Randomised Controlled Trial Statistical Analysis Plan for ...
12
1 HeLP-Diabetes: Randomised Controlled Trial Statistical Analysis Plan for Effectiveness and Cost-Effectiveness 8 th October 2015 1. Overview of Analyses and Manuscripts The following provides the statistical analysis plans for the HeLP-Diabetes trial. The purpose is (i) to clarify the primary analyses, and (ii) to avoid misleading inferences that would arise from post-hoc analyses. Thus the statistical analysis plan has been drawn up in advance of looking at the outcome data. This document describes the analyses that will be undertaken and manuscripts that will be prepared, with descriptive statistics and analyses following the structure set out in this document. Regarding time-lines for analysis and reporting the main features are: Recruitment of the 350 patients is expected to continue until end of September 2014 at the earliest. However, to achieve the required numbers recruitment could continue until the end of 2014 if required. Outcome analyses will be conducted once all patients have been followed-up for 1 year, and after the database has been cleaned. This analysis is expected to report in the Spring/Summer of 2016. A GANTT chart showing the agreed targets is given in Figure 1. 2. Background to the HeLP-Diabetes trial The principal research questions to be addressed by the trial are as follows: 1. Determine the effect of the HeLP-Diabetes self-management programme (SMP) on the change in glycated haemoglobin (HbA1c) and diabetes-related emotional distress, as measured by the Problem Areas In Diabetes (PAID) questionnaire, in people with type 2 diabetes between baseline and 12 month follow-up, compared to a comparator group. 2. Determine the incremental cost-effectiveness of the HeLP-Diabetes SMP compared to a comparator group from the perspective of health and personal social services and wider public sector resources. The study is a two-arm multi-centre individually randomised controlled trial conducted in general practices in England. 2.1 Inclusion/Exclusion criteria Patients who are aged 18 or over with type 2 diabetes mellitus (T2DM) are eligible to participate in the trial. Exclusion criteria are as follows: Unable to provide informed consent, e.g. due to psychosis, dementia or severe learning difficulties; Terminally ill with less than 12 months life expectancy; Unable to use a computer due to severe mental or physical impairment; Insufficient mastery of English to use the intervention i.e. requires an interpreter in consultations; . 2.2 Consent Informed, written consent will be sought prior to conducting any trial procedures. On receipt of the expression of interest form, the nurse will contact the patient and offer them an appointment at the practice. This will ensure that following identification, participants will
-
Upload
khangminh22 -
Category
Documents
-
view
3 -
download
0
Transcript of Randomised Controlled Trial Statistical Analysis Plan for ...

1
HeLP-Diabetes: Randomised Controlled Trial Statistical Analysis Plan for Effectiveness
and Cost-Effectiveness
8th October 2015
1. Overview of Analyses and Manuscripts The following provides the statistical analysis plans for the HeLP-Diabetes trial. The purpose is (i) to clarify the primary analyses, and (ii) to avoid misleading inferences that would arise from post-hoc analyses. Thus the statistical analysis plan has been drawn up in advance of looking at the outcome data. This document describes the analyses that will be undertaken and manuscripts that will be prepared, with descriptive statistics and analyses following the structure set out in this document. Regarding time-lines for analysis and reporting the main features are:
Recruitment of the 350 patients is expected to continue until end of September 2014 at the earliest. However, to achieve the required numbers recruitment could continue until the end of 2014 if required.
Outcome analyses will be conducted once all patients have been followed-up for 1 year, and after the database has been cleaned. This analysis is expected to report in the Spring/Summer of 2016.
A GANTT chart showing the agreed targets is given in Figure 1. 2. Background to the HeLP-Diabetes trial The principal research questions to be addressed by the trial are as follows:
1. Determine the effect of the HeLP-Diabetes self-management programme (SMP) on
the change in glycated haemoglobin (HbA1c) and diabetes-related emotional
distress, as measured by the Problem Areas In Diabetes (PAID) questionnaire, in
people with type 2 diabetes between baseline and 12 month follow-up, compared to a
comparator group.
2. Determine the incremental cost-effectiveness of the HeLP-Diabetes SMP compared
to a comparator group from the perspective of health and personal social services
and wider public sector resources.
The study is a two-arm multi-centre individually randomised controlled trial conducted in general practices in England. 2.1 Inclusion/Exclusion criteria Patients who are aged 18 or over with type 2 diabetes mellitus (T2DM) are eligible to participate in the trial. Exclusion criteria are as follows:
Unable to provide informed consent, e.g. due to psychosis, dementia or severe
learning difficulties;
Terminally ill with less than 12 months life expectancy;
Unable to use a computer due to severe mental or physical impairment;
Insufficient mastery of English to use the intervention i.e. requires an interpreter in
consultations;
.
2.2 Consent Informed, written consent will be sought prior to conducting any trial procedures. On receipt of the expression of interest form, the nurse will contact the patient and offer them an appointment at the practice. This will ensure that following identification, participants will

2
always be given at least 24 hours from receiving the participant information sheet to giving informed consent. 2.3 Randomisation and Blinding Randomisation will be performed only after all (nurse and patient) baseline data assessments have been completed. Randomisation will be at the level of the individual participant. It will be stratified by recruitment centre and will be performed centrally using a web-based randomisation system provided by Sealed Envelope
TM (http://www.sealedenvelope.com/).
Patients will be randomised to either: 1. The Intervention: Facilitated access to the HeLP-Diabetes SMP interactive website.
Facilitated access consists of a) an introductory appointment with a nurse, b) three
supportive follow-up phone calls, c) on-going discussion of the website in routine
appointments for diabetes-related matters.
2. The Comparator: Facilitated access to a simple information website, based on the
information available on the Diabetes UK and NHS choices websites. Facilitated
access consists of a) an introductory appointment with a nurse, b) discretionary
discussion of the website in routine appointments for diabetes-related matters.
Baseline data (visit 1) will be obtained prior to randomisation so there will be no risk of bias. Randomisation will be performed centrally and allocation will not be revealed to the participants who will have been informed that the trial is comparing two forms of web-based education for diabetes (one simple website and one detailed website). The nurse (nurse 1) who is responsible for running the introductory sessions (visit 2) with the patients to show them either the control or the intervention website will not be blinded. The risk of bias in collection of follow-up data will be minimised by using standardised data collection instruments with participants completing self-assessment questionnaires before seeing the nurse to record clinical data. The nurse who will be collecting follow up data (nurse 2 at visit 3 and 4) will be a different nurse to the nurse who runs the introductory session (visit 2) and will therefore be blinded to the website (intervention; comparator) each patient has been allocated to. The trial manager will not be blinded to the website the participants have be allocated to so any follow up phone call to non-responders will be carried out by a member of the research team who is blind to patient allocation. Results regarding the primary and secondary outcomes will not be presented to members of the TMG until all patients have completed their 12-month follow-up, although a blinded “dummy” analysis may be conducted once the majority (e.g. 80%) of patients have completed follow-up. 2.4 Study variables and endpoints (i) Pre-randomisation. Each centre will provide information on the number of invitation letters sent out, and general patient characteristics (e.g. age, sex) of these invited patients. Baseline data (nurse completed and self-completed questionnaires) are all required prior to randomisation. Patients who do not have complete baseline data will not be randomised, yet may still have some baseline data recorded (e.g. nurse completed data from visit 1). (ii) Baseline data. For randomised patients baseline data are collected for a variety of characteristics, including Demographic, Lifestyle and Patient History
Age, sex, ethnicity, socioeconomic information, experience and access to computers, smoking status, diabetes diagnosis date, other comorbidity, medication.
Clinical measures
Blood pressure, height, weight, HbA1c, total and HDL cholesterol. Health service use
Inpatient, outpatient, day cases, appointments and health service tests in last 12 months.
Self-completed questionnaires
Problem Areas in Diabetes (PAID), Hospital Anxiety and Depression Scale (HADS),
Diabetes Management Self-Efficacy Scale (DMSES), Diabetes Treatment Satisfaction
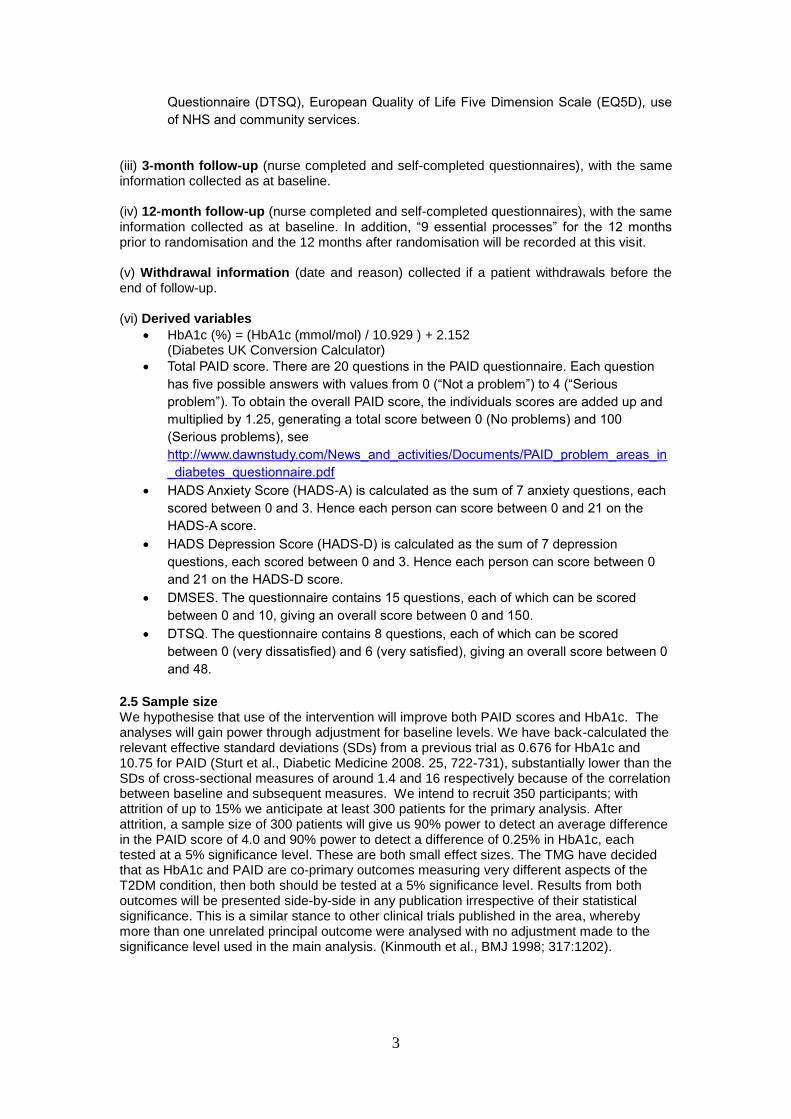
3
Questionnaire (DTSQ), European Quality of Life Five Dimension Scale (EQ5D), use
of NHS and community services.
(iii) 3-month follow-up (nurse completed and self-completed questionnaires), with the same information collected as at baseline. (iv) 12-month follow-up (nurse completed and self-completed questionnaires), with the same information collected as at baseline. In addition, “9 essential processes” for the 12 months prior to randomisation and the 12 months after randomisation will be recorded at this visit. (v) Withdrawal information (date and reason) collected if a patient withdrawals before the end of follow-up. (vi) Derived variables
HbA1c (%) = (HbA1c (mmol/mol) / 10.929 ) + 2.152 (Diabetes UK Conversion Calculator)
Total PAID score. There are 20 questions in the PAID questionnaire. Each question
has five possible answers with values from 0 (“Not a problem”) to 4 (“Serious
problem”). To obtain the overall PAID score, the individuals scores are added up and
multiplied by 1.25, generating a total score between 0 (No problems) and 100
(Serious problems), see
http://www.dawnstudy.com/News_and_activities/Documents/PAID_problem_areas_in
_diabetes_questionnaire.pdf
HADS Anxiety Score (HADS-A) is calculated as the sum of 7 anxiety questions, each
scored between 0 and 3. Hence each person can score between 0 and 21 on the
HADS-A score.
HADS Depression Score (HADS-D) is calculated as the sum of 7 depression
questions, each scored between 0 and 3. Hence each person can score between 0
and 21 on the HADS-D score.
DMSES. The questionnaire contains 15 questions, each of which can be scored
between 0 and 10, giving an overall score between 0 and 150.
DTSQ. The questionnaire contains 8 questions, each of which can be scored
between 0 (very dissatisfied) and 6 (very satisfied), giving an overall score between 0
and 48.
2.5 Sample size We hypothesise that use of the intervention will improve both PAID scores and HbA1c. The analyses will gain power through adjustment for baseline levels. We have back-calculated the relevant effective standard deviations (SDs) from a previous trial as 0.676 for HbA1c and 10.75 for PAID (Sturt et al., Diabetic Medicine 2008. 25, 722-731), substantially lower than the SDs of cross-sectional measures of around 1.4 and 16 respectively because of the correlation between baseline and subsequent measures. We intend to recruit 350 participants; with attrition of up to 15% we anticipate at least 300 patients for the primary analysis. After attrition, a sample size of 300 patients will give us 90% power to detect an average difference in the PAID score of 4.0 and 90% power to detect a difference of 0.25% in HbA1c, each tested at a 5% significance level. These are both small effect sizes. The TMG have decided that as HbA1c and PAID are co-primary outcomes measuring very different aspects of the T2DM condition, then both should be tested at a 5% significance level. Results from both outcomes will be presented side-by-side in any publication irrespective of their statistical significance. This is a similar stance to other clinical trials published in the area, whereby more than one unrelated principal outcome were analysed with no adjustment made to the significance level used in the main analysis. (Kinmouth et al., BMJ 1998; 317:1202).

4
3. Analysis Plan for Outcomes 3.1 Descriptive analyses of randomised and non-randomised patients (i) A detailed CONSORT diagram describing patient flow with exclusions and total numbers randomised to each treatment will be presented. Figure 2 shows the type of CONSORT diagram that will be presented. (ii) Comparison of demographics between randomised and non-randomised patients.
We will compare demographic information provided by the GP surgeries for patients who were sent invitation letters but who were not eventually randomised, with the demographics of the randomised population.
(iii) Baseline comparability of randomised groups.
Tables of summary statistics will be produced by randomised group for a number of baseline variables.
Mean and standard deviations will be presented for continuous variables, unless the variable is skewed in which case median and interquartile range will be presented. The number of missing observations will also be reported.
The frequency and percentages (based on the non-missing sample size) of observed levels will be reported for all categorical measures. The number of missing observations will also be reported.
(iv) The extent of any contamination will be described, by reporting the number of patients
from the same family who have members randomised to both intervention and control groups. However, this may not be an issue as nurses are being asked to try and limit invitations to participate in the trial to one per household.
(v) The extent of SMP usage over the 12-month follow-up will be described using webpage
analytic summary statistics (number log-ins, time spent in each log-in, number pages visited per log-in) for both the intervention and control websites.
(vi) 3-month and 12-month follow-up measures
Summary statistics of the repeat measures will also be presented at 3-months (visit 3)
and 12-months (visit 4).
3.2. Follow-up time range To ensure comparable time periods, for our primary analyses we will use a patient’s follow-up data for visit 3 if it is collected within 2-4 months of randomisation and a patient’s follow-up data for visit 4 if it is collected within 10-14 months of randomisation. A sensitivity analysis will be undertaken restricted to patients whose visit 4 measures are collected within 11-13 months of randomisation (see Section 3.3.3). 3.3 Primary Outcome Analyses
1) HbA1c
The groups will be compared as randomised (intention-to-treat). The first primary analysis will be a comparison of 12-month HbA1c between the randomised groups. A linear mixed effects model will be used with HbA1c (at visit 4) as the outcome, and adjusting for baseline HbA1c, age, sex, current (baseline) participation in other self-management programmes, and pre-existing cardiovascular disease and duration of diabetes. Centre effects will be included as random-effects in the primary analysis (see also Section 3.3.3) since the randomisation is stratified by centre (Kahan and Morris, Statistics in Medicine, 2013). Patients whose HbA1c measure is recorded outside of 10-14 months will be excluded (see Section 3.2). The estimate for the randomised group coefficient will be reported, together with its 95% confidence interval and Wald p-value. A p-value less than 0.05 will be used to judge a statistically significant difference between the randomised groups.
2) PAID
5
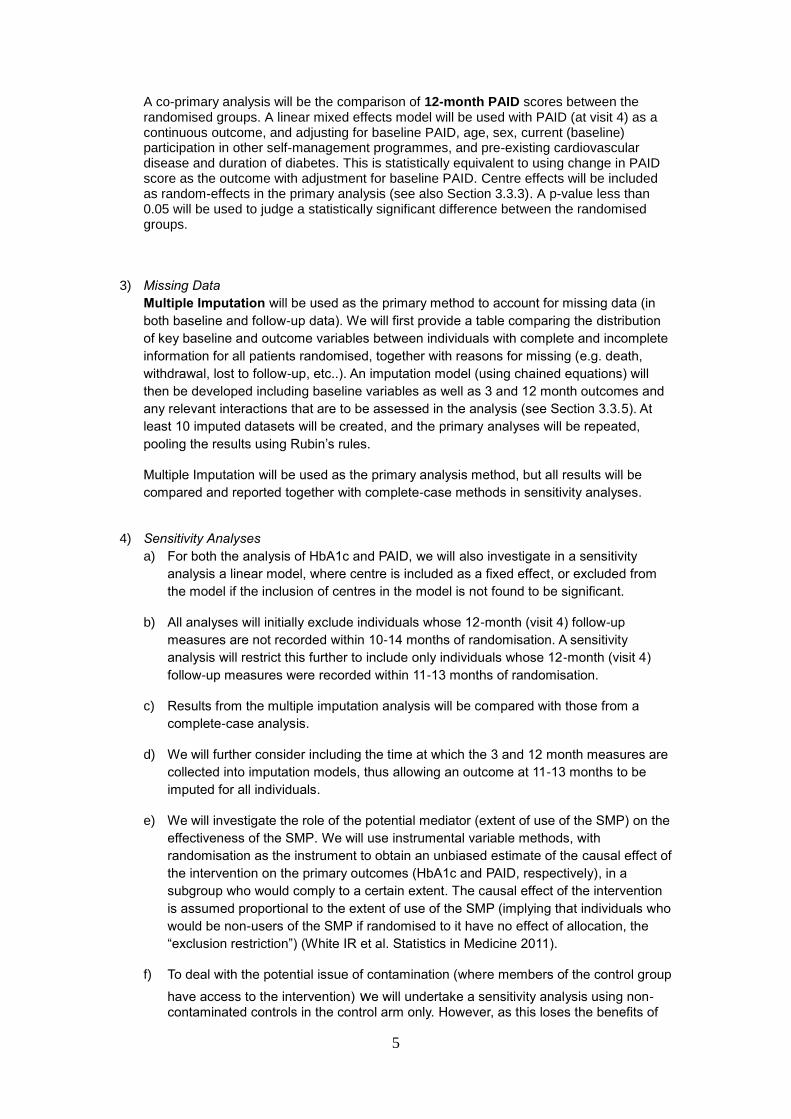
A co-primary analysis will be the comparison of 12-month PAID scores between the randomised groups. A linear mixed effects model will be used with PAID (at visit 4) as a continuous outcome, and adjusting for baseline PAID, age, sex, current (baseline) participation in other self-management programmes, and pre-existing cardiovascular disease and duration of diabetes. This is statistically equivalent to using change in PAID score as the outcome with adjustment for baseline PAID. Centre effects will be included as random-effects in the primary analysis (see also Section 3.3.3). A p-value less than 0.05 will be used to judge a statistically significant difference between the randomised groups.
3) Missing Data
Multiple Imputation will be used as the primary method to account for missing data (in
both baseline and follow-up data). We will first provide a table comparing the distribution
of key baseline and outcome variables between individuals with complete and incomplete
information for all patients randomised, together with reasons for missing (e.g. death,
withdrawal, lost to follow-up, etc..). An imputation model (using chained equations) will
then be developed including baseline variables as well as 3 and 12 month outcomes and
any relevant interactions that are to be assessed in the analysis (see Section 3.3.5). At
least 10 imputed datasets will be created, and the primary analyses will be repeated,
pooling the results using Rubin’s rules.
Multiple Imputation will be used as the primary analysis method, but all results will be
compared and reported together with complete-case methods in sensitivity analyses.
4) Sensitivity Analyses
a) For both the analysis of HbA1c and PAID, we will also investigate in a sensitivity
analysis a linear model, where centre is included as a fixed effect, or excluded from
the model if the inclusion of centres in the model is not found to be significant.
b) All analyses will initially exclude individuals whose 12-month (visit 4) follow-up
measures are not recorded within 10-14 months of randomisation. A sensitivity
analysis will restrict this further to include only individuals whose 12-month (visit 4)
follow-up measures were recorded within 11-13 months of randomisation.
c) Results from the multiple imputation analysis will be compared with those from a
complete-case analysis.
d) We will further consider including the time at which the 3 and 12 month measures are
collected into imputation models, thus allowing an outcome at 11-13 months to be
imputed for all individuals.
e) We will investigate the role of the potential mediator (extent of use of the SMP) on the
effectiveness of the SMP. We will use instrumental variable methods, with
randomisation as the instrument to obtain an unbiased estimate of the causal effect of
the intervention on the primary outcomes (HbA1c and PAID, respectively), in a
subgroup who would comply to a certain extent. The causal effect of the intervention
is assumed proportional to the extent of use of the SMP (implying that individuals who
would be non-users of the SMP if randomised to it have no effect of allocation, the
“exclusion restriction”) (White IR et al. Statistics in Medicine 2011).
f) To deal with the potential issue of contamination (where members of the control group
have access to the intervention) we will undertake a sensitivity analysis using non-contaminated controls in the control arm only. However, as this loses the benefits of

6
randomisation, we will also undertake a Complier Average Causal Effect (CACE) analysis which respects randomisation. For the CACE analysis we will label contaminated control participants as potential non-compliers.
5) Subgroup analyses / Effect modification
A limited number of predefined subgroups will be analysed to investigate effect modification. The chosen subgroups are
Baseline HbA1c (continuous); for the outcome of HbA1c only
Baseline PAID (continuous); for the outcome of PAID only
Duration of diabetes; for both HbA1c and PAID outcomes For the purpose of presentation, baseline HbA1c results will be shown by splitting baseline HbA1c into two subgroups: <7.5% and greater than or equal to 7.5%. However the test for interaction will be made assuming a linear effect modification over the continuum of HbA1c values in order to maintain power. Similarly, effect modification by baseline PAID will be tested keeping PAID continuous but presenting results for two groups below and above the median. Since four interaction tests will be performed overall (one for each co-primary outcome for duration of diabetes), a Bonferroni corrected p-value of <0.01 will be used as a guide before claiming strong evidence of a difference in effectiveness between subgroups.
3.4 Secondary endpoint analyses A number of secondary endpoints will be investigated in a hypothesis generating manner (rather than hypothesis confirming). Hence any results from these analyses will be interpreted with caution and would require validation from further external studies. The outcomes that will be considered are Clinical Outcomes collected by the nurse
a) Systolic blood pressure
b) Diastolic blood pressure
c) Body mass index
d) Total cholesterol
e) HDL cholesterol
f) Completion of “9 essential processes” during 12 month follow-up obtained outside
of the trial (weight, BP, smoking status, serum creatinine, cholesterol, HbA1c,
urinary albumen, assessment of eyes and feet). This data is to be obtained from
the patient’s notes.
Patient-reported outcomes
g) HADS
h) DMSES
i) DTSQ
All analyses will be conducted using a linear mixed model similar to the primary outcome analyses, except for f) which will be modelled using Poisson regression (with mixed-effects). All analyses of secondary endpoints will be adjusted for their respective baseline measure (if available).
4 Analysis Plan for Health-Economic Outcomes

7
The incremental cost-effectiveness of facilitated access to HeLP-Diabetes compared to usual
care for patients with T2DM will be assessed following NICE guidance both from a health and
personal social services perspective (National Institute for Health and Care Excellence (NICE)
2012, National Institute for Health and Care Excellence (NICE) 2013).
The components of the analysis are health outcomes, costs of the active and control
intervention, and the potential impact on diabetes care and complications. Intervention costs
will be measured directly. The potential impact on diabetes care and complication will be
measured by the use of NHS and social services. This will be calculated from the patient
record. All costs will be presented in 2014 prices.
Two health outcomes will be used in the analysis: health related quality of life (HRQoL),
measured by the Problem Areas in Diabetes (PAID) scale (Welch, Weinger et al. 2003), and
quality-adjusted life years (QALYs), derived from EQ-5D (The EuroQol Group 1990).
4.1 Cost of the intervention Costs of the intervention to the NHS are made up of two major components: development of
the intervention and implementation costs.
1) Development costs
Development costs encompass the investment in the initial development of the self-
management website and the subsequent maintenance and updating. As the website has
already been developed before the trial stage, the resources devoted to the initial
development have been recorded during the development process. These resources included
consulting with user panel and professionals, producing multi-media contents for the website
and developing and designing the website.
Given that the development of the website has been completed by our researcher team in the
previous stage and this process is not planned to be repeated during the trial period or
projection period, the majority of development cost will be reported for reference but not
included in the analysis. However, the cost of the general infrastructure for internet operation,
such as domain names, SSL certificate, IP address, site hosting and the relevant staff time
required for maintenance and update will occur regularly as long as the website is still in use.
As a result, these will be included in the analysis and allocated across their respective
contract time to account for the operating costs for HeLP-Diabetes website. There will be a
table to summarise the development cost components and their respective amount.
2) Implementation costs Implementation stage consists of training for the facilitators and them facilitating the patients
in practice. The training costs will be largely made up of trainers and trainees’ time, plus
materials used for training purpose. Cost of premises and overheads will be included in the
personnel salary proportional to the time spent. This will be recorded by a perfoma.
The facilitating costs will include staff cost in introductory session and follow-up phone calls,
printing cost of user guide booklet. Estimates of the additional time required from the general
practice staff will also be obtained. The costs of health professional input from the practices
will be based on national average rates using PSSRU estimates, when appropriate edition of
the document is published.
4.2 Cost of health care and social services use
8
Participants’ utilisation of primary and secondary health care will be extracted from their
records. Participants’ use of other community and social services will be collected
retrospectively by self-report using a questionnaire. The appropriate national average unit
costs will then be applied to the quantities to estimate the cost of health care and social
services (Curtis 2013, Department of Health 2013).
The primary outcome will be the mean cost (SD) in each group within the 12 months post-
randomisation. The cost data collected at baseline (in the past 12 months) and at 3 months
follow-up will be presented separately to assess any pattern or potential pre-existing
conditions. The various cost items and their quantities will be presented in a summary table
by intervention group at different time points. All the unit costs adopted in the analysis and
their respective sources will be presented in a separate table.
4.3 Health related quality of life (HRQoL)
The trial will assess health related quality of life (HRQoL), measured by the Problem Areas in
Diabetes (PAID) scale (Welch, Weinger et al. 2003). PAID has 20 items focusing on areas
that cause difficulty for people living with diabetes, including social situations, food, friends
and family, diabetes treatment, relationships with health care professionals and social
support. It will be a part of follow-up questionnaire to be collected by self-report. As this is one
of the primary outcomes, the result will be presented in the main analysis.
To calculate quality-adjusted life years (QALYs), EQ-5D will also be collected through self-
report questionnaire and then be used for a cost-utility analysis, as per NICE guidance
(National Institute for Health and Care Excellence (NICE) 2013). QALYs will be calculated
using area under the curve analysis from the baseline, 3- and 12- month follow-ups, adjusting
for baseline levels (Richardson and Manca 2004).
4.4 Cost-effectiveness analysis
The change of PAID scores in each arm from baseline to 12 month follow-up will be combined
with their respective costs to be compared in a cost-effectiveness analysis. Similarly,
combining QALYs in each arm with their respective costs, an incremental cost-effectiveness
ratio (ICER) will then be produced, measuring incremental cost per QALY gained from
intervention.
4.5 Sensitivity analysis
A study will be conducted separated from the trial assessing different implementation
strategies. Estimates of costs for the different implementation and facilitated access activities
will be derived from the study. They will then be used to replace the trial implementation
strategy and explore the cost-effectiveness under different practice scenarios.
In addition, the non-parametric bootstrap technique will be employed to explore the sensitivity
of calculated ICERs. The results from bootstrap resampling will be used to plot cost-
effectiveness plane and cost-effectiveness acceptability curve (CEAC) to show the
uncertainty surrounding adoption decision (Fenwick, Claxton et al. 2001).
4.6 Long-term cost-effectiveness projection
Following a literature search for existing models, we will adopt the United Kingdom
Prospective Diabetes Study (UKPDS) outcomes model (Clarke, Gray et al. 2004) to project
the cost-effectiveness over a lifetime. The model predicts likely outcomes using risk factors

9
including age, gender, ethnicity, duration of diabetes, height, weight, smoking status, total
cholesterol, HDL cholesterol, systolic blood pressure and HbA1c, all of which will be collected
either through medical records or self-reported questionnaire. The main outputs are estimates
of Quality-adjusted Life Expectancy and costs of complications. The estimates of costs of
complications will be updated into 2014 prices. The cost of HeLP-Diabetes website will be
incorporated assuming reasonable operation length of duration.
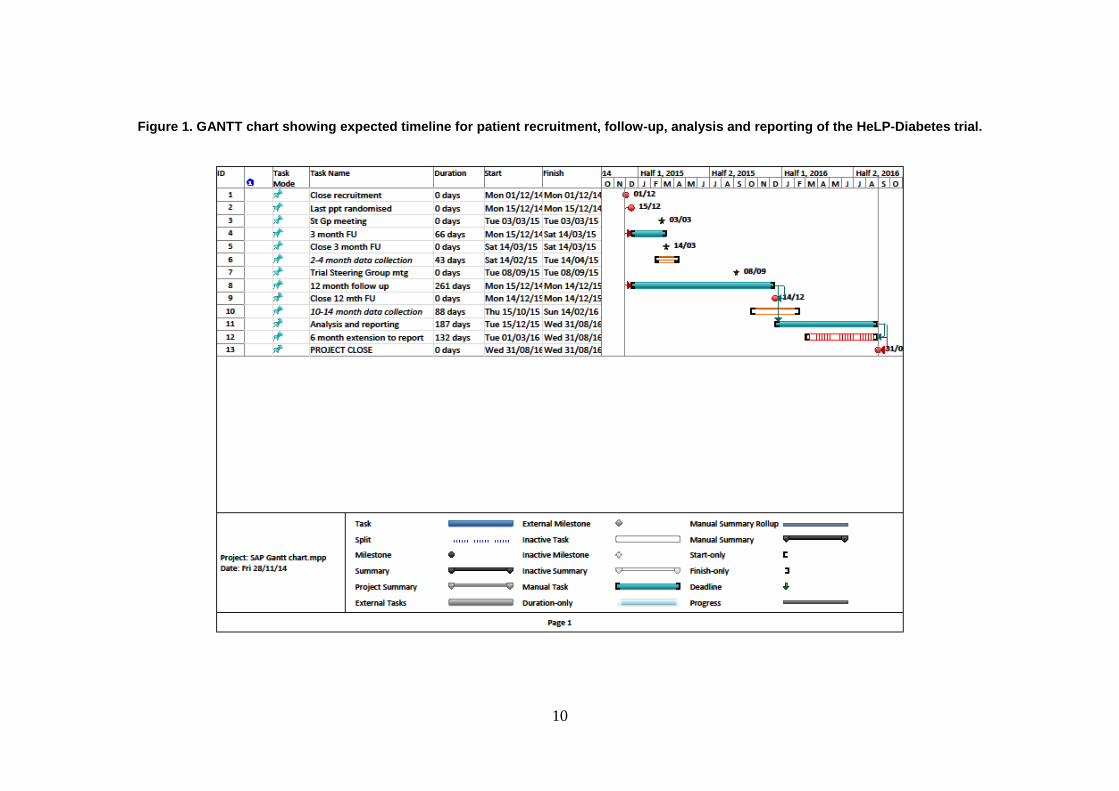
10
Figure 1. GANTT chart showing expected timeline for patient recruitment, follow-up, analysis and reporting of the HeLP-Diabetes trial.
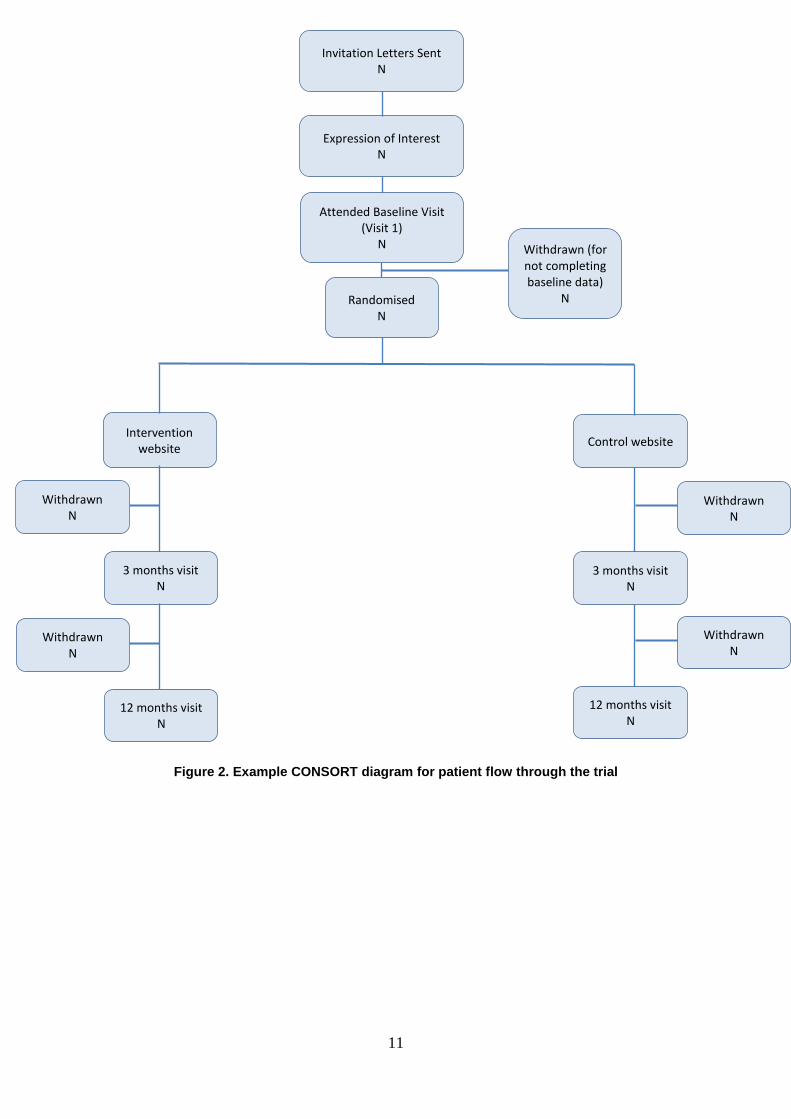
11
Figure 2. Example CONSORT diagram for patient flow through the trial
Randomised N
Intervention website Control website
Expression of Interest N
3 months visit N
3 months visit N
Withdrawn (for not completing baseline data)
N
Withdrawn N
Invitation Letters Sent N
Attended Baseline Visit (Visit 1)
N
Withdrawn N
12 months visit N
Withdrawn N
12 months visit N
Withdrawn N

12
References
Clarke, P. M., A. M. Gray, A. Briggs, A. J. Farmer, P. Fenn, R. J. Stevens, D. R. Matthews, I. M. Stratton and R. R. Holman (2004). "A model to estimate the lifetime health outcomes of patients with type 2 diabetes: the United Kingdom Prospective Diabetes Study (UKPDS) Outcomes Model (UKPDS no. 68)." Diabetologia 47(10): 1747-1759. Curtis, L. (2013). Unit costs of health and social care 2013, Personal Social Services Research Unit (PSSRU), University of Kent. Department of Health (2013). Reference costs 2012-13. Fenwick, E., K. Claxton and M. Sculpher (2001). "Representing uncertainty: The role of cost-effectiveness acceptability curves." Health Economics 10(8): 779-787. Kahan BC, Morris TP. Analysis of multicentre trials with continuous outcomes: when and how should we account for centre effects? Statistics in Medicine 2013, 32: 1136-1149. Kinmonth AL, Woodcock A, Griffin S, Spiegal N, Campbell MJ. Randomised controlled trial of patient centred care of diabetes in general practice: impact on current wellbeing and future disease risk. BMJ 1998; 317:1202. National Institute for Health and Care Excellence (NICE) (2012). Methods for development of NICE public health guidance. London. National Institute for Health and Care Excellence (NICE) (2013). Guide to the methods of technology appraisal 2013. Richardson, G. and A. Manca (2004). "Calculation of quality adjusted life years in the published literature: a review of methodology and transparency." Health Economics 13(12): 1203-1210. Sturt JA, Whitlock S, Fox C, Hearnshaw H, Farmer AJ, Wakelin M, Eldridge S, Griffiths F, Dale J. Effects of the Diabetes Manual 1:1 structured education in primary care. Diabetic Medicine 2008, 25: 722- 731. The EuroQol Group (1990). "EuroQol—A new facility for the measurement of health-related quality of life." Health Policy 16. Welch, G., K. Weinger, B. Anderson and W. H. Polonsky (2003). "Responsiveness of the Problem Areas In Diabetes (PAID) questionnaire." Diabet Med 20(1): 69-72. White IR, Kalaitzaki E, Thompson SG. Allowing for missing outcome data and incomplete uptake of randomised interventions, with application to an Internet-based alcohol trial. Statistics in Medicine 2011, 30: 3192-3207.