The Effect of Pb2+ Substitution on the Quantum Paraelectric Behaviour of CaTiO3
21
1 Effect of Pb 2+ substitution on the quantum paraelectric behaviour of CaTiO 3 Amreesh Chandra and Dhananjai Pandey School of Materials Science and Technology, Institute of Technology, Banaras Hindu University, Varanasis-221005, India Abstract Results of low temperature dielectric measurements on the mixed (Ca 1-x Pb x )TiO 3 system are presented to show that a dielectric anomaly appears for x≥0.10. The observed dielectric peak is shown to be due to a thermodynamic phase transition and not due to a relaxor or dipole glass type transition. Curie-Weiss fit to the dielectric constant gives negative Curie temperature which points towards an antiferroelectric transition. Arguments are advanced to propose that CaTiO 3 may be an incipient antiferroelectric in which Pb 2+ substitution stabilises the antiferroelectric phase.
-
Upload
parvathisait87gmail -
Category
Documents
-
view
1 -
download
0
Transcript of The Effect of Pb2+ Substitution on the Quantum Paraelectric Behaviour of CaTiO3
1
Effect of Pb2+ substitution on the quantum paraelectric behaviour of CaTiO3
Amreesh Chandra and Dhananjai Pandey
School of Materials Science and Technology, Institute of Technology, Banaras Hindu
University, Varanasis-221005, India
Abstract
Results of low temperature dielectric measurements on the mixed (Ca1-xPbx)TiO3 system
are presented to show that a dielectric anomaly appears for x≥0.10. The observed
dielectric peak is shown to be due to a thermodynamic phase transition and not due to a
relaxor or dipole glass type transition. Curie-Weiss fit to the dielectric constant gives
negative Curie temperature which points towards an antiferroelectric transition.
Arguments are advanced to propose that CaTiO3 may be an incipient antiferroelectric in
which Pb2+ substitution stabilises the antiferroelectric phase.
2
1. Introduction
SrTiO3 and KTaO3 are well known incipient ferroelectrics [1-2]. Their dielectric
constant gradually increases from 305 and 239 at 300K to very large values of 20,000 and
4500, respectively, upon cooling to 4K [3-5]. The enormous rise in the dielectric constant
correlates very well with the experimentally observed softening of the TO mode at q=0
[6-8]. However, below 4K, the dielectric constant in both the materials is independent of
temperature. This saturation of dielectric constant below 4K has been attributed to the
zero point fluctuations which preclude the condensation of the soft TO mode at q=0.
Accordingly, both these materials are said to be quantum paraelectrics below 4K [3]. The
possibility of a sharp transition around 40K to a quantum coherent state has also been
proposed for SrTiO3 [9-12]. There have been several theoretical efforts to understand
these quantum effects in SrTiO3 [3, 13-15]. For example, it has been shown theoretically
that quantum zero-point motion can suppress the phase transitions [14]. Using path-
integral Monte Carlo simulations and ab initio effective Hamiltonian, Zhong and
Vanderbilt [15] have recently shown that the quantum fluctuations can indeed suppress
the ferroelectric transition of SrTiO3 completely.
Chemical substitutions like A (= Ca2+, Ba2+ or Pb2+) in place of Sr2+ in the mixed
system (Sr1-xAx)TiO3 have been shown to suppress quantum fluctuations and stabilise a
quantum ferroelectric phase with Tc varying as (x-xc)1/2, where xc≈0.002 [16-17]. In the
Sr1-xCaxTiO3 system, the dielectric response gets smeared out for 0.016 ≤ x ≤ 0.12 which
has recently been attributed to competing ferroelectric and antiferroelectric instabilities
[18-19]. Further, for 0.12≤ x ≤ 0.40, this system exhibits an antiferroelectric phase
3
transition (AFE) [18, 20-21]. Substitutions in place of K+ in the mixed system
(K1-xAx)TaO3 (where A= Li1+ or Na1+) are also known to suppress the quantum
fluctuations but, unlike (Sr1-xCax)TiO3, here a glassy polar phase is stabilised for xc≥
0.01 and 0.12 for Li1+ and Na1+ , respectively [1-2]. On increasing their concentration
beyond x = 0.022 and 0.20 for Li1+ and Na1+ substitutions, normal ferroelectric behaviour
has been reported [1-2].
A more recent entrant to the family of quantum paraelectrics is CaTiO3 where the
saturation of dielectric constant below 30K has been reported [22-23]. However, unlike
SrTiO3 and KTaO3, where the role of chemical substitutions in suppressing the quantum
fluctuations has been investigated in great detail, there is only one report on the role of
chemical substitutions in CaTiO3. Lemanov et al [23] studied the effect of Pb2+ and Ba2+
substitutions in place of Ca2+ in the mixed system (Ca1-xAx)TiO3 (A=Pb2+, Ba2+) for
x=0.05 and found that the quantum paraelectric behaviour still persists. We present here
the results of dielectric measurements on the mixed (Ca1-xPbx)TiO3 system for x = 0.10
and 0.20 which show for the first time that a dielectric anomaly corresponding to a
thermodynamic phase transition appears for x ≥ 0.10. It is shown that unlike the
(Sr1-xAx)TiO3 and (K1-xAx)TaO3 systems, where doping stabilizes polar phases, the
dielectric anomaly in the (Ca1-xPbx)TiO3 system is not linked with a polar phase (i.e.,
ferroelectric or dipole glass/ relaxor ferroelectric) transition but may probably be due to
an antiferroelectric (antipolar) phase transition(AFE).
2. Experiment
Dense (density: 94% of the theoretical density) sintered ceramic pellets of (Ca1-
xPbx)TiO3 of ≈ 1cm diameter were prepared by the conventional solid state route, the
4
details of which are given elsewhere [24]. Dielectric measurements were carried out on
such dense pellets. Both the faces of sintered pellets were gently polished with 0.25µm
diamond paste and then washed with acetone to clean off the surface. Isopropyl alcohol
was then applied to remove the moisture, if any, left on the pellet surface. Fired-on silver
paste was subsequently applied on both the faces of the pellet. It was first dried at 100oC
in an oven and then cured by firing at 500oC for 10 minutes. For dielectric measurements
below room temperature, a locally designed set-up was used. Temperature was measured
with an accuracy of 0.1K using a Kiethley thermometer (model 740). A Hioki LCR meter
(Model No. 3532) was used for the measurement of capacitance and loss tangent (tanδ).
For collecting room temperature X-ray diffraction (XRD) data, sintered pellets were first
crushed into fine powders. These crushed powders were then annealed at 500oC for 10
hours to remove strains which may develop during the process of crushing. These
annealed powders were used for collecting the X-ray diffraction (XRD) data. For
collecting the XRD data, a 12kW Rigaku make copper rotating anode based powder
diffractometer fitted with a curved crystal graphite monochromator in the diffracted beam
was used. The data collection was done at 6kW at a scan rate of 1o min-1 and step width
of 0.01 degree in the 2θ range from 20-120o. The polarization hysteresis loop
measurement was done using a locally fabricated Hysteresis Loop Tracer based on a
modified Sawer-Tower circuit.
3. Results and Discussion
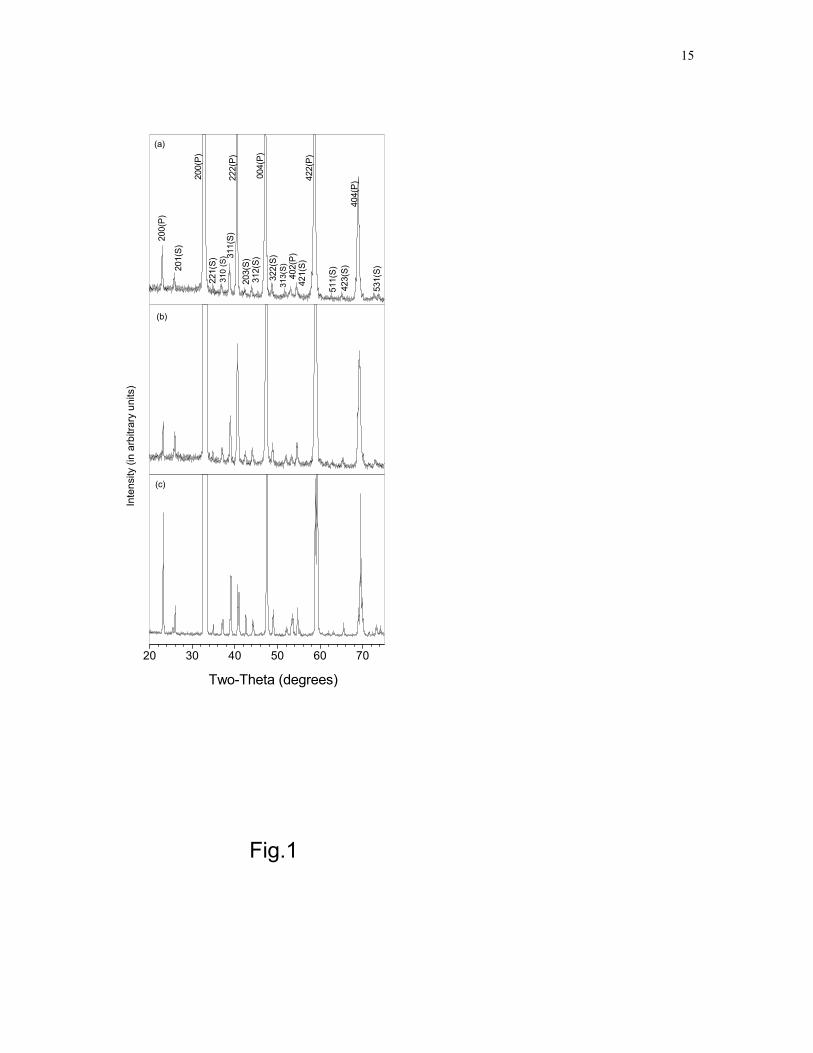
Fig. 1 depicts the room temperature X-ray diffraction patterns of (Ca1-xPbx)TiO3
for x = 0.0, 0.10 and 0.20. The XRD patterns in Fig. 1 contain perovskite as well as
superlattice reflections marked as P and S, respectively. Both type of reflections can be
5
indexed with respect to a doubled perovskite pseudo-cell. With respect to such a cell, the
elementary perovskite peaks assume hkl indices which are represented by all even (e)
integers. The superlattice reflections, on the otherhand, have one or more odd(o)
numbered indices. The patterns shown in Fig. 1 contain superlattice reflections of the
type ooo, ooe and oee (e.g. 311, 312, 322 in the figure) which arise due to antiphase
octahedral tilts, inphase octahedral tilts and antiparallel cationic (Ca2+/ Pb2+)
displacements, respectively (see Reference [25]). Since all the perovskite and superlattice
peaks are common for x=0, 0.10 and 0.20, we conclude that there is no change in the
room temperature structure of CaTiO3 as a result of Pb2+ substitution i.e, the crystal
structure remains orthorhombic with Pbnm space group and a-a-c+ tilt system [25]. The
cell parameters as obtained by least squares refinement are a = 5.39(7) , 5.43(1) and
5.45(1) Ǻ, b = 5.410(7), 5.41(1) and 5.45(1) Ǻ, and c = 7.65(1), 7.68(1) and 7.70(4) Ǻ for
x=0.0, 0.10 and 0.20 respectively. The unit cell volume increases with x as expected on
the basis of larger ionic radius of Pb2+ as compared to that of Ca2+.
The dielectric constant of CaTiO3 increases with decreasing temperature as per
Barret law[26] and shows quantum saturation below 30K as expected for a quantum
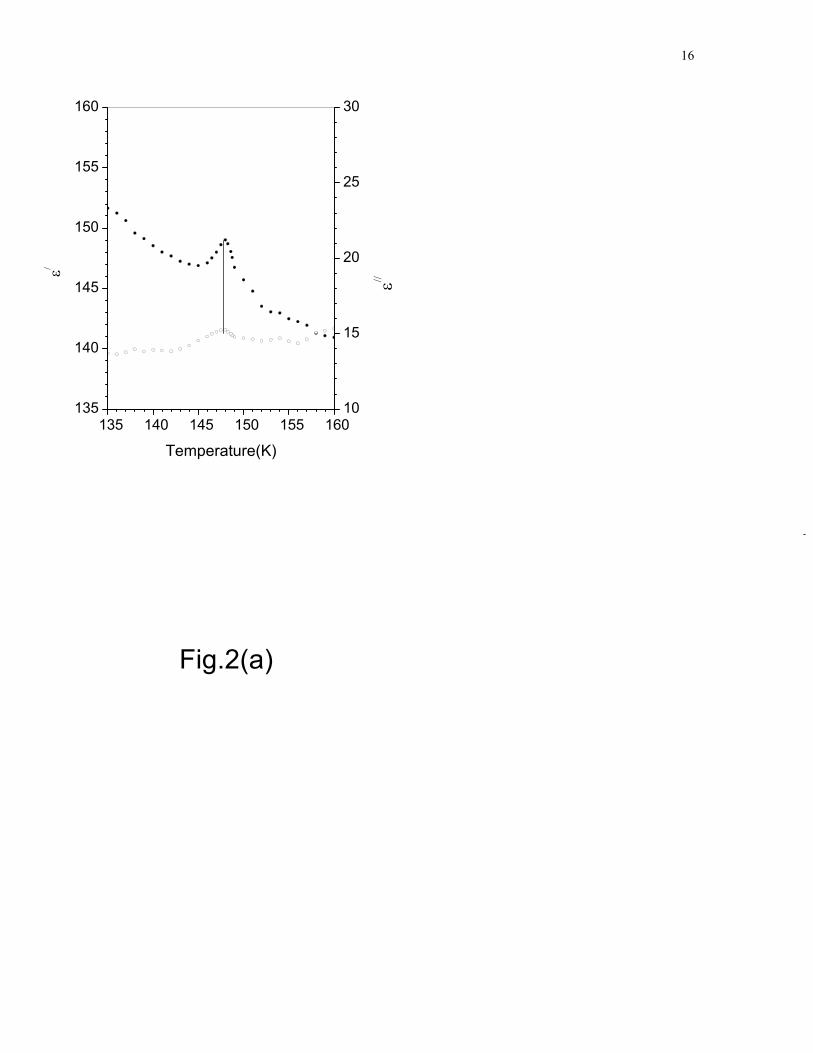
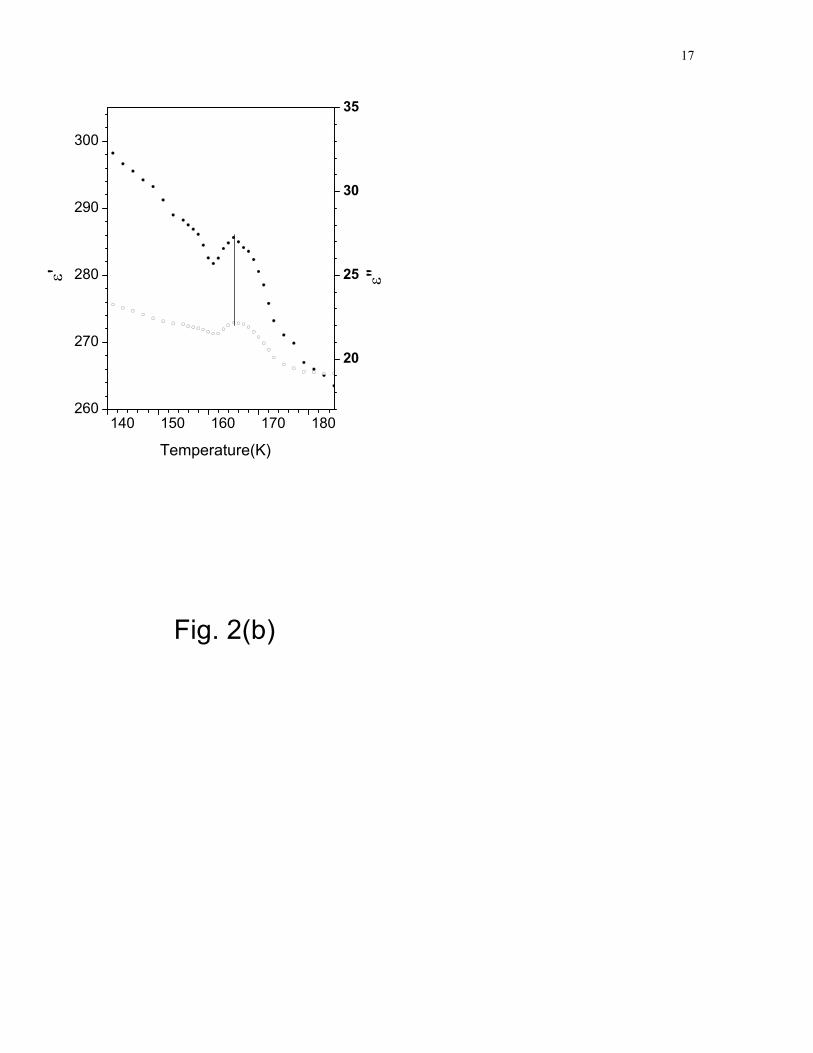
paraelectric [22]. The effect of Pb2+ doping on the temperature dependence of dielectric
constant of CaTiO3 is shown in Fig. 2(a and b) which depicts the temperature variation of
real (ε/) and imaginary (ε//) parts of the dielectric constant for (Ca1-xPbx)TiO3 with x=0.10
and 0.20. It is evident from this figure that a dielectric peak appears at 147K and 164K
for x=0.10 and 0.20, respectively. It is interesting to note that the dielectric peak in Fig.
2(a and b) appears on a continuously rising background due to the paraelectric behaviour
of the CaTiO3 matrix. The height of the dielectric peak increases with increasing Pb2+
6
content. This dielectric anomaly is not due to a relaxor/dipole glass type transition since
the temperatures Tm/ and Tm
// corresponding to the peak values of ε/ and ε// are coincident
(see Fig. 2). In relaxor/ glassy systems, it is well known that Tm// <Tm
/ and both of them
shift to higher temperature sides on increasing the frequency of measurement [27,28]. In
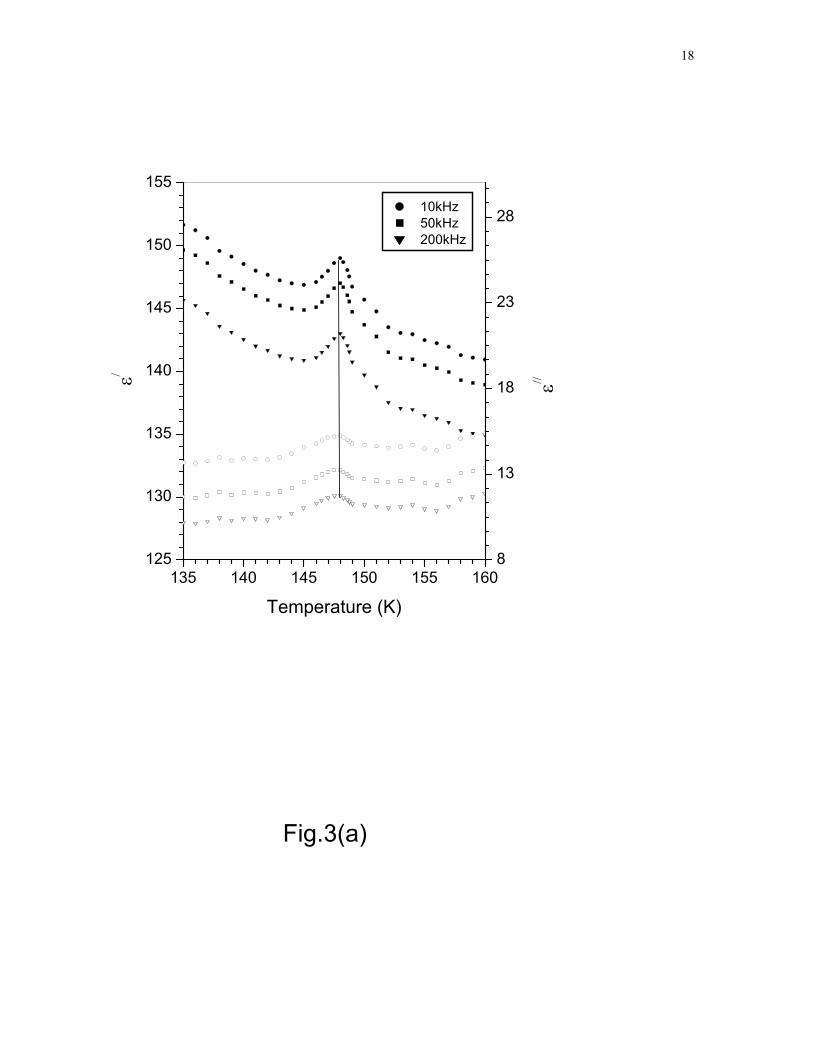
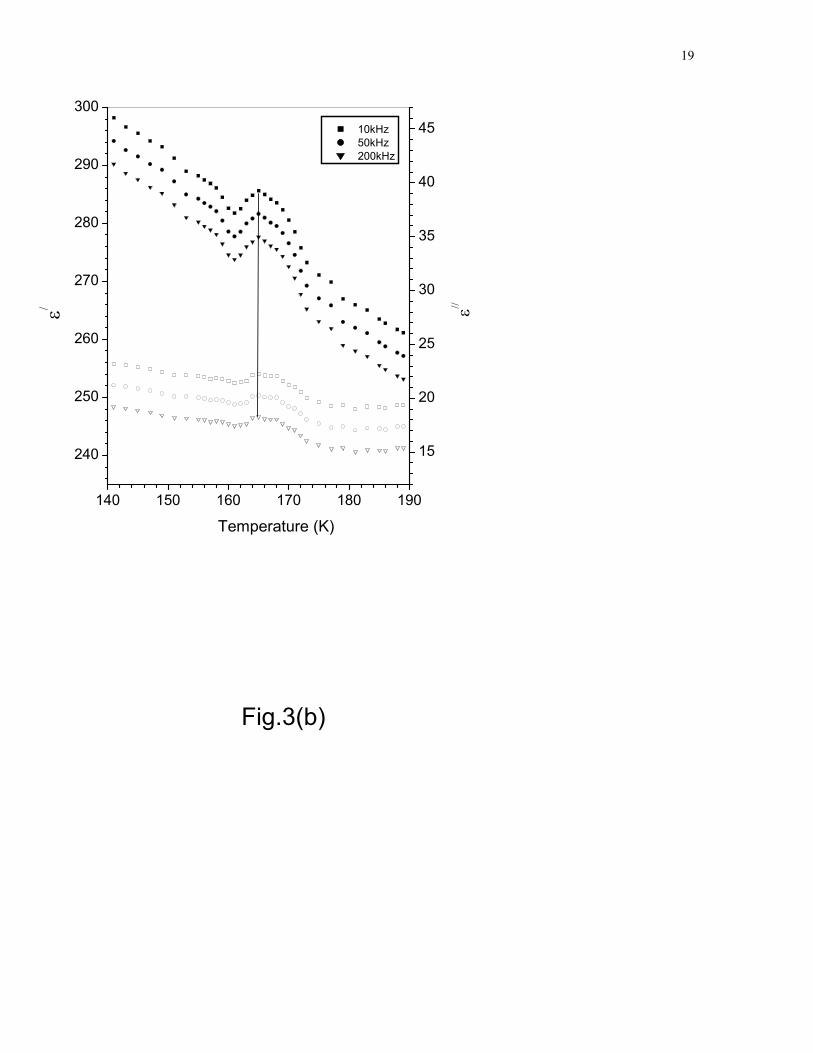
the (Ca1-xPbx)TiO3 system, Tm// and Tm
/ are not only coincident but also frequency
independent as can be seen from Fig. 3 which depicts ε/ and ε// at various frequencies
upto 200kHz. The small frequency dispersion (~5%) in the dielectric constant at all
temperatures in the frequency range 10-200kHz is due to conductivity losses. These
losses arise due to Pb2+ vacancies which are unavoidable at the sintering temperature
(1473 K) as a result of high vapour pressure of PbO above 1073K. This dispersion is not
due to relaxor ferroelectric behaviour for which it should have been confined to the
vicinity of the transition temperature[28]. The frequency independence of Tm/ and Tm
//
further rules out any relaxor/ dipolar glass behaviour. Thus the dielectric anomaly shown
in Fig. 2 is due to a thermodynamic phase transition and not due to relaxor/glassy
transition.
In order to check if the observed dielectric anomaly in Fig. 2(a,b) is due to a
ferroelectric transition, we carried out polarization hysteresis loop measurements above
and below the transition temperatures on the (Ca1-xPbx)TiO3 samples. No hysteresis loop
was observed between polarization and electric field below the transition temperature for
fields upto 60kV/cm. Dielectric breakdown of the sample occurred on application of
fields greater than 60kV/cm.For conventional ferroelectrics and dipolar glass/ relaxor
ferroelectric materials, an external field of 60kV/cm is large enough to open the
hysteresis loop[2,27,28]. The absence of P-E hysteresis loop below the transition
7
temperature clearly rules out the possibility of a ferroelectric transition being responsible
for the observed dielectric anomalies in Fig. 2.
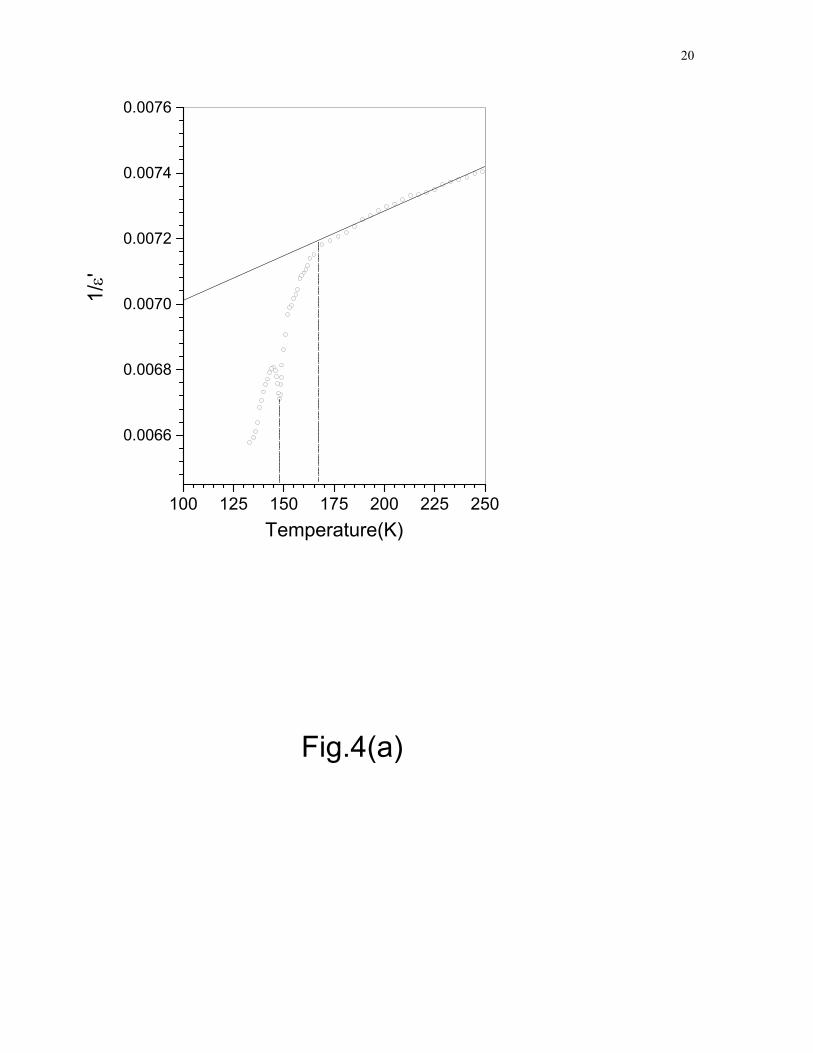
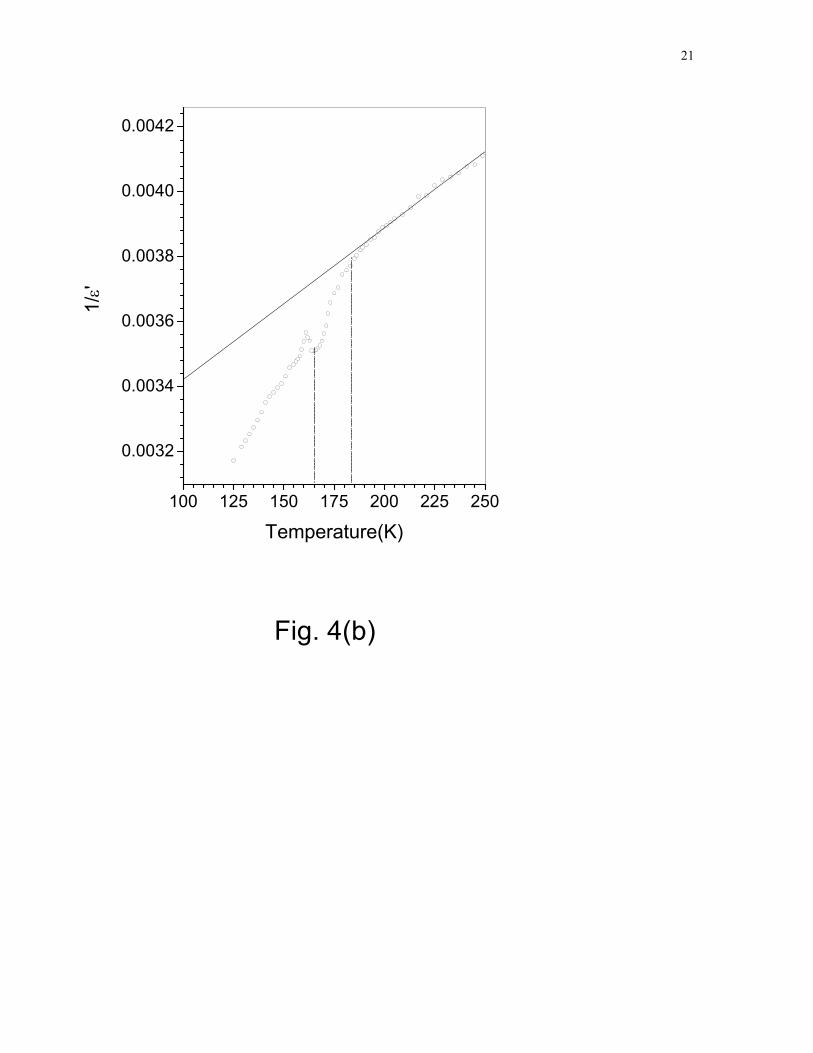
The dielectric constant of (Ca1-xPbx)TiO3 system obeys Curie-Weiss behaviour at
high temperatures as shown in Fig. 4 (a and b) for x = 0.10 and 0.20 respectively. The
departure from Curie-Weiss law over about 20K range (shown by dotted vertical lines in
Fig. 4) above the transition temperature points towards diffuse nature of this transition
which may be due to local compositional fluctuations which are invariably present in
samples prepared by conventional solid state route [27]. Since the transition temperature
(Tm/) of the mixed system varies with Pb content (x) at a rate of 3.3K/mol% of PbTiO3,
different regions of the sample with slightly varying compositions will have different
transition temperatures (Tm/). The experimentally measured ε/ versus temperature plot
will therefore be a broad envelope of these local transitions. This will naturally smear out
the ε/ versus temperature plots. Such diffuse transitions are known to exhibit departure
from Curie-Weiss behaviour over wide range of temperatures [29,30]. The Curie-Weiss
temperatures (Tc) as obtained from the extrapolation of the linear region in the 1/ε/ versus
temperature plots in Fig. 4 are found to be –109K and –15K for x=0.10 and 0.20,
respectively. The significance of negative Curie-Weiss temperature in this mixed system
needs to be elaborated.
For ferroelectric materials, the dielectric constant above the transition temperature
(Tm/) is known to follow Curie-Weiss behaviour:
χ/ = C / (T-Tc) ---------------------(1)
where C is the Curie constant and Tc the Curie Weiss temperature. For ferroelectrics, Tc
has to be necessarily positive and it may be less than or equal to Tm/ for first and second
8
order phase transitions, respectively [31]. For antiferroelectrics, phenomenologically, the
dielectric constant follows the relationship [32]
ε/ = 1/ [g + λ(T – T0)] ---------------- (2)
where g is a measure of the coupling between the sublattice polarization (antipolar), λ is
inverse of Curie constant. Eq. (2) can be recast in the form of Eq. (1) by putting 1/λ = C
(C is Curie constant) and T0 – g/λ =Tc. Unlike ferroelectrics where To is necessarily
positive, the sign of Tc for antiferroelectrics may be positive or negative depending on
whether T0<gC or T0>gC, respectively i.e., it depends on the value of the Curie-Weiss
constant (C) and the sublattice antipolar coupling(g) [21]. The negative value of Cure-
Weiss temperature for (Ca1-xPbx)TiO3 implies that the dielectric anomaly in Fig. 2 is
definitely not due to a ferroelectric transition but can be due to an antiferroelectric phase
transition. This is similar to the case of (Ca1-xSrx)TiO3 system where for compositions
0.88 < x ≤ 0.40, negative value of Tc has been shown to be due to an antiferroelectric
transition [18, 20-21]. In magnetic systems also, negative value of Tc is taken as a proof
for an antiferromagnetic transition[33].
At this stage, it may be pertinent to understand as to why (Ca1-xSrx)TiO3 [18,20-
21] and (Ca1-xPbx)TiO3 systems exhibit antiferroelectric transition with negative Tc. As
far as one of the end members (SrTiO3 or PbTiO3) is concerned, it is either an incipient
ferroelectric or ferroelectric but does not possess any antiferroelectric instability. In the
following, we shall now advance arguments to propose that the origin of
antiferroelectricity in these two mixed systems lies in the incipient antiferroelectric
behaviour of CaTiO3. The temperature variation of the dielectric constant in SrTiO3 [3],
9
KTaO3[8] and CaTiO3 [22] have been fitted with the following quantum mechanical
mean-field formula due to Barrett [26]
χ = M / [(T1/2) coth (T1/2T) – Tc] ------------- (3)
This expression has been derived within the self consistent single mode theory for
quantum crystals [3] as well as a limiting case of a renormalized harmonic approximation
involving nonlinear polarizability of the oxygen shell [4]. The characteristic temperature
T1 in Eq. (3) signifies the onset of low temperature region in which the quantum effects
are important and dielectric constant shows deviation from the classical Curie-Weiss law.
The values of T1 = 84K and 56.9K, and Tc= 38K and 13.1K for SrTiO3 and KTaO3,
respectively, are positive [3-4] whereas for CaTiO3 T1=104K and Tc= -159K [16].
Dielectric measurements by other workers [23,34] have also revealed negative Tc for
CaTiO3. For temperatures T>T1 where the quantum effects can be ignored, Eq.(3)
reduces to the classical Curie-Weiss law with Tc of Eq.(3) becoming the Curie-Weiss
temperature[26]. A negative Tc for CaTiO3 clearly rules out incipient ferroelectric
behaviour proposed by earlier workers [23,35] but implies an incipient antiferroelectric
behaviour. This is in contrast to SrTiO3 and KTaO3 which are incipient ferroelectrics with
positive Tc. In a recent experimental study of the temperature dependence of soft mode
frequency in CaTiO3, Zelezny et al [36] have also reported negative Tc of about –105K
which they have attributed to an incipient ferroelectric behaviour. The arguments
advanced in this paper, however, clearly show that Tc has to be necessarily positive for
incipient or regular ferroelectric behaviour. We suspect that the soft mode observed by
these workers corresponds to a non-zone centre phonon which is responsible for the
negative Tc. It seems that Pb2+ and Sr2+ substitutions stabilize the AFE phase in the
10
CaTiO3 matrix by raising the transition temperatures to values greater than T1(=104K) in
Eq.(3) such that the effect of quantum fluctuations becomes negligible. The present
results also suggest that the recent first principles calculations [37-38] of phonons and
static dielectric constant in CaTiO3 need to be reexamined from the point of view of an
antiferroelectric instability.
4. Conclusions
The dielectric constant of CaTiO3 increases with increasing temperature as per
Barret’s law with evidence for quantum saturation below 30K. We have shown for the
first time that Pb2+ substitution can lead to a dielectric anomaly for concentrations
x≥0.10. Further, we have shown that the dielectric anomaly is due to a thermodynamic
phase transition and not due to a relaxor/ dipolar glass transition. The Curie-Weiss fit to
the dielectric constant above the transition temperature reveals negative Curie-
temperature which implies an antiferroelectric transition. It is argued that CaTiO3 is an
incipient antiferroelectric in which Pb2+ substitution suppresses the quantum fluctuations
and thereby stabilises the antiferroelectric phase.
5. Acknowledgement
We thank IUC-DAEF for partial financial support.
11
References:
[1] B.E. Vugmeister and M.D. Glinchuk, Rev. Mod. Phys. 62, 993(1990)
[2] U.T. Höchli, K. Knorr K, and A. Loidl, Adv. Phys. 39 ,405 (1990)
[3] K.A. Muller and H. Burkard, Phys. Rev. B 19, 3593 (1979)
[4] D. Rytz, U.T. Höchli, and H.Bilz Phys. Rev. B 22, 359 (1980)
[5] J. Hemberger, M. Nicklast, R.Viana, P. Lunkenheimer, A.Loidl, and Böhmer,
J. Phys.: Condens. Matter 8, 4673 (1996)
[6] R.A. Cowley, Phys. Rev. 134, A981(1964)
[7] G. Shirane, R. Nathans, and V.J. Minkiewicz , Phys. Rev. 157, 396 (1967)
[8] P.A. Fleury, and J.M. Worlock, Phys. Rev. 174, 613(1968)
[9] K.A. Muller, W. Berlinger, and E.Tosati, Z. Phys. B 84, 277(1991)
[10] R. Vacher, J. Pelous, B. Hennion, G. Coddens, E. Courtens, and K.A. Muller,
Europhys. Lett. 17, 45 (1992)
[11] O.M. Nes, K.A. Muller, T. Suzuki, and F. Fossheim, Europhys. Lett. 19, 397(1992)
[12] R. Viana, P. Lukenheimer, J. Hemberger, R. Bohmer and A Loidl, Phys. Rev. B 50,
601(1994)
[13] R. Martonak, and E. Tossatti, Phys. Rev. B 49, 12596 (1994)
[14] T. Schneider, H. Beck, and E. Stoll, Phys. Rev. B 13, 1123 (1976)
[15] W. Zhong, and D. Vanderbilt, Phys. Rev. B 53, 5047 (1996);
R. Roussev and A.J. Mills, Phys. Rev. B 67, 014105 (2003)
[16] J.G. Bednorz, and K.A. Muller, Phys. Rev. Lett. 52, 2289 (1984)
12
[17] V.V. Lemanov, E.P. Smirnova, P.P Syrnikov, and E.A. Tarakanov, Phys. Rev. B
54, 3151 (1996); V.V. Lemanov, E.P. Smirnova, and E.A. Tarakanov, Phys. Solid
State 39, 628 (1997)
[18] R. Ranjan, D. Pandey, and N.P. Lalla, Phys. Rev Lett. 84, 3726 (2000)
[19] R. Ouillon, J.P.P. Lucarre, P. Ranson, P. Pruzan, S.K. Mishra, R. Ranjan, and
D. Pandey, J. Phys: Condens. Matter 14, 2079 (2002)
[20] R. Ranjan, and D. Pandey, J. Phys: Condens. Matter 13, 4239 (2001)
[21] R. Ranjan, and D. Pandey, J. Phys: Condens. Matter 13, 4251 (2001)
[22] I.S. Kim, M. Itoh, and T.J. Nakamura, Solid State Chem. 101, 77 (1992)
[23] V.V. Lemanov, A.V. Sotnikov, E.P. Smirnova, M.Weihnacht, and R. Kunze,
Solid State Commun. 110, 611 (1999)
[24] A. Chandra, and D. Pandey, J. Mater. Res. 18, 413 (2003)
[25] A.M. Glazer, Acta Cystallogr. B 28, 3384 (1972); A.M. Glazer, Acta Cystallogr. A
31, 756 (1975)
[26] J.H. Barrett, Phys. Rev. 86, 118 (1952)
[27] D. Pandey, Key Engg. Materials 101-102, 177 (1995)
[28] L.E. Cross, Ferroelectrics 76, 241 (1987)
[29] V.S. Tiwari, and D. Pandey, J. Am. Ceram. Soc. 77,1819 (1994)
[30] V.S. Tiwari, N. Singh, D. Pandey, J. Phys.: Condens. Mattter 7,1441 (1995)
[31] M.E. Lines, and A.M. Glass Principles and Applications of Ferroelectrics and
Related Materials (Oxford: Clarendon) (1977)
[32] R. Blinc, and B. Zeks Soft Modes in Ferroelectrics and Antiferroelectrics (North
Holland Publishing Co.- Amsterdam) (1974)
13
[33] C. Kittel Introduction to Solid State Physics (John Wiley & Sons, Inc.,
Singapore) (1996)
[34] G. Rupprecht, and R.O. Bell, Phys. Rev. 135, A748 (1965)
[35] Y.X. Wang, W.L. Zhong, C.L. Wang, and P.L. Zhang, Solid State Commun. 117,
461 (2001)
[36] V. Zelezny, E. Cockayne, J. Petzelt, M.F. Limonov, D.E. Usvyat, V.V. Lemanov,
A.A. Volkov, Phys. Rev. B 66, 24303 (2002)
[37] D. Vanderbilt, and H. Zhong, Ferroelectrics 206-207,181 (1998)
[38] E. Cockayne, and B.P. Burton, Phys. Rev. B 62,3735 (2000)
14
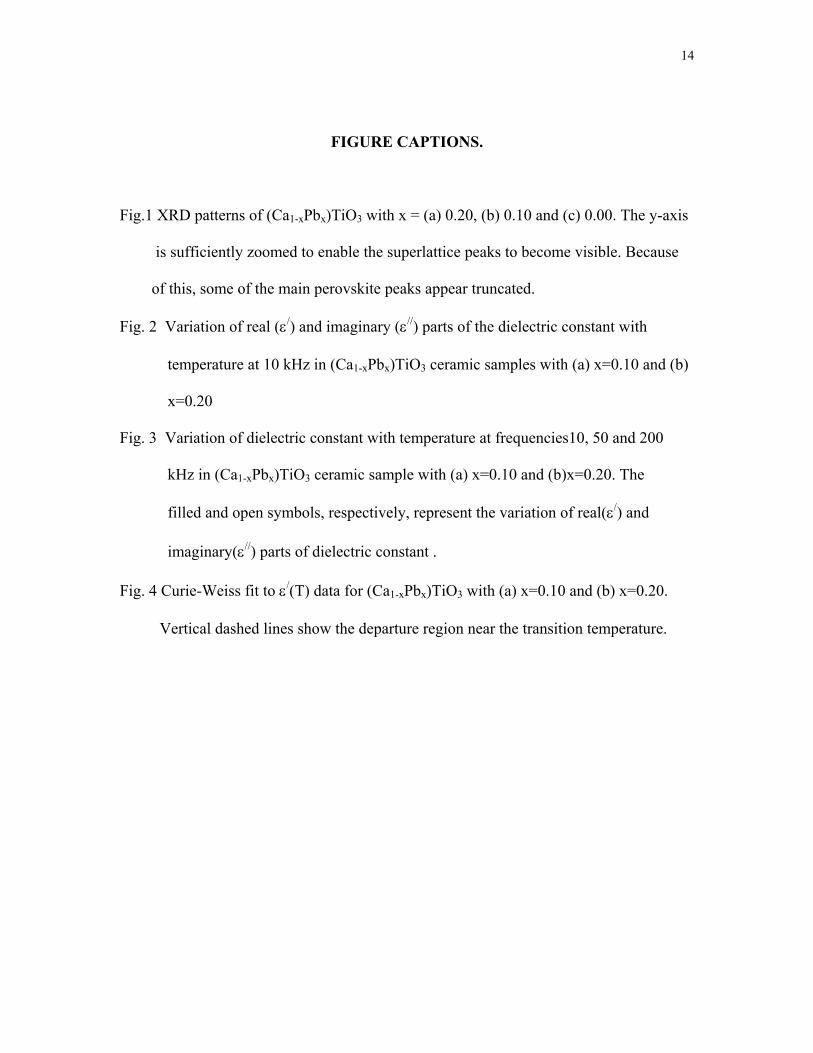
FIGURE CAPTIONS.
Fig.1 XRD patterns of (Ca1-xPbx)TiO3 with x = (a) 0.20, (b) 0.10 and (c) 0.00. The y-axis
is sufficiently zoomed to enable the superlattice peaks to become visible. Because
of this, some of the main perovskite peaks appear truncated.
Fig. 2 Variation of real (ε/) and imaginary (ε//) parts of the dielectric constant with
temperature at 10 kHz in (Ca1-xPbx)TiO3 ceramic samples with (a) x=0.10 and (b)
x=0.20
Fig. 3 Variation of dielectric constant with temperature at frequencies10, 50 and 200
kHz in (Ca1-xPbx)TiO3 ceramic sample with (a) x=0.10 and (b)x=0.20. The
filled and open symbols, respectively, represent the variation of real(ε/) and
imaginary(ε//) parts of dielectric constant .
Fig. 4 Curie-Weiss fit to ε/(T) data for (Ca1-xPbx)TiO3 with (a) x=0.10 and (b) x=0.20.
Vertical dashed lines show the departure region near the transition temperature.
15
20 30 40 50 60 70
(c)
Inte
nsity
(in
arbi
trary
uni
ts)
Two-Theta (degrees)
(b)
221(
S)
Fig.1
(a)
531(
S)
423(
S)51
1(S)20
1(S)
404(
P)
422(
P)42
1(S)
402(
P)31
3(S)
322(
S)00
4(P)
203(
S)31
2(S)
222(
P)31
1(S)
310
(S)
200(
P)
200(
P)
16
135 140 145 150 155 160135
140
145
150
155
160
10
15
20
25
30
ε//ε/
Temperature(K)
Fig.2(a)
17
140 150 160 170 180260
270
280
290
300
20
25
30
35
Temperature(K)
ε'
Fig. 2(b)
ε''
18
135 140 145 150 155 160125
130
135
140
145
150
155
8
13
18
23
28
Fig.3(a)
ε//ε/
Temperature (K)
10kHz 50kHz 200kHz
19
140 150 160 170 180 190
240
250
260
270
280
290
300
15
20
25
30
35
40
45
Fig.3(b)
ε//ε/
Temperature (K)
10kHz 50kHz 200kHz
20
100 125 150 175 200 225 250
0.0066
0.0068
0.0070
0.0072
0.0074
0.0076
Fig.4(a)
1/ε'
Temperature(K)
21
100 125 150 175 200 225 250
0.0032
0.0034
0.0036
0.0038
0.0040
0.0042
Fig. 4(b)
1/ε'
Temperature(K)