Print advertising media substitution - RIT Scholar Works
25
Rochester Institute of Technology RIT Scholar Works Books 2007 Print advertising media substitution Patricia Sorce Mahew Swain Follow this and additional works at: hp://scholarworks.rit.edu/books is Full-Length Book is brought to you for free and open access by RIT Scholar Works. It has been accepted for inclusion in Books by an authorized administrator of RIT Scholar Works. For more information, please contact [email protected]. Recommended Citation Sorce, Patricia and Swain, Mahew, "Print advertising media substitution" (2007). Accessed from hp://scholarworks.rit.edu/books/39
-
Upload
khangminh22 -
Category
Documents
-
view
2 -
download
0
Transcript of Print advertising media substitution - RIT Scholar Works

Rochester Institute of TechnologyRIT Scholar Works
Books
2007
Print advertising media substitutionPatricia Sorce
Matthew Swain
Follow this and additional works at: http://scholarworks.rit.edu/books
This Full-Length Book is brought to you for free and open access by RIT Scholar Works. It has been accepted for inclusion in Books by an authorizedadministrator of RIT Scholar Works. For more information, please contact [email protected].
Recommended CitationSorce, Patricia and Swain, Matthew, "Print advertising media substitution" (2007). Accessed fromhttp://scholarworks.rit.edu/books/39

Print Advertising
Media Substitution
By
Matt Swain
Graduate Student
School of Print Media
Rochester Institute of Technology
Patricia Sorce, Ph.D.
Administrative Chair and Fawcett
Distinguished Professor
School of Print Media
Rochester Institute of Technology
A Research Monograph of the
Printing Industry Center at RIT
No. PICRM-2008-07


By
Matt Swain Graduate Student, School of Print MediaRochester Institute of Technology
Patricia Sorce, Ph.D. Administrative Chair and Fawcett Distinguished Professor, School of Print MediaRochester Institute of Technology
Print Advertising Media Substitution
A Research Monograph of the Printing Industry Center at RIT Rochester, NYJanuary 2008
PICRM-2008-07
i
© 2008 Printing Industry Center at RIT— All rights reserved.

Swain & Sorce (PICRM-2008-07)
The research agenda of the Printing Industry Center at RIT and the publication of research findings are supported by the following organizations:
With Thanks
ii
bc

Print Advertising Media Substitution 1
Table of ContentsAbstract .......................................................................................................................... 3
Introduction ................................................................................................................... 3
Advertising Media—The Changing Landscape ......................................................... 4
Radio ....................................................................................................................... 4
Television ................................................................................................................ 5
Newspaper .............................................................................................................. 6
Magazine ................................................................................................................. 6
Outdoor ................................................................................................................... 6
Internet .................................................................................................................... 7
Methodology .................................................................................................................. 8
Data Gathering ....................................................................................................... 8
Accounting for Inflation ....................................................................................... 8
Data Analysis .......................................................................................................... 8
Unmeasured Media ............................................................................................... 9
Results .......................................................................................................................... 10
Distribution of Advertising Spending by Medium.......................................... 10
Differences in Media Mix by Industry .............................................................. 12
Internet Advertising Growth .............................................................................. 14
Discussion .................................................................................................................... 15
References ..................................................................................................................... 17
Table of Contents

Swain & Sorce (PICRM-2008-07)2
Print Advertising Media Substitution 3
Abstract
This quantitative study examined changes to the advertising media mix of lead-ing national advertisers from 2003 and 2005. The advertising channels analyzed were newspaper, magazine, television, outdoor, radio, Internet, and Yellow Pages. Of these seven categories, there was statistically significant growth in radio and Internet adver-tising, and a statistically significant decrease in traditional Yellow Pages advertising. Differences in advertising spending were found by industry.
Introduction
Where it was once standard to put the majority of their advertising efforts into televi-sion and newspaper, corporations have re-evaluated the distribution of their advertis-ing budgets. As new types of communication media continue to evolve, leading national advertisers will need to change with the evolution of new media. One medium that has played a major role in this advertising transition is the Internet.
The Internet has become a powerful medium for advertising over the past decade. In the post-9/11 economy, top companies have larger advertising budgets than ever before. Some of these companies are still focusing the majority of their budgets toward televi-sion advertising, while others have decided to dedicate more funds to newer advertis-ing paths, such as the Internet. This research examined the distribution of advertising spending for the one hundred leading national advertisers from 2003 and 2005 in order to analyze changes in media strategies.
The research focused on three main objectives:
Were there significant changes to the distribution of advertising spending by 1. medium between 2003 and 2005?
Are there differences in media mix by industry of the advertiser?2.
Has Internet advertising grown at the expense of other media?3.
Abstract
Swain & Sorce (PICRM-2008-07)4
Advertising Media—The
Changing Landscape
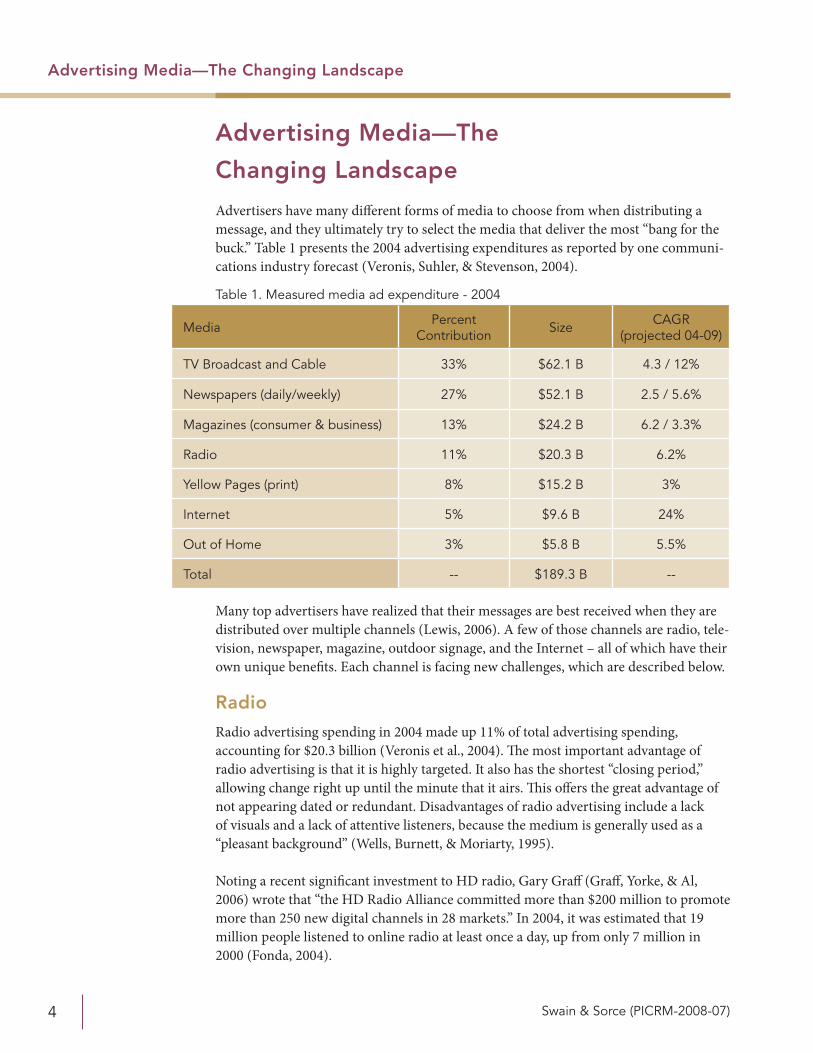
Advertisers have many different forms of media to choose from when distributing a message, and they ultimately try to select the media that deliver the most “bang for the buck.” Table 1 presents the 2004 advertising expenditures as reported by one communi-cations industry forecast (Veronis, Suhler, & Stevenson, 2004).
Table 1. Measured media ad expenditure - 2004
Media Percent Contribution Size CAGR
(projected 04-09)
TV Broadcast and Cable 33% $62.1 B 4.3 / 12%
Newspapers (daily/weekly) 27% $52.1 B 2.5 / 5.6%
Magazines (consumer & business) 13% $24.2 B 6.2 / 3.3%
Radio 11% $20.3 B 6.2%
Yellow Pages (print) 8% $15.2 B 3%
Internet 5% $9.6 B 24%
Out of Home 3% $5.8 B 5.5%
Total -- $189.3 B --
Many top advertisers have realized that their messages are best received when they are distributed over multiple channels (Lewis, 2006). A few of those channels are radio, tele-vision, newspaper, magazine, outdoor signage, and the Internet – all of which have their own unique benefits. Each channel is facing new challenges, which are described below.
Radio
Radio advertising spending in 2004 made up 11% of total advertising spending, accounting for $20.3 billion (Veronis et al., 2004). The most important advantage of radio advertising is that it is highly targeted. It also has the shortest “closing period,” allowing change right up until the minute that it airs. This offers the great advantage of not appearing dated or redundant. Disadvantages of radio advertising include a lack of visuals and a lack of attentive listeners, because the medium is generally used as a “pleasant background” (Wells, Burnett, & Moriarty, 1995).
Noting a recent significant investment to HD radio, Gary Graff (Graff, Yorke, & Al, 2006) wrote that “the HD Radio Alliance committed more than $200 million to promote more than 250 new digital channels in 28 markets.” In 2004, it was estimated that 19 million people listened to online radio at least once a day, up from only 7 million in 2000 (Fonda, 2004).
Advertising Media—The Changing Landscape
Print Advertising Media Substitution 5
Recent studies have suggested that radio is a powerful advertising medium when used in conjunction with other media. Because of the hype around multi-channel marketing, radio will most likely maintain its proportion of the advertising pie (Brown, 2005). Clear Channel is attempting to boost its revenue and entice new advertisers by breaking the norms of traditional radio advertising and offering five-second spots, called “adlets,” at about 20% the cost of a 60 second advertisement. They will also offer two-second ads at half the cost of the five-second ads. There is a split between media buyers on whether or not this approach will be successful, but it could be a good opportunity for radio stations looking to attract smaller advertisers (Vranica, 2006).
Television
Television advertising in 2004 made up one-third of measured media expenditures at $62 billion, capturing the largest share of any media (Veronis et al., 2004). This number reflects audience size data that shows television accounted for nearly 45% of American adults’ daily media consumption in 2005 (Lindsay, 2006). Television allows advertisers to stimulate both the auditory and visual systems of consumers, increasing the impact of their messages. Also, with the large audience that television attracts, the cost per person reached could be less than a penny. However, the disadvantage of this approach is that producing and airing a television commercial can be extremely expensive in terms of absolute costs (Wells et al., 1995).
In 2004, broadcast television advertising spending experienced substantial growth because of unprecedented spending on the presidential election and the Olympics. This excitement was short-lived, however, when in June of 2005 Procter & Gamble announced that it was cutting $300 million from its television advertising budget. As the world’s largest advertiser, this was a significant announcement for the future of televi-sion advertising. Procter & Gamble has been a long-time television advertiser, spend-ing roughly $2 billion last year in television alone. Media buyers speculated that the company wants to reduce its dependence on television advertising. One New York advertising consultant suggested that, “a big factor accelerating [Procter & Gamble’s advertising] shift now … is that TV-advertising costs have been rising and confidence in the medium’s ability to reach consumers has been eroding” (Mandese, 2005). With Procter & Gamble making such a drastic change to its advertising spending, market analysts fear others will follow suit.
In August of 2006, the Australian beer company, Foster’s, announced that it will no longer run television advertisements in the U.S., and will focus solely on Internet adver-tising. While other beer manufacturers are continuing to pour money into television commercials, they are also more aggressively pursuing Internet audiences, indicating that beer companies may continue to move away from television advertising as their primary means of reaching their main demographic of males between the ages of 18 and 34 (Becker, 2006).
At the same time that the Internet is gaining consumer mindshare, digital video record-ers, such as TiVo, are finding their way into a growing number of households – yet
Advertising Media—The Changing Landscape

Swain & Sorce (PICRM-2008-07)6
another factor eroding the impact of television advertising. Digital video recorders allow consumers to take control of when they watch a program and whether or not they want to sit through the commercials. Given the option, viewers will increasingly choose “time-shift” viewing to by-pass the inconvenience of commercial breaks (Elms, 2004).
Newspaper
Newspaper advertising in 2004 had the second-largest share of advertising spending on measured media at 27% market share, or $52.2 billion (Veronis et al., 2004). It is an appealing medium because of its extensive market coverage, geographic flexibility, and the positive attitude that consumers generally have toward it. Some of the disadvantages of the medium that advertisers face are its short life span, the amount of clutter, and poor reproduction quality, with the exception of pre-printed material such as inserts (Wells et al., 1995).
The newspaper industry as a whole has been experiencing losses over the past few years. One group that newspapers are worrying about is real estate advertisers. Real estate advertising is an $11 billion business annually, and newspapers have historically enjoyed a significant portion of real estate advertising. As more consumers turn to online real estate shopping, a number of companies are reducing their newspaper advertising spending and moving it toward online advertising. Some newspapers are fighting back by teaming up to host Web sites such as Apartments.com, where they can entice adver-tisers to continue advertising in their newspapers by offering the opportunity to adver-tise online as well (Mullaney, 2006).
Magazine
Magazine advertising accounted for $24.2 billion, or 13%, of measured media adver-tising expenditure in 2004 (Veronis et al., 2004). The medium has many advantages, the most rewarding being the ability to convey a message to a very targeted audience. Advertisers take advantage of highly targeted campaigns because there are magazines for every interest. In this medium, advertisers also tend to take advantage of the gener-ally superior print quality (Wells et al., 1995). The limitations of magazine advertising include limited flexibility and the high cost of advertising in magazines with extensive distribution networks.
In one study, two-thirds of the consumers surveyed said that they learned about the Web site in question after first seeing it advertised in a magazine. Advertisers have recognized the power of multi-channel marketing, and have taken advantage of using magazines as a bridge to their Web sites (Kanso & Nelson, 2004).
Outdoor
Outdoor advertising had the smallest portion of measured media advertising spending in 2004 with 3%, or $5.8 billion (Veronis et al., 2004). It is a medium that can be seen on buildings, buses, or signs on the morning drive to work. It can be very large, very color-
Advertising Media—The Changing Landscape

Print Advertising Media Substitution 7
ful, and consequently hard to ignore. It is recognized as the least expensive major media communication tool, and is great for messages that need to be repeated. Disadvantages of the medium include the generally short exposure time and, as a result, the need to make the message brief (Wells et al., 1995).
One of the recent roadside implementations has been digital billboards. At the start of 2007, there were about 400 digital billboards nationwide. These billboards allow for messages to be changed frequently and do not require the printing or set-up and take-down costs that are associated with traditional billboard advertising. Safety experts have expressed concerns about whether or not these billboards have created added distrac-tions to drivers. Some industry analysts predict that there could be as many as 90,000 lining the nation’s streets and highways within the next decade (Story, 2007). Again, safety experts and zoning commissions will most likely play a role in slowing this imple-mentation process.
Internet
With $9.6 billion (5%) of the 2004 measured media advertising expenditure (Veronis et al., 2004), Internet advertising is growing at the highest rate of any medium. Companies can advertise through search engines, banner advertising, and site sponsoring – to name a few of the different approaches. The medium offers many advantages. Perhaps the most important is measurability. Advertising in the medium can be extremely well-targeted to a desired audience as well. One current disadvantage to Internet advertising is that pay-per-click advertisers are paying for falsified click-throughs—something that search engine owners are working to curb.
Until as recently as 2003, there had been an overwhelming impression that there was more Internet advertising space to be distributed than there were advertisers to purchase the space. This tended to make all parties involved feel as though Internet advertising was a buyer’s market, keeping web advertising inexpensive for many years. Over the last several years, there has been a shift to a seller’s market, where leading Web sites have begun to charge higher premiums to advertise on their sites (Bruner, 2005). Another advantage of Internet advertising is its ability to produce return on investment (ROI) metrics. With an increased ability to measure advertising effectiveness, compa-nies will embrace these technological advances, which will enable behavioral targeting (Veronis, Suhler, & Stevenson, 2005).
In summary, each advertising channel is going through its own changes as advertisers find more or less value in the medium’s ability to reach the target audience. They under-stand that multi-channel communication is an effective tool, but it is difficult to find an exact combination for success. Because of this, advertisers have adjusted their media mixes in an attempt to get the most consumer mindshare for their efforts. The purpose of this research is to quantify these changes.
Advertising Media—The Changing Landscape
Swain & Sorce (PICRM-2008-07)8
Methodology
Data Gathering
This study used the “100 Leading National Advertisers’” data for 2003 and 2005 published in Advertising Age and compiled by TNS Media Services. Once the data were entered into a spreadsheet, North American Industry Classification System (NAICS) codes were added from Hoovers.com for each of the companies on the list.
Accounting for Inflation
Because the financial figures were from different years, we needed to account for the inflation of the U.S. dollar. The inflation percentages were retrieved from the Bureau of Labor Statistics on October 24, 2006. The Advertising Agencies industry was selected from the Producer’s Price Index (PPI). Within this industry, there were sub-categories that matched what the researcher was working with for data. These sub-categories were newspapers, periodicals, television, radio, Internet, and other media placements.
The 2003 annual figures were compared against the 2005 annual figures in order to estimate the percent change due to inflation. To compare the data, the 2003 data were multiplied by the appropriate inflation percentage in order to get comparable figures to 2005.
Data Analysis
There were ten data points for each firm in the spreadsheets:
1. Total U.S. ad spending
2. Estimated unmeasured
3. Measured media
4. Magazine
5. Newspaper
6. Outdoor
7. Television
8. Radio
9. Internet1
10. Yellow Pages
Total U.S. ad spending was compared with estimated unmeasured and measured media in order to obtain percent-of-whole charts. The data in the seven individual media cate-gories, (Magazine, Newspaper, Outdoor, TV, Radio, Internet, and Yellow Pages) were 1 - The TNS data on Internet spending excluded paid search and broadband video advertising.
Methodology

Print Advertising Media Substitution 9
used for the majority of the research. The t-Test and the Sign Test were used to find the statistical significance of the data. The following section briefly explains how the unmea-sured media compared to the measured media.
Unmeasured Media
Unmeasured media focuses on media such as public relations, trade shows, catalogs and direct mail, B2B promotion products, branded entertainment, custom publishing, and consumer promotion. In 2003, there was $53.8 billion spent in advertising on measured media among the leading national advertisers, but there was also an estimated $38.7 billion spent in unmeasured media. Figure 1 compares unmeasured advertising spend-ing to measured advertising spending between 2003 and 2005.
This comparison suggested that, while unmeasured advertising has grown by $2.3 billion, advertising spending for unmeasured media did not grow as quickly as for measured media, which increased by over $7 billion in that time period. This contra-dicted the recent notions that advertising spending on unmeasured media was growing at a faster rate than measured media spending (Cappo, 2003).
While it was important to address this data, the unmeasured media was not the primary focus of the research. The data in the seven individual media categories, (Magazine,
Methodology
2003 2005
$91.6 Billion $101.3 Billion
40%
60%
41%
59%
Unmeasured Media
Measured Media
Figure 1. Measured media advertising spending vs. unmeasured media spending

Swain & Sorce (PICRM-2008-07)10
Newspaper, Outdoor, TV, Radio, Internet, and Yellow Pages) were used for the majority of the research. The t-Test and the Sign Test were used to find the statistical significance of the data.
Results
Distribution of Advertising Spending by Medium
Were there significant changes to the distribution of advertising spending by medium between 2003 and 2005?
Overall spending from 2003 to 2005 grew $7.4 billion. Figure 2 shows the total measured advertising spending by media for the 100 leading national advertisers.
* 2003 data has been adjusted to account for inflation
There was growth in all media types with the exception of Yellow Pages advertising. Yellow Pages advertising dropped by over $50 million, accounting for a 30% reduction in spending for the medium. The change in the percent contribution of each medium to the total advertising expenditures for 2003 and 2005 is shown in Figure 3.
Methodology
Magazine
60,000
Mill
ions
of
Do
llars
Media
50,000
40,000
30,000
20,000
10,000
0Newspaper Outdoor Television Radio Internet Yellow
PagesTotal
2003
2005
Figure 2. Total measured advertising spending by media for 100 leading national advertisers*

Print Advertising Media Substitution 11
The relative proportion in Figure 3 reveals that there was a 4% decrease in televi-sion advertising’s contribution to the total measured advertising spending. The rela-tive proportion increased by more than 2% for both radio and Internet. Newspaper advertising’s percentage dropped less than 0.5%, while outdoor advertising’s percentage increased by less than 0.5%.
Between 2003 and 2005 there were some mergers, acquisitions, blunders, financial constraints, strategic redirections, and other circumstances that altered which compa-nies appeared on the 100 Leading National Advertisers list for 2005. In order to create comparability, only the firms that appeared on both lists in their exact form were used, leaving 81 companies in the sample. Matched pair t-Tests were used to see if these changes in advertising were statistically significant. As Table 2 shows, there is a statisti-cally significant increase in spending for radio and Internet advertising only.
Results
Magazine
Newspaper
Outdoor
Television
Radio
Internet
Yellow Pages
1.18%
14.36%
17.53%
61.07%
3.22%2.30%
0.34%
1.53%
13.87%
17.55%
57.04%
$61.2 Billion$53.8 Billion
5.48%4.33%
0.20%
Figure 3. Distribution of spending on measured media

Swain & Sorce (PICRM-2008-07)12
Table 2. Determining statistical significance (n=81)
MediaMean (in millions) % Change
in Mean P (T<=t)two-tail
StatisticallySignificant2003 2004
Magazine $109.25 $123.44 12.99% 0.480 No
Newspaper 66.13 84.82 28.26% 0.347 No
Outdoor 6.98 9.34 33.86% 0.252 No
Television 367.29 388.15 5.68% 0.692 No
Radio 15.36 34.66 125.59% 0.001 Yes
Internet 13.59 24.30 78.77% 0.016 Yes
Yellow Pages 1.96 0.85 -56.53% 0.144 No
Because only nine companies from each of the two lists nationally advertised in the Yellow Pages, the sign test was used to further analyze this medium. The test was statisti-cally significant (p ≤ 0.05), revealing only one leading national advertiser that increased its Yellow Pages advertising.
Differences in Media Mix by Industry
Are there differences in media mix by industry of the advertiser?
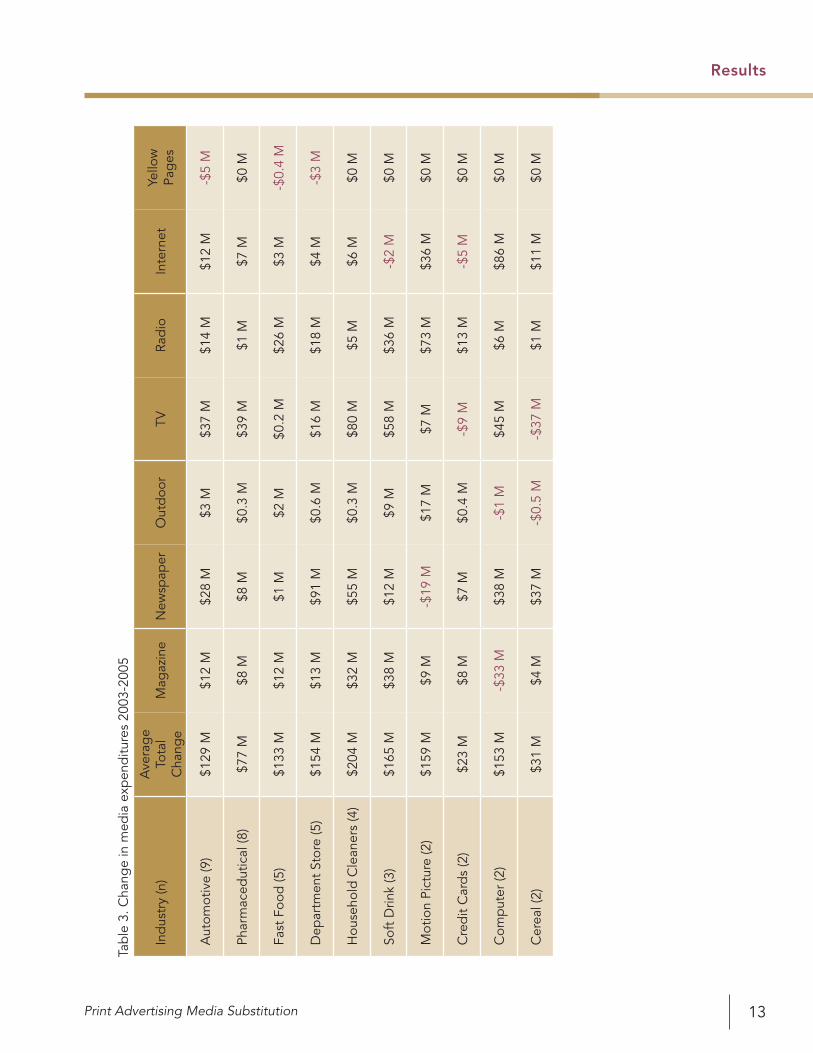
There was variation among the industries in their media mixes. Table 3 shows the break-down of the representation of some of the industries and the average change in expen-ditures that each industry accounted for per medium. Unlike the analysis that was performed in the first section, these sample sizes are too small to use significance tests. A descriptive analysis was used to ascertain the changes that have occurred among lead-ing industries. Table 3 presents those differences.
Results
Print Advertising Media Substitution 13
Results
Tab
le 3
. Cha
nge
in m
edia
exp
end
iture
s 20
03-2
005
Ind
ustr
y (n
)A
vera
ge
Tota
l C
hang
eM
agaz
ine
New
spap
erO
utd
oor
TVRa
dio
Inte
rnet
Yello
w
Pag
es
Aut
omot
ive
(9)
$129
M$1
2 M
$28
M$3
M$3
7 M
$14
M$1
2 M
-$5
M
Phar
mac
edut
ical
(8)
$77
M$8
M$8
M$0
.3 M
$39
M$1
M$7
M$0
M
Fast
Foo
d (5
)$1
33 M
$12
M$1
M$2
M$0
.2 M
$26
M$3
M-$
0.4
M
Dep
artm
ent
Stor
e (5
)$1
54 M
$13
M$9
1 M
$0.6
M$1
6 M
$18
M$4
M-$
3 M
Hou
seho
ld C
lean
ers
(4)
$204
M$3
2 M
$55
M$0
.3 M
$80
M$5
M$6
M$0
M
Soft
Drin
k (3
)$1
65 M
$38
M$1
2 M
$9 M
$58
M$3
6 M
-$2
M$0
M
Mot
ion
Pict
ure
(2)
$159
M$9
M-$
19 M
$17
M$7
M$7
3 M
$36
M$0
M
Cre
dit
Car
ds
(2)
$23
M$8
M$7
M$0
.4 M
-$9
M$1
3 M
-$5
M$0
M
Com
put
er (2
)$1
53 M
-$33
M$3
8 M
-$1
M$4
5 M
$6 M
$86
M$0
M
Cer
eal (
2)$3
1 M
$4 M
$37
M-$
0.5
M-$
37 M
$1 M
$11
M$0
M

Swain & Sorce (PICRM-2008-07)14
In the industries with smaller sample sizes, there are eight instances where advertisers reduced their spending in media other than Yellow Pages from 2003 to 2005. In the same time period, there were only three instances of a reduction in spending for the highly-represented companies, and those were all in Yellow Pages advertising. While computer manufacturers reduced their magazine advertising spending by an average of $33 million, soft drink manufacturers increased their magazine advertising spending by an average of $38 million. A similar situation to this is where cereal manufacturers reduced their television spending by an average of $37 million, but the average change in expenditure for advertisers in the automotive industry was an increase of $37 million. Also, note that the pharmaceutical and household cleaners industries were the only ones to show no decline in advertising for any of the measured media. This table alone shows that there are, in fact, differences in media mix depending on the industry of the advertiser.
Internet Advertising Growth
Has Internet advertising grown at the expense of other media?
Figure 4 shows the percent that each media contributed to the $7.5 billion growth in advertising among leading national advertisers from 2003 and 2005. (Yellow Pages advertising decreased, so it is not included.) Internet advertising expenditure contrib-uted to 19% of that growth, the third largest contributor.
Results
Figure 4. Percent contribution to growth between 2003 and 2005
Magazine
Newspaper
Outdoor
Television
Radio
Internet
18%
10%
4%
27%
22%
19%

Print Advertising Media Substitution 15
Though Internet advertising is growing at a statistically significant rate, this chart indi-cates that spending on magazine, newspaper, outdoor, television, and radio advertising have also increased. Note that measured Internet advertising spending excludes paid search advertising – a very profitable area for some Web sites.
Discussion
Comparing the absolute changes in media expenditures between 2003 and 2005, the distribution of advertising spending has not changed dramatically. The top advertisers increased spending in all media with the exception of Yellow Pages. While we expected to see a growth in Internet advertising, the statistically significant growth in radio advertising came as a surprise. This growth may have been related to significant invest-ment in radio on the part of the HD alliance and other industry proponents, but it may also have been due to the fact that radio is a compliment to a well-rounded advertising campaign. The two industries that showed the most growth in radio adverting were soft drink manufacturers and fast food companies. It could be that these two industries have started to target impulse buyers while driving to or from work, or that some compa-nies may have been mimicking the advertising trends of their competitors. Regardless, radio will be a medium to watch in future years to determine whether or not advertising spending in the medium continues to grow.
When changes were analyzed by industry of the advertiser, we saw different media expenditure patterns. In the case of cereal manufacturers, national newspaper adver-tising spending increased from just over $1 million to more than $74 million. This was the most dramatic change among the industries that were reviewed in this study. It is a segment to watch to see how these companies will change their advertising mix in future years – newspaper advertising in particular. What this research showed was that all industries are going through changes to their media mixes, but that each is taking a different approach to how they will move forward.
Internet advertising among leading national advertisers is growing at a statistically significant rate. What is harder to determine is whether or not the growth in Internet advertising is coming at the expense of other media. Yellow Pages is the one medium that could be incurring losses from increases in Internet advertising. As consumers progressively continue to turn to the Internet, the trend is to perform a quick Internet search for local and national businesses rather than to look in their printed Yellow Pages book. Because of this, advertisers may be taking money that would otherwise be allocated for Yellow Pages advertising and putting it into their Internet advertising budget. In depth analysis of advertising spending, as tracked by TNS Media Intelligence, is limited because paid search advertising and broadband video spending are not included in the “measured” category of Internet advertising spending. If paid search advertising was included in the measured media portion of the data, this field would be substantially larger.
Results
Swain & Sorce (PICRM-2008-07)16
One could also argue that the 4% drop in television advertising’s proportion of the total advertising dollars spent from 2003 to 2005 lends support to this conclusion. Advertisers are gaining a better understanding of the power of Internet advertising and the broad reach that it has. Moreover, the measurability of Internet advertising is unsur-passed as opposed to traditional advertising channels, making it that much more entic-ing to focus advertising dollars in that arena.
One individual case that may further support the notion that Internet advertising is growing at the expense of other media is the recent activity of GM’s advertising spend-ing. In a recent article from Advertising Age (February 12, 2007), a table showed the change in advertising spending for General Motors when comparing January and November of 2005 to the same periods in 2006. GM has reduced its national advertising in all mainstream media by more than $600 million when compared to the same time period in 2005. Only one media channel in this list grew, and that was Internet advertis-ing. With the second-largest advertiser making a statement such as this about its media mix, it may further support the notion that Internet advertising is, in fact, increasing at the expense of other media.
This study was intended to be the basis for future research. Because of this research, future analysis of how these leading national advertisers continue to change their media mixes will be made easier and have increased meaning.
Discussion

Print Advertising Media Substitution 17
References
Becker, A. (2006, August 14). Late to the party. Broadcasting & Cable, 10.
Brown, M. (2005). Radio’s ROI advantage. NY: Radio Ad Effectiveness Lab. Retrieved September 6, 2006, from http://www.radioadlab.org
Bruner, R. E. (2005, April). The decade in online advertising 1994-2004. DoubleClick.com.
Cappo, J. (2003). The future of advertising. NY: McGraw-Hill.
Elms, S. (2004, August 26). The best advertising players will find a way to beat PVR skippers. Marketing Week, 18.
Fonda, D. (2004, April 19). The revolution in radio. Time, 163(16), 55-56.
Graff, G., Yorke, J., & Al, P. (2006, December 23). The year radio woke up. Billboard, 118(51), 26.
Kanso, A. M., & Nelson, R. A. (2004, December). Internet and magazine advertising: Integrated partnerships or not? Journal of Advertising Research, 317-326.
Lewis, H. G. (2006, April 1). Is this really a catalog? Multichannel Merchant. Retrieved April 8, 2006, from http://www.printthis.clickability.com
Lindsay, G. (2006, January 2). One consumer at a time. Advertising Age, 77(1), 22-23.
Mandese, J. (2005, June 27). P&G’s ominous 15% solution. Broadcasting & Cable, 16.
Mullaney, T. J. (2006, September 18). Ads follow home buyers to the web. Business Week, (4001), 9.
Story, L. (2007, January 11). Digital billboard up ahead: New-wave sign or hazard? New York Times, pp. C1-C9.
Veronis, Suhler, & Stevenson. (2004). Communications Industry Forecast/Forecast Summary 2005. Retrieved May 13, 2006, from https://www.vss.com/ (Reg. Required)
Veronis, Suhler, & Stevenson. (2005). Communications Industry Summary Chapter 2004. Retrieved May, 2006, from https://www.vss.com/orderform/registration.asp
Vranica, S. (2006, October 4). Ad buyers eye Clear Channel’s ‘blink’ radio. Northwest Florida Daily News. Retrieved October 4, 2006, from http://www.nwfdailynews.com/articleArchive/oct2006/clearchannelblinkradiospots.php
Wells, W., Burnett, J., & Moriarty, S. (1995). Advertising principles and practice (3rd ed.). Englewood Cliffs, New Jersey: Prentice Hall. (Original work published 1989)
References


Rochester Institute of TechnologyCollege of Imaging Arts and Sciences55 Lomb Memorial DriveRochester, NY 14623Phone: (585) 475-2733http://print.rit.edu