The effect of low cycle fatigue, ratcheting and mean stress relaxation on stress-strain response and...
8
The effect of low cycle fatigue, ratcheting and mean stress relaxation on stress–strain response and microstructural development in a dual phase steel Surajit Kumar Paul a,⇑ , Nicole Stanford b , Adam Taylor b , Timothy Hilditch a a School of Engineering, Deakin University, Pigdons Rd, Waurn Ponds, VIC 3217, Australia b Institute of Frontier Materials, Deakin University, Pigdons Rd, Waurn Ponds, VIC 3217, Australia article info Article history: Received 1 May 2015 Received in revised form 5 June 2015 Accepted 10 June 2015 Available online 17 June 2015 Keywords: Low-cycle fatigue Ratcheting Mean stress relaxation Dual phase steel Local misorientation abstract This study examines the cyclic plastic deformation behavior and microstructural development of a dual phase steel in both symmetric and asymmetric cycling in strain and stress control modes. The low-cycle fatigue (LCF) and mean stress relaxation (MSR) tests show very similar fatigue lifetimes. However, fatigue lifetimes reduce and prominent accumulation of directional strain was observed in ratcheting. A microstructural analysis has revealed that the type of cyclic test carried out has a noticeable impact on the substructural development, and this has been correlated with differences in accumulated tensile strain. Electron backscatter diffraction investigation has shown larger in-grain misorientation for ratcheting specimen in comparison with LCF and MSR specimens. The orientation of ferrite grains was found to have very little effect on their substructural development, and strain localization commonly occurred in the ferrite at the ferrite/martensite interface. Ó 2015 Elsevier Ltd. All rights reserved. 1. Introduction Dual phase (DP) steels, with a microstructure comprised of var- ious proportions of ferrite and martensite, are attractive in applica- tions requiring a combination of high strength, low yield-to-ultimate strength ratio and good formability, such as in automotive body structures. Performance under cyclic loading is an important issue for the structural integrity assessment of any complex structure that may be subjected to repeated loads. Cyclic plastic deformation is an interesting consideration for multi-phase steels such as DP, as the accommodations of the plas- tic strain between phases influence the fatigue properties. Usually, engineering structures are designed in such a way that the material only deforms in an elastic manner, however locally plastic defor- mation may occur due to the presence of a stress raiser. The applied cyclic loading on this section of the structure can be either symmetric or asymmetric, and strain or stress controlled. Symmetric strain or stress controlled cycling in the plastic domain is commonly referred to as low-cycle fatigue (LCF), while asym- metric strain-control cyclic plastic loading is termed mean stress relaxation (MSR). ‘‘Ratcheting’’ is a cyclic loading schedule that produces a directional progressive accumulation of plastic strain during asymmetric stress cycling [1]. Ratcheting can thus deterio- rate the performance of components due to the cumulative effect of fatigue damage and permanent ratcheting strain accumulation. The tensile ratcheting strain accumulation can exacerbate fatigue damage by continuous thinning of the components cross- sectional area, and the combined effect can lead to premature failure of the material [2,3]. Recently ratcheting has become an increasingly important research focus due to recognition of its high detrimental effect on fatigue life [4–6]. LCF performances of DP steels are characterized by a number of research groups [7–11], where typical behavior shows strain parti- tioning between the phases, the development of substructure in the ferrite, and initial cyclic hardening followed by subsequent softening. However, the authors have not found extensive experi- mental literature on MSR and ratcheting response for DP steel. Several microstructural investigation on the ratcheting behavior of materials were reported in literatures, including: AISI316L stainless steel [12,13], carbon steel and 316L stainless steel [14,15], Ti–6Al–4V two phase alloy [16], 304LN stainless steel [17,18], recrystallized molybdenum [19] and hot-rolled AZ31B magnesium alloy [20]. Dingreville et al. [21] reported the variation of microscopic ratcheting with various microstructural morphol- ogy in their crystal plasticity investigation. Gaudin and Feaugas http://dx.doi.org/10.1016/j.ijfatigue.2015.06.003 0142-1123/Ó 2015 Elsevier Ltd. All rights reserved. ⇑ Corresponding author. Mobile: +61 431362497. E-mail addresses: [email protected], [email protected] (S.K. Paul), [email protected] (N. Stanford), [email protected]. au (A. Taylor), [email protected] (T. Hilditch). International Journal of Fatigue 80 (2015) 341–348 Contents lists available at ScienceDirect International Journal of Fatigue journal homepage: www.elsevier.com/locate/ijfatigue
Transcript of The effect of low cycle fatigue, ratcheting and mean stress relaxation on stress-strain response and...
International Journal of Fatigue 80 (2015) 341–348
Contents lists available at ScienceDirect
International Journal of Fatigue
journal homepage: www.elsevier .com/locate / i j fa t igue
The effect of low cycle fatigue, ratcheting and mean stress relaxation onstress–strain response and microstructural development in a dual phasesteel
http://dx.doi.org/10.1016/j.ijfatigue.2015.06.0030142-1123/� 2015 Elsevier Ltd. All rights reserved.
⇑ Corresponding author. Mobile: +61 431362497.E-mail addresses: [email protected], [email protected]
(S.K. Paul), [email protected] (N. Stanford), [email protected] (A. Taylor), [email protected] (T. Hilditch).
Surajit Kumar Paul a,⇑, Nicole Stanford b, Adam Taylor b, Timothy Hilditch a
a School of Engineering, Deakin University, Pigdons Rd, Waurn Ponds, VIC 3217, Australiab Institute of Frontier Materials, Deakin University, Pigdons Rd, Waurn Ponds, VIC 3217, Australia
a r t i c l e i n f o a b s t r a c t
Article history:Received 1 May 2015Received in revised form 5 June 2015Accepted 10 June 2015Available online 17 June 2015
Keywords:Low-cycle fatigueRatchetingMean stress relaxationDual phase steelLocal misorientation
This study examines the cyclic plastic deformation behavior and microstructural development of a dualphase steel in both symmetric and asymmetric cycling in strain and stress control modes. The low-cyclefatigue (LCF) and mean stress relaxation (MSR) tests show very similar fatigue lifetimes. However, fatiguelifetimes reduce and prominent accumulation of directional strain was observed in ratcheting. Amicrostructural analysis has revealed that the type of cyclic test carried out has a noticeable impact onthe substructural development, and this has been correlated with differences in accumulated tensilestrain. Electron backscatter diffraction investigation has shown larger in-grain misorientation forratcheting specimen in comparison with LCF and MSR specimens. The orientation of ferrite grains wasfound to have very little effect on their substructural development, and strain localization commonlyoccurred in the ferrite at the ferrite/martensite interface.
� 2015 Elsevier Ltd. All rights reserved.
1. Introduction
Dual phase (DP) steels, with a microstructure comprised of var-ious proportions of ferrite and martensite, are attractive in applica-tions requiring a combination of high strength, lowyield-to-ultimate strength ratio and good formability, such as inautomotive body structures. Performance under cyclic loading isan important issue for the structural integrity assessment of anycomplex structure that may be subjected to repeated loads.Cyclic plastic deformation is an interesting consideration formulti-phase steels such as DP, as the accommodations of the plas-tic strain between phases influence the fatigue properties. Usually,engineering structures are designed in such a way that the materialonly deforms in an elastic manner, however locally plastic defor-mation may occur due to the presence of a stress raiser. Theapplied cyclic loading on this section of the structure can be eithersymmetric or asymmetric, and strain or stress controlled.Symmetric strain or stress controlled cycling in the plastic domainis commonly referred to as low-cycle fatigue (LCF), while asym-metric strain-control cyclic plastic loading is termed mean stress
relaxation (MSR). ‘‘Ratcheting’’ is a cyclic loading schedule thatproduces a directional progressive accumulation of plastic strainduring asymmetric stress cycling [1]. Ratcheting can thus deterio-rate the performance of components due to the cumulative effectof fatigue damage and permanent ratcheting strain accumulation.The tensile ratcheting strain accumulation can exacerbate fatiguedamage by continuous thinning of the components cross-sectional area, and the combined effect can lead to prematurefailure of the material [2,3]. Recently ratcheting has become anincreasingly important research focus due to recognition of its highdetrimental effect on fatigue life [4–6].
LCF performances of DP steels are characterized by a number ofresearch groups [7–11], where typical behavior shows strain parti-tioning between the phases, the development of substructure inthe ferrite, and initial cyclic hardening followed by subsequentsoftening. However, the authors have not found extensive experi-mental literature on MSR and ratcheting response for DP steel.Several microstructural investigation on the ratcheting behaviorof materials were reported in literatures, including: AISI316Lstainless steel [12,13], carbon steel and 316L stainless steel[14,15], Ti–6Al–4V two phase alloy [16], 304LN stainless steel[17,18], recrystallized molybdenum [19] and hot-rolled AZ31Bmagnesium alloy [20]. Dingreville et al. [21] reported the variationof microscopic ratcheting with various microstructural morphol-ogy in their crystal plasticity investigation. Gaudin and Feaugas
342 S.K. Paul et al. / International Journal of Fatigue 80 (2015) 341–348
[12] and Feaugas and Gaudin [13] reported in their quantitativeinvestigation that ratcheting occurred in AISI316L stainless steelif cross slip takes place because of the unrecoverability of slip incyclic loading increased due to the enhanced resistance of disloca-tion movement in cross slip. Considering the importance of cyclicplastic deformation on DP steels, the present investigationexamines the materials cyclic plastic deformation response andmicrostructural development during LCF, MSR and ratcheting.
2. Experimental method
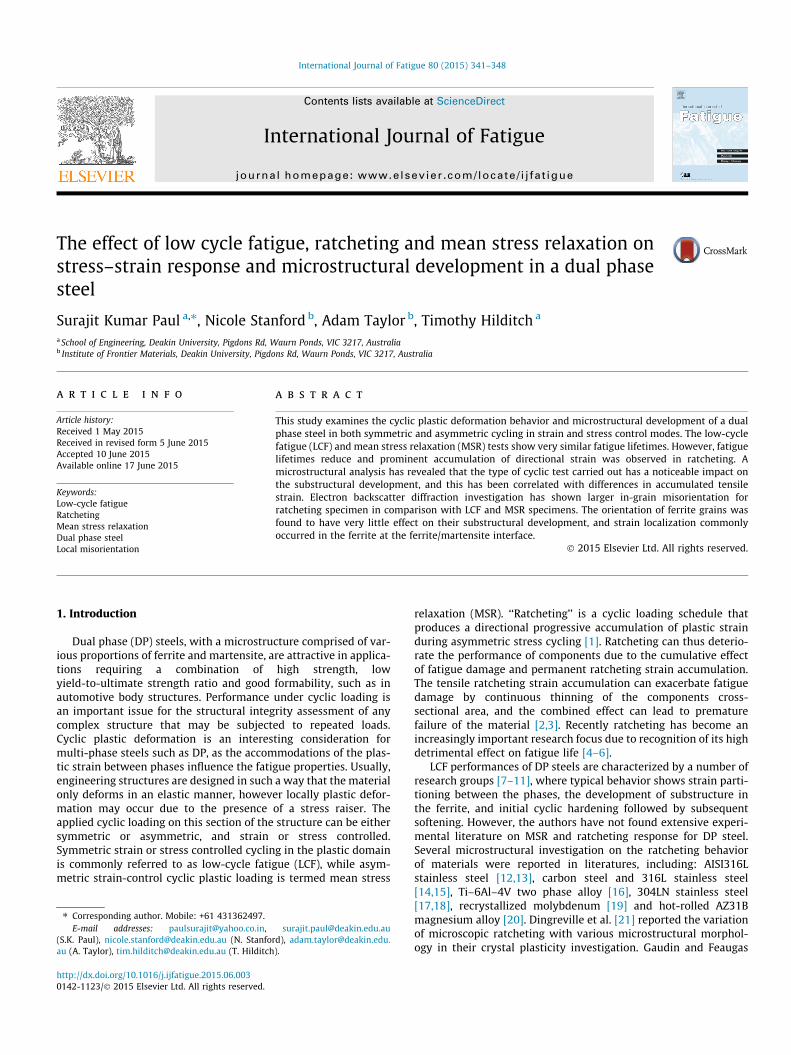
The material used in the present investigation was DP780 steelsheet with 2 mm thickness and a nominal chemical composition(in wt.%) of: C 0.093, Mn 1.93, Si 0.88, P 0.014, Cr 0.022, Al 0.034and balance Fe. The tensile properties of the steel are: Yield stress(YS) 520 MPa, ultimate tensile strength (UTS) 870 MPa and uni-form elongation (UEL) 9.6%. The micrograph for as received condi-tion is shown in Fig. 1. The grain size of this material is 9.7 lm.Cyclic test specimens were prepared from DP780 steel sheet sothat the specimen length was in the rolling direction. Identicalspecimen geometry was adopted in the present work as used byHilditch et al. [22], with parallel length 7.9 mm and gage sectionwidth 2.0 mm. Ratcheting tests were performed in engineeringstress control mode while LCF and mean stress relaxation testswere conducted in total strain control mode on a 25 kNservo-hydraulic load frame. The strain was measured by a 5 mmgauge length clip-on extensometer. The strain control experiments(LCF and MSR) were conducted at a constant strain rate of 0.02 s�1,while stress control experiments (ratcheting) were conducted at aconstant stress rate of 1500 MPa/s. The stress and strain rates werechosen to minimize the strain rate effect in the different modes ofcyclic plastic deformation experiments. To prevent slippage orcrack initiation at the touching points of extensometer edges andsample, epoxy is placed under the extensometer edges.
SEM with backscattered electron (BSE) mode was used to exam-ine the microstructural evolution during cyclic plastic deformationtests. The samples for BSE imaging were prepared by mounting andpolishing using standard metallographic techniques, followed by�10 min polishing with OPS. Selected specimens were examinedfurther on a JEOL 7900F SEM using both electron backscattereddiffraction (EBSD) and standard backscattered imaging. Forbackscattered imaging, the ‘‘gentle beam’’ mode was used toimprove resolution by applying a positive bias to the specimenstage. EBSD and imaging were conducted at 20 kV. The EBSDsystem used was an Oxford Instruments HKL system.
Fig. 1. As received microstructure (backscattered imaging) of DP 780 steel.
3. Results
3.1. Low-cycle fatigue (LCF)
The cyclic stress response (stress amplitude versus number ofcycles plot) is illustrated in Fig. 2. The material shows cyclic soften-ing at all strain amplitudes, however the amount of cyclic softeningincreases with increasing strain amplitude. The saturated state ofhardening is not exhibited by this material in any investigatedstrain amplitudes. Half of fatigue life cycle was considered assaturated cycle for generating cyclic stress–strain curve.
The cyclic stress–strain curve can be determined from set ofstress amplitude versus total strain amplitude, and can berepresented by:
ea ¼rsat
a
Eþ rsat
a
K
� �1=n0
ð1Þ
where rsata is the stress amplitude of saturated cycle, ea is the total
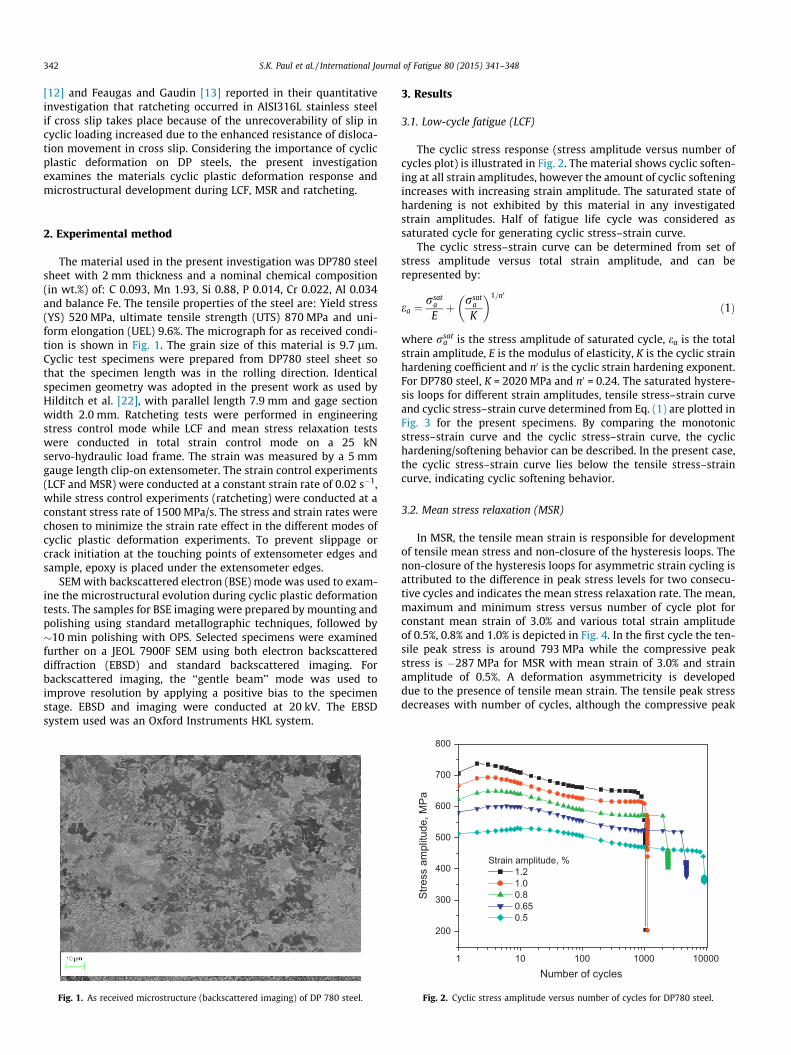
strain amplitude, E is the modulus of elasticity, K is the cyclic strainhardening coefficient and n0 is the cyclic strain hardening exponent.For DP780 steel, K = 2020 MPa and n0 = 0.24. The saturated hystere-sis loops for different strain amplitudes, tensile stress–strain curveand cyclic stress–strain curve determined from Eq. (1) are plotted inFig. 3 for the present specimens. By comparing the monotonicstress–strain curve and the cyclic stress–strain curve, the cyclichardening/softening behavior can be described. In the present case,the cyclic stress–strain curve lies below the tensile stress–straincurve, indicating cyclic softening behavior.
3.2. Mean stress relaxation (MSR)
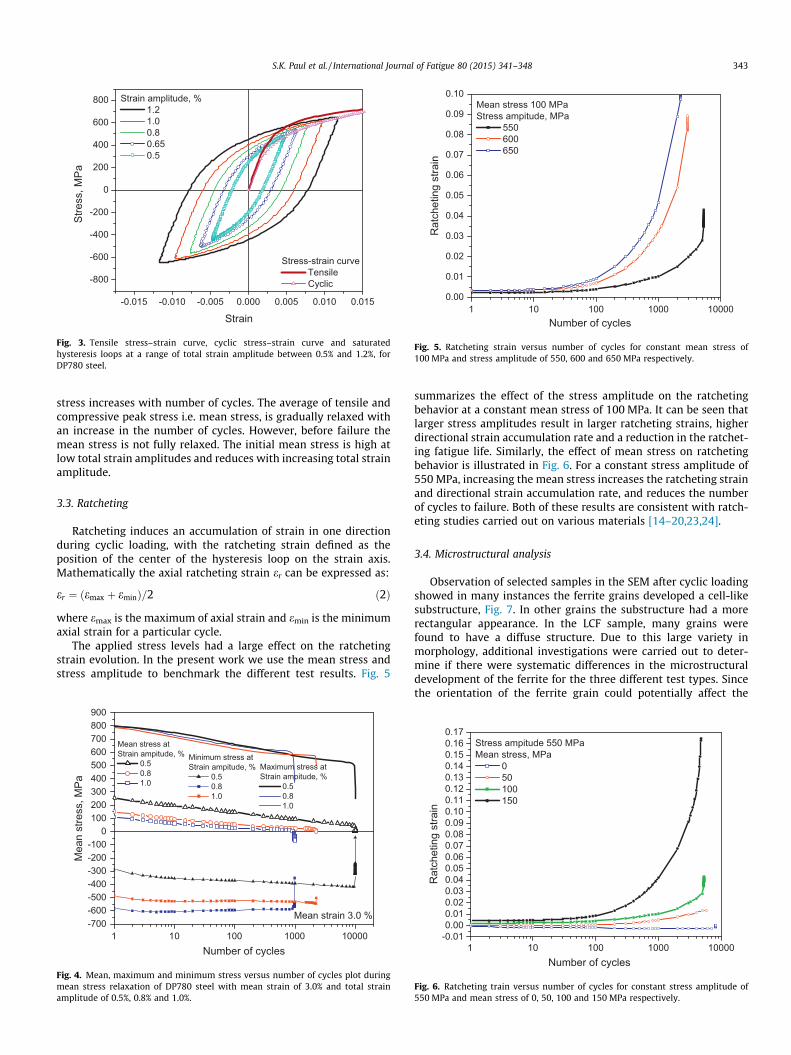
In MSR, the tensile mean strain is responsible for developmentof tensile mean stress and non-closure of the hysteresis loops. Thenon-closure of the hysteresis loops for asymmetric strain cycling isattributed to the difference in peak stress levels for two consecu-tive cycles and indicates the mean stress relaxation rate. The mean,maximum and minimum stress versus number of cycle plot forconstant mean strain of 3.0% and various total strain amplitudeof 0.5%, 0.8% and 1.0% is depicted in Fig. 4. In the first cycle the ten-sile peak stress is around 793 MPa while the compressive peakstress is �287 MPa for MSR with mean strain of 3.0% and strainamplitude of 0.5%. A deformation asymmetricity is developeddue to the presence of tensile mean strain. The tensile peak stressdecreases with number of cycles, although the compressive peak
1 10 100 1000 10000
200
300
400
500
600
700
800
Stre
ss a
mpl
itude
, MP
a
Number of cycles
Strain amplitude, % 1.2 1.0 0.8 0.65 0.5
Fig. 2. Cyclic stress amplitude versus number of cycles for DP780 steel.
-0.015 -0.010 -0.005 0.000 0.005 0.010 0.015
-800
-600
-400
-200
0
200
400
600
800
Stress-strain curve Tensile Cyclic
Strain amplitude, % 1.2 1.0 0.8 0.65 0.5
Stre
ss, M
Pa
Strain
Fig. 3. Tensile stress–strain curve, cyclic stress–strain curve and saturatedhysteresis loops at a range of total strain amplitude between 0.5% and 1.2%, forDP780 steel.
1 10 100 1000 100000.00
0.01
0.02
0.03
0.04
0.05
0.06
0.07
0.08
0.09
0.10Mean stress 100 MPaStress ampitude, MPa
550 600 650
Rat
chet
ing
stra
in
Number of cycles
Fig. 5. Ratcheting strain versus number of cycles for constant mean stress of100 MPa and stress amplitude of 550, 600 and 650 MPa respectively.
S.K. Paul et al. / International Journal of Fatigue 80 (2015) 341–348 343
stress increases with number of cycles. The average of tensile andcompressive peak stress i.e. mean stress, is gradually relaxed withan increase in the number of cycles. However, before failure themean stress is not fully relaxed. The initial mean stress is high atlow total strain amplitudes and reduces with increasing total strainamplitude.
3.3. Ratcheting
Ratcheting induces an accumulation of strain in one directionduring cyclic loading, with the ratcheting strain defined as theposition of the center of the hysteresis loop on the strain axis.Mathematically the axial ratcheting strain er can be expressed as:
er ¼ ðemax þ eminÞ=2 ð2Þ
where emax is the maximum of axial strain and emin is the minimumaxial strain for a particular cycle.
The applied stress levels had a large effect on the ratchetingstrain evolution. In the present work we use the mean stress andstress amplitude to benchmark the different test results. Fig. 5
1 10 100 1000 10000-700-600-500-400-300-200-100
0100200300400500600700800900
Minimum stress atStrain ampitude, %
0.5 0.8 1.0
Mean strain 3.0 %
Maximum stress atStrain ampitude, %
0.5 0.8 1.0
Mean stress atStrain ampitude, %
0.5 0.8 1.0
Mea
n st
ress
, MP
a
Number of cycles
Fig. 4. Mean, maximum and minimum stress versus number of cycles plot duringmean stress relaxation of DP780 steel with mean strain of 3.0% and total strainamplitude of 0.5%, 0.8% and 1.0%.
summarizes the effect of the stress amplitude on the ratchetingbehavior at a constant mean stress of 100 MPa. It can be seen thatlarger stress amplitudes result in larger ratcheting strains, higherdirectional strain accumulation rate and a reduction in the ratchet-ing fatigue life. Similarly, the effect of mean stress on ratchetingbehavior is illustrated in Fig. 6. For a constant stress amplitude of550 MPa, increasing the mean stress increases the ratcheting strainand directional strain accumulation rate, and reduces the numberof cycles to failure. Both of these results are consistent with ratch-eting studies carried out on various materials [14–20,23,24].
3.4. Microstructural analysis
Observation of selected samples in the SEM after cyclic loadingshowed in many instances the ferrite grains developed a cell-likesubstructure, Fig. 7. In other grains the substructure had a morerectangular appearance. In the LCF sample, many grains werefound to have a diffuse structure. Due to this large variety inmorphology, additional investigations were carried out to deter-mine if there were systematic differences in the microstructuraldevelopment of the ferrite for the three different test types. Sincethe orientation of the ferrite grain could potentially affect the
1 10 100 1000 10000-0.010.000.010.020.030.040.050.060.070.080.090.100.110.120.130.140.150.160.17
Stress ampitude 550 MPaMean stress, MPa
0 50 100 150
Rat
chet
ing
stra
in
Number of cycles
Fig. 6. Ratcheting train versus number of cycles for constant stress amplitude of550 MPa and mean stress of 0, 50, 100 and 150 MPa respectively.
LC
F
Rat
chet
ing
MSR
Loading axis
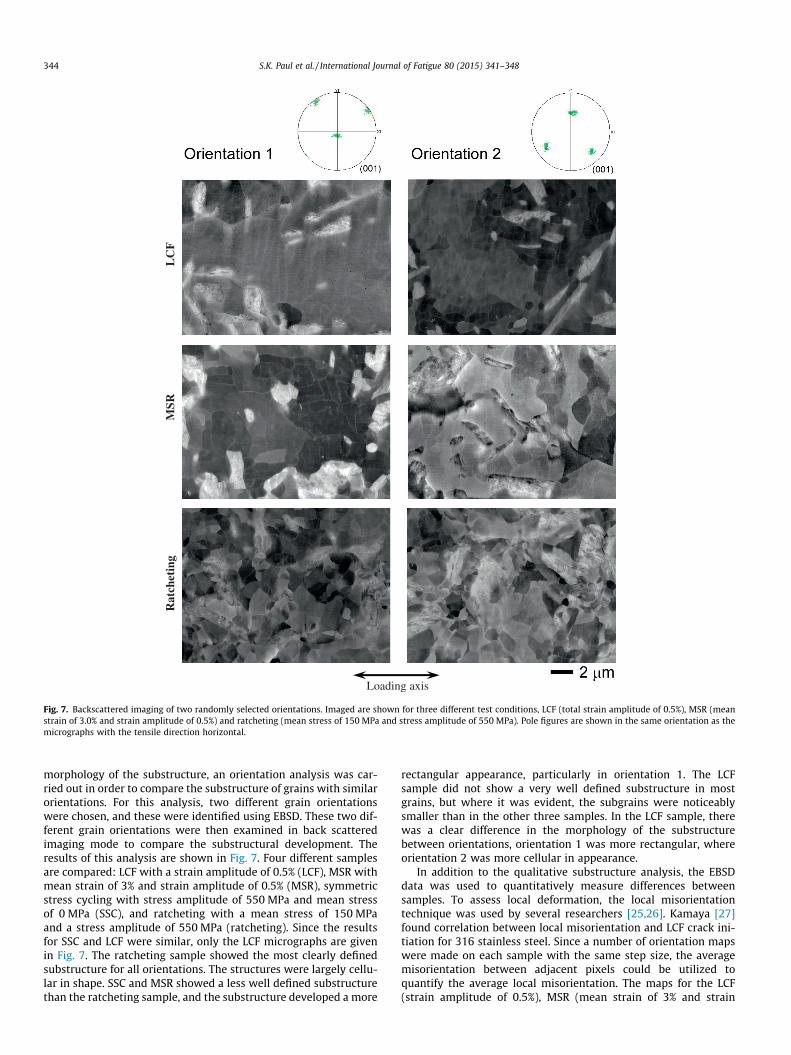
Fig. 7. Backscattered imaging of two randomly selected orientations. Imaged are shown for three different test conditions, LCF (total strain amplitude of 0.5%), MSR (meanstrain of 3.0% and strain amplitude of 0.5%) and ratcheting (mean stress of 150 MPa and stress amplitude of 550 MPa). Pole figures are shown in the same orientation as themicrographs with the tensile direction horizontal.
344 S.K. Paul et al. / International Journal of Fatigue 80 (2015) 341–348
morphology of the substructure, an orientation analysis was car-ried out in order to compare the substructure of grains with similarorientations. For this analysis, two different grain orientationswere chosen, and these were identified using EBSD. These two dif-ferent grain orientations were then examined in back scatteredimaging mode to compare the substructural development. Theresults of this analysis are shown in Fig. 7. Four different samplesare compared: LCF with a strain amplitude of 0.5% (LCF), MSR withmean strain of 3% and strain amplitude of 0.5% (MSR), symmetricstress cycling with stress amplitude of 550 MPa and mean stressof 0 MPa (SSC), and ratcheting with a mean stress of 150 MPaand a stress amplitude of 550 MPa (ratcheting). Since the resultsfor SSC and LCF were similar, only the LCF micrographs are givenin Fig. 7. The ratcheting sample showed the most clearly definedsubstructure for all orientations. The structures were largely cellu-lar in shape. SSC and MSR showed a less well defined substructurethan the ratcheting sample, and the substructure developed a more
rectangular appearance, particularly in orientation 1. The LCFsample did not show a very well defined substructure in mostgrains, but where it was evident, the subgrains were noticeablysmaller than in the other three samples. In the LCF sample, therewas a clear difference in the morphology of the substructurebetween orientations, orientation 1 was more rectangular, whereorientation 2 was more cellular in appearance.
In addition to the qualitative substructure analysis, the EBSDdata was used to quantitatively measure differences betweensamples. To assess local deformation, the local misorientationtechnique was used by several researchers [25,26]. Kamaya [27]found correlation between local misorientation and LCF crack ini-tiation for 316 stainless steel. Since a number of orientation mapswere made on each sample with the same step size, the averagemisorientation between adjacent pixels could be utilized toquantify the average local misorientation. The maps for the LCF(strain amplitude of 0.5%), MSR (mean strain of 3% and strain
0.0 0.5 1.0 1.5 2.0 2.5 3.0 3.5 4.0 4.5 5.00.0
0.5
1.0
1.5
2.0Test type
LCF SSC MSR Ratcheting
Freq
uenc
y (a
.u.)
Local misorientation (degrees)
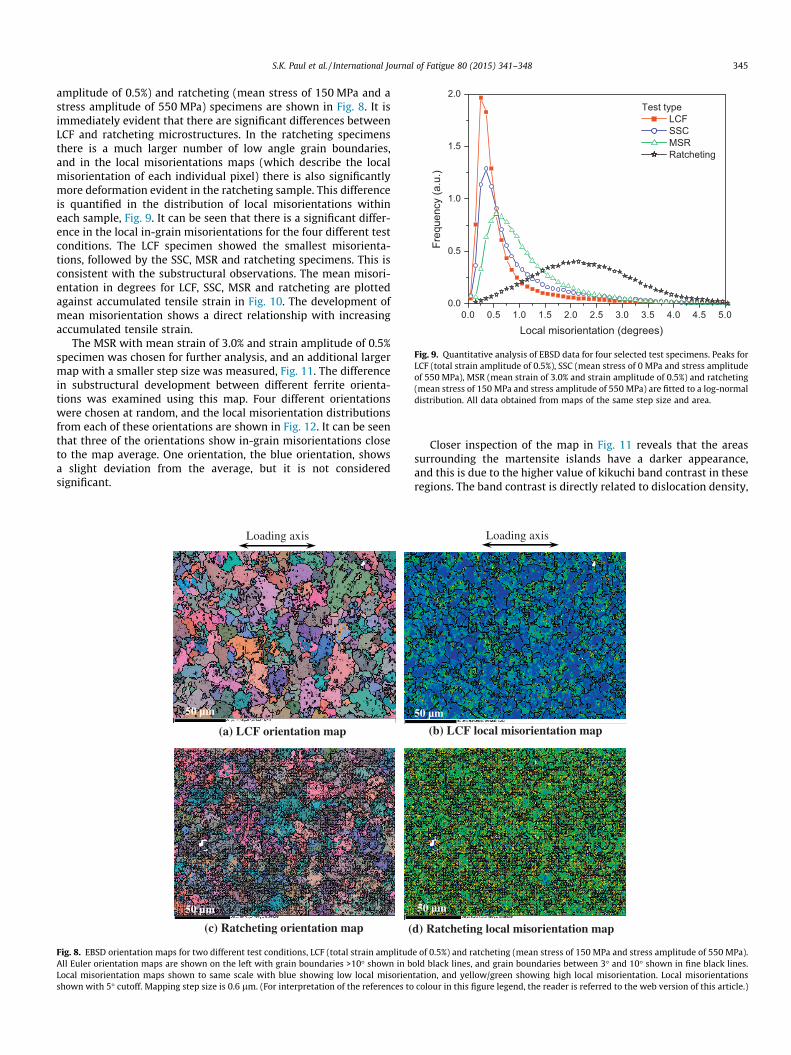
Fig. 9. Quantitative analysis of EBSD data for four selected test specimens. Peaks forLCF (total strain amplitude of 0.5%), SSC (mean stress of 0 MPa and stress amplitudeof 550 MPa), MSR (mean strain of 3.0% and strain amplitude of 0.5%) and ratcheting(mean stress of 150 MPa and stress amplitude of 550 MPa) are fitted to a log-normaldistribution. All data obtained from maps of the same step size and area.
S.K. Paul et al. / International Journal of Fatigue 80 (2015) 341–348 345
amplitude of 0.5%) and ratcheting (mean stress of 150 MPa and astress amplitude of 550 MPa) specimens are shown in Fig. 8. It isimmediately evident that there are significant differences betweenLCF and ratcheting microstructures. In the ratcheting specimensthere is a much larger number of low angle grain boundaries,and in the local misorientations maps (which describe the localmisorientation of each individual pixel) there is also significantlymore deformation evident in the ratcheting sample. This differenceis quantified in the distribution of local misorientations withineach sample, Fig. 9. It can be seen that there is a significant differ-ence in the local in-grain misorientations for the four different testconditions. The LCF specimen showed the smallest misorienta-tions, followed by the SSC, MSR and ratcheting specimens. This isconsistent with the substructural observations. The mean misori-entation in degrees for LCF, SSC, MSR and ratcheting are plottedagainst accumulated tensile strain in Fig. 10. The development ofmean misorientation shows a direct relationship with increasingaccumulated tensile strain.
The MSR with mean strain of 3.0% and strain amplitude of 0.5%specimen was chosen for further analysis, and an additional largermap with a smaller step size was measured, Fig. 11. The differencein substructural development between different ferrite orienta-tions was examined using this map. Four different orientationswere chosen at random, and the local misorientation distributionsfrom each of these orientations are shown in Fig. 12. It can be seenthat three of the orientations show in-grain misorientations closeto the map average. One orientation, the blue orientation, showsa slight deviation from the average, but it is not consideredsignificant.
(a) LCF orientation map
(c) Ratcheting orientation map (
50 µm
50 µm
Loading axis
Fig. 8. EBSD orientation maps for two different test conditions, LCF (total strain amplitudAll Euler orientation maps are shown on the left with grain boundaries >10� shown in bLocal misorientation maps shown to same scale with blue showing low local misorienshown with 5� cutoff. Mapping step size is 0.6 lm. (For interpretation of the references to
Closer inspection of the map in Fig. 11 reveals that the areassurrounding the martensite islands have a darker appearance,and this is due to the higher value of kikuchi band contrast in theseregions. The band contrast is directly related to dislocation density,
(b) LCF local misorientation map
d) Ratcheting local misorientation map
50 µm
50 µm
Loading axis
e of 0.5%) and ratcheting (mean stress of 150 MPa and stress amplitude of 550 MPa).old black lines, and grain boundaries between 3� and 10� shown in fine black lines.tation, and yellow/green showing high local misorientation. Local misorientationscolour in this figure legend, the reader is referred to the web version of this article.)
0.0 0.5 1.0 1.5 2.0 2.5-0.02
0.00
0.02
0.04
0.06
0.08
0.10
0.12
0.14
0.16
0.18
Acc
umul
ated
tens
ile s
train
Local mean misorientation (degrees)
Fig. 10. Local mean misorientation in degree for various accumulated tensile strain.
346 S.K. Paul et al. / International Journal of Fatigue 80 (2015) 341–348
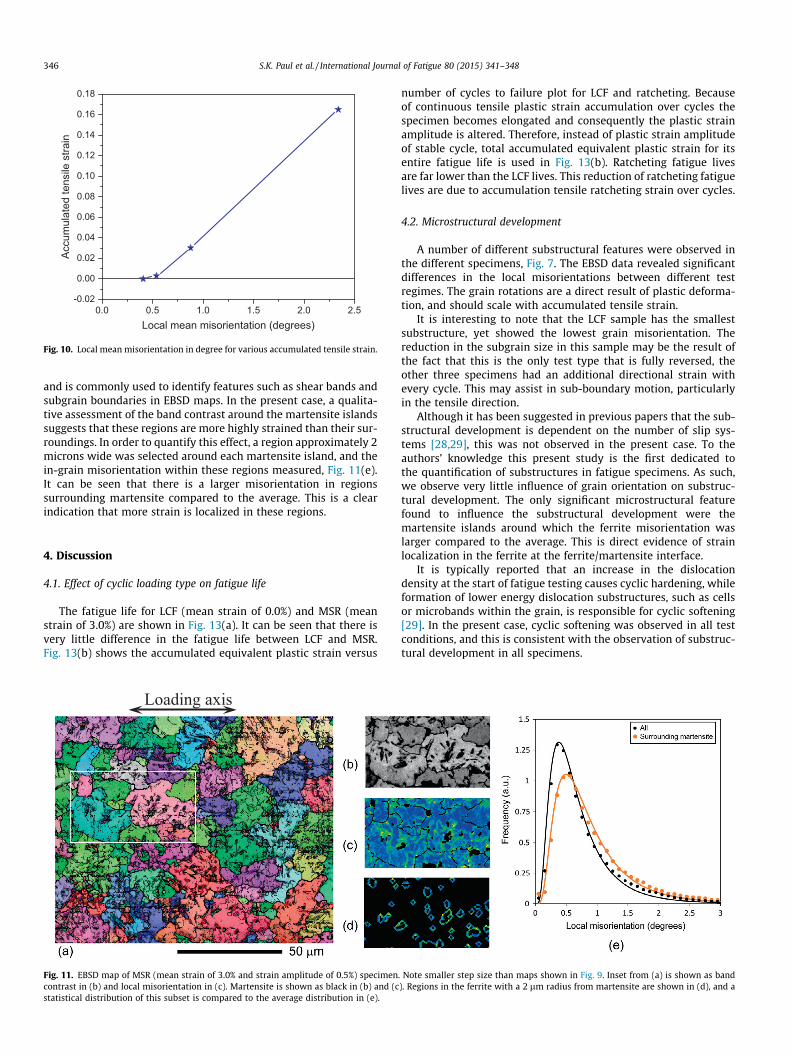
and is commonly used to identify features such as shear bands andsubgrain boundaries in EBSD maps. In the present case, a qualita-tive assessment of the band contrast around the martensite islandssuggests that these regions are more highly strained than their sur-roundings. In order to quantify this effect, a region approximately 2microns wide was selected around each martensite island, and thein-grain misorientation within these regions measured, Fig. 11(e).It can be seen that there is a larger misorientation in regionssurrounding martensite compared to the average. This is a clearindication that more strain is localized in these regions.
4. Discussion
4.1. Effect of cyclic loading type on fatigue life
The fatigue life for LCF (mean strain of 0.0%) and MSR (meanstrain of 3.0%) are shown in Fig. 13(a). It can be seen that there isvery little difference in the fatigue life between LCF and MSR.Fig. 13(b) shows the accumulated equivalent plastic strain versus
Loading axis
Fig. 11. EBSD map of MSR (mean strain of 3.0% and strain amplitude of 0.5%) specimencontrast in (b) and local misorientation in (c). Martensite is shown as black in (b) and (cstatistical distribution of this subset is compared to the average distribution in (e).
number of cycles to failure plot for LCF and ratcheting. Becauseof continuous tensile plastic strain accumulation over cycles thespecimen becomes elongated and consequently the plastic strainamplitude is altered. Therefore, instead of plastic strain amplitudeof stable cycle, total accumulated equivalent plastic strain for itsentire fatigue life is used in Fig. 13(b). Ratcheting fatigue livesare far lower than the LCF lives. This reduction of ratcheting fatiguelives are due to accumulation tensile ratcheting strain over cycles.
4.2. Microstructural development
A number of different substructural features were observed inthe different specimens, Fig. 7. The EBSD data revealed significantdifferences in the local misorientations between different testregimes. The grain rotations are a direct result of plastic deforma-tion, and should scale with accumulated tensile strain.
It is interesting to note that the LCF sample has the smallestsubstructure, yet showed the lowest grain misorientation. Thereduction in the subgrain size in this sample may be the result ofthe fact that this is the only test type that is fully reversed, theother three specimens had an additional directional strain withevery cycle. This may assist in sub-boundary motion, particularlyin the tensile direction.
Although it has been suggested in previous papers that the sub-structural development is dependent on the number of slip sys-tems [28,29], this was not observed in the present case. To theauthors’ knowledge this present study is the first dedicated tothe quantification of substructures in fatigue specimens. As such,we observe very little influence of grain orientation on substruc-tural development. The only significant microstructural featurefound to influence the substructural development were themartensite islands around which the ferrite misorientation waslarger compared to the average. This is direct evidence of strainlocalization in the ferrite at the ferrite/martensite interface.
It is typically reported that an increase in the dislocationdensity at the start of fatigue testing causes cyclic hardening, whileformation of lower energy dislocation substructures, such as cellsor microbands within the grain, is responsible for cyclic softening[29]. In the present case, cyclic softening was observed in all testconditions, and this is consistent with the observation of substruc-tural development in all specimens.
. Note smaller step size than maps shown in Fig. 9. Inset from (a) is shown as band). Regions in the ferrite with a 2 lm radius from martensite are shown in (d), and a
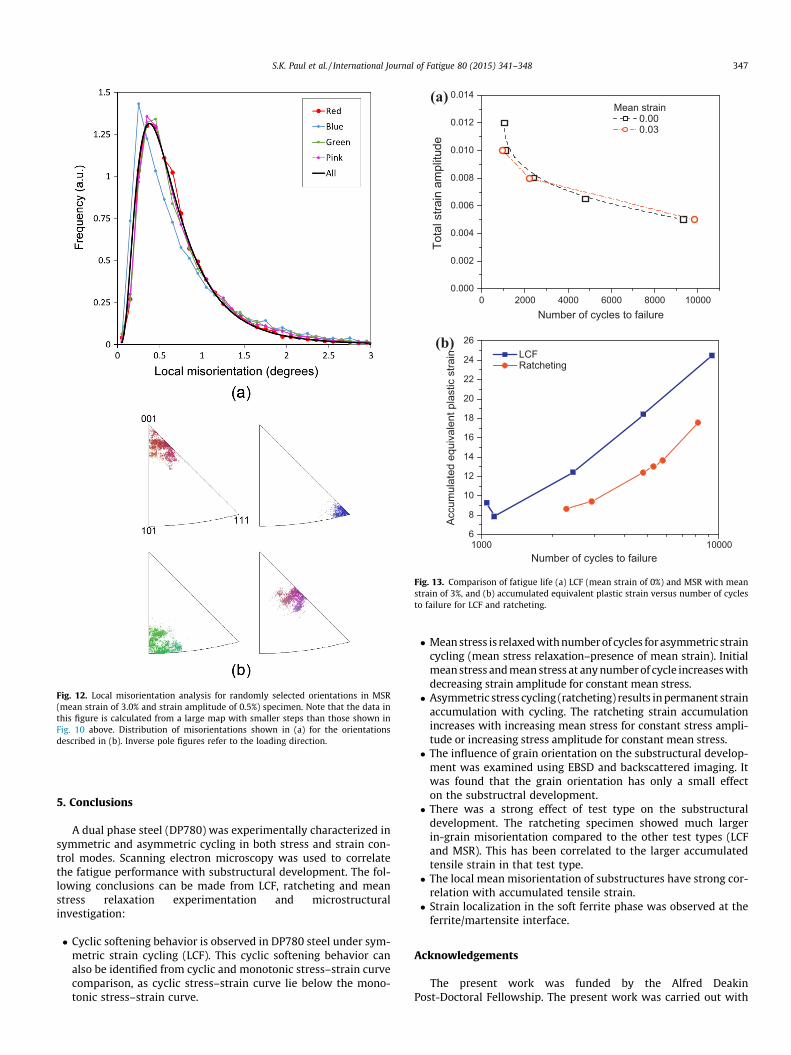
Fig. 12. Local misorientation analysis for randomly selected orientations in MSR(mean strain of 3.0% and strain amplitude of 0.5%) specimen. Note that the data inthis figure is calculated from a large map with smaller steps than those shown inFig. 10 above. Distribution of misorientations shown in (a) for the orientationsdescribed in (b). Inverse pole figures refer to the loading direction.
0 2000 4000 6000 8000 100000.000
0.002
0.004
0.006
0.008
0.010
0.012
0.014Mean strain
0.00 0.03
Tota
l stra
in a
mpl
itude
Number of cycles to failure
(a)
1000 100006
8
10
12
14
16
18
20
22
24
26 LCF Ratcheting
Acc
umul
ated
equ
ival
ent p
last
ic s
train
Number of cycles to failure
(b)
Fig. 13. Comparison of fatigue life (a) LCF (mean strain of 0%) and MSR with meanstrain of 3%, and (b) accumulated equivalent plastic strain versus number of cyclesto failure for LCF and ratcheting.
S.K. Paul et al. / International Journal of Fatigue 80 (2015) 341–348 347
5. Conclusions
A dual phase steel (DP780) was experimentally characterized insymmetric and asymmetric cycling in both stress and strain con-trol modes. Scanning electron microscopy was used to correlatethe fatigue performance with substructural development. The fol-lowing conclusions can be made from LCF, ratcheting and meanstress relaxation experimentation and microstructuralinvestigation:
� Cyclic softening behavior is observed in DP780 steel under sym-metric strain cycling (LCF). This cyclic softening behavior canalso be identified from cyclic and monotonic stress–strain curvecomparison, as cyclic stress–strain curve lie below the mono-tonic stress–strain curve.
� Mean stress is relaxed with number of cycles for asymmetric straincycling (mean stress relaxation–presence of mean strain). Initialmean stress and mean stress at any number of cycle increases withdecreasing strain amplitude for constant mean stress.� Asymmetric stress cycling (ratcheting) results in permanent strain
accumulation with cycling. The ratcheting strain accumulationincreases with increasing mean stress for constant stress ampli-tude or increasing stress amplitude for constant mean stress.� The influence of grain orientation on the substructural develop-
ment was examined using EBSD and backscattered imaging. Itwas found that the grain orientation has only a small effecton the substructral development.� There was a strong effect of test type on the substructural
development. The ratcheting specimen showed much largerin-grain misorientation compared to the other test types (LCFand MSR). This has been correlated to the larger accumulatedtensile strain in that test type.� The local mean misorientation of substructures have strong cor-
relation with accumulated tensile strain.� Strain localization in the soft ferrite phase was observed at the
ferrite/martensite interface.
Acknowledgements
The present work was funded by the Alfred DeakinPost-Doctoral Fellowship. The present work was carried out with

348 S.K. Paul et al. / International Journal of Fatigue 80 (2015) 341–348
the support of the Deakin Advanced Characterisation Facility. Theassistance of Rodney Seiffert with the sample fabrication is grate-fully acknowledged.
References
[1] Paul SK, Sivaprasad S, Dhar S, Tarafder S. Key issues in cyclic plasticdeformation: experimentation. Mech Mater 2011;43:705–20.
[2] Paul SK, Sivaprasad S, Dhar S, Tarafder S. True stress controlled ratchetingbehavior of 304LN stainless steel. J Mater Sci 2012;47:4660–72.
[3] Paul SK, Sivaprasad S, Dhar S, Tarafder S. Cyclic plastic deformation anddamage in 304LN stainless steel. Mater Sci Eng, A 2011;528:4873–82.
[4] Kang G. Ratchetting: recent progresses in phenomenon observation,constitutive modeling and application. Int J Fatigue 2008;30:1448–72.
[5] Jiang Y, Zhang J. Benchmark experiments and characteristic cyclic plasticitydeformation. Int J Plast 2008;24:1481–515.
[6] Chen X, Chen X, Yu D, Gao B. Recent progresses in experimental investigationand finite element analysis of ratcheting in pressurized piping. Int J PressVessels Pip 2013;101:113–42.
[7] Sherman AM, Davies RG. The effect of martensite content on the fatigue of adual-phase steel. Int J Fatigue 1981;3:36–40.
[8] Zhongguang W, Guonan W, Wei K, Haicai H. Influence of the martensitecontent on the fatigue behaviour of a dual-phase steel. Mater Sci Eng1987;91:39–44.
[9] Hadianfard MJ. Low cycle fatigue behavior and failure mechanism of a dual-phase steel. Mater Sci Eng, A 2009;499:493–9.
[10] Paul SK, Stanford N, Hilditch T. Effect of martensite volume fraction on lowcycle fatigue behaviour of dual phase steels: experimental and microstructuralinvestigation. Mater Sci Eng, A 2015;638:296–304.
[11] Paul SK, Stanford N, Hilditch T. Effect of martensite morphology on low cyclefatigue behaviour of dual phase steels: experimental and microstructuralinvestigation. Mater Sci Eng A (Communicated).
[12] Gaudin C, Feaugas X. Cyclic creep process in AISI 316L stainless steel in termsof dislocation patterns and internal stresses. Acta Mater 2004;52:3097–110.
[13] Feaugas X, Gaudin C. Ratchetting process in the stainless steel AISI 316L at300 K: an experimental investigation. Int J Plast 2004;20:643–62.
[14] Kang G, Dong Y, Liu Y, Wang H, Cheng X. Uniaxial ratchetting of 20 carbonsteel: macroscopic and microscopic experimental observations. Mater Sci Eng,A 2011;528:5610–20.
[15] Kang G, Dong Y, Wang H, Liu Y, Cheng X. Dislocation evolution in 316Lstainless steel subjected to uniaxial ratchetting deformation. Mater Sci Eng, A2010;527:5952–61.
[16] Kang G, Dong Y, Liu Y, Jiang H. Macroscopic and microscopic investigations onuniaxial ratchetting of two-phase Ti–6Al–4V alloy. Mater Charact2014;92:26–35.
[17] Dutta K, Sivaprasad S, Tarafder S, Ray KK. Influence of asymmetric cyclicloading on substructure formation and ratcheting fatigue behaviour of AISI304LN stainless steel. Mater Sci Eng, A 2010;527:7571–9.
[18] Sarkar A, Nagesha A, Parameswaran P, Sandhya R, Mathew MD. Influence ofdynamic strain aging on the deformation behavior during ratcheting of a316LN stainless steel. Mater Sci Eng, A 2013;564:359–68.
[19] Yu XJ, Kumar KS. Uniaxial, load-controlled cyclic deformation of recrystallizedmolybdenum sheet. Mater Sci Eng, A 2012;540:187–97.
[20] Lin YC, Liu Z-H, Chen X-M, Chen J. Uniaxial ratcheting and fatigue failurebehaviors of hot-rolled AZ31B magnesium alloy under asymmetrical cyclicstress-controlled loadings. Mater Sci Eng, A 2013;573:234–44.
[21] Dingreville R, Battaile CC, Brewer LN, Holm EA, Boyce BL. The effect ofmicrostructural representation on simulations of microplastic ratcheting. Int JPlast 2010;26:617–33.
[22] Hilditch TB, Timokhina IB, Robertson LT, Pereloma EV, Hodgson PD. Cyclicdeformation of advanced high-strength steels : mechanical behavior andmicrostructural analysis. Metall Mater Trans A 2009;40:342–53.
[23] Paul SK. Effect of anisotropy on ratcheting: an experimental investigation onIFHS steel sheet. Mater Sci Eng, A 2012;538:349–55.
[24] Lin YC, Chen X-M, Chen G. Uniaxial ratcheting and low-cycle fatigue failurebehaviors of AZ91D magnesium alloy under cyclic tension deformation. J AlloyCompd 2011;509:6838–43.
[25] Kamaya M. Assessment of local deformation using EBSD: quantification ofaccuracy of measurement and definition of local gradient. Ultramicroscopy2011;111:1189–99.
[26] Fukuya K, Nishioka H, Fujii K, Miura T, Kitsunai Y. Local strain distribution neargrain boundaries under tensile stresses in highly irradiated SUS316 stainlesssteel. J Nucl Mater 2013;432:67–71.
[27] Kamaya M. Influence of bulk damage on crack initiation in low-cycle fatigue of316 stainless steel. Fatigue Fract Eng Mater Struct 2009;33:94–104.
[28] Petrenec M, Polak J, Obrtlık K, Man J. Dislocation structures in cyclicallystrained X10CrAl24 ferritic steel. Acta Mater 2006;54:3429–43.
[29] Kruml T, Polak J. Fatigue softening of X10CrAl24 ferritic steel. Mater Sci Eng2001;A319–A321:564–8.