The Effect of Family Factors on Intense Alcohol Use among European Adolescents: A Multilevel...
12
Hindawi Publishing Corporation Psychiatry Journal Volume 2013, Article ID 250215, 12 pages http://dx.doi.org/10.1155/2013/250215 Research Article The Effect of Family Factors on Intense Alcohol Use among European Adolescents: A Multilevel Analysis Kristjan Kask, 1 Anna Markina, 1 and Zuzana Podana 2 1 Institute of Public Law, University of Tartu, Kaarli Puiestee 3, 10119 Tallinn, Estonia 2 Department of Sociology, Charles University, Nam. J. Palacha 2, 11638 Prague, Czech Republic Correspondence should be addressed to Kristjan Kask; [email protected] Received 27 October 2012; Accepted 25 January 2013 Academic Editor: J¨ org Richter Copyright © 2013 Kristjan Kask et al. is is an open access article distributed under the Creative Commons Attribution License, which permits unrestricted use, distribution, and reproduction in any medium, provided the original work is properly cited. In Europe use of alcohol by adolescents is a large and increasing problem. e aim of this study is to examine the effects of family factors such as structure, social control, affluence, and negative life events on adolescents’ risky alcohol use. Data on alcohol use and family factors were obtained from the International Self-Report Delinquency Study (ISRD-2). Using multilevel analysis, it was found that overall, complete family and high social control by parents were lowering the intense alcohol use whereas negative life events in the family and high family affluence were increasing youngsters’ intense alcohol use. Differences between regions of Europe were present for all family factors except affluence. Namely, in Northern Europe the impact of family structure and social control on intense alcohol use was stronger than that in other regions (e.g., Western Europe, Mediterranean, and Postsocialist countries). Also, in Northern Europe where the proportion of adolescents who have not experienced negative life events is the highest, the impact of negative life events on intense alcohol use was stronger; that is, negative life events increased the alcohol use. We conclude that family plays a significant role in adolescents’ risky alcohol use. 1. Introduction Alcohol use in adolescence is strongly influenced by social and environmental factors [1]. Several studies have examined which family factors can explain delinquency in adolescents. For example, the factors which increase the risk of ado- lescent delinquency are related to the lack of warmth, low supervision, harsh punishment, conflictual family climate, and problems of parents within the family [2, 3]. e nature of the association between family factors and youth’s intensive alcohol use is complex. Hirschi’s social con- trol theory is one of the most influential theories concerning the role of family [4]. Hirschi noted that young people who have strong bonding with their parents would interiorize the values and norms of their parents which results in behaving in a norm conforming way. According to Luthar et al. family factors can act as protective buffers against the negative effect of a high-risk context (i.e., protective enhancing effect) [5]. Schonberg and Shaw have indicated that family protective factors are influential in high-risk contexts [6]. Parental supervision in their research was found to vary in importance across contextual conditions. Cleveland et al. [7] noted that family protective factors (e.g., attachment, supervision, and discipline) offered less protection for students in high-risk school contexts (see also [8, 9]). In this paper we are interested in which family factors are associated with intense drinking in juveniles in different regions of Europe. us, principles of clustering countries are first introduced followed by closer look to the effects of different family factors on alcohol use among adolescents. 1.1. Clustering Countries. For both practical and theoretical reasons, we sought for an empirical method to cluster the 25 countries involved in the Second International Self Report- Delinquency Study (ISRD-2). In classifying countries we used the idea of different national welfare regimes [10, 11]. eir view is based on the principle that all individuals provide for their needs by producing essentially goods and services in three different ways: (1) they work on the market
Transcript of The Effect of Family Factors on Intense Alcohol Use among European Adolescents: A Multilevel...

Hindawi Publishing CorporationPsychiatry JournalVolume 2013, Article ID 250215, 12 pageshttp://dx.doi.org/10.1155/2013/250215
Research ArticleThe Effect of Family Factors on Intense Alcohol Use amongEuropean Adolescents: A Multilevel Analysis
Kristjan Kask,1 Anna Markina,1 and Zuzana Podana2
1 Institute of Public Law, University of Tartu, Kaarli Puiestee 3, 10119 Tallinn, Estonia2Department of Sociology, Charles University, Nam. J. Palacha 2, 11638 Prague, Czech Republic
Correspondence should be addressed to Kristjan Kask; [email protected]
Received 27 October 2012; Accepted 25 January 2013
Academic Editor: Jorg Richter
Copyright © 2013 Kristjan Kask et al. This is an open access article distributed under the Creative Commons Attribution License,which permits unrestricted use, distribution, and reproduction in any medium, provided the original work is properly cited.
In Europe use of alcohol by adolescents is a large and increasing problem. The aim of this study is to examine the effects of familyfactors such as structure, social control, affluence, and negative life events on adolescents’ risky alcohol use. Data on alcohol useand family factors were obtained from the International Self-Report Delinquency Study (ISRD-2). Using multilevel analysis, it wasfound that overall, complete family and high social control by parents were lowering the intense alcohol use whereas negative lifeevents in the family andhigh family affluencewere increasing youngsters’ intense alcohol use.Differences between regions of Europewere present for all family factors except affluence. Namely, in Northern Europe the impact of family structure and social control onintense alcohol use was stronger than that in other regions (e.g.,Western Europe,Mediterranean, and Postsocialist countries). Also,in Northern Europe where the proportion of adolescents who have not experienced negative life events is the highest, the impactof negative life events on intense alcohol use was stronger; that is, negative life events increased the alcohol use. We conclude thatfamily plays a significant role in adolescents’ risky alcohol use.
1. Introduction
Alcohol use in adolescence is strongly influenced by socialand environmental factors [1]. Several studies have examinedwhich family factors can explain delinquency in adolescents.For example, the factors which increase the risk of ado-lescent delinquency are related to the lack of warmth, lowsupervision, harsh punishment, conflictual family climate,and problems of parents within the family [2, 3].
The nature of the association between family factors andyouth’s intensive alcohol use is complex. Hirschi’s social con-trol theory is one of the most influential theories concerningthe role of family [4]. Hirschi noted that young people whohave strong bonding with their parents would interiorize thevalues and norms of their parents which results in behavingin a norm conforming way. According to Luthar et al. familyfactors can act as protective buffers against the negative effectof a high-risk context (i.e., protective enhancing effect) [5].Schonberg and Shaw have indicated that family protectivefactors are influential in high-risk contexts [6]. Parental
supervision in their researchwas found to vary in importanceacross contextual conditions. Cleveland et al. [7] noted thatfamily protective factors (e.g., attachment, supervision, anddiscipline) offered less protection for students in high-riskschool contexts (see also [8, 9]).
In this paper we are interested in which family factorsare associated with intense drinking in juveniles in differentregions of Europe. Thus, principles of clustering countriesare first introduced followed by closer look to the effects ofdifferent family factors on alcohol use among adolescents.
1.1. Clustering Countries. For both practical and theoreticalreasons, we sought for an empirical method to cluster the 25countries involved in the Second International Self Report-Delinquency Study (ISRD-2). In classifying countries weused the idea of different national welfare regimes [10, 11].Their view is based on the principle that all individualsprovide for their needs by producing essentially goods andservices in three different ways: (1) they work on the market
2 Psychiatry Journal
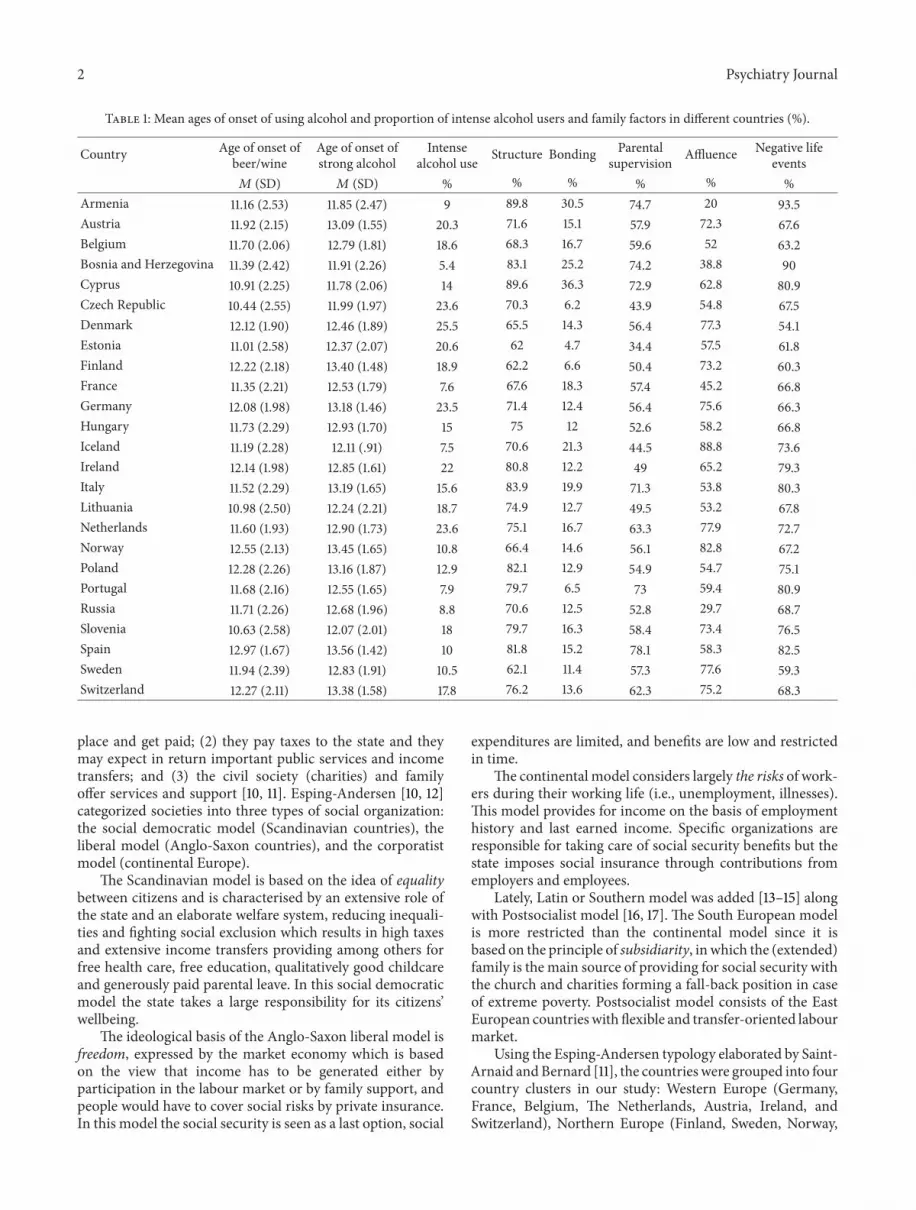
Table 1: Mean ages of onset of using alcohol and proportion of intense alcohol users and family factors in different countries (%).
Country Age of onset ofbeer/wine
Age of onset ofstrong alcohol
Intensealcohol use Structure Bonding Parental
supervision Affluence Negative lifeevents
𝑀 (SD) 𝑀 (SD) % % % % % %Armenia 11.16 (2.53) 11.85 (2.47) 9 89.8 30.5 74.7 20 93.5Austria 11.92 (2.15) 13.09 (1.55) 20.3 71.6 15.1 57.9 72.3 67.6Belgium 11.70 (2.06) 12.79 (1.81) 18.6 68.3 16.7 59.6 52 63.2Bosnia and Herzegovina 11.39 (2.42) 11.91 (2.26) 5.4 83.1 25.2 74.2 38.8 90Cyprus 10.91 (2.25) 11.78 (2.06) 14 89.6 36.3 72.9 62.8 80.9Czech Republic 10.44 (2.55) 11.99 (1.97) 23.6 70.3 6.2 43.9 54.8 67.5Denmark 12.12 (1.90) 12.46 (1.89) 25.5 65.5 14.3 56.4 77.3 54.1Estonia 11.01 (2.58) 12.37 (2.07) 20.6 62 4.7 34.4 57.5 61.8Finland 12.22 (2.18) 13.40 (1.48) 18.9 62.2 6.6 50.4 73.2 60.3France 11.35 (2.21) 12.53 (1.79) 7.6 67.6 18.3 57.4 45.2 66.8Germany 12.08 (1.98) 13.18 (1.46) 23.5 71.4 12.4 56.4 75.6 66.3Hungary 11.73 (2.29) 12.93 (1.70) 15 75 12 52.6 58.2 66.8Iceland 11.19 (2.28) 12.11 (.91) 7.5 70.6 21.3 44.5 88.8 73.6Ireland 12.14 (1.98) 12.85 (1.61) 22 80.8 12.2 49 65.2 79.3Italy 11.52 (2.29) 13.19 (1.65) 15.6 83.9 19.9 71.3 53.8 80.3Lithuania 10.98 (2.50) 12.24 (2.21) 18.7 74.9 12.7 49.5 53.2 67.8Netherlands 11.60 (1.93) 12.90 (1.73) 23.6 75.1 16.7 63.3 77.9 72.7Norway 12.55 (2.13) 13.45 (1.65) 10.8 66.4 14.6 56.1 82.8 67.2Poland 12.28 (2.26) 13.16 (1.87) 12.9 82.1 12.9 54.9 54.7 75.1Portugal 11.68 (2.16) 12.55 (1.65) 7.9 79.7 6.5 73 59.4 80.9Russia 11.71 (2.26) 12.68 (1.96) 8.8 70.6 12.5 52.8 29.7 68.7Slovenia 10.63 (2.58) 12.07 (2.01) 18 79.7 16.3 58.4 73.4 76.5Spain 12.97 (1.67) 13.56 (1.42) 10 81.8 15.2 78.1 58.3 82.5Sweden 11.94 (2.39) 12.83 (1.91) 10.5 62.1 11.4 57.3 77.6 59.3Switzerland 12.27 (2.11) 13.38 (1.58) 17.8 76.2 13.6 62.3 75.2 68.3
place and get paid; (2) they pay taxes to the state and theymay expect in return important public services and incometransfers; and (3) the civil society (charities) and familyoffer services and support [10, 11]. Esping-Andersen [10, 12]categorized societies into three types of social organization:the social democratic model (Scandinavian countries), theliberal model (Anglo-Saxon countries), and the corporatistmodel (continental Europe).
The Scandinavian model is based on the idea of equalitybetween citizens and is characterised by an extensive role ofthe state and an elaborate welfare system, reducing inequali-ties and fighting social exclusion which results in high taxesand extensive income transfers providing among others forfree health care, free education, qualitatively good childcareand generously paid parental leave. In this social democraticmodel the state takes a large responsibility for its citizens’wellbeing.
The ideological basis of the Anglo-Saxon liberal model isfreedom, expressed by the market economy which is basedon the view that income has to be generated either byparticipation in the labour market or by family support, andpeople would have to cover social risks by private insurance.In this model the social security is seen as a last option, social
expenditures are limited, and benefits are low and restrictedin time.
The continental model considers largely the risks of work-ers during their working life (i.e., unemployment, illnesses).This model provides for income on the basis of employmenthistory and last earned income. Specific organizations areresponsible for taking care of social security benefits but thestate imposes social insurance through contributions fromemployers and employees.
Lately, Latin or Southern model was added [13–15] alongwith Postsocialist model [16, 17]. The South European modelis more restricted than the continental model since it isbased on the principle of subsidiarity, in which the (extended)family is the main source of providing for social security withthe church and charities forming a fall-back position in caseof extreme poverty. Postsocialist model consists of the EastEuropean countrieswith flexible and transfer-oriented labourmarket.
Using the Esping-Andersen typology elaborated by Saint-Arnaid andBernard [11], the countries were grouped into fourcountry clusters in our study: Western Europe (Germany,France, Belgium, The Netherlands, Austria, Ireland, andSwitzerland), Northern Europe (Finland, Sweden, Norway,

Psychiatry Journal 3
Table 2: The results of multilevel analysis concerning family structure (𝑛 individuals: 53053; 𝑛 schools: 1344; 𝑛 countries: 25).
Model 0:empty model
Model 1:controlvariables
Model 2:family
structure
Model 3: familystructure
random slope
Model 4:countrycluster
Model 5: familystructure ×
country cluster
Fixed exp(𝐵) (S.E.) exp(𝐵) (S.E.) exp(𝐵) (S.E.) exp(𝐵) (S.E.) exp(𝐵) (S.E.) exp(𝐵) (S.E.)Intercept .16 (.02)∗∗∗ .10 (.01)∗∗∗ .13 (.01)∗∗∗ .13 (.01)∗∗∗ .10 (.02)∗∗∗ .14 (.02)∗∗∗
Grade 8 (ref. grade 7) .91 (.03)∗∗∗ .91 (.03)∗∗∗ .91 (.03)∗∗∗ .91 (.03)∗∗ .91 (.07)∗∗
Grade 9 (ref. grade 7) 1.09 (.04)∗ 1.09 (.04)∗ 1.09 (.04)∗ 1.09 (.04)∗ 1.09 (.03)∗
Male (ref. female) 1.43 (.04)∗∗∗ 1.45 (.04)∗∗∗ 1.45 (.04)∗∗∗ 1.45 (.04)∗∗∗ 1.45 (.03)∗∗∗
Native (ref. migrant) 1.37 (.05)∗∗∗ 1.37 (.05)∗∗∗ 1.37 (.05)∗∗∗ 1.37 (.05)∗∗∗ 1.37 (.03)∗∗∗
Family structure (ref. incompletefamily) .72 (.02)∗∗∗ .73 (.03)∗∗∗ .73 (.03)∗∗∗ .55 (.11)∗∗∗
Western Europe (ref.Northern Europe, NE) 1.68 (.44)∗ 1.34 (.29)
Mediterranean countries (ref. NE) 1.10 (.33) .63 (.36)
Postsocialist countries (ref. NE) 1.36 (.34) .75 (.27)Family structure ×Western Europe (ref. NE) 1.22 (.03)∗
Family structure ×Mediterraneancountries (ref. NE) 1.52 (.01)∗∗∗
Family structure × Postsocialistcountries (ref. NE) 1.56 (.01)∗∗∗
Random
Var. school .273 .254 .253 .254 .254 .255Var. country .246 .240 .234 .293 .273 .205Var. family structure .024 .026 .001
Cor. family structure, intercept −.554 −.645 −1.000
LR test 𝜒2(2) = 1850∗∗∗ 𝜒2(4) = 317∗∗∗ 𝜒2(1) = 136∗∗∗ 𝜒2(2) = 9∗∗ 𝜒2(3)= 4.3 ns 𝜒2(6) = 27.8∗∗∗
∗∗∗
𝑃 < .001; ∗∗𝑃 < .01; ∗𝑃 < .05. Models 4 and 5 are compared to Model 3.
Denmark, and Iceland), Mediterranean countries (Spain,Italy, Portugal, and Cyprus), and finally Postsocialist coun-tries (Czech Republic, Poland, Hungary, Estonia, Lithuania,Slovenia, Bosnia-Herzegovina, Armenia, and Russia).
Apart from extending the classification scheme of Saint-Arnaid and Bernard, we differ from their classification ofcountries in four aspects: Iceland that originally belongsto the cluster of liberal welfare regimes is placed into theNorthern European cluster, Ireland (also liberal welfareregime) is placed into the Western Europe cluster as it is theonly Anglo-Saxon country in our study, Switzerland whichwas not a part of Saint-Arnaid’s and Bernard’s analyses isplaced within the Western European cluster, and Cypruswhich was also lacking in their analyses takes the position ofGreece. Finally, we believe that the country clusters provide auseful organizing framework for analysing a large number ofcountries simultaneously.
1.2. Family Factors. Family structure, that is, whether thechild has both parents present at home or not, has negativeeffects on the social behaviour of children and supervision athomes, and it is a major determinant of delinquency [18, 19].
Single parents have often fewer financial and coping resourcescompared to traditional two-parent families [20–22]. Also,youngsters from single-parent families are more likely tomake decisions without consulting a parent [23].
Those adolescents living in one-parent households aremore likely to be involved in risky use of alcohol [24]. Theyreported that youth living in single-parent households hadhigher rates of drinking alcohol compared to those livingin two-parent households. Bjarnason et al. [25] noted thatadolescents living with both biological parents engaged lessfrequently in heavy alcohol use than those living in any otherarrangements. Oman et al. [26] reported that youth living inone-parent households aremore likely to report using alcoholin the past thirty days. Only a few studies have found that nodifferences in substance use by adolescents in two-parent orsingle-parent families [27] or that single-mother families areno more likely to be at risk for alcohol and other drug abuse[28].
Research demonstrates that supervision and family con-trol are strong predictors of delinquency [29, 30]. Junger-Tas et al. [19] noted that family social control is based ontwo dimensions, indirect and direct control. Indirect control

4 Psychiatry Journal
Table 3: Adjusted odds ratios for five family variables by country (controlled for gender, grade, and migrant status).
Country Family structure Family bonding Parental supervision Affluence Negative life eventsArmenia 1.95 0.90 0.72 1.18 1.08Austria 0.63 0.64 0.68 1.24 1.25Belgium 0.68 0.70 0.65 1.25 1.21Bosnia and Herzegovina 1.51 0.66 0.58 1.19 1.18Cyprus 0.95 0.74 0.52 1.12 1.30Czech Republic 0.88 0.80 0.64 1.12 1.10Denmark 0.54 0.57 0.57 1.17 1.31Estonia 0.85 0.72 0.61 1.11 1.19Finland 0.64 0.54 0.46 1.18 1.37France 0.63 0.68 0.71 1.27 1.26Germany 0.67 0.66 0.66 1.76 1.29Hungary 0.79 0.65 0.59 1.10 1.06Iceland 0.35 0.55 0.47 0.58 1.74Ireland 0.55 0.62 0.52 0.83 1.45Italy 0.76 0.73 0.66 1.18 1.20Lithuania 0.72 0.77 0.61 1.02 1.16Netherlands 0.79 0.68 0.70 1.58 1.31Norway 0.67 0.64 0.61 1.20 1.31Poland 0.71 0.74 0.54 1.10 1.21Portugal 0.92 1.00 0.66 1.17 1.09Russia 0.77 0.59 0.57 1.24 1.17Slovenia 0.72 0.68 0.54 0.91 1.19Spain 0.87 0.79 0.69 1.21 1.26Sweden 0.51 0.65 0.51 1.21 1.42Switzerland 0.75 0.59 0.59 1.27 1.32
is affected by the quality of the relationship of a youngsterwith his parents [3], whereas direct control in the familyis applied by close supervision. For example, White andHalliwell [31] have found that family dinners have a positiveeffect on lowering the likelihood of alcohol use (see also [32]).Parental support has been associated with decreased alcoholconsumption [33].
Another factor connected to youth alcohol consumptionis affluence, that is, whether the adolescent or his/her familyowns certain things (own room, PC, or car). The concept ofaffluence in ISRD-2 is different from socioeconomic status(SES) although there are some connecting links. Studies con-cerning parents’ SES have found that it is positively connectedwith larger alcohol intake [34]. Elgar et al. [35] note thatincome inequality was associated with drinking frequencyamong 11- and 13-year-olds and drunkenness among 11-year-olds.
Some studies have identified a higher risk of excessiveadolescent drinking behaviour among lower SES groups[36–38]; others have found weak effect of SES on adoles-cent alcohol consumption [39, 40]. Two Finnish studiesfound a clear relationship between adolescents’ own financialresources and drunkenness [37, 41]. Negative life events (con-cerning parental conflicts and alcohol abuse) experiencedby adolescents during their lifetime have a large effect ontheir behaviour. For example, Burt et al. [42] indicated thatparental divorce predicts delinquency and other externalizing
behaviours during childhood and adolescence. Otten et al.[43] indicated that alcohol use of the younger children wasaffected by alcohol use of both parents.
Several studies have examined the effects of parents onthe onset and also heavy and problematic drinking of theirchildren. For example, greater alcohol use by parents isassociated with earlier use of alcohol by adolescents [44,45]. Parental problematic alcohol use may disrupt normalsocial processes within the family, leading to increased levelsof family disruption, family and marital conflict, financialstrain, family alcohol and drug use, inadequate parentingpractices, and poorer outcomes for children [46–51]. Seljamoet al. [52] found that fathers’ present heavy drinking andparental early drinking were the best predictors of theirchildren’s problematic alcohol use at the age of 15. In addition,children with a family history of alcoholism demonstratemore escalation of alcohol use [53] and more often developalcohol disorders and dependence [54] than children withouta family history of alcoholic parents.
Thus, in the current paper we hypothesize that affluenceand negative life events are related to more intensive use ofalcohol whereas family structure and social control to lessintense alcohol use among adolescents. Concerning countryclusters it is hypothesized that in regions where the familystructure is more complete and where social control is higher,the adolescents use alcohol less intensively. However, inregions where the affluence is higher and adolescents have
Psychiatry Journal 5
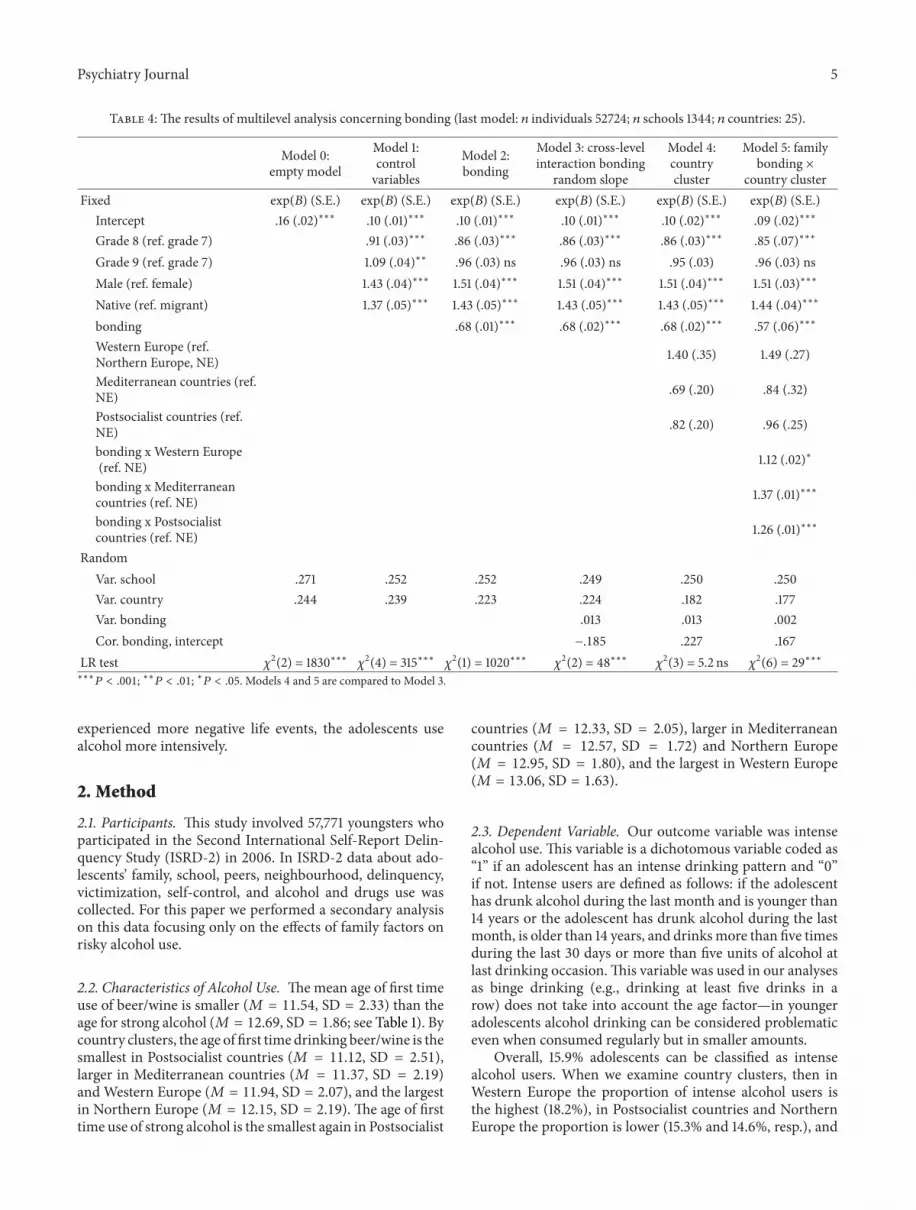
Table 4: The results of multilevel analysis concerning bonding (last model: 𝑛 individuals 52724; 𝑛 schools 1344; 𝑛 countries: 25).
Model 0:empty model
Model 1:controlvariables
Model 2:bonding
Model 3: cross-levelinteraction bonding
random slope
Model 4:countrycluster
Model 5: familybonding ×
country clusterFixed exp(𝐵) (S.E.) exp(𝐵) (S.E.) exp(𝐵) (S.E.) exp(𝐵) (S.E.) exp(𝐵) (S.E.) exp(𝐵) (S.E.)
Intercept .16 (.02)∗∗∗ .10 (.01)∗∗∗ .10 (.01)∗∗∗ .10 (.01)∗∗∗ .10 (.02)∗∗∗ .09 (.02)∗∗∗
Grade 8 (ref. grade 7) .91 (.03)∗∗∗ .86 (.03)∗∗∗ .86 (.03)∗∗∗ .86 (.03)∗∗∗ .85 (.07)∗∗∗
Grade 9 (ref. grade 7) 1.09 (.04)∗∗ .96 (.03) ns .96 (.03) ns .95 (.03) .96 (.03) nsMale (ref. female) 1.43 (.04)∗∗∗ 1.51 (.04)∗∗∗ 1.51 (.04)∗∗∗ 1.51 (.04)∗∗∗ 1.51 (.03)∗∗∗
Native (ref. migrant) 1.37 (.05)∗∗∗ 1.43 (.05)∗∗∗ 1.43 (.05)∗∗∗ 1.43 (.05)∗∗∗ 1.44 (.04)∗∗∗
bonding .68 (.01)∗∗∗ .68 (.02)∗∗∗ .68 (.02)∗∗∗ .57 (.06)∗∗∗
Western Europe (ref.Northern Europe, NE) 1.40 (.35) 1.49 (.27)
Mediterranean countries (ref.NE) .69 (.20) .84 (.32)
Postsocialist countries (ref.NE) .82 (.20) .96 (.25)
bonding x Western Europe(ref. NE) 1.12 (.02)∗
bonding x Mediterraneancountries (ref. NE) 1.37 (.01)∗∗∗
bonding x Postsocialistcountries (ref. NE) 1.26 (.01)∗∗∗
RandomVar. school .271 .252 .252 .249 .250 .250Var. country .244 .239 .223 .224 .182 .177Var. bonding .013 .013 .002Cor. bonding, intercept −.185 .227 .167
LR test 𝜒2(2) = 1830∗∗∗ 𝜒2(4) = 315∗∗∗ 𝜒2(1) = 1020∗∗∗ 𝜒
2(2) = 48∗∗∗ 𝜒2(3) = 5.2 ns 𝜒2(6) = 29∗∗∗
∗∗∗
𝑃 < .001; ∗∗𝑃 < .01; ∗𝑃 < .05. Models 4 and 5 are compared to Model 3.
experienced more negative life events, the adolescents usealcohol more intensively.
2. Method
2.1. Participants. This study involved 57,771 youngsters whoparticipated in the Second International Self-Report Delin-quency Study (ISRD-2) in 2006. In ISRD-2 data about ado-lescents’ family, school, peers, neighbourhood, delinquency,victimization, self-control, and alcohol and drugs use wascollected. For this paper we performed a secondary analysison this data focusing only on the effects of family factors onrisky alcohol use.
2.2. Characteristics of Alcohol Use. Themean age of first timeuse of beer/wine is smaller (𝑀 = 11.54, SD = 2.33) than theage for strong alcohol (𝑀 = 12.69, SD = 1.86; see Table 1). Bycountry clusters, the age of first time drinking beer/wine is thesmallest in Postsocialist countries (𝑀 = 11.12, SD = 2.51),larger in Mediterranean countries (𝑀 = 11.37, SD = 2.19)and Western Europe (𝑀 = 11.94, SD = 2.07), and the largestin Northern Europe (𝑀 = 12.15, SD = 2.19). The age of firsttime use of strong alcohol is the smallest again in Postsocialist
countries (𝑀 = 12.33, SD = 2.05), larger in Mediterraneancountries (𝑀 = 12.57, SD = 1.72) and Northern Europe(𝑀 = 12.95, SD = 1.80), and the largest in Western Europe(𝑀 = 13.06, SD = 1.63).
2.3. Dependent Variable. Our outcome variable was intensealcohol use. This variable is a dichotomous variable coded as“1” if an adolescent has an intense drinking pattern and “0”if not. Intense users are defined as follows: if the adolescenthas drunk alcohol during the last month and is younger than14 years or the adolescent has drunk alcohol during the lastmonth, is older than 14 years, and drinksmore than five timesduring the last 30 days or more than five units of alcohol atlast drinking occasion.This variable was used in our analysesas binge drinking (e.g., drinking at least five drinks in arow) does not take into account the age factor—in youngeradolescents alcohol drinking can be considered problematiceven when consumed regularly but in smaller amounts.
Overall, 15.9% adolescents can be classified as intensealcohol users. When we examine country clusters, then inWestern Europe the proportion of intense alcohol users isthe highest (18.2%), in Postsocialist countries and NorthernEurope the proportion is lower (15.3% and 14.6%, resp.), and

6 Psychiatry Journal
Table 5: The results of multilevel analysis concerning parental supervision (𝑛 individuals: 52564; 𝑛 schools: 1344; 𝑛 countries: 25).
Model 0:empty model
Model 1:controlvariables
Model 2:parental
supervision
Model 3: parentalsupervisionrandom slope
Model 4:countrycluster
Model 5: parentalsupervision ×country cluster
Fixed exp(𝐵) (S.E.) exp(𝐵) (S.E.) exp(𝐵) (S.E.) exp(𝐵) (S.E.) exp(𝐵) (S.E.) exp(𝐵) (S.E.)Intercept .16 (.02)∗∗∗ .10 (.01)∗∗∗ .10 (.01)∗∗∗ .10 (.01)∗∗∗ .09 (.02)∗∗∗ .09 (.02)∗∗∗
Grade 8 (ref. grade 7) .90 (.03)∗∗∗ .85 (.03)∗∗∗ .86 (.03)∗∗∗ .86 (.03)∗∗∗ .86 (.07)∗∗∗
Grade 9 (ref. grade 7) 1.09 (.04)∗∗ 1.02 (.03) ns 1.01 (.03) ns 1.01 (.04) ns 1.01 (.03) nsMale (ref. female) 1.43 (.04)∗∗∗ 1.29 (.03)∗∗∗ 1.29 (.03)∗∗∗ 1.29 (.03)∗∗∗ 1.29 (.03)∗∗∗
Native (ref. migrant) 1.35 (.05)∗∗∗ 1.46 (.05)∗∗∗ 1.46 (.05)∗∗∗ 1.46 (.05)∗∗∗ 1.46 (.04)∗∗∗
Parental supervision .62 (.01)∗∗∗ .61 (.01)∗∗∗ .61 (.01)∗∗∗ .53 (.07)∗∗∗
Western Europe (ref.Northern Europe, NE) 1.52 (.39) 1.59 (.27)
Mediterranean countries (ref.NE) .93 (.27) .97 (.33)
Postsocialist countries (ref. NE) .95 (.23) .99 (.25)Parental supervision ×Western Europe (ref. NE) 1.20 (.02)∗∗
Parental supervision ×Mediterranean countries (ref.NE)
1.17 (.01)∗
Parental supervision ×Postsocialist countries (ref. NE) 1.14 (.01)∗
RandomVar. school .277 .258 .258 .257 .257 .257Var. country .248 .242 .220 .225 .178 .181Var parental supervision .007 .007 .004Cor parental supervision,intercept .204 .019 .083
LR test 𝜒2(2) = 1868∗∗∗ 𝜒2(4) = 313∗∗∗ 𝜒2(1) = 1592∗∗∗ 𝜒2(2) = 20∗∗∗ 𝜒2(3) = 4.6 ns 𝜒
2(6) = 13.5∗∗∗∗
𝑃 < .001; ∗∗𝑃 < .01; ∗𝑃 < .05. Models 4 and 5 are compared to Model 3.
in Mediterranean countries the lowest (12.7%). By countries,in Denmark, The Netherlands, and Czech Republic theproportion of intense alcohol users is the highest whereasin Bosnia-Herzegovina, Iceland, France, and Portugal theproportion is the lowest (see Table 1).
2.4. Independent Variables. For the individual-level analy-sis the variables were family structure, bonding, affluence,parental supervision, and negative life events.
Concerning family structure 25.1% of the sample livedwith single-parent or step-parent households and 74.9% livedwith both parents at home. For the analysis the sample livingwith single-parent or step-parent households was coded as“0” and those living with both parents at home coded as “1.”When we examine differences in country clusters, then inMediterranean countries 84.1% (𝑛 = 7560) of adolescents livein complete family, in Postsocialist countries the proportionis 76.4% (𝑛 = 19848), in Western Europe 73% (𝑛 = 17723),and in Northern Europe 65.4% (𝑛 = 11934). When differentcountries are examined, then in Armenia and Cyprus almost90%of adolescents live with both parents, whereas in Estonia,
Finland, and Sweden the proportion is the smallest (seeTable 1).
Family bonding is a combined variable which consistsof four variables, that is, whether the adolescent gets alongwith father (from 1 “not at all” to 4 “very well”), gets alongwith mother (from 1 “not at all” to 4 “very well”), spendsleisure time together with parents (from 1 “never” to 6 “morethan once a week”), and has dinner with his/her family(from 1 “never” to 8 “daily”). In the analysis family bondingwas standardized. When we observe differences in countryclusters, then in Mediterranean countries 20.3% (𝑛 = 7565)of adolescents reportedmaximum bonding (getting very wellalong with father and mother, spending leisure time togetherwith parents more than once a week, and having daily dinnerwith the family). In other regions this proportion was lower,namely, 14.9% (𝑛 = 19660) in Postsocialist countries, 14.9%(𝑛 = 17674) in Western Europe, and 13.6% (𝑛 = 11906) inNorthern Europe. As per countries, in Cyprus and Armeniabonding is the strongest, whereas in Estonia, Czech Republic,and Finland it is the weakest (see Table 1).
Concerning parental supervision 5.4% of the sampleindicated that they get supervised rarely or never, 35.3%sometimes, and 59.3% always (or they do not go out). In

Psychiatry Journal 7
Table 6: The results of multilevel analysis concerning affluence (𝑛 individuals: 53136; 𝑛 schools: 1344; 𝑛 countries: 25).
Model 0:empty model
Model 1: controlvariables
Model 2:affluence
Model 3: affluencerandom slope
Model 4:country cluster
Model 5: affluence× country cluster
Fixed exp(𝐵) (S.E.) exp(𝐵) (S.E.) exp(𝐵) (S.E.) exp(𝐵) (S.E.) exp(𝐵) (S.E.) exp(𝐵) (S.E.)Intercept .16 (.02)∗∗∗ .10 (.01)∗∗∗ .10 (.01)∗∗∗ .10 (.01)∗∗∗ .10 (.02)∗∗∗ .10 (.02)∗∗∗
Grade 8 (ref. grade 7) .91 (.03)∗∗∗ .90 (.03)∗∗∗ .90 (.03)∗∗∗ .90 (.03)∗∗∗ .90 (.07)∗∗∗
Grade 9 (ref. grade 7) 1.09 (.04)∗∗ 1.07 (.04)∗ 1.07 (.04)∗ 1.06 (.04) 1.06 (.03)Male (ref. female) 1.43 (.04)∗∗∗ 1.42 (.04)∗∗∗ 1.42 (.04)∗∗∗ 1.43 (.04)∗∗∗ 1.43 (.03)∗∗∗
Native (ref. migrant) 1.37 (.05)∗∗∗ 1.32 (.05)∗∗∗ 1.32 (.05)∗∗∗ 1.31 (.05)∗∗∗ 1.30 (.04)∗∗∗
Affluence 1.17 (.02) ∗∗∗ 1.18 (.04) ∗∗∗ 1.18 (.04)∗∗∗ 1.19 (.12)∗
Western Europe (ref.Northern Europe, NE) 1.54 (.38) 1.45 (.26)
Mediterranean countries(ref. NE) .82 (.23) .82 (.32)
Postsocialist countries (ref.NE) 1.02 (.24) 1.07 (.24)
Affluence ×Western Europe(ref. NE) 1.10 (.03)
Affluence ×Mediterraneancountries (ref. NE) .99 (.01)
Affluence × Postsocialistcountries (ref. NE) .92 (.01)
RandomVar. school .274 .256 .251 .245 .246 .245Var. country .246 .240 .216 .208 .172 .171Var. affluence .015 .015 .009Cor. affluence, intercept .025 −.245 −.233
LR test 𝜒2(2) = 1859∗∗∗ 𝜒2(4) = 318 ∗∗∗ 𝜒2(1) = 103∗∗∗ 𝜒2(2) = 26∗∗∗ 𝜒2(3) = 5.4 ns 𝜒
2(6) = 12.8∗∗∗∗
𝑃 < .001; ∗∗𝑃 < .01; ∗𝑃 < .05. Models 4 and 5 are compared to Model 3.
the analysis parental supervision was standardized. Whenwe examine differences in country clusters, then parentalsupervision was most prevalent in Mediterranean countries(73.3%, 𝑛 = 7520), followed by Western Europe (57.7%,𝑛 = 17446), Postsocialist countries (55.2%, 𝑛 = 19773), andNorthern Europe (52.9%, 𝑛 = 11951). Parental supervisionis the strongest in Spain, Armenia, and Bosnia-Herzegovina,whereas in Estonia, Czech Republic, and Iceland it is thelowest (see Table 1).
Family affluence is a combined variable which consistsof four variables; that is, whether the adolescent has his/herown room (yes or no); his/her own PC (yes or no); his/herown mobile phone (yes or no), and if the family has a car(yes or no). In the analysis family affluence was standardized.When we observe differences in country clusters, then theproportion of those adolescents who answered “yes” to allthe questions about owning their own room, PC, and mobilephone and parents owning a car was the highest in NorthernEurope (80%, 𝑛 = 12055), followed by Western Europe(64.4%, 𝑛 = 17761), Mediterranean countries (59%, 𝑛 =7565), and Postsocialist countries (49.9%, 𝑛 = 19892). Whendifferent countries are observed, then the proportion was thehighest in Iceland andNorway and the lowest inArmenia andRussia (see Table 1).
Negative life events concerning family disruption con-sist of three variables, that is, whether the adolescent hasexperienced parents’ use of alcohol and/or drugs, violence ofparents, and parents’ separation or divorce. In the analysisnegative life events were standardized. In Mediterraneancountries the proportion of those adolescents who haveexperienced any of the negative life events was the highest(81.0%, 𝑛 = 7459); in Postsocialist countries and WesternEurope this proportion was lower (74.3%, 𝑛 = 19439and 69.6%, 𝑛 = 17525, resp.); and in Northern Europethis proportion was the lowest (62.9%, 𝑛 = 11949). InDenmark and Sweden the proportion of those who have notexperienced any negative life events was the lowest whereasin Armenia and Bosnia-Herzegovina it was the highest (seeTable 1).
2.5. Statistical Analysis. In this study multilevel logisticregression analysis was used to estimate the effects of familyfactors on juveniles’ intense drinking. The analysis wasconducted in R 2.15.0; the package lme4 was used for doingall the analyses. Laplace approximation was used to estimatethe parameters in the models. The first level of the multilevelanalysis is the individual level of the youngsters concerningintense alcohol use. These youngsters were clustered within

8 Psychiatry Journal
Table 7: The results of multilevel analysis concerning negative life events (𝑛 individuals: 52386; 𝑛 schools: 1344; 𝑛 countries: 25).
Model 0:empty model
Model 1:controlvariables
Model 2:negative life
events
Model 3: negativelife events
random slope
Model 4:countrycluster
Model 5: negativelife events ×
country cluster
Fixed exp(𝐵) (S.E.) exp(𝐵) (S.E.) exp(𝐵) (S.E.) exp(𝐵) (S.E.) exp(𝐵)(S.E.) exp(𝐵) (S.E.)
Intercept .16 (.02)∗∗∗ .10 (.01)∗∗∗ .10 (.01)∗∗∗ .10 (.01)∗∗∗ .11 (.02)∗∗∗ .09 (.02)∗∗∗
Grade 8 (ref. grade 7) .91 (.03)∗∗∗ .90 (.03)∗∗∗ .90 (.03)∗∗∗ .90 (.03)∗∗∗ .90 (.07)∗∗∗
Grade 9 (ref. grade 7) 1.09 (.04)∗∗ 1.07 (.04)∗ 1.07 (.04)∗ 1.07 (.04) 1.07 (.03)
Male (ref. female) 1.42 (.04)∗∗∗ 1.48 (.04)∗∗∗ 1.48 (.04)∗∗∗ 1.48(.04)∗∗∗ 1.48 (.03)∗∗∗
Native (ref. migrant) 1.36 (.05)∗∗∗ 1.38 (.05)∗∗∗ 1.38 (.05)∗∗∗ 1.38(.05)∗∗∗ 1.38 (.04)∗∗∗
Negative life events 1.25 (.02)∗∗∗ 1.25 (.02)∗∗∗ 1.26(.02)∗∗∗ 1.39 (.04)∗∗∗
Western Europe (ref.Northern Europe, NE) 1.33 (.32) 1.55 (.27)
Mediterranean countries (ref. NE) .63 (.18) .89 (.32)Postsocialist countries (ref. NE) .67 (.16) 1.06 (.25)Negative life events ×Western Europe (ref. NE) .93 (.01)∗
Negative life events ×Mediterranean countries (ref. NE) .86 (.01)∗∗∗
Negative life events × Postsocialistcountries (ref. NE) .82 (.01)∗∗∗
RandomVar. school .273 .254 .251 .251 .251 .251Var. country .248 .242 .220 .221 .210 .179Var. negative life events .004 .004 .001Cor. negative life events, intercept .128 −.637 −1.000
LR test 𝜒2(2) = 1833∗∗∗ 𝜒2(4) = 305∗∗∗ 𝜒2(1) = 358∗∗∗ 𝜒
2(2) = 11∗∗ 𝜒2(3) =5.9 ns 𝜒
2(6) = 34.2∗∗∗
∗∗∗
𝑃 < .001; ∗∗𝑃 < .01; ∗𝑃 < .05. Models 4 and 5 are compared to Model 3.
schools (second level). The third level of the analysis is thecountry level. Explanatory variables included social demo-graphic variables (grade, gender, and migrant status) and fivefamily factors (family structure, affluence, bonding, negativelife events, and parental supervision).
The analyses of the effect of family factors on alcoholuse were controlled for gender, grade, and immigrant status.Concerning gender, females were coded as “0” and males as“1.” Regarding immigrant status, the youngsters were dividedinto two groups: natives (coded as “1”) and 1st/2nd generationmigrants (coded as “0”). Finally, grade was entered as twodummy variables in the model (the youngsters in the 7thgrade were used as a reference group which were comparedseparately against the 8th and the 9th graders).
3. Results
3.1. Family Structure. Results for family structure are pre-sented in Table 2. In Model 0 we see that the odds ratio ofbeing an intense alcohol user is .16. In Model 1 we added
the sociodemographic variables (gender, grade, and migrantstatus). The table indicates that boys are more likely toconsume alcohol more intensively than girls (OR = 1.43).Youngsters with a migrant status (first or second generation)were less likely to have consumed alcohol compared to thenatives (OR = 1.37). Finally, adolescents in the 8th grade areless (OR = 0.91) and the 9th grade (OR = 1.09) are morelikely to have been involved in risky drinking than the seventhgrade students. In Model 2 we added family structure to themodel. When adolescents were living with both parents, thenit lowered the likelihood of intense alcohol use (OR = .72)compared to single-parent households. The model includingfamily structure fits better than Model 1 (𝜒2(1) = 136, 𝑃 <.001).
In Model 3 random slope variance on the country levelis estimated for the impact of family structure. This randomslope variance was found to be significant (𝜒2(2) = 9, 𝑃 <.01),meaning that there are differences in the impact of familystructure on intense alcohol use also across countries (seeTable 3). The correlation between the intercepts and slopes

Psychiatry Journal 9
of the countries is negative (−.554), which indicates thatthe higher the intercept, the smaller the impact of familystructure on the intense alcohol use in a country.
In Models 4 and 5 we added country clusters to theanalysis.Model 4 was found to be not significantly better thanModel 3 (𝜒2(3) = 4.3, ns), although there was a differencebetween Northern and Western Europe on intense alcoholuse. Model 5 was found to be significantly better than Model3 (𝜒2(6) = 27.8, 𝑃 < .001) and there were differences presentbetween clusters in the impact of family structure on intensealcohol use. Namely, inNorthern Europe the impact of familystructure on intense alcohol use was strongest (i.e., completefamily much lowers the alcohol use compared to incompletefamily) compared to Western Europe, Mediterranean, andPostsocialist countries (where the effect of complete familyon the alcohol use was the weakest).
3.2. Family Social Control. First the results concerning bond-ing (see Table 4) and then parental supervision (see Table 5)are discussed.Models 0 and 1 are similar to those described indetail in the previous section; therefore for this and followingfactors thesemodels are not overviewed. InModel 2we addedbonding to the model. When the bonding to the parentsis higher it lowers the presence of intense alcohol drinking(OR = .68). The model including bonding fits better thanModel 1 (𝜒2(1) = 1020, 𝑃 < .001).
In Model 3 we examined the interaction effect betweencountry and bonding. There are differences in the impactof bonding across countries (see Table 3). The correlationbetween the intercepts and slopes of the countries is negative(−.185) which indicates that the higher the intercept, thesmaller the impact of bonding on the intense alcohol use in acountry.The model including bonding fits better than Model2 (𝜒2(2) = 48, 𝑃 < .001).
In Models 4 and 5 we added country clusters to theanalysis. Model 4 was found to be not significantly betterthan Model 3 (𝜒2(3) = 5.2, ns). Model 5 was found tobe significantly better than Model 3 (𝜒2(6) = 29.0, 𝑃 <.001) and there were differences present between clusters inthe impact of bonding on intense alcohol use. Namely, inNorthern Europe the impact of bonding on intense alcoholusewas the strongest (i.e., strong bonding lowered the alcoholuse) compared to Western Europe, Postsocialist countries,andMediterranean countries (where the effect of bonding onthe alcohol use was the weakest).
Now the results on parental supervision are examined.In Model 2 we added parental supervision to the modelwhich lowered the likelihood of intense alcohol use (OR =0.62). The model including parental supervision fits betterthan Model 1 (𝜒2(1) = 1592, 𝑃 < .001). In Model 3 weexamined the interaction effect between country and parentalsupervision. There was significant association present whichindicates that there are differences in the impact of supervi-sion across countries (see Table 3). The correlation betweenthe intercepts and slopes of the countries is positive (.204),which indicates that the higher the intercept, the higher theimpact of supervision in a country. The model includingsupervision fits better than model 2 (𝜒2(2) = 20, 𝑃 < .001).
In Models 4 and 5 we added country clusters to theanalysis. Model 4 was found to be not significantly betterthan Model 3 (𝜒2(3) = 4.6, ns). Model 5 was found to besignificantly better than Model 3 (𝜒2(6) = 13.5, 𝑃 < .05) andthere were differences present between clusters in the impactof parental supervision on intense alcohol use. Namely, inNorthern Europe the impact of parental supervision onintense alcohol use was the strongest (i.e., strong parentalsupervision lowered the alcohol use) compared to Postsocial-ist and Mediterranean countries andWestern Europe (wherethe effect of parental supervision on the alcohol use was theweakest).
3.3. Affluence. Next, family affluence is examined (seeTable 6). In Model 2 we added affluence to the model whichincreased the odds of intense alcohol use by 17% (OR = 1.17).It means that those adolescents who are more affluent inour terms have significantly higher odds of intense drinking.The model fits better than Model 1 (𝜒2(1) = 103, 𝑃 <.001). In Model 3 we examined the interaction effect betweencountry and affluence. There are differences in the impactof affluence across countries (see Table 3). The correlationbetween the intercepts and slopes of the countries is slightlypositive (.025), which indicates that the higher the intercept,the higher the impact of affluence on a country. The modelfits better than Model 2 (𝜒2(2) = 26, 𝑃 < .001).
In Models 4 and 5 we added country clusters to theanalysis. Model 4 was found to be not significantly betterthan Model 3 (𝜒2(3) = 5.4, ns). Model 5 was found to besignificantly better than Model 3 (𝜒2(6) = 12.8, 𝑃 < .05);however, there were also no differences between clusters inthe impact of affluence on intense alcohol use.
3.4. Negative Life Events. Finally, negative life events arestudied (see Table 7). InModel 2 we added negative life eventsto themodel.The increase in negative life events increased theodds of intense alcohol use by 25% (OR= 1.25).Themodel fitsbetter than Model 1 (𝜒2(1) = 358, 𝑃 < .001). In Model 3 weexamine the interaction effect between country and negativelife events. It was again confirmed that there are differencesin the impact of negative life events across countries (seeTable 3). The correlation between the intercepts and slopesof the countries is positive (.128). The model fits better thanModel 2 (𝜒2(2) = 2, 𝑃 < .01).
In Models 4 and 5 we added country clusters to theanalysis. Model 4 was found to be not significantly betterthan Model 3 (𝜒2(3) = 5.9, ns). Model 5 was found to besignificantly better than Model 3 (𝜒2(6) = 34.2, 𝑃 < .001),and there were differences present between clusters in theimpact of negative life events on intense alcohol use. Namely,in Northern Europe the impact of negative life events onintense alcohol use was the strongest (i.e., negative life eventsincreased the alcohol use) compared to Western Europe,Mediterranean, and Postsocialist countries (where the effectof negative life events on the alcohol use was the weakest).

10 Psychiatry Journal
4. Discussion
In this chapter we examined the intense alcohol use ofyoungsters from 25 European countries and to what extentthe intense alcohol use was associated with different familyfactors, that is, structure, bonding, supervision, affluence, andnegative life events, and also the differences between countryclusterswere observed.The analysiswas controlled for similarbackground information, that is, gender, grade, and migrantstatus.
Concerning family structure our hypotheses were con-firmed. The adolescents who came from two-parent house-holds were less likely intense alcohol users than those fromsingle-parent households which confirms some previousfindings [24, 26, 35]. Multilevel analysis demonstrated thatthere were differences between countries and also betweencountry clusters. Namely, in Northern Europe the impactof family structure on intense alcohol use was strongerthan in other regions (Western Europe, Mediterranean, andPostsocialist countries). Thus, on one hand, in NorthernEurope the proportion of adolescents who live with bothparents was the smallest, yet the effect of living with bothparents on intense alcohol usewas the strongest. Interestingly,in Mediterranean and Postsocialist countries the impact offamily structure on intense alcohol use was similar; however,in Mediterranean countries the proportion of both parentsliving with the adolescents is higher.
Regarding social control, the adolescents in families withstronger bonding and parental supervision were less involvedwith intense alcohol use which supports previous research[31–33]. The differences in intensive alcohol use emergedbetween countries and also between country clusters. InNorthern Europe the impact of bonding and parental super-vision on intense alcohol use was the strongest comparedto other regions (i.e., strong bonding and parental controllowered the intense alcohol use). Interestingly, strong bond-ing was most prevalent inMediterranean countries; however,the impact of bonding on intense alcohol use was there theweakest (similar results but in a lesser extent emerged forparental supervision). One possible reason for this findingcould be that in Mediterranean countries the proportion ofintense alcohol users is the lowest compared to other regions.
Although the scale of affluence has been used alreadyin international research [55], the analysis of ISRD-2 dataquestions the value of this scale as a measure of affluence.Marshall and Enzmann have proposed that in affluent soci-eties the scale measures the propensity to consume instead[56]. As this scale was the best available indicator for SES,it was included into analysis; however, the results shall beinterpreted with care. Affluence was found to be related tointense alcohol use; that is, when adolescents were frommore affluent family, then it increased the intense alcoholuse which confirms previous findings [34, 37, 41]. Therewere differences in affluence between different countries;that is, in some countries affluent youngsters were moreintense alcohol users than in other countries which confirmsMarshall’s and Enzmann’s hypothesis [56]. However, therewere no differences between country clusters in the impactof affluence on intense alcohol use. This finding is interesting
because the differences in affluence were relatively large, from49.9% in Postsocialist countries to 80% in Northern Europe.
Last, we found support for the hypothesis that whenadolescents experience more negative life events, then it willincrease their intense drinking (see also [43, 53]). There weredifferences in the association of negative life events withintense alcohol use between countries, and also the differ-ences were present between country clusters. In NorthernEurope, where the proportion of adolescents who have expe-rienced more negative life events is the highest, the impact ofnegative life events on intense alcohol use was stronger thanin other regions (i.e., negative life events increased the alcoholuse). One important factor influencing this can be the divorceratewhich is relatively low inMediterranean andPostsocialistcountries compared to Northern Europe.
Overall, we can conclude that all family factors werehighly related to intense alcohol use among adolescentswhich confirms Hirschi’s social control theory [4]. Familystructure and social control were lowering the intense alcoholuse, whereas negative life events and affluence were increas-ing youngsters’ intense alcohol use. Differences betweencountry clusters were present for all family factors exceptaffluence.
Acknowledgments
The research was carried out by support of the EuropeanCommission 7th Framework Programme to the project Effec-tive Environmental Strategies for the Prevention of AlcoholAbuse Among Adolescents in Europe (AAA-Prevent), Grantagreement HEALTH-F2-2009-242204. The authors wouldlike to thank members of the AAA-Prevent (Jiri Burianekfrom Charles University in Czech Republic; Majone Steketee,Harrie Jonkman, Jessica van der Toorn, and Claire Aussemsfrom Verwey-Jonker Instituut in the Netherlands; UbertoGatti, Alfredo Verde, and Gabriele Rocca from University ofGenoa in Italy; Astrid-Britta Braker andRenate Soellner fromUniversity of Hildesheim in Germany; Kristin Goebel andHerbert Scheithauer from Freie Universitat Berlin in Ger-many; Hans Berten and Nicole Vettenburg from Universityof Ghent in Belgium) for their fruitful discussions during thisresearch.
References
[1] K. S. Kendler, E. Schmitt, S. H. Aggen, and C. A. Prescott,“Genetic and environmental influences on alcohol, caffeine,cannabis, and nicotine use from early adolescence to middleadulthood,” Archives of General Psychiatry, vol. 65, no. 6, pp.674–682, 2008.
[2] R. Loeber and T. Dishion, “Early predictors of male delin-quency: a review,”Psychological Bulletin, vol. 94, no. 1, pp. 68–99,1983.
[3] R. Loeber and M. Stouthamer-Loeber, “Family factors ascorrelates and predictors of juvenile conduct problems anddelinquency,” in Crime and Justice, M. Tonry and N. Morris,Eds., vol. 7, pp. 29–149, University of Chicago Press, Chicago,Ill, USA, 1986.

Psychiatry Journal 11
[4] T.Hirschi,Causes ofDelinquency, University ofCalifornia Press,Berkeley, Calif, USA, 1969.
[5] S. S. Luthar, D. Cicchetti, and B. Becker, “The construct ofresilience: a critical evaluation and guidelines for future work,”Child Development, vol. 71, no. 3, pp. 543–562, 2000.
[6] M. A. Schonberg and D. S. Shaw, “Do the predictors of childconduct problems vary by high- and low-levels of socioe-conomic and neighborhood risk?” Clinical Child and FamilyPsychology Review, vol. 10, no. 2, pp. 101–136, 2007.
[7] M. J. Cleveland, M. E. Feinberg, and M. T. Greenberg, “Protec-tive families in high- and low-risk environments: implicationsfor adolescent substance use,” Journal of Youth and Adolescence,vol. 39, no. 2, pp. 114–126, 2010.
[8] R. L. Simons, K. H. Lin, L. C. Gordon, G. H. Brody, V. Murry,and R. D. Conger, “Community differences in the associationbetween parenting practices and child conduct problems,”Journal of Marriage and Family, vol. 64, no. 2, pp. 331–345, 2002.
[9] C. Knoester and D. L. Haynie, “Community Context, socialintegration into family, and youth violence,” Journal ofMarriageand Family, vol. 67, no. 3, pp. 767–780, 2005.
[10] G. Esping-Andersen, The Three Worlds of Welfare Capitalism,Princeton University Press, Princeton, NJ, USA, 1990.
[11] S. Saint-Arnaid and P. Bernard, “Convergence or resilience? Ahierarchical cluster analysis of the welfare regimes in advancedcountries,” Current Sociology, vol. 51, pp. 499–527, 2003.
[12] G. Esping-Andersen, Social Foundations of PostindustrialEconomies, Oxford University Press, New York, NY, USA, 1999.
[13] S. Leibfried, “Towards a European welfare state? On integratingpoverty regimes into the European community,” in Social Policyin a Changing Europe, Z. Ferge and J. E. Kolberg, Eds., pp. 245–280, Campus Verlag, Frankfurt am Main, Germany, 1992.
[14] M. Ferrera, “The ’southern model’ of welfare in social Europe,”Journal of European Social Policy, vol. 6, no. 1, pp. 17–37, 1996.
[15] G. Bonoli, “Classifying welfare states: a two-dimensionapproach,” Journal of Social Policy, vol. 26, no. 3, pp. 351–372,1997.
[16] T. Lappi-Seppala, “Penal policy and prisoner rates in Scandi-navia,” in Festschrift in Honor of Raimo Lahti, K. Nuotio, Ed.,pp. 265–306, University of Helsinki, Helsinki, Finland, 2007.
[17] P. Smit, I. H. Marshall, and M. van Gammeren, “An empiricalapproach to country clustering,” in Crime and Criminal JusticeSystems in Europe and North America 1995–2004, K. Aromaaand M. Heiskanen, Eds., pp. 169–195, HEUNI, Helsinki, Fin-land, 2008.
[18] R. J. Sampson and J. H. Laub, Crime in the Making: Pathwaysand Turning Points Through Life, Harvard University Press,Cambridge, Mass, USA, 1993.
[19] J. Junger-Tas, I. H. Marshall, and D. Riberaud, Delinquencyin an International Perspective: The International Self-ReportedDelinquency Study (ISRD), Criminal Justice Press, Monsey, NY,USA; Kugler Publications, The Hague, The Netherlands, 2003.
[20] G. H. Elder, J. S. Eccles, M. Ardelt, and S. Lord, “Inner-cityparents under economic pressure: perspective on the strategiesof parenting,” Journal of Marriage and the Family, vol. 57, pp.771–784, 1995.
[21] S. Gabel, “Behavioral problems in sons of incarcerated or other-wise absent fathers: the issue of separation,” Family Process, vol.31, no. 3, pp. 303–314, 1992.
[22] A. J. Norton and P. C. Glick, “One parent families: a social andeconomic profile,” Family Relations, vol. 35, pp. 9–17, 1986.
[23] S. M. Dornbusch, J. M. Carlsmith, S. J. Bushwall et al., “Singleparents, extended households, and the control of adolescents,”Child Development, vol. 56, no. 2, pp. 326–341, 1985.
[24] R. L. Flewelling and K. E. Bauman, “Family structure as apredictor of initial substance use and sexual intercourse in earlyadolescence,” Journal of Marriage and the Family, vol. 52, pp.171–181, 1990.
[25] T. Bjarnason, B. Andersson, M. Choquet, Z. Elekes, M. Mor-gan, and G. Rapinett, “Alcohol culture, family structure andadolescent alcohol use: multilevel modeling of frequency ofheavy drinking among 15-16 year old students in 11 Europeancountries,” Journal of Studies on Alcohol, vol. 64, no. 2, pp. 200–208, 2003.
[26] R. F. Oman, S. K. Vesely, E. Tolma, C. B. Aspy, S. Rodine, andL. Marshall, “Does family structure matter in the relationshipsbetween youth assets and youth alcohol, drug and tobacco use?”Journal of Research on Adolescence, vol. 17, no. 4, pp. 743–766,2007.
[27] F. I. Fawzy, R. H. Coombs, J.M. Simon, andM. Bowman-Terrell,“Family composition, socioeconomic status, and adolescentsubstance use,”Addictive Behaviors, vol. 12, no. 1, pp. 79–83, 1987.
[28] C. H. Amey and S. L. Albrecht, “Race and ethnic differencesin adolescent drug use: the impact of family structure and thequantity and quality of parental interaction,” Journal of DrugIssues, vol. 28, no. 2, pp. 283–298, 1998.
[29] J. Junger-Tas, “Causal factors: social control theory,” in JuvenileDelinquency in the Netherlands, J. Junger-Tas and R. Block, Eds.,Kugler Publications, Berkeley, Calif, USA, 1988.
[30] R. Loeber and D. P. Farrington, “Never too early, never too late:risk factors and successful interventions for serious and violentjuvenile offenders,” Studies on Crime and Crime Prevention, vol.7, pp. 7–30, 1998.
[31] J. White and E. Halliwell, “Alcohol and tobacco use during ado-lescence: the importance of the family mealtime environment,”Journal of Health Psychology, vol. 15, no. 4, pp. 526–532, 2010.
[32] L. B. Fisher, I. W. Miles, S. B. Austin, C. A. Camargo, and G.A. Colditz, “Predictors of initiation of alcohol use among USadolescents: findings from a prospective cohort study,” Archivesof Pediatrics and Adolescent Medicine, vol. 161, no. 10, pp. 959–966, 2007.
[33] K. Urberg,M. S. Goldstein, and P. A. Toro, “Supportive relation-ships as a moderator of the effects of parent and peer drinkingon adolescent drinking,” Journal of Research onAdolescence, vol.15, no. 1, pp. 1–19, 2005.
[34] J. Pomerleau, L. L. Pederson, T. Østbye, M. Speechley, and K.N. Speechley, “Health behaviours and socio-economic status inOntario, Canada,” European Journal of Epidemiology, vol. 13, no.6, pp. 613–622, 1997.
[35] F. J. Elgar, C. Roberts, N. Parry-Langdon, and W. Boyce,“Income inequality and alcohol use: a multilevel analysis ofdrinking and drunkenness in adolescents in 34 countries,”European Journal of Public Health, vol. 15, no. 3, pp. 245–250,2005.
[36] R. Lowry, L. Kann, J. L. Collins, and L. J. Kolbe, “The effectof socioeconomic status on chronic disease risk behaviorsamong US adolescents,” The Journal of the American MedicalAssociation, vol. 276, no. 10, pp. 792–797, 1996.
[37] T. Lintonen, M. Rimpela, A. Vikat, and A. Rimpela, “The effectof societal changes on drunkenness trends in early adolescence,”Health Education Research, vol. 15, no. 3, pp. 261–269, 2000.
[38] M. Lemstra, N. R. Bennett, C. Neudorf et al., “A meta-analysisof marijuana and alcohol use by socio-economic status in

12 Psychiatry Journal
adolescents aged 10–15 years,” Canadian Journal of PublicHealth, vol. 99, no. 3, pp. 172–177, 2008.
[39] J. Tuinstra, J. W. Groothoff, W. J. A. Van Den Heuvel, and D.Post, “Socio-economic differences in health risk behavior inadolescence: do they exist?” Social Science andMedicine, vol. 47,no. 1, pp. 67–74, 1998.
[40] C. A. Vereecken, L. Maes, and D. De Bacquer, “The influence ofparental occupation and the pupils’ educational level on lifestylebehaviors among adolescents in Belgium,” Journal of AdolescentHealth, vol. 34, no. 4, pp. 330–338, 2004.
[41] A. Kouvonen and T. Lintonen, “Adolescent part-time work andheavy drinking in Finland,”Addiction, vol. 97, no. 3, pp. 311–318,2002.
[42] S. A. Burt, A. R. Barnes, M.McGue, andW. G. Iacono, “Parentaldivorce and adolescent delinquency: ruling out the impact ofcommon genes,” Developmental Psychology, vol. 44, no. 6, pp.1668–1677, 2008.
[43] R. Otten, C. S. Van Der Zwaluw, H. Van Der Vorst, and R. C. M.E. Engels, “Partner effects and bidirectional parent-child effectsin family alcohol use,” European Addiction Research, vol. 14, no.2, pp. 106–112, 2008.
[44] C. Jackson, “Initial and experimental stages of tobacco andalcohol use during late childhood: relation to peer, parent, andpersonal risk factors,” Addictive Behaviors, vol. 22, no. 5, pp.685–698, 1997.
[45] P. L. Ellickson and R. D. Hays, “Antecedents of drinking amongyoung adolescents with different alcohol use histories,” Journalof Studies on Alcohol, vol. 52, no. 5, pp. 398–408, 1991.
[46] J. L. Johnson and M. Leff, “Children of substance abusers:overview of research findings,” Pediatrics, vol. 103, no. 5, pp.1085–1099, 1999.
[47] P. S. Keller, E. M. Cummings, P. T. Davies, and P. M. Mitchell,“Longitudinal relations between parental drinking problems,family functioning, and child adjustment,” Development andPsychopathology, vol. 20, no. 1, pp. 195–212, 2008.
[48] M. T. Lynskey, A. C. Heath, E. C. Nelson et al., “Geneticand environmental contributions to cannabis dependence in anational young adult twin sample,” Psychological Medicine, vol.32, no. 2, pp. 195–207, 2002.
[49] K. J. Sher, E. R. Grekin, and N. A. Williams, “The developmentof alcohol use disorders,” Annual Review of Clinical Psychology,vol. 1, pp. 493–523, 2005.
[50] P. Tolan, D. Gorman-Smith, and D. Henry, “Family violence,”Annual Review of Psychology, vol. 57, pp. 557–583, 2006.
[51] L. M. Gutman, J. S. Eccles, S. Peck, and O. Malanchuk,“The influence of family relations on trajectories of cigaretteand alcohol use from early to late adolescence,” Journal ofAdolescence, vol. 34, no. 1, pp. 119–128, 2011.
[52] S. Seljamo, M. Aromaa, L. Koivusilta et al., “Alcohol use infamilies: a 15-year prospective follow-up study,” Addiction, vol.101, no. 7, pp. 984–992, 2006.
[53] R. Lieb, K. R. Merikangas, M. Hofler, H. Pfister, B. Isensee, andH. U.Wittchen, “Parental alcohol use disorders and alcohol useand disorders in offspring: a community study,” PsychologicalMedicine, vol. 32, no. 1, pp. 63–78, 2002.
[54] S. Y. Hill, S. Shen, L. Lowers, and J. Locke, “Factors predictingthe onset of adolescent drinking in families at high risk fordeveloping alcoholism,” Biological Psychiatry, vol. 48, no. 4, pp.265–275, 2000.
[55] W. Boyce, T. Torsheim, C. Currie, and A. Zambon, “The familyaffluence scale as a measure of national wealth: validation of an
adolescent self-report measure,” Social Indicators Research, vol.78, no. 3, pp. 473–487, 2006.
[56] I. H. Marshall and D. Enzmann, “Methodology and design ofthe ISRD-2 study,” inTheMany Faces of Youth Crime, J. Junger-Tas, I. H. Marshall, D. Enzmann, M. Killias, M. Steketee, and B.Gruszczynska, Eds., pp. 21–68, Springer, New York, NY, USA,2011.