The Effect of Chiari Malformation Type I on Cerebrospinal ...
167
The Effect of Chiari Malformation Type I on Cerebrospinal Fluid Dynamics Author: Lloyd, Robert Publication Date: 2019 DOI: https://doi.org/10.26190/unsworks/3909 License: https://creativecommons.org/licenses/by-nc-nd/3.0/au/ Link to license to see what you are allowed to do with this resource. Downloaded from http://hdl.handle.net/1959.4/64973 in https:// unsworks.unsw.edu.au on 2022-06-03
-
Upload
khangminh22 -
Category
Documents
-
view
3 -
download
0
Transcript of The Effect of Chiari Malformation Type I on Cerebrospinal ...

The Effect of Chiari Malformation Type I on CerebrospinalFluid Dynamics
Author:Lloyd, Robert
Publication Date:2019
DOI:https://doi.org/10.26190/unsworks/3909
License:https://creativecommons.org/licenses/by-nc-nd/3.0/au/Link to license to see what you are allowed to do with this resource.
Downloaded from http://hdl.handle.net/1959.4/64973 in https://unsworks.unsw.edu.au on 2022-06-03
The Effect of Chiari Malformation Type I
on Cerebrospinal Fluid Dynamics
Authored by Robert A. Lloyd
A thesis in fulfilment of the requirements for the degree of
Doctor of Philosophy
Prince of Wales Clinical School
Faculty of Medicine
Supervisor: Lynne E. Bilston
Co-supervisor: David F. Fletcher
Submitted: September 2019


i
Thesis/Dissertation sheet
Surname/Family Name : Lloyd
Given Name/s : Robert Arthur
Abbreviation for degree as give in the University calendar : Doctor of Philosophy (Research)
Faculty : Medicine
School : Prince of Wales Clinical School
Thesis Title : The Effect of Chiari Malformation Type I on Cerebrospinal Fluid Dynamics
Abstract 350 words maximum:
Chiari malformation type I is a disorder in which the cerebellar tonsils herniate through the
foramen magnum. A majority of patients with this condition also develop a fluid filled
cavity (syrinx) within the spinal cord. Syrinxes are associated with both sensory and motor
disturbances, with extreme cases leading to autonomic dysfunction. The mechanisms that
lead to the accumulation of fluid remain unknown. There is no universally accepted
treatment and current surgical treatments have variable, but often unsatisfactory, outcomes
and side effects are common. There is a need to understand cerebrospinal fluid (CSF)
circulation in Chiari malformation to identify the mechanism(s) that cause syrinx
formation. This would enable a mechanistically based treatment to be developed.
This thesis presents six interrelated studies investigating CSF circulation and the influence
of tonsillar herniation on CSF dynamics, to better understand potential mechanisms for
syrinx formation. Methods used include novel real-time magnetic resonance imaging
(MRI) of CSF and blood flow, morphological assessments of anatomical MRI, subject-
specific computational models of the spinal subarachnoid space, and idealised models of
the perivascular space.
The subject-specific models showed that in Chiari patients the peak systolic CSF pressure
was increased and occurred earlier in the cardiac cycle, compared with controls. The
perivascular space model suggested that these subarachnoid pressure characteristics may
cause increased flow into the cord that is favourable for syrinx formation in Chiari patients.
Increased overcrowding below the foramen magnum in syrinx free subjects led to an
earlier systolic pulse, whereas in syrinx subjects it caused a delay. This difference in
behaviour may be related to syrinx patients having a smaller midsagittal cross-sectional
area and could explain why not all patients develop a syrinx. Real-time imaging of CSF
flow in controls were inconsistent with the currently accepted mechanism for respiratory
CSF circulation, suggesting instead that respiratory CSF flow is primarily dependent on the
balance of the thoracic and lumbar spinal pressures. Real-time imaging in Chiari patients
found coughing and straining produced high velocity cranial flow at the foramen magnum,
which may be a marker for Chiari associated headache, but whether this influences syrinx
formation requires further investigation.

ii
Declaration relating to disposition of project thesis/dissertation I hereby grant to the University of New South Wales or its agents the right to archive and to make available my
thesis or dissertation in whole or in part in the University libraries in all forms of media, now or here after known, subject to the provisions of the Copyright Act 1968. I retain all property rights, such as patent rights. I also retain the right to use in future works (such as articles or books) all or part of this thesis or dissertation.
I also authorise University Microfilms to use the 350 word abstract of my thesis in Dissertation Abstracts
International (this is applicable to doctoral theses only). …………………………………………… Signature
…………………………..……………… Witness Signature
……….……………… Date
The University recognises that there may be exceptional circumstances requiring restrictions on copying or conditions on use. Requests for restriction for a period of up to 2 years must be made in writing. Requests for a longer period of restriction may be considered in exceptional circumstances and require the approval of the Dean of Graduate Research.
FOR OFFICE USE ONLY
Date of completion of requirements for Award:
iii
Originality statement
‘I hereby declare that this submission is my own work and to the best of my knowledge it
contains no materials previously published or written by another person, or substantial
proportions of material which have been accepted for the award of any other degree or diploma
at UNSW or any other educational institution, except where due acknowledgement is made in
the thesis. Any contribution made to the research by others, with whom I have worked at
UNSW or elsewhere, is explicitly acknowledged in the thesis. I also declare that the intellectual
content of this thesis is the product of my own work, except to the extent that assistance from
others in the project's design and conception or in style, presentation and linguistic expression is
acknowledged.’
Signed ……………………………………………..............
Date …………………………………………….................
Copyright statement
‘I hereby grant the University of New South Wales or its agents the right to archive and
to make available my thesis or dissertation in whole or part in the University libraries in
all forms of media, now or here after known, subject to the provisions of the Copyright
Act 1968. I retain all proprietary rights, such as patent rights. I also retain the right to use
in future works (such as articles or books) all or part of this thesis or dissertation.
I also authorise University Microfilms to use the 350 word abstract of my thesis in
Dissertation Abstract International (this is applicable to doctoral theses only).
I have either used no substantial portions of copyright material in my thesis or I have
obtained permission to use copyright material; where permission has not been granted I
have applied/will apply for a partial restriction of the digital copy of my thesis or
dissertation.'
Signed ……………………………………………..............
Date …………………………………………….................
Authenticity statement
‘I certify that the library deposit digital copy is a direct equivalent of the final officially
approved version of my thesis. No emendation of content has occurred and if there are any
minor variations in formatting, they are the result of the conversion to digital format’
Signed ……………………………………………..............
Date …………………………………………….................

iv
Inclusion of publications statement
UNSW is supportive of candidates publishing their research results during their candidature
as detailed in the UNSW Thesis Examination Procedure.
Publications can be used in their thesis in lieu of a Chapter if:
The student contributed greater than 50% of the content in the publication and is the
“primary author”, i.e. the student was responsible primarily for the planning, execution
and preparation of the work for publication
The student has approval to include the publication in their thesis in lieu of a Chapter
from their supervisor and Postgraduate Coordinator.
The publication is not subject to any obligations or contractual agreements with a third
party that would constrain its inclusion in the thesis
Please indicate whether this thesis contains published material or not.
☐ This thesis contains no publications, either published or submitted for
publication
☐ Some of the work described in this thesis has been published and it has been
documented in the relevant Chapters with acknowledgement.
☒ This thesis has publications (either published or submitted for publication)
incorporated into it in lieu of a chapter and the details are presented below
CANDIDATE’S DECLARATION
I declare that:
I have complied with the Thesis Examination Procedure
Where I have used a publication in lieu of a Chapter, the listed publication(s) below
meet(s) the requirements to be included in the thesis.
Name
Signature
Date (dd/mm/yy)
Postgraduate Coordinator’s Declaration (to be filled in where publications are used in
lieu of Chapters)
I declare that:
the information below is accurate
where listed publication(s) have been used in lieu of Chapter(s), their use complies
with the Thesis Examination Procedure
the minimum requirements for the format of the thesis have been met.
PGC’s Name
PGC’s Signature Date (dd/mm/yy)

v
Details of publication #1:
Full title: Chiari Malformation may Increase Perivascular Cerebrospinal Fluid Flow into the
Spinal Cord: A Subject-Specific Computational Modelling Study
Authors: Lloyd, R.A., Fletcher, D.F., Clarke, E.C. & Bilston, L.E.
Journal or book name: Journal of Biomechanics
Volume/page numbers: 65, 185-193
Date accepted/ published: 8th December 2017
Status Published ✔ Accepted and
In press
In progress
(submitted)
The Candidate’s Contribution to the Work
Lloyd, R. A. provided conception and design of study, and collected, processed, analysed,
and interpreted the data. He also drafted manuscript and revisions.
Location of the work in the thesis and/or how the work is incorporated in the thesis:
The publication has been included in lieu of Chapter 2
Primary Supervisor’s Declaration
I declare that:
• the information above is accurate
• this has been discussed with the PGC and it is agreed that this publication can be
included in this thesis in lieu of a Chapter
• All of the co-authors of the publication have reviewed the above information and have
agreed to its veracity by signing a ‘Co-Author Authorisation’ form.
Supervisor’s name
Supervisor’s signature
Date (dd/mm/yy)

vi
Details of publication #2:
Full title: The Effects of Variation in the Arterial Pulse Waveform on Perivascular Flow
Authors: Lloyd, R.A., Stoodley, M. A., Fletcher, D.F. & Bilston, L.E.
Journal or book name: Journal of Biomechanics
Volume/page numbers: 90, 65-70
Date accepted/ published: 11th June 2019
Status Published ✔ Accepted and
In press
In progress
(submitted)
The Candidate’s Contribution to the Work
Lloyd, R. A. provided conception and design of study, and collected, processed, analysed,
and interpreted the data. He also drafted manuscript and revisions.
Location of the work in the thesis and/or how the work is incorporated in the thesis:
The publication has been included in lieu of Chapter 3
Primary Supervisor’s Declaration
I declare that:
• the information above is accurate
• this has been discussed with the PGC and it is agreed that this publication can be
included in this thesis in lieu of a Chapter
• All of the co-authors of the publication have reviewed the above information and have
agreed to its veracity by signing a ‘Co-Author Authorisation’ form.
Supervisor’s name
Supervisor’s signature
Date (dd/mm/yy)

vii
Table of contents
Thesis/Dissertation sheet ............................................................................................................. i
Originality statement ................................................................................................................. iii
Copyright statement .................................................................................................................. iii
Authenticity statement ............................................................................................................... iii
Inclusion of publications statement .......................................................................................... iv
Table of contents ....................................................................................................................... vii
Acknowledgements ..................................................................................................................... x
Publications from thesis ............................................................................................................ xi
Presentations from thesis ......................................................................................................... xii
Other publications ................................................................................................................... xiii
List of figures ............................................................................................................................ xiv
List of tables............................................................................................................................. xvii
1. Introduction and literature review .................................................................................... 1
Background of healthy anatomy and physiology of the CSF spaces ............................ 2
The cerebrospinal fluid spaces ............................................................................. 2
Subarachnoid space circulation ............................................................................ 4
Perivascular flow .................................................................................................. 8
Chiari malformation and syringomyelia ....................................................................... 8
Chiari malformation ............................................................................................. 8
Syringomyelia ....................................................................................................... 9
Mechanisms for syrinx formation: Clinical studies ............................................ 10
Treatment ............................................................................................................ 12
Magnetic resonance imaging studies .......................................................................... 13
Structural anatomy of Chiari malformation ....................................................... 13
The effect of Chiari on CSF flow ........................................................................ 18
The purpose and reliability of computational modelling ............................................ 21
Idealised modelling ............................................................................................. 28
Subject-specific modelling .................................................................................. 29
The importance of subarachnoid structures on CSF flow .................................. 30
Mechanism for syrinx development: Engineering studies .......................................... 32
The tonsillar piston ............................................................................................. 32
Venturi effect and elastic jump ............................................................................ 33
Mechanism for perivascular inflow .................................................................... 33
Summary ..................................................................................................................... 35
The effects of Chiari malformation on CSF dynamics: Thesis Aims ......................... 36
2. Chiari malformation may increase perivascular cerebrospinal fluid flow into the
spinal cord: a subject-specific computational modelling study ..................................... 37
Introduction ................................................................................................................. 37
Methods....................................................................................................................... 39
MR Imaging and flow measurements .................................................................. 39
Computational modelling of the spinal subarachnoid space .............................. 40
Statistical analysis............................................................................................... 43
Results ......................................................................................................................... 43

viii
Subarachnoid model validation ........................................................................... 43
CSF dynamics in Chiari subjects ......................................................................... 44
Arterial pulse delay and perivascular flow ......................................................... 44
The effect of subarachnoid space pressure-time features on perivascular flow .. 48
Discussion .................................................................................................................... 48
Implications for syrinx development .................................................................... 48
Study limitations .................................................................................................. 50
Conclusion ................................................................................................................... 51
3. The effects of variation in the arterial pulse waveform on perivascular flow .............. 53
Introduction ................................................................................................................. 53
Methods ....................................................................................................................... 55
Modelling perivascular flow ................................................................................ 55
Systematic variation of the arterial pulse wave ................................................... 56
Arterial pulse amplitude ...................................................................................... 56
Statistical analysis ............................................................................................... 57
Results ......................................................................................................................... 59
Discussion .................................................................................................................... 60
Influence of arterial pulse waveform on the ‘leaky valve’ mechanism ................ 60
Study limitations .................................................................................................. 61
Conclusion ................................................................................................................... 62
4. The shape of the posterior fossa and its effects on cerebrospinal fluid dynamics ........ 63
Introduction ................................................................................................................. 63
Methods ....................................................................................................................... 68
MR imaging and anatomical segmentation ......................................................... 68
Spinal canal taper ................................................................................................ 69
Subarachnoid pressure-time data ........................................................................ 69
Statistical analysis ............................................................................................... 70
Results ......................................................................................................................... 70
Posterior fossa morphology ................................................................................. 70
Spinal canal taper ................................................................................................ 72
The effect of craniocervical obstruction on the subarachnoid pressure waveform
72
Discussion .................................................................................................................... 74
Study limitations .................................................................................................. 75
Conclusion ................................................................................................................... 76
5. Respiratory cerebrospinal fluid flow is driven by the thoracic and lumbar spinal
pressures ............................................................................................................................. 77
Introduction ................................................................................................................. 77
Methods ....................................................................................................................... 79
Subjects ................................................................................................................ 79
Respiratory manoeuvres ...................................................................................... 79
MRI scans ............................................................................................................ 79
Pressure measurements ....................................................................................... 80
Data analysis ....................................................................................................... 81
Statistical analysis ............................................................................................... 82
ix
Results ......................................................................................................................... 84
CSF and venous blood flow during expiratory efforts ........................................ 84
CSF and venous blood flow during inspiratory efforts ....................................... 85
Similarity of MRI waveforms during the sampled manoeuvres .......................... 86
Differences in the magnitude of CSF dynamics and trunk pressures during
different strength manoeuvres ............................................................................................. 87
Regression modelling .......................................................................................... 89
Discussion ................................................................................................................... 91
Mechanics of inspiratory CSF flow .................................................................... 91
Mechanics of expiratory CSF flow ...................................................................... 93
Study limitations .................................................................................................. 94
Clinical implications ........................................................................................... 94
Conclusion .................................................................................................................. 95
6. Simulating respiratory effects on the cervical CSF pressures ....................................... 96
Introduction ................................................................................................................. 96
Methods....................................................................................................................... 96
Results ......................................................................................................................... 98
Discussion ................................................................................................................... 99
Conclusion ................................................................................................................ 100
7. Pilot study: The effects of coughing and Valsalva on cerebrospinal fluid flow in
Chiari I malformation ..................................................................................................... 101
Introduction ............................................................................................................... 101
Methods..................................................................................................................... 101
MR imaging and flow measurements ................................................................ 102
Computational modelling of the spinal subarachnoid space ............................ 103
Results ....................................................................................................................... 105
CSF flow studies................................................................................................ 105
Subarachnoid space models .............................................................................. 110
Discussion ................................................................................................................. 115
Evaluation of imaging protocol ........................................................................ 115
Sources of error in the coughing models .......................................................... 116
Conclusion ................................................................................................................ 117
8. Summary and conclusions .............................................................................................. 118
Implications for CSF physiology .............................................................................. 118
Implications for Chiari malformation and syringomyelia ......................................... 119
Implications for research methods ............................................................................ 120
Imaging ............................................................................................................. 120
Modelling .......................................................................................................... 121
Future directions ....................................................................................................... 122
Understanding syrinx formation ....................................................................... 122
Understanding coughing-associated headache ................................................ 123
Conclusion ................................................................................................................ 124
References ................................................................................................................................ 125

x
Acknowledgements
Firstly, I would like to thank Professor Lynne Bilston for her mentorship and guidance
throughout my PhD. I am grateful to have had the opportunity to study with Lynne, and to have
been part of such a welcoming research group. I am also thankful for her continued interest in
my professional development, for which her suggestions to improve my choice of language
while presenting will surely help.
I would also like to thank my co-supervisor Professor David Fletcher, for his mentorship,
guidance and willingness to advise me and troubleshoot both modelling and grammatical errors.
I would also like to thank Professor Marcus Stoodley and the Macquarie syrinx research group.
I would like to thank Barbara Toson for her statistical expertise. I would like to thank the staff at
the NeuRA imaging centre. I am also thankful to the participants who were willing to contribute
to my research, in spite of the discomfort long imaging sessions or nasogastric catheters may
have caused them.
Thank you to the Column of Hope and NeuRA for funding my time as a PhD student.
Surprisingly, I would wish to thank David Cameron and his government, for convincing me to
pursue research opportunities outside my country.
To my parents, I would like to thank you for your long-standing support allowing me to pursue
further education, as well as your lack of basic knowledge as to the proper use of contraceptive
measures allowing me to exist. On the note of existing, I would also like to thank the kind New
Yorker, who allowed me to return to Sydney and complete my thesis.

xi
Publications from thesis
I. Lloyd, R. A., Fletcher, D. F., Clarke, E. C., and Bilston, L. E. ‘Chiari malformation may
increase perivascular cerebrospinal fluid flow into the spinal cord: A subject-specific
computational modelling study’. Journal of Biomechanics. 2017 Oct; 65, 185-193.
II. Lloyd, R. A., Stoodley, M. A., Fletcher, D. F., and Bilston, L. E. ‘The effects of variation in
the arterial pulse waveform on perivascular flow’. Journal of Biomechanics. 2019 Jun, 90,
56-70

xii
Presentations from thesis
I. Bilston, L., Lloyd, R., and Fletcher, D. 2017 ‘Computational modelling of spinal
perivascular flow: Relationships between perivascular transport and subarachnoid space
pressure, pulse timing and pulse shape’ Presented at 4th International CSF Dynamics
Symposium, Atlanta, USA, June 19th-20th
II. Lloyd, R., Fletcher, D., and Bilston, L. 2017 ‘The effect of Chiari Malformation and
syringomyelia on CSF flow: CFD subject-specific models for a cohort of Chiari patients
and controls’ Presented at 4th International CSF Dynamics Symposium, Atlanta, USA, June
19th-20th
III. Lloyd, R., Fletcher, D., and Bilston, L. 2017 ‘The effect of Chiari malformation and
syringomyelia on perivascular flow: A computational modelling study’ Presented at 45th
Annual Tow Research Awards, Sydney, November 24th
IV. Lloyd, R., Ball, I., and Bilston, L. 2017 ‘Using TimeSLIP and Real-time PC-MRI to
quantify respiratory effects on the cerebrospinal fluid dynamics’ Presented at The
Australian and New Zealand Society for Magnetic Resonance, Kingscliff, NSW, Dec 2nd-6th
V. Lloyd, R., Fletcher, D., Clarke, E and Bilston, L. 2018 ‘The effects of Chiari malformation
and syringomyelia on Perivascular flow’ Presented at the 8th World Congress of
Biomechanics, Dublin, Ireland, July 8th-12th
VI. Lloyd, R., Ball, I., Stoodley, M., Fletcher, D., and Bilston, L. 2018 ‘The effects of coughing
and Valsalva on cerebrospinal fluid flow and cranial venous drainage’ Presented at the 8th
World Congress of Biomechanics, Dublin, Ireland, July 8th-12th
VII. Lloyd, R., Stoodley, M., Fletcher, D., and Bilston, L. 2019 ‘Mechanisms of syrinx
formation C: Engineering studies’, Presented as an invited talk at CSF flow at Niagara Falls,
Niagara Falls, USA, June 26th-28th
VIII. Lloyd, R., Butler, J., Gandevia, S., Stoodley, M., and Bilston, L. 2019 ‘CSF flow during
respiration is influenced by both thoracic and abdominal pressures’ Presented at 5th
International CSF Dynamics Symposium, Oslo, Norway, July 1st-2nd
IX. Lloyd, R., Fletcher, D., Butler, J., Gandevia, S., and Bilston, L. 2019 ‘The significance of
abdominal pressure on respiratory cerebrospinal fluid dynamics’ Presented at the 16th
International Symposium on Computer Methods in Biomechanical and Biomedical
Engineering and the 4th Conference on Imaging and Visualization, New York City, USA,
August 14th-16th

xiii
Other publications
I. Mowlavi. S., Engmann. J., Burbige. A., Lloyd. R., Hayoun. P., Le Reverend. B., and
Ramaioli. M. ‘In vivo observations and in vitro experiments on the oral phase of
swallowing newtonian and shear thinning liquids’, Journal of Biomechanics, 2016 Dec:
49(16), 3788-3795
II. Cirovic, S., Lloyd, R., Jovanovik, J., Volk, H. A., and Rusbridge, C. ‘Computer simulation
of syringomyelia in dogs’. BMC Veterinary Research, 2018 Mar; 14(1), 82
III. Dawes, B. H., Lloyd, R. A., Rogers, J. M., Magnussen, J. S., Bilston, L. E., and Stoodley,
M. A. “Cerebellar tissue strain in Chiari malforamtion with headache”. World
Neurosurgery, 2019 May; [In Press]

xiv
List of figures
Figure 1.1 A) Gross anatomy of the central nervous system and the CSF spaces (Elliott et al.,
2013). B) Detailed diagram of the meninges within the spinal canal. ......................... 3
Figure 1.2 Diagram of perivascular spaces within the brain (Standring, 2015) highlighting
the structures of the meninges, subarachnoid space, and perivascular spaces............. 4
Figure 1.3 Schematic of the Monro-Kellie doctrine (QA = arterial flow, Qv = venous flow and
QCSF = CSF flow). ........................................................................................................ 5
Figure 1.4 Schematic of the epidural veins and radiographs of there function. ............................ 6
Figure 1.5 Schematic of the effects of respiration on the venous blood flow in the epidural
veins. ............................................................................................................................ 7
Figure 1.6 Serial radiographs of the lumbar spine. ........................................................................ 7
Figure 1.7 Illustrated cases of canalicular syrinxes in a patient with Chiari I malformation,
(A) communicating and (B) non-communicating. (C) provides an example of
extracanalicular non-communicating syringomyelia. .................................................. 9
Figure 1.8 Gardner’s mechanism for syrinx development. ......................................................... 10
Figure 1.9 Williams pressure dissociation mechanism for syrinx development. ........................ 11
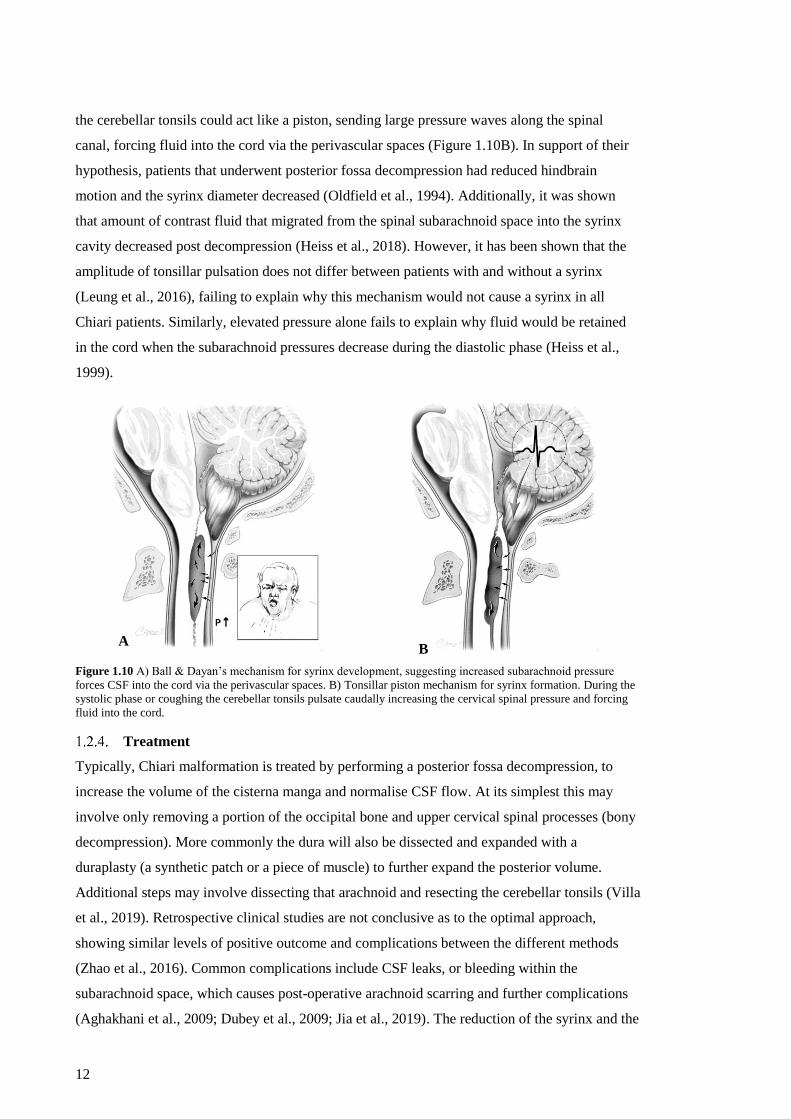
Figure 1.10 A) Ball & Dayan’s mechanism for syrinx development, suggesting increased
subarachnoid pressure forces CSF into the cord via the perivascular spaces. B)
Tonsillar piston mechanism for syrinx formation. .................................................... 12
Figure 1.11 Common morphometric measurements performed in the literature. ....................... 15
Figure 1.12 Example cardiac CSF pulse from a control. ............................................................. 20
Figure 1.13 Examples of flow jets and recirculation patterns in Chiari patients from Bunck et
al. (2012). ................................................................................................................... 20
Figure 1.14 A) Example of poor agreement between CFD and MRI .......................................... 30
Figure 1.15 Example of the different methods used to model the effects of nerver roots and
denticulate ligaments on CSF flow (Pahlavian et al., 2014; Sass et al., 2017;
Stockman, 2005). ....................................................................................................... 31
Figure 1.16 The effects of arachnoid trabeculae of CSF flow and fluid mixing. ........................ 32
Figure 2.1 (A) An illustration of the perivascular anatomy, highlighting a single penetrating
vessel and the potential channel for fluid transport ................................................... 38
Figure 2.2 The Venc prescribes the maximum and minimum velocities that correspond to a
phase .......................................................................................................................... 40
Figure 2.3 (A) Midline sagittal MR scan of a Chiari subject with a syrinx. (B) Magnified
view of midline scan with segmented model area overlaid. ...................................... 42
Figure 2.4 Example of the measured MRI and model velocity-time profiles used for
validation, taken from a control subject. ................................................................... 45
xv
Figure 2.5 Bland-Altman plots assessing the model error (modelled variable – MRI
measurement), each data point is the average error measured across the 10
locations sampled around the subarachnoid space in a subject (Figure 2.3C). ......... 46
Figure 2.6 Group means with their 95% confidence intervals from one-way ANOVA for;
parameters measured from subarachnoid pressures .................................................. 47
Figure 2.7 Relationship between pressure wave features and net pumping rates calculated
with an arterial delay of 4%. ..................................................................................... 48
Figure 2.8 Effect of peak pressure timing on net perivascular flow, for selected cases with a
4% delay in arterial expansion. ................................................................................. 50
Figure 3.1 Illustration demonstrating how the interactions of the forward travelling and
reflected waves may alter the shape of the arterial pressure pulse, adapted from
London and Pannier (2010)....................................................................................... 54
Figure 3.2 Annotated schematic of the axisymmetric perivascular space model. ...................... 55
Figure 3.3 Example of the arterial displacement waveforms used in the parametric analysis. ... 56
Figure 3.4 Calculated pumping rates. Group means with 95% confidence intervals are
shown. ....................................................................................................................... 60
Figure 4.1 Common morphometric measurements performed in the literature. ......................... 65
Figure 4.2 Example posterior fossa volume of a Chiari patient with a syrinx. ........................... 69
Figure 4.3 Relationship between the timing (A-D) and magnitude (E-H) of the subarachnoid
pressures and the measures of obstruction. ............................................................... 73
Figure 5.1 Schematic of the Monro-Kellie hypothesis (QA=arterial flow, Qv=venous flow and
QCSF=CSF flow). ....................................................................................................... 77
Figure 5.2 Schematic of the effects of respiration on the venous blood flow in the epidural
veins. ......................................................................................................................... 78
Figure 5.3 Diagrammatic presentation of the experimental set-up. ............................................ 80
Figure 5.4 Sample measurements of pressures and velocity in an individual subject for each
of the respiratory manoeuvres. .................................................................................. 83
Figure 5.5 Example of one subject’s repeated coughs, followed by a normal breath (marked
by red dashed line). ................................................................................................... 84
Figure 5.6 Example of one subject’s repeated expiratory sniffs, followed by a normal breath
(marked by red dashed line). ..................................................................................... 85
Figure 5.7 Example of one subjects repeated inspiratory sniffs, followed by a normal breath
(marked by red dashed line). ..................................................................................... 86
Figure 5.8 The cross-correlation coefficients for the coughs, expiratory and inspiratory sniffs
in all participants comparing the manoeuvre waveforms of CSF velocity to both
(A) epidural and (B) IJV acceleration, and (C) epidural to IJV acceleration. ........... 86

xvi
Figure 5.9 Average peak displacements plotted against the average peak intrathoracic and
abdominal pressures generated during inspiratory and expiratory efforts. ................ 90
Figure 5.10 Schematic of the effects of inspiration on the change in the venous blood volume
within the thoracic spinal canal. ................................................................................ 92
Figure 6.1 Annotated schematic of the simple spinal model. ...................................................... 97
Figure 6.2 Input displacements for the baseline simulation. ....................................................... 98
Figure 6.3 Example of simulated CSF velocities and displacements at C3. ............................... 98
Figure 6.4 The peak CSF displacements at C3 plotted against the relative difference in
volume change between thoracic and lumbar spine. ................................................. 99
Figure 7.1 Shape of the coughing pulse applied to the caudal end of the model. ..................... 105
Figure 7.2 Group median and interquartile range for the peak cranial (upper) and caudal
(lower) velocities during inspiration and expiration. ............................................... 106
Figure 7.3 Sample measurements of the CSF velocities during a Valsalva manoeuvre at C3,
in two control subjects (A and B), a Chiari patient with (C) and without a syrinx
(D)............................................................................................................................ 106
Figure 7.4 Group median and interquartile range for the peak cranial (Left: A,C,D, and F)
and caudal (Right: B, E, and G) velocities before (pre: A,B), during and after
(post: F, G) Valsalva. ............................................................................................... 108
Figure 7.5 Sample measurements of the CSF velocities during a cough in the cervical spinal
canal, in a Control (A), Chiari patient without (B) and two with a syrinx (C & D).109
Figure 7.6 Group median and interquartile range for the peak cranial (upper: A, B, and C)
and caudal (lower: D, E, and F) velocities before (pre: A, D), during (B, E), and
after (post: C, F) a cough. ........................................................................................ 110
Figure 7.7 A) Example of measured MRI and model velocity for a control subject at C3 for
a cardiac cycle. ........................................................................................................ 111
Figure 7.8 Bland-Altman plots assessing the model error (modelled variable – MRI
measurement) for the cardiac models plotted against the MRI measurement. ........ 111
Figure 7.9 Example CSF velocities in a Chiari patient with a syrinx, calculated with a
coughing pulse applied to the caudal end of the model compared with the subjects
measured MRI velocities. ........................................................................................ 112
Figure 7.10 Bland-Altman plots assessing the model error (modelled variable – MRI
measurement) for the coughing models plotted against the MRI measurement. ..... 113
Figure 7.11 Outline of the model cross-sectional area overlaid on the corresponding axial
slice at the foramen magnum, for subjects A (Left) and B (Right) of Figure 7.10.. 114
Figure 7.12 Group median and interquartile range of the pressure drop between the cervical
spine and foramen magnum, for a cardiac and coughing pulse. .............................. 114

xvii
List of tables
Table 1.1 Summary of morphometric studies. ............................................................................ 16
Table 1.2 Summary of spinal taper measurements. .................................................................... 18
Table 1.3 Summary of the magnitude and timing features of CSF flow in Chiari patients both
with and without a syrinx present. ............................................................................ 19
Table 1.4 Summary of computational models investigating characteristics of normal CSF
dynamics. .................................................................................................................. 22
Table 1.5 Summary of computational models investigating the effect of pathology on CSF
dynamics. .................................................................................................................. 24
Table 2.1 Summary of participant information ........................................................................... 39
Table 2.2 Summary of the agreement between model and in vivo velocity-time profiles.......... 45
Table 3.1 Alterations made to displacement wave, displayed as: variable value (percentage
change from baseline model). ................................................................................... 58
Table 4.1 Summary of Chiari morphometric studies. ................................................................. 66
Table 4.2 Summary of participant information ........................................................................... 68
Table 4.3 Descriptive statistics of the morphological measures that were normally
distributed. ................................................................................................................ 71
Table 4.4 Descriptive statistics of the morphological measures that were non-normally
distributed. ................................................................................................................ 71
Table 4.5 Median spinal tapers measured within the cohort. ...................................................... 72
Table 5.1 Mean and 95% confidence intervals of the peak variables during different
respiratory manoeuvres, in both the cervical and lumbar regions. ............................ 89
Table 5.2 Pairwise comparisons from the linear mixed model for both expiratory and
inspiratory Sniffs, looking at the effects of both the location, strength and their
interaction. ................................................................................................................ 89
Table 7.1 Summary of the agreement between model and MRI velocity-time profiles for the
cardiac models. ....................................................................................................... 111
Table 7.2 Summary of the agreement between the peak model and MRI velocity, at both the
foramen magnum (FM), and at C3 for the coughing models. ................................. 113

1
1. Introduction and literature review
Chiari malformation type I is a condition where the cerebellar tonsils herniate (by ≥ 5 mm) into
the upper cervical spinal canal, causing symptoms of headaches, neck pain and sensory and
motor disturbances (Fernández et al., 2009; Milhorat et al., 1999). A large number of these
patients also develop syringomyelia, fluid filled cavities (syrinxes) within the spinal cord. The
continued growth of the syrinx is believed to compress or damage the nervous tissue (Milhorat
et al., 1995), giving rise to additional symptoms such as persistent pain, loss of motor function,
sensory disturbances and occasionally autonomic dysfunction (Sakushima et al., 2012).
The true prevalence of Chiari Type I is unknown. Using the anatomical definition of Chiari as
having 5 mm or greater tonsillar herniation through the foramen magnum, imaging studies have
estimated Chiari to affect between 0.04-0.90% of the population (Morris et al., 2009; Vernooij
et al., 2007). However, this likely overestimates the clinically relevant cases, as symptomatic
Chiari occurs less frequently (Aitken et al., 2009; Strahle et al., 2011). Within the Chiari
population between 57-78% are diagnosed with syrinxes (Ellenbogen et al., 2000; Milhorat et
al., 1999; Tubbs et al., 2004).
While the symptoms are assumed to originate from abnormal anatomy, neither the severity of
tonsillar herniation nor skull morphology appear to be related to whether patients experience
symptoms (Khalsa et al., 2018; Meadows et al., 2000). Additionally, the mechanisms which
cause coughing and straining associated headaches are poorly understood (Alperin et al., 2015;
Leung et al., 2016). Similarly, the mechanisms which cause a syrinx to develop or enlarge
remain unknown, and the severity of tonsillar herniation appears unrelated to whether a syrinx is
likely to develop (Masur et al., 1995; Stovner and Rinck, 1992).
As the pathophysiology of Chiari malformation and syringomyelia are poorly understood, there
is not a universally accepted treatment, leading to variable, and often unsatisfactory (2.60-
38.4%) outcomes (Aghakhani et al., 2009; Dubey et al., 2009; Jia et al., 2019; Parker et al.,
2013). Positive outcomes from these treatments are commonly attributed to the normalisation of
the posterior cranial volume and cerebrospinal fluid flow (CSF) through the foramen magnum.
There have been many hypotheses proposed for the mechanisms by which Chiari malformation
gives rise to a syrinx, most of which lack supporting evidence, and some have since been
discredited (Ball and Dayan, 1972; Gardner, 1965). Thus, there is a need to understand normal
CSF circulation and the effect of Chiari malformation, to identify mechanisms that could cause
patient symptoms and syrinx development. As this would enable a mechanistically-based
treatment to be developed.

2
Background of healthy anatomy and physiology of the CSF spaces
The cerebrospinal fluid spaces
The brain and spinal cord are suspended in a bath of CSF. This is thought to protect the central
nervous system (CNS) from shock and facilitate solute transport and the homeostasis of the
CNS. CSF is a Newtonian fluid with properties similar to water (density = 1000 kg.m-3,
viscosity = 0.8 mPa.s) (Bloomfield et al., 1998), which is secreted from a highly vascularised
structure within the ventricles called the choroid plexus. It is reabsorbed into the venous blood
through the arachnoid villi (Figure 1.1), and along the spinal nerve roots. Although, more
recently clinical and experimental studies have suggested that the CSF may be produced and
absorbed across the walls of capillaries in the CNS (Brinker et al., 2014). Additionally, dural
lymphatic vessels have been identified (Absinta et al., 2017), which have been demonstrated to
provide an alternate source of rapid CSF drainage (Ma et al., 2017; Ma et al., 2019).
Classically the difference between CSF production and drainage is believed to drive a slow
creeping flow. CSF from the lateral ventricles can flow through the foramen of Monro into the
third ventricle, then through the aqueduct of Sylvius into the fourth ventricle, and out of the
foramen of Magendie (midline outlet) and foramina of Lushka (lateral outlets) into the cisterna
magna, and the subarachnoid space which encases the CSF volume external to the brain and
spinal cord (Figure 1.1) (Brodbelt and Stoodley, 2007). CSF can potentially flow from the
fourth ventricle into the central canal of the spinal cord via the obex, however the central canal
is commonly occluded in adults (Milhorat et al., 1994).

3
A B
Figure 1.1 A) Gross anatomy of the central nervous system and the CSF spaces (Elliott et al., 2013). B) Detailed
diagram of the meninges within the spinal canal. The arachnoid mater (A) lines the thicker dura mater (D). The
arachnoid trabeculae (IL) connects to the pia mater lining the cord. This layer is fenestrated consisting of sheets and
pillar structures connecting, blood vessels (V) and nerve roots. The pia mater also coats the blood vessels within the
subarachnoid space (Nicholas and Weller, 1988). A) Reproduced from Elliot et al., Journal of Fluids and Structures,
2013, 40:1-24 with permissions from Elsevier. B) Reproduced from Nicholas and Weller, Journal of Neurosurgery,
1988, 69:276-282 with permissions from http://thejns.org.
The subarachnoid space is bounded by two layers of fibrous connective tissue (meninges). The
inner layer is the pia mater, which lines the surface of the brain, spinal cord, and blood vessels
which cross the subarachnoid space and penetrate the nervous tissue (Figures 1.1B and 1.2)
(Cloyd and Low, 1974; Nicholas and Weller, 1988). The outer boundary is the arachnoid mater,
which is connected to the pia mater by the arachnoid trabeculae (arachnoid web). The arachnoid
trabeculae consist of both fenestrated sheets and pillar like collagenous structures, which
surround and support blood vessels (Figure 1.1B) (Cloyd and Low, 1974; Nicholas and Weller,
1988). The arachnoid web partitions the subarachnoid space into different cisterns, however the
fenestrations and varied density allows free CSF circulation (Brodbelt and Stoodley, 2007). The
arachnoid mater is overlaid by the dura mater, a thick elastic membrane which provides strength
to the fluid space. Within the cranium the dura coats the surface of the skull, as it progresses
through the foramen magnum into the spine, the dura is separated from the bone by a layer of
fat that allows movement (Weller, 2005). The difference in the support provided to the cranial
and spinal dura mater results in the spinal subarachnoid space being more compliant, allowing
4
the volume of the spinal subarachnoid space to change in response to the variation in CSF
pressure (Henry–Feugeas et al., 2000).
See Standring (2015) Section 3, Chapter 18, Figure 18.14on page 227.
Alternative versions in Zhang et al. (1990) Figure 10, PMID: 2254158,
or in Elliott et al. (2013) Figure 4, Available at DOI:
https://doi.org/10.1016/j.jfluidstructs.2013.01.010
Figure 1.2 Diagram of perivascular spaces within the brain (Standring, 2015) highlighting the structures of the
meninges, subarachnoid space, and perivascular spaces.
There is a fluid space which surrounds blood vessels that penetrate the parenchyma of the brain
and spinal cord, which extends to the arterioles and venules (Figure 1.2) (Lam et al., 2017;
Zhang et al., 1990). These ‘perivascular’ spaces provide a fluid pathway which is continuous
with the subarachnoid space. CSF tracer studies have demonstrated that solutes injected in the
subarachnoid space rapidly migrate into and stain the perivascular spaces. These pathways are
suspected to play a role in the solute transport and exchange between the interstitial fluid and
CSF, in the homeostasis of the CNS (Diem et al., 2016; Hawkes et al., 2011; Iliff et al., 2013a).
Subarachnoid space circulation
CSF oscillates within the subarachnoid space, driven by pressure changes created by the
cardiovascular and respiratory systems. It is generally accepted that the fast (~1 Hz) pulsations
are cardiac driven and respiration drives slower CSF oscillations (<<1 Hz) (Hamer et al., 1977;
Takizawa et al., 2017), although sudden respiratory events such as coughing and straining can
also lead to a rapid displacement of CSF (Hamilton et al., 1936; Williams, 1976; Williams,
1981a; Yildiz et al., 2017).
Cardiac CSF pulsations are primarily driven by the volume balance within the cranial
compartment (the Monro-Kellie doctrine). Over the cardiac cycle the net volume of blood
(arterial inflow minus venous return) within the cranium changes, and CSF is displaced through
the foramen magnum into or out of the spinal subarachnoid space to compensate (Figure 1.3)

5
(Alperin et al., 2005a; Alperin et al., 2005b). Although the spinal cord also pulsates (Dunbar et
al., 1966; Nakamura et al., 1997; Nakamura et al., 1998), it has a less significant effect on CSF
flow compared with cranial pulsations as the spinal canal is more compliant (Henry–Feugeas et
al., 2000).
Figure 1.3 Schematic of the Monro-Kellie doctrine (QA = arterial flow, Qv = venous flow and QCSF = CSF flow). (A)
Labelled schematic demonstrating a hypothetical initial or resting state. The cranial volume is constant, as the net
blood volume increases CSF is displaced into the spinal canal (B). Conversely, a decrease in blood volume draws
CSF cranially (C).
The current literature suggests that there are two mechanisms which drive respiratory CSF flow,
one for normal breathing and one for sudden expiratory efforts (e.g. coughing or the Valsalva
manoeuvre [a forced exhalation against a closed epiglottis]). In the case of forced expiration the
CSF pressure is increased (Hamilton et al., 1944; Hamilton et al., 1936) driving cranial flow
(Du Boulay et al., 1972; Martins et al., 1972; Williams, 1976; Williams, 1981a, b). The
pressures of the trunk are assumed to be transmitted to the spinal canal via the epidural veins
(Henriques, 1962). The epidural veins are a valveless network of veins which span the length of
the spine, occupying a large volume of the extradural fat (Figure 1.4) (Groen et al., 2004; Groen
et al., 2005; Groen et al., 1997). When thoracic and abdominal pressures are increased, blood
flow from the inferior to superior vena cava is prevented, being diverted through the spinal
epidural veins (Figure 1.4) (Batson, 1940; Henriques, 1962; Shah, 1994). This increase in blood
volume will act to compress the dura mater, increasing spinal pressure, and displacing CSF
(Figure 1.5) (Du Boulay et al., 1972; Martins et al., 1972; Reitan, 1941).

6
See Groen et al. (1997) Figure 1.
Available at DOI:
https://doi.org/10.1002/(SICI)1097-
0185(199710)249:2<285::AID-
AR16>3.0.CO;2-K
See Henriques (1962) Figures 11 A & B.
PMID: 13906534
Figure 1.4 Schematic of the epidural veins and radiographs of there function. A) Simplified diagram of anterior
epidural veins and their connection to the larger veins out of the spine (1 jugular vein, 2 vertebral vein, 3 azygos
veins, 4 superior vena cava, 5 inferior vena cava, 6 left renal vein, 7 ascending lumbar vein, 8 femoral veins) (Groen
et al., 1997). B) Radiograph showing venous blood flow in a dogs vena cava under rest. C) Radiograph showing that
when pulmonary pressure was increased, blood flow from the inferior to superior vena cava was prevented, being
diverted into the valveless spinal epidural veins (Henriques, 1962).
CSF flow during normal respiration is hypothesised to be driven by the blood volume balance
within the cranium (Figure 1.3). Thoracic pressures become negative during inspiration,
decreasing the central venous pressure (Hamer et al., 1977; Hamit et al., 1965), increasing
venous return from the cranium (Dreha-Kulaczewski et al., 2017), and CSF flows cranially to
compensate (Dreha-Kulaczewski et al., 2017; Dreha-Kulaczewski et al., 2018; Yamada et al.,
2013). Conversely, during exhalation CSF flows caudally as venous return decreases. However,
this proposed mechanism fails to account for the cases where CSF above the diaphragm flows
caudally during inspiration (Aktas et al., 2019; Dreha-Kulaczewski et al., 2017; Dreha-
Kulaczewski et al., 2018). Aktas et al. (2019) demonstrated that diaphragmatic breathing
resulted in a larger magnitude of cranial CSF flow compared with thoracic, attributing this to
increased abdominal pressures driving a greater volume of blood into the lumbar epidural veins,
and therefore a greater displacement of CSF. Previously it has been shown that inspiration
decreases the cervical and thoracic epidural pressures (Usubiaga et al., 1967), therefore by the
same reasoning it is possible that a sufficient decrease in thoracic pressure could remove a
greater volume of blood from the epidural veins, creating a decrease in spinal pressure that
would draw CSF caudally (Figure 1.5C).
A C B

7
Figure 1.5 Schematic of the effects of respiration on the venous blood flow in the epidural veins. A) Resting
condition, highlighting the possible directions of venous blood flow (solid black arrows) in the respective vessels. B)
With a cough or Valsalva manoeuvre, both intrathoracic and abdominal pressures become positive, driving blood into
the epidural veins, compressing the dural sac driving CSF cranially. C) During inspiration the intrathoracic pressures
becomes negative, increasing venous return in the internal jugular veins (IJV) and epidural veins, removal of blood
from the thoracic epidural veins decreases the pressure in the spinal canal, if this is greater than the increased lumbar
spinal pressures CSF may flow caudally.
The overall effect of respiration on CSF circulation is likely a balance between the dynamic
effects of respiration on the spinal pressures (Figure 1.5), and the coupled cardiovascular effects
on the intracranial pressures (Figure 1.3). For example, when venous return is hindered (e.g.
persistent straining or jugular compression) intracranial pressure is increased by a decrease in
venous drainage, driving CSF flow into the spinal canal (Figures 1.6A-i & B-v) (Bedford, 1935;
Reitan, 1941; Shah, 1994). This can also be achieved by increasing the mean arterial pressure
(e.g. hypercapnia or in response to releasing Valsalva) (Figure 1.6B-iii) (Martins et al., 1972;
Williams, 1981a, b). Alternately, CSF can be drawn cranially by a reduction in mean arterial
pressures, which may occur during hyperventilation (Figure 1.6B-ii).
A - i ii B - i ii iii iv v
Figure 1.6 Serial radiographs of the lumbar spine. A) Reproduced from Reitan (1941) with permsions from
www.tandfonline.com: i – caudal displacement and bulging with jugular compression, ii – cranial displacement of
CSF when abdominal pressure is increased with jugular compression. B) Reproduced from Martins et al. (1972) with
markers to indicate net direction flow: i – base line location of bolus, ii – post 2 minute hyperventillation, iii – post 2
minutes breathing 10% CO2, iv – During a Valsalva, v – post 15 seconds of jugular compression. B) Reproduced
from Martins et al., Journal of Neurology, Neurosurgery & Psychiatry, 1972, 35:468-473 with permissions from the
BMJ publishing Group Ltd.

8
Perivascular flow
Fluid from the spinal subarachnoid space can flow into the spinal cord via the perivascular
spaces. This flow will be in part dependent on the difference between the subarachnoid and
interstitial pressures, although the mechanisms which facilitate this flow are unclear. Currently,
it is believed that the arterial pulsations within the perivascular space actively drive flow into
the cord. In a sheep model, Stoodley et al. (1997) demonstrated this dependence by ligating the
brachiocephalic trunk (large artery that branches off the aorta and supplying blood to the
cranium in sheep), reducing the arterial pulse pressure while maintaining the mean arterial and
subarachnoid pressure, finding tracer deposition along the perivascular spaces was diminished
compared with the control animal. Another ligation study in mice demonstrated the same
behaviour in the brain, perpetuating this hypothesis (Iliff et al., 2013b). Additionally, recent
intravital imaging studies have shown perivascular tracers pulsate in phase with the cardiac
cycle (Bedussi et al., 2018; Mestre et al., 2018). However, the significance of arterial pulsation
as a driver of perivascular flow is not clear. In the sheep model presented by Stoodley et al.
(1997), ligation also reduced the subarachnoid pulse pressure, therefore the significance of
arterial or subarachnoid pulsations on perivascular flow cannot be discerned. On a similar note,
in surface pial arteries the pulse amplitude of the arteries appears too small (~1% of arterial
diameter) (Mestre et al., 2018) to mechanically drive the flow.
Within the parenchyma most fluid motion is driven by diffusion, as the tight junctions and
narrow, tortuous nature of the extracellular space restrict advective flow (Brinker et al., 2014;
Tao and Nicholson, 1996). However, tracer studies have shown that fluid within the cord that
reaches the perivascular spaces will preferentially flow along them (Liu et al., 2018; Wong et
al., 2012), potentially being dispersed along the pathway to the outlets by the pulsatile flow. It
has been hypothesised that a pressure difference between the arteries and veins within the
parenchyma could drive flow through the extracellular space, drawing fluid in along the
periarterial and out through the perivenous spaces (Iliff et al., 2012). However, the evidence
supporting this remains controversial, and the mechanisms which facilitate fluid outflow from
the cord remain poorly understood (Brinker et al., 2014; Liu et al., 2014).
Chiari malformation and syringomyelia
Chiari malformation
As noted above in the Introduction, Chiari I Malformation is a congenital condition
characterised by the herniation of the cerebellar tonsils by 3-5 mm or more below the foramen
magnum (Fernández et al., 2009). The cause of the herniation is believed to be the abnormal
development of the posterior fossa, combined with an otherwise normal cerebellum giving rise
to overcrowding (Milhorat et al., 1999). The disease presents most commonly with symptoms

9
such as suboccipital headaches, neck pain and vertigo. These symptoms can be exacerbated by
Valsalva manoeuvre and head movements (Fernández et al., 2009; Milhorat et al., 1999).
Syringomyelia
Figure 1.7 Illustrated cases of canalicular syrinxes in a patient with Chiari I malformation, (A) communicating and
(B) non-communicating. (C) provides an example of extracanalicular non-communicating syringomyelia.
Communicating syrinxes (Figure 1.7A) appear as a dilation of the central canal, lined entirely or
partially by ependymal cells. The caudal end of the cavity is obstructed by a stenosis and
cranially unobstructed allowing passive flow to and from the fourth ventricle. This type of
syrinx commonly is asymptomatic, as the cavity rarely ruptures into the spinal tissue (Milhorat
et al., 1995). Communication with the fourth ventricle is an infrequent occurrence in cases of
syringomyelia (West and Williams, 1980). This communication is commonly found in
association with obstructions to CSF flow through the outlets of the fourth ventricle
(hydrocephalus and Chiari II malformation), suggesting that excess CSF leads to the dilation of
the central canal (Milhorat, 2000; Milhorat et al., 1995).
Non-communicating canalicular syrinxes (Figure 1.7B) are dilations of the central canal
enclosed both caudally and cranially by a stenosis (obstructing flow to the fourth ventricle).
Unlike communicating syrinxes, with growth the syrinx is likely to rupture and dissect the
parenchyma, leading to additional neurological defects (Milhorat et al., 1995). They are found
in association with obstructions of flow at the level of or below the foramen magnum, such as
with Chiari I malformation and arachnoiditis (Milhorat, 2000), although the causal link is poorly
understood.
Non-communicating extracanalicular syrinxes (Figure 1.7C) initiate within the parenchyma of
the spinal cord and do not communicate with the central canal. The initial cavitation is often
associated with spinal cord trauma, although the mechanism in which the cavity fills with fluid
is unknown. Rodent models of injury suggest that spinal trauma causes a prolonged disruption
of the blood-spinal cord barrier, and increased the expression of water channels within the
spinal cord (such as Aquaporin-4 [AQP4]; a protein channel that facilitates transport of water
A B C

10
across the blood-spinal cord barrier), which would allow for greater fluid accumulation and may
aid syrinx formation (Hemley et al., 2013; Hemley et al., 2012; Hemley et al., 2009).
Additionally, arachnoiditis and scarring at the site of injury may influence fluid influx
(Milhorat, 2000; Naftel et al., 2013; Najafi et al., 2016; Wong et al., 2016).
Mechanisms for syrinx formation: Clinical studies
Communicating syrinx formation
Initial suggestions of a mechanistic link between the structural abnormalities and syrinx
formation came from clinical observations. Gardner (1965) hypothesised that if the outlets of
the fourth ventricle were sealed, the pulsation of the choroid plexus would force fluid into the
central canal and produce a syrinx (Figure 1.8). Using this understanding of how a syrinx
develops, Gardner (1965) suggested that Chiari associated syrinxes could be treated by
removing a portion of the occipital bone (posterior fossa decompression; done to increase CSF
volume of cisterna magna), removing obstructions to the fourth ventricle, sealing the obex, and
expanding the dura mater with a duraplasty (a patch of material used as artificial dura, with the
aim of increasing CSF volume).
Figure 1.8 Gardner’s mechanism for syrinx development. A) During the systolic phase, pulsation of the choroid
plexus forces fluid from the fourth ventricle to the central canal of the spinal cord, expanding the syrinx. B) During
diastolic phase syrinx fluid is prevented from returning to fourth ventricle.
The positive surgical outcomes from posterior fossa decompression earned the hypothesis
popularity (Klekamp, 2002), although further studies showed that the same level of success was
found when the obex was left unobstructed (questioning the role of central canal communication
in syrinx formation) (Ball and Dayan, 1972). Additionally, this mechanism relied on the
permanent blockage of the fourth ventricle, which would result in hydrocephalus (Williams,
1969), which does not occur in the majority of syrinx patients (Williams, 1980). In cases
associated with Chiari II malformation and hydrocephalus, this mechanism is still accepted
(Milhorat, 2000; Milhorat et al., 1995).
A B

11
Williams (1969) developed the concept of CSF communication via the fourth ventricle,
suggesting that the cerebellar tonsils could act as a one-way valve, allowing cranial flow but
obstructing caudal flow (Figure 1.9). During this caudal flow obstruction a pressure difference
between the cranial and spinal subarachnoid spaces would develop (commonly referred to as a
“pressure dissociation” in clinical literature), and in order to equalise the pressure difference,
CSF would flow into the cord via the central canal (Williams, 1981a, b). This ‘suck’ effect was
demonstrated with invasive pressure measurements, finding cranial pressures to be higher than
in the lumbar spine post-Valsalva. This effect was attributed to the tonsillar obstruction, but it
should be noted that this study used no control subjects, thus which characteristics are
pathological is not clear. Heiss et al. (1999) later confirmed the occurrence of this pressure
dissociation, performing jugular compression on controls and Chiari subjects to increase
intracranial pressure, showing a delay in the rise of the lumbar spinal pressures in Chiari
patients compared with controls. However, MRI scans from this study showed syrinxes are
compressed in systole and do not expand during Valsalva manoeuvres, which contradicts what
would be expected under the mechanisms suggested by either Gardner or Williams.
Figure 1.9 Williams pressure dissociation mechanism for syrinx development. A) While coughing or straining CSF is
displaced cranially. B) At rest the tonsils descend preventing CSF from flowing caudally and maintaining increased
intracranial pressure. To normalise the pressure CSF flows from the fourth ventricle into spinal cord via the central
canal, forming the syrinx.
Mechanism for perivascular inflow
As communicating syringomyelia is uncommon among Chiari type I patients, Ball and Dayan
(1972) proposed that the perivascular spaces could provide an alternate pathway to the central
canal. Ball and Dayan (1972) noted that in cords with a syrinx, the lumen of the perivascular
spaces were abnormally dilated, this was taken to indicate that the perivascular spaces had been
under pressure for a prolonged period. From this, it was assumed that increased subarachnoid
pressure could force CSF into the cord, leading to the development of a syrinx (Figure 1.10A).
With the use of MRI and ultrasonography Oldfield et al. (1994) & Heiss et al. (1999) identified
that the cerebellar tonsils pulsate in phase with the caudal CSF flow. It was hypothesised that
A B
12
the cerebellar tonsils could act like a piston, sending large pressure waves along the spinal
canal, forcing fluid into the cord via the perivascular spaces (Figure 1.10B). In support of their
hypothesis, patients that underwent posterior fossa decompression had reduced hindbrain
motion and the syrinx diameter decreased (Oldfield et al., 1994). Additionally, it was shown
that amount of contrast fluid that migrated from the spinal subarachnoid space into the syrinx
cavity decreased post decompression (Heiss et al., 2018). However, it has been shown that the
amplitude of tonsillar pulsation does not differ between patients with and without a syrinx
(Leung et al., 2016), failing to explain why this mechanism would not cause a syrinx in all
Chiari patients. Similarly, elevated pressure alone fails to explain why fluid would be retained
in the cord when the subarachnoid pressures decrease during the diastolic phase (Heiss et al.,
1999).
Figure 1.10 A) Ball & Dayan’s mechanism for syrinx development, suggesting increased subarachnoid pressure
forces CSF into the cord via the perivascular spaces. B) Tonsillar piston mechanism for syrinx formation. During the
systolic phase or coughing the cerebellar tonsils pulsate caudally increasing the cervical spinal pressure and forcing
fluid into the cord.
Treatment
Typically, Chiari malformation is treated by performing a posterior fossa decompression, to
increase the volume of the cisterna manga and normalise CSF flow. At its simplest this may
involve only removing a portion of the occipital bone and upper cervical spinal processes (bony
decompression). More commonly the dura will also be dissected and expanded with a
duraplasty (a synthetic patch or a piece of muscle) to further expand the posterior volume.
Additional steps may involve dissecting that arachnoid and resecting the cerebellar tonsils (Villa
et al., 2019). Retrospective clinical studies are not conclusive as to the optimal approach,
showing similar levels of positive outcome and complications between the different methods
(Zhao et al., 2016). Common complications include CSF leaks, or bleeding within the
subarachnoid space, which causes post-operative arachnoid scarring and further complications
(Aghakhani et al., 2009; Dubey et al., 2009; Jia et al., 2019). The reduction of the syrinx and the
A B

13
relief of symptoms are typically attributed to the normalisation of CSF flow (Dolar et al., 2004;
Iskandar et al., 2004) and tissue motion (Dawes et al., 2019; Lawrence et al., 2018), although a
mechanism for this link has yet to be established.
Shunting can be used to ensure flow from the fourth ventricle, or across the foramen magnum
(Guyotat et al., 1998). More typically it is used to drain the syrinx when the associated
pathology is deemed inoperable or previous interventions have failed to reduce the syrinx
(Cacciola et al., 2009; Davidson et al., 2018). The shunt can be placed in the syrinx to drain
fluid into the pleural, peritoneal, or subarachnoid spaces (Cacciola et al., 2009; Chumas et al.,
1993; Davidson et al., 2018). The collapse of syrinxes with shunting into the subarachnoid
space may provide insight as to the mechanics of syrinx growth (Davidson et al., 2018). Syrinx
growth can be thought to be an imbalance between the normal levels of fluid flow into and out
of the spinal cord. Shunting into the subarachnoid provides direct communication with the
syrinx, and if increased subarachnoid pressure alone could increase fluid uptake, the syrinx
would be expected to grow. Since syrinxes are successfully treated with this method, it would
suggest that there is either some additional mechanism required to increase fluid uptake, or there
may be a mechanism restricting normal fluid outflow from the cord.
Magnetic resonance imaging studies
Structural anatomy of Chiari malformation
Tonsillar herniation is a clinical definition of Chiari, however the 5 mm threshold falls within
the range seen in the wider healthy population (Smith et al., 2013). Additionally, the degree of
herniation shows no relation to whether the patient experiences symptoms (Khalsa et al., 2018;
Meadows et al., 2000), or develops a syrinx (Masur et al., 1995; Stovner and Rinck, 1992).
Other morphometric measures of the occipital bone and the soft tissues within the posterior
fossa have also been used to characterise Chiari (Figure 1.11; Table 1.1). Common findings are
that Chiari patients compared with controls appear to have; a shorter clivus (Figure 1.11; line 3)
with a shallower angulation (Figure 1.11; angles 9 & 11), a shorter occipital bone (Figure 1.11;
line 6) with a steeper angulation (Figure 1.11; angles 10 & 13), in addition to a larger fraction of
the fossa volume occupied by the hindbrain (over-crowding). The corpus callosum, pons, and
fastigium of the fourth ventricle have also been found to be closer to the foramen magnum
(Figure 1.11; lines 16, 17 & 18). The proximity of these structures to the foramen magnum has
generally not been addressed, and it has likely been assumed that their relative position is the
result of an abnormal posterior fossa causing the caudal descent of these structures, similar to
the cerebellar tonsils (Houston et al., 2018; Urbizu et al., 2014). However, it could also indicate
that supratentorial abnormalities are influencing hindbrain descent and overcrowding (Heiss,
2014). As in the analogous condition Chiari-like malformation found in brachycephalic toy

14
breeds of dog, it has been shown that rostral changes in bone structure contribute to
overcrowding, and tonsillar herniation (Knowler et al., 2017; Rusbridge et al., 2018).
Chiari patients with a syrinx have been found to have a narrower foramen magnum
(Eppelheimer et al., 2018) and greater clivus incline (Yan et al., 2016) compared with patients
without a syrinx (Figure 1.11; line 7 and angle 9). These subtle differences could affect the CSF
dynamics and contribute to syrinx formation; however, these findings are not consistent across
the two studies (Table 1.1). Additionally, not controlling for the presence of a syrinx could
contribute to conflicting findings within the literature. Most studies have either not mentioned
or failed to control for the differences between Chiari patients with and without a syrinx (see
Table 1.1).
Similarly to tonsillar herniation, no relationship has been demonstrated between the morphology
of the posterior fossa and the symptoms of the Chiari patient (Alperin et al., 2014; Alperin et al.,
2015; Khalsa et al., 2018). However, Chiari headaches are associated with a significant decrease
in intracranial compliance (Alperin et al., 2014; Alperin et al., 2015), and increased hindbrain
(Leung et al., 2016) and spinal cord (Lawrence et al., 2018) pulsation, although the mechanisms
which facilitate this relationship, and whether they contribute to syrinx growth is not fully
understood.

15
Linear
1) Height of PCF = perpendicular distance from the foramen magnum [Line 7] to the superior aspect of the tentorium.
2) Width of PCF = distance between the dorsum sellae of the clivus to the internal occipital protuberance.
3) Clivus length = distance between the dorsum sellae (superior point) to the basion (inferior point), also equals the sum of 4
and 5.
4) Basisphenoid length = dorsum sellae to the sphenoocciput.
5) Basiocciput length = basion to the sphenoocciput.
6) Supraocciput length (Occipital bone length) = the opisthion (posterior point of foramen magnum) to the internal occipital
protuberance.
7) Foramen magnum (McRae line) = anterior-posterior diameter between the basion and opisthion.
Angular
9) Clivus incline (Boogard angle) = angle between lines 3 and 7.
10) Tentorial angle = angle between lines 15 and 6.
11) Basal angle = angle between line 3 and a line extending along the anterior cranial fossa from the dorsum sellae.
12) Wackenheim angle = angle between line 3 and a tangent line connecting the posterior aspect of the dens to the caudal point
of the C2 vertebra.
13) Twining’s-tentoral angle = angle between lines 2 and 15.
Soft tissue 14) Tonsillar herniation below foramen magnum [Line 7]. (Distance below line is taken as positive.)
15) Tentorium length = From the internal occipital protuberance to the superior end of the tentorium.
16) Fastigium height = perpendicuar distance between the foramen magnum [Line 7] and the fastigium of the fourth ventricle.
17) Pons height = perpendicular distance between the foramen magnum [Line 7] the superior aspect of the pons at the
invagination before the midbrain.
18) Corpus callosum height = perpendicuar distance between the foramen magnum [Line 7] to the inferior aspect of the
splenium of the corpus callosum.
Areas
19) PCF area = area enclosed by lines 3,7,6,15,8
20) PCF osseous area = area enclosed by lines 3,7,6,2
Volumes
21) PCF volume = volume segmented form the same bounds as 19.
22) Hindbrain volume within the PCF volume [21].
23) CSF volume in PCF [21] = volume 21 minus volume 22.
24) Ratio of hindbrain volume:PCF volume – relative measure of overcrowding [Volumes 22/21].
Figure 1.11 Common morphometric measurements performed in the literature. Numbering scheme used to simplify
summary of study findings in Table 1.1. Measurements are divided into five categories, linear, angular, area, and
volumetric measures of PCF, in addition to measures of soft tissue location.

16 Table 1.1 Summary of morphometric studies. Table contains symbolic representations of the commonly investigated characteristics (for clarity, some insignificant measures or those used in few
studies were neglected). Significant findings are shown as; decrease (↓), increase (↑), no significant difference (NS), and measure not studied (-).Measurement codes corresponded to Figure 1.11.
For studies where Chiari patients both with and without a syrinx were grouped, the proportion of syrinx patients are noted (? Indicates where syrinx patients were included but the number of
patients was not quoted). *Indicates a measurement that was calculated in the original study but can be calculated from the paper. 1Highlights that the study includes 2 subjects with fourth
ventricle herniation which may affected the results. 2Study uses a total 364 Chiari patients in the study but only 50 were used for quantitative analysis.
Study Number of subjects Comparison Linear measures Angular measures Soft tissue measurements Area Volume
1 2 3 4 5 6 7 9 10 11 12 13 14 15 16 17 18 19 20 21 22 23 24
Dagtekin et al. (2011)
Control = 25
Chiari = 15
Syrinx = 9/15
Chiari v.
Control - - NS ↓ ↑ ↓ ↑ - NS - - - - - - NS - - - - - - -
Alperin et al. (2014) Control = 37
Chiari = 36
Chiari v.
Control - ↓ ↓ - - ↓ NS - - - - - - - - - - - - ↓ NS - ↑
Alperin et al. (2015) Control = 37
Chiari = 63
Chiari v.
Control - - ↓ - - ↓ - - - - - - - - - - - - - ↓ NS - ↑
Nishikawa et al.
(1997)
Control = 50
Chiari = 301
Syrinx = 26/30
Chiari v.
Control - - NS - NS ↓ - - - - - ↑ - - - NS - - - NS NS - ↑
Nishikawa et al.
(1997)
Control = 50
Chiari = 301
Syrinx = 26/30
Chiari w/
basilar invagination v.
Control - - ↓ - ↓ ↓ - - - - - ↑ - - - NS - - - NS NS - ↑
Milhorat et al. (1999)
Control = 50
Chiari = 502
Syrinx = ?/50
Chiari v.
Control - - ↓ - - ↓ - - ↑ - - - ↑ - - - - - - ↓ NS ↓ ↑*
Karagoz et al. (2002)
Control = 21
Chiari = 22
Syrinx = 13/22
Chiari v.
Control - ↓ ↓ - - ↓ NS ↑ NS ↑ - ↑ - - - - - NS ↓ - - - -
Sekula et al. (2005) Control = 25
Chiari = 22
Chiari v.
Control - NS ↓ ↓ ↓ NS NS - - - - ↑ - - - NS - - - - - - -
Hwang et al. (2013)
Controls = 24
Chiari = 12
Syrinx = ?/12
Chiari v.
Control - ↓ ↓ - - NS ↓ ↑ ↑ - - - - - - NS - - - - - - -
Urbizu et al. (2014)
Controls = 50
Chiari = 100
Syrinx = 45/100
Chiari v.
Control ↓ NS ↓ NS NS ↓ NS - ↓ ↑ NS - ↑ ↓ ↓ ↓ ↓ ↓ ↓ - - - -
Milhorat et al. (2010) Controls = 80
Chiari = 388
Chiari v.
Control - - ↓ - - ↓ NS - - - - - - - - - - - - ↓ NS - ↑*
Aydin et al. (2005)
Control = 30
Chiari = 60
Syrinx = 46/60
Chiari v.
Control ↓ ↓ ↓ - - NS ↑ - - - - - - - - - - - - - - - -
Dufton et al. (2011) Control = 107
Chiari = 81
Chiari v.
Control - - ↓ - - - ↑ ↑ - - - - ↑ - - - - - - - - - -
Yan et al. (2016) Control = 40
Chiari = 36
Chiari v.
Control - ↓ ↓ - - ↓ NS NS - - - - - - - - - - - - - - -

17
Table 1.1 Continued summary of morphometric studies. Showing the studies that investigated the difference in morphology with sex, and the differences seen in syrinx patients. Significant
findings are shown as; decrease (↓), increase (↑), no significant finding (NS), and measure not studied (-).For studies where Chiari patients both with and without a syrinx were grouped, the
proportion of syrinx patients are noted (? Indicates where syrinx patients were included but the number of patients was not quoted). 3Study reassessed after reducing the data set to control for
age, race and body mass index.
Study Number of
subjects Comparison
Linear measures Angular measures Soft tissue measurements Area Volume
1 2 3 4 5 6 7 9 10 11 12 13 14 15 16 17 18 19 20 21 22 23 24
Schady et al. (1987) Control = 26
Chiari = 13
Male
Chiari v.
Control - NS ↓ - - - NS ↑ - ↑ - - - - - - - - ↓ - - - -
Stovner et al. (1993) Control = 14
Chiari = 11
Male
Chiari v.
Control - NS - - - - - - - - - - - - - - - - NS - - - -
Vega et al. (1990)
Control = 23
Chiari = 25
Syrinx = ?/25
Male
Chiari v.
Control - - ↓ - - - NS ↑ - ↑ - - - - - - - - ↓ ↓ - - -
Houston et al. (2019)
Control = 26
Chiari = 26
Syrinx = 8/26
Male
Chiari v.
Control ↓ ↑ ↓ - - NS NS ↑ ↓ NS ↓ - ↑ NS ↓ ↓ ↓ NS NS - - - -
Schady et al. (1987) Control = 23
Chiari = 19
Female
Chiari v.
Control - NS NS - - - NS ↑ - ↑ - - - - - - - - ↓ - - - -
Stovner et al. (1993) Control = 26
Chiari = 22
Female
Chiari v.
Control - NS - - - - - - - - - - - - - - - - ↓ - - - -
Vega et al. (1990)
Control = 23
Chiari = 17
Syrinx = ?/25
Female
Chiari v.
Control - - ↓ - - - NS ↑ - NS - - - - - - - - ↓ NS - - -
Houston et al. (2019)
Control = 26
Chiari = 26
Syrinx = 6/26
Female
Chiari v.
Control
NS NS ↓ - - NS NS ↑ NS NS ↓ - ↑ NS ↓ ↓ ↓ NS NS - - - -
Houston et al. (2018)
Controls = 131-140
Chiari = 155-162
Syrinx = 28/162
Female
Chiari v.
Control ↓ NS ↓ - - NS ↑ ↑ NS ↑ ↓ - ↑ NS ↓ ↓ ↓ ↓ ↓ - - - -
Houston et al. (2018)3
Controls = 100-108
Chiari = 115-121
Syrinx = 21/121
Female
Chiari v.
Control ↓ NS ↓ - - NS ↑ ↑ NS ↑ ↓ - ↑ NS ↓ ↓ ↓ NS NS - - - -
Eppelheimer et al. (2018) Controls = 140
Syrinx = 38
Syrinx v.
Control NS NS NS - - NS NS NS NS NS NS - NS NS NS ↓ NS ↓ NS - - - -
Yan et al. (2016) Control = 40
Syrinx = 48
Syrinx v.
Control - ↓ ↓ - - ↓ NS ↑ - - - - - - - - - - - - - - -
Eppelheimer et al. (2018) Chiari =198
Syrinx = 38
Syrinx free v.
Syrinx NS NS NS - - NS ↑ NS NS NS NS - NS NS NS NS NS NS NS - - - -
Yan et al. (2016) Chiari = 19
Syrinx = 48
Syrinx free v.
Syrinx - NS NS - - NS NS ↑ - - - - - - - - - - - - - - -

18
Several studies have measured the taper of the spinal canal (change in the anterior-posterior
diameter of the spinal subarachnoid space per vertebrae along the spine) to determine how it
may relate the syrinx formation (Gadde et al., 2017; Hammersley et al., 2012; Hirano et al.,
2012; Struck et al., 2016; Zhu et al., 2014). A common finding is that the diameter of the spinal
canal increases faster between the C4 and C7 vertebrae in syrinx patients compared with
controls and syrinx free Chiari patients (Table 1.2). These studies suggest there may be subtle
differences in the pressure gradients in the cervical spine in Chiari subjects, which could
facilitate syrinx development. Although there is some conflict within the literature, in part this
may be attributed to the small sample of several studies (Gadde et al., 2017; Hammersley et al.,
2012; Hirano et al., 2012). Additionally, as the tapers are defined by the spinal level, differences
in the caudocranial height of the vertebra has been neglected, which may have a significant
effect on the rate of change (and pressure gradients) between subjects. These studies did not
take into account whether there is any variation in the size of the epidural space associated with
different subarachnoid tapers. This could also affect CSF dynamics by causing local changes in
the spinal compliance or by altering the sensitivity to respiratory forces.
Table 1.2 Summary of spinal taper measurements. The table contains a symbolic representation of the studies
findings. Significant findings are shown as; decrease in the anterior-posterior diameter caudally (↓), increase in the
anterior-posterior diameter caudally (↑), no significant difference (NS), and measure not studied (-).
Study Number of subjects Comparison C1-
C4 C4-C7 C1-C7 C1-T1
Gadde et al. (2017) Control = 21
Pre-syrinx = 21
Pre-syrinx v.
Control NS ↑ NS -
Gadde et al. (2017) Chiari = 21
Pre-syrinx = 21
Pre-syrinx v.
Chiari NS NS NS -
Hammersley et al. (2012) Chiari with scoliosis = 2
Syrinx with scoliosis = 20
Chiari with scoliosis v.
Syrinx with scoliosis NS - NS -
Thompson et al. (2016) Chiari = 101
Syrinx = 49
Syrinx v.
Chiari NS ↑ ↓ -
Struck et al. (2016) Control = 50
Idiopathic syrinx = 50
Idiopathic syrinx v.
Control NS NS NS -
Zhu et al. (2014) Syrinx distended = 44
Syrinx not distended = 33
Syrinx distended v.
Syrinx not distended ↓ ↑ ↓ -
Hirano et al. (2012) Control = 9
Chiari = 9
Chiari v.
Control - - - NS
Hirano et al. (2012) Control = 12
Syrinx = 12
Syrinx v.
Control - - - ↑
Hirano et al. (2012) Syrinx = 7
Idiopathic syrinx = 7
Idiopathic syrinx v.
Control - - NS
The effect of Chiari on CSF flow
Early cardiac-gated phase-contrast MRI (PC-MRI) studies were conducted in the midsagittal
plane, finding reduced CSF flow at the level of the foramen magnum (Armonda et al., 1994;
Ellenbogen et al., 2000), supporting the hypothesis that Chiari malformation restricts CSF flow
(Gardner, 1965; Williams, 1969). Subsequent axial and 4D (flow through a volume over time)
PC-MRI scans have since demonstrated that although flow though the anterior CSF space may
be restricted, high velocity jets are commonly found in the anterolateral spaces (Bunck et al.,
2012; Bunck et al., 2011; Haughton et al., 2003; Iskandar et al., 2004; Quigley et al., 2004).

19
Other abnormal features of CSF flow have been identified in Chiari patients, however the
majority of studies have grouped patients both with and without a syrinx, removing the
possibility of identifying differences related to syrinx formation (Haughton et al., 2003;
Hofmann et al., 2000; Iskandar et al., 2004; Quigley et al., 2004). The findings of the few
studies which have investigated the difference in CSF flow between the two patient groups are
summarized in Table 1.3. Figure 1.12 shows a typical cardiac CSF pulse annotated with the
characteristics investigated. In general, Chiari patients without a syrinx have been shown to
have increased peak caudal velocities, which occur earlier in the cardiac cycle compared with
controls, whereas patients with a syrinx have normal peak velocities, with delays in timing
features when compared with both controls and syrinx free patients (Table 1.3). However, there
is disagreement as to whether syrinx subjects have normal or increased peak velocities (Table
1.3).
Table 1.3 Summary of the magnitude and timing features of CSF flow in Chiari patients both with and without a
syrinx present. Features of interest are annotated on Figure 1.12. Significant findings are shown as; decrease (↓),
increase (↑), no significant difference (NS), and measure not studied (-). Table divided into comparisons between the
three different subject groups.
Study
Peak
cranial
velocity
Peak
caudal
velocity
Time of
cranial
peak
Time of
caudal
peak
Time of
cranial
onset
Time of
caudal
onset
Caudal
flow
duration
Ch
iari
v.
Co
ntr
ol
Pinna et al.
(2000) - - - - - - NS
Bunck et
al. (2012) ↑ ↑ - NS - - NS
Clarke et
al. (2013b) NS ↑ NS ↓ NS ↓ NS
Sy
rin
x v
.
Co
ntr
ol
Pinna et al.
(2000) - - - - - - NS
Bunck et
al. (2012) ↑ ↑ - ↑ - - NS
Clarke et
al. (2013b) NS NS ↑ NS NS ↑ NS
Ch
iari
v.
Sy
rin
x
Pinna et al.
(2000) - - - - - - ↓
Bunck et
al. (2012) NS NS - ↓ - - NS
Clarke et
al. (2013b) NS ↑ NS ↓ ↓ ↓ NS

20
Figure 1.12 Example cardiac CSF pulse from a control. Showing annotations for characteristics of the velocity-time
profile used for analysis. Image edited and reproduced from Clarke et al. (2013b).
Overall, exceptionally high CSF velocities (4.9-37.9 cm.s-1) were found by Bunck et al. (2012)
compared with conventional 2D flow studies (~4-10 cm.s-1) (Clarke et al., 2013b; Haughton et
al., 2003; Iskandar et al., 2004), suggesting that the limited field of view of 2D imaging is prone
to missing key flow features. However, from the circular flow jets shown in the example images
provided (Figure 1.13), it is unclear whether the region of interest used to quantify flow
excluded the blood vessels such as the anterior epidural veins (Groen et al., 1997). Failing to do
so could account for the large discrepancy in the measured velocities and explain why the
greatest velocities were measured at C1, instead of near the constriction at the foramen magnum
as expected.
Figure 1.13 Examples of flow jets and recirculation patterns in Chiari patients from Bunck et al. (2012). A) shows
velocity vectors on the coronal plane, b) shows axial slice in same subject at obstruction (approx. C1), highlighting
dark circular jets. D) shows another patient example in coronal plane, with corresponding axial view C). High
velocity jets had aliasing errors and were interpreted as CSF jets, however this is unclear and they may be blood
vessels. Reproduced from Bunk et al.,European Radiology,2012, 22:1860-70 with permissions from Springer Nature.
21
Bhadelia et al. (2016) used real-time pencil beam imaging to investigate the effect of coughing
on CSF flow in Chiari patients. This imaging technique measures the through plane velocity at
axial cross-sections along the length of a cylindrical volume. While scanning, participants
would breathe normally for approximately 20 seconds, followed by six forceful coughs, then
return to normal breathing. With this protocol, it was demonstrated that the CSF pulse
amplitude was decreased post-cough in Chiari patients compared with controls (Bhadelia et al.,
2016). Similarly, it was shown that in Chiari patients with headache associated symptoms, there
was a greater decrease in the stroke volume (net volume of CSF displaced per cardiac beat)
post-cough compared with patients without specific symptoms (Bezuidenhout et al., 2018).
These findings were interpreted to support Williams (1969) mechanism of pressure dissociation
(Figure 1.9), suggesting that post-cough the cerebellar tonsils would move and obstruct CSF
flow, although this valving motion was not explicitly demonstrated in the study. There may be
other factors which could contribute to this behaviour, such as the increased duration of
inspiration post-cough shown in the example case provided by Bhadelia et al. (2016).
Additionally, after the release of sustained elevated trunk pressures (i.e. persistent coughing or
straining) there are changes in heart rate and mean blood pressure which may be confounding
factors (Dawson et al., 1999; Korner et al., 1976), particularly as the CSF pulse amplitudes are
not comparable between groups during coughing, which may suggest different strength
expiratory efforts, and could have contributed to the differences found in the post-cough CSF
flow (Bezuidenhout et al., 2018). Whether these cough-dependent changes in CSF flow
contribute to syrinx development has not been assessed.
The purpose and reliability of computational modelling
Computational models are used to examine physical phenomena which could play a role in
syrinx development. This can be achieved by either using idealised models to illustrate new
mechanisms, or subject-specific models which can provide additional information that current
imaging techniques cannot. Models investigating aspects of normal CSF dynamics are
summarised in Table 1.4 and models studying the influence of pathology are summarised in
Table 1.5.

22 Table 1.4 Summary of computational models investigating characteristics of normal CSF dynamics.
Study Numerical
method Anatomy Boundary inputs Validation Focus of Investigation Outcome Limitations Sweetman and
Linninger
(2011) Finite
element Semi-
idealised Cardiac displacements applied to lateral ventricles and circle
of Willis Model agrees with
MR flow at two
locations How cranial pulsations drive
CSF flow Estimate of pressures and flows
Indication of increased mixing with
flow transition from cranial to caudal flow
-
Tangen et al.
(2015) Finite
Volume Subject-
specific Cardiac displacements applied to brain surface, choroid plexus
and lower spine Model agrees with MR flow at three
locations How nerve roots and
arachnoid web influence flow Nerve roots and web increase fluid
recirculation Web density can increase flow
resistance
Arachnoid web assumed to be rigid
cylinders. Potentially over-estimating
there resistance to flow and on mixing.
Gupta et al.
(2009) Finite
Volume Subject-
specific MR acquired CSF flows
applied to inlets Comparisons to
literature values Determine flow path in
cranial and cervical junction Determine influence of
arachnoid web
Estimates of flow paths and CSF
mixing Arachnoid density increases pressures
required for a given flow
Arachnoid web assumed to be rigid cylinders and applied as a porous
resistance. Likely over estimating there resistance and neglecting any
dynamic effect. Gupta et al.
(2010)
Sass et al. (2017)
Finite Volume
Subject-specific
Highest CSF flow rate in
cervical region applied to
foramen magnum Model over-
estimates flow
rates Determine the influence of
anatomical nerve roots List hydrodynamic factors of the
model. N=1. No comparisons made to model
without nerve roots so effects cannot
be assessed Pahlavian et
al. (2014) Finite
Volume Subject-
specific Highest CSF flow rate in
cervical region applied to foramen magnum
Poor matching
with 4D MRI data Determine whether addition
of nerve roots would fix
discrepancy between models
and MR
Insignificant effect on pressures. Introduce flow jets.
Introduced recirculation during flow
reversal.
Large differences between MR and
model geometries, causing validity problems
Yiallourou et
al. (2012) Finite
Volume Subject-
specific Highest CSF flow rate in
cervical region applied to foramen magnum
Poor matching
with 4D MRI data Reliability study into CFD
model Poor agreement between models and
MR. Attributed to lack spinal structures
Large differences between MR and
model geometries, causing validity problems
Khani et al. (2017)
Finite Volume
Subject-specific
0 Pa outlet and dura mater was
displaced to fit a approximated volume change measured by
MRI flow data
Good matching
between model
and MR data New method to accurately
model CSF velocity’s Model could match average flow
profiles well, although there are still local decencies likely due to nerve
roots and web
Model applies an unphysiological motion to the dura. Forcing the
correct velocities independent of the
geometry. No pressure data. reported
Loth et al.
(2001) Finite
Volume Semi-
idealised MR acquired CSF flows
applied to inlet
Comparison to
literature values
and qualitative assessment of
PCMRI
Characterise dynamic within
the spinal canal Flow inertia dominated.
Eccentricity of the cord has little
effect on pressure by influence local
flow field -
Khani et al.
(2018) Finite
Volume Subject-
specific 0 Pa outlet and dura mater was displaced to fit a approximated
volume change measured by
MRI flow data
Good forced agreement
between model
and MR Determine the effects nerve
roots on CSF flow
Nerve roots create flow jets and
increase local mixing during flow
reversal. Fine obstructions increase the effect
of steady streaming See Khani et al. (2017)

23
Table 1.4 Summary of computational models investigating characteristics of normal CSF dynamics continued.
Study Numerical
method Anatomy Boundary inputs Validation Focus of Investigation Outcome Limitations
Cheng et al. (2014)
Finite Volume
Subject-specific
MR acquired CSF flows applied to inlet
Good agreement at T2 level
Determine the effect of cord motion
Cord motion could change local
velocity field based on eccentricity. Negligible effect on the CSF
pressures
Excluded fine structures from
subarachnoid which could influence
cord motion. Stockman
(2005) Lattice
Boltzmann Idealised CSF flow from literature
applied to inlet Comparison to
literature values Influence of fine structures
on flow Introduction of fine structures has a negligible effect on average flow. Increase in plane velocities and
mixing
Fine structures assumed to be rigid cylinders, likely overestimating there
resistance and neglecting any dynamic
effect. Stockman (2007)
Sánchez et al.
(2018) Analytical Idealised CSF flow from literature
applied to inlet Comparison to
literature and
mechanical model Influence of eccentricity on
bulk flow. Cumulative effects of convective
acceleration can result in a creeping
flow when the cord is eccentric.
Creeping velocity is likely negligible compared with psychological changes
in net flow. Fine structures and changes in spine
curvature will significantly affect this
as a mechanism for bulk flow.
Kuttler et al.
(2010) Finite
Volume Semi-
idealised
Literature based cardiac flow
rate applied to cranial inlet. Lower spine has a moving
boundary to simulate
respiratory compression
Comparison to
literature Influence of oscillatory flow
on drug circulation
Input condition result in a non-zero
mean velocity in spinal canal. CSF pulsation play a larger role in
solute transport then injection
method
Fluid transport under CSF pulsation
not actually calculated. Solute flow calculated based on time averaged CSF flow. Abstract results,
cannot be directly compared with.
Martin et al.
(2016) Finite
Volume Subject-
specific Highest CSF flow rate in
cervical region applied to
foramen magnum None
To assess the significance of
inter-operator variability
when generating subject-specific models
CSF velocities and pressures
relatively insensitive to small errors
in the volume of the subarachnoid space
No validation was conducted. There is
good agreement between operators, but
with no in vivo comparison, the
operator’s performance cannot be
assessed.
Cheng et al.
(2012) Finite
Volume Subject-
specific MR acquired CSF flows
applied to inlet Model agrees with
MR flow at two locations
Determine how arachnoiditis
and it permeability effect CSF dynamics.
Model demonstrated that
arachnoiditis increases resistance to
flow, increasing the magnitude and introducing timing delays in CSF
pressure. Also introduces complex flow patterns, i.e. anterior-posterior
bidirectional flow.
Yeo et al. (2017) found peak CSF flow to occur earlier compared with control
in a larger cohort of PTS syrinx
patients. Suggesting that modelling arachnoiditis a porous obstruction,
does not accurately capture it effects
on CSF dynamics.

24 Table 1.5 Summary of computational models investigating the effect of pathology on CSF dynamics.
Study Numerical
method Anatomy Boundary inputs Validation Focus of Investigation Outcome Limitations
Cirovic (2009) Analytical Idealised Harmonic waves assumed Compared with waves speeds
calculated in
Bertram et al. (2005)
Influence of geometry and
material properties on wave
propagation Syrinx growth slows wave
propagation in the spinal cord and
increases radial pulsation
Governing equations are simplified assuming that the wave amplitudes
are small. i.e. CSF velocity << pulse
speed With respiratory driven CSF flow
this may not be true, and the non-
linear convective term cannot be
neglected.
Cirovic and Kim (2012) Analytical Idealised
1) Cranial 100 Pa and 2)
caudal 10 kPa Half sine pulses at 100Hz.
Verified against literature values of
wave speed
(models and in vivo)
To Assess whether 1D
models can be used in place
of finite element. Characterise wave
propagation and influence of
a syrinx
Syrinx growth slows wave
propagation in the spinal cord and
increases radial pulsation
Model assumes small deformations.
In the lumbar and sacral spine with respiration this assumption does not
hold true (Martins et al., 1972)
Linge et al. (2010) Finite Volume
Semi-idealised
Sinusoid applied to the
craniocervical junction. Caudal
peak velocity ≈ 2 cm.s-1
Flow field qualitatively
compared with in
vivo data by a
neuroradiologist
To provide a proof of concept generalised spinal
model for future assessment
of pathological changes in
geometry - -
Linge et al. (2011) Finite
Volume Semi-
idealised Same as Linge et al. (2010) Same as Linge et
al. (2010) Determine the effect of
extending the tonsils
caudally on CSF dynamics
Creates more complex flow fields
(i.e. flow jets and bidirectional
flow) and increases the pressure gradient
Only tested one herniated state.
Unknown how gradual progression
from normal levels of herniation to pathological effects CSF dynamics.
Linge et al. (2013) Finite Volume
Semi-idealised
Asymmetric waveform. F= 80
& 120 bpm. For slower heart rate caudal velocity 2x greater
than cranial, and diastolic phase 2x longer than systole.
Fast heart rate becomes
symmetric.
Same as Linge et al. (2010)
Determine the effect of
elevated heart rate on CSF dynamics
Creates more complex flow fields
(i.e. flow jets and bidirectional flow) and increases the pressure
gradient
Increased cranial velocity with higher
heart rate unsupported and unlikely to occur in vivo. This will affect the
pressure gradients reported
Linge et al. (2014) Finite
Volume Semi-
idealised Same as 80 bpm case from
Linge et al. (2013) None To assess how different level
of posterior fossa
decompression affect CSF
dynamics
All levels of decompression reduced CSF velocities and flow
complexity, and the pressures
returned to normal levels
Post decompression treated as rigid,
ignoring the effects of a duraplasty. Tonsils do not ascend in post-
decompression as expected. Both
factors may have an effect on the CSF dynamics.

25
Table 1.5 Summary of computational models investigating the effect of pathology on CSF dynamics continued.
Study Numerical
method Anatomy Boundary inputs Validation Focus of Investigation Outcome Limitations
Clarke et al. (2013a)
Finite Volume
Subject-specific
MR acquired CSF flows applied to inlet
Model agrees with
MR flow at two
locations Determine the effects of
Chiari and syringomyelia on
the CSF pressure profile
Peak pressures occurred earlier and would be elevated in the Chiari
subject. The syrinx delayed the pressure pulse and reduced it amplitude
A single subject was used for each
group and may not represent the wider
population.
Martin et al.
(2013) Finite
Volume Subject-
specific MR acquired CSF flows
applied to inlet Compared with
unvalidated models To determine an appropriate parameter for diagnose and
surgical assessment
Pressure gradient and CSF impedance greater in Chiari
subjects. Surgery reduced these parameters to
a varying degree, still elevated
compared with controls
2 Chiari and 1 control subject used. As
such results may not be representative.
Shaffer et al. (2014)
Finite Volume
Subject-specific
MR acquired CSF flows applied to inlet None
To assess the CSF impedance
as an indicator for Chiari
symptomology
Tonsillar herniation is a poor
indicator for CSF impedance. Impedance is greater in Chiari
subjects although there is overlap
and no difference between asymptomatic and symptomatic
patients.
Hydraulic impedance was the only
measure assessed, which can be biased by the assumptions behind its
calculation. Other factors relating to
the CSF velocity and pressure waveforms may be related to tonsillar
herniation.
Pahlavian et al. (2015)
Finite Volume
Subject-specific
MR acquired CSF flows applied to inlet None
To assess the importance of
tonsillar pulsation in subject-
specific modelling Tonsillar pulsation results in small
changes in CSF pressure close to the
foramen magnum
N=1, with mild herniation, so may not
characterise the effect of more severe
Chiari. However, tonsillar pulsation is unlikely to have a dominating effect
over the pulsation of the whole brain
in the cranium.
Cheng et al.
(2012) Finite
Volume Subject-
specific MR acquired CSF flows
applied to inlet Model agrees with
MR flow at two
locations Determine how arachnoiditis
and it permeability effect
CSF dynamics.
Model demonstrated that
arachnoiditis increases resistance to flow, increasing the magnitude and
introducing timing delays in CSF
pressure. Also introduces complex flow
patterns i.e. anterior-posterior
bidirectional flow.
Yeo et al. (2017) found peak CSF
flow to occur earlier compared with
control in a larger cohort of PTS syrinx patients. Suggesting that
modelling arachnoiditis a porous
obstruction, may not accurately capture it effects on CSF dynamics.
Roldan et al.
(2009) Boundary
Element Subject-
specific
MR acquired CSF flows applied to inlet and 0 Pa at
outlet during systole. Boundary
conditions flipped during
diastole Same volume flow rate for
Chiari and control.
Flow field qualitatively
compared with in
vivo data
To use subject models to
characterise the effect of
Chiari on CSF dynamics
Given the same volume flow rate, the reduction in area caused by
Chiari increases CSF pressures and
velocity.
Poor age and sex matched subject leading to the models being scaled for
comparison, which may introduce
error. Boundary conditions assigned for
diastole are unphysiological. BEM neglects fluid inertia.

26 Table 1.5 Summary of computational models investigating the effect of pathology on CSF dynamics continued.
Study Numerical
method Anatomy Boundary inputs Validation Focus of Investigation Outcome Limitations
Rutkowska et
al. (2012) Finite
Element Subject-
specific Same time varying pressure
gradient applied to all model.
(Not explicitly shown in paper)
Model and MR
peak velocities
show good agreement
To use a cohort of subject
specific models to
characterise the effects of Chiari on CSF dynamics
CSF velocities are greater in Chiari subjects. At the level of the foramen
magnum pressures are elevated in
Chari subjects. Posterior fossa decompression normalised CSF
pressure.
Use of predefined pressure difference
instead of measured CSF velocities
for the boundary conditions, may result in spurious results.
Stoverud et al. (2013)
Finite Element Idealised
Inlet and outlets assigned a
velocity, either constant or
sinusoidal. None
A parametric study investigating the relationship
between pressure drop,
velocity and the severity of a subarachnoid obstruction.
Increasing the level of obstruction
increases the pressure gradient across the obstruction and
introduced a timing delay. -
Stoverud et al. (2016)
Finite Element
Subject-specific
MR acquired CSF flows applied to inlet None
To see the effect of Chiari on CSF dynamics in both the
cervical subarachnoid space
and within the CSF spaces of the posterior fossa.
Chiari subjects were found to have increased pressures and velocities in
both the fossa and spinal canal. Chiari was found to delay the CSF
pulse.
Inlet boundary conditions have been
shifted from timings present in raw
data (To potentially fix timing difference of triggering signal i.e.
PPU vs ECG). Therefore, findings of
phase difference are unreliable. Some inlet flow were estimated,
causing potential errors in the velocity
and pressure magnitudes.
Bertram et al.
(2005) Finite
Element Idealised 100 Pa half sine pulse at 2.5
and 5 Hz and a triangle wave at
20, and 200 Hz, applied to the cranial inlet.
None To determine the effects of
changing the properties of the
dura, spinal cord and central canal on the wave speed.
Increasing rigidity of dura and cord, increase wave speed. Inclusion of
central canal had little effect on the
wave speed. Travelling waves dissipate along
spinal canal, elastic jump unlikely.
-
Bertram et al. (2008)
Finite Element Idealised 100 Pa triangle wave at 200 Hz
applied to the cranial inlet. None To assess the effect of
arachnoid scaring (radial cord tethering) on CSF pressure
and cord stress.
Dura-cord tethers increase radial
tension within the cord. Making the
spinal cord pressure more negative.
Increased dural stiffness increased this effect.
Model focuses on the effects in the spinal cord. The stress created by the
tethers are low and unlikely to
damage cord tissue. Effects on CSF dynamics not properly assessed.
Artificially stiff region of cord to
make tethers stable, will influence wave propagation and cord stress.

27
Table 1.5 Summary of computational models investigating the effect of pathology on CSF dynamics continued.
Study Numerical
method Anatomy Boundary inputs Validation Focus of Investigation Outcome Limitations
Bertram (2009)
Finite Element Idealised 100 Pa triangle wave at 200 Hz
applied to the cranial inlet. Verified against
wave speeds calculated from
MRI and models.
To determine the effect of a
syrinx on wave propagation
and assess the feasibility increased syrinx fluid
momentum dissecting the
cord (‘slosh’).
Syrinx introduces wave reflections and slows forward travelling
waves. Momentum generated in the
syrinx unlikely to expand the cavity.
Crude geometry likely exaggerated the magnitude of wave refection
created by a syrinx. These reflections
intern effect the relative velocity of the syrinx.
Bertram
(2010) Finite
Element Idealised
100 Pa triangle wave at 200 Hz
or a 1000 Pa sine2 wave at
2.5Hz. Either applied to the cranial inlet or at lumbar
region to external dural
surface.
None To assess whether the
addition of a stenosis is
likely to increase the syrinx
‘slosh’.
Increased restriction of the stenosis
created pressure gradients in the subarachnoid along the length of
the syrinx. This did not
significantly contribute to syrinx ‘slosh’.
-
Bertram and Heil (2016)
Finite Element Idealised 500 Pa sine wave at 2.5 Hz at
cranial inlet None To determine the effect a
stenosis would have on flow
into and through a syrinx,
accounting for the porosity of the cord.
The stenosis creates pressure
gradients which recirculating flow from subarachnoid into the syrinx
cavity. Slowly changing the
cavities volume. Suggesting this mechanism does not require
perivascular spaces.
Mechanism requires a cavity, and is sensitive to its location to the
stenosis. Also requires a significant
occlusion. Assumes flow through a permeable tissue, the perivascular
spaces not the extracellular spaces
would be the least resistive component.
Heil and
Bertram (2016)
Elliott et al. (2017) Analytical Idealised Harmonic waves assumed
Verified against
literature values of wave speed (in
vivo data)
Effect of material properties of the spinal canal, degree of
subarachnoid obstruction,
and syrinx size on the wave propagation.
With a syrinx and obstruction,
syrinx fluid and the cord move out of phase. Suggesting slosh could
play a role in syrinx progression.
Interpretation of difference in in vivo
wave speed in relation to validation and overall model behaviour may be
incorrect. Pathology may contribute
to the higher wave speed in Williams (1976), however coughing also
changes spinal compliance and
therefore wave speed. So this may still be within the range of normal
controls.

28
Idealised modelling
Idealised models make assumptions that simplify the biomechanics being modelled. These
simplifications reduce the complexity of the problem, making it easier to identify how
parametric changes (assumed effects of the pathology) alter the model outputs (characteristics of
CSF dynamics, for example velocity, pressure, wave speed etc.). Typical approaches are to
either treat the subarachnoid space as a series of resistances and capacitances (lumped
parameter/zero-dimensional modelling) (Chang and Nakagawa, 2003, 2004; Elliott et al., 2011),
or reduce the spinal canal to a series of flexible/rigid axisymmetric coaxial tubes (one-
dimensional modelling) (Berkouk et al., 2003; Carpenter et al., 2003; Cirovic, 2009; Cirovic
and Kim, 2012; Elliott et al., 2009; Elliott et al., 2017; Toro et al., 2018). The main aim of these
models has been to identify how changes to the material properties and compliance of the spinal
canal affects wave propagation.
Coaxial models of the spinal canal have been used to characterise how pressure pulses would
propagate along the spinal subarachnoid space, identifying four distinct wave modes. One of the
slower waves causes the dura to distend and compresses the spinal cord, contributing the most
to the longitudinal motion of the cord. The next fastest wave, results in the compression of both
the cord and dura with little influence on the axial motion of the cord. The fastest wave mode is
primarily associated with the longitudinal displacement of the dura mater, with negligible effect
on the cord or CSF flow. The slowest wave mode acts similar to the second mode in the radial
direction, although this mode is dependent on a patent central canal which is uncommon in
healthy adults (Milhorat et al., 1994) with a syrinx it becomes more dominant (Bertram, 2009;
Cirovic, 2009; Cirovic and Kim, 2012). These travelling waves will reflect at boundaries (i.e.
foramen magnum and lumbar cistern), and at discontinuities in the stiffness of tissues. The
interaction of these travelling and reflected waves may stress tissues and locally increase the
CSF pressures, which could influence syrinx formation. Additionally, these models have
demonstrated reductions in the relative size of the subarachnoid space increases the wave speed,
whereas the presence of a syrinx causes a reduction (Bertram, 2009; Cirovic, 2009; Cirovic and
Kim, 2012), which may inform our understanding of how pathology influences the
characteristic differences in the timing and magnitude of CSF pulses (Clarke et al., 2013b; Yeo
et al., 2017).
Typically, the pulse wave velocity of an idealised model is compared with MRI measurements
(Greitz et al., 1999; Kalata et al., 2009) to demonstrate the behaviour of the model is
representative of in vivo conditions (Tables 1.4 and 1.5), however this may not be a valid
approach. The compliance of the spinal canal is in part dependent on the pressure acting on the
external surface of the dura mater. Since the extradural pressure varies with respiration, the
compliance of the spinal canal, and the pulse wave velocity will also vary (Usubiaga et al.,
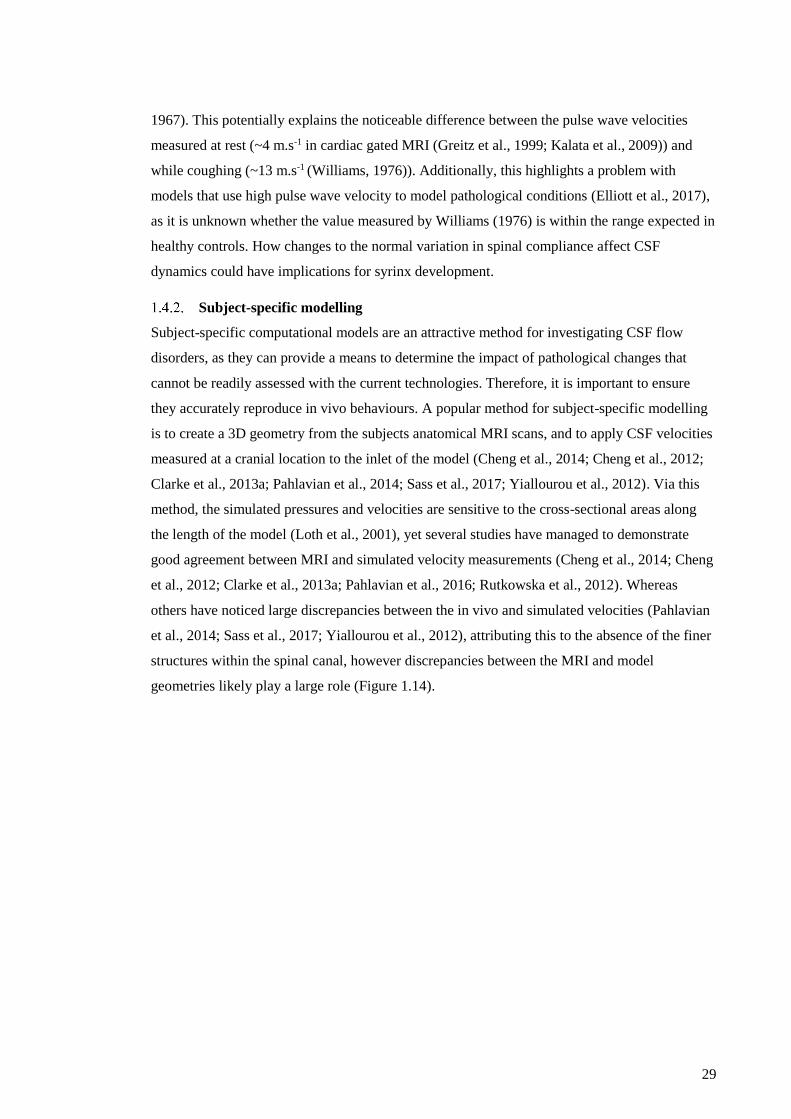
29
1967). This potentially explains the noticeable difference between the pulse wave velocities
measured at rest (~4 m.s-1 in cardiac gated MRI (Greitz et al., 1999; Kalata et al., 2009)) and
while coughing (~13 m.s-1 (Williams, 1976)). Additionally, this highlights a problem with
models that use high pulse wave velocity to model pathological conditions (Elliott et al., 2017),
as it is unknown whether the value measured by Williams (1976) is within the range expected in
healthy controls. How changes to the normal variation in spinal compliance affect CSF
dynamics could have implications for syrinx development.
Subject-specific modelling
Subject-specific computational models are an attractive method for investigating CSF flow
disorders, as they can provide a means to determine the impact of pathological changes that
cannot be readily assessed with the current technologies. Therefore, it is important to ensure
they accurately reproduce in vivo behaviours. A popular method for subject-specific modelling
is to create a 3D geometry from the subjects anatomical MRI scans, and to apply CSF velocities
measured at a cranial location to the inlet of the model (Cheng et al., 2014; Cheng et al., 2012;
Clarke et al., 2013a; Pahlavian et al., 2014; Sass et al., 2017; Yiallourou et al., 2012). Via this
method, the simulated pressures and velocities are sensitive to the cross-sectional areas along
the length of the model (Loth et al., 2001), yet several studies have managed to demonstrate
good agreement between MRI and simulated velocity measurements (Cheng et al., 2014; Cheng
et al., 2012; Clarke et al., 2013a; Pahlavian et al., 2016; Rutkowska et al., 2012). Whereas
others have noticed large discrepancies between the in vivo and simulated velocities (Pahlavian
et al., 2014; Sass et al., 2017; Yiallourou et al., 2012), attributing this to the absence of the finer
structures within the spinal canal, however discrepancies between the MRI and model
geometries likely play a large role (Figure 1.14).

30
Figure 1.14 A) Example of poor agreement between CFD and MRI , highlighing poor agreement between velocities
and differences in cross-sectional area (Yiallourou et al., 2012), Left – control model, Right – Chiari model. B)
Example of good agreement between CFD and MRI, highlighting good matching between the cross-sectional areas
(Pahlavian et al., 2016).
As an alternative to using MRI flow data as an input condition, other researchers have opted to
actively drive CSF flow. Sweetman and Linninger (2011) and Tangen et al. (2015) aimed to
drive CSF flow by simulating the volume change of the brain during perfusion, by assigning a
displacement to the pial surfaces of the brain, based on a cerebral blood flow waveform scaled
to match the volume change expected in a caudal location. This approach demonstrated good
agreement between MRI and simulated velocities. Recently, Khani et al. (2017) demonstrated
that by applying non-uniform displacements to the surface of the dura mater, a low level of error
can be seen in the calculated velocities. However, there are significant issues with this approach,
limiting its application and wider use. Firstly, the method changes the volume of the model to
match the measured change in volume (the integrated difference between flow rates at two
locations; ∆𝑉 = (𝑄2 − 𝑄1) × ∆𝑡), which forces the model to match the measured MRI
velocities. Thus, with this method good agreement between the velocities could be achieved
even with an incorrect geometry of the subarachnoid space, however the CSF pressures and
streamlines are likely to be inaccurate. Additionally, this applied motion does not agree with the
known drivers of cardiac CSF flow (Alperin et al., 2005a; Alperin et al., 2005b; Henry–Feugeas
et al., 2000).
The importance of subarachnoid structures on CSF flow
Subject-specific models generally neglect various subarachnoid space structures, to make
analysis simpler and streamline the workflow to reduce the time needed to simulate large
A B

31
subject cohorts. Therefore, it is important to understand how these structures affect CSF flow,
and that their exclusion will not introduce significant error into a simulation.
In a rigid boundary model Loth et al. (2001) demonstrated that the relative position of the spinal
cord could cause significant changes to the local flow field, but the CSF pressures were
unaffected. In reality the cord is compliant (Bilston and Thibault, 1995) and some interaction
between the CSF flow and cord deflection may be expected. Using a fluid-structure-interaction
(FSI) model of the cervical spine in a healthy control, Cheng et al. (2014) showed that a non-
uniform flow field about the cord would induce small displacements (~2 mm), which further
disturbed the local flow field, however similar to the rigid model this did not significantly
change the subarachnoid pressures (< 1 Pa absolute change; ~1.3% change).
The influence of nerve roots and denticulate ligaments (a caudocranially-orientated thick
collagen membrane which extends from the pia to the dura, providing support to the spinal cord
(Weller, 2005)) on flow has been assessed with varying levels of complexity (e.g. tubes, sheets,
aerofoils or anatomical structures based on cadaver studies; Figure 1.15) (Khani et al., 2018;
Pahlavian et al., 2014; Sass et al., 2017; Stockman, 2005; Tangen et al., 2015). The inclusion of
these structures has been shown to alter the local flow field, potentially creating jets between the
nerve bundles increasing local velocity peaks (~ 2 cm.s-1 increase) (Khani et al., 2018;
Pahlavian et al., 2014), and during flow reversal (caudal to cranial or vice versa) the obstruction
can create recirculation zones that increase local mixing of CSF (Khani et al., 2018; Pahlavian
et al., 2014; Tangen et al., 2015). However, the inclusion of the nerve roots and denticulate
ligaments has been shown to have little effect on the average flow profile (Stockman, 2005) and
subarachnoid pressure (< 10 Pa increase; < 15% increase in peak pressure drop along the spine)
(Pahlavian et al., 2014).
Figure 1.15 Example of the different methods used to model the effects of nerver roots and denticulate ligaments on
CSF flow (Pahlavian et al., 2014; Sass et al., 2017; Stockman, 2005). Left: Reproduced from Stockman, Journal of
Biomechanical Engineering, 2005, 128:106-114 with permission from ASME.
The arachnoid web is distributed throughout the subarachnoid space (Cloyd and Low, 1974;
Nicholas and Weller, 1988; Weller, 2005), and its influence on CSF flow has typically been
modelled as a simplified uniform or random array of fine tubes, with diameters ranging from
30-137 µm (Gupta et al., 2009; Stockman, 2005). CSF flows radially and circumferentially
about these obstructions, altering the local flow field and increasing fluid mixing (Figure 1.16),

32
however as the arachnoid web occupies a small volume fraction of the subarachnoid space, the
average caudocranial flow is unchanged (Stockman, 2005, 2007; Tangen et al., 2015).
Modelling the arachnoid web as rigid inclusions has suggested that the web may increase
resistance to flow, meaning a larger pressure is required to achieve the same flow rate, and if the
arachnoid is neglected the simulated pressures would likely underestimate in vivo conditions
(Gupta et al., 2009; Tangen et al., 2015). However, the arachnoid web is a compliant structure
(Mortazavi et al., 2018), so the rigid approximation likely overestimates the resistance to flow,
and underestimates CSF mixing, as a flexible structure will create more complex flows due to
the two-way interaction between tissue displacement and CSF flow (Balint and Lucey, 2005;
Cheng et al., 2014; Hübner et al., 2004).
Figure 1.16 The effects of arachnoid trabeculae of CSF flow and fluid mixing. A) Flow profile at different times in
the oscillatory cycle [s] and different mean velocities [cm.s-1] (grey scale dark-low to light-high) (Stockman, 2005).
B) Dispersion of a line of tracer introducing into the spinal canal, Left – model with trabeculae causing rapid
dispersion of the tracer, Right – model with no structures within the spinal canal, oscillations cause some dispersion
however bolus is still well defined (Stockman, 2007). A) Reproduced from Stockman, Journal of Biomechanical
Engineering, 2005, 128:106-114 with permission from ASME. B) Reproduced from Stockman, Journal of
Biomechanical Engineering, 2007, 129:666-675 with permission from ASME.
These studies suggest that the structures within the subarachnoid space primarily affect the local
flow field, increasing fluid mixing, and do not have a significant effect on the simulated
pressures. As such, these structures can generally be neglected, unless they contribute to the
pathology being studied (i.e. arachnoid scarring, tethering, or local compressions) (Bertram et
al., 2008; Cheng et al., 2012), or the model aims to investigate the effects of CSF mixing on
drug dispersion (Khani et al., 2018; Kuttler et al., 2010; Sánchez et al., 2018). Provided a
reliable method is used to quantify the volume of the subarachnoid space, a subject-specific
model consisting of just the CSF space, treating the dura mater and spinal cord as rigid
boundaries may accurately reproduce in vivo cardiac driven CSF flow (Cheng et al., 2014;
Cheng et al., 2012; Clarke et al., 2013a; Pahlavian et al., 2016; Rutkowska et al., 2012).
Mechanism for syrinx development: Engineering studies
The tonsillar piston
Although supporting evidence is lacking, the hypothesis that the pulsation of the cerebellar
tonsils actively drives CSF from the subarachnoid space into the spinal cord (Figure 1.10B) is
still discussed widely by clinicians (Heiss et al., 2018). Pahlavian et al. (2015) used a subject-
specific model to simulate the effect of tonsillar pulsation. The model showed that tonsillar

33
pulsation locally altered flow at the level of the obstruction, however there was only a small
change in the pressure drop across the craniocervical junction (<10 Pa), approximately four
times smaller than the pressure drop caused by the systolic CSF pulse. This would be expected
as the volume of the upper cervical spinal canal is both smaller and more compliant than the
cranium, therefore pulsations of the cerebellar tonsils would cause a smaller pressure change
compared with the pulsation of the cranial vasculature. The increased pulse pressure in Chiari
subjects (Clarke et al., 2013a) can be, in part, attributed to similar volume of CSF flow being
driven through a foramen magnum with a reduced cross-sectional area (Linge et al., 2011).
Venturi effect and elastic jump
Two mechanisms for syrinx development, the elastic jump and Venturi effect, were derived
from analytical mathematical models but were quickly dismissed. The Venturi effect describes
the process where fluid velocity increases and its pressure decreases through a local
constriction. Greitz (2006) postulated that constrictions in the subarachnoid space (e.g. Chiari
malformation, vertebral fracture or scarring) would cause a localised pressure drop which would
‘suck’ the tissues of the cord and lead to syrinx formation. However, computational (Bertram,
2010) and mechanical models (Martin et al., 2010; Martin and Loth, 2009) of severe
subarachnoid obstructions have failed to demonstrate a significant Venturi effect which could
contribute to syrinx growth.
The elastic jump hypothesis was developed from a simplified model of coaxial tubes (Berkouk
et al., 2003; Carpenter et al., 2003). The model suggested that the leading edge of pressure
waves travelling along the spinal cord would steepen, and when obstructed a reflection would
create transiently elevated pressures within the cord which could damage tissues and cause
syrinx formation (Carpenter et al., 2003). However, this behaviour was highly dependent on the
size of the subarachnoid space, which was subsequently shown to be unrealistically narrow in
the original model. When tested with a more physiologically likely range of subarachnoid
dimensions, it was shown that the spinal canal would have to be several meters long for an
elastic jump to form, and unlikely to contribute to syrinx development (Elliott et al., 2009).
Mechanism for perivascular inflow
Peristalsis
Ligation studies demonstrated that perivascular tracer deposition depends on arterial pulsation,
and it was concluded that the pulsations actively drove flow along the perivascular spaces (Iliff
et al., 2013b; Stoodley et al., 1997). This active mechanism was used to explain how CSF tracer
could flow into a syrinx cavity against its high pressure (Stoodley et al., 1999; Stoodley et al.,
2000). Furthermore, Bilston et al. (2003) suggested that peristaltic waves travelling along the
surface of the arteries could propel fluid along the perivascular space, even against an adverse

34
pressure gradient. However, the wavelength used (≤ 300 µm) to achieve peristalsis is unlikely
to occur in vivo, since the arterial wave speed is greater than 2 m.s-1 (Borlotti et al., 2010;
Gladdish et al., 2005; Hoeks et al., 1999; Wang and Parker, 2004), so for a typical heart rate of
60 bpm the wavelength would be on the order of meters. Wang and Olbricht (2011) attempted
to expand upon this mechanism including a hydraulic resistance to the perivascular space to
account for obstructive material situated within the perivascular space, and such features were
later shown to exist in electron microscopy studies (Lam et al., 2017). However, as the model
used a similarly unrealistic wavelength, it too likely does not realistically represent the
mechanics of perivascular flow.
Asgari et al. (2016) assessed whether arterial pulsation alone could transport fluid through the
perivascular space. Using an axisymmetric model, arterial pulsation was simulated with a
moving boundary at the inner radius of the perivascular space, applying zero volume flux across
the domain. The model showed that arterial expansion would displace a volume of fluid, but
upon relaxation the fluid would return to its initial position, potentially aiding fluid mixing but
unlikely to drive fluid flow in isolation.
Arterial vs subarachnoid space pressure phase differences
Bilston et al. (2010) suggested an alternate mechanism using a realistic wavelength for arterial
pulsation. Based on the magnitude of pulsation seen elsewhere in the body (Millasseau et al.,
2002), the model demonstrated that penetrating arteries could act as a partial valve, expanding
to reduce the perivascular space during systole and relaxing in diastole. This model was used to
demonstrate that timing differences between the onset of the subarachnoid space pressures and
arterial expansion could act to either increase or restrict CSF flow into the spinal cord.
Subsequent imaging (Clarke et al., 2013b; Yeo et al., 2017) and modelling studies (Cheng et al.,
2012; Clarke et al., 2013a; Martin et al., 2010; Stoverud et al., 2013) have shown pathological
conditions to introduce such changes in timing, which would be favourable for syrinx formation
via this mechanism. A parametric analysis with this model showed that if the systolic CSF
pressure was increased and sustained for a longer period while the artery is relaxed fluid uptake
would likely increase (Clarke et al., 2017). Analytical lumped parameter models also
demonstrated that decreases in spinal compliance could cause timing shifts favourable for fluid
accumulation via this mechanism (Elliott et al., 2011; Martin et al., 2012). However, this
mechanism has yet to be demonstrated to occur in vivo. The pulse amplitude of penetrating
vessels remains unknown, although recent measurements of the surface pial arteries in the brain
have shown the pulse amplitude to be less than 1% of the initial diameter (Mestre et al., 2018),
making it unclear whether there would sufficient motion to form a valving mechanism.

35
Summary
Chiari malformation remains poorly understood, with many of the clinically accepted
mechanisms for syrinx development such as the ‘tonsillar piston’ (Heiss et al., 2018), having
little evidence to support the underlying biomechanics of the mechanism. As a result the current
treatments are still based around restoring free CSF flow at the foramen magnum, a treatment
that was originally based on the work of Gardner (1965) and Williams (1969). This treatment is
associated with wide variation in outcomes between institutions and frequent unfavourable
outcomes (Aghakhani et al., 2009; Dubey et al., 2009; Jia et al., 2019; Parker et al., 2013).
To further understand the pathogenesis of syringomyelia in Chiari patients, it is important to
establish the mechanistic link between the abnormal morphology and altered CSF dynamics.
The morphology of the posterior fossa has been extensively investigated (Table 1.1), however
commonly only the midsagittal structures are investigated, although PC-MRI flow studies have
demonstrated that the lateral anatomy has a significant effect on CSF dynamics (Bunck et al.,
2012; Bunck et al., 2011; Haughton et al., 2003; Iskandar et al., 2004; Quigley et al., 2004).
Additionally, few studies have identified differences between the anatomy of Chiari patients
with and without a syrinx (Eppelheimer et al., 2018; Yan et al., 2016), making it unclear as to
why syrinxes do not occur in all patients (Speer et al., 2003) if overcrowding is the cause.
Positive outcomes after decompression surgery have been shown to coincide with the
‘normalisation’ of CSF flow at the foramen magnum (Dolar et al., 2004; Iskandar et al., 2004).
This has furthered the assumption that abnormal CSF flow contributes to syrinx formation,
although a causal link has yet to be demonstrated. Understanding how CSF flow differs between
patients with and without a syrinx may help understand the mechanism which causes their
development. However, to date only three studies have examined the differences between these
patient groups (Bunck et al., 2012; Clarke et al., 2013b; Ellenbogen et al., 2000). Syrinx patients
are shown to have a delayed caudal peak flow compared with syrinx free patients (Bunck et al.,
2012; Clarke et al., 2013b), however whether these differences are related to the structures of
the craniocervical junction, or cause syrinx formation has not been investigated.
Since coughing and straining associated headaches are common in Chiari patients, abnormal
changes in CSF flow under different respiratory manoeuvres have commonly been hypothesised
to relate to both patient symptoms and syrinx pathophysiology (Bhadelia et al., 2016; Williams,
1981b). However, how respiration drives CSF flow in the healthy population is still poorly
characterised, making it difficult to correctly identify abnormal behaviour which could
contribute to the disorder.

36
The effects of Chiari malformation on CSF dynamics: Thesis Aims
The overall aims of this thesis are to use MRI imaging and computational models to improve
the understanding of the effects of Chiari malformation on CSF dynamics, to provide a basis for
future mechanistically-based treatment options for Chiari and syringomyelia. Specifically, the
aim of Chapter 2 is to use subject-specific computational models of healthy controls, and
Chiari patients with and without a syrinx, to estimate the effect of Chiari and syringomyelia on
the subarachnoid pressures. In addition, to using an idealised model of the perivascular space to
determine whether features of the pressure-time profile would be favourable for increased CSF
flow into the cord, and syrinx formation. In Chapter 3 a parametric study is conducted to assess
how sensitive the ‘leaky valve’ model of the perivascular space is to variation in the arterial
pulse wave. In Chapter 4 the morphology of the posterior cranial fossa is measured in healthy
controls, and Chiari patients with and without a syrinx, to determine whether bone structure or
tonsillar overcrowding are related to the characteristic difference in the subarachnoid pressure
profiles. The aim of Chapter 5 is to use real-time PC-MRI to measure CSF and epidural blood
flow, to identify the driving mechanism of respiratory CSF in healthy controls. Chapter 6 aims
to demonstrate that the relative difference in the magnitude of compression and expansion
applied to the lumbar and thoracic dural sac respectively, could drive CSF cranially and
caudally as hypothesised in Chapter 5. With the secondary aim of determining the caudal
boundary condition required to simulate coughing in subject specific models. Finally, Chapter
7 aims to demonstrate that real-time PC-MRI could be used to identify characteristic differences
in CSF flow which may be indicators for syrinx development or coughing associated headaches.
It has the secondary aim of demonstrating feasibility of reproducing the effects of coughing in
subject specific models of healthy controls and Chiari patients.

37
2. Chiari malformation may increase perivascular cerebrospinal fluid
flow into the spinal cord: a subject-specific computational
modelling study
Publication I
Lloyd, R.A., Fletcher, D.F., Clarke, E.C. & Bilston, L.E. Chiari Malformation May Increase
Perivascular Cerebrospinal Fluid Flow into the Spinal Cord: A Subject-Specific Computational
Modelling Study. Journal of Biomechanics. 2017 Oct; 65, 185-193.
Declaration
I certify that this publication was a direct result of my research towards this PhD and that
reproductoin in this thesis does not breach copyright regulations.
……………………………………………….
Rob Lloyd [candidate]
Introduction
Chiari malformation Type I is a disorder in which the cerebellar tonsils herniate through the
foramen magnum. A majority (65−80%) of Chiari patients also develop a fluid filled cavity
(syrinx) within the spinal cord (Speer et al., 2003). Syrinxes are associated with both sensory
and motor disturbances, and occasionally with autonomic dysfunction (Sakushima et al., 2012).
The mechanisms that lead to syrinx formation in only some of the population remains unknown,
with current treatments for syringomyelia being unsatisfactory (Aghakhani et al., 2009).
Previous experimental studies showed that cerebrospinal fluid (CSF) flows from the spinal
subarachnoid space into the spinal cord via the perivascular spaces (PVS) (Ball and Dayan,
1972), and that this flow is dependent on arterial pulsation (Stoodley et al., 1997; Stoodley et
al., 1999). A simple computational model was used to demonstrate that the arteries could act as
a ‘leaky valve’, increasing resistance to flow in the PVS by dilating during systole and vice
versa (Figure. 2.1) (Bilston et al., 2010). Via this mechanism, modest changes in the timing of
the arterial and subarachnoid pressures could lead to the enhanced influx of CSF into the spinal
cord required for syrinx formation (Clarke et al., 2017).

38
Figure 2.1 (A) An illustration of the perivascular anatomy, highlighting a single penetrating vessel and the potential
channel for fluid transport , re-printed from Bilston et al., Journal of Neurosurgery, 2010, 112:808-813 with
permission from http://thejns.org. (B) A simplified diagram of the perivascular anatomy (Figure 2.1A) demonstrating
how the potential ‘leaky valve’ mechanism in the perivascular space (PVS) could alter CSF inflow, and the basis for
the design of the perivascular model shown in Figure 2.3G.
Phase-contrast magnetic resonance imaging (PC-MRI) studies have shown that both the timing
and velocity of CSF flow in the subarachnoid space are altered in Chiari patients. However, the
subarachnoid pressures cannot be measured noninvasively, so computational models are used to
provide an estimate. Idealised models have been used to demonstrate; how obstructions to flow
in the subarachnoid space delay the onset and increase the amplitude of peak pressures
(Stoverud et al., 2013), that greater tonsillar herniation increases the pressure gradient in the
subarachnoid space (Linge et al., 2011), and that the presence of a syrinx in the cord may delay
the pressure pulses (Cirovic and Kim, 2012).
Subject-specific models provide greater accuracy, as they rely on fewer assumptions and can be
validated directly. Of the subject-specific Chiari modelling studies in the literature (Clarke et al.,
2013a; Martin et al., 2013; Pahlavian et al., 2015; Shaffer et al., 2011; Shaffer et al., 2014;
Støverud et al., 2016), only Clarke et al. (2013a) studied how a syrinx influenced the
subarachnoid pressure-time profile, showing both timing and magnitude changes compared with
healthy controls. These subject-specific pressure-time profiles were used in conjunction with a
model of the PVS, to show that the increased duration of the positive pressure in syrinx patients
could promote CSF flow into the spinal cord (Clarke et al., 2017). However, only one model
was used per subject group, so the findings may not be representative of the patient population.

39
The aim of this study was to use a larger series of subject-specific models to investigate how
Chiari I malformation, with and without a syrinx, affects the magnitude and timing of the
subarachnoid pressure-time profiles compared with healthy controls, and to assess how
characteristics of the subarachnoid pressure influence perivascular flow. We hypothesise that
magnitude and timing of subarachnoid pressure in Chiari patients without a syrinx will be
significantly altered, leading to a greater influx of CSF into the spinal cord.
Methods
MR Imaging and flow measurements
This study used the MRI scan data from Clarke et al. (2013b) and reanalysed the subjects
modelled in in Clarke et al. (2013a) and Clarke et al. (2017). The University of New South
Wales Human Research and Ethics Committee approved all experimental protocols. All
participants gave written informed consent. Twenty-four participants underwent MRI scanning
of the head and neck; 9 healthy controls and 15 symptomatic Chiari I patients, 7 with and 8
without syringomyelia (Table 2.1).
Table 2.1 Summary of participant information, showing age, weight and heart rate during MRI. Data displayed as
means ± S.D. (range).
Subject Group Age Weight Heart Rate N
[Years] [Kg] [Bpm]
Control 37.8 ± 11.5 (24 -60) 68.5 ± 12.4 (55-85) 68.4 ± 12.1 (49.8-88.1) 9
Chiari w/o syrinx 36.0 ± 11.2 (22-60) 64.5 ± 7.6 (55-78) 67.4 ± 9.2 (51.9-81.3) 8
Chiari w/ syrinx 40.3 ± 10.9 (27-58) 78.0 ± 15.1 (58-100) 70.3 ± 8.6 (60.5-87.8) 7
3D isotropic T1 weighted sagittal anatomical MRI scans of the cervical spine were acquired,
parameters for the scan include; 0.94 mm voxels, matrix = 288×288, FOV = 270×270, TR/TE =
5.5/2.5 ms and 180 slices of 0.94 mm thickness. Axial cardiac gated cine PC-MRI scans (30
phases/cycle) were acquired at the following locations and encoded velocities (Venc); the base of
the skull (Venc = 12 cm.s-1), 5 mm cranial to the tip of the cerebellar tonsils (Venc=10 cm.s-1), mid
C2 (Venc = 9 cm.s-1) and mid C5 (Venc = 13 cm.s-1). Additional scanning parameters were; matrix
= 240×176, FOV = 250×250, TR/TE = 21/6.8 ms and slice thickness = 5 mm. For further details
on the scanning protocol see Clarke et al. (2013a).
Blood flow measurements taken from mid-C5 were used to provide an estimate of the relative
timing of the arterial and CSF pressures, by assuming that blood flow and pressure were in
phase. As for a typical artery of 4 mm diameter (Reymond et al., 2009) with blood oscillating at
a frequency of 60 bpm and a peak velocity of 30 cm.s-1 (density 1054 kg.m-3 and viscosity
4 mPa.s (McDonald, 1955)), the Reynolds and the Womersley numbers would be 316 and 2.57
respectively. For a Womersley number less than 3, the boundary layer would occupy
approximately half the artery’s radius, reducing the inertial effects on the flow, therefore

40
laminar flow with the pressure and flow in phase can be assumed (Lighthill, 1975). The blood
flow was analysed from the C5 plane as the vertebral artery at this location runs approximately
parallel to the spinal canal and therefore the flow would be primarily through-plane as required.
However, the Venc set to measure CSF velocities was too low to capture the blood flow, leading
to phase wrapping in blood vessels (Figures 2.3C, 2.3D). To remove the phase wraps (Figures
2.2A, 2.2B), multiples of 2π were manually added to the affected voxels (Figures 2.2C, 2.2D)
(Bioucas-Dias and Valadao, 2007).
The velocity in the vertebral artery at C5 was measured from the corrected PC-MRI data using
the freely available software Segment (Heiberg et al., 2010). The velocity data was fitted with
cubic smoothing splines (MATLAB v8.6, The MathWorks Inc., MA) to interpolate the offset
between the R wave and systolic uptake (tOffset; Figure 2.2D).
Figure 2.2 The Venc prescribes the maximum and minimum velocities that correspond to a phase in the range from –
π to + π. In the case where the measured velocity exceeds the Venc, the phase ‘wraps around’ to the bottom of the
range. This is called phase wrap, which is visualised here as discontinuities in the plots of the phase (A, B).
Correction of the phase wrap removes these discontinuities (B) providing a smooth representation of the flow
velocities across the artery. The figure shows examples of wrapped (A-B) and unwrapped (C-D) blood velocity data
in the vertebral artery at C5. A and C show the variation in velocity across the lumen of the artery at the systolic peak
(where X and Y are the pixel coordinates of the sampled region of interest). B and D show the encoded velocity-time
profiles for the vessel centre line. (D) Highlighting the foot of systolic uptake (t Offset), the crosses mark the acquired
data points and the solid line is the interpolated profile.
Computational modelling of the spinal subarachnoid space
The pressure-time profiles were calculated using the modelling protocols in Clarke et al.
(2013a). In summary, for each subject a 3D geometry of the subarachnoid space (Figure 2.3)
was constructed from point cloud data, manually segmented from the anatomical MRI. The
models spanned from 5 mm cranial to the tip of the cerebellar tonsils or the base of the skull to
10 mm past mid-C5, with a 5 mm extension to the cranial inlet to provide a smooth entry zone.
The models were imported into ANSYS CFX (v17.1, ANSYS Inc., PA) to calculate the CSF
velocities and pressures. CSF in this study was modelled as a Newtonian fluid with 0.8 mPa.s

41
viscosity and 1000 kg m-3 density (Bloomfield et al., 1998). PC-MRI flow data from 5 mm
cranial to the tip of the tonsils or the base of the skull was applied to the cranial end of the
model as the inlet boundary condition. The caudal outlet was set to have a reference pressure of
0 Pa. The spinal cord and dura mater were treated as solid wall boundaries. The CSF flow was
assumed to be laminar. All models were calculated with the measured time scales, but as there
was minimal variation in heart rate between subject groups (ANOVA, p = 0.22), the output
timescales were subsequently normalised for comparison. The models were validated by
comparing features of the calculated velocity-time profiles against the MRI data, taken from 10
corresponding locations at mid-C2 and mid-C5 of the subarachnoid space (Figure 2.3C). The
monitor points (Figure 2.3C) were positioned in the centre of the annulus of the spinal canal,
avoiding areas close to solid structures in order to minimise the mixing effects introduced by
structures such as nerve roots and possible partial volume effects in the MRI data. The features
of interest were; the time when the caudal flow begins, the timing of the peak caudal flow, the
time when flow changes from caudal to cranial and the peak caudal and cranial velocities.
Characteristics of the pressure-time profiles (Figure 2.3F) from mid-C2 were compared between
the subject groups. The features of interest were the timing of; the onset of positive pressure (t
On), the peak positive pressure (t Peak) and the transition from positive to negative pressure (t Off),
as well as the magnitude of the peak positive (P Max) and negative (P Min) pressures. Additionally,
the cumulative pressure acting over time (area under the pressure curve; AUC) during the
positive (A +) and negative (A –) segments, as well as the overall net value (A Net) were
calculated.
A steady state run provided initial conditions for the transient simulation. A solution was
accepted once a time periodic state was reached in the second cycle, with normalised residuals
converging to below 10–5 at each time step (5 ms). The CFD code is a 3D Navier-Stokes solver
that uses a finite volume approach. The equations were solved using a pressure-velocity coupled
solver. Spatial and time derivatives were calculated with second order differencing schemes.
Double precision was applied to minimise rounding errors.

42
Figure 2.3 (A) Midline sagittal MR scan of a Chiari subject with a syrinx. (B) Magnified view of midline scan with
segmented model area overlaid. White lines show the scan planes used for PC-MRI at the base of the skull, C2 and
C5. (C) Magnified view of the PC-MRI at C5, showing the 10 locations used to compare measured and simulated
velocities for model validation. (D) Model cross section overlaid on the C5 PC-MRI. The white arrows on C and D
highlight the phase wrapped vertebral arteries. (E) 3D model of the subarachnoid space, with the planes
corresponding to the PC-MRI scans highlighted in red. (F) An example of the simulated subarachnoid pressure
profile (PSAS(t)) for a Chiari subject without a syrinx taken from the C2 plane (Figure 2.3E), with key features
annotated, where tpeak = time of peak positive pressure, PMax= Peak positive pressure, PMin = Peak negative pressure,
ton = time of positive pressure onset, toff = time of negative pressure onset, A+ = Area under positive pressure curve,
A− = Area under cranial negative curve. (G) Schematic of the axisymmetric perivascular space model. The inlet was
assigned the simulated subarachnoid pressure-time profile, similar to the example in Figure 2.3F. Arterial expansion
was modelled by applying a time dependent displacement (H) to the inner wall of the perivascular space.
Modelling the perivascular space
Following the strategy in Clarke et al. (2017) perivascular transport was modelled with a
previously published idealised model of the perivascular space (Bilston et al., 2010). In
summary, the model is an axisymmetric representation of a penetrating artery, the surrounding
perivascular space, spinal cord and surrounding subarachnoid space (SAS) (Figure 2.3G). The
spinal cord parenchyma at the outer wall of the annulus was treated as rigid. The arterial
expansion was simulated as a prescribed moving boundary, by applying a time dependent
displacement with an amplitude of 10 µm (Figure 2.3H) to the wall at the inner radius. As the
wavelength of the arterial pulse is orders of magnitude larger than the length of the model, the
displacement could be assumed to act uniformly along the wall. The calculated pressures from
mid-C2 (Figure 2.3F) were applied to the inlet of the perivascular model. The outlet was given a
reference pressure of 0 Pa.
Prior studies have illustrated that the relative timing of arterial and subarachnoid pressures
influences perivascular flow (Bilston et al., 2010; Clarke et al., 2017). Since the in vivo timing

43
is unknown, a range of offsets were simulated. Arterial expansion was delayed relative to the R
wave in steps of 2%, from 0–20% of the cardiac cycle.
The models were solved in ANSYS CFX (v17.1, ANSYS Inc., PA), the high resolution
bounded second order scheme was used for the advection term and the second order backward
Euler scheme for the transient term. For convergence, normalised residuals were reduced below
2 × 10⁻⁵ at each time step. For further detail of the model configuration and assumptions see
Bilston et al. (2010) and Clarke et al. (2017). The flow rate was integrated over the cardiac cycle
to provide the net mass of fluid transported along the PVS per cardiac cycle (pumping rate).
Statistical analysis
Agreement between the velocity-time profiles of the MRI measurements and subarachnoid
models, were assessed using the Bland-Altman method for repeated measures (Bland and
Altman, 2007). Bland-Altman plots provide the average model error and the 95% limits of
agreement (±1.96×S.D.). Model error was calculated as the model result minus the MRI
measurement. The velocity-time profiles (Figure 2.4) and the within subject variation of the
measured MRI data were used to determine whether the model error was acceptable.
Features of the pressure-time profiles (Figure 2.3F) and the perivascular model were compared
between subject groups with a one-way ANOVA using MATLAB (v8.6, The MathWorks Inc.,
MA). When the ANOVA model returned a significant difference (p < 0.05), a Bonferroni post-
hoc test was used to identify significant differences between the three groups. Stepwise multiple
regression was used to determine whether features of the subarachnoid pressures were
associated with the net pumping rate.
Results
Subarachnoid model validation
The simulated and measured MRI velocities show an acceptable level of agreement (Figure 2.4)
for most comparison points. The greatest deviation between the models and the MRI data was in
the posterior and inferior segments of the models (Figures 2.4, 2.5 and Table 2.2), where the
models would predict a uniform flow field around the spinal cord, while the MRI data showed
significant variation around the cord. The models showed no proportional or a preferential bias
for any subject group (Figure 2.5). The model error was less than the measured variation around
the cord (Table 2.2). On average the models overestimated the timing of the peak caudal flow
and when the flow reversed (Figure 2.5 and Table 2.2). This can be attributed to deviation from
the in vivo velocities around the spinal cord (Figure 2.4).

44
CSF dynamics in Chiari subjects
Figure 2.6 shows the average measured pressure-time characteristics (Figure 2.3F) for each
group. The timing of the positive peak pressure in Chiari patients without a syrinx were shown
to occur earlier than controls (ANOVA, p = 0.045) and patients with a syrinx (ANOVA,
p = 0.037). The peak positive pressures in Chiari patients without syringomyelia were greater
than in controls (ANOVA, p = 0.029). In patients with a syrinx the transition from positive to
negative pressure was delayed compared with those without (ANOVA, p = 0.038). Chiari
malformation and syringomyelia had no influence on the AUC.
Arterial pulse delay and perivascular flow
Delaying the onset of arterial expansion between 0 – 14% of the cardiac cycle, increased flow
into the spinal cord (Figure 2.6D). Chiari patients without a syrinx had significantly greater CSF
inflow (ANOVA, p < 0.05) than (i) controls for a delay between 4 – 14%, (ii) patients with a
syrinx for a delay of 4 – 10%.The phase corrected blood flow maintained an approximately
parabolic flow profile throughout the cardiac cycle (Figure 2.2C), which confirms that the
pressure and velocity are in phase, as expected for low Womersley numbers. Systolic uptake in
the vertebral artery occurred 4.7 ± 0.1% after the R wave in controls. This was similar
(ANOVA, p = 0.45) in both patients with (4.4 ± 0.5%) and without (5.1 ± 0.4%) a syrinx. The
average delay for all subjects (N = 24) was 4.7 ± 0.2%.

45
Figure 2.4 Example of the measured MRI and model velocity-time profiles used for validation, taken from a control
subject. Each figure shows data at both the C2 (Left) and C5 (Right) levels, at five regions around the spinal cord and
the average annular velocity (Bottom). The dashed lines mark the standard deviation, crosses indicate transitions
between caudal and cranial flow and diamonds indicate peak caudal velocities.
Table 2.2 Summary of the agreement between model and in vivo velocity-time profiles. Model error displayed as the
bias ± 95% limits of agreement. Measured spread displayed as the 95% limits of agreement of the within subject
variation in the MRI data.
Velocity-time feature Model error Measured spread
Plane C2 Plane C5 Plane C2 Plane C5
Time of initial caudal flow [%] 0.19 ± 3.00 -0.17 ± 5.71 3.53 9.36
Time of peak caudal flow [%] 3.11 ± 6.07 0.99 ± 8.81 7.94 12.4
Time of return to cranial flow [%] 2.06 ± 12.5 2.58 ± 16.3 18.2 25.1
Peak caudal velocity [cms-1] -0.10 ± 0.88 -1.39 ± 2.56 1.09 3.61
Peak cranial velocity [cms-1] 0.17 ± 0.64 1.14 ± 1.78 0.79 2.34

46
Figure 2.5 Bland-Altman plots assessing the model error (modelled variable – MRI measurement), each data point is
the average error measured across the 10 locations sampled around the subarachnoid space in a subject (Figure 2.3C).
The solid line marks the average model bias and the dashed lines show the 95% limits of agreement (Table 2.2). The
first and second columns display the results taken from the C2 and C5 planes respectively. Features of the velocity-
time profile used for validation were; (A - B) the time caudal flow starts, (C - D) the time of peak caudal flow, (E - F)
the time cranial flow restarts, (G -H) the peak caudal velocity and (I - J) the peak cranial velocity

47
47
Figure 2.6 Group means with their 95% confidence intervals from one-way ANOVA for; parameters measured from subarachnoid pressures at C2 (A - C) and predicted perivascular pumping
rates (D). Measured parameters include; (A) the timing features, (B) the peak positive and negative pressures, (C) the pressure duration (AUC). Annotated dashed lines across the time axis
indicate the 95% confidence intervals of the measured time delay until systolic uptake (tOffset) for all subjects (D). Significant comparisons are indicated by an asterisk (* = p < 0.05).

48
The effect of subarachnoid space pressure-time features on perivascular flow
The pumping rates were weakly correlated with the; timing of the peak pressure, amplitude of
peak pressure, positive and net AUC (Figure 2.7). The timing of the peak pressure, amplitude of
peak pressure and net AUC were significantly associated with net pumping rates (Regression
analysis, p < 0.0001; RAdj2 = 0.85).
Figure 2.7 Relationship between pressure wave features and net pumping rates calculated with an arterial delay of
4%. (A) Relation with time of the positive pressure peak (tPeak), (B) Relation with peak positive pressure (PMax), (C)
Relation with positive AUC (A +), (D) Relation with net AUC (A Net), grey dashed line highlights separation between
the normal levels and a noticeable increase in pumping rate. Labelled crosses indicate cases (a) to (c) in Figure 2.8
Discussion
Implications for syrinx development
This study presents a series (N = 24) of patient-specific CFD models of Chiari patients and
controls, which demonstrate how subarachnoid pressures are altered by Chiari malformation
and syringomyelia. We found that the peak positive pressures were elevated and occurred
earlier, in patients without a syrinx than those with a syrinx and healthy controls. The coupled

49
CFD and perivascular space model showed that the increased peak pressures and changes in
timing introduced by tonsillar herniation are likely to promote CSF flow into the spinal cord and
contribute to the formation of a syrinx. These findings were consistent across the range of
arterial pulse delays measured with PC-MRI.
Studies have consistently demonstrated that obstructions to flow in the subarachnoid space and
craniocervical junction result in elevated peak pressures (Cheng et al., 2012; Clarke et al.,
2013a; Stoverud et al., 2013). Results for timing are less consistent. Two studies have shown
that obstructions could delay the timing of pressure pulses (Cheng et al., 2012; Stoverud et al.,
2013), in contrast with the findings of the current study (Figure 2.6A and 2.7A), other subject-
specific modelling (Clarke et al., 2013a) and in vivo imaging studies (Clarke et al., 2013b).
These differences may be due to how the specific type of obstruction investigated influences the
compliance of the spinal canal. The timing of the flow profile is influenced by the compliance
of the cranial and spinal compartments. Increases in compliance would act to delay the
propagation of travelling waves, whereas decreases would accelerate wave propagation. The
herniated tonsils are likely to affect the compliance at the foramen magnum, and increase the
wave propagation across this region, whereas wave propagation in more caudal locations is
affected by spinal canal compliance.
Posterior fossa decompression is the most common treatment for Chiari malformation, and can
collapse a syrinx; however unfavourable surgical outcomes are frequent (Aghakhani et al.,
2009). The surgery aims to restore normal flow by increasing the volume of the craniocervical
junction. This may reduce the tonsillar obstruction and increase craniocervical junction
compliance due to duraplasty. Both of these would normalise the compliance, delaying wave
transmission and may reduce flow into the spinal cord (Figure 2.7A).
Introduction of a fluid cavity in the spinal cord increases the compliance of the spinal canal,
reducing the peak amplitude and mean subarachnoid pressure (Elliott et al., 2011; Martin et al.,
2010; Martin and Loth, 2009), and causing delays in pressure transmission (Cirovic and Kim,
2012; Martin and Loth, 2009). This is consistent with the observation that the magnitude and
timing of the subarachnoid pressures (Figure 2.6A and 2.6B) and velocities (Clarke et al.,
2013b) in patients with a syrinx are more similar to control subjects than patients without a
syrinx, suggesting that the formation of a syrinx could act to normalise subarachnoid dynamics
and hinder further growth.
Taking the average measured delay until systolic uptake together with the linked results of the
perivascular model, we conclude that patients with Chiari malformation without a syrinx may
have a greater influx of fluid into the spinal cord via perivascular spaces compared with controls
and patients with a syrinx (Figure 2.6D), as previously predicted by Bilston et al. (2010). It

50
would be interesting to follow Chiari patients to determine whether this parameter predicts
syrinx formation.
Our analysis extends findings from (Clarke et al., 2017), which showed that the net AUC
influences perivascular flow, however it has also shown that the shape of the pressure profile is
important (Figure 2.7). This is likely due to the relatively small timing delay between the R
wave and systolic uptake, which was not previously considered by Clarke et al. (2017). Figure
2.8 illustrates that arterial expansion provides increased resistance to flow from an early time
point in the cardiac cycle; so perivascular flow would be sensitive to changes that give higher
pressures earlier in the cardiac cycle.
Figure 2.8 Effect of peak pressure timing on net perivascular flow, for selected cases with a 4% delay in arterial
expansion. All cases have comparable net AUC, with the peak times progressing from early (A) to later (C) in the
cardiac cycle. The net pumping rates for the cases are highlighted with crosses in Figure 2.7.
Study limitations
The limitations of the subarachnoid space models are discussed in Clarke et al. (2013a). In this
study, the subarachnoid space was modelled as having rigid boundaries, and internal structures
such as the nerve roots and any arachnoid webs were neglected. The inclusion of these features
can cause variation in the local flow field, which could account for some of the differences in
the velocities between our models and the PC-MRI data; however, their influence on the
subarachnoid pressures has been shown to be minimal (Cheng et al., 2014; Pahlavian et al.,
2014). To create a high-quality mesh, the segmented subarachnoid space was smoothed. This
may account for some deviation between the simulated and measured velocities.

51
The timing of the blood pressures was measured in the vertebral artery at mid-C5, but may
differ in the penetrating arteries further down the arterial tree (London and Pannier, 2010). The
wave speed in the vertebral artery is approximately 9 m.s-1 (Wang and Parker, 2004), assuming
the length of the vessel to be no more than 10 cm, the timing delay between the locations can be
estimated to be +10 ms (+1% of the cardiac cycle at 60 bpm), and thus likely have a negligible
effect on the interpretation of the results.
The arterial displacement used for the perivascular model was derived from finger
photoplethysmograph measurements (Millasseau et al., 2002). Although this simplification may
overestimate the displacement during late diastole (Hirata et al., 2006), due to the distribution of
the subarachnoid pressure profile (Figure 2.8), perivascular flow can be expected to be
insensitive to variation during diastole. As the offset between the onset of subarachnoid and
arterial pressure is relatively small, the effective ‘sealing’ of the perivascular space may be
affected by heart rate and vessel properties (Bombardini et al., 2008; Kelly et al., 1989;
Wilkinson et al., 2000) and should be considered in future studies. Additionally, the model
neglected anatomical variation in the perivascular space and assumed a reference pressure of
0 Pa within the spinal cord parenchyma, effectively equating central cord pressure to the caudal
subarachnoid pressure. These assumptions may overestimate flow within the perivascular space
if the spinal cord pressure is higher than caudal subarachnoid pressure, which may occur as
syrinx pressure increases (Heiss et al., 1999), giving a proportional decrease in perivascular
flow. This issue is discussed further in Bilston et al. (2010) and Clarke et al. (2017).
In this study, variation in the shape of the subarachnoid pressure pulse has been attributed to the
general differences between the subject groups. Investigating how the pressure pulse is
influenced by specific changes in anatomy (occipital bone morphology, tonsillar herniation,
etc.) and physiology (heart rate, respiratory stress, etc.) may provide further insight into the
drivers of perivascular flow.
The sample size used in this study (N = 24), although larger than most computational studies, is
nevertheless a modest group of participants and may not represent all Chiari patients.
Additionally, this study used data from a single time point MRI study, and additional
information about the prior history (such as duration of symptoms) and subsequent progression
of the disease may provide further insight in the pathogenesis of syringomyelia.
Conclusion
This study has demonstrated that Chiari malformation could lead to peak pressures occurring
earlier and being significantly increased compared with those from controls, whereas patients
who also have a syrinx tend to have pressure-time profiles more similar to healthy controls. The
idealised model of the perivascular space indicated that for a range of arterial pressure delays

52
spanning those measured in the vertebral artery, Chiari patients without a syrinx may have a
significantly greater CSF inflow than controls and syrinx patients. The model demonstrated that
extended periods of high pressure occurring earlier in the cardiac cycle could increase
perivascular inflow; as such these features may underlie the formation of a syrinx. Further
analysis of how patient pressure profiles change over time prior to and during the development
of a syrinx, as well as in response to treatment, are likely to provide further insight into the
pathogenesis of syringomyelia.
53
3. The effects of variation in the arterial pulse waveform on
perivascular flow
Publication II
Lloyd, R.A., Stoodley, M. A., Fletcher, D.F. & Bilston, L.E. The Effects of Variation in the
Arterial Pulse Waveform on Perivascular Flow. Journal of Biomechanics. 2019 April; 90, 65-
70.
Declaration
I certify that this publication was a direct result of my research towards this PhD and that
reproduction in this thesis does not breach copyright regulations.
……………………………………………….
Rob Lloyd [candidate]
Introduction
The perivascular spaces are fluid channels within the brain and spinal cord which surround
arteries and veins (Lam et al., 2017). These structures provide a conduit between the
cerebrospinal fluid (CSF) in the subarachnoid space and parenchymal interstitial fluid,
facilitating solute transport and waste clearance (Diem et al., 2016; Hawkes et al., 2011; Iliff et
al., 2013a). Tracer studies have indicated that arterial pulsations are involved in perivascular
transport (Iliff et al., 2013b; Rennels et al., 1985; Stoodley et al., 1997; Stoodley et al., 1999).
Identifying the normal function of the perivascular spaces and how flow can be disrupted is vital
to understanding healthy neural function, and abnormal fluid accumulation in nervous tissues.
Syrinxes are fluid filled cavities which form in the spinal cord, they are commonly associated
with subarachnoid space obstructions. Syrinxes can cause sensory and motor disturbances, and
current surgical treatments are frequently unsuccessful (Aghakhani et al., 2009). Fluid
accumulation in a syrinx is the net result of an imbalance between fluid inflow and outflow, and
since the mechanisms which cause fluid accumulation are unknown, this hinders treatment
improvements.
As CSF flow through the perivascular spaces depends on arterial pulsation (Iliff et al., 2013b;
Rennels et al., 1985; Stoodley et al., 1997; Stoodley et al., 1999), computational models have
been used to explore the biomechanics, showing that arterial pulsation alone cannot actively
drive flow in the absence of a pressure gradient (Asgari et al., 2016; Bilston et al., 2003).
However, the artery could act as a ‘leaky’ valve. While an artery expands the perivascular space

54
narrows, increasing resistance to flow driven by dynamic subarachnoid space pressure (Bilston
et al., 2010). As such, flow through the perivascular spaces will be related to the timing
differences between the arterial and subarachnoid pressures (Clarke et al., 2017; Lloyd et al.,
2017).
Lumped parameter models have shown that decreased spinal canal compliance induces a timing
shift in the subarachnoid pressures favourable for increased fluid accumulation (Elliott et al.,
2011; Martin et al., 2012). Our perivascular space model together with simulated subject-
specific pressure data (Lloyd et al., 2017), predicted that the timing changes introduced by
Chiari malformation could significantly increase inflow compared with controls.
Research has focused on how changes in subarachnoid pressure influence perivascular flow but
not examined how variations in the arterial pulse wave affect flow. The arterial waveform is
comprised of the forward and reflected travelling pulse waves (Figure 3.1). Reflections are
produced by impedance differences along the vascular tree. For further details of what
influences the pulse waveform shape, see (Kim et al., 2017; London and Pannier, 2010).
Changes in the arterial waveform may alter perivascular space dimensions across the cardiac
cycle, and thus affect the efficiency of the ‘leaky valve’ mechanism. This study used an
idealised model of the perivascular space with subject-specific subarachnoid pressure profiles to
assess how features of the arterial pulse waveform influence perivascular flow, in order to
determine whether the ‘leaky valve’ mechanism is sensitive to the arterial pulse waveform. We
hypothesised that pulse wave variations within typical physiological ranges would minimally
affect net CSF inflow.
Figure 3.1 Illustration demonstrating how the interactions of the forward travelling and reflected waves may alter the
shape of the arterial pressure pulse, adapted from London and Pannier (2010). (A) A baseline example with the travel
time of the reflected wave (TR) being 0.29 s. (B) The effects of increasing the stiffness of the aorta, reducing the
travelling time of the reflected wave to 0.18 s, shifting the peak into late systole and reducing the diastolic pressure.
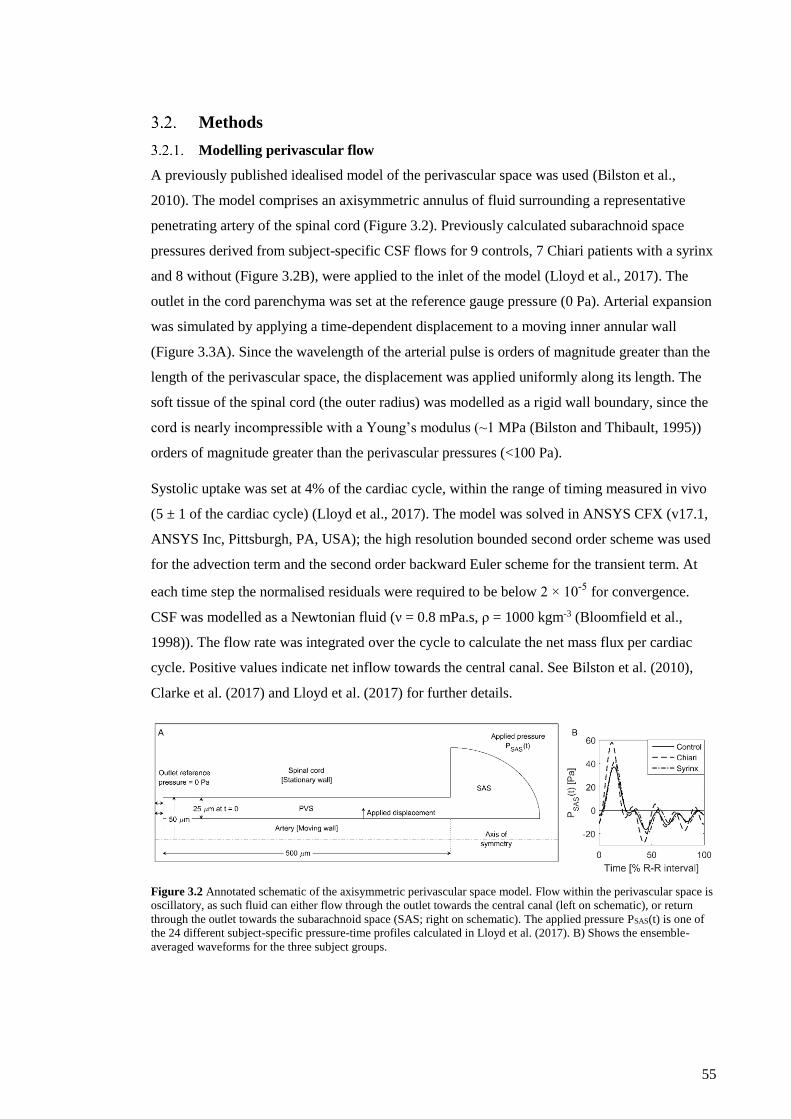
55
Methods
Modelling perivascular flow
A previously published idealised model of the perivascular space was used (Bilston et al.,
2010). The model comprises an axisymmetric annulus of fluid surrounding a representative
penetrating artery of the spinal cord (Figure 3.2). Previously calculated subarachnoid space
pressures derived from subject-specific CSF flows for 9 controls, 7 Chiari patients with a syrinx
and 8 without (Figure 3.2B), were applied to the inlet of the model (Lloyd et al., 2017). The
outlet in the cord parenchyma was set at the reference gauge pressure (0 Pa). Arterial expansion
was simulated by applying a time-dependent displacement to a moving inner annular wall
(Figure 3.3A). Since the wavelength of the arterial pulse is orders of magnitude greater than the
length of the perivascular space, the displacement was applied uniformly along its length. The
soft tissue of the spinal cord (the outer radius) was modelled as a rigid wall boundary, since the
cord is nearly incompressible with a Young’s modulus (~1 MPa (Bilston and Thibault, 1995))
orders of magnitude greater than the perivascular pressures (<100 Pa).
Systolic uptake was set at 4% of the cardiac cycle, within the range of timing measured in vivo
(5 ± 1 of the cardiac cycle) (Lloyd et al., 2017). The model was solved in ANSYS CFX (v17.1,
ANSYS Inc, Pittsburgh, PA, USA); the high resolution bounded second order scheme was used
for the advection term and the second order backward Euler scheme for the transient term. At
each time step the normalised residuals were required to be below 2 × 10⁻⁵ for convergence.
CSF was modelled as a Newtonian fluid (ν = 0.8 mPa.s, ρ = 1000 kgm-3 (Bloomfield et al.,
1998)). The flow rate was integrated over the cycle to calculate the net mass flux per cardiac
cycle. Positive values indicate net inflow towards the central canal. See Bilston et al. (2010),
Clarke et al. (2017) and Lloyd et al. (2017) for further details.
Figure 3.2 Annotated schematic of the axisymmetric perivascular space model. Flow within the perivascular space is
oscillatory, as such fluid can either flow through the outlet towards the central canal (left on schematic), or return
through the outlet towards the subarachnoid space (SAS; right on schematic). The applied pressure PSAS(t) is one of
the 24 different subject-specific pressure-time profiles calculated in Lloyd et al. (2017). B) Shows the ensemble-
averaged waveforms for the three subject groups.

56
Systematic variation of the arterial pulse wave
Parametric analysis was conducted to assess how the arterial waveform affected perivascular
flow. A simplified version of the displacement waveform used in Bilston et al. (2010) was used
as a baseline (Figure 3.3A). Features of the displacement wave were systematically altered to
mimic in vivo waveform characteristics, while maintaining the baseline value for remaining
features (Figure 3.3 and Table 1). Each displacement wave was applied to the model for all 24
subject-specific pressure profiles.
Figure 3.3 Example of the arterial displacement waveforms used in the parametric analysis. (A) Annotated baseline
waveform, highlight the features of interest in this study. (B) Example of a profile with an earlier peak displacement
(tpeak) being sustained for a longer time (Δt) (increased AUC in uptake; AUCUptake). (C) Example of a profile with a
rapid decline in pressure during late systole and diastole (decreased AUC in decline; AUCDecline), by imposing an
artificial dicrotic notch to the waveform at 40% of the cardiac cycle. (D) Example waveforms for changing the time
of the peak displacement while keeping the total area the same.
Arterial pulse amplitude
The arterial wall deformation within the spinal cord penetrating arteries is unknown, and an
amplitude of 10µm has been assumed previously (Bilston et al., 2010; Clarke et al., 2017).
There, the pulse waveform was scaled to 1.25, 2.5, 5, and 20µm peak amplitude.
Systolic peak time
Systolic peak timing was shifted by between −18 to +10% from baseline (Figure 3.3D; Table
1), to span values in the vertebral artery (first peak = 9±2% and second peak = 25±7% of the
cardiac cycle after systolic uptake), and carotid artery (−8 to 5% change from baseline, from the
youngest to oldest, respectively) (Kelly et al., 1989). Resulting variation in the total area under
the curve (AUC) from baseline was kept below 4%.

57
Systolic peak time and duration (Area under systolic uptake)
The AUC during systolic uptake was increased from 9-35% from baseline, spanning the
increase between 30-70 years (Kelly et al., 1989), by shifting the systolic peak 8-18% earlier.
The peak displacement was maintained until the beginning of systolic decline, which was held
at 28% of the cardiac cycle (Table 1). AUC during uptake was not decreased as this would
require the wave to be altered in late systole and diastole.
Area under systolic decline and diastolic run-off
The AUC during decline was decreased by 15 to 49% from the baseline, to cover a range of
values (–39 to –11% change from baseline, from the oldest to youngest respectively) estimated
from Kelly et al. (1989), by altering the magnitude of the displacement at the dicrotic notch
(Figure 3.3C). The dicrotic notch was assumed to occur at 40% of the cardiac cycle (38±8% of
the cardiac cycle in vertebral artery profiles).
Statistical analysis
The effect of arterial waveform on net perivascular flow was assessed using a generalised linear
mixed model (GLMM) with Bonferroni correction (IBM Statistics v24, IBM Corp., Armonk,
NY). p<0.05 was considered significant.

58 Table 3.1 Alterations made to displacement wave, displayed as: variable value (percentage change from baseline model). Highlighted cells indicate variables altered, where AUCUptake is the area
under the curve during systolic uptake, AUCDecline is the area under the curve during systolic decline and diastole, and tpeak is the time when peak displacement occurs.
Amplitude Peak time Peak duration (Δt) AUC in uptake AUC in Decline Total AUC
Wave Name [µm (% change)] [% R-R interval (% change)] [% R-R interval (% change)] [µm (% change)] [µm (% change)] [µm (% change)]
Baseline 10 28 0 1.62 4.3 5.93
Amp 1.25µm 1.25 (−87.5) 28 0 0.20 (−87.5) 0.50 (−87.5) 0.74 (−87.5)
Amp 2.5 µm 2.5 (−75) 28 0 0.40 (−75.0) 1.10 (−75.0) 1.48 (−75.0)
Amp 5 µm 5 (−50) 28 0 0.81 (−50.0) 2.20 (−50.0) 2.96 (−50.0)
Amp 20 µm 20 (100) 28 0 3.23 (100) 8.60 (100) 11.9 (100)
AUCUptake +9% 10 20 (−8.0) 8 (8.0) 1.75 (8.52) 4.30 6.07 (2.32)
AUCUptake +21% 10 14 (−14) 14 (14) 1.96 (21.0) 4.30 6.27 (5.73)
AUCUptake +35% 10 10 (−18) 18 (18) 2.18 (34.9) 4.30 64.9 (9.51)
AUCDecline −49% 10 28 0 1.62 2.20 (−49.0) 3.81 (-35.7)
AUCDecline −33% 10 28 0 1.62 2.90 (−32.8) 4.52 (-23.8)
AUCDecline −15% 10 28 0 1.62 3.70 (−14.9) 5.29 (-10.8)
tPeak −18% 10 10 (−18) 0 0.40 (−75.0) 5.60 (30.9) 6.05 (2.03)
tPeak −14% 10 14 (−14) 0 0.59 (−63.3) 5.40 (24.9) 5.98 (0.85)
tPeak −8% 10 20 (−8) 0 0.97 (−39.7) 5.00 (16.1) 5.98 (0.87)
tPeak +10% 10 38 (10) 0 2.26 (39.5) 3.90 (-9.98) 6.14 (3.52)

59
Results
Figure 3.4 shows the effect of the arterial wave variations on net perivascular inflow. Figure
3.4A shows that reducing the pulse amplitude decreases the net inflow. Conversely, increasing
the amplitude slightly increased CSF inflow. Earlier arrival of the systolic peak reduces CSF
flow into the spinal cord (Figure 3.4B). Perivascular flow decreased with increasing AUC
during systolic uptake (Figure 3.4C), and decreased AUC during systolic decline and diastole
(Figure 3.4D).
In controls, there was net outflow of fluid when either; the systolic peak times were earlier than
14% of the cardiac cycle, the AUC during systolic uptake was increased more than 26%, or the
AUC during systolic decline and diastole was decreased more than 23%. Chiari patients without
a syrinx maintained a significantly greater influx of CSF compared with controls and syrinx
patients for all conditions. However, for amplitudes less than 5 µm and systolic peaks occurring
earlier than 14% into the cardiac cycle, the 95% confidence intervals overlap.
There were no interaction effects between the subject groups and the characteristics of the
arterial pulse wave (GLMM: Amplitude; p = 0.146, AUC uptake; p = 0.455, AUC decline; p =
0.959, systolic peak time; p = 0.65). Therefore, differences between groups can be attributed to
differences in the input subarachnoid pressures.
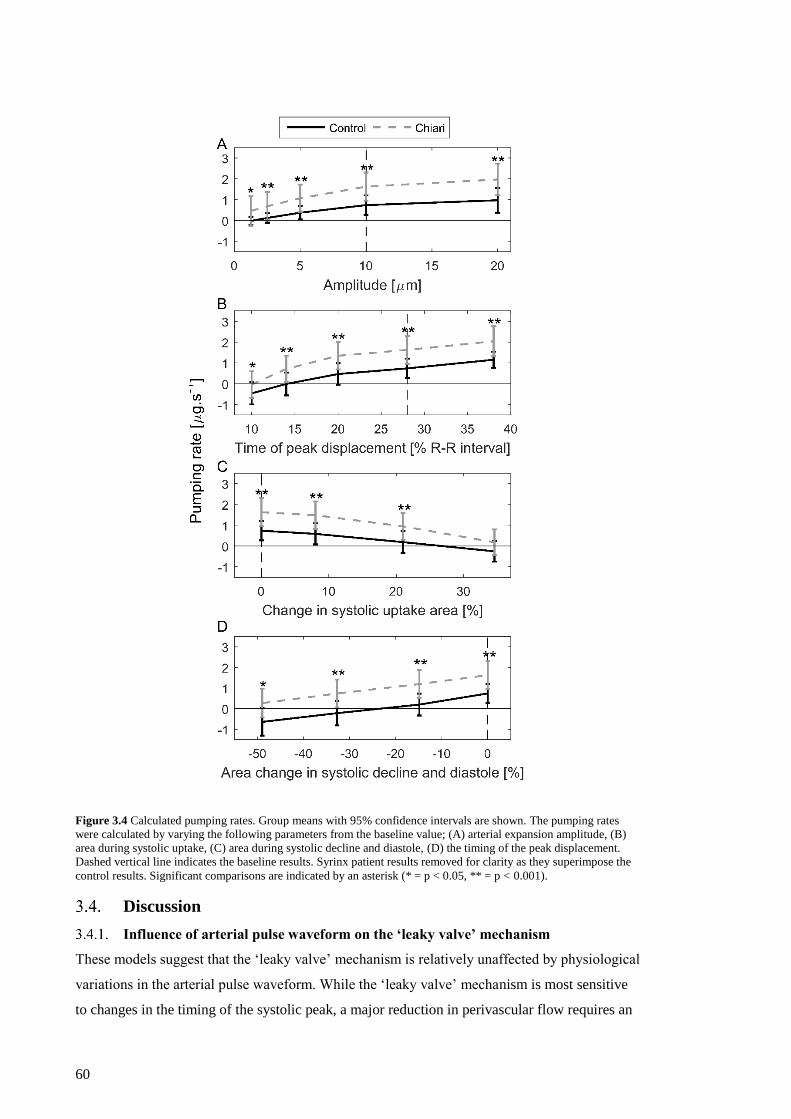
60
Figure 3.4 Calculated pumping rates. Group means with 95% confidence intervals are shown. The pumping rates
were calculated by varying the following parameters from the baseline value; (A) arterial expansion amplitude, (B)
area during systolic uptake, (C) area during systolic decline and diastole, (D) the timing of the peak displacement.
Dashed vertical line indicates the baseline results. Syrinx patient results removed for clarity as they superimpose the
control results. Significant comparisons are indicated by an asterisk (* = p < 0.05, ** = p < 0.001).
Discussion
Influence of arterial pulse waveform on the ‘leaky valve’ mechanism
These models suggest that the ‘leaky valve’ mechanism is relatively unaffected by physiological
variations in the arterial pulse waveform. While the ‘leaky valve’ mechanism is most sensitive
to changes in the timing of the systolic peak, a major reduction in perivascular flow requires an

61
unphysiologically early systolic peak (Kelly et al., 1989). Chiari subjects had a significantly
higher inflow over a physiologically likely range of parameters (Figure 3.4).
Our wave amplitude results are in agreement with previous animal studies showing that
diminished arterial pulse amplitude reduces CSF tracer penetration into the spinal cord
(Stoodley et al., 1997; Stoodley et al., 1999). Given the relative timing of the CSF and arterial
pulses, the positive pressure that drives CSF into the spinal cord occurs during a period of low
resistance (late diastole – early systole), whereas the backflow driven by the negative pressures
faces the largest resistance due to arterial expansion. Therefore, the reduced perivascular flow
seen at low amplitude can be attributed to increased backflow. Conversely, increasing the
amplitude above 10 µm also increased resistance to inflow, causing a minimal increase in CSF
inflow (Figure 3.4A). The sensitivity to the timing of the peak displacement (Figure 3.4B), is
similarly affected by the change to inflow resistance.
The low impedance of the cerebral vascular bed (Kim et al., 2017) allows for small penetrating
arteries to maintain pulsatile pressures (Blanco et al., 2017; Geurts et al., 2018). As such, the
pressure waveform would likely have a pronounced peak in systole, with a gradual decline
through late systole and diastole. Measurements from the vertebral and carotid artery (Kelly et
al., 1989) suggest that the baseline waveform (Figure 3.3A) used in previous studies (Bilston et
al., 2010; Clarke et al., 2017; Lloyd et al., 2017) may overestimate the efficiency of the ‘leaky
valve’ mechanism (Figure 3.4D). However, group differences between Chiari subjects and
controls are not altered (Figure 3.4), suggesting that the ‘leaky valve’ is robust to
physiologically reasonable variations in the arterial pulse waveform.
Study limitations
The subarachnoid pressures were based on cardiac-gated MRI scans, neglecting any effects of
respiration (Hamer et al., 1977; Yildiz et al., 2017). If respiration alters the net subarachnoid
pressures, fluid inflow could vary with the respiratory cycle and this should be included in
future studies.
In part, spinal subarachnoid flow is driven by arterial pulsation within the cranium (Alperin et
al., 2005a; Alperin et al., 2005c). Therefore, changes in the arterial pulse may also affect the
subarachnoid pulse shape, which has not been considered here as these effects are not known.
The presence of a syrinx has been repeatedly shown to normalise CSF dynamics (Cirovic and
Kim, 2012; Clarke et al., 2013b; Elliott et al., 2011; Lloyd et al., 2017; Martin et al., 2010;
Martin and Loth, 2009), but there is no in vivo data for perivascular flow. Therefore,
perivascular flow arising from CSF pressures in syrinx patients would be expected to be similar
to control subjects, as found here and by Lloyd et al. (2017). However, the CSF dynamics in the
pre-syrinx state are unknown, so this study uses the syrinx free subjects as an approximation of

62
that initial state, although there are likely differences as these subjects have not yet developed a
syrinx. It was not possible to obtain longitudinal clinical or imaging data to confirm this. It
follows from this that these results do not provide a complete picture of the mechanisms of
syrinx formation or enlargement, as they are based on cross-sectional data. Future studies
should address this issue.
This model neglected variation in cross-sectional area and the bundles of collagen fibres found
in the perivascular space (Lam et al., 2017). The models may thus underestimate perivascular
resistance to flow.
We did not model temporal variation in the internal pressure of the spinal cord, effectively
assuming the cord pressure curve follows the caudal subarachnoid pressure. A syrinx would
elevate the pressure within the spinal cord, either in or out of phase with the subarachnoid
pressure (Heiss et al., 1999), altering the pressure gradient and reducing perivascular flow. This
would have a comparable effect to altering the shape of the subarachnoid pressure waveform in
isolation, the effects of which has been explored by Clarke et al. (2017).
Solute transport has not explicitly been simulated in this study. However, tracer particles such
as Ovalbumin (Tao and Nicholson, 1996) would be dominated by convective flow (Péclet
number ≈ 1250, for a typical 5 mm.s-1 velocity) and closely follow bulk flow, as seen in recent
intravital imaging studies (Bedussi et al., 2018; Mestre et al., 2018). Modelling particle
deposition or flow into the parenchyma should be a focus of future work.
Conclusion
In this parametric analysis, it has been demonstrated that Chiari patients without a syrinx
maintain a significantly greater perivascular flow into the cord over a physiologically realistic
range of arterial pulse wave shapes, indicating that the error introduced using idealised arterial
pulse shapes in previous studies is likely to be small. The results also suggest that changes in the
arterial pulse associated with aging (i.e. increased late systolic pulse amplitude and faster
diastolic decay) may slightly decrease perivascular flow.

63
4. The shape of the posterior fossa and its effects on cerebrospinal
fluid dynamics
Introduction
Chiari malformation type I is defined clinically by the herniation of the cerebellar tonsils
through the foramen magnum (Milhorat et al., 1999). Many patients with the condition are also
diagnosed with syringomyelia, a condition where a fluid filled cavity (syrinx) forms within the
spinal cord (Speer et al., 2003). Syrinxes have been associated with both sensory and motor
deficits (Sakushima et al., 2012). Although the mechanistic link between the two conditions is
unknown, it is assumed that changes in the cerebrospinal fluid (CSF) dynamics, caused by the
obstruction formed in the foramen magnum, play a significant role in the pathogenesis of a
syrinx.
Although 3-5mm of tonsillar herniation is used clinically to diagnose Chiari, it has been shown
to have no relation to a patient’s symptoms (Khalsa et al., 2018; Meadows et al., 2000) or the
risk of syrinx development (Masur et al., 1995; Stovner and Rinck, 1992). Other morphometric
measures of bony landmarks and position of soft tissues within the posterior cranial fossa (PCF;
Figure 4.1; Table 4.1), as well as the taper of the cervical subarachnoid space have been
suggested as characteristics that could affect CSF dynamics and result in syrinx formation.
Syrinx patients have been found to have a narrower foramen magnum (Eppelheimer et al.,
2018), and a greater clivus incline (Yan et al., 2016) compared with syrinx free Chiari patients
(Figure 4.1; line 7 and angle 9). Additionally, the anterior-posterior diameter of the
subarachnoid space decreases faster from the C7 to C4 vertebrae in syrinx patients (Gadde et al.,
2017; Thompson et al., 2016; Zhu et al., 2014).
Invasive in vivo pressure monitoring studies have documented that the spinal subarachnoid
pressures are elevated in Chiari patients (Heiss et al., 1999; Heiss et al., 2012), attributing the
pressure increase to the tonsils acting as a piston, driving a high pressure wave into the spinal
subarachnoid space. In contrast, computational models have demonstrated that tonsillar
pulsation produces a relatively small change in pressure relative to a static herniation (Linge et
al., 2011; Pahlavian et al., 2015). Additionally, Leung et al. (2016) demonstrated that there is no
difference between the tonsillar motion in syrinx and syrinx free Chiari patients. It was shown
with a series of subject-specific models that Chiari patients without a syrinx had an elevated
pulse pressure occurring earlier in the cardiac cycle, attributing this effect to the over-crowding
of the posterior fossa (Lloyd et al., 2017). However, despite numerous morphological (Table
4.1) and computational studies (Linge et al., 2011; Pahlavian et al., 2015), there remains no
clear understanding of how structures of the posterior fossa and cerebellar anatomy influence
CSF dynamics in the region of the foramen magnum.
64
The aim of this study was to use a series of subject specific anatomical models to investigate
how the anatomy of the craniocervical junction influences the subarachnoid pressure-time
profiles in Chiari patients, with and without a syrinx, compared with healthy controls. We
hypothesised that overcrowding in the posterior cranial fossa (PCF) reduces compliance and
causing the pressure peak to occur earlier in the cardiac cycle.

65
Linear
1) Height of PCF = perpendicular distance from the foramen magnum [Line 7] to the superior aspect of the tentorium.
2) Width of PCF = distance between the dorsum sellae of the clivus to the internal occipital protuberance.
3) Clivus length = distance between the dorsum sellae (superior point) to the basion (inferior point), also equals the sum of 4 and
5.
4) Basisphenoid length = dorsum sellae to the sphenoocciput.
5) Basiocciput length = basion to the sphenoocciput.
6) Supraocciput length (Occipital bone length) = the opisthion (posterior point of foramen magnum) to the internal occipital
protuberance.
7) Foramen magnum (McRae line) = anterior-posterior diameter between the basion and opisthion.
Angular
9) Clivus incline (Boogard angle) = angle between lines 3 and 7.
10) Tentorial angle = angle between lines 15 and 6.
11) Basal angle = angle between line 3 and a line extending along the anterior cranial fossa from the dorsum sellae.
12) Wackenheim angle = angle between line 3 and a tangent line connecting the posterior aspect of the dens to the caudal point of
the C2 vertebra.
13) Twining’s-tentoral angle = angle between lines 2 and 15.
Soft tissue 14) Tonsillar herniation below foramen magnum [Line 7]. (Distance below line is taken as positive.)
15) Tentorium length = From the internal occipital protuberance to the superior end of the tentorium.
16) Fastigium height = perpendicuar distance between the foramen magnum [Line 7] and the fastigium of the fourth ventricle.
17) Pons height = perpendicular distance between the foramen magnum [Line 7] the superior aspect of the pons at the invagination
before the midbrain.
18) Corpus callosum height = perpendicuar distance between the foramen magnum [Line 7] to the inferior aspect of the splenium
of the corpus callosum.
Areas
19) PCF area = area enclosed by lines 3,7,6,15,8
20) PCF osseous area = area enclosed by lines 3,7,6,2
Volumes
21) PCF volume = volume segmented form the same bounds as 19.
22) Hindbrain volume within the PCF volume [21].
23) CSF volume in PCF [21] = volume 21 minus volume 22.
24) Ratio of hindbrain volume:PCF volume – relative measure of overcrowding [Volumes 22/21].
Figure 4.1 Common morphometric measurements performed in the literature. Numbering scheme used to simplify
summary of study findings in Tables 4.1,3 &4. Measurements are divided into five categories, linear, angular, area,
and volumetric measures of PCF, in addition to measures of soft tissue location.

66 Table 4.1 Summary of Chiari morphometric studies. Table contains symbolic representations of the commonly investigated characteristics (for clarity, some insignificant measures or those used
in few studies were neglected). Significant findings are shown as; decrease (↓), increase (↑), no significant difference (NS), and measure not studied (-).Measurement codes corresponded to
Figure 4.1. For studies where Chiari patients both with and without a syrinx were grouped, the proportion of syrinx patients are noted (? Indicates where syrinx patients were included but the
number of patients was not quoted). *Indicates a measurement that was not calculated in the original study but can be calculated from the paper. 1The study includes 2 subjects with fourth
ventricle herniation which may affect the results. 2Study includes 364 Chiari patients but only 50 were used for quantitative analysis.
Study Number of subjects Comparison Linear measures Angular measures Soft tissue measurements Area Volume
1 2 3 4 5 6 7 9 10 11 12 13 14 15 16 17 18 19 20 21 22 23 24
This Study Control = 12
Chiari = 12
Chiari v
Control ↓ NS NS - - NS NS NS NS ↑ NS NS ↑ NS ↓ ↓ ↓ NS NS NS NS NS NS
Dagtekin et al. (2011)
Control = 25
Chiari = 15
Syrinx = 9/15
Chiari v.
Control - - NS ↓ ↑ ↓ ↑ - NS - - - - - - NS - - - - - - -
Alperin et al. (2014) Control = 37
Chiari = 36
Chiari v.
Control - ↓ ↓ - - ↓ NS - - - - - - - - - - - - ↓ NS - ↑
Alperin et al. (2015) Control = 37
Chiari = 63
Chiari v.
Control - - ↓ - - ↓ - - - - - - - - - - - - - ↓ NS - ↑
Nishikawa et al.
(1997)
Control = 50
Chiari = 301
Syrinx = 26/30
Chiari v.
Control - - NS - NS ↓ - - - - - ↑ - - - NS - - - NS NS - ↑
Nishikawa et al.
(1997)
Control = 50
Chiari = 301
Syrinx = 26/30
Chiari w/
basilar invagination v.
Control - - ↓ - ↓ ↓ - - - - - ↑ - - - NS - - - NS NS - ↑
Milhorat et al. (1999)
Control = 50
Chiari = 502
Syrinx = ?/50
Chiari v.
Control - - ↓ - - ↓ - - ↑ - - - ↑ - - - - - - ↓ NS ↓ ↑*
Karagoz et al. (2002)
Control = 21
Chiari = 22
Syrinx = 13/22
Chiari v.
Control - ↓ ↓ - - ↓ NS ↑ NS ↑ - ↑ - - - - - NS ↓ - - - -
Sekula et al. (2005) Control = 25
Chiari = 22
Chiari v.
Control - NS ↓ ↓ ↓ NS NS - - - - ↑ - - - NS - - - - - - -
Hwang et al. (2013)
Controls = 24
Chiari = 12
Syrinx = ?/12
Chiari v.
Control - ↓ ↓ - - NS ↓ ↑ ↑ - - - - - - NS - - - - - - -
Urbizu et al. (2014)
Controls = 50
Chiari = 100
Syrinx = 45/100
Chiari v.
Control ↓ NS ↓ NS NS ↓ NS - ↓ ↑ NS - ↑ ↓ ↓ ↓ ↓ ↓ ↓ - - - -
Milhorat et al. (2010) Controls = 80
Chiari = 388
Chiari v.
Control - - ↓ - - ↓ NS - - - - - - - - - - - - ↓ NS - ↑*
Aydin et al. (2005)
Control = 30
Chiari = 60
Syrinx = 46/60
Chiari v.
Control ↓ ↓ ↓ - - NS ↑ - - - - - - - - - - - - - - - -
Dufton et al. (2011) Control = 107
Chiari = 81
Chiari v.
Control - - ↓ - - - ↑ ↑ - - - - ↑ - - - - - - - - - -
Yan et al. (2016) Control = 40
Chiari = 36
Chiari v.
Control - ↓ ↓ - - ↓ NS NS - - - - - - - - - - - - - - -

67
Table 4.1 Continued summary of morphometric studies. Showing the studies that investigated the difference in morphology with sex, and the differences seen in syrinx patients. Significant
findings are shown as; decrease (↓), increase (↑), no significant finding (NS), and measure not studied (-). For studies where Chiari patients both with and without a syrinx were grouped, the
proportion of syrinx patients are noted (? Indicates where syrinx patients were included but the number of patients was not quoted). 3Study reassessed after reducing the data set to control for
age, race and body mass index.
Study Number of
subjects Comparison
Linear measures Angular measures Soft tissue measurements Area Volume
1 2 3 4 5 6 7 9 10 11 12 13 14 15 16 17 18 19 20 21 22 23 24
Schady et al. (1987) Control = 26
Chiari = 13
Male
Chiari v.
Control - NS ↓ - - - NS ↑ - ↑ - - - - - - - - ↓ - - - -
Stovner et al. (1993) Control = 14
Chiari = 11
Male
Chiari v.
Control - NS - - - - - - - - - - - - - - - - NS - - - -
Vega et al. (1990)
Control = 23
Chiari = 25
Syrinx = ?/25
Male
Chiari v.
Control - - ↓ - - - NS ↑ - ↑ - - - - - - - - ↓ ↓ - - -
Houston et al. (2019)
Control = 26
Chiari = 26
Syrinx = 8/26
Male
Chiari v.
Control ↓ ↑ ↓ - - NS NS ↑ ↓ NS ↓ - ↑ NS ↓ ↓ ↓ NS NS - - - -
Schady et al. (1987) Control = 23
Chiari = 19
Female
Chiari v.
Control - NS NS - - - NS ↑ - ↑ - - - - - - - - ↓ - - - -
Stovner et al. (1993) Control = 26
Chiari = 22
Female
Chiari v.
Control - NS - - - - - - - - - - - - - - - - ↓ - - - -
Vega et al. (1990)
Control = 23
Chiari = 17
Syrinx = ?/25
Female
Chiari v.
Control - - ↓ - - - NS ↑ - NS - - - - - - - - ↓ NS - - -
Houston et al. (2018)
Controls = 131-140
Chiari = 155-162
Syrinx = 28/162
Female
Chiari v.
Control ↓ NS ↓ - - NS ↑ ↑ NS ↑ ↓ - ↑ NS ↓ ↓ ↓ ↓ ↓ - - - -
Houston et al. (2018)3
Controls = 100-108
Chiari = 115-121
Syrinx = 21/121
Female
Chiari v.
Control ↓ NS ↓ - - NS ↑ ↑ NS ↑ ↓ - ↑ NS ↓ ↓ ↓ NS NS - - - -
Houston et al. (2019)
Control = 26
Chiari = 26
Syrinx = 6/26
Female
Chiari v.
Control
NS NS ↓ - - NS NS ↑ NS NS ↓ - ↑ NS ↓ ↓ ↓ NS NS - - - -
This Study Controls = 12
Syrinx = 9
Syrinx v.
Control ↓ NS NS - - NS NS NS NS NS NS NS ↑ NS ↓ ↓ ↓ NS NS NS NS NS NS
Eppelheimer et al. (2018) Controls = 140
Syrinx = 38
Syrinx v.
Control NS NS NS - - NS NS NS NS NS NS - NS NS NS ↓ NS ↓ NS - - - -
Yan et al. (2016) Control = 40
Syrinx = 48
Syrinx v.
Control - ↓ ↓ - - ↓ NS ↑ - - - - - - - - - - - - - - -
This Study Chiari = 12
Syrinx = 9
Syrinx free v.
Syrinx NS NS NS - - NS NS NS NS NS NS NS NS NS NS NS NS ↓ NS NS NS NS NS
Eppelheimer et al. (2018) Chiari =198
Syrinx = 38
Syrinx free v.
Syrinx NS NS NS - - NS ↑ NS NS NS NS - NS NS NS NS NS NS NS - - - -
Yan et al. (2016) Chiari = 19
Syrinx = 48
Syrinx free v.
Syrinx - NS NS - - NS NS ↑ - - - - - - - - - - - - - - -

68
Methods
MR imaging and anatomical segmentation
This study included analysis of previously collected anatomical MRI data from Clarke et al.
(2013a) and prospectively collected data that are part of a separate ongoing study. For
anatomical MRI data acquired in Clarke et al. (2013a), the experimental protocols were
approved by the University of New South Wales Human Research and Ethics Committee. The
South Eastern Sydney Local Health District Human Research Ethics Committee approved all
experimental protocols for the new data sets. All participants gave written informed consent to
enter the study. Thirty-two participants underwent MRI scanning of the head and neck; 12
healthy controls and 21 symptomatic Chiari I patients, 9 with and 12 without syringomyelia
(Table 4.2). 3D isotropic T1 weighted sagittal anatomical MRI scans of the cervical spine were
acquired. Parameters for the scan include; 0.94mm voxels, matrix = 288×288, FOV = 270×270,
TR/TE =5.5/2.5 ms and 180 slices of 0.94 mm thickness.
Table 4.2 Summary of participant information, showing age, weight and heart rate during MRI. Data displayed as
‘means ± S.D’ (range).
Subject Group Age Weight Heart Rate N
[Years] [Kg] [Bpm]
Control 37.3 ± 11.2 (24 -60) 66.9 ± 12.0 (53-85) 67.6 ± 10.8 (49.8-88.1) 12
Chiari w/o syrinx 33.6 ± 10.1 (22-60) 65.1 ± 10.0 (55-87) 66.7 ± 9.5 (51.9-81.3) 12
Chiari w/ syrinx 40.0 ± 9.76 (27-58) 73.5 ± 15.4 (55-100) 70.5 ± 9.5 (58.9-87.8) 9
Morphometric measurements
The structure of the posterior fossa and hindbrain were quantified taking linear, angular and area
measures on the midsagittal plane (when required images were reformatted to give the
midsagittal slice). The 21 measures taken are defined in Figure 4.1. The basisphenoid [line 4]
and basiocciput [line 5] lengths were excluded as their net effect is well described by the length
of the clivus [line 3]. Measurements were performed by a single observer with the open source
software 3D Slicer (https://www.slicer.org).
A single user segmented the fossa and hindbrain volumes as follows. The structures were
outlined in the axial plane at 5 mm intervals, the space between these was interpolated then
smoothed with a 2 mm Gaussian kernel. Boundaries were inspected and manually corrected.
Volume regions were defined (Figure 4.2), 1) parallel to the inferior aspect of the C1 vertebrae
to the foramen magnum (C1-FM), 2) from the foramen magnum to the Line 2 (osseous volume;
volume corresponding to previously measured osseous area [Area 20]), 3) from the foramen
magnum to the superior aspect of the tentorium (Fossa volume; volume corresponding to
previously measured posterior cranial fossa area [Area 19]). As the craniocervical junction is

69
continuous when calculating overcrowding (tissue volume / total volume) the C1-FM volumes
were added to the osseous (C1-Osseous) and fossa (C1-Fossa) volumes.
Figure 4.2 Example posterior fossa volume of a Chiari patient with a syrinx. Left: midsagittal view with the outline
of the segmented volume overlayed, blue = total volume of fossa, yellow = tissue volume. The volumes were divided
into the segments: A) between the C1 vertebra (1) and foramen magnum (2), B) from the foramen magnum (2) to the
anterior-posterior diameter of the fossa (3), and C) from line 3 to the superior aspect of the tentorium. Right: shows
the corresponding segmented volumes. A = C1-FM, A+B = C1-Osseous, A+B+C = C1-Fossa, B+C = volumes 21-23.
Spinal canal taper
The anteroposterior diameters of the cervical spinal canal from C1 to C7 were measured on the
midsagittal plain, this was measures perpendicular the spinal subarachnoid space at the mid-
point of each vertebrae. The caudocranial heights of the vertebra were measured between the
midpoints of the anteroposterior diameters at each level. Similar, to studies in the literature a
least square fit was used to estimate the spinal tapers (mm/level) between the C1-C7, C1-C4,
and C4-C7 regions. Spinal tapers were also calculated by the change in both anteroposterior
diameter and height ((𝑪𝒂𝒖𝒅𝒂𝒍 𝑫𝒊𝒂 − 𝑪𝒓𝒂𝒏𝒊𝒂𝒍 𝑫𝒊𝒂)
𝑪𝒂𝒖𝒅𝒐𝒄𝒓𝒂𝒏𝒊𝒂𝒍 𝑯𝒆𝒊𝒈𝒉𝒕⁄ ) for the same regions, to account for the
variation in height between subjects.
Subarachnoid pressure-time data
The effect of tonsillar obstruction on CSF dynamics was assessed against each subject’s
matched pressure-time data (derived from 24 previously published (Lloyd et al., 2017) and 8
original subject-specific computational models). In summary, 32 models of the cervical
subarachnoid space were manually segmented from the anatomical MRI. Cardiac-gated cine
phase-contrast MRI (PC-MRI) of CSF flow at the level of the cerebellar tonsils or foramen
magnum were used as an inlet boundary condition, the outlet was set with a 0 Pa reference
pressure. The CSF velocities and pressures were solved in ANSYS CFX (v17.1, ANSYS Inc.,
PA), and validated against MRI velocities measured in the cervical spine. The magnitude and
timing of the peak pressures calculated at the C2 level were analysed in this study. Cardiac PC-
MRI was not available for one Chiari subject which was excluded from modelling.

70
Statistical analysis
The morphometric measures were compared between subject groups with a one-way ANOVA,
using a Bonferroni post hoc test to identify group differences when a significant difference (p <
0.05) was found. For variables which were non-normally distributed a Kruskal-Wallis test was
performed, and with a post-hoc Mann-Whitney U test to identify group differences. Linear
regression was used to determine whether features of the subarachnoid pressure profiles were
significantly associated with the morphometric measures of overcrowding. Analyses were
conducted with IBM Statistics (v24, IBM Corp., Armonk, NY).
Results
Posterior fossa morphology
All morphological measurements are shown in Tables 4.3 and 4.4, for the normally and non-
normally distributed variables respectively. Both Chiari patients with and without a syrinx had
a; greater tonsillar herniation [line 14], lower fastigium [line 16], pons [line 17], and a greater
ratio of the volume occupied by tissue between the C1-FM, C1-Osseous, and C1-Fossa
segments. Table 4.1 contains a summary of significant trends for comparison with the other
studies in the literature. The midsagittal cross-sectional area of the posterior fossa was found to
be significantly smaller (area 19 = ‒13%) in syrinx patients compared with syrinx free subjects.

71
Table 4.3 Descriptive statistics of the morphological measures that were normally distributed. Linear measures are in
mm, angular measures are in degrees, the areas are in mm2, volumes in ml, and ratios are non-dimensional. None of
the variables in this table were significantly different between groups.
Measure Control Chiari w/o syrinx Chiari w/ syrinx
Mean 95% CI Mean 95% CI Mean 95% CI
Linear 7 37.3 35.3-39.3 36.9 35.1-38.7 36.2 33.3-39.2
Volume 21 192.3 181.6-202.9 181.9 166.8-197.0 182.8 167.9-197.8
C1-Fossa
Volume Total 201.2 189.9-212.5 190.1 174.8-205.6 191.5 174.9-208.1
Table 4.4 Descriptive statistics of the morphological measures that were non-normally distributed. Linear measures
are in mm, the areas are in mm2, volumes in ml, and ratios are non-dimensional. Significant comparisons are in bold,
italicised, and indicated with asterisks, * p < 0.05, ** p < 0.01, and *** p < 0.001. Comparison N-C is between
controls and Chiari patients without a syrinx, N-S is between controls and patients with a syrinx, and C-S is between
patients with and without a syrinx.
Measure Control Chiari w/o syrinx Chiari w/ syrinx Comparison
Median IQR [Q1-Q3] Median IQR [Q1-Q3] Median IQR [Q1-Q3] N-C N-S C-S
Linear
1 66.6 64.7-70.3 61.8 57.1-68.5 59.8 59.0-65.1 * *
2 83.5 82.2-88.5 81.6 80.9-86.2 83.9 81.8-87.9
3 44.1 42.2-48.7 43.1 40.8-44.5 41.1 39.8-45.0
6 39.8 37.4-46.4 39.2 36.3-42.1 41.1 39.9-44.9
Angular
9 117.1 111.7-118.4 119.7 114.9-123.7 117.6 111.5-133.3
10 98.0 90.9-107.3 98.1 89.8-103.8 93.9 89.1-95.0
11 113.0 108.2-119.3 120.0 117.4-124.7 115.8 109.9-120.4 *
12 151.1 147.8-157.8 150.0 147.0-154.3 150.5 136.6-160.7
13 40.5 37.4-44.8 41.3 39.7-46.3 38.8 37.3-40.1
Soft tissue
14 –2.57 –5.22- –1.28 6.91 1.78-9.62 7.89 5.51-10.7 *** ***
15 49.4 47.2-51.4 49.2 46.9-50.3 45.6 43.7-46.9
16 32.7 31.0-34.2 28.3 25.8-29.5 28.3 25.6-29.1 *** ***
17 43.1 41.6-44.9 39.4 36.5-40.8 40.6 32.8-42.4 *** *
18 62.9 61.8-64.1 60.0 55.7-62.6 57.7 54.4-60.1 * **
Area 19 3595 3219-3873 3650 3262-3937 3178 2996-3499 *
20 2217 1804-2416 2035 1864-2161 1869 1674-2249
Volume
22 169.0 150.0-175.2 155.0 143.0-179.7 159.2 149.5-168.5
23 27.4 23.6-32.3 21.5 18.8-27.3 24.2 16.7-30.4
24 0.85 0.82-0.88 0.87 0.85-0.89 0.89 0.84-0.90
C1-FM
Volume
Tissue 2.51 1.85-3.02 3.87 3.56-4.72 4.89 4.01-6.25 *** ***
Total 9.13 7.62-9.67 8.03 7.59-9.36 7.86 6.96-10.5
Ratio 0.27 0.24-0.28 0.45 0.40-0.66 0.56 0.40-0.65 *** ***
C1-Osseous
Volume
Tissue 129.7 117.4-141.8 122.7 107.1-138.7 129.9 114.6-140.5
Total 152.7 146.5-167.2 141.5 122.6-158.3 147.6 126.4-164.9
Ratio 0.83 0.80-0.86 0.87 0.84-0.89 0.89 0.85-0.90 ** **
C1-Fossa
Volume
Tissue 171.4 151.8-177.7 159.8 146.5-184.3 164.1 152.8-174.5
Ratio 0.83 0.79-0.85 0.85 0.84-0.88 0.88 0.83-0.88 * *

72
Spinal canal taper
Table 4.5 shows the measured spinal canal taper, for each of the defined regions. No significant
differences were found between subject groups, for either the tapers which accounted for
variance in the vertebral height or normalised by spinal level.
Table 4.5 Median spinal tapers measured within the cohort.
C1-C7 C1-C4 C4-C7
Group Median IQR [Q1-Q3] Median IQR [Q1-Q3] Median IQR [Q1-Q3]
Ta
per
[mm
/mm
] Control –0.03 –0.04- –0.02 –0.07 –0.09- –0.05 0.002 –0.02-0.03
Chiari w/o
syrinx –0.04 –0.06- –0.02 –0.08 –0.12- –0.06 –0.003 –0.02-0.04
Chiari w/
Syrinx –0.03 –0.06- –0.02 –0.06 –0.11- –0.02 –0.011 –0.03- –0.02
Ta
per
[mm
/lev
el]
Control –0.58 –0.81- –0.43 –1.4 –1.8- –0.92 0.05 –0.34-0.37
Chiari w/o
syrinx –0.64 –1.1- –0.50 –1.6 –2.2- –1.1 –0.10 –0.20-0.40
Chiari w/
Syrinx –0.75 –1.1- –0.26 –1.4 –2.2- –0.51 –0.05 –0.50-0.37
The effect of craniocervical obstruction on the subarachnoid pressure waveform
The relationships between tonsillar obstruction and the subarachnoid pressures are shown in
Figure 4.3. In controls or syrinx free patients the measures of obstruction (herniation [line 14],
and the volume ratios) were neither correlated with the magnitude or timing of the peak
pressures. Pooling syrinx free patients and controls together showed the magnitude and timing
to be weakly associated with herniation (Figure 4.3A and E) and the ratio of the volume
occupied between C1-FM (Figure 4.3B and F), whereas in syrinx patients the peak timing was
moderately correlated with the tonsillar herniation (Figure 4.3A) and strongly related to the
volume occupied between C1-FM (Figure 4.3B).

73
Figure 4.3 Relationship between the timing (A-D) and magnitude (E-H) of the subarachnoid pressures and the measures of obstruction. Linear relationships shown A-F are all significant
(p<0.05). No significant relationships were found between the C1-Osseous/C1-Fossa overcrowding and the peak pressure for either subjects with or without a syrinx. R2 is the coefficient for
determination for the linear regression lines shown. Relationships in syrinx free subjects are shown as a solid line, the dashed line indicated a relationship in the syrinx patients.

74
Discussion
This study found in general that the morphology of the posterior cranial fossa and the spinal
canal in Chiari patients were in the range of healthy controls. However, the structures of the
brain were located closer to the foramen magnum, which may be a contributing factor to why
the posterior fossa in Chiari patients was occupied by a greater fraction of nervous tissue.
Similar to other studies, the position of the pons, fastigium of the fourth ventricle and splenium
of the corpus callosum were found to be closer to the foramen magnum in Chiari patients
compared with controls (Eppelheimer et al., 2018; Houston et al., 2018; Urbizu et al., 2014).
This has generally been overlooked, likely attributing the descent of the hindbrain to structural
differences in the posterior fossa. However, Chiari patients have been found to have shorter
intracranial heights (Eppelheimer et al., 2018; Houston et al., 2019; Houston et al., 2018;
Taştemur et al., 2017) and widths (Taştemur et al., 2017) compared with controls, suggesting
that supratentorial abnormalities and other structures in the cranium could affect posterior fossa
overcrowding (Heiss, 2014).
The absolute value of the measurements are within the ranges of previous investigations, for
both the linear, angular (Houston et al., 2018; Urbizu et al., 2014; Yan et al., 2016) and
volumetric (Alperin et al., 2014; Khalsa et al., 2018; Khalsa et al., 2017; Nishikawa et al., 1997)
measures. In contrast to previous studies only the posterior cranial fossa height [linear 1] and
basal angle [angle 11] were significantly different between Chiari patients and controls (Table
4.1). Additionally, the total volume of the posterior fossa and the volumes of the hind brain (C1-
Osseous and C1-Fossa) were not different compared with controls, however Chiari patients
were still significantly more overcrowded (Table 4.4). These results indicate that the group wise
differences are related to the overall shape of the cranial volume rather than the absolute size of
the structures. This would allow for various structures to be within normal ranges and still cause
overcrowding.
Interestingly, in syrinx free patients the midsagittal area [area 19] of the posterior fossa was not
different from controls, but it was significantly smaller in patients with a syrinx compared with
patients without (Table 4.4). These differences in shape will alter the overall distribution of the
cranial volume, which may cause local variations in overcrowding, restricting and forming
alternate fluid pathways. This in turn may contribute to the difference in CSF dynamics between
those with and without a syrinx (Figure 4.3A, B, E, and F) and play a role in syrinx
development.
In syrinx patients a strong association was seen between the timing delay of the peak pressure
pulse and the obstruction of the subarachnoid space below the foramen magnum (Figure 4.3B).
Previously this delay has been attributed to the increase in spinal compliance introduced by the

75
fluid cavity (Cirovic and Kim, 2012; Martin and Loth, 2009). Although the dimensions of
syrinx cavity were not quantified in this study, the syrinx patient with the longest delay had a
visually smaller syrinx compared with the patient with the earliest timing. This could suggest
that the delay seen is primarily the result of the obstruction, similar to that seen in various
models of stenosis (Stoverud et al., 2013) and arachnoiditis (Cheng et al., 2012).
Study limitations
The sample size of this study (N = 33) compared with other studies is underpowered to detect a
small effect size between morphological measures. This may explain why our results differ from
previous studies in different patient populations, and limited inference should be taken from the
results when assessing the performance of a morphological measurement as a clinical marker
for Chiari malformation. However, even between the larger studies there are conflicting findings
and large variance in the effect size of the differences between controls and Chiari patients
(Houston et al., 2018; Karagoz et al., 2002; Urbizu et al., 2014), suggesting these measures are
unreliable for clinical use. A contributing factor to this may be related to the different
demographics sampled in those studies (Bogdanov et al., 2019; Brickell et al., 2006; Roller et
al., 2015), and this needs to be assessed in future studies. An additional limitation of the cross-
sectional study design is that the data is taken from a single time point and provides no
information as to how the morphology may cause change in the CSF dynamics over time. All
data in this study was collected manually by a single user which, while consistent, may
introduce a source of human error and bias.
CSF dynamics are likely influenced by the size of the syrinx cavity (Martin et al., 2010; Martin
and Loth, 2009) and supratentorial structures (Heiss, 2014). However, due to the limited field of
view used for the acquisition of the anatomical images, these features could not be quantified.
Imaging protocols have since been altered so their influence can be fully investigated in future
studies.
The current analysis of Chiari morphology is limited by its reliance on the analysis of the
midsagittal plane, and it has been shown that these are poor predictors of the overall volume
(Alperin et al., 2014). More advanced shape analysis techniques such as spherical harmonic
decomposition (SPHARM) could be used in future investigations. These methods parameterise
the volume, allowing for the comparison of local differences about the whole volume (Paniagua
et al., 2013; Styner et al., 2006). Although the available software is still under development and
requires validation, SPHARM may help identify better clinical markers of Chiari malformation.
The relationship between the posterior fossa morphology and subarachnoid pressures was
assessed using cardiac-gated data. With the development of real-time MR imaging techniques,
the significance of respiration on CSF dynamics has been emphasised (Aktas et al., 2019;

76
Dreha-Kulaczewski et al., 2017; Dreha-Kulaczewski et al., 2018; Yamada et al., 2013).
Coughing and straining is known create large changes in the subarachnoid pressures, driving
CSF cranially (Williams, 1976; Williams, 1981a). As such, understanding how overcrowding
alters the response to a sudden increase in pressure may inform our understanding of Chiari
symptomology and syrinx development.
Conclusion
The morphometric analysis showed that the craniocervical junction was overcrowded, and that
the mid-sagittal area of the posterior fossa was significantly smaller in syrinx patients compared
with syrinx free Chiari patients. This suggests that there are differences in the overall shape of
the posterior cranial fossa between the two patient groups, which could create local changes to
the CSF pathways and dynamics. The results of this study suggest that the timing of the
subarachnoid pressures may be influenced by the degree of tonsillar obstruction, particularly in
the base of the posterior fossa. Structural differences in the posterior fossa significantly
influence the pressure timing and may influence whether a syrinx is formed. Future
morphological assessments of the occipital bone and syrinx cavity are planned to provide
further insight into the pathophysiology of Chiari malformation and syringomyelia.

77
5. Respiratory cerebrospinal fluid flow is driven by the thoracic and
lumbar spinal pressures
Introduction
Both the cardiovascular and respiratory systems contribute to the pulsatile flow of cerebrospinal
fluid (CSF). The cardiac component is well understood to be dependent on the blood volume
balance within the cranium (the Monro-Kellie hypothesis; Figure 5.1) (Mokri, 2001), as the
cranium is rigid and of a fixed volume, so as the volume of arterial and venous blood varies
over the cardiac cycle, CSF is either displaced into or out of the spinal canal to compensate
(Alperin et al., 2005a; Alperin et al., 2005b).
Figure 5.1 Schematic of the Monro-Kellie hypothesis (QA=arterial flow, Qv=venous flow and QCSF=CSF flow). (A)
Labelled schematic demonstrating a hypothetical initial or resting state. The cranial volume is constant, as the net
blood volume increases CSF is displaced into the spinal canal (B). Conversely, a decrease in blood volume draws
CSF cranially (C).
Respiratory-driven CSF flow depends on two different mechanisms. In the case of forced
expiratory efforts such as coughing or a Valsalva manoeuvre, spinal pressures are increased
(Hamilton et al., 1944; Hamilton et al., 1936), driving CSF cranially (Du Boulay et al., 1972;
Martins et al., 1972; Williams, 1976; Williams, 1981a, b). This is facilitated by the epidural
veins (Figures 5.2A and 5.2B), a valveless network spanning the length of the spine that allows
backflow from the vena cava (Batson, 1940; Henriques, 1962). When the intrathoracic or
abdominal pressures are increased, blood flows into the spinal canal and compresses the dural
sac, displacing CSF (Du Boulay et al., 1972; Martins et al., 1972; Reitan, 1941). On the other
hand, CSF flow during normal respiration is commonly accepted to be driven by the Monro-
Kellie hypothesis (Figure 5.1). During inspiration CSF has been shown to flow cranially (Aktas
et al., 2019; Dreha-Kulaczewski et al., 2017; Dreha-Kulaczewski et al., 2018; Yamada et al.,
2013), compensating for the increase in venous return from the cranium (Dreha-Kulaczewski et
al., 2017) as a result of decreased intrathoracic pressures. Conversely, during expiration CSF
flows caudally as venous return decreases.

78
Figure 5.2 Schematic of the effects of respiration on the venous blood flow in the epidural veins. A) Resting
condition, highlighting the possible directions of venous blood flow (solid black arrows) in the respective vessels. B)
With a cough or Valsalva manoeuvre, both intrathoracic and abdominal pressures become positive, driving blood into
the epidural veins, compressing the dural sac driving CSF cranially. C) During inspiration the intrathoracic pressures
becomes negative, increasing venous return in the internal jugular veins (IJV) and epidural veins, removal of blood
from the thoracic epidural veins decreases the pressure in the spinal canal, if this is greater than the increased lumbar
spinal pressures CSF may flow caudally.
However, the Monro-Kellie hypothesis fails to account for why CSF would flow caudally
during inspiration as has been reported in several imaging studies (Aktas et al., 2019; Dreha-
Kulaczewski et al., 2017; Dreha-Kulaczewski et al., 2018). Aktas et al. (2019) demonstrated
that diaphragmatic breathing resulted in greater cranial CSF flow compared with thoracic
breathing, suggesting that increased epidural pressure (Usubiaga et al., 1967) as a result of
greater abdominal pressures caused the increase in CSF flow. Therefore, by the same logic it is
possible that the decrease in the thoracic epidural pressure during inspiration could act to draw
CSF caudally (Usubiaga et al., 1967; Figure 5.2C).
CSF plays an important role in the transport of solutes and metabolic waste. CSF flows
continuously between the ventricles, to the subarachnoid space of both the cranium and spinal
canal. Understanding the mechanisms which drive CSF circulation is critical for clinical
problems such as identification of a mechanistic link between obstructive CSF disorders and the
formation of fluid filled cavities within the spinal cord (syringomyelia), or establishing the
kinematics of intrathecal drug injections and their efficacy.
The aim of this study was to determine the mechanisms which drive respiratory CSF flow in
healthy human subjects. Real-time phase-contrast magnetic resonance imaging (PC-MRI) is a
non-invasive method for the quantification of fluid velocities, and is uniquely capable of
capturing the changes in CSF and blood flow velocities in response to respiration. The
intrathoracic and abdominal pressures were also recorded, so the pressures required to drive
flow could be assessed. We hypothesised that respiratory CSF flow is dependent on the change
in the epidural blood volume within the spinal canal, and not only the Monro-Kellie hypothesis.

79
Methods
Subjects
Ten healthy subjects were enrolled in the study, consisting of five females (age 32±10 years;
weight 65±14 kg; height 174±9 cm; mean ± S.D.) and five males (age 31±6 years; weight
86±8 kg; height 181±3 cm; mean ± S.D.). Subjects underwent MRI scans to quantify arterial,
CSF and venous flow in response to respiratory changes. In a separate session, the same
manoeuvres were performed with a pressure transducer used to measure the intrathoracic and
abdominal pressures. The South Eastern Sydney Local Health District Human Research Ethics
Committee approved all experimental protocols, and these were conducted according to the
Declaration of Helsinki (2013) with the exception of clause 35. All participants gave written
informed consent and had no contraindication for MR imaging.
Respiratory manoeuvres
While supine, participants were instructed to perform either; a sniff (a nasal inspiratory effort,
with close mouth), an expiratory sniff (a nasal expiratory effort, with close mouth), or a weak
cough (equivalent to a throat clear) between normal breaths. The manoeuvres were performed at
the end of expiration, to ensure all manoeuvres started from approximately the same expiratory
lung volume. The inspiratory and expiratory sniffs were performed several times at low,
medium, and high intensities (which were self-reported to scale by approximately a factor of
two between each intensity level), to assess effect respiratory effort has on the magnitude of
CSF flow. Before either the MRI scan or pressure measurements participants were informed of
and practiced the respiratory manoeuvres.
MRI scans
MRI data were collected using a 3T Philips Achieva 3TX (Philips Healthcare, Best, The
Netherlands). Subjects lay supine and were asked to keep still and breathe quietly, with the
Frankfort plane vertical. Foam pads were placed around the head to reduce head motion. The
16-channel neurovascular head coil was used to image flow in the cervical spinal canal. The 16-
channel torso coil was used to capture flow in the lumbar spinal canal. Respiratory motion was
recorded concurrently with a respiratory monitoring band which measures the displacement of
the thorax, positioned below the xiphoid process of the sternum. During the real-time scans the
subjects were instructed to perform the various respiratory manoeuvres as the scans were
triggered. The timing was confirmed with the respiratory band signal. Scanning parameters for
the real-time PC-MRI include; flip angle = 20°, matrix=96×81, C3 FOV=192×192mm, L2
FOV=210×300mm, TR/TE = 13/7ms and a slice thickness of 10mm. The scanning planes were
positioned mid-C3 and mid-L2 perpendicular to the spinal canal (Figure 5.3). The encoding
velocities (Venc) were set to 10-45 cm s-1 for CSF measurements and 55-105 cm s-1 for blood
flow, acquiring 200 phases at 70 and 140ms intervals at C3 and L2 respectively. Scans were

80
repeated with a higher Venc when aliasing artefacts were present, but small errors were still
present in some scans, which were corrected manually by adding or subtracting 2π to affected
pixels (Bioucas-Dias and Valadao, 2007). Velocity was calculated from the PC-MRI scans
using Segment software (Heiberg et al., 2010). Regions of interest were manually drawn and
tracked over the spinal subarachnoid space and epidural veins (Figure 5.3). In the cervical
region, additional regions of interest included the vertebral arteries, internal carotid arteries, and
the internal jugular veins (IJV).
Figure 5.3 Diagrammatic presentation of the experimental set-up. A) Participants lay supine of the scanning bed. For
cervical scans the neurovascular head coil (dashed lines) is used, and the imaging plane is positioned in the middle of
the C3 vertebrae perpendicular to the spinal canal. For lumbar scans the torso coil (dotted lines) is used, and the
imaging plane is positioned mid-L2 perpendicular to the spinal canal. The respiratory band was positioned at the
sternum and used during both the cervical and lumbar scans. Images B and D show cropped views of the imaging
planes for mid-C3 and mid-L2 respectively, with the regions of interest annotated.
Pressure measurements
While seated, lignocaine (Co-phenylcaine Forte 5%) was administered nasally to numb the
nasopharynx. A catheter with two the pressure sensors (CTO/4E-2, Gaeltec, Dunvegan,
Scotland) was inserted via one nostril. The subjects were placed in the supine position and
instructed to perform some coughs and sniffs, to ensure that the proximal and distal pressure
sensors were in the oesophagus and stomach respectively. The catheter was then taped at the

81
nose and forehead. Subjects were left to acclimatise to the catheter for 2-9 minutes until a
regular respiratory rhythm was resumed. Subjects were given similar instructions as during the
MRI scans, to perform the respiratory manoeuvres at the end of expiration, being given real-
time feedback to perform manoeuvres at the end of expiration, and the amount of effort to give
in order to achieve three consistent repeats. Subjects were similarly instructed to increase or
decrease the effort of a manoeuvre to ensure that the high, medium, and low intensity
inspiratory/expiratory sniff peak pressures scaled by a factor of 2. The pressure sensor was
calibrated against the hydrostatic pressure of a column of water. The signal was amplified
(S7b/2, Gaeltec, Dunvegan, Scotland) and converted from an analogue to a digital input (Power
1401, Cambridge Electronic Design, Cambridge, UK) being sampled at 100 Hz with Spike2
(v7, Cambridge Electronic Design, Cambridge, UK).
Data analysis
The flow data were segmented into epochs containing the respiratory manoeuvres (i.e. cough,
expiratory, or inspiratory sniff). The signal from the respiratory band was used to identify the
timing of the event. The time-series mean was calculated from the raw 200 phases collected,
and an event was confirmed if the peak CSF velocities were ±2 S.D. greater than the time-series
mean. Internal jugular vein flows where contralateral flow was in opposing directions were
excluded from analysis. The CSF velocities were integrated with the trapezium method to
estimate the CSF displacement. The following features of interest were compared: peak cranial
and caudal CSF velocities, and peak CSF displacement. Pressure recordings were also divided
into epochs of the manoeuvres (i.e. cough, expiratory, or inspiratory sniff excluding the normal
breaths), taking the peak intrathoracic and abdominal pressures for comparison.
Pre-processing
A cross-correlation can be used to compare the similarity of time-series data, but a requirement
is that the signal is stationary. Our hypothesis is that CSF is displaced by the compression of the
dural sac and would have a similar waveform to the epidural blood flow. However, the CSF
displacements were non-stationary signals. To make the signals stationary they can be
differentiated, comparing the CSF velocity with the venous acceleration. The time scales were
normalised to the duration of the respiratory manoeuvre (i.e. duration of a cough, expiratory or
inspiratory sniff). On a normalised time scale all signals were fitted by a 4th order Fourier series,
to smooth and reduce the data to the same number of time points. The venous blood velocities
were then numerically differentiated. To further remove noise from the data, for each subject an
ensemble average was taken from the repeated measures of each respiratory manoeuvre (cough
or high intensity expiratory/inspiratory sniff).

82
Statistical analysis
Cross-correlations were performed between the ensemble averaged CSF and venous time-series
data for coughs and high intensity expiratory/inspiratory sniffs using MATLAB (v8.6, The
MathWorks Inc, MA), taking the maximum correlation coefficient within a lag 20% of the
normalised event duration. A linear mixed model (LMM) was used to compare whether the CSF
velocities/displacement or intrathoracic/abdominal pressures were different between the high
and medium or medium and low intensity respiratory manoeuvres. The LMM accounts for
missing values, and bootstrapping with 1000 samples was used to correct for non-normally
distributed variables. The model incorporated the fixed effects of the location (spinal location
C3 or L2, or catheter probe location abdominal or thoracic), manoeuvre intensity and their
interaction. The LMM also accounts for the within-subject similarity between the repeated
measurements taken at C3/L2 and at different manoeuvre intensities. Pairwise comparisons
were performed with a Bonferroni correction, considering p < 0.05 to be statistically significant
(IBM Statistics v24, IBM corp., Armonk, NY). Linear regression analysis was performed
between the median peak CSF displacements and median peak trunk pressures of each subject
(assuming data collected from manoeuvres at the same intensity were paired), for inspiratory
and expiratory manoeuvres. Similarly, stepwise multiple regression analysis was performed to
determine the relationship between the CSF displacements and trunk pressures pooling
inspiratory and expiratory efforts. A variable was included in the model if p < 0.05 and
excluded when p > 0.10. Heteroscedasticity was checked using the Goldfeld-Quandt test. Where
data were heteroscedastic, regression analysis was performed using bootstrapping methods
(with 1000 samples), which does not assume homoscedasticity.

83
Figure 5.4 Sample measurements of pressures and velocity in an individual subject for each of the respiratory
manoeuvres. A) MRI velocities at mid-C3 in the carotid (red) and vertebral (pink) arteries, subarachnoid space
(green), and the epidural (dark blue) and internal jugular (light blue) veins. B) Intra-abdominal (black) and
intrathoracic (grey) pressures. C) MRI velocities at mid-L2 in the subarachnoid and epidural veins. A cranial
displacement/velocity is positively signed, and a negative sign indicates a caudal displacement/velocity. Note cervical
MRI (A), lumbar MRI (C) and pressure measurements (B) were not collected concurrently, so absolute time scales
and respiratory manoeuvres are not the same. Arrows are used to indicate the timing of the peaks which correspond to
the respiratory manoeuvres (cough/expiratory and inspiratory sniffs).

84
Results
Figure 5.4 shows typical data obtained from the MRI scans and pressure transducer in a subject
during sequences of coughs, expiratory sniffs, and sniffs. The epidural and IJV velocity
waveforms follows the abdominal and intrathoracic pressure traces. Similarly, the relatively
large responses in CSF flow are seen to occur at the same time as in the venous flow.
CSF and venous blood flow during expiratory efforts
Figures 5.5 and 5.6 shows an example of a representative subject performing several coughs and
expiratory sniffs. During the expiratory efforts both the intrathoracic and abdominal pressures
are elevated (Figure 5.5/6 C and F). This corresponds to an influx of venous blood into both the
cervical and lumbar epidural veins (Figure 5.5/6 B and E), giving a cranial displacement of CSF
(Figure 5.5/6 A and D). In the lumbar spine both cranial and caudal epidural flow indicate an
influx of blood, however whether it fills the thoracolumbar (cranial) or lumbosacral (caudal)
sections depends on the pressure gradient in the trunk relative to the imaging plane. The
expiratory sniffs showed the same response as the coughs, with a lower magnitude change.
Figure 5.5 Example of one subject’s repeated coughs, followed by a normal breath (marked by red dashed line). A
and D show the CSF displacement, B and E show the corresponding epidural velocities, C and F show the
intrathoracic and abdominal pressures respectively. A cranial displacement/velocity is positively signed, and a
negative sign indicates caudal a displacement/velocity. The expiratory-sniffs show the same response (Figure 5.6).
The cervical MRI, lumbar MRI and pressure measurements are not measured concurrently, so duration of a cough
will differ between panels.

85
Figure 5.6 Example of one subject’s repeated expiratory sniffs, followed by a normal breath (marked by red dashed
line). A and D show the CSF displacement, B and E show the corresponding epidural velocities, C and F show the
intrathoracic and abdominal pressures respectively. A cranial displacement/velocity is positively signed, and a
negative sign indicates caudal a displacement/velocity. The cervical MRI, lumbar MRI and pressure measurements
are not measured concurrently, so duration of an expiratory sniff will differ between panels.
CSF and venous blood flow during inspiratory efforts
Figure 5.7 shows the same representative subject performing several sniffs. During the sniff the
abdominal pressure increased and the thoracic pressures became negative (Figure 5.7C and F).
Similar to the expiratory efforts in the lumbar spine, this corresponded to an influx of venous
flow into the spinal canal and a cranial displacement in CSF flow (Figure 5.7D and E). In the
cervical spine, there was an increase of venous flow from the cranium to the thoracic spine
(Figure 5.7B). For the majority of sniffs CSF was initially drawn in the same direction as the
blood flow (caudally), and transitions to a cranial displacement in the later phase of the sniff
(Figure 5.7A). However, for two sniffs there was a large cranial displacement of CSF. Note
there appears to be no difference in the epidural blood flow corresponding to these sniffs.
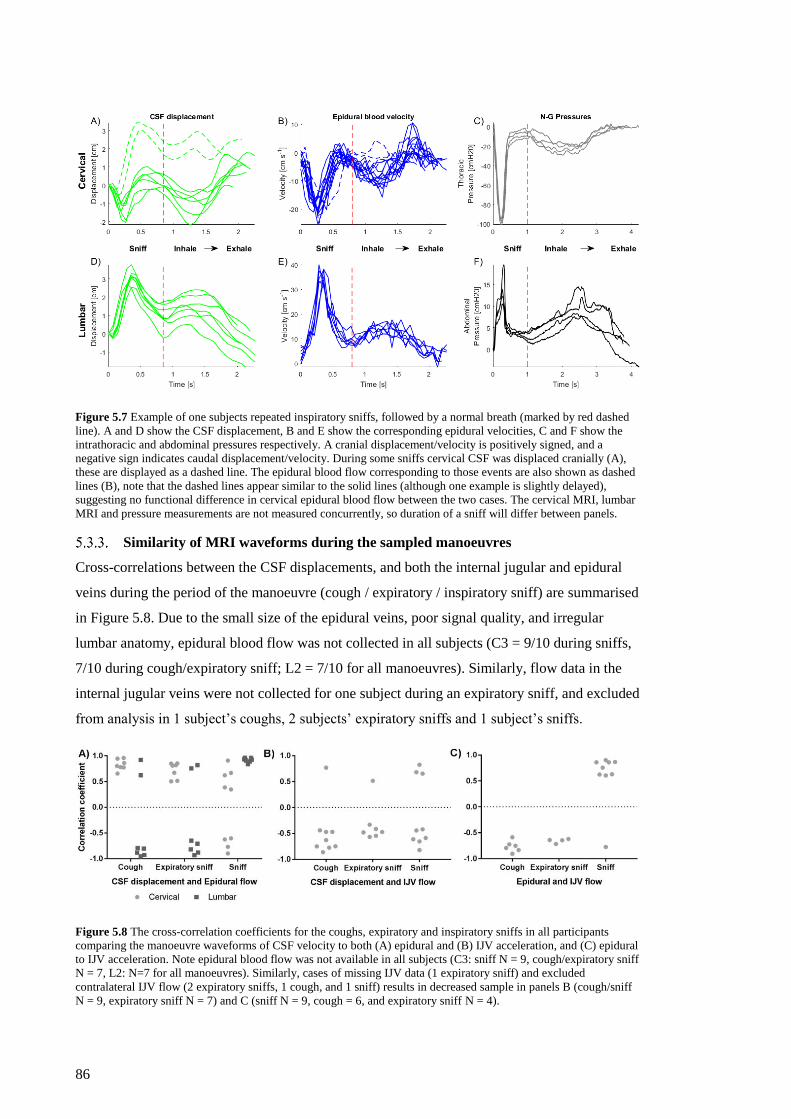
86
Figure 5.7 Example of one subjects repeated inspiratory sniffs, followed by a normal breath (marked by red dashed
line). A and D show the CSF displacement, B and E show the corresponding epidural velocities, C and F show the
intrathoracic and abdominal pressures respectively. A cranial displacement/velocity is positively signed, and a
negative sign indicates caudal displacement/velocity. During some sniffs cervical CSF was displaced cranially (A),
these are displayed as a dashed line. The epidural blood flow corresponding to those events are also shown as dashed
lines (B), note that the dashed lines appear similar to the solid lines (although one example is slightly delayed),
suggesting no functional difference in cervical epidural blood flow between the two cases. The cervical MRI, lumbar
MRI and pressure measurements are not measured concurrently, so duration of a sniff will differ between panels.
Similarity of MRI waveforms during the sampled manoeuvres
Cross-correlations between the CSF displacements, and both the internal jugular and epidural
veins during the period of the manoeuvre (cough / expiratory / inspiratory sniff) are summarised
in Figure 5.8. Due to the small size of the epidural veins, poor signal quality, and irregular
lumbar anatomy, epidural blood flow was not collected in all subjects (C3 = 9/10 during sniffs,
7/10 during cough/expiratory sniff; L2 = 7/10 for all manoeuvres). Similarly, flow data in the
internal jugular veins were not collected for one subject during an expiratory sniff, and excluded
from analysis in 1 subject’s coughs, 2 subjects’ expiratory sniffs and 1 subject’s sniffs.
Figure 5.8 The cross-correlation coefficients for the coughs, expiratory and inspiratory sniffs in all participants
comparing the manoeuvre waveforms of CSF velocity to both (A) epidural and (B) IJV acceleration, and (C) epidural
to IJV acceleration. Note epidural blood flow was not available in all subjects (C3: sniff N = 9, cough/expiratory sniff
N = 7, L2: N=7 for all manoeuvres). Similarly, cases of missing IJV data (1 expiratory sniff) and excluded
contralateral IJV flow (2 expiratory sniffs, 1 cough, and 1 sniff) results in decreased sample in panels B (cough/sniff
N = 9, expiratory sniff N = 7) and C (sniff N = 9, cough = 6, and expiratory sniff N = 4).

87
Correlations during expiratory efforts
In the lumbar spinal canal, during an expiratory effort there was an increase in epidural blood
flow and CSF was displaced cranially. In two subjects the epidural blood flow was also in phase
flowing cranially, in the remaining five subjects epidural flow was directed caudally (Figure
5.8A). The correlation between the waveforms ranged from moderate to strong for both the
coughs (Cross-correlation; 0.62 – 0.95) and expiratory sniffs (Cross-correlation; 0.65 - .93).
Whereas, in the cervical spinal canal there was a more consistent response. For all subjects
during an expiratory effort there would be an increase in cranial epidural blood flow and CSF
displacement. Being in phase, the coughing (Cross-correlation; 0.77 – 0.96) and expiratory sniff
(Cross-correlation; 0.50 – 0.85) traces showed strong and moderate correlations respectively. In
all but one subject the cranial displacement of CSF was accompanied by an increase venous
drainage via the internal jugular veins (Figure 5.8B). Similarly, in all subjects epidural and
internal jugular flow were out of phase (Figure 5.8C; in the subject who exhibited cranial flow
in the internal jugular in response to a cough/expiratory sniff, epidural flow data was not
available).
Correlations during inspiratory efforts
In the lumbar spinal canal, increased epidural blood flow corresponded with an increase in CSF
displacement, with both being directed cranially and in phase in all subjects (Cross-correlation;
0.84 – 0.96; Figure 5.8A). Whereas, in the cervical spinal canal the behaviour was less
consistent. In five of the nine subjects an increase of venous return through the epidural veins
was accompanied by the caudal displacement of CSF, in the remaining subjects CSF was
displaced cranially. This mixed response gave a weaker correlation between the waveforms
(Cross-correlation; 0.35 – 0.90), particularly in subjects where CSF would flow either cranially
or caudally between repeated measurements (Figure 5.7). Similarly, CSF compared with
internal jugular veins showed a mixed response with 3 subjects being in phase and 6 out of
phase (Figure 5.8B). In 8/9 subjects during inspiration there was an increase in venous return
via both the internal jugular and epidural veins (Figure 5.8C), however in one subject with
increased drainage via the epidural vein there was retrograde flow in the internal jugular vein
(Figure 5.4A).
Differences in the magnitude of CSF dynamics and trunk pressures during
different strength manoeuvres
During an expiratory sniff, the peak CSF velocities and displacement were greater at C3 than L2
(Table 5.2). Increasing the intensity of the expiratory sniff, from low to medium, and medium to
high, saw a consistent increase in the magnitude of the peak cranial velocity and CSF
displacement between the different levels of effort (Table 5.2). The peak caudal velocity was
greater in the high intensity expiratory sniffs compared with the medium effort (-1.71 cm s-1;

88
LMM; p = 0.011), but between the medium and low strength efforts there was no significant
difference (LMM; p = 0.265). The expiratory sniff resulted in a comparable increase in the
abdominal and intrathoracic pressures (LMM; p = 0.211). Increasing the intensity of the
expiratory sniff saw the abdominal/intrathoracic pressure to increase by an average of
28 cmH2O between both low to medium and medium to high intensity efforts. The effect of
expiratory sniff intensity was not different depending the spinal/catheter location (LMM;
p > 0.05).
During a sniff, the peak caudal velocity was greater at C3 than L2 (–1.50 cm s-1; LMM;
p = 0.004). There was a greater cranial displacement of CSF in the lumbar spinal canal
compared with the cervical spinal canal (0.978 cm; LMM; p = 0.004). Increasing the intensity
of the sniff form medium to high resulted in a significant increase in the peak velocities and
displacement (Table 5.2), however there was no difference between the low and medium
intensity efforts. Increasing the sniff intensity had a different effect on the lumbar CSF
displacement compared with the in the cervical displacement (LMM; p = 0.014). In the lumbar
spinal canal increasing the sniff intensity from medium to high resulted in a larger cranial
displacement of CSF (1.58 cm; LMM; p < 0.001), but in the cervical spinal canal there was no
difference in the magnitude of displacement between the intensities. During the low intensity
sniffs the CSF velocity in the cervical spinal canal did not exceed the ±2 S.D. threshold, so any
effect could not be discerned from normal cardiac flow and was excluded from analysis. During
a sniff the intrathoracic pressure was significantly negative compared with the abdominal
pressure (–65 cmH2O; LMM; p < 0.001). On average, between each level (low to high) of
intensity the pressure dropped by 9 cmH2O. The change in sniff intensity had a different effect
on the intrathoracic and abdominal pressures (LMM; p < 0.001). On average between each sniff
intensity (low to high) the intrathoracic pressures decreased by 30 cmH2O (Table 5.2). Whereas
the abdominal pressure increased by 12.9 cmH2O (LMM; p = 0.007) between the medium and
high intensity sniffs, but showed no difference between the low and medium intensity efforts
(LMM; p = 0.079).
Table 5.1 shows the mean and 95% confidence intervals all respiratory manoeuvres, at all
measurement locations and manoeuvre intensities. Table 5.2 shows estimated mean differences
and their corresponding p values for all pairwise comparisons made with the linear mixed
model.

89
Table 5.1 Mean and 95% confidence intervals of the peak variables during different respiratory manoeuvres, in both
the cervical and lumbar regions. C3 and L2 indicate the scanning planes for the MRI variables, whereas for the
pressure measurements C3 and L2 indicate the intrathoracic and abdominal pressures respectively. H, M, and L
indicated high, medium and low intensity manoeuvres respectively. For the coughs only one intensity was used. The
(-) indicates that that no change in CSF dynamics were measured for low intensity sniffs in the cervical spinal canal.
Cranial velocity
[cm.s-1]
Caudal velocity
[cm.s-1]
Displacement
[cm]
Pressure
[cmH2O]
Type Loc Strength mean 95% CI mean 95% CI mean 95% CI mean 95% CI
Co
ug
h C3 - 14.1 12.1-16.3 –7.40 –9.18- –5.97 2.64 2.20-3.09 83.2 76.3-90.5
L2 - 8.77 6.88-10.8 –4.77 –5.32- –4.14 1.74 1.35-2.12 85.8 78.1-93.8
Ex
pir
ato
ry
Sn
iff
C3
H 11.5 10.3-12.7 –6.00 –6.75- –5.24 2.44 2.17-2.70 68.2 62.3-74.0
M 8.37 6.06-10.7 –4.23 –5.77- –2.69 1.77 1.24-2.29 43.3 37.6-49.0
L 3.13 –0.361-6.62 –2.56 –4.81- –0.301 .639 –0.155-1.43 16.3 10.2-22.4
L2
H 8.94 7.46-10.4 –4.28 –5.23- –3.34 1.90 1.56-2.23 75.7 69.8-81.5
M 4.36 2.55-6.17 –2.63 –3.80- –1.46 1.00 0.590-1.41 44.7 39.0-50.4
L 2.59 –0.495-5.67 –1.21 –3.19-0.783 0.422 –0.278-1.12 16.5 10.4-22.6
Sn
iff
C3
H 9.41 8.31-10.5 –5.50 –6.29- –4.71 0.795 0.457-1.13 –79.6 –85.4- –73.8
M 4.34 2.33-6.35 –3.28 –4.72- –1.83 0.361 –0.257-0.979 –48.5 –54.3- –42.6
L - - - - - - –21.4 –27.4- –15.3
L2
H 11.2 10.0-12.4 –5.18 –6.03- –4.33 2.82 2.46-3.18 27.1 21.3-33.0
M 4.27 2.82-5.73 –2.12 –3.17- –1.07 1.24 0.796-1.69 14.2 8.37-20.0
L 2.63 0.958-4.30 –1.37 –2.57- –0.165 0.605 0.092-1.12 4.65 –1.14-10.72
Table 5.2 Pairwise comparisons from the linear mixed model for both expiratory and inspiratory Sniffs, looking at
the effects of both the location, strength and their interaction. Shown as the mean difference (∆�̅�) and p value for each
variable. C3 and L2 indicate the scanning planes for the MRI variables, whereas for the pressure measurements C3
and L2 indicate the intrathoracic and abdominal pressures respectively. H, M, and L indicated high, medium and low
intensity manoeuvres respectively. Significant comparisons (p < 0.05) are shown in bold. The (-) indicates when the
LMM found no significant interaction effect (p > 0.05), and a pairwise comparison was not conducted.
Cranial velocity
[cm.s-1]
Caudal velocity
[cm.s-1]
Displacement
[cm]
Pressure
[cmH2O]
Type Effects Comparison ∆�̅� P value ∆�̅� P value ∆�̅� P value ∆�̅� P value
Ex
pir
ato
ry
Sn
iff
Location C3-L2 2.37 0.017 –1.56 0.016 0.507 0.024 –3.05 0.211
Strength H-M 3.85 <0.001 –1.71 0.011 0.783 <0.001 27.9 <0.001
M-L 3.51 0.039 –1.55 0.265 0.853 0.024 27.7 <0.001
Location &
Strength
C3 H-M - - - - - - - -
M-L - - - - - - - -
L2 H-M - - - - - - - -
M-L - - - - - - - -
Sn
iff
Location C3-L2 0.829 0.25 –1.50 0.004 –0.978 <0.001 –65.1 <0.001
Strength H-M 6.01 <0.001 –2.64 <0.001 1.01 <0.001 –9.11 0.007
M-L 1.68 0.34 –1.33 0.24 0.198 1.00 –8.77 0.012
Location & Strength
C3 H-M - - - - 0.434 0.23 –31.2 <0.001
M-L - - - - - - –27.1 <0.001
L2 H-M - - - - 1.58 <0.001 12.9 0.007
M-L - - - - 0.639 0.198 9.55 0.079
Regression modelling
Figure 5.9 shows the relationships between the trunk pressures and CSF displacement in both
the cervical and lumbar spine during inspiratory and expiratory efforts (the slope (β) of the
relationships are in units of cm/cmH2O). The Goldfeld-Quant test confirmed that for all
respiratory manoeuvres, as the magnitude of the trunk pressures increased there was an increase
in the variability of the lumbar CSF displacements (heteroscedasticity) (p < 0.05). Therefore,
linear regression was performed using bootstrapping methods (95% CI of regression shown on
Figures 5.9C and D).

90
Figure 5.9 Average peak displacements plotted against the average peak intrathoracic and abdominal pressures
generated during inspiratory and expiratory efforts. Where cranial and caudal CSF displacement are shown as
positive and negative, respectively. Solid grey lines are the linear regression, dotted grey lines indicate the 95% CI of
the regression when the data are heteroscedastic.
Trunk pressures and CSF displacement during expiratory efforts
During an expiratory effort, cervical CSF displacement was significantly related to the pressures
of the trunk, with larger displacements associated with both increased intrathoracic (β = 0.033)
and abdominal (β = 0.031) pressures. Similarly, lumbar CSF displacement was also significantly
related to the pressures of the trunk, with greater displacement associated with both increased
thoracic (β = 0.022; CI = 0.017 to 0.029) and abdominal (β = 0.022; CI = 0.016 to 0.027)
pressures. However, for the same change in the trunk pressure there is a larger displacement of
CSF at C3 compared with L2.
Trunk pressures and CSF displacement during inspiratory effort
During inspiratory efforts, cervical CSF displacement was related to the trunk pressures, giving
larger displacements for a more negative intrathoracic (β = –0.010) and greater abdominal
(β = 0.026) pressures. Lumbar CSF displacement was also shown to be significantly associated
with the intrathoracic (β = –0.031; CI = –0.046 to –0.021) and abdominal (β = 0.085;
CI = 0.057 to 0.124) pressures. However, for the same change in the trunk pressures, there is a
greater displacement in the lumbar spine compared with the cervical spine.
Multivariable linear regression
Since the trunk pressures vary continuously through inspiratory and expiratory efforts, a
stepwise linear regression was performed pooling both inspiratory and expiratory manoeuvres.
In this model, cranial displacement of CSF in the cervical spine was only significantly

91
associated with the abdominal pressures (β = 0.031; R2 = 0.82; p < 0.001), whereas
displacement in the lumbar spine was significantly related to both the intrathoracic and
abdominal pressures (𝑅𝐴𝑑𝑗2 = 0.78; p < 0.001). While increased abdominal and reduced
intrathoracic pressures increase cranial CSF displacement, an increase in intrathoracic pressure
reduces the magnitude of cranial CSF displacement (βAbd = 0.041; βThor = –0.020; p < 0.001).
Discussion
This study demonstrated that during inspiration, CSF could flow either cranially or caudally,
independent of the venous drainage from the cranium (Figure 5.7). We also found that increased
abdominal pressure was associated with the cranial displacement of CSF, but if the intrathoracic
pressure was sufficiently negative CSF would be drawn caudally (Figure 5.9A and B). These
data suggest that respiratory CSF flow is primarily driven by the spinal pressures rather than
cranial fluid volume balance, as dictated by the Monro-Kellie hypothesis.
Mechanics of inspiratory CSF flow
During inspiration, the negative intrathoracic pressure results in an increase of venous drainage
from the cranium, and decreased intracranial pressure (Hamer et al., 1977; Lawley et al., 2017).
Similarly, the thoracic extradural pressures also decrease during inspiration (Usubiaga et al.,
1967). As there are a greater number of outlets for venous blood to return to the vena cava from
the thoracic spinal canal compared with the cranium (Groen et al., 1997), it is possible for the
thoracic spinal pressures to become more negative than the cranium, causing CSF to flow
caudally (Figure 5.2C) as previously reported (Aktas et al., 2019; Dreha-Kulaczewski et al.,
2017; Dreha-Kulaczewski et al., 2018).
Previous imaging studies have shown that CSF flows cranially during inspiration, however this
was not consistent between subjects (Aktas et al., 2019; Dreha-Kulaczewski et al., 2017; Dreha-
Kulaczewski et al., 2018; Yamada et al., 2013). Some of the variability may come from the
specific breathing protocol used, a prolonged period of ‘deep’ inspiration followed by slow
exhalation. With slower low magnitude changes in the intrathoracic and abdominal pressures,
the intracranial cardiac pulsations have greater influence on CSF flow and introduce large
variation between repeated manoeuvres (Figures 5.6A and 5.7A). Alternatively, some of these
cases will be the result of inspiration driving caudal CSF flow, similar to the subjects in this
study whose intrathoracic pressure was sufficiently negative compared with the abdominal
pressure (Figure 5.9). This behaviour is dependent on the balance of inflow and outflow of
epidural blood. As the segments of the spine are continuous, the volume of blood being drained
from the thoracic spine during inspiration is also replaced by both cervical and lumbar venous
blood (Figure 5.7). When the intrathoracic pressure is sufficiently negative, there is greater
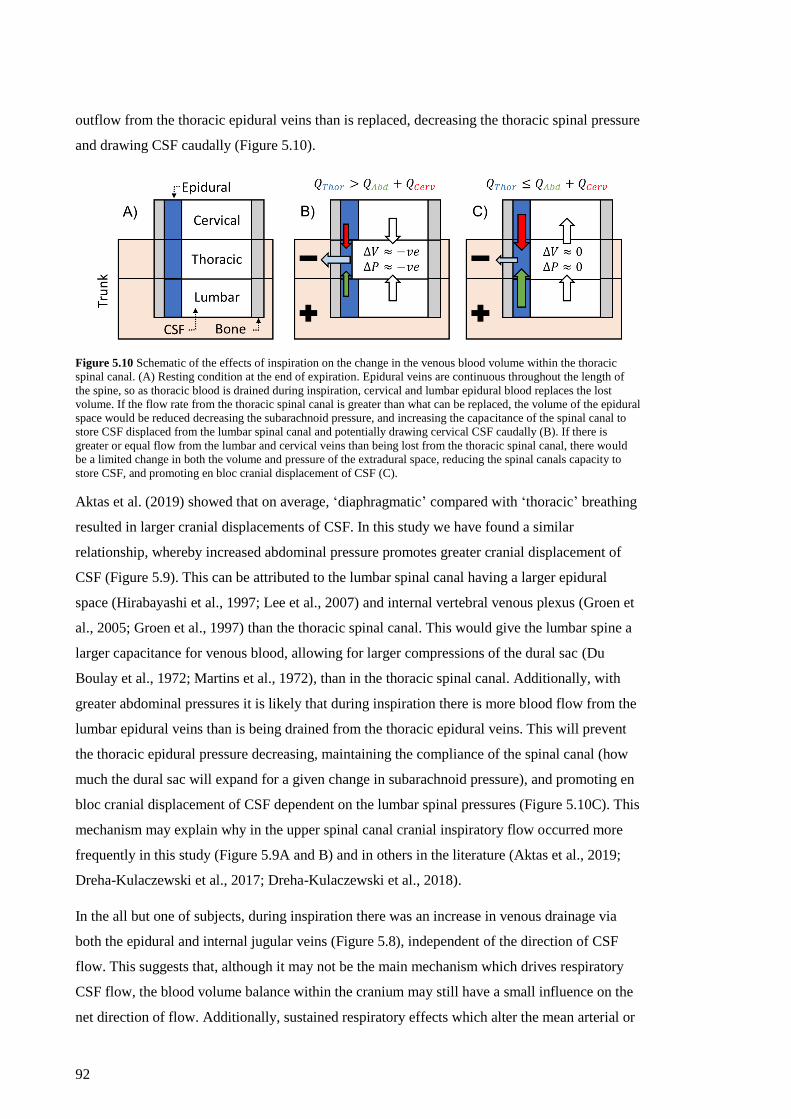
92
outflow from the thoracic epidural veins than is replaced, decreasing the thoracic spinal pressure
and drawing CSF caudally (Figure 5.10).
Figure 5.10 Schematic of the effects of inspiration on the change in the venous blood volume within the thoracic
spinal canal. (A) Resting condition at the end of expiration. Epidural veins are continuous throughout the length of
the spine, so as thoracic blood is drained during inspiration, cervical and lumbar epidural blood replaces the lost
volume. If the flow rate from the thoracic spinal canal is greater than what can be replaced, the volume of the epidural
space would be reduced decreasing the subarachnoid pressure, and increasing the capacitance of the spinal canal to
store CSF displaced from the lumbar spinal canal and potentially drawing cervical CSF caudally (B). If there is
greater or equal flow from the lumbar and cervical veins than being lost from the thoracic spinal canal, there would
be a limited change in both the volume and pressure of the extradural space, reducing the spinal canals capacity to
store CSF, and promoting en bloc cranial displacement of CSF (C).
Aktas et al. (2019) showed that on average, ‘diaphragmatic’ compared with ‘thoracic’ breathing
resulted in larger cranial displacements of CSF. In this study we have found a similar
relationship, whereby increased abdominal pressure promotes greater cranial displacement of
CSF (Figure 5.9). This can be attributed to the lumbar spinal canal having a larger epidural
space (Hirabayashi et al., 1997; Lee et al., 2007) and internal vertebral venous plexus (Groen et
al., 2005; Groen et al., 1997) than the thoracic spinal canal. This would give the lumbar spine a
larger capacitance for venous blood, allowing for larger compressions of the dural sac (Du
Boulay et al., 1972; Martins et al., 1972), than in the thoracic spinal canal. Additionally, with
greater abdominal pressures it is likely that during inspiration there is more blood flow from the
lumbar epidural veins than is being drained from the thoracic epidural veins. This will prevent
the thoracic epidural pressure decreasing, maintaining the compliance of the spinal canal (how
much the dural sac will expand for a given change in subarachnoid pressure), and promoting en
bloc cranial displacement of CSF dependent on the lumbar spinal pressures (Figure 5.10C). This
mechanism may explain why in the upper spinal canal cranial inspiratory flow occurred more
frequently in this study (Figure 5.9A and B) and in others in the literature (Aktas et al., 2019;
Dreha-Kulaczewski et al., 2017; Dreha-Kulaczewski et al., 2018).
In the all but one of subjects, during inspiration there was an increase in venous drainage via
both the epidural and internal jugular veins (Figure 5.8), independent of the direction of CSF
flow. This suggests that, although it may not be the main mechanism which drives respiratory
CSF flow, the blood volume balance within the cranium may still have a small influence on the
net direction of flow. Additionally, sustained respiratory effects which alter the mean arterial or

93
venous pressures within the cranium (therefore the overall intracranial pressure) (i.e.
hyperventilation, increased CO2 inspiration, jugular compression, or a sustained Valsalva) have
been shown to alter the balance between the spinal and cranial pressures and change the net
direction of CSF flow (Bedford, 1935; Martins et al., 1972; Reitan, 1941; Shah, 1994).
However, in one subject internal jugular vein flow was shown to compensate for changes in
epidural blood flow during normal breaths and both the expiratory and inspiratory efforts
(Figure 5.4A). Although not universal, this further supports the hypothesis that the spinal
pressures primarily drive respiratory CSF flow.
Mechanics of expiratory CSF flow
As originally hypothesised by Reitan (1941), the increase in trunk pressure caused by expiratory
efforts, such as a cough, resulted in an influx of epidural blood into the spinal canal, and a
cranial displacement of CSF (Figures 5.2B, 5.5 and 5.6). Usubiaga et al. (1967) showed that
during a cough the pressure change in the thoracic epidural space was greater than in the
cervical or lumbar spine, suggesting this was the result of being closer to the pleural cavity.
However, the results of this study would suggest rather that the thoracic epidural space had a
higher pressure due to the additive effect of the blood vessels filling and the influx of CSF from
the lumbar spine. Similarly, central venous pressure is also elevated when the expiratory
pressure is positive, due to increased load on the vena cava preventing venous return (Hamit et
al., 1965; Shah, 1994). However, Figures 5.4A and 5.8C demonstrate that a dynamic rise in
trunk pressure results in an increase in venous return via the internal jugular veins. This
increased flow would contribute to the instantaneous rise in central venous pressure, particularly
as central venous pressure has been recorded from an internal jugular catheter (Hamilton et al.,
1944; Hamit et al., 1965; Shah, 1994).
Unlike forced manoeuvres like coughing, expiration during normal breathing is passive,
relaxing the diaphragm and intercostal muscles allowing the abdominal and intrathoracic
pressures to return to their resting state (Figure 5.7C and F). Previous imaging studies reported
that expiratory CSF flow is caudal, although at locations above the diaphragm this was not
consistent between subjects (Aktas et al., 2019; Dreha-Kulaczewski et al., 2017; Dreha-
Kulaczewski et al., 2018). Being a passive action, the net direction of CSF flow during
expiration is dependent on the direction CSF was displaced during inspiration. For example, in
the lumbar spinal canal during inspiration, the increased abdominal pressure consistently
displaces CSF cranially, therefore when this pressure is removed, CSF moves caudally returning
to its initial position (Figures 5.5, 5.6 and 5.7). The same occurs in the cervical spinal canal,
although the direction is not consistent. As previously explained, the direction of cervical CSF
flow is dependent on the balance between the intrathoracic and abdominal pressures. Therefore,

94
if the inspiratory pressures result in a cranial displacement of CSF, when the pressures are
reduced during expiration CSF will return caudally, or vice versa (Figures 5.5, 5.6 and 5.7).
Study limitations
The relationships between the intrathoracic/abdominal pressures and CSF displacements
presented in this study are estimates, as the data were not recorded concurrently. Differences
between the environment of the lab and scanner (scanner noise and encased by the torso coil)
may influence how the respiratory manoeuvres were performed between sessions. However,
waveforms of the pressures and CSF displacements are similar (Figures 5.5, 5.6 and 5.7), but
future studies would benefit from using MR compatible pressure catheters.
In our regression analysis we assumed that for respiratory manoeuvres performed at the same
intensity, the CSF displacements and peak pressures were paired. However, our analysis showed
no significant change in CSF displacement and abdominal pressure between the different
intensities of sniffing (Table 5.2). Specifically, the abdominal pressures were not different
between medium and low strength sniffs, but the intrathoracic pressures measured concurrently
were significantly different. This could be the result of a difference in breathing strategy, being
more reliant on thoracic versus diaphragmatic breathing (Konno and Mead, 1967). For example,
the intrathoracic pressure in one subject performing a medium sniff was 26 cmH2O more
negative than when performing a low intensity sniff, but the abdominal pressure was only 1
cmH2O greater. Similarly, this could affect the lumbar CSF displacements. In the cervical spine
there were no differences in the magnitude of CSF displacement between the high and medium
sniff intensities. One explanation could be that under the proposed mechanism (Figure 5.2C) as
the intrathoracic pressure decreases the spinal canal becomes more compliant, this allows for a
large change in the volume of dural sac for a relatively small change in the subarachnoid
pressure, normalising the effect of different inspiratory pressures. It is also possible that in the
scanner participants did not achieve different strength sniffs, and this may introduce a source of
bias in the regression analysis.
To capture the large dynamic range of the CSF and blood velocities during respiration without
aliasing errors, high encoding velocities were used. This resulted in a low signal to noise ratio
for the low velocities during the resting breaths. To mitigate this, analysis focused on data
recorded during a high velocity event (i.e. cough, expiratory and inspiratory sniff). This also
prevented automatic tracking of the regions of interest, requiring manual tracking.
Clinical implications
These data suggest how much the dural sac will expand in response to changes in the spinal
subarachnoid pressure (compliance of the spinal canal) will be largely dependent on the epidural
pressures, which vary with respiration (Shah, 1994; Usubiaga et al., 1967). During inspiration
95
the outflow of venous blood from the thoracic spinal canal decreases the extradural pressure
(Usubiaga et al., 1967), making the thoracic spinal canal more compliant and introducing a
volume change that decreases the cervical and thoracic spinal pressures (Figure 5.10). In the
case of spinal trauma resulting in a stenosis, this natural change in spinal compliance may be
disturbed by either increased resistance to venous blood flow, or preventing changes in the
volume of the subarachnoid space. This would result in a persistently higher spinal pressure,
similar to a mild expiratory effort with every breath. This could cyclically stress the spinal cord,
potentially contributing to the formation of fluid filled cavities (syrinxes).
The dispersion of intrathecal drug injections can be unpredictable, so understanding the normal
circulation may help prevent unexpected outcomes (Hocking and Wildsmith, 2004; Kamran and
Wright, 2001; Kuttler et al., 2010). Recent modelling studies have identified steady streaming (a
creeping flow resulting from oscillatory flows) to play a significant role in the cranial dispersal
of subarachnoid solutes (Khani et al., 2018; Lawrence et al., 2019; Sánchez et al., 2018),
achieving flows of ~0.1 mm.s-1 in line with in vivo human tracer studies. These velocities are
based on qualitative studies that started imaging between 10-15 minutes after the initial lumbar
injection, noting the tracer had reached the foramen magnum at this point (Greitz and Hannerz,
1996; Ringstad et al., 2017), so the actual rate of transport remains unknown. The results of our
study indicate that a bolus can be displaced between 1-2 cm in a second during a normal breath
(Figures 5.4C, 5.5D, 5.6D, and 5.7D), and further with either large negative inspiratory or
positive expiratory pressures (Figures 5.5, 5.6, and 5.7). Dispersion of the drug will also be
increased by the arachnoid web and nerve roots (Pahlavian et al., 2014; Stockman, 2005, 2007;
Tangen et al., 2015). Our data would suggest that respiratory effects need to be accounted for
when administering drugs by intrathecal injection, especially if the patient is ventilated, as the
increased intrathoracic pressures may promote a rapid dispersion of the drug towards the brain
(Figure 5.9).
Conclusion
Respiratory CSF flow is primarily dependent on the blood volume balance within the thoracic
and lumbar spinal canal, and the cranial fluid balance plays a lesser role. The net direction of
CSF flow in the upper spinal canal is dependent on the balance between the outflow of thoracic
epidural blood and the influx of lumbar epidural blood. Large increases in abdominal pressure
cause an influx of epidural blood, compressing the dural sac and displacing CSF cranially.
However, if the intrathoracic pressure is sufficiently negative, there is greater venous return
from the thoracic epidural veins, reducing the spinal pressure and drawing CSF caudally from
the upper spinal canal. The findings of this study provide a more complete description of normal
of CSF circulation. This is needed to understand the effects of obstructions to CSF flow, the
dynamics of drug dispersion, and how to manipulate CSF pressures.

96
6. Simulating respiratory effects on the cervical CSF pressures
Introduction
Chapter 5 demonstrated that respiratory CSF flow is dependent on the volume of blood within
the spinal canal. With increasing trunk pressures, an influx of blood via the epidural veins
compresses the dural sac and displaces CSF. Additionally, it was hypothesised that cranial CSF
displacement during inspiration was the result of the lumbar spinal pressure becoming more
dominant, whereas the caudal flow was the result of the thoracic spinal canal pressure becoming
sufficiently negative to counteract the increased lumbar spinal pressure and draw CSF caudally
from the cranium. Although the data presented support this hypothesis, there was no imaging of
the thoracic spine, measurements of the extradural pressures, or the dural displacements, which
would support the feasibility of these mechanisms.
Subject-specific modelling studies have previously used cardiac-gated PC-MRI data as the
cranial input and assumed 0 Pa reference pressure at the caudal end. For cardiac CSF pulsations
in isolation this is a reasonable assumption, as the pressure variation originates from the volume
balances within the cranium (Alperin et al., 2005a; Alperin et al., 2005b). However, respiration
introduces periodic variation in the spinal pressures (Hamer et al., 1977), which has been shown
to have a more significant effect on CSF flow (Aktas et al., 2019). Therefore, a static reference
pressure is not appropriate, and to simulate respiratory effects a dynamic boundary condition is
required.
The aim of this study is to use a simplified model of the spinal subarachnoid space to simulate
the effect of respiratory changes in epidural pressure on CSF flow to demonstrate the feasibility
of the proposed mechanism for CSF circulation, and to determine a suitable caudal boundary
condition to simulate respiratory events in future subject-specific models. Expecting the
subarachnoid pressures to be proportional to the rate of change in the subarachnoid volume.
Methods
The model simplifies the spinal subarachnoid space to an axisymmetric annulus (Figure 6.1),
the dimensions of the spine are estimated from data taken from the visible Human project
(Bertram et al., 2005; Loth et al., 2001). The surface of the spinal cord and inner surface of the
dura mater were modelled as rigid boundaries. The end of the sacral spine was assigned as a
zero-flow boundary. The outlet at the cranial end was set a 0 Pa reference pressure. Respiration
was simulated by applying a time-dependent displacement (Figure 6.2) in the radial direction to
the outer radius, at both the thoracic and lumbar spinal regions. The models were solved in
ANSYS CFX (v19.2, ANSYS Inc, PA) to provide the CSF velocities and pressures. CSF was
modelled as a Newtonian fluid with 0.8 mPa.s viscosity and 1000 kg.m-3 density. The CSF flow

97
was assumed to be laminar, which is appropriate as even for peak coughing velocities (30 cm.s-
1) the Reynolds number was 1875 (assuming a typical hydraulic diameter of 5 mm) sufficiently
below transition. Additionally, evidence of turbulence was not seen in the MRI data. Velocity
and pressure data were taken from a plane corresponding to the C3 vertebra, and verified against
the MRI velocities measured in vivo.
Figure 6.1 Annotated schematic of the simple spinal model. Flow is simulated by applying the time displacements
shown in Figure 6.2 to the thoracic and lumbar regions of the model.
The applied displacement was derived from a subject’s epidural blood flow during a sniff
followed by a normal breath. As there was no significant timing delay between the epidural
blood flow and CSF displacements, it was assumed that the pressure (and therefore
displacement) was in phase with the blood flow. A cough has been shown to reduce the volume
of the thecal sac by ~50% (Du Boulay et al., 1972), inspiration also compresses the lumbar
dural sac only to a lesser extent (Reitan, 1941). To approximate the effect of a high to medium
strength sniff (Table 5.2), the peak displacement in the lumbar region was set to reduce the outer
radius by 10% (0.75 mm). This relatively small displacement prevented the need for mesh
remodelling, simplifying the model and reducing computational time. The same waveform was
applied to the thoracic spine, so only the differences in the amplitude between the two regions
affected the flow. For the baseline test, the amplitude of the thoracic displacement (0.29 mm)
was scaled so that the applied volume change was equal between the two regions. To determine
whether CSF would flow either caudally or cranially depending on the relative volume change
in between the two spinal regions, the thoracic displacement was scaled so that the absolute
volume change ranged between 10% smaller to 10% greater than in the lumbar spine, in steps of
5%.

98
Figure 6.2 Input displacements for the baseline simulation. A negative displacement causes compression of the dural
sac, and a positive expands it.
The CFD code (v19.2, CFX ANSYS) uses a 3D Navier-Stokes solver which couples the
pressure and velocity equations, using the finite volume approach. For convergence normalised
residuals were reduced below 10-5 for each time step (5 ms), accepting a solution once a quasi-
steady state was reached in the second cycle. Spatial and time derivatives were calculated with
second order differencing schemes, and double precision was used to reduce rounding errors.
Results
Figure 6.3 shows an example of the simulated CSF velocities and displacements for two test
cases. When the volume change in the thoracic spine is 10% less than in the lumbar spine, CSF
is displaced cranially. In contrast, when the thoracic volume change was 10% greater, CSF
moves caudally.
Figure 6.3 Example of simulated CSF velocities and displacements at C3. For a relative volume change in the
thoracic spine 10% smaller and larger than in the lumbar spine. A positive value indicates cranial flow, and negative
caudal flow.
Figure 6.4 shows how the relative difference in the volume change in the two regions alters the
magnitude and direction of CSF displacement, demonstrating a linear relationship with the
volume balance between the two regions. Additionally, the results indicate that, given the
correct balance, respiration can result in a negligible effect on CSF dynamics.

99
Figure 6.4 The peak CSF displacements at C3 plotted against the relative difference in volume change between
thoracic and lumbar spine. A positive value indicates cranial flow, and negative is caudal flow.
Discussion
To simulate the effect of inspiration on CSF flow, this study used moving boundaries to mimic
the effect of changing blood volumes within the thoracic and lumbar extradural spaces has on
the spinal subarachnoid space, thereby demonstrating that these changes in volume can be used
to reproduce the patterns of CSF flow seen in vivo (Figures 5.4, 5.7, and 6.3). The results also
indicate that if the volume change in the thoracic spine is comparatively small, then the lumbar
displacement becomes dominant, driving a cranial flow (Figure 6.4), whereas, if the expansion
of the thoracic subarachnoid space is sufficiently large CSF is drawn caudally, supporting the
hypothesis that the direction of cervical CSF flow depends on the balance of epidural blood
flow within the thoracic and lumbar spine (Chapter 5). The balance between the volumes of the
thoracic and lumbar spinal subarachnoid spaces can change the direction of CSF flow
supporting the findings of Chapter 5. Further to this, Figure 6.4 demonstrates a range where
given differences in timing or magnitude, respiration can have a negligible effect on CSF
motion, as the change in volume of the thoracic spine can act as a sink for lumbar CSF. This
could be one reason why normal breathing has been seen to have a limited effect of CSF flow
(Bhadelia et al., 2016; Dreha-Kulaczewski et al., 2015, 2017; Yildiz et al., 2017), requiring
stronger manoeuvres to demonstrate a consistent effect. Additionally, differences in local spinal
anatomy (i.e. epidural vein size and impedance, or size of spinal compartments) could
contribute to the inter-subject variability (Groen et al., 1997; Hirabayashi et al., 1997; Lee et al.,
2007).
In other subject-specific modelling studies, non-uniform boundary motion has been used to
match the simulated and measured CSF velocities (Khani et al., 2018; Khani et al., 2017).
However, the displacements used were not validated and unphysiological, as cardiac-driven
CSF pulsations are predominantly driven from the cranium into the spinal canal (Henry–
Feugeas et al., 2000), and the dural pulsations are created from the internal pressure changes not
the extradural pressures. Although these methods would be appropriate for simulating

100
respiratory flow (flow driven by the extradural forces Figure 5.2), the actual dural displacements
are unknown, and the method itself is computationally costly. An alternative method would be
to apply a pressure pulse to the caudal end of the model which incorporated the effects dural
motion would have on the subarachnoid pressures. As the spinal canal is a closed system, filled
with an incompressible fluid, the volume flow rate (Figure 6.3) and therefore pressures would
be proportional to the rate of change in the volume of the fluid domain. Therefore, an
asymmetric sine wave can be applied to the caudal boundary of the model and scaled in
magnitude to match the simulated velocities to the MRI data. Since, the flow is laminar the
exact shape of the applied wave can be estimated from in vivo MRI data.
Conclusion
This model demonstrates that the pressure balances required to allow CSF to flow both cranially
and caudally during inspiration are physiologically feasible. Additionally, it has provided a
sensible estimate of the waveform required at the caudal end of subject-specific models to
simulate respiratory effects without significant additional computational cost.

101
7. Pilot study: The effects of coughing and Valsalva on cerebrospinal
fluid flow in Chiari I malformation
Introduction
Chiari malformation type I is clinically defined by the cerebellar tonsil anatomy, accompanied
by the appearance of overcrowding, however a link between the anatomy and the symptoms of
Chiari or the pathogenesis of Chiari-associated syringomyelia has yet to be demonstrated.
Invasive measurement techniques have been used to examine the common association between
Chiari and coughing triggered headache. These studies have suggested that during coughing the
cerebellar tonsils obstruct normal flow, which creates pressure gradients between the cranium
and spinal canal that could contribute to headaches and syrinx formation (Sansur et al., 2003;
Tachibana et al., 1992; Williams, 1981b). Few studies have since investigated the effects of
respiration on CSF dynamics in Chiari patients, and whether such a flow obstruction exists.
Bhadelia et al. (2016) recently demonstrated that in Chiari patients the amplitude of cardiac
pulsation driven CSF flow is decreased post-cough. Bhadelia et al. (2016) suggested that this
was evidence that coughing caused the tonsils to descend and further restrict flow through the
foramen magnum, as originally hypothesised by Williams (1969). This mechanism has yet to be
proven, but this change in behaviour is a potentially useful marker which may help to further the
understanding of Chiari associated headache (Bezuidenhout et al., 2018). In Chapter 5, it was
shown that in controls the effects of coughing were transient, with no lasting effects post-cough
(Figures 5.4 and 5.5; Chapter 5), however only single coughs were performed and it is unclear if
the behaviour described by Bhadelia et al. (2016) is related to a sustained elevated trunk
pressure during repetitive coughs causing coupled cardiovascular effects (post-Valsalva
overshoot/rebound: a transient increase in the mean arterial pressure), nor is it clear the extent to
which this differs between healthy subjects and those with Chiari malformation (Dawson et al.,
1999; Korner et al., 1976; Williams, 1981a).
The aim of this pilot study was to demonstrate that real-time phase contrast MRI could be used
to identify the characteristics of CSF flow in Chiari patients both with and without
syringomyelia. It was hypothesised that the reduced area of the foramen magnum would result
in higher velocities in Chiari patients during respiratory manoeuvres such as coughing and
Valsalva. A secondary aim was to demonstrate that subject-specific computational models could
reliably simulate the effects of coughing in both patients and controls.
Methods
The South Eastern Sydney Local Health District Human Research Ethics Committee approved
all experimental protocols, and all participants gave written informed consent. Ten participants

102
enrolled in the study, consisting of four Chiari patients without a syrinx (age 29 ± 9 years;
weight 67 ± 14 kg), two with a syrinx (age 44 ± 2 years; weight 60 ± 5 kg), and four age and sex
matched controls (age 34 ± 9 years; weight 61 ± 6 kg) (a fifth control subject was excluded from
analysis). Subjects underwent MRI scanning of the head and neck to quantify CSF flow in
response to respiratory manoeuvres.
MR imaging and flow measurements
Respiratory manoeuvres
While in the supine position, three respiratory manoeuvres were assessed. Initial scans collected
data during phases of normal quiet breathing. Scans were also collected while participants
performed a Valsalva manoeuvre, and during coughing. During the Valsalva manoeuvres
participants were instructed to breathe normally and count to three, then perform a Valsalva and
continue to strain for five seconds, and then to release and breathe normally for the remainder of
the scan. When performing coughs participants were originally instructed to breathe normally
and count to three, then perform three consecutive coughs, inhaling in between each cough, and
then breathe normally for the remainder of the scan. This was adjusted in the most recent
participants to the protocol used in Chapter 5, i.e. subjects were instructed to cough between
normal breaths at the end of expiration. This approach was adopted as it was found that
participants were less likely to forget to breathe between coughs, preventing the summation of
coughs.
Imaging parameters
MRI data was collected using a 3T Philips Achieva 3TX (Philips Healthcare, Best, The
Netherlands). 3D isotropic T1 sagittal anatomical MRI scans were acquired from the cervical
spine, parameters for the scan include; 0.94 mm voxels, matrix = 288×288, FOV = 270×270,
TR/TE = 5.5/2.5 ms and 180 slices of 0.94 mm thickness. Both cardiac gated and real-time PC-
MRI scans were collected from at the base of the skull (or 5 mm superior to the tip of the
cerebellar tonsils in Chiari subjects) and at the C3 vertebra perpendicular to the spinal canal.
The encoding velocities (Venc) for the cardiac gated scans were set to 12 cm.s-1, 10 cm.s-1 and
13 cm.s-1 at the base of the skull, 5 mm superior to the tip of the cerebellar tonsils and C3
vertebra respectively. Additional scanning parameters include; matrix = 240×176, FOV =
250×250, TR/TE=21.6/6.8 ms, 30 phases/cycle and slice thickness = 5 mm. For further details
on the scanning protocol see Clarke et al. (2013b). For real-time PC-MRI scans the encoding
velocity was scaled between to 10-40 cm.s-1 at all levels acquiring 200 phases at 70 ms intervals.
Scans were repeated with higher Venc when aliasing artefacts were present. Other scanning
parameters include; flip angle = 20°, matrix = 96×81, FOV = 192×192mm, TR/TE = 13/7 ms
and a slice thickness of 10 mm.

103
Flow data processing
CSF velocity data was calculated from the PC-MRI scans using the freely-available software
Segment (Heiberg et al., 2010). Regions of interest were manually drawn and tracked over the
spinal subarachnoid space. The resulting flow data were segmented into epochs containing
either normal breaths or the respiratory manoeuvre. Valsalva data were segmented into the pre,
onset, hold, and post phases of the Valsalva. The coughing scans were similarly separated into
the pre, cough, and post cough phases. With the original coughing protocol, two subjects did not
take a breath between coughs, resulting in the summation of multiple coughs, therefore only the
first cough in the sequence was assessed, and the caudal peak was excluded (which could be
influenced by the subsequent coughs). The peak cranial and caudal velocities were compared
both within and between groups.
Statistical analysis
In a larger study with a sufficient number of participants, statistical testing would likely be
performed using a linear mixed model (LMM) approach, as the LMM can take into account the
repeated measures, multiple levels and potential missing data. However, given the sample size
of this pilot study statistical tests would not be valid (Kraemer, 2019), therefore statistical
analysis beyond basic descriptive statistics has not been performed.
Computational modelling of the spinal subarachnoid space
Subject-specific models and the initial calculation of the pressure-time profiles were obtained
following the protocols outlined in Clarke et al. (2013a) and Chapter 2. For each subject, a 3D
geometry of the spinal subarachnoid space was generated from point cloud data, manually
segmented from the anatomical MRI. The models spanned from the base of the skull (or 5 mm
superior to the tip of the cerebellar tonsils) to 10 mm caudal to the middle of C5, with a 5 mm
extension applied to the rostral inlet to provide a smooth entry zone.
The models were solved in ANSYS CFX (v18.0, ANYS Inc., PA). CSF in this study was
assumed to be a Newtonian fluid with a viscosity of 0.8 mPa.s and 1000 kg.m-3 density
(Bloomfield et al., 1998). The spinal cord and dura mater were treated as rigid walls. With an
average hydraulic diameter of 5 mm and peak CSF velocity of 30 cm.s-1 during a cough, the
Reynolds number was calculated as 1875, so laminar flow was assumed. Each subject-specific
model was solved under two different load conditions; a cardiac-driven CSF pulse (used for
validation of the model geometry and boundary conditions) and a caudal coughing pressure
pulse (see Chapter 6).
A steady state run provided the initial conditions for the transient simulations. In these, the
normalised residuals were required to converge to be below 10-5 at each time step (5 ms). The
CFD code is a 3D Navier-Stokes solver that uses a finite volume approach. The equations were

104
solved using a pressure-velocity coupled solver. Spatial and time derivatives were calculated
with second order differencing schemes. Double precision was applied to minimise rounding
errors.
Cardiac flow models
For the cardiac pulsation driven models, fitted flow data taken from the cranial scan was applied
to the cranial inlet of the model. At the caudal outlet a reference pressure of 0 Pa was set. A
solution was accepted once a periodic state was reached in the second cycle. The models were
validated by comparing the average velocity-time profiles against the MRI data, taken at mid-
C3. Features of the velocity profile which were assessed include; the time when caudal flow
begins, the timing of peak caudal and cranial flow and when the flow changes from caudal to
cranial, in addition to the peak caudal and cranial velocities (Figures 1.12 and 2.4). In two
subjects, cardiac-gated scans were not collected, so an average cardiac pulse taken from the
real-time scans during normal breathing was used as an input, and the models were compared
against the peak velocities since timing data was not available.
Coughing models
To mimic the coughing protocol performed during the MRI scans, the caudal boundary
condition was switched between a resting and coughing state. The resting state was used to
approximate the normal breath between coughs, assuming normal breathing to have a minimal
effect on CSF flow (Figure 5.4A). For this phase, the total pressure calculated at the cranial inlet
with the initial cardiac model was applied as an inlet boundary condition, and at the caudal
outlet a reference pressure of 0 Pa was applied. To simulate a cough, a generic pressure pulse
was applied to the caudal end of the model (Figure 7.1). Chapter 6 assessed the effects of dural
compression on CSF velocities, suggesting that the pressure pulse applied at the caudal end of
the model to simulate respiratory events would be proportional to the rate of change in the dural
compression. Assuming that the compression of the dural sac is proportional to the inflow of
epidural blood, the generic cough pulse was approximated from the derivative of a typical
epidural velocity-time profile during a cough, measured in Chapter 5 (for example see Figure
5.5B).

105
Figure 7.1 Shape of the coughing pulse applied to the caudal end of the model. Shape approximated from the
derivative of the epidural venous velocity during a cough. Duration of the cough was held at 1 second. The amplitude
of the peak pressures were scaled between 25, 50, and 75 Pa.
Initially two cardiac pulses were run to ensure the model was in a quasi-steady state. The cough
pulse was then applied at the beginning of the next cardiac pulse (synchronous with onset of the
systolic CSF pulse), and repeated every three cardiac pulses, giving a total of three coughs
followed by two cardiac pulses. The increase in caudal subarachnoid pressure created by a
cough is unknown, therefore the amplitude of the three coughing pulses were scaled to 25, 50
and 75 Pa to provide an estimate (these pressures were estimated from an initial trial in a model
of a control subject, assuming the coughing force to be comparable between controls and Chiari
patients). The coughing pulses were validated by comparing the peak cranial and caudal CSF
velocities at both the foramen magnum and mid-C3. The sequence with the best match was then
analysed. The peak pressure drop between the foramen magnum and C3 which would drive both
cranial and caudal flow was compared between groups.
Statistical analysis
Agreement between the MRI velocities and the subarachnoid space models was assessed using
the Bland-Altman method. Bland-Altman plots provide the average model error and 95% limits
of agreement (±1.96×S.D.). Due to the small sample size this pilot study was underpowered to
perform more complex statistical tests.
Results
CSF flow studies
Normal breathing
Figure 7.2 shows the median CSF velocities for each group during both the inspiratory and
expiratory phases of quiet breathing. The peak cranial and caudal velocities are within the same
range in both inspiration and expiration. Both the Chiari patients with and without a syrinx
appear to have higher velocities, although there is a large overlap between the interquartile
ranges.

106
Figure 7.2 Group median and interquartile range for the peak cranial (upper) and caudal (lower) velocities during
inspiration and expiration. Black markers indicate measurements taken at the foramen magnum and the grey are taken
at C3. Each data point indicates an individual subject’s median velocity.
Valsalva manoeuvre
Figure 7.3 Sample measurements of the CSF velocities during a Valsalva manoeuvre at C3, in two control subjects
(A and B), a Chiari patient with (C) and without a syrinx (D). Cranial velocities are positive and caudal are negative.
The red dashed lines indicate the beginning and end of the Valsalva manoeuvre.
Figure 7.3 shows the effect of a Valsalva manoeuvre on CSF flow in examples of 2 controls,
and 2 patients, one with and one without a syrinx. Similar responses are seen for all subjects.
With the onset of the Valsalva there is a sudden high velocity (~10 cm.s-1) cranial flow of CSF.
The remainder of the response to the Valsalva was variable between subjects. During the

107
maintained Valsalva two responses were commonly seen. 1) The cardiac pulse amplitude would
initially increase, and as the Valsalva persisted the amplitude decreased (Figures 7.3 A and C).
2) The pulse amplitude would be comparable with the normal cardiac pulse, and gradually
increase over time (Figures 7.3 B and D). After the release of the Valsalva CSF flow would
either normalise (Figures 7.3 A and B), or the pulse amplitude would transiently increase
(Figures 7.3 C and D). In the Chiari subjects post-Valsalva there were no cases that saw a
blockage to CSF flow. With these small subject numbers, it remains unclear whether the
differences in behaviour are related to the groups or difference in the strain effort during the
Valsalva.
Figure 7.4 shows the median cranial and caudal CSF velocities before, during and after a
Valsalva manoeuvre for each subject group. Within the subject groups the CSF velocities during
the maintained Valsalva and after its release appear comparable with those before the Valsalva.
The onset of the Valsalva results in a large cranial flow in all groups. At the level of the foramen
magnum the velocities appear to be higher in the patient groups but numbers are too small to be
definitive in this pilot study. The velocities at C3 are generally greater than at the foramen
magnum (except syrinx patients, in this small cohort), and there is a large overlap of the
interquartile ranges between the subject groups.

108
Figure 7.4 Group median and interquartile range for the peak cranial (Left: A,C,D, and F) and caudal (Right: B, E,
and G) velocities before (pre: A,B), during and after (post: F, G) Valsalva. The onset of the Valsalva is labelled as
Valsalva (C), and the persistent strain as Hold (D, E). Black markers indicate measurements taken at the foramen
magnum and the grey are taken at C3. Each data point indicates an individual subject’s median velocity over the
duration of the Valsalva phase and repeated measurements.

109
Coughing
Figure 7.5 shows typical data obtained from the MRI scans while coughing for one control
subject, and 3 Chiari subjects, two with and one without a syrinx. During the cough there is
initially an increase in cranial flow (~10 cm.s-1; Figures 7.5 A-C) then a caudal return (~5 cm.s-
1; Figures 7.5 A-C). After the cough the cardiac pulse quickly returns in all subjects, although in
one syrinx subject the amplitude of the cardiac pulses post-cough are small (Figure 7.5D) and it
is unclear whether cranial flow was achieved, as peak velocities trended toward 0 cm.s-1 during
the diastolic phase. Note in this case, to prevent aliasing, the encoding velocity was two times
greater than in the other examples (40 cm.s-1), increasing noise and reducing the sensitivity to
the lower velocities of the cardiac pulses.
Figure 7.5 Sample measurements of the CSF velocities during a cough in the cervical spinal canal, in a Control (A),
Chiari patient without (B) and two with a syrinx (C & D). Where cranial velocities are positive and caudal are
negative. The red dashed lines indicate the beginning and end of the coughs.

110
Figure 7.6 Group median and interquartile range for the peak cranial (upper: A, B, and C) and caudal (lower: D, E,
and F) velocities before (pre: A, D), during (B, E), and after (post: C, F) a cough. Black markers indicate
measurements taken at the foramen magnum and the grey are taken at C3. Each data point indicates an individual
subject’s median velocity for the duration of the pre and post cough phases and a minimum of 3 coughs.
Figure 7.6 shows the group data for the peak cranial and caudal velocities, before, during and
after a cough. Within the subject groups, both the cranial and caudal CSF velocities were within
comparable ranges both before and after coughing. The cough resulted in a high velocity cranial
flow peak, followed by a large caudal peak in all subjects. At the foramen magnum, there was a
trend that the Chiari patients had both higher cranial and caudal velocities, but additional subject
numbers are required. In the cervical spine, the CSF velocities seem comparable across groups,
with a large overlap of the interquartile ranges.
Subarachnoid space models
Model validation
For the initial cardiac model, the simulated and measured MRI velocities at C3 showed an
acceptable level of agreement (Figure 7.7A), wherein the example presented the largest error
was at the caudal peak which was underestimated by 0.50 cm.s-1 (17% less than MRI peak
velocity). On average the model predicts the start of caudal flow, the time of peak caudal flow
and when flow transitions from caudal to cranial to occur later in the cardiac cycle than in vivo
(Figures 7.8A-C and Table 7.1). The timing features of these rigid boundary models are
dependent on the applied inlet flow, so these differences can be attributed to the larger error in
timing between flow at the foramen magnum and at C3 (Table 7.1). In general, the absolute
error between the model and MRI cranial and caudal peaks was low, with a tendency to
underestimate the caudal and overestimate the cranial peaks (Figures 7.8D and E; Table 7.1).
The poorest agreement was seen in a control model where the caudal peak was overestimated by
1.33 cm.s-1 (40% greater than MRI measurement).

111
Using a pressure boundary condition at both the inlet and outlet can be unstable, converging on
a solution that is highly dependent on the initial estimates (ANSYS CFX, v18.0, Help System,
Solver Modelling Guide 2.3.2). With the pressure boundary at the inlet, the model converged on
the same solution for both the velocity (Figure 7.7B) and pressure (Figure 7.7C) terms.
Figure 7.7 A) Example of measured MRI and model velocity for a control subject at C3 for a cardiac cycle. Example
of simulated velocities (B) and pressures (C) in the case where flow data are applied to the cranial inlet compared
with when a pressure profile is applied to the inlet
Figure 7.8 Bland-Altman plots assessing the model error (modelled variable – MRI measurement) for the cardiac
models plotted against the MRI measurement. Solid line marks the average model bias, and the dash lines show the
95% limits of agreement (Table 7.1). Characteristics of the timing are on the upper panels, and velocity on the lower.
Table 7.1 Summary of the agreement between model and MRI velocity-time profiles for the cardiac models. Model
error displayed as the bias ±95% limits of agreement. Measured spread of MRI measurements displayed as maximum
range.
Model error Measured spread
Velocity-time feature Plane C3 FM – C3
Time of initial caudal flow [%] 1.14 ± 1.12 2.00
Time of peak caudal flow [%] 9.05 ± 7.20 14.0
Time of return to cranial flow [%] 3.87 ± 4.60 16.0
Peak caudal velocity [cm.s-1] −0.29 ± 0.56 –
Peak cranial velocity [cm.s-1] 0.10 ± 0.19 –

112
Figure 7.9 shows a representative subject-specific model during a coughing pulse followed by a
period of rest. The model shows an acceptable level of error between the cranial peak, slightly
overestimating the velocity at the foramen magnum and underestimating at C3. The caudal peak
shows poorer matching, having a similar peak velocity, but showing a second peak which is not
present in the MRI data. This double peak has been seen in other MRI measurements
(Figure 7.5B), suggesting this error is the result of the summation of the caudal coughing peak
and the systolic CSF pulse, and is due to not matching the duration and timing of the subject’s
cough to the MRI data. The model captures no lasting transient effects after the cough pulse has
finished, with the regular cardiac pulse returning. The same is seen in the MRI data, although
the cardiac pulses match poorly, possibly due to timing difference and respiratory effects of
breathing after a cough.
Figure 7.9 Example CSF velocities in a Chiari patient with a syrinx, calculated with a coughing pulse applied to the
caudal end of the model compared with the subjects measured MRI velocities. The red dashed line indicates the peak
cranial velocity during a cough.

113
Table 7.2 Summary of the agreement between the peak model and MRI velocity, at both the foramen magnum (FM),
and at C3 for the coughing models. Model error displayed as the bias ±95% limits of agreement.
Model error Model error
Velocity-time feature Plane FM Plane C3
Peak caudal velocity [cm.s-1] 2.75 ± 5.58 -0.67 ± 1.56
Peak cranial velocity [cm.s-1] 2.95 ± 2.62 -2.04 ± 1.50
Figure 7.10 Bland-Altman plots assessing the model error (modelled variable – MRI measurement) for the coughing
models plotted against the MRI measurement. Solid line marks the average model bias, and the dash lines show the
95% limits of agreement (Table 7.2). Error in cranial velocity in upper panels, and caudal in lower.
On average the simulated coughing pulse showed greater deviation from in vivo measurements
compared with the cardiac pulses (Tables 7.1 and 7.2). At mid-C3 there was better agreement
between measured and simulated coughing velocities, with a tendency to underestimate both the
peak cranial and caudal velocities. At the foramen magnum the error between measured and
simulated velocities increased (approximately by a factor of 2), typically overestimating the
cranial and caudal velocities.
Models of two subjects with large tonsillar herniations (subject A = 7 mm; subject B = 28 mm)
showed poor agreement at the foramen magnum. Subject A (Figure 7.10) underestimates the
cranial peak by 4 cm.s-1 at C3 and overestimated the peak at the foramen magnum by 10 cm.s-1.
Subject B (Figure 7.10) overestimates the caudal peak at C3 by 2 cm.s-1 and at the foramen
magnum by 17 cm.s-1. The error at C3 in these examples could be explained by some variation
in model geometry, or the pressure of the coughing pulse being incorrect. However, the large
error at the cranial end suggests that either there is poor agreement of the model geometry
(Figure 7.11), or the model is too simple to simulate the system’s behaviour at the cranial end.

114
Figure 7.11 Outline of the model cross-sectional area overlaid on the corresponding axial slice at the foramen
magnum, for subjects A (Left) and B (Right) of Figure 7.10.
Subarachnoid pressures
Figure 7.12 shows the peak pressure differences between the foramen magnum and the cervical
spine for both a cardiac and coughing pulse. The coughing pulse resulted in a larger pressure
pulse driving cranial flow compared with the cardiac pulse, in all subject groups. Chiari patients
tended to have a greater pressure difference compared with controls, although there is
considerable overlap between the subject groups. The simulated pressures during the caudal
phase of the cough were comparable to the systolic cardiac pulse. The poor validation of the
models may lead to incorrect pressures being calculated, and characteristic differences not being
fully captured.
Figure 7.12 Group median and interquartile range of the pressure drop between the cervical spine and foramen
magnum, for a cardiac and coughing pulse. Here a positive pressure drop would drive cranial flow and negative
caudal.

115
Discussion
Evaluation of imaging protocol
Valsalva manoeuvres
The Valsalva manoeuvre is thought to increase intracranial pressure by both decreasing venous
drainage from the cranium, and transient changes in the mean arterial pressure due to the trunk
pressure and baroreceptor reflexes (Dawson et al., 1999; Korner et al., 1976; Williams, 1981a).
The act of straining will also increase the spinal pressures (Martins et al., 1972; Williams,
1981a). As a result, CSF flows will depend on the balance between the intracranial and spinal
pressures, which change dynamically during respiratory manoeuvres. The different behaviours
(exemplified in Figure 7.3) are seen in all subject groups, and could be explained by this
pressure balance without the need of a tonsillar obstruction causing a ‘pressure dissociation’
(Williams, 1981b). However, the effects of intracranial or spinal pressure changes cannot be
easily identified from just CSF flow data. In future scans concurrent arterial and venous flow
data may help characterise the effect of cardiovascular changes on the intracranial pulsation,
since the cardiac component of CSF flow is dependent on the change in the net volume of blood
within the cranium (Alperin et al., 2005a; Alperin et al., 2005b), correlations between the CSF
and arterial blood flow can be attributed to cranial pressure changes.
The variable response to the Valsalva manoeuvre across subjects (Figure 7.3) could be related to
differences in the effort of the strain performed during the scan, or anatomical variation. To get
more consistent responses and to help determine whether differences are the result of
anatomical variation, participants may require more training prior to the scan. Additionally,
monitoring the expiratory pressure during the Valsalva may be required to ensure consistent
performance.
The results of this pilot study suggest that although the general response to a Valsalva may be
similar across both controls and Chiari patients, the velocities at the foramen magnum in the
patient groups may be greater (Figure 7.4). This requires further investigation to determine
whether this is consistent in a larger cohort, and if it corresponds to patient symptomatology
and/or changes with treatment.
Coughing
Single coughs cause a transient rise in spinal pressure which is not associated with a coupled
effect on the arterial pressure, and therefore intracranial pressure (Hamilton et al., 1944;
Hamilton et al., 1936; Williams, 1981a), unlike the Valsalva manoeuvres. As a result,
interpreting the effects of coughing on CSF flow is simplified. Additionally, the instructions for
the manoeuvre are simpler, reducing the chance of participant error, and giving a consistent
behaviour between subjects (Figure 7.5). These factors suggest the single cough protocol is the

116
most suitable and reliable method to assess the effect of large changes in CSF pressure on
Chiari malformation and syringomyelia.
Recently, Bhadelia et al. (2016) has suggested that post-cough the cerebellar tonsils form an
obstruction resulting in a decrease in the amplitude of subsequent cardiac CSF pulsations. In the
current study, both the control subjects and Chiari patients’ cardiac CSF pulsations quickly
normalised post-cough. Additionally, in all participants during the cough there was a large
caudal flow peak following the initial cranial peak (Figures 7.5 and 7.6). This would suggest
that CSF flow is not restricted post-cough by some tonsillar valving mechanism. One subject
did appear to have restricted cranial CSF flow post-cough (Figure 7.5D), however the encoding
velocity was 40 cm.s-1 making the post-cough signal noisy, and unclear is whether this
measurement is accurate. This is an inherent limitation of current real time PC-MRI methods,
whereby the encoding velocities can only be set to reliably measure either the coughing or
cardiac component of CSF flow. As shown by Bhadelia et al. (2016) setting the encoding
velocity to 5 cm.s-1 to capture the lower velocities post cough will likely cause phase wrapping
errors during the coughs. Methods have been developed to take measurements at multiple
encoding velocities, however these require cardiac gating, and only correct for spatial difference
in velocity (Knobloch et al., 2014; Schnell et al., 2017).
The results of this limited cohort indicate that the studied Chiari patients may have higher CSF
velocities at the foramen magnum during a cough compared with controls. A larger sample is
required to determine whether this is representative of Chiari patients and related to the
pathology.
General limitation
Currently, the slice thickness of the axial scans is 10 mm. In Chiari patients this can result in
large partial volume errors at the level of the obstruction, due to the complex geometry of the
craniocervical junction, or the vertebral arteries which penetrate the dura at C1 obscuring the
majority of the anterior CSF space. Without further development, the current technique is
limited for use in the wider investigation of the effect of obstructive CSF flow disorders.
Sources of error in the coughing models
The simplistic assumed shape of the coughing pressure pulse (Figure 7.1), introduced some
error to the simulated velocities (Figure 7.9). Creating the coughing pulse from a subject’s own
epidural blood flow or CSF displacement (Chapter 5), matching the duration of the cough, and
the phase of the cardiac cycle that it occurs in, would likely result in closer agreement between
the models and in vivo data.
Two models showed reasonable agreement with the in vivo coughing velocities at C3, but
discrepancies at the cranial end. Incorrect segmentation of the model geometry could result in

117
this deviation (Pahlavian et al., 2016; Pahlavian et al., 2014), however the small difference in
the cross-sectional area (Figure 7.11) would not be expected to cause such a large increase in
velocity. Therefore, it is likely that there is some important mechanism that is not currently
included in the models. These models assume the dura mater and spinal cord are rigid
boundaries and neglect the effects of intracranial compliance and tonsillar motion. For a cough,
a rigid dura mater is appropriate, as during a cough the extradural pressures are increased (Shah,
1994; Usubiaga et al., 1967) which decrease the compliance of the spinal canal. In Chapter 5 it
was shown that during a cough there is an influx of venous blood into the cranium via the
epidural veins, but also an increased drainage via the internal jugular veins (Figure 5.4). The net
difference between these flows will alter the effective cranial compliance, which may
significantly affect CSF dynamics and should be considered in future models. Additionally, the
increased spinal pressures during a cough could displace the spinal cord and cerebellar tonsils
(Cheng et al., 2014), which may vary the size of the fluid pathways and alter CSF flow and the
subarachnoid pressures. This may be particularly important for Chiari patients with severe
tonsillar herniation (i.e. subjects A and B; Figure 7.10). To incorporate this into future models,
the structures of the cranium may be needed, including the two-way effects of the fluid structure
interaction at the craniocervical junction in particular.
Conclusion
This pilot study demonstrated that real-time PC-MRI can be used to measure changes in CSF
flow during respiratory events such as coughing and Valsalva. Coughing provides a more
reliable measure of large changes in CSF pressure across the different subject groups, whereas
the Valsalva manoeuvre may help assess the effect of transient changes in the mean arterial
pressure. This preliminary data suggests Chiari patients have greater CSF velocities at the
foramen magnum during respiratory manoeuvres, but further investigation is required to
determine if this persists in a larger cohort and is related to patient symptoms.
With the current modelling approach, most of the models achieved an acceptable level of
agreement between the simulated and measured CSF velocities. However, larger discrepancies
in two Chiari patient models with substantial tonsillar obstructions indicates the models are not
completely capturing the biomechanics of the CSF space. Thus, the simulated pressures are
likely unreliable unless intracranial compliance and tonsillar motion are taken into account.

118
8. Summary and conclusions
This thesis has presented a series of six studies which investigated the influence of
cardiovascular, respiratory and structural factors on healthy subjects and patients with Chiari
malformation Type I, which may further our understanding of the biomechanics of syrinx
formation. Within the respective chapters more detailed discussion of the results are presented.
In this section an overview and the wider implications of the findings is presented.
Implications for CSF physiology
Currently, two different mechanisms are thought to drive respiratory-related CSF flow. During
normal quiet breathing, CSF is thought to flow cranially to compensate for increased venous
return during inspiration, and that the opposite occurs during expiration (Dreha-Kulaczewski et
al., 2017; Yamada et al., 2013). During forced expiratory efforts (i.e. coughs, sneezing, and
straining), venous blood fills the epidural veins (Batson, 1940; Henriques, 1962), which
compresses the dural sac, increasing spinal pressure and displacing CSF cranially (Hamilton et
al., 1944; Martins et al., 1972; Reitan, 1941; Williams, 1981a). In Chapter 5 it was
demonstrated that both CSF flow behaviours could be explained by the effects of both the
intrathoracic and abdominal pressures on epidural blood flow into and out of the spinal canal.
With this mechanism it was possible to demonstrate that depending on the relative
distension/compression of the thoracic and lumbar dural sac, both the inspiratory cranial and
caudal CSF flow that is seen in vivo could be achieved (Chapter 6), which had previously not
been explained (Aktas et al., 2019; Dreha-Kulaczewski et al., 2017; Dreha-Kulaczewski et al.,
2018).
In Chapter 5 it was shown that variation in trunk pressure has a significant effect on the CSF
dynamics, and this suggests that accounting for its influence may aid in the understanding of
other research problems. For example, understanding the effect body position on CSF pressure
is important to prevent over drainage of shunts used for treatment of hydrocephalus.
Transitioning from a supine to an upright position causes a hydrostatic drop in intracranial
pressure, however models that only account for the hydrostatic forces tend to overestimate the
measured pressure drop in more upright positions (Bergsneider et al., 2004; Qvarlander et al.,
2013). Data from this thesis suggest that discrepancy may be able to be explained by postural
abdominal contractions (Montes et al., 2017) and increases in abdominal pressure (Cobb et al.,
2005; De Keulenaer et al., 2009), causing an influx of epidural blood into the spinal canal,
which increases lumbar pressure, and reduces the pressure difference with the cranium.
Intrathecal drug injections provide an effective way to deliver treatment directly to the central
nervous system, however the processes which facilitate the distribution of the drug within the
subarachnoid space remain poorly characterised, leading to large variation between patients

119
(Hocking and Wildsmith, 2004; Shafer et al., 1998). The rate at which drugs spread cranially
from the initial lumbar injection site significantly contributes to this variation, and is expected to
be dependent on the mixing of CSF within the subarachnoid space (Eisenach et al., 2003). To
explain this phenomenon, computational models have suggested that cardiac pulsations enhance
dispersion (Hettiarachchi et al., 2011; Hsu et al., 2012), and the anatomical structure of the
subarachnoid space can result in an additional creeping flow in the cranial direction (Khani et
al., 2018; Kuttler et al., 2010; Lawrence et al., 2019; Sánchez et al., 2018). However, it should
be noted that the amplitude of the cardiac pulsation in the lower spinal canal is small (Khani et
al., 2018; Tanaka et al., 1998), so the effect of cardiac pulsation-driven dispersion in the lumbar
spine is likely minimal. In contrast, Chapter 5 demonstrated that variation in abdominal pressure
can result in large displacements of lumbar CSF, particularly during inspiration (Figure 5.7),
which would likely have a significant effect on drug dispersion from the thecal sac delivery
point. Understanding the effects of respiratory forces on drug dispersal may help predict drug
delivery patterns for individual patients, or that respiratory manoeuvres could be used to
facilitate the desired pattern of delivery.
Implications for Chiari malformation and syringomyelia
As noted throughout the thesis, not all Chiari patients develop a syrinx and the reasons for this
are not understood. For a syrinx to form or enlarge there is likely an imbalance between the
fluid flow into and out of the spinal cord. Timing differences between the arterial and CSF
pulsations was suggested as a mechanism which could facilitate an increase of fluid
accumulation (Bilston et al., 2010). In Chapters 2 and 3 this mechanism was assessed with
simulated subject-specific CSF pressures and an idealised model of the perivascular space. The
models showed that early peak pressures in Chiari patients could cause an increase in fluid
accumulation, and that the delay in arterial pulsation required occurs in vivo, providing support
for this mechanism. A limitation of this hypothesis is that it depends on arterial pulsation. This
dependency was derived from ligation studies which showed that with reduced arterial pulse
pressure deposition of tracer along the perivascular spaces diminished, however the ligation also
reduced CSF pulse pressure (Stoodley et al., 1997), so the significance of arterial pulsation
compared with CSF pulse pressure is unclear. Furthermore, recent intravital imaging studies
have shown in surface pial vessels the arterial pulsation to be ~1% of the original diameter
(Mestre et al., 2018), which would be insufficient for this hypothesised mechanism. As for pulse
amplitudes less than 10% of the vessel diameter, the artery during systole does not provide
sufficient resistance for the ‘leaky valve’, and there is no net flow (Figure 3.4A).
Using subject-specific models, it was demonstrated that for a cardiac pulse, the peak CSF
pressure was increased and occurred earlier in the cardiac cycle compared with controls and
syrinx patients, whereas syrinx patients had a pressure-time profile comparable with control

120
subjects (Chapter 2). How the differences between the patient groups may relate to syrinx
development remains unclear. In cross-sectional studies it is typically assumed that the Chiari
patients without a syrinx are representative of a pre-syrinx state (Clarke et al., 2013a; Clarke et
al., 2013b), and that the decreased amplitude and delay in timing are attributed to the syrinx
increasing compliance (Cirovic and Kim, 2012; Elliott et al., 2011; Martin et al., 2010; Martin
and Loth, 2009). In Chapter 4 it was shown that the peak times were correlated with the fraction
of the craniocervical junction obstructed by the tonsils. For syrinx subjects, greater obstruction
correlated with an increase delay in peak time, whereas in syrinx free subjects the degree of
obstruction was associated with earlier timing of the CSF flow peak. Additionally, the
midsagittal cross-sectional area of the posterior fossa was shown to be significantly smaller in
the syrinx cohort. These findings suggest that the timing differences between patient groups
may be caused by the structural anatomy of the obstruction. While this may explain why only
some patients develop syrinxes (Ellenbogen et al., 2000; Milhorat et al., 1999; Tubbs et al.,
2004), this would also indicate that Chiari patients without a syrinx are a poor model of the pre-
syrinx state in patients that go on to develop one.
Williams (1969) suggested that the cerebellar tonsils could act as a one-way valve allowing CSF
to flow cranially, but restricting caudal flow during a cough. This dynamic action has yet to be
demonstrated, however it is still used to explain changes in CSF dynamics (Bhadelia et al.,
2016). In Chapter 7 it was demonstrated that during a cough in both patients with and without a
syrinx there is a large caudal flow at the level of the obstruction (Figures 7.5 and 7.6), which
may indicate that the tonsils do not restrict caudal flow while coughing. Although, this is a
small pilot study and requires further investigation, this initial evidence may prevent further
research into unsupported mechanisms.
Implications for research methods
Imaging
As part of this thesis, a standard protocol for investigating respiratory effects on spinal CSF
flow using real-time PC-MRI has been developed and applied to healthy subjects and a small
number of Chiari patients (Chapters 5 and 7). Short high intensity inspiratory and expiratory
efforts were shown to provide a repeatable response (Figures 5.5-5.7), allowing for the influence
of trunk pressures on CSF flow to be investigated. Single coughs appear to be a more robust
protocol than Valsalva manoeuvres, as they only cause a transient change in spinal pressure, and
are not associated with coupled effects on the arterial pressure (Hamilton et al., 1944; Hamilton
et al., 1936; Williams, 1981a), which may confound results (Chapter 7). Additionally, the
protocol for single coughs is simpler for participants to follow, which in a cohort with potential
cognitive difficulties (Allen et al., 2014; Rogers et al., 2018) may provide more reliable results.
In future work, it is recommended to include single sniffs in the imaging protocol, as

121
demonstrated in Chapter 5 inspiratory efforts can cause an increase in venous drainage, and
either a cranial or caudal displacement of CSF. Contrasting these differences in blood and CSF
flow with coughing in Chiari patients may provide additional insight into the mechanisms of
coughing headache and syrinx development.
Morphological measurements of Chiari have failed to provide consistent markers of the
disorder, which could either further explain patient symptoms or pathology (Table 4.1).
Measurements that are currently used clinically are likely limited by their restriction to the
midsagittal plane (Alperin et al., 2014), as the lateral structures are known to have a significant
influence on CSF dynamics (Bunck et al., 2012; Bunck et al., 2011; Haughton et al., 2003;
Iskandar et al., 2004; Quigley et al., 2004). Three-dimensional shape analysis of the cranial
morphology is a promising avenue for better understanding the complexity of the posterior fossa
and cerebellum shape and the effects of CSF flow in the region. These methods have been
implemented for the analysis of the shape of long bones and the ventricles, however there is still
a need for methodological validation and improved implementation to enable use by non-
specialists (Heimann and Meinzer, 2009; Paniagua et al., 2013; Styner et al., 2006).
Modelling
Computational models can be used to examine the feasibility of proposed mechanisms, and as
such, could provide directions for future research. Additionally, models can be used to provide
data that cannot be collected without invasive methods. Thus, the main aim of modelling should
be to provide clinicians with new insights as to the pathophysiology of Chiari and
syringomyelia, which may lead to changes in the current clinical practices. In order to do this
clinicians need to be convinced that the models are reflective of real physiological processes and
are reliable.
Recently, several studies have been published which indicate that subject-specific models
cannot accurately reproduce the measured CSF velocities, attributing this poor performance to
the lack of anatomical detail (Pahlavian et al., 2014; Yiallourou et al., 2012) or failure to
incorporate key biomechanical processes (Khani et al., 2018; Khani et al., 2017). The modelling
protocol developed in Chapter 2 demonstrated that rigid boundary models, which exclude
additional anatomical features such as the nerve roots can accurately simulate cardiac CSF flow,
but may not be appropriate for modelling respiratory effects such as coughing (Chapter 7). As
the cranial compliance is likely to affect the model’s behaviour, it will need to be included,
either by a lumped-parameter model or explicitly modelling fluid structure interactions.
Models of the CSF space are often validated by comparing the pulse wave velocity of a model
with wave speeds calculated from cardiac-gated MRI measurements (which average over
several cardiac cycles, removing variation due to quiet breathing) (Tables 1.4 and 1.5), however

122
this may not be appropriate, as the pulse speed of the spinal canal is unlikely to be constant. In
Chapter 5 it was demonstrated that respiratory changes in trunk pressure causes changes in the
volume of epidural blood, which will alter the extradural pressure (and the effective stiffness of
the dura) (Usubiaga et al., 1967) and likely compresses the dural sac to drive flow (Chapter 6).
These factors will cause variation in the CSF pulse wave speed with both time and location, as
the wave speed of the spinal canal is dependent on the relative size of the subarachnoid and the
stiffness of the dura (Bertram, 2009; Cirovic, 2009; Cirovic and Kim, 2012; Toro et al., 2018).
This variation needs to be accounted for in future models, particularly to identify if pathological
features alter wave propagation outside the normal limits of variation. To measure the pulse
speed non-invasively the imaging protocol outlined in Chapters 5 and 7 could be adapted to the
sagittal plane. This would enable flow at cranial and caudal positions to be measured
concurrently, which is required since the effect of inspiratory manoeuvres is variable in the
upper cervical spinal canal (Figure 5.7).
Future directions
Understanding syrinx formation
Tonsillar herniation is the most obvious sign of Chiari malformation, and as a result research
has focused on the structure and overcrowding of the posterior fossa (Table 4.1). The descent of
more superior structures of the brain such as the corpus callosum (Houston et al., 2018; Urbizu
et al., 2014), as well as reduced intracranial heights (Eppelheimer et al., 2018; Houston et al.,
2019; Houston et al., 2018; Taştemur et al., 2017) and widths (Taştemur et al., 2017) in Chiari
patients may indicate that supratentorial abnormalities contribute to caudal shift of the hind
brain, however this has yet to be investigated. In dogs with an analogous condition (Chiari-like
malformation), rostral abnormalities in bone structure have been confirmed to contribute to
overcrowding and tonsillar herniation (Knowler et al., 2017; Rusbridge et al., 2018). These
observations, together with the results of Chapter 4, suggest that the role of differences in
supratentorial structures should be investigated in Chiari patients, as abnormalities will likely
alter fluid pathways and CSF flow. This, in turn, may help understand the pathophysiology of
both syrinx formation and coughing triggered headaches that are a common symptom of Chiari
malformation.
In order to understand how the changes in CSF dynamics caused by pathology such as Chiari
malformation or arachnoiditis contribute to syrinx formation, the mechanisms which facilitate
fluid flow into the spinal cord needs to be understood, both in healthy subjects and in patients.
Recent intravital imaging studies have demonstrated that tracer from the subarachnoid space
flows into the perivascular spaces in a pulsatile motion that resembles the arterial pulsation
(Bedussi et al., 2018; Mestre et al., 2018). However, it is unclear whether CSF pressure
pulsations or spinal arterial pulsations drive this flow. To determine this with animal models,

123
comparisons between the effect of ligating the cranial (to reduce CSF pulsation) and spinal (to
reduce pulsation of spinal penetrating arteries only while maintaining cranially-derived CSF
pressure pulsation) arteries could help determine the relative importance of arterial and CSF
pulsation on perivascular flow. This may be technically challenging, and models could be used
to explore the influence of these factors in the first instance.
Currently, perivascular fluid inflow into the CNS is believed to be dependent on cardiovascular
factors, however respiration may have a significant effect and should be included into future
models and experimental studies. In particular, two effects of respiration need to be accounted
for. Firstly, during normal breathing the CSF pressures slowly oscillate (Hamer et al., 1977;
Hamit et al., 1965), and whether this slow variation in CSF pressure is sufficient to drive
periods of net inflow or outflow through the perivascular space, without arterial pulsation, needs
to be determined. Secondly, during inspiration there is an increase in venous drainage from the
cervical spine (Chapter 5), and this could affect perivascular flow by changing the compliance
of the spinal cord (Elliott et al., 2011), or could increase flow into the parenchyma by increasing
the pressure gradient between arteries and veins (Asgari et al., 2015; Holter et al., 2017; Jessen
et al., 2015; Jin et al., 2016). The influence of these factors is important for understanding the
normal fluid homeostasis of the spinal cord, but might also help determine how local changes in
the compliance of the spinal canal, such as those that occur in Chiari and syrinx patients,
contribute to increased fluid uptake in the cord (Berliner et al., 2019; Brodbelt et al., 2003).
Understanding coughing-associated headache
The cause of Chiari associated headache, or why some patient’s headaches are triggered by
coughing and straining is still poorly understood. Imaging studies have shown greater motion of
the spinal cord (Lawrence et al., 2018) and cerebellar tonsils (Leung et al., 2016) in Chiari
patients than matched controls. This increased motion is suspected to cause abnormal tissue
strains which have been suggested to cause headache, although mechanisms of this have not
been demonstrated, and the CNS tissue itself does not contain pain receptors. Additionally, no
difference in the magnitude of cardiac-driven tonsillar motion has been demonstrated between
patients with either persistent or coughing associated headaches (Dawes et al., 2019), however
this issue is likely better investigated using non-cardiac-gated methods to investigate respiratory
related tissue motion during manoeuvres similar to those that evoke headache in patients.
During a cough, spinal pressures are increased (Hamilton et al., 1944; Williams, 1981a) and
there is an influx of venous blood into the cranium via the epidural veins (Figure 5.5). Persistent
coughs or straining, such as in a Valsalva manoeuvre, will cause a transient rise in mean arterial
pressure (Dawson et al., 1999; Korner et al., 1976). Increased CSF pressure may introduce
abnormal tissue motion through the foramen magnum which could strain the hindbrain.

124
Whereas, increased blood pressure may lead to increased tissue pulsation which could strain the
cerebellar tonsils constrained by the craniocervical junction, or dilated blood vessels (i.e.
epidural venous plexus or vertebral arteries) could strain the meninges or compress tissues
within the crowded junction. Determining whether these different mechanisms occur, and their
relative importance, may help understand the triggers of coughing headache.
Conclusion
This program of research used magnetic resonance imaging and computational modelling
methods to better understand CSF circulation in healthy humans and Chiari patients, both with a
syrinx and without. The research has further elucidated the mechanism by which respiratory
manoeuvres drive CSF flow in the spinal canal and demonstrated the primary importance of
abdominal and thoracic pressures in driving this flow, likely via shifts in epidural blood volume.
The methods developed to study this in healthy subjects have been shown to be feasible to apply
in Chiari patients in the future. It has added some additional supporting evidence to the
hypothesis that inflow of fluid into the spinal cord could be altered by changes in the relative
timing of the arrival of CSF and arterial pressure pulses to a penetrating artery. The research has
also provided evidence that structural differences in morphology of the poster fossa between
patients with and without a syrinx could explain why only some patients develop a syrinx,
however this work also highlighted that standard linear measurements poorly characterise the
cranial morphology, and that more advanced techniques are required for future research.
125
References
Absinta, M., Ha, S.-K., Nair, G., Sati, P., Luciano, N.J., Palisoc, M., Louveau, A., Zaghloul,
K.A., Pittaluga, S., Kipnis, J., 2017. Human and Nonhuman Primate Meninges Harbor
Lymphatic Vessels That Can Be Visualized Noninvasively by MRI. Elife 6, e29738.
Aghakhani, N., Parker, F., David, P., Morar, S., Lacroix, C., Benoudiba, F., Tadie, M., 2009.
Long-Term Follow-up of Chiari-Related Syringomyelia in Adults: Analysis of 157 Surgically
Treated Cases. Neurosurgery 64, 308-315; discussion 315.
Aitken, L.A., Lindan, C.E., Sidney, S., Gupta, N., Barkovich, A.J., Sorel, M., Wu, Y.W., 2009.
Chiari Type I Malformation in a Pediatric Population. Pediatric Neurology 40, 449-454.
Aktas, G., Kollmeier, J.M., Joseph, A.A., Merboldt, K.D., Ludwig, H.C., Gartner, J., Frahm, J.,
Dreha-Kulaczewski, S., 2019. Spinal CSF Flow in Response to Forced Thoracic and Abdominal
Respiration. Fluids and Barriers of the CNS 16, 10.
Allen, P.A., Houston, J.R., Pollock, J.W., Buzzelli, C., Li, X., Harrington, A.K., Martin, B.A.,
Loth, F., Lien, M.-C., Maleki, J., Luciano, M.G., 2014. Task-Specific and General Cognitive
Effects in Chiari Malformation Type I. PLoS One 9, e94844.
Alperin, N., Hushek, S.G., Lee, S.H., Sivaramakrishnan, A., Lichtor, T., 2005a. MRI Study of
Cerebral Blood Flow and CSF Flow Dynamics in an Upright Posture: The Effect of Posture on
the Intracranial Compliance and Pressure. Acta Neurochirurgica. Supplement 95, 177-181.
Alperin, N., Lee, S.H., Sivaramakrishnan, A., Hushek, S.G., 2005b. Quantifying the Effect of
Posture on Intracranial Physiology in Humans by MRI Flow Studies. Journal of Magnetic
Resonance Imaging: An Official Journal of the International Society for Magnetic Resonance in
Medicine 22, 591-596.
Alperin, N., Loftus, J.R., Oliu, C.J., Bagci, A.M., Lee, S.H., Ertl-Wagner, B., Green, B., Sekula,
R., 2014. Magnetic Resonance Imaging Measures of Posterior Cranial Fossa Morphology and
Cerebrospinal Fluid Physiology in Chiari Malformation Type I. Neurosurgery 75, 515-522.
Alperin, N., Loftus, J.R., Oliu, C.J., Bagci, A.M., Lee, S.H., Ertl-Wagner, B., Sekula, R.,
Lichtor, T., Green, B.A., 2015. Imaging-Based Features of Headaches in Chiari Malformation
Type I. Neurosurgery 77, 96-103.
Alperin, N., Sivaramakrishnan, A., Lichtor, T., 2005c. Magnetic Resonance Imaging—Based
Measurements of Cerebrospinal Fluid and Blood Flow as Indicators of Intracranial Compliance
in Patients with Chiari Malformation. Journal of Neurosurgery 103, 46-52.
Armonda, R.A., Citrin, C.M., Foley, K.T., Ellenbogen, R.G., 1994. Quantitative Cine-Mode
Magnetic Resonance Imaging of Chiari I Malformations: An Analysis of Cerebrospinal Fluid
Dynamics. Neurosurgery 35.
Asgari, M., de Zelicourt, D., Kurtcuoglu, V., 2016. Glymphatic Solute Transport Does Not
Require Bulk Flow. Scientific Reports 6, 38635.

126
Asgari, M., de Zélicourt, D., Kurtcuoglu, V., 2015. How Astrocyte Networks May Contribute to
Cerebral Metabolite Clearance. Scientific Reports 5, 15024.
Aydin, S., Hanimoglu, H., Tanriverdi, T., Yentur, E., Kaynar, M.Y., 2005. Chiari Type I
Malformations in Adults: A Morphometric Analysis of the Posterior Cranial Fossa. Surgical
Neurology 64, 237-241.
Balint, T.S., Lucey, A.D., 2005. Instability of a Cantilevered Flexible Plate in Viscous Channel
Flow. Journal of Fluids and Structures 20, 893-912.
Ball, M., Dayan, A., 1972. Pathogenesis of Syringomyelia. The Lancet 300, 799-801.
Batson, O.V., 1940. The Function of the Vertebral Veins and Their Role in the Spread of
Metastases. Annals of Surgery 112, 138-149.
Bedford, T., 1935. The Effect of Increased Intracranial Venous Pressure on the Pressure of the
Cerebrospinal Fluid. Brain 58, 427-447.
Bedussi, B., Almasian, M., de Vos, J., VanBavel, E., Bakker, E.N., 2018. Paravascular Spaces
at the Brain Surface: Low Resistance Pathways for Cerebrospinal Fluid Flow. Journal of
Cerebral Blood Flow and Metabolism 38, 719-726.
Bergsneider, M., Yang, I., Hu, X., McArthur, D.L., Cook, S.W., Boscardin, W.J., 2004.
Relationship between Valve Opening Pressure, Body Position, and Intracranial Pressure in
Normal Pressure Hydrocephalus: Paradigm for Selection of Programmable Valve Pressure
Setting. Neurosurgery 55, 851-858; discussion 858-859.
Berkouk, K., Carpenter, P., Lucey, A., 2003. Pressure Wave Propagation in Fluid-Filled Co-
Axial Elastic Tubes Part 1: Basic Theory. Journal of Biomechanical Engineering 125, 852-856.
Berliner, J.A., Woodcock, T., Najafi, E., Hemley, S.J., Lam, M., Cheng, S., Bilston, L.E.,
Stoodley, M.A., 2019. Effect of Extradural Constriction on CSF Flow in Rat Spinal Cord.
Fluids and Barriers of the CNS 16, 7.
Bertram, C., Bilston, L., Stoodley, M., 2008. Tensile Radial Stress in the Spinal Cord Related to
Arachnoiditis or Tethering: A Numerical Model. Medical & Biological Engineering &
Computing 46, 701-707.
Bertram, C.D., 2009. A Numerical Investigation of Waves Propagating in the Spinal Cord and
Subarachnoid Space in the Presence of a Syrinx. Journal of Fluids and Structures 25, 1189-
1205.
Bertram, C.D., 2010. Evaluation by Fluid/Structure-Interaction Spinal-Cord Simulation of the
Effects of Subarachnoid-Space Stenosis on an Adjacent Syrinx. Journal of Biomechanical
Engineering 132, 061009-061009-061015.
Bertram, C.D., Brodbelt, A.R., Stoodley, M.A., 2005. The Origins of Syringomyelia: Numerical
Models of Fluid/Structure Interactions in the Spinal Cord. Journal of Biomechanical
Engineering 127, 1099-1109.

127
Bertram, C.D., Heil, M., 2016. A Poroelastic Fluid/Structure-Interaction Model of
Cerebrospinal Fluid Dynamics in the Cord with Syringomyelia and Adjacent Subarachnoid-
Space Stenosis. Journal of Biomechanical Engineering 139, 011001-011001.
Bezuidenhout, A.F., Khatami, D., Heilman, C.B., Kasper, E.M., Patz, S., Madan, N., Zhao, Y.,
Bhadelia, R.A., 2018. Relationship between Cough-Associated Changes in CSF Flow and
Disease Severity in Chiari I Malformation: An Exploratory Study Using Real-Time MRI.
American Journal of Neuroradiology 39, 1267.
Bhadelia, R.A., Patz, S., Heilman, C., Khatami, D., Kasper, E., Zhao, Y., Madan, N., 2016.
Cough-Associated Changes in CSF Flow in Chiari I Malformation Evaluated by Real-Time
MRI. American Journal of Neuroradiology 37, 825-830.
Bilston, L.E., Fletcher, D.F., Brodbelt, A.R., Stoodley, M.A., 2003. Arterial Pulsation-Driven
Cerebrospinal Fluid Flow in the Perivascular Space: A Computational Model. Computer
Methods in Biomechanics and Biomedical Engineering 6, 235-241.
Bilston, L.E., Stoodley, M.A., Fletcher, D.F., 2010. The Influence of the Relative Timing of
Arterial and Subarachnoid Space Pulse Waves on Spinal Perivascular Cerebrospinal Fluid Flow
as a Possible Factor in Syrinx Development. Journal of Neurosurgery 112, 808-813.
Bilston, L.E., Thibault, L.E., 1995. The Mechanical Properties of the Human Cervical Spinal
Cordin Vitro. Annals of Biomedical Engineering 24, 67-74.
Bioucas-Dias, J.M., Valadao, G., 2007. Phase Unwrapping Via Graph Cuts. IEEE Transactions
on Image Processing 16, 698-709.
Blanco, P.J., Müller, L.O., Spence, J.D., 2017. Blood Pressure Gradients in Cerebral Arteries: A
Clue to Pathogenesis of Cerebral Small Vessel Disease. Stroke and Vascular Neurology 2, 108-
117.
Bland, J.M., Altman, D.G., 2007. Agreement between Methods of Measurement with Multiple
Observations Per Individual. Journal of Biopharmaceutical Statistics 17, 571-582.
Bloomfield, I.G., Johnston, I.H., Bilston, L.E., 1998. Effects of Proteins, Blood Cells and
Glucose on the Viscosity of Cerebrospinal Fluid. Pediatric Neurosurgery 28, 246-251.
Bogdanov, E.I., Faizutdinova, A.T., Mendelevich, E.G., Sozinov, A.S., Heiss, J.D., 2019.
Epidemiology of Symptomatic Chiari Malformation in Tatarstan: Regional and Ethnic
Differences in Prevalence. Neurosurgery 84, 1090-1097.
Bombardini, T., Gemignani, V., Bianchini, E., Venneri, L., Petersen, C., Pasanisi, E., Pratali, L.,
Alonso-Rodriguez, D., Pianelli, M., Faita, F., Giannoni, M., Arpesella, G., Picano, E., 2008.
Diastolic Time - Frequency Relation in the Stress Echo Lab: Filling Timing and Flow at
Different Heart Rates. Cardiovascular Ultrasound 6, 15.
Borlotti, A., Vermeersch, S., Rietzschel, E., Segers, P., Khir, A.W., 2010. A Comparison
between Local Wave Speed in the Carotid and Femoral Arteries in Healthy Humans:
Application of a New Method. Conference proceedings: Conference of the IEEE Engineering in

128
Medicine and Biology Society. IEEE Engineering in Medicine and Biology Society. Annual
Conference 2010, 2857-2860.
Brickell, K.L., Anderson, N.E., Charleston, A.J., Hope, J.K.A., Bok, A.P.L., Barber, P.A., 2006.
Ethnic Differences in Syringomyelia in New Zealand. Journal of Neurology, Neurosurgery, and
Psychiatry 77, 989-991.
Brinker, T., Stopa, E., Morrison, J., Klinge, P., 2014. A New Look at Cerebrospinal Fluid
Circulation. Fluids and Barriers of the CNS 11, 10.
Brodbelt, A., Stoodley, M., 2007. CSF Pathways: A Review. British Journal of Neurosurgery
21, 510-520.
Brodbelt, A.R., Stoodley, M.A., Watling, A.M., Tu, J., Burke, S., Jones, N.R.J.S., 2003. Altered
Subarachnoid Space Compliance and Fluid Flow in an Animal Model of Posttraumatic
Syringomyelia. 28, E413-E419.
Bunck, A.C., Kroeger, J.R., Juettner, A., Brentrup, A., Fiedler, B., Crelier, G.R., Martin, B.A.,
Heindel, W., Maintz, D., Schwindt, W., Niederstadt, T., 2012. Magnetic Resonance 4D Flow
Analysis of Cerebrospinal Fluid Dynamics in Chiari I Malformation with and without
Syringomyelia. European Radiology 22, 1860-1870.
Bunck, A.C., Kröger, J.-R., Jüttner, A., Brentrup, A., Fiedler, B., Schaarschmidt, F., Crelier,
G.R., Schwindt, W., Heindel, W., Niederstadt, T., Maintz, D., 2011. Magnetic Resonance 4D
Flow Characteristics of Cerebrospinal Fluid at the Craniocervical Junction and the Cervical
Spinal Canal. European Radiology 21, 1788-1796.
Cacciola, F., Capozza, M., Perrini, P., Benedetto, N., Di Lorenzo, N., 2009. Syringopleural
Shunt as a Rescue Procedure in Patients with Syringomyelia Refractory to Restoration of
Cerebrospinal Fluid Flow. Neurosurgery 65, 471-476; discussion 476.
Carpenter, P., Berkouk, K., Lucey, A., 2003. Pressure Wave Propagation in Fluid-Filled Co-
Axial Elastic Tubes Part 2: Mechanisms for the Pathogenesis of Syringomyelia. Journal of
Biomechanical Engineering 125, 857-863.
Chang, H.S., Nakagawa, H., 2003. Hypothesis on the Pathophysiology of Syringomyelia Based
on Simulation of Cerebrospinal Fluid Dynamics. Journal of Neurology, Neurosurgery &
Psychiatry 74, 344-347.
Chang, H.S., Nakagawa, H., 2004. Theoretical Analysis of the Pathophysiology of
Syringomyelia Associated with Adhesive Arachnoiditis. Journal of Neurology, Neurosurgery &
Psychiatry 75, 754-757.
Cheng, S., Fletcher, D., Hemley, S., Stoodley, M., Bilston, L., 2014. Effects of Fluid Structure
Interaction in a Three Dimensional Model of the Spinal Subarachnoid Space. Journal of
Biomechanics 47, 2826-2830.
Cheng, S., Stoodley, M.A., Wong, J., Hemley, S., Fletcher, D.F., Bilston, L.E., 2012. The
Presence of Arachnoiditis Affects the Characteristics of CSF Flow in the Spinal Subarachnoid
Space: A Modelling Study. Journal of Biomechanics 45, 1186-1191.

129
Chumas, P.D., Armstrong, D.C., Drake, J.M., Kulkarni, A.V., Hoffman, H.J., Humphreys, R.P.,
Rutka, J.T., Hendrick, E.B., 1993. Tonsillar Herniation: The Rule Rather Than the Exception
after Lumboperitoneal Shunting in the Pediatric Population. Journal of Neurosurgery 78, 568-
573.
Cirovic, S., 2009. A Coaxial Tube Model of the Cerebrospinal Fluid Pulse Propagation in the
Spinal Column. Journal of Biomechanical Engineering 131, 021008.
Cirovic, S., Kim, M., 2012. A One-Dimensional Model of the Spinal Cerebrospinal-Fluid
Compartment. Journal of Biomechanical Engineering 134, 021005.
Clarke, E.C., Fletcher, D.F., Bilston, L.E., 2017. Sustained High-Pressure in the Spinal
Subarachnoid Space While Arterial Expansion Is Low May Be Linked to Syrinx Development.
Computer Methods in Biomechanics and Biomedical Engineering 20, 457-467.
Clarke, E.C., Fletcher, D.F., Stoodley, M.A., Bilston, L.E., 2013a. Computational Fluid
Dynamics Modelling of Cerebrospinal Fluid Pressure in Chiari Malformation and
Syringomyelia. Journal of Biomechanics 46, 1801-1809.
Clarke, E.C., Stoodley, M.A., Bilston, L.E., 2013b. Changes in Temporal Flow Characteristics
of CSF in Chiari Malformation Type I with and without Syringomyelia: Implications for Theory
of Syrinx Development. Journal of Neurosurgery 118, 1135-1140.
Cloyd, M.W., Low, F.N., 1974. Scanning Electron Microscopy of the Subarachnoid Space in
the Dog. I. Spinal Cord Levels. The Journal of Comparative Neurology 153, 325-367.
Cobb, W.S., Burns, J.M., Kercher, K.W., Matthews, B.D., James Norton, H., Todd Heniford,
B., 2005. Normal Intraabdominal Pressure in Healthy Adults. Journal of Surgical Research 129,
231-235.
Dagtekin, A., Avci, E., Kara, E., Uzmansel, D., Dagtekin, O., Koseoglu, A., Talas, D.,
Bagdatoglu, C., 2011. Posterior Cranial Fossa Morphometry in Symptomatic Adult Chiari I
Malformation Patients: Comparative Clinical and Anatomical Study. Clinical Neurology and
Neurosurgery 113, 399-403.
Davidson, K.A., Rogers, J.M., Stoodley, M.A., 2018. Syrinx to Subarachnoid Shunting for
Syringomyelia. World Neurosurgery 110, e53-e59.
Dawes, B.H., Lloyd, R.A., Rogers, J.M., Magnussen, J.S., Bilston, L.E., Stoodley, M.A., 2019.
Cerebellar Tissue Strain in Chiari Malformation with Headache. World Neurosurgery [In Press].
Dawson, S.L., Panerai, R.B., Potter, J.F., 1999. Critical Closing Pressure Explains Cerebral
Hemodynamics During the Valsalva Maneuver. Journal of Applied Physiology 86, 675-680.
De Keulenaer, B.L., De Waele, J.J., Powell, B., Malbrain, M.L.N.G., 2009. What Is Normal
Intra-Abdominal Pressure and How Is It Affected by Positioning, Body Mass and Positive End-
Expiratory Pressure? Intensive Care Medicine 35, 969-976.

130
Diem, A.K., Tan, M., Bressloff, N.W., Hawkes, C., Morris, A.W.J., Weller, R.O., Carare, R.O.,
2016. A Simulation Model of Periarterial Clearance of Amyloid-Β from the Brain. Frontiers in
Aging Neuroscience 8.
Dolar, M.T., Haughton, V.M., Iskandar, B.J., Quigley, M., 2004. Effect of Craniocervical
Decompression on Peak CSF Velocities in Symptomatic Patients with Chiari I Malformation.
American Journal of Neuroradiology 25, 142-145.
Dreha-Kulaczewski, S., Joseph, A.A., Merboldt, K.D., Ludwig, H.C., Gartner, J., Frahm, J.,
2015. Inspiration Is the Major Regulator of Human CSF Flow. The Journal of Neuroscience 35,
2485-2491.
Dreha-Kulaczewski, S., Joseph, A.A., Merboldt, K.D., Ludwig, H.C., Gartner, J., Frahm, J.,
2017. Identification of the Upward Movement of Human CSF in Vivo and Its Relation to the
Brain Venous System. Journal of Neuroscience 37, 2395-2402.
Dreha-Kulaczewski, S., Konopka, M., Joseph, A.A., Kollmeier, J., Merboldt, K.-D., Ludwig,
H.-C., Gärtner, J., Frahm, J., 2018. Respiration and the Watershed of Spinal CSF Flow in
Humans. Scientific Reports 8, 5594.
Du Boulay, G., O'Connell, J., Currie, J., Bostick, T., Verity, P., 1972. Further Investigations on
Pulsatile Movements in the Cerebrospinal Fluid Pathways. Acta Radiologica: Diagnosis 13,
496-523.
Dubey, A., Sung, W.S., Shaya, M., Patwardhan, R., Willis, B., Smith, D., Nanda, A., 2009.
Complications of Posterior Cranial Fossa Surgery--an Institutional Experience of 500 Patients.
Surgical Neurology 72, 369-375.
Dufton, J.A., Habeeb, S.Y., Heran, M.K.S., Mikulis, D.J., Islam, O., 2011. Posterior Fossa
Measurements in Patients with and without Chiari I Malformation. Canadian Journal of
Neurological Sciences / Journal Canadien des Sciences Neurologiques 38, 452-455.
Dunbar, H.S., Guthrie, T.C., Karpell, B., 1966. A Study of the Cerebrospinal Fluid Pulse Wave.
Archives of Neurology 14, 624-630.
Eisenach, M.D.James C., Hood, M.D.David D., Curry, R.N.R., Shafer, M.D.Steven L., 2003.
Cephalad Movement of Morphine and Fentanyl in Humans after Intrathecal Injection.
Anesthesiology 99, 166-173.
Ellenbogen, R.G., Armonda, R.A., Shaw, D.W.W., Winn, H.R., 2000. Toward a Rational
Treatment of Chiari I Malformation and Syringomyelia. Neurosurgical Focus 8, 1-10.
Elliott, N., Bertram, C., Martin, B.A., Brodbelt, A., 2013. Syringomyelia: A Review of the
Biomechanics. Journal of Fluids and Structures 40, 1-24.
Elliott, N., Lockerby, D.A., Brodbelt, A., 2009. The Pathogenesis of Syringomyelia: A Re-
Evaluation of the Elastic-Jump Hypothesis. Journal of Biomechanical Engineering 131, 044503.

131
Elliott, N., Lockerby, D.A., Brodbelt, A., 2011. A Lumped-Parameter Model of the
Cerebrospinal System for Investigating Arterial-Driven Flow in Posttraumatic Syringomyelia.
Medical Engineering & Physics 33, 874-882.
Elliott, N.S.J., Lucey, A.D., Lockerby, D.A., Brodbelt, A.R., 2017. Fluid–Structure Interactions
in a Cylindrical Layered Wave Guide with Application in the Spinal Column to Syringomyelia.
Journal of Fluids and Structures 70, 464-499.
Eppelheimer, M.S., Houston, J.R., Bapuraj, J.R., Labuda, R., Loth, D.M., Braun, A.M., Allen,
N.J., Heidari Pahlavian, S., Biswas, D., Urbizu, A., Martin, B.A., Maher, C.O., Allen, P.A.,
Loth, F., 2018. A Retrospective 2D Morphometric Analysis of Adult Female Chiari Type I
Patients with Commonly Reported and Related Conditions. Frontiers in Neuroanatomy 12.
Fernández, A., Alfredo, Guerrero, I., Alberto, Martínez, I., Maravillas, Vázquez, A., María
Eugenia, Fernández, B., Javier, Octavio, C., I,Ester, Labrado, D., Javier, Silva, E., Mercedes,
Fernández , M., García-Ramos, R., García Ribes, M., Gómez, C., Insausti Valdivia, J., Navarro
Valbuena, R., Ramón, J.R., 2009. Malformations of the Craniocervical Junction (Chiari Type I
and Syringomyelia: Classification, Diagnosis and Treatment). BMC Musculoskeletal Disorders
10, S1-S1.
Gadde, J.A., Shah, V., Liebo, G.B., Ringstad, G.A., Pomeraniec, I.J., Bakke, S.J., Fric, R.,
Ksendzovsky, A., Jane, J.A., Schwartz, E.S., Haughton, V., 2017. Anatomical Features of the
Cervical Spinal Canal in Chiari I Deformity with Presyrinx: A Case-Control Study. The
Neuroradiology Journal 30, 405-409.
Gardner, W.J., 1965. Hydrodynamic Mechanism of Syringomyelia: Its Relationship to
Myelocele. Journal of Neurology, Neurosurgery & Psychiatry 28, 247-259.
Geurts, L., Biessels, G.J., Luijten, P., Zwanenburg, J., 2018. Better and Faster Velocity
Pulsatility Assessment in Cerebral White Matter Perforating Arteries with 7T Quantitative Flow
MRI through Improved Slice Profile, Acquisition Scheme, and Postprocessing. Magnetic
Resonance in Medicine 79, 1473-1482.
Gladdish, S., Manawadu, D., Banya, W., Cameron, J., Bulpitt, C.J., Rajkumar, C., 2005.
Repeatability of Non-Invasive Measurement of Intracerebral Pulse Wave Velocity Using
Transcranial Doppler. Clinical Science 108, 433-439.
Greitz, D., 2006. Unraveling the Riddle of Syringomyelia. Neurosurgical Review 29, 251-264.
Greitz, D., Ericson, K., Flodmark, O., 1999. Pathogenesis and Mechanics of Spinal Cord Cysts-
a New Hypothesis Based on Magnetic Resonance Studies of Cerebrospinal Fluid Dynamics.
International Journal of Neuroradiology 5, 61-78.
Greitz, D., Hannerz, J., 1996. A Proposed Model of Cerebrospinal Fluid Circulation:
Observations with Radionuclide Cisternography. American Journal of Neuroradiology 17, 431.
Groen, R.J., du Toit, D.F., Phillips, F.M., Hoogland, P.V., Kuizenga, K., Coppes, M.H., Muller,
C.J., Grobbelaar, M., Mattyssen, J., 2004. Anatomical and Pathological Considerations in
Percutaneous Vertebroplasty and Kyphoplasty: A Reappraisal of the Vertebral Venous System.
Spine 29, 1465-1471.

132
Groen, R.J.M., Grobbelaar, M., Muller, C.J.F., van Solinge, G., Verhoof, O., du Toit, D.F.,
Hoogland, P.V.J.M., 2005. Morphology of the Human Internal Vertebral Venous Plexus: A
Cadaver Study after Latex Injection in the 21–25-Week Fetus. Clinical Anatomy 18, 397-403.
Groen, R.J.M., Groenewegen, H.J., van Alphen, H.A.M., Hoogland, P.V.J.M., 1997.
Morphology of the Human Internal Vertebral Venous Plexus: A Cadaver Study after
Intravenous Araldite Cy 221 Injection. The Anatomical Record: An Official Publication of the
American Association of Anatomists 249, 285-294.
Gupta, S., Soellinger, M., Boesiger, P., Poulikakos, D., Kurtcuoglu, V., 2009. Three-
Dimensional Computational Modeling of Subject-Specific Cerebrospinal Fluid Flow in the
Subarachnoid Space. Journal of Biomechanical Engineering 131, 021010.
Gupta, S., Soellinger, M., Grzybowski, D.M., Boesiger, P., Biddiscombe, J., Poulikakos, D.,
Kurtcuoglu, V., 2010. Cerebrospinal Fluid Dynamics in the Human Cranial Subarachnoid
Space: An Overlooked Mediator of Cerebral Disease. I. Computational Model. Journal of The
Royal Society Interface 7, 1195.
Guyotat, J., Bret, P., Jouanneau, E., Ricci, A.C., Lapras, C., 1998. Syringomyelia Associated
with Type I Chiari Malformation a 21-Year Retrospective Study on 75 Cases Treated by
Foramen Magnum Decompression with a Special Emphasis on the Value of Tonsils Resection.
Acta Neurochirurgica 140, 745-754.
Hamer, J., Alberti, E., Hoyer, S., Wiedemann, K., 1977. Influence of Systemic and Cerebral
Vascular Factors on the Cerebrospinal Fluid Pulse Waves. Journal of Neurosurgery 46, 36-45.
Hamilton, W.F., Woodbury, R.A., H. T. Harper, J., 1944. Arterial, Cerebrospinal and Venous
Pressures in Man During Cough and Strain. American Journal of Physiology-Legacy Content
141, 42-50.
Hamilton, W.F., Woodbury, R.A., Harper, H.T., Jr, 1936. Physiologic Relationships between
Intrathoracic, Intraspinal and Arterial Pressures. Journal of the American Medical Association
107, 853-856.
Hamit, H.F., BEALL JR, A.C., De Bakey, M.E., 1965. Hemodynamic Influences Upon Brain
and Cerebrospinal Fluid Pulsations and Pressures. Journal of Trauma and Acute Care Surgery 5,
174-184.
Hammersley, J., Haughton, V., Wang, Y., del Rio, A.M., 2012. Tapering of the Cervical Spinal
Canal in Patients with Scoliosis with and without the Chiari I Malformation. American Journal
of Neuroradiology 33, 1752.
Haughton, V.M., Korosec, F.R., Medow, J.E., Dolar, M.T., Iskandar, B.J., 2003. Peak Systolic
and Diastolic CSF Velocity in the Foramen Magnum in Adult Patients with Chiari I
Malformations and in Normal Control Participants. American Journal of Neuroradiology 24,
169-176.
Hawkes, C.A., Hartig, W., Kacza, J., Schliebs, R., Weller, R.O., Nicoll, J.A., Carare, R.O.,
2011. Perivascular Drainage of Solutes Is Impaired in the Ageing Mouse Brain and in the
Presence of Cerebral Amyloid Angiopathy. Acta Neuropathologica 121, 431-443.

133
Heiberg, E., Sjogren, J., Ugander, M., Carlsson, M., Engblom, H., Arheden, H., 2010. Design
and Validation of Segment--Freely Available Software for Cardiovascular Image Analysis.
BMC Medical Imaging 10, 1.
Heil, M., Bertram, C.D., 2016. A Poroelastic Fluid–Structure Interaction Model of
Syringomyelia. Journal of Fluid Mechanics 809, 360-389.
Heimann, T., Meinzer, H.-P., 2009. Statistical Shape Models for 3D Medical Image
Segmentation: A Review. Medical Image Analysis 13, 543-563.
Heiss, J., 2014. Diagnostic Investigations, in: Flint, G., Rusbridge, C. (Eds.), Syringomyelia: A
Disorder of CSF Circulation. Springer Berlin Heidelberg, Berlin, Heidelberg, pp. 125-140.
Heiss, J.D., Jarvis, K., Smith, R.K., Eskioglu, E., Gierthmuehlen, M., Patronas, N.J., Butman,
J.A., Argersinger, D.P., Lonser, R.R., Oldfield, E.H., 2018. Origin of Syrinx Fluid in
Syringomyelia: A Physiological Study. Neurosurgery 84, 457-468.
Heiss, J.D., Patronas, N., DeVroom, H.L., Shawker, T., Ennis, R., Kammerer, W., Eidsath, A.,
Talbot, T., Morris, J., Eskioglu, E., Oldfield, E.H., 1999. Elucidating the Pathophysiology of
Syringomyelia. Journal of Neurosurgery 91, 553-562.
Heiss, J.D., Snyder, K., Peterson, M.M., Patronas, N.J., Butman, J.A., Smith, R.K., DeVroom,
H.L., Sansur, C.A., Eskioglu, E., Kammerer, W.A., Oldfield, E.H., 2012. Pathophysiology of
Primary Spinal Syringomyelia. Journal of Neurosurgery: Spine 17, 367-380.
Hemley, S.J., Bilston, L.E., Cheng, S., Chan, J.N., Stoodley, M.A., 2013. Aquaporin-4
Expression in Post-Traumatic Syringomyelia. Journal of Neurotrauma 30, 1457-1467.
Hemley, S.J., Bilston, L.E., Cheng, S., Stoodley, M.A., 2012. Aquaporin-4 Expression and
Blood-Spinal Cord Barrier Permeability in Canalicular Syringomyelia. Journal of Neurosurgery:
Spine 17, 602-612.
Hemley, S.J., Tu, J., Stoodley, M.A., 2009. Role of the Blood-Spinal Cord Barrier in
Posttraumatic Syringomyelia. Journal of Neurosurgery: Spine 11, 696-704.
Henriques, C., 1962. The Veins of the Vertebral Column and Their Role in the Spread of
Cancer: Hunterian Lecture Delivered at the Royal College of Surgeons of England on 3rd
October 1961. Annals of the Royal College of Surgeons of England 31, 1.
Henry–Feugeas, M.-C., Idy–Peretti, I., Baledent, O., Poncelet–Didon, A., Zannoli, G., Bittoun,
J., Schouman–Claeys, E., 2000. Origin of Subarachnoid Cerebrospinal Fluid Pulsations: A
Phase-Contrast MR Analysis. Magnetic Resonance Imaging 18, 387-395.
Hettiarachchi, H.D.M., Hsu, Y., Harris, T.J., Linninger, A.A., 2011. The Effect of Pulsatile
Flow on Intrathecal Drug Delivery in the Spinal Canal. Annals of Biomedical Engineering 39,
2592.

134
Hirabayashi, Y., Saitoh, K., Fukuda, H., Igarashi, T., Shimizu, R., Seo, N., 1997. Magnetic
Resonance Imaging of the Extradural Space of the Thoracic Spine. British Journal of
Anaesthesia 79, 563-566.
Hirano, M., Haughton, V., Munoz del Rio, A., 2012. Tapering of the Cervical Spinal Canal in
Patients with Chiari I Malformations. American Journal of Neuroradiology 33, 1326.
Hirata, K., Yaginuma, T., O’Rourke, M.F., Kawakami, M., 2006. Age-Related Changes in
Carotid Artery Flow and Pressure Pulses: Possible Implications for Cerebral Microvascular
Disease. Stroke 37, 2552-2556.
Hocking, G., Wildsmith, J.A.W., 2004. Intrathecal Drug Spread. British Journal of Anaesthesia
93, 568-578.
Hoeks, A.P., Brands, P.J., Willigers, J.M., Reneman, R.S., 1999. Non-Invasive Measurement of
Mechanical Properties of Arteries in Health and Disease. Proceedings of the Institution of
Mechanical Engineers. Part H, Journal of Engineering in Medicine 213, 195-202.
Hofmann, E., Warmuth-Metz, M., Bendszus, M., Solymosi, L., 2000. Phase-Contrast MR
Imaging of the Cervical CSF and Spinal Cord: Volumetric Motion Analysis in Patients with
Chiari I Malformation. American Journal of Neuroradiology 21, 151-158.
Holter, K.E., Kehlet, B., Devor, A., Sejnowski, T.J., Dale, A.M., Omholt, S.W., Ottersen, O.P.,
Nagelhus, E.A., Mardal, K.-A., Pettersen, K.H., 2017. Interstitial Solute Transport in 3D
Reconstructed Neuropil Occurs by Diffusion Rather Than Bulk Flow. Proceedings of the
National Academy of Sciences 114, 9894.
Houston, J.R., Allen, N.J., Eppelheimer, M.S., Bapuraj, J.R., Biswas, D., Allen, P.A., Vorster,
S.J., Luciano, M.G., Loth, F., 2019. Evidence for Sex Differences in Morphological
Abnormalities in Type I Chiari Malformation. The Neuroradiology Journal 32, 458-466.
Houston, J.R., Eppelheimer, M.S., Pahlavian, S.H., Biswas, D., Urbizu, A., Martin, B.A.,
Bapuraj, J.R., Luciano, M., Allen, P.A., Loth, F., 2018. A Morphometric Assessment of Type I
Chiari Malformation above the Mcrae Line: A Retrospective Case-Control Study in 302 Adult
Female Subjects. Journal of Neuroradiology 45, 23-31.
Hsu, Y., Hettiarachchi, H.D.M., Zhu, D.C., Linninger, A.A., 2012. The Frequency and
Magnitude of Cerebrospinal Fluid Pulsations Influence Intrathecal Drug Distribution: Key
Factors for Interpatient Variability. Anesthesia & Analgesia 115, 386-394.
Hübner, B., Walhorn, E., Dinkler, D., 2004. A Monolithic Approach to Fluid–Structure
Interaction Using Space–Time Finite Elements. Computer Methods in Applied Mechanics and
Engineering 193, 2087-2104.
Hwang, H.S., Moon, J.G., Kim, C.H., Oh, S.-M., Song, J.-H., Jeong, J.H., 2013. The
Comparative Morphometric Study of the Posterior Cranial Fossa : What Is Effective
Approaches to the Treatment of Chiari Malformation Type 1? Journal of Korean Neurosurgical
Society 54, 405-410.

135
Iliff, J.J., Lee, H., Yu, M., Feng, T., Logan, J., Nedergaard, M., Benveniste, H., 2013a. Brain-
Wide Pathway for Waste Clearance Captured by Contrast-Enhanced MRI. The Journal of
Clinical Investigation 123, 1299-1309.
Iliff, J.J., Wang, M., Liao, Y., Plogg, B.A., Peng, W., Gundersen, G.A., Benveniste, H., Vates,
G.E., Deane, R., Goldman, S.A., Nagelhus, E.A., Nedergaard, M., 2012. A Paravascular
Pathway Facilitates CSF Flow through the Brain Parenchyma and the Clearance of Interstitial
Solutes, Including Amyloid Beta. Science Translational Medicine 4, 147ra111.
Iliff, J.J., Wang, M., Zeppenfeld, D.M., Venkataraman, A., Plog, B.A., Liao, Y., Deane, R.,
Nedergaard, M., 2013b. Cerebral Arterial Pulsation Drives Paravascular CSF-Interstitial Fluid
Exchange in the Murine Brain. The Journal of Neuroscience 33, 18190-18199.
Iskandar, B.J., Quigley, M., Haughton, V.M., 2004. Foramen Magnum Cerebrospinal Fluid
Flow Characteristics in Children with Chiari I Malformation before and after Craniocervical
Decompression. Journal of Neurosurgery 101, 169-178.
Jessen, N.A., Munk, A.S.F., Lundgaard, I., Nedergaard, M., 2015. The Glymphatic System: A
Beginner’s Guide. Neurochemical Research 40, 2583-2599.
Jia, C., Li, H., Wu, J., Gao, K., Zhao, C.B., Li, M., Sun, X., Yang, B., 2019. Comparison
Decompression by Duraplasty or Cerebellar Tonsillectomy for Chiari Malformation-I
Complicated with Syringomyelia. Clinical Neurology and Neurosurgery 176, 1-7.
Jin, B.-J., Smith, A.J., Verkman, A.S., 2016. Spatial Model of Convective Solute Transport in
Brain Extracellular Space Does Not Support a “Glymphatic” Mechanism. The Journal of
General Physiology 148, 489.
Kalata, W., Martin, B.A., Oshinski, J.N., Jerosch-Herold, M., Royston, T.J., Loth, F., 2009. MR
Measurement of Cerebrospinal Fluid Velocity Wave Speed in the Spinal Canal. IEEE
Transactions on Bio-medical Engineering 56, 1765-1768.
Kamran, S., Wright, B.D., 2001. Complications of Intrathecal Drug Delivery Systems.
Neuromodulation: Technology at the Neural Interface 4, 111-115.
Karagoz, F., Izgi, N., Kapijcijoglu Sencer, S., 2002. Morphometric Measurements of the
Cranium in Patients with Chiari Type I Malformation and Comparison with the Normal
Population. Acta Neurochirurgica 144, 165-171.
Kelly, R., Hayward, C., Avolio, A., O'Rourke, M., 1989. Noninvasive Determination of Age-
Related Changes in the Human Arterial Pulse. Circulation 80, 1652-1659.
Khalsa, S.S.S., Geh, N., Martin, B.A., Allen, P.A., Strahle, J., Loth, F., Habtzghi, D., Serrano,
A.U., McQuaide, D., Garton, H.J.L., Muraszko, K.M., Maher, C.O., 2018. Morphometric and
Volumetric Comparison of 102 Children with Symptomatic and Asymptomatic Chiari
Malformation Type I. Journal of Neurosurgery: Pediatrics 21, 65-71.
Khalsa, S.S.S., Siu, A., DeFreitas, T.A., Cappuzzo, J.M., Myseros, J.S., Magge, S.N., Oluigbo,
C.O., Keating, R.F., 2017. Comparison of Posterior Fossa Volumes and Clinical Outcomes after
Decompression of Chiari Malformation Type I. Journal of Neurosurgery: Pediatrics, 1-7.

136
Khani, M., Sass, L.R., Xing, T., Keith Sharp, M., Balédent, O., Martin, B.A., 2018.
Anthropomorphic Model of Intrathecal Cerebrospinal Fluid Dynamics within the Spinal
Subarachnoid Space: Spinal Cord Nerve Roots Increase Steady-Streaming. Journal of
Biomechanical Engineering 140, 081012-081012-081015.
Khani, M., Xing, T., Gibbs, C., Oshinski, J.N., Stewart, G.R., Zeller, J.R., Martin, B.A., 2017.
Nonuniform Moving Boundary Method for Computational Fluid Dynamics Simulation of
Intrathecal Cerebrospinal Flow Distribution in a Cynomolgus Monkey. Journal of
Biomechanical Engineering 139, 081005-081005-081012.
Kim, M.O., Li, Y., Wei, F., Wang, J., O'Rourke, M.F., Adji, A., Avolio, A.P., 2017. Normal
Cerebral Vascular Pulsations in Humans: Changes with Age and Implications for Microvascular
Disease. Journal of Hypertension 35, 2245-2256.
Klekamp, J., 2002. The Pathophysiology of Syringomyelia–Historical Overview and Current
Concept. Acta Neurochirurgica 144, 649-664.
Knobloch, V., Binter, C., Kurtcuoglu, V., Kozerke, S., 2014. Arterial, Venous, and
Cerebrospinal Fluid Flow: Simultaneous Assessment with Bayesian Multipoint Velocity-
Encoded MR Imaging. Radiology 270, 566-573.
Knowler, S.P., Cross, C., Griffiths, S., McFadyen, A.K., Jovanovik, J., Tauro, A., Kibar, Z.,
Driver, C.J., La Ragione, R.M., Rusbridge, C., 2017. Use of Morphometric Mapping to
Characterise Symptomatic Chiari-Like Malformation, Secondary Syringomyelia and Associated
Brachycephaly in the Cavalier King Charles Spaniel. PLoS One 12, e0170315.
Konno, K., Mead, J., 1967. Measurement of the Separate Volume Changes of Rib Cage and
Abdomen During Breathing. Journal of Applied Physiology 22, 407-422.
Korner, P.I., Tonkin, A.M., Uther, J.B., 1976. Reflex and Mechanical Circulatory Effects of
Graded Valsalva Maneuvers in Normal Man. Journal of Applied Physiology 40, 434-440.
Kraemer, H.C., 2019. Is It Time to Ban the P Value? Journal of the American Medical
Association psychiatry doi:10.1001/jamapsychiatry.2019.1965.
Kuttler, A., Dimke, T., Kern, S., Helmlinger, G., Stanski, D., Finelli, L.A., 2010. Understanding
Pharmacokinetics Using Realistic Computational Models of Fluid Dynamics: Biosimulation of
Drug Distribution within the CSF Space for Intrathecal Drugs. Journal of Pharmacokinetics and
Pharmacodynamics 37, 629-644.
Lam, M.A., Hemley, S.J., Najafi, E., Vella, N.G.F., Bilston, L.E., Stoodley, M.A., 2017. The
Ultrastructure of Spinal Cord Perivascular Spaces: Implications for the Circulation of
Cerebrospinal Fluid. Scientific Reports 7, 12924.
Lawley, J.S., Petersen, L.G., Howden, E.J., Sarma, S., Cornwell, W.K., Zhang, R., Whitworth,
L.A., Williams, M.A., Levine, B.D., 2017. Effect of Gravity and Microgravity on Intracranial
Pressure. The Journal of Physiology 595, 2115-2127.
Lawrence, B.J., Luciano, M., Tew, J., Ellenbogen, R.G., Oshinski, J.N., Loth, F., Culley, A.P.,
Martin, B.A., 2018. Cardiac-Related Spinal Cord Tissue Motion at the Foramen Magnum Is
137
Increased in Patients with Type I Chiari Malformation and Decreases Postdecompression
Surgery. World Neurosurgery 116, e298-e307.
Lawrence, J.J., Coenen, W., Sánchez, A.L., Pawlak, G., Martínez-Bazán, C., Haughton, V.,
Lasheras, J.C., 2019. On the Dispersion of a Drug Delivered Intrathecally in the Spinal Canal.
Journal of Fluid Mechanics 861, 679-720.
Lee, R., Van Zundert, A., Breedveld, P., Wondergem, J., Peek, D., Wieringa, P., 2007. The
Anatomy of the Thoracic Spinal Canal Investigated with Magnetic Resonance Imaging (MRI).
Acta Anaesthesiologica Belgica 58 163-167.
Leung, V., Magnussen, J.S., Stoodley, M.A., Bilston, L.E., 2016. Cerebellar and Hindbrain
Motion in Chiari Malformation with and without Syringomyelia. Journal of Neurosurgery:
Spine 24, 546-555.
Lighthill, J., 1975. Mathematical Biofluiddynamics. Society for Industrial and Applied
Mathematics, Philadelphia pp. 199-208.
Linge, S.O., Haughton, V., Lovgren, A.E., Mardal, K.A., Helgeland, A., Langtangen, H.P.,
2011. Effect of Tonsillar Herniation on Cyclic CSF Flow Studied with Computational Flow
Analysis. American Journal of Neuroradiology 32, 1474-1481.
Linge, S.O., Haughton, V., Lovgren, A.E., Mardal, K.A., Langtangen, H.P., 2010. CSF Flow
Dynamics at the Craniovertebral Junction Studied with an Idealized Model of the Subarachnoid
Space and Computational Flow Analysis. American Journal of Neuroradiology 31, 185-192.
Linge, S.O., Mardal, K.A., Haughton, V., Helgeland, A., 2013. Simulating CSF Flow Dynamics
in the Normal and the Chiari I Subarachnoid Space During Rest and Exertion. American Journal
of Neuroradiology 34, 41-45.
Linge, S.O., Mardal, K.A., Helgeland, A., Heiss, J.D., Haughton, V., 2014. Effect of
Craniovertebral Decompression on CSF Dynamics in Chiari Malformation Type I Studied with
Computational Fluid Dynamics. Journal of Neurosurgery: Spine 21, 559-564.
Liu, C., Zhao, L., Liu, C., 2014. Effects of Blood Pressure and Sex on the Change of Wave
Reflection: Evidence from Gaussian Fitting Method for Radial Artery Pressure Waveform.
PLoS One 9, e112895.
Liu, S., Lam, M.A., Sial, A., Hemley, S.J., Bilston, L.E., Stoodley, M.A., 2018. Fluid Outflow
in the Rat Spinal Cord: The Role of Perivascular and Paravascular Pathways. Fluids and
Barriers of the CNS 15, 13.
Lloyd, R.A., Fletcher, D.F., Clarke, E.C., Bilston, L.E., 2017. Chiari Malformation May
Increase Perivascular Cerebrospinal Fluid Flow into the Spinal Cord: A Subject-Specific
Computational Modelling Study. Journal of Biomechanics 65, 185-193.
London, G.M., Pannier, B., 2010. Arterial Functions: How to Interpret the Complex Physiology.
Nephrology, Dialysis, Transplantation 25, 3815-3823.

138
Loth, F., Yardimci, M.A., Alperin, N., 2001. Hydrodynamic Modeling of Cerebrospinal Fluid
Motion within the Spinal Cavity. Journal of Biomechanical Engineering 123, 71-79.
Ma, Q., Ineichen, B.V., Detmar, M., Proulx, S.T., 2017. Outflow of Cerebrospinal Fluid Is
Predominantly through Lymphatic Vessels and Is Reduced in Aged Mice. Nature
Communications 8, 1434.
Ma, Q., Ries, M., Decker, Y., Müller, A., Riner, C., Bücker, A., Fassbender, K., Detmar, M.,
Proulx, S.T., 2019. Rapid Lymphatic Efflux Limits Cerebrospinal Fluid Flow to the Brain. Acta
Neuropathologica 137, 151-165.
Martin, B.A., Kalata, W., Shaffer, N., Fischer, P., Luciano, M., Loth, F., 2013. Hydrodynamic
and Longitudinal Impedance Analysis of Cerebrospinal Fluid Dynamics at the Craniovertebral
Junction in Type I Chiari Malformation. PLoS One 8, e75335.
Martin, B.A., Labuda, R., Royston, T.J., Oshinski, J.N., Iskandar, B., Loth, F., 2010. Spinal
Subarachnoid Space Pressure Measurements in an in Vitro Spinal Stenosis Model: Implications
on Syringomyelia Theories. Journal of Biomechanical Engineering 132, 111007.
Martin, B.A., Loth, F., 2009. The Influence of Coughing on Cerebrospinal Fluid Pressure in an
in Vitro Syringomyelia Model with Spinal Subarachnoid Space Stenosis. Cerebrospinal Fluid
Research 6, 17.
Martin, B.A., Reymond, P., Novy, J., Balédent, O., Stergiopulos, N., 2012. A Coupled
Hydrodynamic Model of the Cardiovascular and Cerebrospinal Fluid System. American Journal
of Physiology-Heart and Circulatory Physiology 302, H1492-H1509.
Martin, B.A., Yiallourou, T.I., Pahlavian, S.H., Thyagaraj, S., Bunck, A.C., Loth, F., Sheffer,
D.B., Kroger, J.R., Stergiopulos, N., 2016. Inter-Operator Reliability of Magnetic Resonance
Image-Based Computational Fluid Dynamics Prediction of Cerebrospinal Fluid Motion in the
Cervical Spine. Annals of Biomedical Engineering 44, 1524-1537.
Martins, A.N., Wiley, J.K., Myers, P.W., 1972. Dynamics of the Cerebrospinal Fluid and the
Spinal Dura Mater. Journal of Neurology, Neurosurgery & Psychiatry 35, 468-473.
Masur, H., Oberwittler, C., Reuther, G., Heyen, P., 1995. Cerebellar Herniation in
Syringomyelia: Relation between Tonsillar Herniation and the Dimensions of the Syrinx and the
Remaining Spinal Cord. A Quantitative MRI Study. European Neurology 35, 162-167.
McDonald, D.A., 1955. The Relation of Pulsatile Pressure to Flow in Arteries. The Journal of
Physiology 127, 533-552.
Meadows, J., Kraut, M., Guarnieri, M., Haroun, R.I., Carson, B.S., 2000. Asymptomatic Chiari
Type I Malformations Identified on Magnetic Resonance Imaging. Journal of Neurosurgery 92,
920-926.
Mestre, H., Tithof, J., Du, T., Song, W., Peng, W., Sweeney, A.M., Olveda, G., Thomas, J.H.,
Nedergaard, M., Kelley, D.H., 2018. Flow of Cerebrospinal Fluid Is Driven by Arterial
Pulsations and Is Reduced in Hypertension. Nature Communications 9, 4878.

139
Milhorat, T.H., 2000. Classification of Syringomyelia. Neurosurgical Focus 8, E1.
Milhorat, T.H., Capocelli, A.L., Jr., Anzil, A.P., Kotzen, R.M., Milhorat, R.H., 1995.
Pathological Basis of Spinal Cord Cavitation in Syringomyelia: Analysis of 105 Autopsy Cases.
Journal of Neurosurgery 82, 802-812.
Milhorat, T.H., Chou, M.W., Trinidad, E.M., Kula, R.W., Mandell, M., Wolpert, C., Speer,
M.C., 1999. Chiari I Malformation Redefined: Clinical and Radiographic Findings for 364
Symptomatic Patients. Neurosurgery 44.
Milhorat, T.H., Kotzen, R.M., Anzil, A.P., 1994. Stenosis of Central Canal of Spinal Cord in
Man: Incidence and Pathological Findings in 232 Autopsy Cases. Journal of Neurosurgery 80,
716-722.
Milhorat, T.H., Nishikawa, M., Kula, R.W., Dlugacz, Y.D., 2010. Mechanisms of Cerebellar
Tonsil Herniation in Patients with Chiari Malformations as Guide to Clinical Management. Acta
Neurochirurgica 152, 1117-1127.
Millasseau, S.C., Kelly, R.P., Ritter, J.M., Chowienczyk, P.J., 2002. Determination of Age-
Related Increases in Large Artery Stiffness by Digital Pulse Contour Analysis. Clinical Science
103, 371-377.
Mokri, B., 2001. The Monro–Kellie Hypothesis: Applications in CSF Volume Depletion.
Neurology 56, 1746-1748.
Montes, A.M., Gouveia, S., Crasto, C., de Melo, C.A., Carvalho, P., Santos, R., Vilas-Boas,
J.P., 2017. Abdominal Muscle Activity During Breathing in Different Postural Sets in Healthy
Subjects. Journal of Bodywork and Movement Therapies 21, 354-361.
Morris, Z., Whiteley, W.N., Longstreth, W.T., Weber, F., Lee, Y.-C., Tsushima, Y., Alphs, H.,
Ladd, S.C., Warlow, C., Wardlaw, J.M., Al-Shahi Salman, R., 2009. Incidental Findings on
Brain Magnetic Resonance Imaging: Systematic Review and Meta-Analysis. BMJ 339, b3016.
Mortazavi, M.M., Quadri, S.A., Khan, M.A., Gustin, A., Suriya, S.S., Hassanzadeh, T.,
Fahimdanesh, K.M., Adl, F.H., Fard, S.A., Taqi, M.A., Armstrong, I., Martin, B.A., Tubbs,
R.S., 2018. Subarachnoid Trabeculae: A Comprehensive Review of Their Embryology,
Histology, Morphology, and Surgical Significance. World Neurosurgery 111, 279-290.
Naftel, R.P., Tubbs, R.S., Menendez, J.Y., Wellons, J.C., 3rd, Pollack, I.F., Oakes, W.J., 2013.
Worsening or Development of Syringomyelia Following Chiari I Decompression: Case Report.
Journal of neurosurgery. Pediatrics 12, 351-356.
Najafi, E., Bilston, L.E., Song, X., Bongers, A., Stoodley, M.A., Cheng, S., Hemley, S.J., 2016.
Longitudinal Measurements of Syrinx Size in a Rat Model of Posttraumatic Syringomyelia.
Journal of Neurosurgery: Spine 24, 941-948.
Nakamura, K., Urayama, K., Hoshino, Y., 1997. Lumbar Cerebrospinal Fluid Pulse Wave
Rising from Pulsations of Both the Spinal Cord and the Brain in Humans. Spinal Cord 35, 735-
739.

140
Nakamura, K., Urayama, K., Hoshino, Y., 1998. Site of Origin of Spinal Cerebrospinal Fluid
Pulse Wave. Journal of Orthopaedic Science 3, 60-66.
Nicholas, D., S. , Weller, R., O., 1988. The Fine Anatomy of the Human Spinal Meninges.
Journal of Neurosurgery 69, 276-282.
Nishikawa, M., Sakamoto, H., Hakuba, A., Nakanishi, N., Inoue, Y., 1997. Pathogenesis of
Chiari Malformation: A Morphometric Study of the Posterior Cranial Fossa. Journal of
Neurosurgery 86.
Oldfield, E.H., Muraszko, K., Shawker, T.H., Patronas, N.J., 1994. Pathophysiology of
Syringomyelia Associated with Chiari I Malformation of the Cerebellar Tonsils: Implications
for Diagnosis and Treatment. Journal of Neurosurgery 80, 3-15.
Pahlavian, S.H., Bunck, A.C., Thyagaraj, S., Giese, D., Loth, F., Hedderich, D.M., Kröger, J.R.,
Martin, B.A., 2016. Accuracy of 4D Flow Measurement of Cerebrospinal Fluid Dynamics in the
Cervical Spine: An in Vitro Verification against Numerical Simulation. Annals of Biomedical
Engineering 44, 3202-3214.
Pahlavian, S.H., Loth, F., Luciano, M., Oshinski, J., Martin, B.A., 2015. Neural Tissue Motion
Impacts Cerebrospinal Fluid Dynamics at the Cervical Medullary Junction: A Patient-Specific
Moving-Boundary Computational Model. Annals of Biomedical Engineering 43, 2911-2923.
Pahlavian, S.H., Yiallourou, T., Tubbs, R.S., Bunck, A.C., Loth, F., Goodin, M., Raisee, M.,
Martin, B.A., 2014. The Impact of Spinal Cord Nerve Roots and Denticulate Ligaments on
Cerebrospinal Fluid Dynamics in the Cervical Spine. PLoS One 9, e91888.
Paniagua, B., Lyall, A., Berger, J.B., Vachet, C., Hamer, R.M., Woolson, S., Lin, W., Gilmore,
J., Styner, M., 2013. Lateral Ventricle Morphology Analysis Via Mean Latitude Axis.
Proceedings of SPIE - the International Society for Optical Engineering 8672.
Parker, S.L., Godil, S.S., Zuckerman, S.L., Mendenhall, S.K., Wells, J.A., Shau, D.N., McGirt,
M.J., 2013. Comprehensive Assessment of 1-Year Outcomes and Determination of Minimum
Clinically Important Difference in Pain, Disability, and Quality of Life after Suboccipital
Decompression for Chiari Malformation I in Adults. Neurosurgery 73, 569-581.
Pinna, G., Alessandrini, F., Alfieri, A., Rossi, M., Bricolo, A., 2000. Cerebrospinal Fluid Flow
Dynamics Study in Chiari I Malformation: Implications for Syrinx Formation. Neurosurgical
Focus 8, 1-8.
Quigley, M.F., Iskandar, B., Quigley, M.A., Nicosia, M., Haughton, V., 2004. Cerebrospinal
Fluid Flow in Foramen Magnum: Temporal and Spatial Patterns at MR Imaging in Volunteers
and in Patients with Chiari I Malformation. Radiology 232, 229-236.
Qvarlander, S., Sundström, N., Malm, J., Eklund, A., 2013. Postural Effects on Intracranial
Pressure: Modeling and Clinical Evaluation. Journal of Applied Physiology 115, 1474-1480.
Reitan, H., 1941. On Movements of Fluid inside the Cerebro-Spinal Space. Acta Radiologica
22, 762-779.

141
Rennels, M.L., Gregory, T.F., Blaumanis, O.R., Fujimoto, K., Grady, P.A., 1985. Evidence for a
'Paravascular' Fluid Circulation in the Mammalian Central Nervous System, Provided by the
Rapid Distribution of Tracer Protein Throughout the Brain from the Subarachnoid Space. Brain
Research 326, 47-63.
Reymond, P., Merenda, F., Perren, F., Rüfenacht, D., Stergiopulos, N., 2009. Validation of a
One-Dimensional Model of the Systemic Arterial Tree. American Journal of Physiology - Heart
and Circulatory Physiology 297, H208-H222.
Ringstad, G., Eide, P.K., Vatnehol, S.A.S., 2017. Glymphatic MRI in Idiopathic Normal
Pressure Hydrocephalus. Brain 140, 2691-2705.
Rogers, J.M., Savage, G., Stoodley, M.A., 2018. A Systematic Review of Cognition in Chiari I
Malformation. Neuropsychology Review 28, 176-187.
Roldan, A., Wieben, O., Haughton, V., Osswald, T., Chesler, N., 2009. Characterization of CSF
Hydrodynamics in the Presence and Absence of Tonsillar Ectopia by Means of Computational
Flow Analysis. American Journal of Neuroradiology 30, 941-946.
Roller, L.A., Bruce, B.B., Saindane, A.M., 2015. Demographic Confounders in Volumetric
MRI Analysis: Is the Posterior Fossa Really Small in the Adult Chiari 1 Malformation?
American Journal of Roentgenology 204, 835-841.
Rusbridge, C., Stringer, F., Knowler, S.P., 2018. Clinical Application of Diagnostic Imaging of
Chiari-Like Malformation and Syringomyelia. Frontiers in Veterinary Science 5.
Rutkowska, G., Haughton, V., Linge, S., Mardal, K.A., 2012. Patient-Specific 3D Simulation of
Cyclic CSF Flow at the Craniocervical Region. American Journal of Neuroradiology 33, 1756.
Sakushima, K., Tsuboi, S., Yabe, I., Hida, K., Terae, S., Uehara, R., Nakano, I., Sasaki, H.,
2012. Nationwide Survey on the Epidemiology of Syringomyelia in Japan. Journal of the
Neurological Sciences 313, 147-152.
Sánchez, A.L., Martínez-Bazán, C., Gutiérrez-Montes, C., Criado-Hidalgo, E., Pawlak, G.,
Bradley, W., Haughton, V., Lasheras, J.C., 2018. On the Bulk Motion of the Cerebrospinal
Fluid in the Spinal Canal. Journal of Fluid Mechanics 841, 203-227.
Sansur, C.A., Heiss, J.D., DeVroom, H.L., Eskioglu, E., Ennis, R., Oldfield, E.H., 2003.
Pathophysiology of Headache Associated with Cough in Patients with Chiari I Malformation.
Journal of Neurosurgery 98, 453-458.
Sass, L.R., Khani, M., Natividad, G.C., Tubbs, R.S., Baledent, O., Martin, B.A., 2017. A 3D
Subject-Specific Model of the Spinal Subarachnoid Space with Anatomically Realistic Ventral
and Dorsal Spinal Cord Nerve Rootlets. Fluids and Barriers of the CNS 14, 36.
Schady, W., Metcalfe, R.A., Butler, P., 1987. The Incidence of Craniocervical Bony Anomalies
in the Adult Chiari Malformation. Journal of the Neurological Sciences 82, 1-3.

142
Schnell, S., Ansari, S.A., Wu, C., Garcia, J., Murphy, I.G., Rahman, O.A., Rahsepar, A.A.,
Aristova, M., Collins, J.D., Carr, J.C., Markl, M., 2017. Accelerated Dual-Venc 4D Flow MRI
for Neurovascular Applications. Journal of Magnetic Resonance Imaging 46, 102-114.
Sekula, R.F., Jannetta, P.J., Casey, K.F., Marchan, E.M., Sekula, L.K., McCrady, C.S., 2005.
Dimensions of the Posterior Fossa in Patients Symptomatic for Chiari I Malformation but
without Cerebellar Tonsillar Descent. Cerebrospinal Fluid Research 2, 11.
Shafer, S.L., Eisenach, J.C., Hood, D.D., Tong, C., 1998. Cerebrospinal Fluid Pharmacokinetics
and Pharmacodynamics of Intrathecal Neostigmine Methylsulfate in Humans Anesthesiology:
The Journal of the American Society of Anesthesiologists 89, 1074-1088.
Shaffer, N., Martin, B., Loth, F., 2011. Cerebrospinal Fluid Hydrodynamics in Type I Chiari
Malformation. Neurological Research 33, 247-260.
Shaffer, N., Martin, B.A., Rocque, B., Madura, C., Wieben, O., Iskandar, B.J., Dombrowski, S.,
Luciano, M., Oshinski, J.N., Loth, F., 2014. Cerebrospinal Fluid Flow Impedance Is Elevated in
Type I Chiari Malformation. Journal of Biomechanical Engineering 136, 0210121-0210128.
Shah, J.L., 1994. Positive Lumbar Extradural Space Pressure. British Journal of Anaesthesia 73,
309-314.
Smith, B.W., Strahle, J., Bapuraj, J.R., Muraszko, K.M., Garton, H.J., Maher, C.O.J.J.o.n.,
2013. Distribution of Cerebellar Tonsil Position: Implications for Understanding Chiari
Malformation. Journal of Neurosurgery 119, 812-819.
Speer, M.C., Enterline, D.S., Mehltretter, L., Hammock, P., Joseph, J., Dickerson, M.,
Ellenbogen, R.G., Milhorat, T.H., Hauser, M.A., George, T.M., 2003. Review Article: Chiari
Type I Malformation with or without Syringomyelia: Prevalence and Genetics. Journal of
Genetic Counseling 12, 297-311.
Standring, S., 2015. Gray's Anatomy : The Anatomical Basis of Clinical Practice. Elsevier,
London, UK.
Stockman, H.W., 2005. Effect of Anatomical Fine Structure on the Flow of Cerebrospinal Fluid
in the Spinal Subarachnoid Space. Journal of Biomechanical Engineering 128, 106-114.
Stockman, H.W., 2007. Effect of Anatomical Fine Structure on the Dispersion of Solutes in the
Spinal Subarachnoid Space. Journal of Biomechanical Engineering 129, 666-675.
Stoodley, M.A., Brown, S.A., Brown, C.J., Jones, N.R., 1997. Arterial Pulsation-Dependent
Perivascular Cerebrospinal Fluid Flow into the Central Canal in the Sheep Spinal Cord. Journal
of Neurosurgery 86, 686-693.
Stoodley, M.A., Gutschmidt, B., Jones, N.R., 1999. Cerebrospinal Fluid Flow in an Animal
Model of Noncommunicating Syringomyelia. Neurosurgery 44, 1065-1075; discussion 1075-
1066.

143
Stoodley, M.A., Jones, N.R., Yang, L., Brown, C.J., 2000. Mechanisms Underlying the
Formation and Enlargement of Noncommunicating Syringomyelia: Experimental Studies.
Neurosurgical Focus 8, E2.
Støverud, K.H., Alnæs, M., Langtangen, H.P., Haughton, V., Mardal, K.-A., 2016. Poro-Elastic
Modeling of Syringomyelia – a Systematic Study of the Effects of Pia Mater, Central Canal,
Median Fissure, White and Gray Matter on Pressure Wave Propagation and Fluid Movement
within the Cervical Spinal Cord. Computer Methods in Biomechanics and Biomedical
Engineering 19, 686-698.
Stoverud, K.H., Langtangen, H.P., Haughton, V., Mardal, K.A., 2013. CSF Pressure and
Velocity in Obstructions of the Subarachnoid Spaces. The Neuroradiology Journal 26, 218-226.
Stoverud, K.H., Langtangen, H.P., Ringstad, G.A., Eide, P.K., Mardal, K.A., 2016.
Computational Investigation of Cerebrospinal Fluid Dynamics in the Posterior Cranial Fossa
and Cervical Subarachnoid Space in Patients with Chiari I Malformation. PLoS One 11,
e0162938.
Stovner, L.J., Bergan, U., Nilsen, G., Sjaastad, O., 1993. Posterior Cranial Fossa Dimensions in
the Chiari I Malformation: Relation to Pathogenesis and Clinical Presentation. Neuroradiology
35.
Stovner, L.J., Rinck, P., 1992. Syringomyelia in Chiari Malformation: Relation to Extent of
Cerebellar Tissue Herniation. Neurosurgery 31, 913-917; discussion 917.
Strahle, J., Muraszko, K.M., Kapurch, J., Bapuraj, J.R., Garton, H.J.L., Maher, C.O., 2011.
Chiari Malformation Type I and Syrinx in Children Undergoing Magnetic Resonance Imaging.
Journal of Neurosurgery: Pediatrics 8, 205-213.
Struck, A.F., Carr, C.M., Shah, V., Hesselink, J.R., Haughton, V.M., 2016. Cervical Spinal
Canal Narrowing in Idiopathic Syringomyelia. Neuroradiology 58, 771-775.
Styner, M., Oguz, I., Xu, S., Brechbuhler, C., Pantazis, D., Levitt, J.J., Shenton, M.E., Gerig, G.,
2006. Framework for the Statistical Shape Analysis of Brain Structures Using SPHARM-PDM.
The Insight Journal, 242-250.
Sweetman, B., Linninger, A.A., 2011. Cerebrospinal Fluid Flow Dynamics in the Central
Nervous System. Annals of Biomedical Engineering 39, 484-496.
Tachibana, S., Iida, H., Yada, K., 1992. Significance of Positive Queckenstedt Test in Patients
with Syringomyelia Associated with Arnold-Chiari Malformations. Journal of Neurosurgery 76,
67-71.
Takizawa, K., Matsumae, M., Sunohara, S., Yatsushiro, S., Kuroda, K., 2017. Characterization
of Cardiac- and Respiratory-Driven Cerebrospinal Fluid Motion Based on Asynchronous Phase-
Contrast Magnetic Resonance Imaging in Volunteers. Fluids and Barriers of the CNS 14, 25.
Tanaka, H., Sakurai, K., Kashiwagi, N., Fujita, N., Hirabuki, N., Inaba, F., Harada, K.,
Nakamura, H., 1998. Transition of the Craniocaudal Velocity of the Spinal Cord: From Cervical
Segment to Lumbar Enlargement. Investigative Radiology 33, 141-145.

144
Tangen, K.M., Hsu, Y., Zhu, D.C., Linninger, A.A., 2015. Cns Wide Simulation of Flow
Resistance and Drug Transport Due to Spinal Microanatomy. Journal of Biomechanics 48,
2144-2154.
Tao, L., Nicholson, C., 1996. Diffusion of Albumins in Rat Cortical Slices and Relevance to
Volume Transmission. Neuroscience 75, 839-847.
Taştemur, Y., Sabanciogullari, V., Salk, I., Sönmez, M., Cimen, M., 2017. The Relationship of
the Posterior Cranial Fossa, the Cerebrum, and Cerebellum Morphometry with Tonsiller
Herniation. Iranian Journal of Radiology 14.
Thompson, A., Madan, N., Hesselink, J.R., Weinstein, G., Munoz del Rio, A., Haughton, V.,
2016. The Cervical Spinal Canal Tapers Differently in Patients with Chiari I with and without
Syringomyelia. American Journal of Neuroradiology 37, 755-758.
Toro, E.F., Thornber, B., Zhang, Q., Scoz, A., Contarino, C., 2018. A Computational Model for
the Dynamics of Cerebrospinal Fluid in the Spinal Subarachnoid Space. Journal of
Biomechanical Engineering 141, 011004-011004-011016.
Tubbs, R.S., Webb, D.B., Oakes, W.J., 2004. Persistent Syringomyelia Following Pediatric
Chiari I Decompression: Radiological and Surgical Findings. 100, 460.
Urbizu, A., Poca, M.-A., Vidal, X., Rovira, A., Sahuquillo, J., Macaya, A., 2014. MRI-Based
Morphometric Analysis of Posterior Cranial Fossa in the Diagnosis of Chiari Malformation
Type I. Journal of Neuroimaging 24, 250-256.
Usubiaga, J.E., Moya, F., Usubiaga, L.E., 1967. Effect of Thoracic and Abdominal Pressure
Changes on the Epidural Space Pressure. British Journal of Anaesthesia 39, 612-618.
Vega, A., Quintana, F., Berciano, J., 1990. Basichondrocranium Anomalies in Adult Chiari
Type I Malformation: A Morphometric Study. Journal of the Neurological Sciences 99.
Vernooij, M.W., Ikram, M.A., Tanghe, H.L., Vincent, A.J.P.E., Hofman, A., Krestin, G.P.,
Niessen, W.J., Breteler, M.M.B., van der Lugt, A., 2007. Incidental Findings on Brain MRI in
the General Population. New England Journal of Medicine 357, 1821-1828.
Villa, A., Imperato, A., Maugeri, R., Visocchi, M., Iacopino, D.G., Francaviglia, N., 2019.
Surgical Treatment in Symptomatic Chiari Malformation Type I: A Series of 25 Adult Patients
Treated with Cerebellar Tonsil Shrinkage, in: Visocchi, M. (Ed.), New Trends in
Craniovertebral Junction Surgery: Experimental and Clinical Updates for a New State of Art.
Springer International Publishing, Cham, pp. 125-131.
Wang, J.J., Parker, K.H., 2004. Wave Propagation in a Model of the Arterial Circulation.
Journal of Biomechanics 37, 457-470.
Wang, P., Olbricht, W.L., 2011. Fluid Mechanics in the Perivascular Space. Journal of
Theoretical Biology 274, 52-57.

145
Weller, R.O., 2005. Microscopic Morphology and Histology of the Human Meninges.
Morphologie 89, 22-34.
West, R., Williams, B., 1980. Radiographic Studies of the Ventricles in Syringomyelia.
Neuroradiology 20, 5-16.
Wilkinson, I.B., MacCallum, H., Flint, L., Cockcroft, J.R., Newby, D.E., Webb, D.J., 2000. The
Influence of Heart Rate on Augmentation Index and Central Arterial Pressure in Humans. The
Journal of Physiology 525 Pt 1, 263-270.
Williams, B., 1969. The Distending Force in the Production of "Communicating
Syringomyelia". The Lancet 294, 189-193.
Williams, B., 1976. Cerebrospinal Fluid Pressure Changes in Response to Coughing. Brain: A
Journal of Neurology 99, 331-346.
Williams, B., 1980. On the Pathogenesis of Syringomyelia: A Review. Journal of the Royal
Society of Medicine 73, 798.
Williams, B., 1981a. Simultaneous Cerebral and Spinal Fluid Pressure Recordings. I.
Technique, Physiology, and Normal Results. Acta Neurochirurgica 58, 167-185.
Williams, B., 1981b. Simultaneous Cerebral and Spinal Fluid Pressure Recordings. II.
Cerebrospinal Dissociation with Lesions at the Foramen Magnum. Acta Neurochirurgica 59,
123-142.
Wong, J., Hemley, S., Jones, N., Cheng, S., Bilston, L., Stoodley, M., 2012. Fluid Outflow in a
Large-Animal Model of Posttraumatic Syringomyelia. Neurosurgery 71, 474-480.
Wong, J.H., Song, X., Hemley, S.J., Bilston, L.E., Cheng, S., Stoodley, M.A., 2016. Direct-
Trauma Model of Posttraumatic Syringomyelia with a Computer-Controlled Motorized Spinal
Cord Impactor. Journal of Neurosurgery: Spine 24, 797-805.
Yamada, S., Miyazaki, M., Yamashita, Y., Ouyang, C., Yui, M., Nakahashi, M., Shimizu, S.,
Aoki, I., Morohoshi, Y., McComb, J.G., 2013. Influence of Respiration on Cerebrospinal Fluid
Movement Using Magnetic Resonance Spin Labeling. Fluids and Barriers of the CNS 10, 36.
Yan, H., Han, X., Jin, M., Liu, Z., Xie, D., Sha, S., Qiu, Y., Zhu, Z., 2016. Morphometric
Features of Posterior Cranial Fossa Are Different between Chiari I Malformation with and
without Syringomyelia. European Spine Journal 25, 2202-2209.
Yeo, J., Cheng, S., Hemley, S., Lee, B.B., Stoodley, M., Bilston, L., 2017. Characteristics of
CSF Velocity-Time Profile in Posttraumatic Syringomyelia. American Journal of
Neuroradiology 38, 1839.
Yiallourou, T.I., Kröger, J.R., Stergiopulos, N., Maintz, D., Martin, B.A., Bunck, A.C., 2012.
Comparison of 4D Phase-Contrast MRI Flow Measurements to Computational Fluid Dynamics
Simulations of Cerebrospinal Fluid Motion in the Cervical Spine. PLoS One 7, e52284.

146
Yildiz, S., Thyagaraj, S., Jin, N., Zhong, X., Heidari Pahlavian, S., Martin, B.A., Loth, F.,
Oshinski, J., Sabra, K.G., 2017. Quantifying the Influence of Respiration and Cardiac Pulsations
on Cerebrospinal Fluid Dynamics Using Real-Time Phase-Contrast MRI. Journal of Magnetic
Resonance Imaging 46, 431-439.
Zhang, E.T., Inman, C.B., Weller, R.O., 1990. Interrelationships of the Pia Mater and the
Perivascular (Virchow-Robin) Spaces in the Human Cerebrum. Journal of Anatomy 170, 111-
123.
Zhao, J.L., Li, M.H., Wang, C.L., Meng, W., 2016. A Systematic Review of Chiari I
Malformation: Techniques and Outcomes. World Neurosurgery 88, 7-14.
Zhu, Z., Sha, S., Sun, X., Liu, Z., Yan, H., Zhu, W., Wang, Z., Qiu, Y., 2014. Tapering of the
Cervical Spinal Canal in Patients with Distended or Nondistended Syringes Secondary to Chiari
Type I Malformation. American Journal of Neuroradiology 35, 2021.