Chiari Malformation Type I: A Case-Control Association Study of 58 Developmental Genes
10
Chiari Malformation Type I: A Case-Control Association Study of 58 Developmental Genes Aintzane Urbizu 1 , Claudio Toma 4,5 , Maria A. Poca 2,3 , Juan Sahuquillo 2,3 , Ester Cuenca-Leo ´n 1 , Bru Cormand 4,5,6 , Alfons Macaya 1 * 1 Pediatric Neurology Research Group, Vall d’Hebron Research Institute, Universitat Auto ` noma de Barcelona, Barcelona, Spain, 2 Department of Neurosurgery, Research Unit Vall d’Hebron University Hospital, Universitat Auto ` noma de Barcelona, Barcelona, Spain, 3 Neurosurgery and Neurotraumatology, Research Unit Vall d’Hebron University Hospital, Universitat Auto ` noma de Barcelona, Barcelona, Spain, 4 Departament de Gene ` tica, Facultat de Biologia, Universitat de Barcelona, Barcelona, Spain, 5 Biomedical Network Research Centre on Rare Diseases, Barcelona, Spain, 6 Institut de Biomedicina de la Universitat de Barcelona, Barcelona, Spain Abstract Chiari malformation type I (CMI) is a disorder characterized by hindbrain overcrowding into an underdeveloped posterior cranial fossa (PCF), often causing progressive neurological symptoms. The etiology of CMI remains unclear and is most likely multifactorial. A putative genetic contribution to CMI is suggested by familial aggregation and twin studies. Experimental models and human morphometric studies have suggested an underlying paraxial mesoderm insufficiency. We performed a case-control association study of 303 tag single nucleotide polymorphisms (SNP) across 58 candidate genes involved in early paraxial mesoderm development in a sample of 415 CMI patients and 524 sex-matched controls. A subgroup of patients diagnosed with classical, small-PCF CMI by means of MRI-based PCF morphometry (n = 186), underwent additional analysis. The genes selected are involved in signalling gradients occurring during segmental patterning of the occipital somites (FGF8, Wnt, and retinoic acid pathways and from bone morphogenetic proteins or BMP, Notch, Cdx and Hox pathways) or in placental angiogenesis, sclerotome development or CMI-associated syndromes. Single-marker analysis identified nominal associations with 18 SNPs in 14 genes (CDX1, FLT1, RARG, NKD2, MSGN1, RBPJ1, FGFR1, RDH10, NOG, RARA, LFNG, KDR, ALDH1A2, BMPR1A) considering the whole CMI sample. None of these overcame corrections for multiple comparisons, in contrast with four SNPs in CDX1, FLT1 and ALDH1A2 in the classical CMI group. Multiple marker analysis identified a risk haplotype for classical CMI in ALDH1A2 and CDX1. Furthermore, we analyzed the possible contributions of the most significantly associated SNPs to different PCF morphometric traits. These findings suggest that common variants in genes involved in somitogenesis and fetal vascular development may confer susceptibility to CMI. Citation: Urbizu A, Toma C, Poca MA, Sahuquillo J, Cuenca-Leo ´ n E, et al. (2013) Chiari Malformation Type I: A Case-Control Association Study of 58 Developmental Genes. PLoS ONE 8(2): e57241. doi:10.1371/journal.pone.0057241 Editor: Joerg-Christian Tonn, Universita ¨t Mu ¨ nchen, Germany Received October 29, 2012; Accepted January 18, 2013; Published February 21, 2013 Copyright: ß 2013 Urbizu et al. This is an open-access article distributed under the terms of the Creative Commons Attribution License, which permits unrestricted use, distribution, and reproduction in any medium, provided the original author and source are credited. Funding: Work supported by Instituto de Salud Carlos III, Spain,grant PI061606; Fundacio ´ La Marato ´ TV3, Spain, grant 062710; and Age `ncia de Gestio ´ d’Ajuts Universitaris i de Recerca (AGAUR), Spain, grant 2009SGR -0078. A.U. is the recipient of a scholarship from AGAUR (Spain). C.T. was supported by the European Union (Marie Curie, PIEF-GA-2009-254930). Funders had no role in study design, data collection and analysis, decision to publish, or preparation of the manuscript. Competing Interests: The authors have read the journal’s policy and have the following conflicts: A.M received honoraria from Novartis Europe as a member of the TOSCA (tuberous sclerosis) Scientific Advisory Board. This does not alter the authors’ adherence to all the PLOS ONE policies on sharing data and materials. * E-mail: [email protected] Introduction The Chiari malformations, first described in 1895 [1], are a group of disorders sharing the common feature of ectopia of the cerebellar tonsils, which are downwardly displaced through the foramen magnum. Chiari malformation type I (CMI) is currently defined by the observation, on cranial midsagittal magnetic resonance imaging (MRI), of a descent of the cerebellar tonsils across the foramen magnum of at least 3 mm [2]. In contrast with Chiari II and III malformations, in CMI the rest of hindbrain structures remain within the posterior fossa. CMI causes neurological dysfunction by direct compression of the neural tissue at the craniovertebral junction or cerebrospinal fluid disturbances that give rise to syringomyelia or hydrocephalus. The most frequent symptoms are headache, ocular disturbances, vertigo, sleep apnea and lower cranial nerve signs, including tongue fasciculation, dysphagia or dysarthria. Motor and sensory symptoms derived from spinal cord disturbances associated with syringomyelia or scoliosis, [3,4] as well as signs and symptoms mimicking pseudotumor cerebri are also often encountered. Although presentation typically occurs in middle age, it may start in childhood or infancy, where it is a cause of sudden infantile death syndrome [5,6]. Conversely, cases of CMI can often be asymptomatic and tonsillar descent is often regarded as an incidental neuroradiological finding [7,8]. The prevalence of CMI is estimated to be in the 1/1,000 to 1/5,000 range [9]. A retrospective analysis of 22,591 serial cranial MRI studies, using a conservative definition of cerebellar tonsillar herniation of $5 mm, showed the presence of CMI in 0.77% of the subjects and asymptomatic CMI in 0.11%, with an estimated prevalence of 1/1,280 [10]. Regarding pathogenesis, different mechanisms are to be distinguished. In the classical form, a shallow posterior cranial fossa (PCF) is unable to house a normal hindbrain and hence the tonsillar herniation occurs (Figure 1A). Seminal experimental work by Marin-Padilla and Marin-Padilla [11] demonstrated that underdevelopment of the occipital bone and overcrowding of the cerebellum in a small posterior fossa are the fundamental defects PLOS ONE | www.plosone.org 1 February 2013 | Volume 8 | Issue 2 | e57241
-
Upload
independent -
Category
Documents
-
view
0 -
download
0
Transcript of Chiari Malformation Type I: A Case-Control Association Study of 58 Developmental Genes

Chiari Malformation Type I: A Case-Control AssociationStudy of 58 Developmental GenesAintzane Urbizu1, Claudio Toma4,5, Maria A. Poca2,3, Juan Sahuquillo2,3, Ester Cuenca-Leon1,
Bru Cormand4,5,6, Alfons Macaya1*
1 Pediatric Neurology Research Group, Vall d’Hebron Research Institute, Universitat Autonoma de Barcelona, Barcelona, Spain, 2Department of Neurosurgery, Research
Unit Vall d’Hebron University Hospital, Universitat Autonoma de Barcelona, Barcelona, Spain, 3Neurosurgery and Neurotraumatology, Research Unit Vall d’Hebron
University Hospital, Universitat Autonoma de Barcelona, Barcelona, Spain, 4Departament de Genetica, Facultat de Biologia, Universitat de Barcelona, Barcelona, Spain,
5 Biomedical Network Research Centre on Rare Diseases, Barcelona, Spain, 6 Institut de Biomedicina de la Universitat de Barcelona, Barcelona, Spain
Abstract
Chiari malformation type I (CMI) is a disorder characterized by hindbrain overcrowding into an underdeveloped posteriorcranial fossa (PCF), often causing progressive neurological symptoms. The etiology of CMI remains unclear and is most likelymultifactorial. A putative genetic contribution to CMI is suggested by familial aggregation and twin studies. Experimentalmodels and human morphometric studies have suggested an underlying paraxial mesoderm insufficiency. We performed acase-control association study of 303 tag single nucleotide polymorphisms (SNP) across 58 candidate genes involved inearly paraxial mesoderm development in a sample of 415 CMI patients and 524 sex-matched controls. A subgroup ofpatients diagnosed with classical, small-PCF CMI by means of MRI-based PCF morphometry (n = 186), underwent additionalanalysis. The genes selected are involved in signalling gradients occurring during segmental patterning of the occipitalsomites (FGF8, Wnt, and retinoic acid pathways and from bone morphogenetic proteins or BMP, Notch, Cdx and Hoxpathways) or in placental angiogenesis, sclerotome development or CMI-associated syndromes. Single-marker analysisidentified nominal associations with 18 SNPs in 14 genes (CDX1, FLT1, RARG, NKD2, MSGN1, RBPJ1, FGFR1, RDH10, NOG, RARA,LFNG, KDR, ALDH1A2, BMPR1A) considering the whole CMI sample. None of these overcame corrections for multiplecomparisons, in contrast with four SNPs in CDX1, FLT1 and ALDH1A2 in the classical CMI group. Multiple marker analysisidentified a risk haplotype for classical CMI in ALDH1A2 and CDX1. Furthermore, we analyzed the possible contributions ofthe most significantly associated SNPs to different PCF morphometric traits. These findings suggest that common variants ingenes involved in somitogenesis and fetal vascular development may confer susceptibility to CMI.
Citation: Urbizu A, Toma C, Poca MA, Sahuquillo J, Cuenca-Leon E, et al. (2013) Chiari Malformation Type I: A Case-Control Association Study of 58Developmental Genes. PLoS ONE 8(2): e57241. doi:10.1371/journal.pone.0057241
Editor: Joerg-Christian Tonn, Universitat Munchen, Germany
Received October 29, 2012; Accepted January 18, 2013; Published February 21, 2013
Copyright: ! 2013 Urbizu et al. This is an open-access article distributed under the terms of the Creative Commons Attribution License, which permitsunrestricted use, distribution, and reproduction in any medium, provided the original author and source are credited.
Funding: Work supported by Instituto de Salud Carlos III, Spain,grant PI061606; Fundacio La Marato TV3, Spain, grant 062710; and Agencia de Gestio d’AjutsUniversitaris i de Recerca (AGAUR), Spain, grant 2009SGR -0078. A.U. is the recipient of a scholarship from AGAUR (Spain). C.T. was supported by the EuropeanUnion (Marie Curie, PIEF-GA-2009-254930). Funders had no role in study design, data collection and analysis, decision to publish, or preparation of the manuscript.
Competing Interests: The authors have read the journal’s policy and have the following conflicts: A.M received honoraria from Novartis Europe as a member ofthe TOSCA (tuberous sclerosis) Scientific Advisory Board. This does not alter the authors’ adherence to all the PLOS ONE policies on sharing data and materials.
* E-mail: [email protected]
Introduction
The Chiari malformations, first described in 1895 [1], are agroup of disorders sharing the common feature of ectopia of thecerebellar tonsils, which are downwardly displaced through theforamen magnum. Chiari malformation type I (CMI) is currentlydefined by the observation, on cranial midsagittal magneticresonance imaging (MRI), of a descent of the cerebellar tonsilsacross the foramen magnum of at least 3 mm [2]. In contrast withChiari II and III malformations, in CMI the rest of hindbrainstructures remain within the posterior fossa.CMI causes neurological dysfunction by direct compression of
the neural tissue at the craniovertebral junction or cerebrospinalfluid disturbances that give rise to syringomyelia or hydrocephalus.The most frequent symptoms are headache, ocular disturbances,vertigo, sleep apnea and lower cranial nerve signs, includingtongue fasciculation, dysphagia or dysarthria. Motor and sensorysymptoms derived from spinal cord disturbances associated withsyringomyelia or scoliosis, [3,4] as well as signs and symptoms
mimicking pseudotumor cerebri are also often encountered.Although presentation typically occurs in middle age, it may startin childhood or infancy, where it is a cause of sudden infantiledeath syndrome [5,6]. Conversely, cases of CMI can often beasymptomatic and tonsillar descent is often regarded as anincidental neuroradiological finding [7,8]. The prevalence ofCMI is estimated to be in the 1/1,000 to 1/5,000 range [9]. Aretrospective analysis of 22,591 serial cranial MRI studies, using aconservative definition of cerebellar tonsillar herniation of$5 mm, showed the presence of CMI in 0.77% of the subjectsand asymptomatic CMI in 0.11%, with an estimated prevalence of1/1,280 [10].Regarding pathogenesis, different mechanisms are to be
distinguished. In the classical form, a shallow posterior cranialfossa (PCF) is unable to house a normal hindbrain and hence thetonsillar herniation occurs (Figure 1A). Seminal experimental workby Marin-Padilla and Marin-Padilla [11] demonstrated thatunderdevelopment of the occipital bone and overcrowding of thecerebellum in a small posterior fossa are the fundamental defects
PLOS ONE | www.plosone.org 1 February 2013 | Volume 8 | Issue 2 | e57241

in CMI [12,13,14]. This has been underscored by severalradiological morphometric studies [3,15,16,17,18,19]. However,cerebellar herniation may also occur in conditions such as cranialsettling associated with connective tissue disorders, intraspinalhypotension following CSF leaks or lumboperitonial shunting,cord traction in tethered cord syndrome and intracranialhypertension caused by space-occupying lesions or hydrocephalus[20], where the PCF has a normal size and the term ‘‘secondary’’CMI is preferred. In the classical form of CMI there is shortness ofthe basichondrocranium [3,15,16,17,19,20,21,22], suggesting un-derdevelopment of occipital somites and pointing at insufficiencyof the paraxial mesoderm as the central event in CMIpathogenesis [23].Whether CMI mesodermal insufficiency is a primary (genetic)
condition or occurs as the result of early gestational injuries, oreven post-natal osseous growth disturbances [16] is unknown.However, a number of evidences suggest that, at least in a subset ofCMI cases, genetic factors may play an important role, includingCMI familial aggregation [9,24], higher degree of concordance inmonozygotic twins and CMI occurrence as part of Mendeliansyndromes [25,26,27]. In the instance of Crouzon syndrome, aspecific FGFR2 mutation has been associated with CMI andsyringomyelia in a small series of cases [28] and a PAX2 mutationwas found in two siblings with CMI and coloboma [29]. The onlyreported genome-wide linkage screen, performed in 23 CMImultiplex families, uncovered two loci on chromosomes 9 and 15,with maximal two-point LOD (logarithm of the odds) score of 3.3on 15q [30]. To date, no single gene has been identified as causingCMI.If heredity does indeed play a role in CMI, it is also possible that
this may occur via a polygenic mechanism. Common geneticvariants in genes involved in growth and shaping of the PCFshould be among the first to be explored. A similar approach hasbeen used in association studies performed in patients with Chiarimalformation type II, where screening of genes critical forneurulation and neural tube closure disclosed some risk factorsbut no major causative gene (reviewed in [31]). In contrast, noprevious association study has been carried out in CMI. We heresought to identify common variants associated with developmentof CMI among critical genes expressed during occipital somite,sclerotome and placental development.
Subjects and Methods
Ethics StatementThe present investigation was conducted according to the
principles expressed in the Declaration of Helsinki and wasapproved by the Ethics Committee of the Vall d’HebronUniversity Hospital. All participants signed an informed consentprior to their participation in the study.
SubjectsA total of 415 patients (42.265.9 years) with symptomatic CMI
were recruited between 2004 and 2010. Three hundred and thirtyseven patients were diagnosed and treated at the Division ofNeurosurgery and the Pediatric Neurology Service of the Valld’Hebron University Hospital in Barcelona. In all of themevaluation included direct anamnesis, physical exam, neurophys-iological studies (somatosensory evoked potentials, brain auditoryevoked potentials and polysomnography) and a cranial and spinalMRI study. For an additional 78 cases that were referred from twoSpanish CMI patient associations, review of clinical summaries,radiological reports and telephone interviews were used to confirmthe diagnosis, but direct review of the MRI studies was not alwayspossible. Diagnosis of CMI was based on MRI demonstration ofdownward herniation $3 mm of the cerebellar tonsils on amidsagittal T1-weighted image in the presence of signs orsymptoms indicating neural compression at the craniovertebraljunction, syringohydromyelia, cerebellar dysfunction or intracra-nial hypertensionSince recent studies have clearly demonstrated that various
mechanisms may lead to tonsillar herniation, we tried to identifythe subset of patients with small PCF in an attempt to increasesample homogeneity. To this end we performed a morphometricPCF analysis in 211 cases with available digital MRI studies(Figure 1B). After applying a previously described logisticregression model based on several PCF measurements performedin CMI cases and a control population [32] we identified asubgroup of 186 patients representative of classical CMI, i.e., withunderdeveloped PCF.Clinical data was retrieved from an in-house patient database
devoted to Chiari malformations and related disorders, a clinicalresearch repository that included detailed information about themedical history, family history, symptoms and signs, treatment andany relevant associated conditions.The control sample was composed of 524 healthy blood donors
(42.6614.4 years), sex-matched with the case sample and recruitedat Vall d’Hebron University Hospital in Barcelona. To minimize
Figure 1. Typical neuroradiological findings in CMI. A) T1-weighted mid-sagittal MR image showing downward herniation of the cerebellartonsils (a) and hypoplasia of the occipital components of the posterior cranial fossa (b): the supraocciput (c) and the basiocciput (d). B) Morphologicalmeasurements performed: length of tonsillar descent (f), supraocciput (g-b) and clivus (c–d) and foramen magnum diameter (b–c). The antero-posterior diameter of PCF (h) was inferred from a line running from the internal occipital protuberance (a) to top of the dorsum sellae (d). The PCFarea was estimated as the polygon delimited by (a) (b) (c) (d) and (e) and the osseus PCF area as the one delimited by (a) (b) (c) and (d). Angularmeasurements: tentorium angle (i), basal angulation (j) and Wackenheim angle (k).doi:10.1371/journal.pone.0057241.g001
Chiari I Malformation Genetic Association Study
PLOS ONE | www.plosone.org 2 February 2013 | Volume 8 | Issue 2 | e57241

ethnic heterogeneity only Caucasian subjects of Spanish originwere included in this study.
DNA isolation and QuantificationGenomic DNA was isolated from peripheral blood lymphocytes
by the salting-out method [33] and from saliva with Oragen DNASelf-Collection kit according to the manufacturer’s recommenda-tions (Genotek Inc. Ottawa, Ontario, Canada). DNA concentra-tions of all samples were determined on a NanoDrop spectropho-tometer (NanoDrop Technologies, LLC, Wilmington, DE).
Selection of genes and SNPsWe selected 58 functional candidate genes. Most belonged to
gene pathways involved in the early paraxial mesoderm develop-ment, leading to formation of the occipital somites, such as retinoicacid (RBP4, RBP1, STRA6, ADH4, RDH10, CRABP1, CYP26A1,CYP26C1, RARG, RARA, RXRA, ALDH1A2) reviewed in [34],FGF8 (FGF8, FGFR1, DUSP4, HES7, SNAI1, SNAI2, CDH1)[35,36,37], Wnt (WNT3A, CTNNB1, Axin2, T, TBX6, MSGN1,NKD1, NKD2) [38,39,40], Notch (DLL1, RBPJ, LFNG, NOTCH1,MESP2, ID1, ID2) [37,40], bone morphogenetic proteins(BMPR1A, BMP2) [41], Cdx (CDX1) [39,42] and Hox pathways(HOXA1, HOXA2, HOXA3, HOXA4, HOXB1, HOXB2, HOXB3,HOXB4, HOXC4, HOXD1, HOXD3, HOXD4) reviewed in [42]. Inaddition, genes involved in sclerotome development, chondrogen-esis and osteogenesis (NOG, SHH, NKX3-2, PRRX1) [43,44,45,46],genes from the VEFG family crucial for placental angiogenesis(VEGFA, KDR, FLT1) [47,48] and genes responsible for twoconditions frequently associated with CMI, NF1 (neurofibromato-sis) and STAT3 (Hyper-IgE Syndrome), were also included[49,50].The SNP selection was based on genetic coverage criteria, by
considering linkage disequilibrium (LD) patterns within thecandidate genes [51]. SNPs covering each gene plus 5 Kb flankingsequences were picked from the CEU panel of the HapMapdatabase (www.hapmap.org, phases 1+2+3, release 27) [52,53].We used the LD-select software (droog.gs.washington.edu/ldSe-lect.html) to evaluate LD of the genomic regions in order tominimize redundancy between the selected SNPs [54,55].TagSNPs were selected with the following criteria: r2,0.85 fromany other SNP according to CEU HapMap data and a minorallele frequency (MAF).0.10 for genes with less than 20 tag SNPsand MAF.0.25 for those genes with more than 20 tagSNPs(FLT1, KDR, NOTCH1, RXRA).
Plex design, genotyping and quality controlA total of 384 tagSNPs were initially selected in our study (Table
S1): 77 SNPs for the retinoic acid pathway, 44 SNPs for the FGF8pathway, 55 SNPs for the Wnt pathway, 44 SNPs for the Notchpathway, 24 SNPs for BMP, 6 SNPs for CDX, 38 SNPs for Hoxpathways, 30 SNPs for genes involved in sclerotome development,51 SNPs for the VEGF pathway and 15 SNPs for NF1 and STAT3.Genotyping was performed at the Barcelona node of the
National Genotyping Center (CeGen, www.cegen.org) using theVeraCode technology (Illumina, San Diego, CA, USA) [56]. Atotal of 9 HapMap individuals were included as controls in thegenotyping assay, obtaining a 100% concordance rate withHapMap genotype data. In addition, no differences were foundin the genotypes of thirteen replicates.
Statistical analysisThe analysis of minimal statistical power was performed a priori
with the CaTS Power Calculator software (sph.umich.edu/csg/
abecasis/CaTS) [57], assuming an odds ratio (OR) of 1.5,estimated disease prevalence of 0.008 [7,10,24], significance levelof 0.05 (a) and MAF of 0.10, under the additive model.All individuals with genotyping rates under 80% were excluded
from the study. From 384 SNPs genotyped in our study, 303passed quality controls filters and were included in the analysis,whereas 81 (21%) were excluded for the following reasons: morethan 15% missing genotypes, deviation from Hardy-Weinbergequilibrium (HWE threshold set at p = 0.01 in our controlpopulation), monomorphism, MAF,0.10 or MAF,0.25 andr2.0.85 from any other studied SNP in our control sample. Theevaluation of LD patterns and r2 were performed from thegenotype data of controls using Haploview v4.2 [58].
Single-marker analysis. The analysis of HWE and the case-control association study were performed with the SNPassoc Rpackage [59]. For the case-control study we analysed all singlemarkers under the additive model using the Cochran-ArmitageTrend Test (ATT) (Table S1). A quantile-quantile plot (Q-Q plot)was generated with the ggplot2 R library [60]. The correction formultiple testing was performed using the Q-value R libraryassuming a 10% False Discovery Rate (FDR) [61] and theBonferroni correction.
Multiple-marker analysis. To minimize multiple testingand type I (a) errors, we restricted the haplotype-based associationstudy to only those LD blocks that included the SNPs overcomingthe 10% FDR correction.The linkage disequilibrium patterns for CDX1, ALDH1A2 and
FLT1 were constructed from the genotyping data of our controlindividuals, using Haploview v4.2 software [58]. The haplotype-based analysis was performed using the same software [58]. Toobtain a measure of significance for multiple testing in haplotypeanalysis, a total of 10,000 permutations were performed.Haplotypes with frequencies ,0.05 were excluded.
PCF morphometric traits and risk genotypes. We usedthe Scheffe’s post hoc test to evaluate whether common variantscontributed to variation in any specific parameters as measured inPCF morphometric analyses, including cerebellar tonsillar descent,length of supraocciput, length of the clivus, foramen magnumdiameter, PCF area, osseous PCF area, antero-posterior diameterof the PCF (PCF length), tentorium angle, basal angulation andWackenheim angle, as previously described [32]. The analysis wascarried out only in the 186 patients where the PCF morphometryconfirmed the diagnosis of classical CMI and was limited tomarkers overcoming 10% FDR corrections for multiple testing inthe single-marker analysis. The Kruskal-Wallis nonparametric testwas used for variables not normally distributed (Kolmogorov-Smirnov test P,0.05) or showing no homogeneity of variances(Levene’s test P,0.05)).
Results
The most common signs and symptoms in the 415 casesincluded in the study are listed in Table 1. Headache was the mostprevalent symptom (69.1%), often featuring neck irradiation(43.3% of those with headache), followed by dizziness (35.1%),motor weakness (33.6%), instability (32.1%), upper limb paresthe-sias (30.7%), sensory loss (29.7%) and fatigue (28.1%). Syringo-myelia was present in 35.1% of cases. Hydrocephalus (15.1%)required specific management. Other, less common manifesta-tions, as well as co-morbid conditions, were typical for CMI(Table 1). Positive CMI family history, defined as at least oneMRI-confirmed CMI first relative, was present in only 6% of thecases. Surgical PCF reconstruction was performed in 55.8% ofpatients.
Chiari I Malformation Genetic Association Study
PLOS ONE | www.plosone.org 3 February 2013 | Volume 8 | Issue 2 | e57241

Criteria for surgery were a .3 mm descent of the cerebellartonsils in i) symptomatic patients, ii) oligosymptomatic patientswith sleep apnea syndrome predominantly of the central type, andiii) patients with syringomyelia. Posterior fossa reconstruction wascarried out in all patients to restore the volumetric capacity of theposterior fossa and to restore normal CSF dynamics at thecraniovertebral junction. In summary, the technique consisted of
the removal of a large amount of occipital bone and the posteriorarch of the atlas. The dura mater was opened and in most cases anextra-arachnoidal technique was used. An extensive dural graftsecured with tenting sutures to the cervical fascia was used to avoidarachnoid scarring and to allow for the expansion of thecompressed cisterna magna or the creation of a pseudocisternamagnaInitially, 384 SNPs from 58 candidate genes were genotyped
(Table S1). Eighty-one SNPs were excluded from statisticalanalysis after data filtering: 40 SNPs had a genotyping rate below85%, 4 SNPs showed deviation from HWE, 20 SNPs weremonomorphic or had MAF,0.10 (or MAF,0.25) and 17 had ar2.0.85 with other SNPs in the same candidate gene (Table S1).All individuals with genotyping rates below 80% were excluded
from the study, resulting in a range of genotyping efficiency of 94–97%. Thus, 303 SNPs were finally assessed in the association studyin a total of 404 patients (286 female) and 519 sex-matchedcontrols. The minimal statistical power of our sample, under theadditive model, was 78% for the whole sample and 53% aftersubgrouping into classical CMI.
Single Marker AnalysisWe used a two-tiered single marker analysis. The first step
comprised the whole patient sample while the second one includedthe more homogeneous subset of morphometry-proven classicalCMI patients. In both we used the same control population.The case-control association study with the whole CMI sample
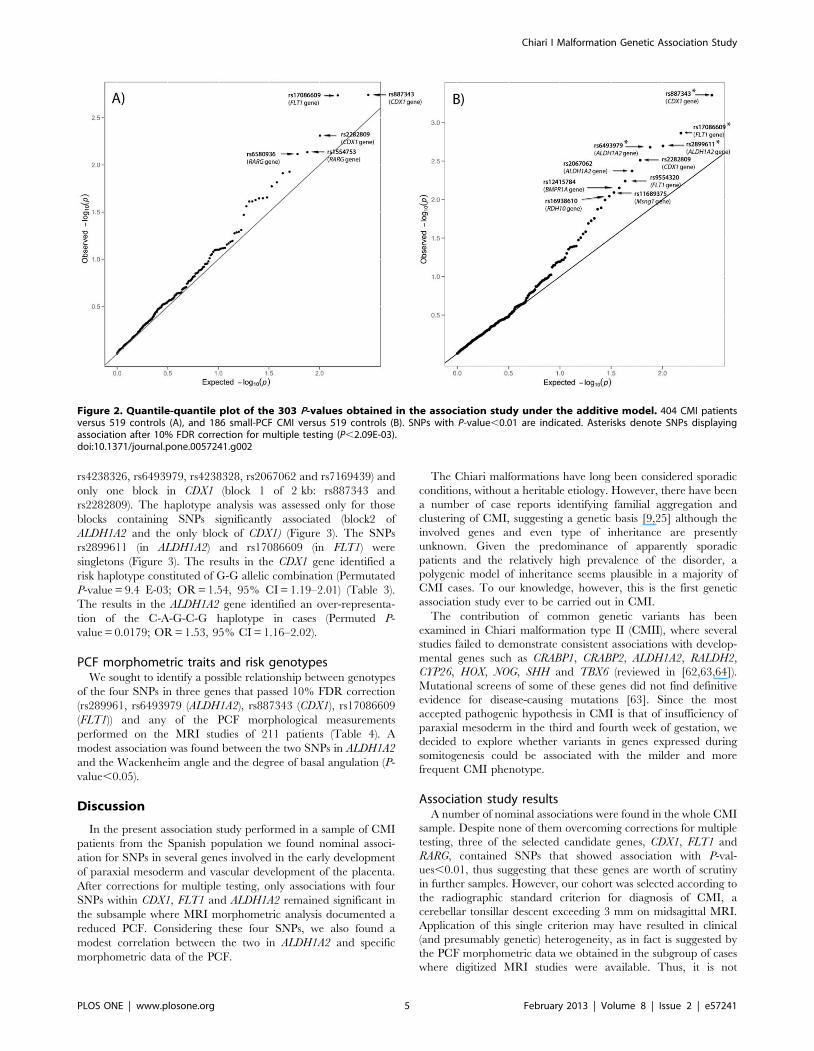
(404 patients and 519 controls) found nominal associations (P-values,0.05) for 18 SNPs located in 14 genes (Table S1). Only 5SNPs, located in three different genes, displayed P-values,0.01:CDX1 (rs887343, rs2282809), FLT1 (rs17086609) and RARG(rs1554753, rs6580936) (P-values and genotype counts are shownin Table 2 and Figure 2A, and P-values for the remaining SNPsare shown in Table S1). However, no marker remained significantafter applying 10% FDR or the Bonferroni correction (Pvalue = 1.6E-04 ( = 0.05/303 SNPs)).The second analysis considered 186 classical CMI patients
(patients with MRI morphometry-confirmed small PCF) and the519 controls. Nominal associations (P-values,0.05) were foundunder the additive model for 26 SNPs located in 13 genes (TableS1). The following 10 SNPs, located in 6 different genes, displayedP-values,0.01: ALDH1A2 (rs2899611, rs6493979, rs2067062),BMPR1A (rs12415784), CDX1 (rs887343, rs2282809), FLT1(rs17086609, rs9554320), MSGN1 (rs11689375) and RDH10(rs16938610) (Table 2 and Figure 2B). P-values for the remainingSNPs are shown in Table S1.After applying a 10% FDR correction (P,2.09E-03) four
associations did remain significant: rs887343 (P=4.4E-04) inCDX1, rs17086609 (P=1.37E-03) in FLT1, rs2899611 (P=2.01E-03) and rs6493979 (P=2.09E-03) in the ALDH1A2 gene. Underthe more strict Bonferroni correction no SNP reached significance.
Multiple Marker AnalysisThe haplotype analysis was addressed only for those genes
containing SNPs that passed 10% FDR in the single markeranalysis. The pairwise linkage disequilibrium map of ALDH1A2,CDX1 and FLT1 genes was calculated in the sample under study(Figure 3). LD patterns across the FLT1 gene defined five blocks(block 1 of ,1 kb: rs9551462, rs9554325; block 2 of 6 kb:rs17086617, rs9508021 and rs2104330; block 3 of 1 kb:rs11149523 and rs8002446; block 4 of 22 kb: rs9513112,rs9513114 and rs7330109; block5 of 5 kb: rs12858139 andrs677471); two blocks were defined in ALDH1A2 (block 1 of11 kb: rs3784264, rs3784260, rs4646615; block 2 of 17 kb:
Table 1. Clinical findings in 415 patients with Chiarimalformation type I.
CMI
Number of patients 415
Sex (M/F) 122/293
Age (y) 42.2650.9
Age at diagnosis 30.6658.7/323
Hydrocephalus 57/377 (15.1%)
Syringomyelia 133/379 (35.1%)
Intracranial Hypertension 20/376 (5.3%)
Retrocurved Odontoid 40/352 (11.4%)
Basilar impression 11/382 (2.3%)
Platibasia 8/382 (2.1%)
Klippel-Feil Malformation 3/377 (0.8%)
Other CraniocervicalMalformations
24/377 (6.4%)
SIGNS AND SYMPTOMS
Time elapsed from onset (mo) 113.3659.4/323
Headache 246/356 (69.1%)
Occipital Headache/Cervicalgia 97/224 (43.3%)
Cough Headache 87/358 (24.3%)
Dizziness 128/365 (35.1%)
Vertigo 82/365 (22.5%)
Visual Alterations 71/364 (19.5%)
Nystagmus 41/276 (14.8%)
Kyphoscoliosis 30/160 (18.7%)
Fatigue 102/363 (28.1%)
Instability 117/364 (32.1%)
Sensory Loss 108/364 (29.7%)
Motor Weakness 123/366 (33.6%)
Dysphagia 67/365 (18.3%)
Dysphonia 16/365 (4.4%)
Gait Disturbances 73/364 (20.0%)
Paresthesia Upper Limbs 112/365 (30.7%)
Paresthesia Lower Limbs 47/366 (12.9%)
Upper Limb Pain 47/365 (12.9%)
Lower Limb Pain 16/365 (4.4%)
Neck Pain 169/366 (46.2%)
Difficulty Swallowing 66/365 (18.1%)
Anxiety 38/360 (10.5%)
Depression 33/361 (9.1%)
Neurofibromatosis type 1 45/382 (11.8%)
TREATMENT
Posterior fossa reconstruction 210/376 (55.8%)
doi:10.1371/journal.pone.0057241.t001
Chiari I Malformation Genetic Association Study
PLOS ONE | www.plosone.org 4 February 2013 | Volume 8 | Issue 2 | e57241
rs4238326, rs6493979, rs4238328, rs2067062 and rs7169439) andonly one block in CDX1 (block 1 of 2 kb: rs887343 andrs2282809). The haplotype analysis was assessed only for thoseblocks containing SNPs significantly associated (block2 ofALDH1A2 and the only block of CDX1) (Figure 3). The SNPsrs2899611 (in ALDH1A2) and rs17086609 (in FLT1) weresingletons (Figure 3). The results in the CDX1 gene identified arisk haplotype constituted of G-G allelic combination (PermutatedP-value = 9.4 E-03; OR=1.54, 95% CI= 1.19–2.01) (Table 3).The results in the ALDH1A2 gene identified an over-representa-tion of the C-A-G-C-G haplotype in cases (Permuted P-value = 0.0179; OR=1.53, 95% CI= 1.16–2.02).
PCF morphometric traits and risk genotypesWe sought to identify a possible relationship between genotypes
of the four SNPs in three genes that passed 10% FDR correction(rs289961, rs6493979 (ALDH1A2), rs887343 (CDX1), rs17086609(FLT1)) and any of the PCF morphological measurementsperformed on the MRI studies of 211 patients (Table 4). Amodest association was found between the two SNPs in ALDH1A2and the Wackenheim angle and the degree of basal angulation (P-value,0.05).
Discussion
In the present association study performed in a sample of CMIpatients from the Spanish population we found nominal associ-ation for SNPs in several genes involved in the early developmentof paraxial mesoderm and vascular development of the placenta.After corrections for multiple testing, only associations with fourSNPs within CDX1, FLT1 and ALDH1A2 remained significant inthe subsample where MRI morphometric analysis documented areduced PCF. Considering these four SNPs, we also found amodest correlation between the two in ALDH1A2 and specificmorphometric data of the PCF.
The Chiari malformations have long been considered sporadicconditions, without a heritable etiology. However, there have beena number of case reports identifying familial aggregation andclustering of CMI, suggesting a genetic basis [9,25] although theinvolved genes and even type of inheritance are presentlyunknown. Given the predominance of apparently sporadicpatients and the relatively high prevalence of the disorder, apolygenic model of inheritance seems plausible in a majority ofCMI cases. To our knowledge, however, this is the first geneticassociation study ever to be carried out in CMI.The contribution of common genetic variants has been
examined in Chiari malformation type II (CMII), where severalstudies failed to demonstrate consistent associations with develop-mental genes such as CRABP1, CRABP2, ALDH1A2, RALDH2,CYP26, HOX, NOG, SHH and TBX6 (reviewed in [62,63,64]).Mutational screens of some of these genes did not find definitiveevidence for disease-causing mutations [63]. Since the mostaccepted pathogenic hypothesis in CMI is that of insufficiency ofparaxial mesoderm in the third and fourth week of gestation, wedecided to explore whether variants in genes expressed duringsomitogenesis could be associated with the milder and morefrequent CMI phenotype.
Association study resultsA number of nominal associations were found in the whole CMI
sample. Despite none of them overcoming corrections for multipletesting, three of the selected candidate genes, CDX1, FLT1 andRARG, contained SNPs that showed association with P-val-ues,0.01, thus suggesting that these genes are worth of scrutinyin further samples. However, our cohort was selected according tothe radiographic standard criterion for diagnosis of CMI, acerebellar tonsillar descent exceeding 3 mm on midsagittal MRI.Application of this single criterion may have resulted in clinical(and presumably genetic) heterogeneity, as in fact is suggested bythe PCF morphometric data we obtained in the subgroup of caseswhere digitized MRI studies were available. Thus, it is not
Figure 2. Quantile-quantile plot of the 303 P-values obtained in the association study under the additive model. 404 CMI patientsversus 519 controls (A), and 186 small-PCF CMI versus 519 controls (B). SNPs with P-value,0.01 are indicated. Asterisks denote SNPs displayingassociation after 10% FDR correction for multiple testing (P,2.09E-03).doi:10.1371/journal.pone.0057241.g002
Chiari I Malformation Genetic Association Study
PLOS ONE | www.plosone.org 5 February 2013 | Volume 8 | Issue 2 | e57241

surprising that statistical significance of the association was higherin the group of 186 patients with underdeveloped PCF. Among the26 nominally associated SNPs within 13 genes, in this ‘‘classicalCMI’’ subsample, association with P-values,0.01 were found forSNPs within six genes: ALDH1A2, RDH10, CDX1, BMPR1A,MSGN1 and FLT1. The association remained significant after a10% FDR correction for SNPs within three genes: rs887343 inCDX1, rs17086609 in FLT1 and rs2899611 plus rs6493979 in theALDH1A2 gene.Regarding the potential functional relevance of the identified
variants, four of the genes with the best association signals (P,0.01in the single marker analysis of either CMI or classical CMI),ALDH1A2, RDH10, RARG and CDX1, are directly or indirectlyrelated with retinoic acid (RA) signalling during somitogenesis. RAis a transcription factor needed for elongation of the embryonicbody axis, acting as a molecular oscillator in the somitic precursorsof the paraxial mesoderm [39] and promoting somite differenti-ation through regulation of the Hox genes [42]. Expression of RAsynthetic enzyme, RALDH2, encoded by ALDH1A2, is crucial atthese presomitic or early somatic stages. Avian or mouse RA-deficient embryos develop abnormally small somites (reviewed in[34]), while exposure to teratogenic RA levels give rise tocongenital dysraphism in humans [65]. RDH10 encodes a retinoldehydrogenase critical for embryonic vitamin A metabolism.Murine Rdh10 mutants display lethal abnormalities characteristicof a RA-deficiency phenotype [66]. RARG binds to DNA afterheterodimerization with any of the retionid X receptors, leading toactivation of RA response elements (RAREs), which displacetranscriptional corepressors and recruits coactivators [67].Through this pathway, RA regulates specific Hox expression inparaxial mesoderm, determining embryonic anterior-posteriorpatterning throughout somitogenesis (reviewed in [34,67]). Thismay origin spinal column defects such as scoliosis [68], present innearly 20% of our CMI patients. A third RA-related gene showingassociation is CDX1. Cdx genes encode homeodomain transcrip-tion factors containing atypical RARE [69,70]. In the mouseembryo primitive streak, expression of Cdx1 begins at postconcep-tional day 7.5 in concurrence with onset of RA signalling and Hoxexpression. Of note, Cdx1-null mutants display alterations in thebasioccipital bone [69].The other three listed genes, BMPR1A, MSGN1 and FLT1,
belong to less interrelated pathways. BMPR1A has been found toregulate the recruitment of prospective paraxial mesoderm cells inthe mouse epiblast. Mutant embryos have a shorter primitivestreak, a more proximal node and a defective extension of theprimitive streak [41]. MSGN1 is a direct target of Wnt and TBX6during the specification, maturation and segmentation of theparaxial mesoderm in the mouse [38]. FLT-1 encodes VEGFR-1,a vascular endothelial growth factor receptor expressed in theendothelium of blood vessels [71]. Vasculogenesis at the chorionicvilli tree is evident by post conceptional day 21, during the four-somite embryonic stage (reviewed in [72]). A FLT-1 mutationresulted in endothelial disorganization and abnormal vesselformation during early embryo development [73]. During thefourth week of life the human embryo switches from the exchangeof nutrients and wastes by simple diffusion to establishment ofutero-placental circulation. It is conceivable that failure toproperly transition through these two stages could impair criticalprocesses as mesodermal proliferation or neurulation.Finally, the four variants associated with classical CMI
(rs887343 in CDX1, rs17086609 in FLT1 and rs2899611 plusrs6493979 in ALDH1A2) are intronic, with no direct effect on theprotein sequence. It could be that the identified risk variants mayproduce by themselves functional alterations or they might lie in
Table
2.Case-controlassociationstudyof40
4Sp
anishCMIpatients
and51
9sex-matched
controls.
Gene
ControlGenotypesN
(%)
AllCMIGenotypesN
(%)
ClassicalCMIGenotypesN
(%)
SNP(P,0.01)
11
12
22
11
12
22
P-val
11
12
22
P-val
ALD
H1A
2rs28
9961
111
0(21)
264(51)
145(28)
NS
59(32)
90(48)
37(20)
0.00201*
rs64
9397
978
(15)
273(53)
168(32)
84(21)
207(51)
113(28)
0.02
436
46(25)
95(51)
45(24)
0.00209*
rs20
6706
214
8(29)
258(50
)10
5(21)
NS
35(20)
93(52)
51(28)
0.00425
BMPR1A
rs12
4157
845(1)
135(26)
379(73)
5(1)
76(19)
323(80)
0.02
744
2(1)
29(16)
155(83)
0.00704
CDX1
rs88
7343
85(16)
252(49)
180(35)
43(11)
187(46)
174(43)
0.00181
16(9)
82(44)
88(47)
0.00044*
rs22
8280
971
(14)
240(46)
206(40)
37(9)
174(43)
193(48)
0.00489
15(8)
76(41)
95(51)
0.00308
FLT1
rs17
0866
0924
2(47)
222(43)
50(10)
149(37)
196(49)
55(14)
0.00183
67(37)
83(45)
33(18)
0.00137*
rs95
5432
010
4(20)
261(50)
153(30)
NS
25(14)
88(47)
73(39)
0.00575
MSG
N1
rs11
6893
7511
7(23)
245(47)
156(30)
60(15)
203(51)
137(34)
0.01
225
21(11)
98(53)
64(36)
0.00810
RARG
rs15
5475
331
0(60)
182(35)
27(5)
272(67)
121(30)
11(3)
0.00732
146(79)
36(19)
4(2)
0.01
752
rs65
8093
635
8(69)
146(28)
15(3)
310(77)
87(21)
7(2)
0.00767
NS
RDH10
rs16
9386
1030
5(59)
178(34)
36(7)
262(64)
126(31)
16(4)
0.02
209
127(68)
53(29)
6(3)
0.00903
Anad
ditional
studyan
alyzed
186classicalCMIpatients
andthesamecontrolpopulation.Only
markers
withP-value,
0.01
(Cochran-Arm
itag
etren
dtest)areshown.
* Significantassociationsafterap
plying10
%FD
R.
doi:10.13
71/journal.pone.00
5724
1.t002
Chiari I Malformation Genetic Association Study
PLOS ONE | www.plosone.org 6 February 2013 | Volume 8 | Issue 2 | e57241

Figure 3. Haploview graphs showing the markers tested and haplotype blocks constructed for ALDH1A2, CDX1 and FLT1. D9 values areindicated (tones from white to dark grey indicate D9 values from 0 to 1, respectively). The genomic structures of ALDH1A2, CDX1 and FLT1 genes aredrawn with coding exons indicated as black boxes. The SNPs with P-value,0.01 are indicated with an asterisk (*); the SNPs showing association after10% FDR correction for multiple testing (P,2.09E-03) are indicated with a double asterisk (**).doi:10.1371/journal.pone.0057241.g003
Table 3. Haplotype analysis for the linkage disequilibrium blocks containing SNPs that showed significant associations in thesingle marker analysis (Haploview v4.2 software).
Population Gene LD block: SNPs Haplotype Cases % Controls %P-value(permP)a Odds Ratio [95% CI]
Classical CMI CDX1 Block 1: rs887343-rs2282809 GG 255 (71) 614 (62) 0.0014 (0.0094) 1.54 [1.19–2.01]
CA 103 (29) 384 (38) 0.0012 (0.0092) 0.65 [0.50–0.84]
Classical CMI ALDH1A2 Block 2: rs4238326-rs6493979-rs4238328-rs2067062-rs7169439
TGGAG 99 (28) 328 (33) 0.0732 (0.3975) 0.79 [0.60–1.02]
CAGCG 100 (28) 201 (20) 0.0025 (0.0179) 1.53 [1.16–2.02]
TGAAG 66 (19) 233 (24) 0.0563 (0.3233) 0.75 [0.55–1.01]
CAGCA 49 (14) 140 (14) 0.882 (1.0000) 0.97 [0.69–1.38]
TAGCG 38 (11) 87 (9) 0.2624 (0.8997) 1.24 [0.83–1.86]
aA total of 10,000 permutations were performed using Haploview v4.2 to obtain a measure of significance corrected for multiple testing.doi:10.1371/journal.pone.0057241.t003
Chiari I Malformation Genetic Association Study
PLOS ONE | www.plosone.org 7 February 2013 | Volume 8 | Issue 2 | e57241

LD with other susceptibility loci, in the case of an indirectassociation. Since all these SNPs are tagSNPs, we analyzed thesevariants and those in LD with them by means of the web utilitySNP Function Prediction [74]. The predictions of functionaleffects for transcription factor binding sites, exonic splicingenhancers or silencers, changing of splicing pattern or efficiencyby disrupting splice sites, regulation of protein translation byaffecting microRNA binding sites and conservation scores were allnegative.
Genetic-morphometric analysisWe also investigated whether any specific PCF morphological
feature might relate to any of the gene variants showingassociation with CMI. A short anteroposterior diameter of thePCF and an increased basal angle have been described in someCMI morphometric studies [17,19]. However, no correlation wasfound among genotypes and any of the previously consideredmore typical features of CMI, such as clivus or supraocciputlength, PCF area or tentorial angle [15]. In our study, two SNPs inALDH1A2 displayed a correlation with the Wackenheim angle andone of them with the basal angulation, in keeping with previousevidence pointing at basiocciput, rather than supraocciput,abnormalities in CMI. Whether an abnormal clivus slope doesconstitute a marker of genetically-determined CMI deservesfurther investigation.
Methodological issuesThe present case–control association study raises several
methodological questions. First, the modest sample size (404patients and 519 controls) may have prevented from detectingsubtle phenotypic effects, as the statistical power calculated for thiscohort is close to 80% when an OR of 1.5 is assumed. Second, wedo not present a replication study of our findings in anindependent cohort. This notwithstanding, ours was a relativelylarge sample considering the low prevalence of CMI (1:1000 to1:5000), bordering that of rare diseases. It was also the first CMIsample being explored for association with a large set of candidategenes. Third, although the SNP selection was designed to coverthe 58 candidate genes on the basis of existing linkagedisequilibrium patterns, gaps still exist in 12 genes due toexperimental constraints, and 21% of the 384 SNPs could notbe studied. Last, lack of MRI studiy of the control population mayhave resulted in inclusion of some asymptomatic CMI cases,although given the estimated low prevalence of tonsillar descent,this should not be expected to influence the validity of our findingsIn conclusion our genetic data give support to the hypothesis
that variants in genes involved in paraxial mesoderm maydetermine PCF size to the extent of the development of theCMI. Specifically, our results point to a putative role for defectiveRA signalling and fetal vasculogenesis in causing hypoplasia of thebasichondrocranium. Although confirmatory studies are needed,these are among the first genetic susceptibility factors to be definedin CMI. Given the limitations of the current radiographicdiagnostic criteria, understanding of the genetic underpinningsof CMI should have important clinical implications, includingearlier recognition of subjects at risk of becoming symptomatic andthe timely indication of the surgical reconstruction of the PCF.
Supporting Information
Table S1 Description of the 384 SNPs initially selected for thegenotyping assay using the VeraCode technology.(DOCX)
Acknowledgments
We thank the Spanish Chiari Malformation associations, Asenchi andANAC, and all the patients for their valuable contribution to this study. Wethank Elizabeth Solana and Olga Mestre for assistance in recruiting thepatient cohort and obtaining samples.
Author Contributions
Conceived and designed the experiments: EC-L MAP JS AM. Performedthe experiments: AU EC-L CT. Analyzed the data: AU CT EC-L BC AM.Contributed reagents/materials/analysis tools: CT MAP. Wrote the paper:AU CT MAP JS EC-L BC AM.
References
1. Chiari H (1987) Concerning alterations in the cerebellum resulting from cerebralhydrocephalus. 1891. Pediatr Neurosci 13: 3–8.
2. Barkovich AJ, Wippold FJ, Sherman JL, Citrin CM (1986) Significance ofcerebellar tonsillar position on MR. AJNR Am J Neuroradiol 7: 795–799.
3. Milhorat TH, Chou MW, Trinidad EM, Kula RW, Mandell M, et al. (1999)Chiari I malformation redefined: clinical and radiographic findings for 364symptomatic patients. Neurosurgery 44: 1005–1017.
4. Tubbs RS, Beckman J, Naftel RP, Chern JJ, Wellons JC 3rd, et al. (2011)Institutional experience with 500 cases of surgically treated pediatric Chiarimalformation Type I. J Neurosurg Pediatr 7: 248–256.
5. Greenlee JD, Donovan KA, Hasan DM, Menezes AH (2002) Chiari Imalformation in the very young child: the spectrum of presentations andexperience in 31 children under age 6 years. Pediatrics 110: 1212–1219.
6. Martinot A, Hue V, Leclerc F, Vallee L, Closset M, et al. (1993) Sudden deathrevealing Chiari type 1 malformation in two children. Intensive care medicine19: 73–74.
7. Vernooij MW, Ikram MA, Tanghe HL, Vincent AJ, Hofman A, et al. (2007)Incidental findings on brain MRI in the general population. N Engl J Med 357:1821–1828.
8. Morris Z, Whiteley WN, Longstreth WT Jr, Weber F, Lee YC, et al. (2009)Incidental findings on brain magnetic resonance imaging: systematic review andmeta-analysis. Bmj 339: b3016.
Table 4. Association between risk genotypes and PCFmorphometric traits in 211 patients with CMI.
ALDH1A2 ALDH1A2 CDX1 FLT1
Measures rs2899611 rs6493979 rs887343 rs17086609
TD 0.105 0.684 0.226 0.328
Supraocciput 0.477 0.352 0.777 0.829
Clivus 0.922 0.976 0.593 0.769
FM 0.080 0.595 0.227 0.933
PCF area 0.248 0.560 0.556 0.459
OPCF area 0.367 0.636 0.532 0.356
PCF length* 0.750 0.300 0.094 0.983
Tentoriumangle
0.456 0.836 0.410 0.118
Basalangulation
0.016 0.067 0.800 0.228
Wackenheimangle
0.006 0.039 0.824 0.146
Data presented are P-values (Scheffe’s post-hoc and Kruskal-Wallis tests).*Assessed as the distance from the dorsum sellae to the internal occipitalprotuberance; in bold, P,0.05.TD: tonsillar descent; OPCF: osseous PCF, FM:foramen magnum.doi:10.1371/journal.pone.0057241.t004
Chiari I Malformation Genetic Association Study
PLOS ONE | www.plosone.org 8 February 2013 | Volume 8 | Issue 2 | e57241

9. Speer MC, George TM, Enterline DS, Franklin A, Wolpert CM, et al. (2000) Agenetic hypothesis for Chiari I malformation with or without syringomyelia.Neurosurg Focus 8: E12.
10. Meadows J, Kraut M, Guarnieri M, Haroun RI, Carson BS (2000)Asymptomatic Chiari Type I malformations identified on magnetic resonanceimaging. J Neurosurg 92: 920–926.
11. Marin-Padilla M, Marin-Padilla TM (1981) Morphogenesis of experimentallyinduced Arnold–Chiari malformation. J Neurol Sci 50: 29–55.
12. Barry A, Patten BM, Stewart BH (1957) Possible factors in the development ofthe Arnold-Chiari malformation. J Neurosurg 14: 285–301.
13. Gardner WJ, Goodall RJ (1950) The surgical treatment of Arnold-Chiarimalformation in adults; an explanation of its mechanism and importance ofencephalography in diagnosis. J Neurosurg 7: 199–206.
14. McLone DG, Knepper PA (1989) The cause of Chiari II malformation: a unifiedtheory. Pediatr Neurosci 15: 1–12.
15. Nishikawa M, Sakamoto H, Hakuba A, Nakanishi N, Inoue Y (1997)Pathogenesis of Chiari malformation: a morphometric study of the posteriorcranial fossa. J Neurosurg 86: 40–47.
16. Noudel R, Jovenin N, Eap C, Scherpereel B, Pierot L, et al. (2009) Incidence ofbasioccipital hypoplasia in Chiari malformation type I: comparative morpho-metric study of the posterior cranial fossa. Clinical article. J Neurosurg 111:1046–1052.
17. Aydin S, Hanimoglu H, Tanriverdi T, Yentur E, Kaynar MY (2005) Chiari typeI malformations in adults: a morphometric analysis of the posterior cranial fossa.Surg Neurol 64: 237–241; discussion 241.
18. Schady W, Metcalfe RA, Butler P (1987) The incidence of craniocervical bonyanomalies in the adult Chiari malformation. J Neurol Sci 82: 193–203.
19. Karagoz F, Izgi N, Kapijcijoglu Sencer S (2002) Morphometric measurements ofthe cranium in patients with Chiari type I malformation and comparison withthe normal population. Acta Neurochir (Wien) 144: 165–171; discussion 171.
20. Milhorat TH, Nishikawa M, Kula RW, Dlugacz YD (2010) Mechanisms ofcerebellar tonsil herniation in patients with Chiari malformations as guide toclinical management. Acta Neurochir (Wien) 152: 1117–1127.
21. Stovner LJ, Bergan U, Nilsen G, Sjaastad O (1993) Posterior cranial fossadimensions in the Chiari I malformation: relation to pathogenesis and clinicalpresentation. Neuroradiology 35: 113–118.
22. Vega A, Quintana F, Berciano J (1990) Basichondrocranium anomalies in adultChiari type I malformation: a morphometric study. J Neurol Sci 99: 137–145.
23. Marin-Padilla M (1991) Cephalic axial skeletal-neural dysraphic disorders:embryology and pathology. Can J Neurol Sci 18: 153–169.
24. Schanker BD, Walcott BP, Nahed BV, Kahle KT, Li YM, et al. (2011) FamilialChiari malformation: case series. Neurosurg Focus 31: E1.
25. Speer MC, Enterline DS, Mehltrette L, Hammock P, Judith Joseph MD, et al.(2003) Chiari Type I Malformation With or Without Syringomyelia: Prevalenceand Genetics. Journal of Genetic Counseling 12: 297–311.
26. Fujita K, Aida N, Asakura Y, Kurosawa K, Niwa T, et al. (2009) Abnormalbasiocciput development in CHARGE syndrome. AJNR Am J Neuroradiol 30:629–634.
27. Wojcik C, Volz K, Ranola M, Kitch K, Karim T, et al. (2010) Rubinstein-Taybisyndrome associated with Chiari type I malformation caused by a large 16p13.3microdeletion: a contiguous gene syndrome? American journal of medicalgenetics Part A 152A: 479–483.
28. Fujisawa H, Hasegawa M, Kida S, Yamashita J (2002) A novel fibroblast growthfactor receptor 2 mutation in Crouzon syndrome associated with Chiari type Imalformation and syringomyelia. J Neurosurg 97: 396–400.
29. Schimmenti LA, Shim HH, Wirtschafter JD, Panzarino VA, Kashtan CE, et al.(1999) Homonucleotide expansion and contraction mutations of PAX2 andinclusion of Chiari 1 malformation as part of renal-coloboma syndrome. HumMutat 14: 369–376.
30. Boyles AL, Enterline DS, Hammock PH, Siegel DG, Slifer SH, et al. (2006)Phenotypic definition of Chiari type I malformation coupled with high-densitySNP genome screen shows significant evidence for linkage to regions onchromosomes 9 and 15. Am J Med Genet A 140: 2776–2785.
31. Kibar Z, Capra V, Gros P (2007) Toward understanding the genetic basis ofneural tube defects. Clinical genetics 71: 295–310.
32. Urbizu A, Poca M, Vidal X, Rovira A, Sahuquillo J, et al. (2012) MRI-basedmorphometric analysis of posterior cranial fossa: a probability model fordiagnosis of Chiari malformation type I. Journal of Neuroimaging. In press.
33. Miller SA, Dykes DD, Polesky HF (1988) A simple salting out procedure forextracting DNA from human nucleated cells. Nucleic Acids Res 16: 1215.
34. Niederreither K, Dolle P (2008) Retinoic acid in development: towards anintegrated view. Nat Rev Genet 9: 541–553.
35. Bottcher RT, Niehrs C (2005) Fibroblast growth factor signaling during earlyvertebrate development. Endocrine reviews 26: 63–77.
36. Shapiro R, Robinson F (1976) Embryogenesis of the human occipital bone. AJRAm J Roentgenol 126: 1063–1068.
37. Kageyama R, Niwa Y, Shimojo H (2009) Rhythmic gene expression in somiteformation and neural development. Molecules and cells 27: 497–502.
38. Wittler L, Shin EH, Grote P, Kispert A, Beckers A, et al. (2007) Expression ofMsgn1 in the presomitic mesoderm is controlled by synergism of WNTsignalling and Tbx6. EMBO reports 8: 784–789.
39. Aulehla A, Pourquie O (2009) Signaling gradients during paraxial mesodermdevelopment. Cold Spring Harb Perspect Biol 2: a000869.
40. William DA, Saitta B, Gibson JD, Traas J, Markov V, et al. (2007) Identificationof oscillatory genes in somitogenesis from functional genomic analysis of ahuman mesenchymal stem cell model. Developmental biology 305: 172–186.
41. Miura S, Davis S, Klingensmith J, Mishina Y (2006) BMP signaling in theepiblast is required for proper recruitment of the prospective paraxial mesodermand development of the somites. Development 133: 3767–3775.
42. Alexander T, Nolte C, Krumlauf R (2009) Hox genes and segmentation of thehindbrain and axial skeleton. Annu Rev Cell Dev Biol 25: 431–456.
43. Olsen BR, Reginato AM, Wang W (2000) Bone development. Annual review ofcell and developmental biology 16: 191–220.
44. Monsoro-Burq AH (2005) Sclerotome development and morphogenesis: whenexperimental embryology meets genetics. The International journal ofdevelopmental biology 49: 301–308.
45. Tribioli C, Lufkin T (1999) The murine Bapx1 homeobox gene plays a criticalrole in embryonic development of the axial skeleton and spleen. Development126: 5699–5711.
46. Martin JF, Bradley A, Olson EN (1995) The paired-like homeo box gene MHoxis required for early events of skeletogenesis in multiple lineages. Genes &development 9: 1237–1249.
47. Kaufmann P, Mayhew TM, Charnock-Jones DS (2004) Aspects of humanfetoplacental vasculogenesis and angiogenesis. II. Changes during normalpregnancy. Placenta 25: 114–126.
48. Demir R, Kayisli UA, Seval Y, Celik-Ozenci C, Korgun ET, et al. (2004)Sequential expression of VEGF and its receptors in human placental villi duringvery early pregnancy: differences between placental vasculogenesis andangiogenesis. Placenta 25: 560–572.
49. Tubbs RS, Rutledge SL, Kosentka A, Bartolucci AA, Oakes WJ (2004) Chiari Imalformation and neurofibromatosis type 1. Pediatric neurology 30: 278–280.
50. Freeman AF, Davis J, Hsu AP, Holland SM, Puck JM (1993) AutosomalDominant Hyper IgE Syndrome. In: Pagon RA, Bird TD, Dolan CR, StephensK, editors. GeneReviews. Seattle (WA).
51. Gu CC, Yu K, Rao DC (2008) Characterization of LD structures and the utilityof HapMap in genetic association studies. Adv Genet 60: 407–435.
52. Thorisson GA, Smith AV, Krishnan L, Stein LD (2005) The InternationalHapMap Project Web site. Genome Res 15: 1592–1593.
53. Barnes MR (2006) Navigating the HapMap. Brief Bioinform 7: 211–224.54. Mueller JC (2004) Linkage disequilibrium for different scales and applications.
Brief Bioinform 5: 355–364.55. Carlson CS, Eberle MA, Rieder MJ, Yi Q, Kruglyak L, et al. (2004) Selecting a
maximally informative set of single-nucleotide polymorphisms for associationanalyses using linkage disequilibrium. Am J Hum Genet 74: 106–120.
56. Lin CH, Yeakley JM, McDaniel TK, Shen R (2009) Medium- to high-throughput SNP genotyping using VeraCode microbeads. Methods Mol Biol496: 129–142.
57. Skol AD, Scott LJ, Abecasis GR, Boehnke M (2006) Joint analysis is moreefficient than replication-based analysis for two-stage genome-wide associationstudies. Nat Genet 38: 209–213.
58. Barrett JC, Fry B, Maller J, Daly MJ (2005) Haploview: analysis andvisualization of LD and haplotype maps. Bioinformatics 21: 263–265.
59. Gonzalez JR, Armengol L, Sole X, Guino E, Mercader JM, et al. (2007)SNPassoc: an R package to perform whole genome association studies.Bioinformatics 23: 644–645.
60. Wickham H (2009) ggplot2: elegant graphics for data analysis. Springer, NewYork.
61. Storey JD (2002) A direct approach to false discovery rates. Journal of the RoyalStatistical Society, Series B 64: 64:479–498.
62. Boyles AL, Hammock P, Speer MC (2005) Candidate gene analysis in humanneural tube defects. American journal of medical genetics Part C, Seminars inmedical genetics 135C: 9–23.
63. Kibar Z, Capra V, Gros P (2007) Toward understanding the genetic basis ofneural tube defects. Clin Genet 71: 295–310.
64. Greene ND, Stanier P, Copp AJ (2009) Genetics of human neural tube defects.Human molecular genetics 18: R113–129.
65. Lammer EJ, Chen DT, Hoar RM, Agnish ND, Benke PJ, et al. (1985) Retinoicacid embryopathy. The New England journal of medicine 313: 837–841.
66. Sandell LL, Sanderson BW, Moiseyev G, Johnson T, Mushegian A, et al. (2007)RDH10 is essential for synthesis of embryonic retinoic acid and is required forlimb, craniofacial, and organ development. Genes & development 21: 1113–1124.
67. Duester G (2008) Retinoic acid synthesis and signaling during earlyorganogenesis. Cell 134: 921–931.
68. Kane WJ (1977) Scoliosis prevalence: a call for a statement of terms. Clinicalorthopaedics and related research: 43–46.
69. Houle M, Sylvestre JR, Lohnes D (2003) Retinoic acid regulates a subset ofCdx1 function in vivo. Development 130: 6555–6567.
70. Houle M, Prinos P, Iulianella A, Bouchard N, Lohnes D (2000) Retinoic acidregulation of Cdx1: an indirect mechanism for retinoids and vertebralspecification. Molecular and cellular biology 20: 6579–6586.
71. Terman BI, Dougher-Vermazen M, Carrion ME, Dimitrov D, Armellino DC,et al. (1992) Identification of the KDR tyrosine kinase as a receptor for vascularendothelial cell growth factor. Biochemical and biophysical research commu-nications 187: 1579–1586.
72. Demir R, Seval Y, Huppertz B (2007) Vasculogenesis and angiogenesis in theearly human placenta. Acta Histochem 109: 257–265.
Chiari I Malformation Genetic Association Study
PLOS ONE | www.plosone.org 9 February 2013 | Volume 8 | Issue 2 | e57241

73. Fong GH, Rossant J, Gertsenstein M, Breitman ML (1995) Role of the Flt-1receptor tyrosine kinase in regulating the assembly of vascular endothelium.Nature 376: 66–70.
74. Xu Z, Taylor JA (2009) SNPinfo: integrating GWAS and candidate geneinformation into functional SNP selection for genetic association studies. Nucleicacids research 37: W600–605.
Chiari I Malformation Genetic Association Study
PLOS ONE | www.plosone.org 10 February 2013 | Volume 8 | Issue 2 | e57241