
PICES SCIENTIFIC REPORT No. 58, 2020 - North Pacific ...
140
PICES SCIENTIFIC REPORT No. 58, 2020 Building Capacity for Coastal Monitoring by Local Small-scale Fishers: The PICES–Japan MAFF FishGIS Project ISBN 978-1-927797-39-6 ISSN 1198-273X
-
Upload
khangminh22 -
Category
Documents
-
view
1 -
download
0
Transcript of PICES SCIENTIFIC REPORT No. 58, 2020 - North Pacific ...

PICES SCIENTIFIC REPORT No. 58, 2020
Building Capacity for Coastal Monitoring by Local Small-scale Fishers: The PICES–Japan MAFF FishGIS Project
ISBN 978-1-927797-39-6 ISSN 1198-273X

PICES Scientific Report No. 58 2020
Building Capacity for Coastal Monitoring by Local Small-scale Fishers:
The PICES–Japan MAFF FishGIS Project
Edited by Mitsutaku Makino and Mark L. Wells
December 2020
North Pacific Marine Science Organization (PICES) P.O. Box 6000, Sidney, BC, V8L 4B2, Canada
www.pices.int

PICES Scientific Reports
Published since 1993, the PICES Scientific Report series includes final reports of PICES expert groups, proceedings of PICES workshops, data reports and reports of planning activities. Formal peer reviews of the scientific content of these publications are not generally conducted. PICES Scientific Reports can be found at: https://meetings.pices.int/publications/scientific-reports This report was developed under the guidance of the PICES Science Board. The views expressed in this report are those of participating scientists under their responsibilities. Front cover: Wooden fishing vessels used by small-scale fishers at a local fisheries port in the West Java, Indonesia (Source: Mitsutaku Makino, The University of Tokyo, Japan). This document should be cited as follows: Makino, M. and Wells, M.L. (Eds.) 2020. Building Capacity for Coastal Monitoring by Local Small-scale Fishers: The PICES–Japan MAFF FishGIS Project. PICES Sci. Rep. No. 58, 131 pp.

PICES Scientific Report No. 58 iii
Table of Contents
Executive Summary ................................................................................................................................... v
要旨 ........................................................................................................................................................... vi
Ringkasan ................................................................................................................................................. vii
1 Introduction ......................................................................................................................................... 1 1.1 Background, objectives and the basic approach of the project ................................................. 1 1.2 Project formation and funding .................................................................................................. 3 1.3 Project timeline ......................................................................................................................... 6 1.4 Structure of the report ............................................................................................................... 8
2 Case Study: Indonesia ........................................................................................................................ 9 2.1 Our Indonesian collaborators ................................................................................................... 9 2.2 Community selection criteria .................................................................................................... 9
2.3 Case study sites ....................................................................................................................... 10
3 The Tools for Citizen Scientists ........................................................................................................ 14
3.1 Citizen science – Overall strategy ........................................................................................... 14 3.2 The FishGIS application design and development .................................................................. 16
3.2.1 Application design ..................................................................................................... 16 3.2.2 FishGIS reports .......................................................................................................... 18 3.2.3 Manual development ................................................................................................. 21
3.3 The HydroColor application ................................................................................................... 22 3.4 Foldscopes ............................................................................................................................... 25
4 Database Development ...................................................................................................................... 26 4.1 Current design ......................................................................................................................... 26 4.2 Future goals for database development .................................................................................. 27
5 Implementation .................................................................................................................................. 29
6 Summary and Recommendations ...................................................................................................... 37 6.1 Foundation to the project successes ........................................................................................ 37 6.2 PICES FishGIS and Official Development Assistance Program ................................................. 37 6.3 Recommendations for success with FishGIS ........................................................................... 38 6.4 Dissemination of project results .............................................................................................. 40

iv PICES Scientific Report No. 58
7 References ......................................................................................................................................... 43
Appendix 1 FishGIS Principles ............................................................................................................. 45
Appendix 2 Project Science Team Members ........................................................................................ 47
Appendix 3 Project Science Team Meeting Reports ............................................................................. 49
Appendix 4 FishGIS Operation ............................................................................................................. 88
Appendix 5 Report of Water Quality Analysis ..................................................................................... 92
Appendix 6 Session Descriptions and Presented Papers at PICES Annual Meetings ......................... 101
Appendix 7 FishGIS Articles in PICES Press ..................................................................................... 110

PICES Scientific Report No. 58 v
Executive Summary
Indonesian coastal communities depend on fisheries as their major source of food and livelihood. Environmental degradation of these coastal regions over the past decades has had substantial negative effects on the well-being of the coastal people. One of the most important tasks for marine researchers is to scientifically assist coastal communities in adapting to social and ecological changes for their sustainable livelihood and better well-being. This was the motivation for PICES (North Pacific Marine Science Organization) to accept a request to undertake a project entitled “Building capacity for coastal monitoring by local small-scale fishers” (acronym FishGIS) and funded by the Ministry of Agriculture, Forestry and Fisheries (MAFF) of Japan, through the Fisheries Agency of Japan (JFA), from the Official Development Assistance (ODA) Fund. The project started in November 2017 and was completed in March 2020.
The overall goal of the FishGIS project was to enhance the capacity of local small-scale fishers and aquaculture farmers to monitor coastal ecosystems and coastal fisheries in Pacific Rim developing countries. The focus of this project was to develop smartphone-based technology and evaluate and implement its use for citizen-science observations and reporting on aspects of environmental quality and fisheries status in coastal waters. Towards this end, PICES began working with Indonesian government scientists and representatives, and in close collaboration with four local coastal communities, using the Transdisciplinary Research Concept of Future Earth. The guiding questions for the project were:
• How do global changes in climate and economy affect coastal ecosystems?
• How may enhanced capacity for monitoring activities by local fishers help to improve fisheries management in coastal areas?
Several workshops were organized to co-design the basic framework of the project with the local people. Through this collaboration, five issues were identified as important keystones for their well-being: (1) water quality, (2) fish catch, (3) Illegal Unregulated and Unreported (IUU) fishing, (4) floating garbage (plastics), and (5) toxic phytoplankton (i.e., red-tides, or harmful alga blooms (HABs)). With the scientific support of PICES researchers, the project developed and implemented smartphone-based tools (applications, sampling methods and reporting protocols) that enabled local fishers and community members to collect and electronically share fisheries and environmental data with relevant Indonesian government authorities and university researchers. Local students and teachers were included in the training workshops to help foster the sustainability of these data collection programs.
The positive outcomes of the project activities are that: (1) the Indonesian national government is moving to include these citizen-science collected data in the Indonesian National Ocean Data Center, (2) the local communities have formed a sense of ownership and pride for their monitoring activities, and (3) these data streams will provide the foundation for obtaining new knowledge and scientifically envisioning the future of coastal ecosystems and livelihood in Indonesia.

vi PICES Scientific Report No. 58
要旨
インドネシアの沿岸集落は、その食料と雇用の源として、漁業に大きく依存している。そし
て、ここ数十年の沿岸環境の劣化は、沿岸にすむ人々の福利に大きな負の影響を与えてきた。
よって、海洋科学者が担う最も重要な役割の一つは、沿岸の集落が持続可能な生計とよりよ
い福利を実現するため、社会および生態系の変化に適応することを、科学的に支援すること
である。以上の認識に基づき、PICES(北太平洋海洋科学機構)は、日本国農林水産省が水産
庁を通じて拠出した ODA(政府開発援助)資金に基づくプロジェクト「地域零細漁業者によ
る沿岸モニタリングの能力構築」を実施した。プロジェクト実施期間は、2017 年 11 月から
2020 年 3 月である。
本プロジェクトの全体的目的は、環太平洋海域の途上国における零細漁業者や養殖業者が沿
岸生態系と沿岸漁業をモニターする能力を向上させることにある。具体的には、市民科学
(Citizen Science)のアプローチにもとづき、沿岸海域の環境の質や漁業の状況を、スマート
フォンを使って観測・報告するための技術を開発し、評価し、そして実装する。この目的の
ため PICES は、フューチャーアースの超学際研究(トランスディシプリナリー研究)のコン
セプトに基づき、インドネシア国の政府研究者や代表者たちと協働し、また地域の沿岸集落
とも緊密に連携してプロジェクトを実施してきた。本プロジェクトの基本的なクエスチョン
は以下の 2 つである。
• 気候や経済のグローバルな変化がどのように沿岸生態系に影響を及ぼすのか? • 地域の漁業者によるモニタリング能力の向上が沿岸の漁業管理の改善にどう貢献する
のか?
現地の集落において現地の人々とワークショップを複数回開催し、プロジェクトの基本的な
枠組みを協働設計(コ・デザイン)した。その結果、地域の人々の福利にとって重要な 5 つ
の問題が明らかとなった。すなわち、1)水質、2)漁獲、3)違法・無報告・無管理漁業
(IUU 漁業)、4)浮遊ごみ(プラスティック)、5)有害微生物(赤潮や有毒藻類 HAB)である。PICES の研究者による科学的サポートの下、このプロジェクトでは新たなスマート
フォン技術(アプリ、サンプリング、報告様式)を開発し、インドネシアの漁業者や沿岸集
落の住人が自ら漁業や水質などのデータを収集したうえで、それを政府関係者や研究者とと
もに電子的に共有することを可能にした。また、地域の学生や教師も参加する訓練ワークシ
ョップを開催することにより、このようなデータ収集の仕組み自体の持続可能性も促進した。
以上の活動の結果、1)インドネシア政府が、このような市民科学を通じて得られたデータ
を、国立海洋データセンターに収納する方向で動き始めた、2)地域の集落の人々が、この
モニタリング活動を我がものとして理解し、また、誇りを持つようになった、3)こうして
得られたデータにより、新たな知が生まれ、ひいてはインドネシアのこれからの沿岸生態系
や整形のあり方を科学的に模索していく基盤となった、などの成果が得られた。

PICES Scientific Report No. 58 vii
Ringkasan
Masyarakat pesisir Indonesia bergantung pada perikanan sebagai sumber utama makanan dan mata pencaharian mereka. Penurunan kualitas lingkungan perairan di wilayah pesisir dalam beberapa dekade terakhir ini telah menyebabkan dampak negatif yang nyata terhadap kesejahteraan masyarakat pesisir. Salah satu tugas paling penting para peneliti kelautan adalah membantu secara ilmiah agar masyarakat pesisir dapat beradaptasi terhadap perubahan sosial dan ekologi untuk menjamin mata pencaharian berkelanjutan dan kesejahteraan yang lebih baik. Dengan latar belakang diatas, PICES (Organisasi Ilmu Kelautan Pasifik Utara) melaksanakan proyek yang berjudul “Meningkatkan kemampuan pemantauan pesisir nelayan lokal skala kecil” (akronim FishGIS) yang didanai oleh Kementerian Pertanian, Kehutanan dan Perikanan (MAFF ) Jepang, melalui Badan Perikanan Jepang (JFA), dari Official Development Assistance (ODA) Fund. Proyek ini dimulai pada bulan November 2017 dan selesai pada bulan Maret 2020.
Tujuan umum dari proyek FishGIS adalah untuk meningkatkan kemampuan nelayan skala kecil dan petani ikan untuk memantau ekosistem pesisir dan perikanan pesisir di negara-negara berkembang di Pesisir Pasifik. Fokus proyek ini adalah mengembangkan, mengevaluasi, dan menerapkan penggunaan teknologi ponsel cerdas (smart phone) pemantauan kualitas lingkungan perairan dan status perikanan di perairan pesisir berbasis masyarakat. Menjelang akhir proyek ini, PICES telah bekerjasama dengan para ilmuwan dan pemerintah Indonesia, serta empat kelompok masyarakat pesisir setempat dengan menggunakan Konsep Penelitian Transdisipliner Bumi Masa Depan. Pertanyaan yang perlu dijawab untuk kegiatan proyek ini adalah:
• Bagaimana perubahan global iklim dan ekonomi mempengaruhi ekosistem pesisir? • Bagaimana peningkatan kemampuan pemantauan pesisir nelayan lokal dapat membantu
meningkatkan pengelolaan perikanan di wilayah pesisir?
Beberapa workshops telah diselenggarakan untuk mendesain kerangka kerja sama proyek yang mendasar dengan masyarakat setempat. Melalui kerjasama ini, lima isu penting telah diidentifikasi sebagai kata kunci penting untuk kesejahteraan masyarakat pesisir yaitu : 1) kualitas air, 2) tangkapan ikan, 3) penangkapan ikan ilegal yang tidak dilaporkan (IUU), 4) sampah (plastik), dan 5) alga beracun (Ganggang Merah Berbahaya/HAB). Dengan dukungan ilmiah dari para peneliti PICES, proyek ini mengembangkan dan mengimplementasikan alat pemantauan berbasis smartphone yang berisi aplikasi, metode pengambilan sampel dan protokol pelaporan yang memungkinkan nelayan lokal dan masyarakat pesisir dapat mengumpulkan data dan informasi secara elektronik tentang data dan informasi sumberdaya perikanan dan lingkungan perairan yang relevan dengan kebutuhan pemerintah Indonesia. Mahasiswa dan dosen lokal dilibatkan dalam workshops dan pelatihan untuk membantu dan mendorong keberlanjutan kegiatan pengumpulan data.
Hasil positif dari kegiatan proyek ini adalah: 1) pemerintah Indonesia telah mengagendakan dimasukkannya data yang dikumpulkan masyarakat pesisir dan ilmuwan kedalam Pusat Data Kelautan Nasional Indonesia, 2) masyarakat setempat telah memiliki rasa kebanggaan atas kemampuan mereka

Ringkasan
viii PICES Scientific Report No. 58
dalam kegiatan pemantauan sumberdaya perikanan dan pesisir, 3) aliran data dan informasi ini akan menjadi dasar pengetahuan baru yang secara ilmiah sangat bermanfaat untuk pembangunan ekosistem pesisir dan meningkatkan kesejahteraan masyarakat pesisir Indonesia.

Section 1 Introduction
PICES Scientific Report No. 58 1
1 Introduction
1.1 Background, objectives and the basic approach of the project
Marine and coastal ecosystems are changing as a consequence of proximate and distal causes. These include coastal development and land reclamations, marine and land-derived pollution, overfishing, loss of biodiversity, and climate drivers associated with increasing temperature, ocean acidification and deoxygenation, changing precipitation patterns, and intensified storms. The result of such ecosystem changes is that many coastal communities now face a severe risk of reductions in marine ecosystem services, such as the unstable seafood supply, occurrences of extreme events, harmful algal blooms, and the degradation of the coastal scenery that supports tourism and human wellness. Understanding, anticipating, and reducing or mitigating these risks hinge upon first recognizing the early stages of changes in marine and coastal ecosystems, which in turn relies critically on observations over time.
Marine environmental monitoring traditionally has been the role of public research institutes and often is more logistically demanding and expensive than for terrestrial ecosystems. This monitoring requires costly infrastructures (such as research vessels and satellites), high-technology devices (such as automated buoys), and specialized laboratories. In many cases, even developed nations lack sufficient resources for these observations (IOC-UNESCO, 2017), and the situation in lower- and middle-income countries is even more challenging. Citizen- or community-based monitoring (Conrad and Hilchey, 2010) is an approach designed to improve the efficiency and effectiveness of monitoring efforts when technical and financial resources are not sufficient. There are several successful examples of citizen-based monitoring in developed countries. However, this approach has not been widely applied yet to the collection of environmental and fisheries data in developing nations.
Local fishers and coastal community members are ideal subjects for citizen-science marine observations. They live in the area, fish routinely in coastal waters, and are keen observers of their environment – important features for effective observational programs. In recent years, many people in lower- and middle-income countries also have become empowered with high-technology smartphone devices. The rapid progress in smartphone technologies and application software has made these commonly-used devices a solid foundation for citizen-science and community-based observational programs.
This was the motivation for a PICES project entitled “Building capacity for coastal monitoring by local small-scale fishers (acronym FishGIS; https://meetings.pices.int/projects/FishGIS) and funded by the Ministry of Agriculture, Forestry and Fisheries (MAFF) of Japan, through the Fisheries Agency of Japan (JFA), from the Official Development Assistance (ODA) Fund, which requires the promotion of economic resources in lower- and middle-income countries through the activities of economically mature countries. The project started in November 2017 and was completed in March 2020.

Introduction Section 1
2 PICES Scientific Report No. 58
The overall goal of the FishGIS project was to enhance the capacity of local small-scale fishers and aquaculture 1 farmers to monitor the environmental quality of coastal ecosystems and the status of coastal fisheries in Pacific Rim developing countries using smartphone-based technology. The guiding questions for the project were: a) How do global changes in climate and economy affect coastal ecosystems? b) How may enhanced capacity for monitoring activities by local fishers help to improve fisheries management in coastal areas?
Indonesia was chosen as a developing Pacific Rim country to implement the project. As the largest archipelago in the world, Indonesia has a coastline over 95,000 km long, with a sea area of 5.4 million km2. Indonesia has the world’s second largest fishery, with much of the fishery being attributed to small-scale fishers operating across many islands and coastal communities. However, landings from these capture fisheries have plateaued in recent decades. In many regions, including the Java Sea and Malacca Strait, fish have been declining, presumably because of uncharacterized ecosystem degradation. Indonesia also has in its coastal margin 5.7 million hectares of brackish-water ponds and marine aquaculture farms. Environmental and ecosystem degradation of the coastal zone has been due, in part, to excessive exploitation by intensive aquaculture activities during the 1980s and unintended mis-management of the coastal resources. The importance of having more effective fisheries management practices is widely recognized in Indonesia, and this has led to support by the government and the willingness of stakeholders to consider new approaches such as the development and implementation of a citizen-/fisher-based observation system linked with fisheries scientists and managers. The essential criteria for choosing Indonesia for this project was also the strong collaboration with the Indonesian Agency for the Assessment and Application of Technology (BPPT) and the Indonesian Institute of Sciences (LIPI) developed over previous PICES/MAFF projects – “Development of the prevention systems for harmful organisms’ expansion in the Pacific Rim” (2007–2012) and “Marine ecosystem health and human well-being” (2012–2017). In consultation with our Indonesian partners, four local coastal communities were identified as the locations for case studies – Muara Gembong, Indramayu, Serang and Pelabuhan Ratu (see Section 2 for details).
A Transdisciplinary Research Concept (Framework) was employed in this project, as promoted by Future Earth (Mauser et al., 2013). Essential characteristics of this approach are the “co-design of research agendas” and “co-production of knowledge” (Fig. 1.1). During the project, more than ten meetings were organized with Indonesian government scientists and representatives, and in close collaboration with four local coastal communities, both in Jakarta and on-site, to learn about their future interests, concerns about their environment and fisheries, and to jointly determine and select the most critical observational parameters for their well-being. The major project initiatives developed through this collaboration were:
1. Coastal monitoring activities by local small-scale fishers to detect ecosystems changes (e.g., in water quality and in plankton community composition);
2. Coastal fisheries monitoring activities by local small-scale fishers to improve coastal fisheries management (e.g., information about fishing operations or species composition in the market);
3. Coastal and estuarine water monitoring activities by local small-scale aquaculture farmers to measure the effects of government clean water initiatives on water quality for aquaculture operations.
1 In this report aquaculture refers to shrimp and algae as well as fish.

Section 1 Introduction
PICES Scientific Report No. 58 3
Fig. 1.1 Framework of transdisciplinary research (Mauser et al., 2013).
A number of training workshops were held where PICES researchers worked together with Indonesian scientists and government officers, coastal community members, teachers and students, and non-governmental organizations, to co-develop and implement smartphone-based tools (applications, sampling methods and reporting protocols) that enabled fishers and community members to collect and electronically share environmental and fisheries data with relevant Indonesian government authorities and researchers and, as a result, to improve management practices and the well-being of coastal communities. Consequently, all stakeholders in the project, especially the local people, acquired a sense of ownership for their monitoring activities, which is very important for sustaining these citizen-science data collection programs after the end of the FishGIS project.
Dissemination of citizen-science philosophy, the project objectives, and developed and implemented smartphone-based technologies through training workshops held at the major regional centers (Jakarta, Serang, Pelabuhan Ratu) has attracted additional interest and enthusiasm for utilizing these observation tools in other coastal regions, and for including the resulting citizen-science collected data in the Indonesian National Ocean Data Center for broader use.
1.2 Project formation and funding
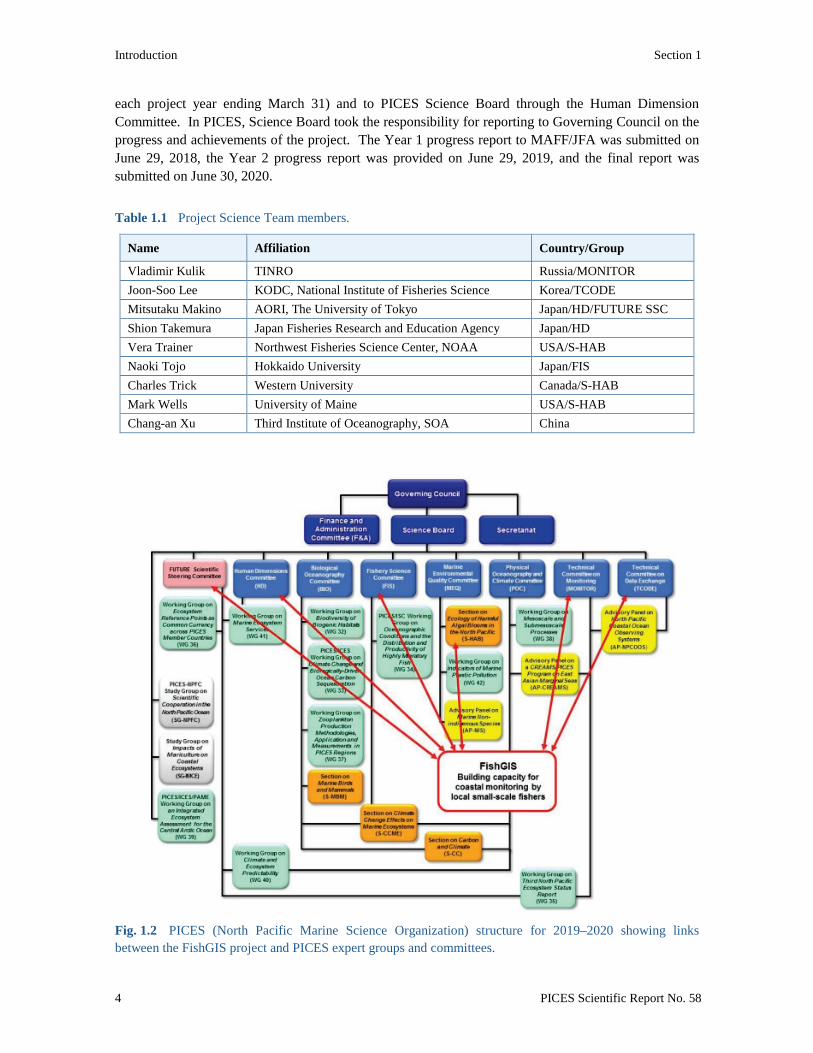
The organizational principles agreed to by MAFF/JFA and PICES are listed in number 3 of Appendix 1. In accordance with these principles, the project was directed by a Project Science Team (PST) formed in December 2017 based on principles and procedures detailed in the PICES Policy for approval and management of special projects (Decision 2017/A/7; https://meetings.pices.int/publications/annual-reports/2017/2017-GC-Decisions-Vladivostok.pdf). All PICES member countries and relevant Scientific and Technical Committees were represented on the PST (Table 1.1 and Fig. 1.2; see also Appendix 2 for contact information for PST members). Drs. Mitsutaku Makino (Japan) and Mark Wells (USA) were appointed as PST Co-Chairmen and were responsible for the detailed planning and execution of the project, and annual reporting on scientific progress to MAFF/JFA (within 90 days after the close of
Introduction Section 1
4 PICES Scientific Report No. 58
each project year ending March 31) and to PICES Science Board through the Human Dimension Committee. In PICES, Science Board took the responsibility for reporting to Governing Council on the progress and achievements of the project. The Year 1 progress report to MAFF/JFA was submitted on June 29, 2018, the Year 2 progress report was provided on June 29, 2019, and the final report was submitted on June 30, 2020.
Table 1.1 Project Science Team members.
Name Affiliation Country/Group
Vladimir Kulik TINRO Russia/MONITOR Joon-Soo Lee KODC, National Institute of Fisheries Science Korea/TCODE Mitsutaku Makino AORI, The University of Tokyo Japan/HD/FUTURE SSC Shion Takemura Japan Fisheries Research and Education Agency Japan/HD Vera Trainer Northwest Fisheries Science Center, NOAA USA/S-HAB Naoki Tojo Hokkaido University Japan/FIS Charles Trick Western University Canada/S-HAB Mark Wells University of Maine USA/S-HAB Chang-an Xu Third Institute of Oceanography, SOA China
Fig. 1.2 PICES (North Pacific Marine Science Organization) structure for 2019–2020 showing links between the FishGIS project and PICES expert groups and committees.
Section 1 Introduction
PICES Scientific Report No. 58 5
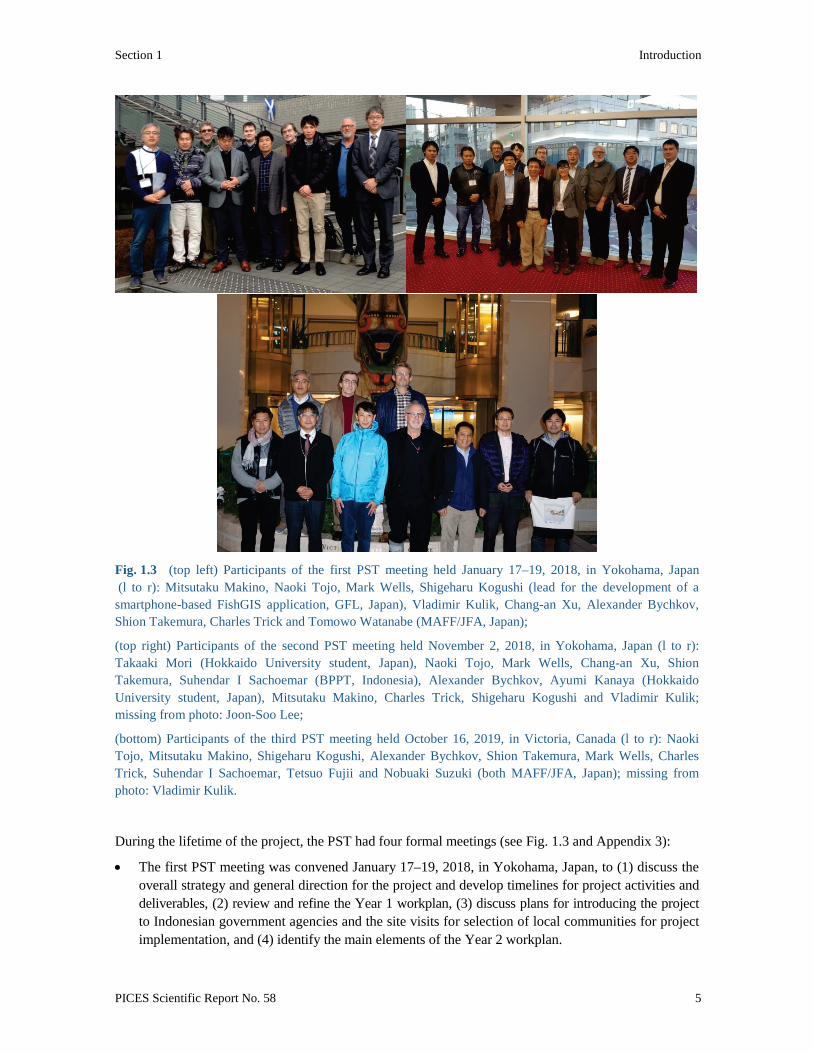
Fig. 1.3 (top left) Participants of the first PST meeting held January 17–19, 2018, in Yokohama, Japan (l to r): Mitsutaku Makino, Naoki Tojo, Mark Wells, Shigeharu Kogushi (lead for the development of a smartphone-based FishGIS application, GFL, Japan), Vladimir Kulik, Chang-an Xu, Alexander Bychkov, Shion Takemura, Charles Trick and Tomowo Watanabe (MAFF/JFA, Japan);
(top right) Participants of the second PST meeting held November 2, 2018, in Yokohama, Japan (l to r): Takaaki Mori (Hokkaido University student, Japan), Naoki Tojo, Mark Wells, Chang-an Xu, Shion Takemura, Suhendar I Sachoemar (BPPT, Indonesia), Alexander Bychkov, Ayumi Kanaya (Hokkaido University student, Japan), Mitsutaku Makino, Charles Trick, Shigeharu Kogushi and Vladimir Kulik; missing from photo: Joon-Soo Lee;
(bottom) Participants of the third PST meeting held October 16, 2019, in Victoria, Canada (l to r): Naoki Tojo, Mitsutaku Makino, Shigeharu Kogushi, Alexander Bychkov, Shion Takemura, Mark Wells, Charles Trick, Suhendar I Sachoemar, Tetsuo Fujii and Nobuaki Suzuki (both MAFF/JFA, Japan); missing from photo: Vladimir Kulik.
During the lifetime of the project, the PST had four formal meetings (see Fig. 1.3 and Appendix 3):
• The first PST meeting was convened January 17–19, 2018, in Yokohama, Japan, to (1) discuss the overall strategy and general direction for the project and develop timelines for project activities and deliverables, (2) review and refine the Year 1 workplan, (3) discuss plans for introducing the project to Indonesian government agencies and the site visits for selection of local communities for project implementation, and (4) identify the main elements of the Year 2 workplan.

Introduction Section 1
6 PICES Scientific Report No. 58
• The second PST meeting was held November 2, 2018, also in Yokohama, in conjunction with the PICES Annual Meeting (PICES-2018). The main objectives of the meeting were to (1) discuss the overall project strategy and timelines for project activities and products, (2) review the outcomes of the July 2018 training workshop and other activities carried out to date, (3) examine on-going data collection and reporting activities for the two initially selected case studies (Muara Gembong and Indramayu), (4) discuss options for an additional case study site, and (5) identify the main elements of the Year 3 workplan.
• The third PST meeting was convened October 16, 2019, in Victoria, Canada, in conjunction with the PICES Annual Meeting (PICES-2019). The main objectives of the meeting were to (1) review the outcomes of the July 2019 training workshop and other activities carried out to date, (2) examine on-going data collections from the four communities involved in the project (Muara Gembong, Indramayu, Serang and Pelabuhan Ratu), (3) plan site visits and the final PST meeting in early 2020, (4) review the timelines for project final reports and products, and (5) discuss the framework for the post-project assessment.
• The final PST meeting was held February 28, 2020, in Jakarta, Indonesia, to (1) examine the results from the training workshops, along with on-going data collections from the four communities involved in the project, (2) review issues related to the FishGIS database transition to the Indonesian government, (3) finalize tasks for the preparation of a final scientific report and other project outcomes, and (4) discuss the directions for modifying and refining smartphone-based observation tools (applications and protocols) developed within the FishGIS project for use in a new MAFF/PICES project on “Building local warning networks for the detection and human dimension of Ciguatera Fish Poisoning in Indonesian communities” (2020–2023).
The financial principles agreed to by MAFF/JFA and PICES are listed in number 4 of Appendix 1. According to these principles, Dr. Alexander Bychkov was appointed by the PICES Executive Secretary to serve as the Project Coordinator and was responsible for the management of the fund and annual reporting on its disposition to MAFF/JFA (within 90 days after the close of each project year ending March 31) and to PICES Governing Council through the Finance and Administration Committee. In PICES, the Finance and Administration Committee took the responsibility for reporting to Governing Council on the financial and management aspects of the project. The Year 1 financial report to MAFF/JFA was provided on June 18, 2018; the Year 2 financial report to MAFF/JFA was submitted on May 17, 2019, and the Year 3 (final) financial report was submitted on May 14, 2020.
1.3 Project timeline
The project was partitioned into three annual segments. During the first segment (November 2017 to March 2018), the PST refined the overall goals and organizational plans for the project and undertook a week-long trip to Indonesia in March 2018, which included (1) an introductory workshop held in Jakarta to communicate these goals and plans to BPPT staff and representatives from other Indonesian agencies, and (2) visits to the communities of Muara Gembong, Indramyu and Cilincing, where the project overview was presented and feedback was received about the problems local fishers and aquaculture farmers faced (see Section 2). Based on these visits, the case study sites were selected and the workshop training was planned and organized.
The main focus of the second segment (April 2018 to March 2019) was on training for the people from Muara Gembong and Indramayu. Due to the small size of both communities, and the lack of well-

Section 1 Introduction
PICES Scientific Report No. 58 7
suited venues, it was decided to bring community leaders, fishers and aquaculture farmers to Jakarta for a 3-day training and implementation workshop in June 2018 (see Sections 3 and 5). Based on the experience gained with Muara Gembong and Indramayu, BPPT staff was confident in recommending fishing and aquaculture communities of Serang and Pelabuhan Ratu as two additional case study sites. A visit of PICES experts to these locations to assess their suitability, combined with introductory workshops and initial training, took place in February 2019 (see Section 2). This time, training was conducted on-site (rather than in Jakarta) as each of these communities was larger in size, and had appropriate venues and a more significant government presence. All workshops in Year 2 followed the same scheme which included reviewing the goals of the project, seeking community feedback on their issues of importance and suggestions for improving the design of smartphone-based applications, providing hands-on practice in the use of the FishGIS and HydroColor applications and phytoplankton observations with Foldscopes, as well as reminding attendees how critical their participation is, both in terms of their own communities and as a demonstration to other Indonesian coastal communities (see Sections 3 and 5). The workshops were primarily led by BPPT and LIPI staff (after a preliminary orientation session for “training of the trainers” run by PICES experts) to facilitate more efficient use of time (vs. PST members teaching with translation), and to emphasize to community members that BPPT and LIPI were the leaders of the efforts in Indonesia, with PICES scientists playing a support role.
In the third segment (April 2019 to March 2020), the emphasis was on the training workshop for members of all four communities involved in the project (Muara Gembong, Indramayu, Serang and Pelabuhan Ratu), held in Karangantu Port of Serang in July 2019 (see Sections 3 and 5). This workshop followed the same protocol as all Year 2 workshops, with an important addition – significant time was devoted to information gathering with community members using a combination of socio-ecology tools such as conversational interviews and “clicker views and discussion”. The aim of this exercise was to assess the “wellness” of the human–fisheries connection and the first results of the use of technology to improve community understanding of the present and future fisheries. The follow-up training workshops were conducted in Serang and Pelabuhan Ratu in February 2020.
The formalized workshop training interactions in Year 2 and Year 3 were interspersed with smaller-scale independent visits to Indramayu in December 2018 and 2019 by a Hokkaido University (HU) team led by one PST member, Dr. Naoki Tojo (see Sections 3 and 5). These visits included practical training with the project observation tools, small-group interviews with fishers and other community members, a “Fisheries Sustainability” game mini-workshop developed by the HU team, and the preparation of an instructive video manual for community-based surveys. This approach, when a single community is used as a “model” or “development” site, enabled closer exchanges between the locals and trainers and helped participants more clearly recognize the need to monitor coastal environment and fisheries resources and landings and how this monitoring could contribute to the sustainability and well-being of their community lives, and improve their understanding of the project tools. The feedback from these communications and in-depth training allowed the team to identify issues that were not readily apparent in the larger-scale training interactions and to better evaluate and refine the design and use of the FishGIS application. These visits also provided an opportunity to collect information on local fisheries, target species, and livelihood of local fishers and aquaculture farmers for socio-economic research.

Introduction Section 1
8 PICES Scientific Report No. 58
1.4 Structure of the report
This report summarizes the integration of standard oceanographic and fisheries practices into smartphone-based technologies, and the refinement of these tools to better meet the needs and observational capacities of marine-dependent communities. Section 1 describes the background, objectives and basic approach (Transdisciplinary Research Concept) of the project and outlines project organization and timelines.
The Indonesian partners who had a key role in this project are introduced in Section 2, along with summaries of the four case study sites ultimately chosen for project implementation. The rationale is provided for the selection of these communities—Muara Gembong and Indramayu Districts on the northern side of Java, Serang (Banten Province) on the western margin, and Pelabuhan Ratu on the southern coast.
Section 3 includes a summary of citizen-science approaches in general, but also discusses how the application of citizen science in fisheries-related observations is extremely limited to date. The central message is that the broad and increasing distribution of smartphones can offer a great potential for establishing effective citizen-science observational programs in developing nations, and Indonesian coastal communities in particular. This Section outlines the experimental tools used in the project and the overall strategy employed for their co-development with community members. Two smartphone applications (FishGIS and HydroColor) and a paper microscope (Foldscope) are then described in detail, including the scientific principles underlying these observation tools.
The process of acquiring observational data only becomes useful when these data can be readily accessed. So, Section 4 covers the current database design implemented during the project lifetime, and the future plans for full database transition to the Indonesian National Oceanographic Data Center.
Section 5 details the implementation steps taken in each of the selected coastal communities, and the challenges encountered during the collaborative introduction and training on the smartphone applications.
Finally, Section 6 presents an overall summary of the project, and lists a series of recommendations to increase the effectiveness and sustainability of the advances made during the project period.
Appendices are included detailing the project principles, PST membership, PST meeting reports, organization/operation of the FishGIS application, calibration effort for converting HydroColor data to chlorophyll concentrations in the coastal regions, papers presented at PICES Annual Meetings, and PICES Press articles related to the project.

Section 2 Case Study: Indonesia
PICES Scientific Report No. 58 9
2 Case Study: Indonesia
2.1 Our Indonesian collaborators
One of the first, and most meaningful, lessons learned from previous PICES/MAFF projects is the importance of connecting with in-country organizations that can facilitate, advance, and inherit the project. These organizations provide the key people who not only understand the project but, most critically, can translate it into the local context. The Indonesian Agency for the Assessment and Application of Technology (Badan Pengkajian dan Penerapan Teknologi; BPPT) was identified as the leading partner to the FishGIS project for two reasons. First, BPPT is a department under the coordination of the Ministry of Research and Technology, and its main priority is the evaluation and formulation of national policies in the assessment and application of technology. Of particular importance is that BPPT historically has managed projects through innovation and capacity development, as well as by nurturing technology transfer to local communities. Second, a productive working relationship with BPPT was established during the previous PICES/MAFF project on “Marine ecosystem health and human well-being” (MarWeB; 2012–2017).
Understanding the presence and significance of harmful algal blooms (HABs) in Indonesian coastal waters was an essential outcome of the FishGIS project, and was facilitated through collaboration with scientists from the Indonesian Institute of Sciences (Lembaga Ilmu Pengetahuan Indonesia; LIPI), many of whom were involved in, and trained, during an earlier PICES/MAFF project on “Development of the prevention systems for harmful organisms’ expansion in the Pacific Rim” (2007–2012). The FishGIS project was able to use this local expertise to help identify phytoplankton composition changes, and the appearance of HAB species at the case study sites.
In March 2018, a group of PICES experts, including all PST members, visited Indonesia in order to communicate the goals and plans for the FishGIS project to BPPT colleagues and representatives from other Indonesian agencies, and to seek their advice on possible approaches for its implementation and suggestions on potential locations for the demonstration case studies. On March 19, 2018, an introductory workshop was held in Jakarta where a Letter of Intent (LOI) between BPPT and PICES was signed as a basis for collaboration on the project (Fig. 2.1).
2.2 Community selection criteria
In collaboration with BPPT, prospective fishing-based communities were selected as demonstration sites. The criteria chosen for evaluating communities suitable for the project centered on six fundamental specifications: (1) logistics, (2) the presence of a strong local coordinator, (3) possession of smartphones by the fishers, (4) community recognition of the relationship between environment and fisheries (wild caught and aquaculture), (5) recognition of existing ecosystem changes by local community members, and (6) the overall interest in the community for education and training. Of these, logistics was the most

Case Study: Indonesia Section 2
10 PICES Scientific Report No. 58
pressing – for budgetary and practicality reasons only small communities within a one-day drive from Jakarta were considered. Also ranking high in the selection process was the choosing of a strong local coordinator who could generate and maintain momentum in the observational program, and finding a substantial number of community fishers who had smartphones. To what degree the community recognized how environmental stress may be affecting their fisheries was used as a proxy to gauge the intensity of their interest, as well as to measure of how involved community members might become when given new tools for observing their environment.
2.3 Case study sites
Through consultation with BPPT, three potential case study sites were identified in the first year of the project: Cilincing, situated on Jakarta Bay of Jakarta Province, and Muara Gembong and Indramayu, located in the northern part of West Java Province, and facing the Java Sea (Fig. 2.2). From March 20–22, 2018, these sites were visited by the PICES Team and BPPT staff to evaluate which had the overall best conditions for implementing the project. Joint meetings and small group interviews were held in each community with local fishers and aquaculture farmers who were interested in hearing about the project, and who were willing to communicate their knowledge of the region (Fig. 2.3). The objective was to learn from the locals about the state of their fisheries, their environment, and their primary concerns for local fisheries. These day-long meetings organized by BPPT and community leaders were well attended by fishers, a significant point given that they were keen to allocate time that otherwise would be devoted to fishing. The vast majority of fishers were found to have smartphones suited to the project, surprising to us at first, but this is a widespread phenomenon in developing nations where landline infrastructures are sparse or do not exist. All sites had sufficient cellular signal strength to support the planned data transfer needs of the smartphone applications.
On completion of these meetings, the three locations were ranked collectively by the PICES Team and Indonesian partners according to the community selection criteria. Muara Gembong and Indramayu were chosen as the initial case study sites for the project. Cilincing was reluctantly ruled out for several reasons, with the main two being the high level of pollution from Jakarta influencing the monitoring of local waters, and that the community and its fishing operations are likely to be in substantial transition or elimination over the next 5 years as a consequence of commercial developments.
Muara Gembong and Indramayu were ideal locations to begin the project, and had similar challenges and marine environmental conditions. These communities are situated on the north Java coast to the east of Jakarta (Fig. 2.2). The nearshore zone there has an extended shallow shelf which has contributed to recent coastal inundation problems. In both cases, the shallow coastal waters contain high suspended sediment loading related to river runoff and wave-induced sediment resuspension, and are influenced to varying degrees by industry, domestic waste, and anthropogenic coastal zone degradation. These coastal areas with high-density population centers have a substantial number of brackish-water and marine aquaculture fisheries farms, and their fisheries resources are dominated by small pelagic fisheries.

Section 2 Case Study: Indonesia
PICES Scientific Report No. 58 11
Fig. 2.1 An introductory workshop held on March 19, 2018, in Jakarta, Indonesia: Signing Ceremony for the Letter of Intent between BPPT, represented by the BPPT Chairman, Mr. Unggul Priyanto, and PICES, represented by Dr. Mitsutaku Makino (top left); PST members and BPPT leadership after the ceremony (top right); Focus Group discussion (bottom left), and Dr. Suhendar I Sachoemar, Director of BPPT Center for Development, Education and Training, leading discussion (bottom right).
Fig. 2.2 The demonstration site locations (green balloons) for the PICES project on “Building capacity for coastal monitoring by local small-scale fishers”. Note that Cilincing was later excluded as a potential site.

Case Study: Indonesia Section 2
12 PICES Scientific Report No. 58
Fig. 2.3 Discussions with local fishers and aquaculture farmers at Muara Gembong (top row), Indramayu (middle row) and Cilincing (bottom row) during visits of the PICES Team and BPPT staff to Indonesian communities considered as potential case study sites in March 2018.
The FishGIS PST members felt that it would be valuable to expand the project to include communities having a different portfolio of local fisheries or different oceanographic characteristics. Two potential case study sites that met the necessary logistical and fisheries needs were suggested by Indonesian partners: Serang city in Banten Province, west of Jakarta, and adjacent to the Sunda Strait, and Pelabuhan Ratu in West Java Province, almost due south of Jakarta (Fig. 2.2). The coastal waters near Serang are less turbid, although the fisheries resources are similar to those in the regions of Muara Gembong and Indramayu. In contrast, the coastal environment off Pelabuhan Ratu is mostly steep and hilly, with little industry and lower population density, and the fishery is dominated by oceanic pelagic fish. Compared with communities in Muara Gembong and Indramayu, those in Serang and Pelabuhan Ratu have more diverse fishing targets, a greater variety of fishing methods and technology levels, and are generally better informed on sustainable resource uses.

Section 2 Case Study: Indonesia
PICES Scientific Report No. 58 13
Fig. 2.4 Visit by the PICES Team and BPPT staff to Indonesian communities considered as potential case study sites in February 2019: Welcome (top) and introduction of the FishGIS project (bottom) at the meeting in Karangantu Port, Serang, on February 4 (left column); and welcome (top) and demonstration of smartphone applications (bottom) in Pelabuhan Ratu on February 6 (right column).
From February 4–7, 2019, two recommended locations, Serang on the north coast and Pelabuhan Ratu in the south, in western Java were visited by the PICES Team and BPPT staff to assess their suitability for implementing the project (Fig. 2.4). After holding joint meetings with fishers and local authorities and small-group interviews, both these communities were selected as additional demonstration sites for the project based on their very different fishery characteristics, their keen enthusiasm to participate in the project, and their logistically feasible travelling distance by car (one day) from Jakarta.

The Tools for Citizen Scientists Section 3
14 PICES Scientific Report No. 58
3 The Tools for Citizen Scientists
3.1 Citizen science – Overall strategy
Productive fisheries and effective environmental management strategies require relevant temporal and spatial observational data. Obtaining these data using traditional scientific surveillance methods is a costly venture. Agencies in developed nations have been turning towards gaining more intensive survey capacity by engaging citizen “scientists” for environmental data collections (Stewart, 1954; Silvertown, 2009; Dickinson et al., 2010). Citizen-scientist participation not only plays a significant role in ecological monitoring, but also enhances projects related to, but not limited to, climate change, water quality monitoring, invasive species, conservation biology, population ecology, and ecological restoration. These efforts introduce challenges (e.g., data quality and verification), but the advancement of technology over the past decade, with increased internet access and smartphones with sensors having global positioning and high-resolution camera functionality, has enabled citizen-science approaches to expand the normal geographical and logistical boundaries that apply to scientific data collections (e.g., online sites at eBird, https://ebird.org/; iNaturalist, https://www.inaturalist.org/). However, with few exceptions (Humber et al., 2017) this approach has not yet been widely applied for collecting environmental and fisheries data.
Involving citizen science with smartphone-based observation tools becomes even more critical for developing nations with limited capacity for environmental monitoring, such as for coastal fisheries. In Indonesia, as in many lower- and middle-income countries, fisheries and marine resources are often the economic mainstay of coastal communities. Unfortunately, active management to improve and sustain these resources, which are facing extreme stress, is currently data-limited.
The strong connection of local communities in Indonesia to coastal resources provides a solid foundation for developing effective citizen-science observational programs. Centering the surveillance program on smartphone-based tools is an effective approach to data collection, transfer, and compilation. The number of smartphone users in Indonesia has increased rapidly in recent years, rising from 54,494,000 in 2017 to 83,907,000 in 2019. Indonesia currently has the sixth largest number of smartphone users in the world (newzoo, https://newzoo.com/; Wikipedia, 2020), with 90% of all smartphones being Android devices. The extensive use of smartphones in Indonesia offers a creative potential for implementing community-based monitoring in this country.
The overall goal of the FishGIS project was to enhance the capacity of local small-scale fishers and aquaculture farmers to monitor the environmental quality of coastal ecosystems and the status of coastal fisheries in Indonesia. The focus of the project was on developing and implementing smartphone-based observation tools that are readily available to the majority of community members to enable detection and recording of key parameters for fisheries management, and that facilitate or automate the uploading of these data to a central database that can be accessed by Indonesian government agencies and university researchers. The purpose of these efforts was twofold: (1) to empower local coastal community

Section 3 The Tools for Citizen Scientists
PICES Scientific Report No. 58 15
members to understand and respond to a changing environment, and (2) to provide relevant government agencies with vital datasets to better evaluate, manage, and regulate these community and national resources.
Two smartphone applications were coupled to accomplish the project objectives: FishGIS, a new application developed within the project (Section 3.2), and HydroColor, an existing application that optically measures aspects of water quality (Section 3.3). Added to these efforts was the utilization of an existing low-cost paper (origami) microscope platform to sample the plankton community for toxic or otherwise harmful algal species (HABs). The HAB portion of the project focused on training in the use of this microscope resource (Foldscope) coupled to smartphone image recording (Section 3.4).
The citizen-science observational program was divided into the data collection stage and the data storage/sharing stage (Fig. 3.1). Fishers, aquaculture farmers, and other participating community members used their smartphone applications and camera to collect data that were then uploaded to a cloud-based database that, in turn, could be accessed by Indonesian government agencies and university researchers. Data and image uploads occur in real time if cellular connections are strong. In most cases, fishers collecting data at sea did not have an adequate cellphone signal for transmission, so the application was designed to temporarily store collected data that could be manually uploaded to the server when the cellphone signal is strong (e.g., when returning to port). In addition, the fishers could receive data from the server to view and edit the results of their reports on their smartphones. Plankton images collected with Foldscope were sent by e-mail directly to LIPI for species identification by HAB experts. The datasets from FishGIS, HydroColor and Foldscope could be compiled into monthly status reports by BPPT and LIPI staff to be provided back to the community.
Fig. 3.1 Concept of the FishGIS smartphone application (FishGIS Service).

The Tools for Citizen Scientists Section 3
16 PICES Scientific Report No. 58
3.2 The FishGIS application design and development
3.2.1 Application design
The FishGIS smartphone application was founded on fundamentals learned from a previous citizen-science observational program of a mangrove forest in Japan. That earlier application was made for community members to monitor habitat conditions for the largest mangrove forest in Okinawa, the Okukubi River system, degraded by infrastructure construction, such as bridges, and the expansion of dam capacity (Takemura, 2017). The goal of the project was to improve mangrove conservations through observations of dead trees, seedlings, and different tree species by using the convenient, user-friendly, high performance, and geo-location capabilities of modern smartphones as a tool for citizen scientists.
A transdisciplinary approach (see Section 1), involving PICES experts, Indonesian government scientists and representatives, and members of local communities, was used in the development of the FishGIS application (Fig, 3.2). A draft strategy for the application design, created at the first PST meeting in January 2018, was reviewed and discussed with BPPT and LIPI staff and community members of Muara Gembong, Indramyu and Cilincing during a visit of PICES experts to Indonesia in March 2018. Taking into account their comments and suggestions, most critical observational parameters were jointly determined, and an initial version (Ver. 0) of the FishGIS application was co-designed (Fig. 3.3). The keystone parameters selected for monitoring were: (1) water quality (turbidity, suspended particulate matter, and chlorophyll), (2) fish catch, (3) Illegal Unregulated and Unreported (IUU) fishing, (4) floating garbage (plastics), and (5) toxic phytoplankton (i.e., red tides, or harmful algal blooms (HABs)).
Fig. 3.2 Transdisciplinary research approach for developing the FishGIS application.
During the project, a number of training and implementation workshops were conducted for members of four communities involved in the project (Muara Gembong, Indramayu, Serang and Pelabuhan Ratu), as well as for Indonesian researchers and central and local government officers. All workshops (in July 2018, February and July 2019, and February 2020) included hands-on training sessions and meetings to seek community feedback on the observational parameters of importance, the FishGIS application design, and the ease of operating FishGIS. These workshops were interspersed with “trial surveys” held

Section 3 The Tools for Citizen Scientists
PICES Scientific Report No. 58 17
in Indramayu in December 2018 and 2019 – smaller-scale in-depth on-site practical training that enabled closer exchanges between the locals and trainers to better evaluate the design and use of the FishGIS application. The feedback from each workshop/trial served as a base to refine and improve the application for demonstration in subsequent training courses, with the cycle continuing over the course of the project.
Local fishers, for example, identified gaps with respect to listings of fish species in the application, and that required adding some species and re-categorizing them based on the ecological characteristics in their fishing grounds (Fig. 3.4, left). In addition, government officers indicated the necessity of refining and re-categorizing the application list of illegal fishing gears for Indonesian waters, and assisted with this task (Fig. 3.4, right). A detailed, screen-by-screen summary of the current version of the FishGIS application is included in Appendix 4.
Fig. 3.3 Screenshots of the FishGIS application.
Fig. 3.4 Examples of the modifications in the FishGIS application based on comments from local stakeholders: “Before” and “After” panels for fish species (left) and for Illegal Unregulated and Unreported (IUU) fishing gears (right).

The Tools for Citizen Scientists Section 3
18 PICES Scientific Report No. 58
Another modification to the initial application included converting (“downgrading”) it to function on older smartphone operating systems (Android and Apple) to comply with older devices still being used by the vast majority of the local fishers2. One issue noted by the PST was that further updating of the Android and Apple operating systems may generate conflicts and render components of the application inoperable. Thus, it will be necessary to carefully consider application development and support policies, such as identifying the users of the FishGIS application and focusing resources on the operating system appropriate for the majority of them.
As noted in Section 3.1, cell phone signals often are weak to non-existent at the coastal fishing grounds in Indonesia. The initial application was also modified so that data could be collected and stored temporarily on the fisher’s smartphone while at sea, and then sent to the server when the fisher returned to cellphone range.
3.2.2 FishGIS reports
One of the more difficult aspects of the project, and one still under development, is designing data reporting formats for the local communities, that is, what information is most desired by community members, some of which may not always have a practical role in their decision-making. This perspective will be best decided as the datasets grow, but it is expected to comprise visualization styles that include data maps as well as graphical formats that can be easily interpreted. Examples of the types of mapping output that can be created from the FishGIS database are shown in Figure 3.5 using hypothetical data (data view from the HydroColor application was integrated into the FishGIS platform).
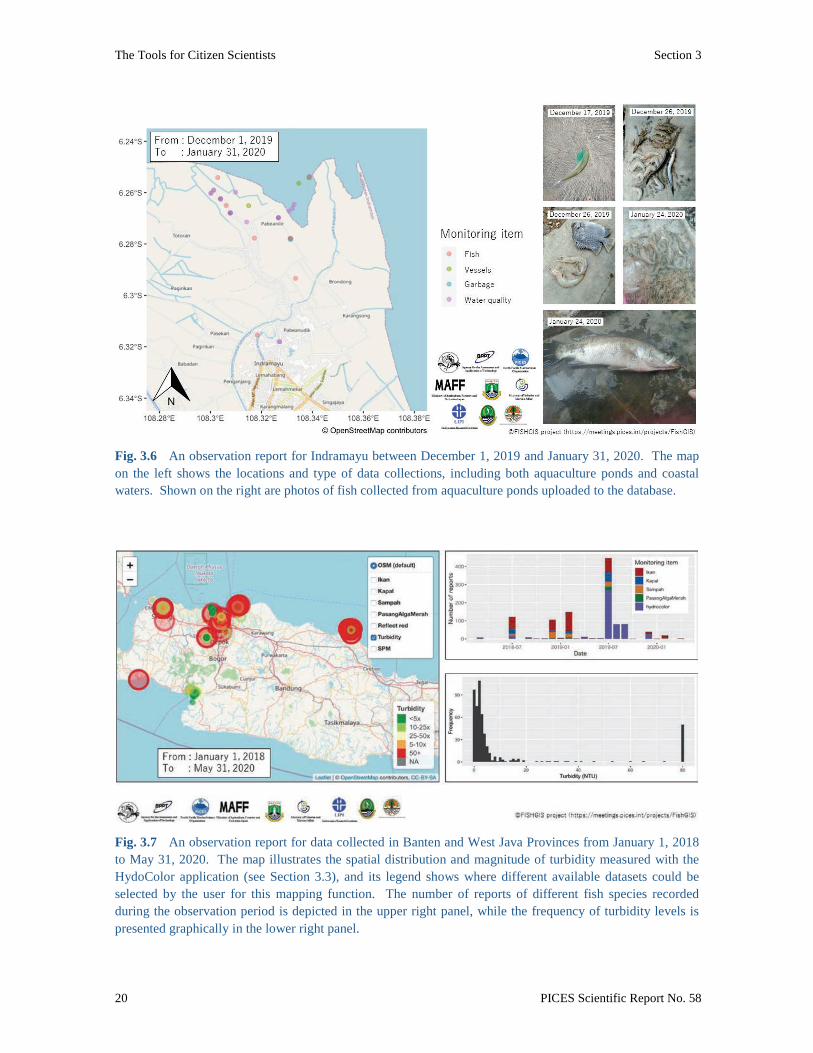
At present, the datasets generated by the four study site communities are thin, given that with refinements the application was in active use for only the latter part of the project. Nevertheless, an example report prepared based on data submitted by fishers and aquaculture farmers in Indramayu over a 2-month period provides information on fish, illegal fishing vessels, garbage, and water quality in both nearshore coastal waters and in fish aquaculture ponds (Fig. 3.6). Another example report presents turbidity levels based on data collected in the Banten and West Java Provinces between January 1, 2018 and May 31, 2020 (Fig. 3.7). These observation report examples show the data visualization capabilities from the FishGIS application/data system. The parameters of interest can be easily selected, viewed and edited in the data visualization program. The intent is that as the observations build, BPPT and community extension officers will help to refine the data visualizations most valuable to the communities, and then generate monthly reports for community circulation.
2 While cell phones are common in Indonesia, many of the devices in use rely on older versions of the Android operating system. Therefore, it was necessary that the observational applications would function on both old and newer operating systems (Android 4.4.4–10; IOS 5.0-13.1) so that the platforms would be available to as many fishers as possible. To be effective, the applications also needed to be reasonably simple to use and enter data, with few steps or automation where possible.

Section 3 The Tools for Citizen Scientists
PICES Scientific Report No. 58 19
Fig. 3.5 Examples of the data visualization the FishGIS reporting can provide as these datasets grow. Depicted are maps of hypothetical observations in Jakarta Bay showing the distribution of fish species, catch trends (size and amount), the presence of illegal fishing vessels, floating garbage, and turbidity data provided by the HydroColor application.
The Tools for Citizen Scientists Section 3
20 PICES Scientific Report No. 58
Fig. 3.6 An observation report for Indramayu between December 1, 2019 and January 31, 2020. The map on the left shows the locations and type of data collections, including both aquaculture ponds and coastal waters. Shown on the right are photos of fish collected from aquaculture ponds uploaded to the database.
Fig. 3.7 An observation report for data collected in Banten and West Java Provinces from January 1, 2018 to May 31, 2020. The map illustrates the spatial distribution and magnitude of turbidity measured with the HydoColor application (see Section 3.3), and its legend shows where different available datasets could be selected by the user for this mapping function. The number of reports of different fish species recorded during the observation period is depicted in the upper right panel, while the frequency of turbidity levels is presented graphically in the lower right panel.

Section 3 The Tools for Citizen Scientists
PICES Scientific Report No. 58 21
3.2.3 Manual development
The FishGIS application was originally designed using the English language as the interface, and then it was converted to an Indonesian Bahasa version (IKAN-GIS) for use in the local communities. Based on the FishGIS operation manual, BPPT staff prepared a version in Bahasa and, with guidance from PICES experts, led the training workshops for community members on how to use IKAN-GIS application (Fig. 3.8). The training materials covered how to install the application onto the smartphones, the structure and operation of the application, and provided data collection examples.
Fig. 3.8 The operation manual in Bahasa language and scenes from presentations on the use of the IKAN-GIS application by BPPT researchers at the training workshops.

The Tools for Citizen Scientists Section 3
22 PICES Scientific Report No. 58
Questions posed by the participants and problems with the use of the application during the demonstrations helped to guide the PST in improving the application’s functionality so that the early phase manual was significantly revised and expanded. However, while valuable during the training, the written and pictured manual was not as well suited for community members afterwards, and many of them experienced some confusion when using the application after the workshops. It was decided then to develop training videos, in Bahasa, on the different aspects of application usage. This step was beneficial as it provided an opportunity to communicate, using non-scientific language, the goal and meaning of sustainable fisheries, and the scientific purpose and value of participating in the project. These videos are in the final stages of preparation at the time of writing this report.
3.3 The HydroColor application
The water quality assessment HydroColor application (Apple App Store, Google Play Store, Facebook page) uses the power of smartphone photographic capabilities to analyze surface waters optically, and is available for both Android and iPhone products. The following is a synopsis of a detailed explanation provided by the application developer (Thomas Leeuw; http://misclab.umeoce.maine.edu/research/HydroColor.php).
The HydroColor application is based on the same general principles as that used for Ocean Color satellites. It employs the light emission from water surfaces, normalized to the incoming radiation, to calculate the water backscattering coefficient, which is inversely proportional to the water absorption coefficient. Particles suspended in the water increase turbidity, and thus the intensity of light emanating from the surface. These particles can include phytoplankton, which contain pigments, organic detritus, and inorganic suspended solids, all of which modulate the color of light leaving the water surface. These compounds are diagnosed by considering the radiance ratios at different wavelengths (colors). Dissolved organic particles absorb light but scatter it to only a small extent, and thus increases in the concentration of these particles lead to a decrease in the intensity of light leaving the water surface. Chlorophyll concentrations, a measure of phytoplankton biomass, can be determined based on the intensity ratios of colors measured by satellites (Blondeau-Patissier et al., 2014) and pocket cameras (Goddjin-Murphy, 2006, 2009). With the smartphone camera, HydroColor has taken this principle further by using a robust measure of reflectance to provide an estimate of water turbidity.
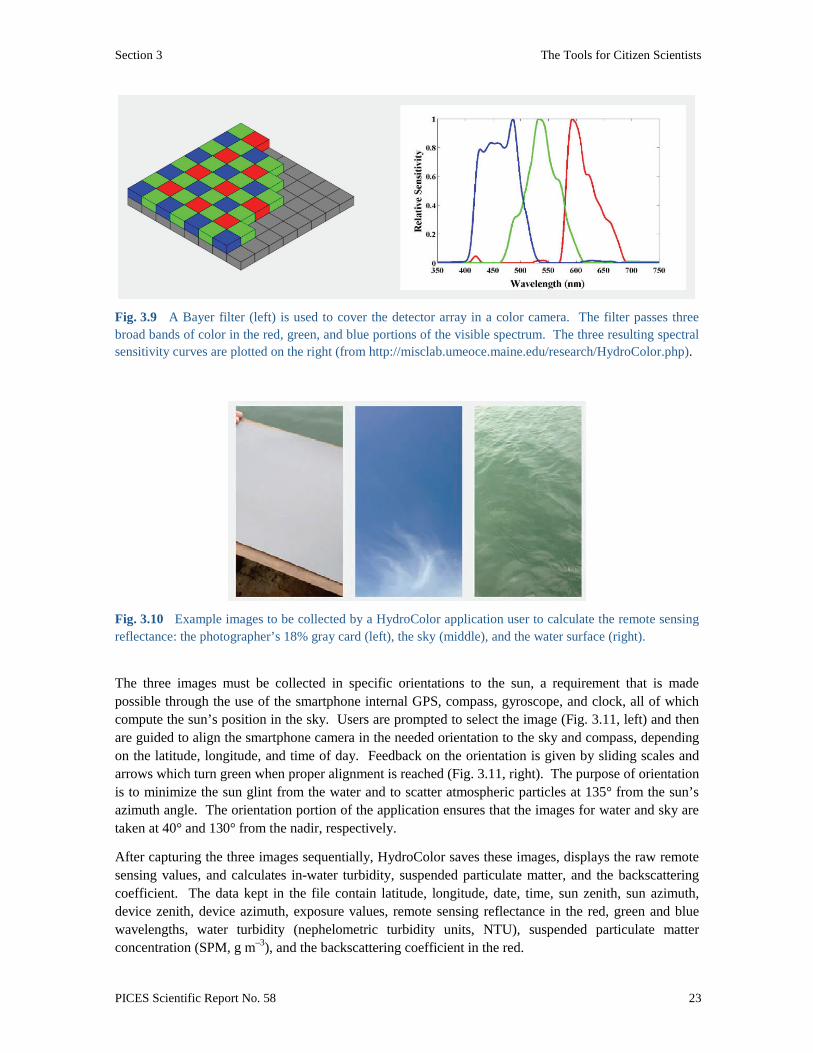
The basic premise of HydroColor is similar to that used with precision radiometers (Mobley, 1999). Three images are collected by the user—one of the water surface, one to correct the light intensity for sun glint off the water surface, and one to normalize these images for the total incoming radiation. Smartphone color cameras utilize a Bayer filter (Fig. 3.9, left) over the detector array in a color camera that separates the light into three broad bands of color: red, green, and blue portions of the visible spectrum. Color images are created by mixing these wavelength bands in different proportions. Through these images, HydroColor calculates remote sensing reflectance in the red (R), green (G), and blue (B) wavelengths (Fig. 3.9, right). The absolute or relative magnitude of this RGB reflectance is used to calculate chlorophyll and turbidity in a water body.
The HydroColor application allows users to collect images of the water surface to gather reflectance data, an image of the sky to collect data on incoming radiation, and an image of a photographer’s gray card (a gray sheet of paper that has 18% reflectance of visible light which is used by photographers to refine exposure settings; Fig. 3.10). Gray cards are available in both paper and plastic (waterproof) formats from local suppliers and were provided free of charge to participating community members.
Section 3 The Tools for Citizen Scientists
PICES Scientific Report No. 58 23
Fig. 3.9 A Bayer filter (left) is used to cover the detector array in a color camera. The filter passes three broad bands of color in the red, green, and blue portions of the visible spectrum. The three resulting spectral sensitivity curves are plotted on the right (from http://misclab.umeoce.maine.edu/research/HydroColor.php).
Fig. 3.10 Example images to be collected by a HydroColor application user to calculate the remote sensing reflectance: the photographer’s 18% gray card (left), the sky (middle), and the water surface (right).
The three images must be collected in specific orientations to the sun, a requirement that is made possible through the use of the smartphone internal GPS, compass, gyroscope, and clock, all of which compute the sun’s position in the sky. Users are prompted to select the image (Fig. 3.11, left) and then are guided to align the smartphone camera in the needed orientation to the sky and compass, depending on the latitude, longitude, and time of day. Feedback on the orientation is given by sliding scales and arrows which turn green when proper alignment is reached (Fig. 3.11, right). The purpose of orientation is to minimize the sun glint from the water and to scatter atmospheric particles at 135° from the sun’s azimuth angle. The orientation portion of the application ensures that the images for water and sky are taken at 40° and 130° from the nadir, respectively.
After capturing the three images sequentially, HydroColor saves these images, displays the raw remote sensing values, and calculates in-water turbidity, suspended particulate matter, and the backscattering coefficient. The data kept in the file contain latitude, longitude, date, time, sun zenith, sun azimuth, device zenith, device azimuth, exposure values, remote sensing reflectance in the red, green and blue wavelengths, water turbidity (nephelometric turbidity units, NTU), suspended particulate matter concentration (SPM, g m–3), and the backscattering coefficient in the red.

The Tools for Citizen Scientists Section 3
24 PICES Scientific Report No. 58
Fig. 3.11 The HydroColor application interface showing prompts for the three images to take: gray card, sky, and water (left). On selecting the image, the screen changes to display the inclinometer and compass to guide the user to the correct smartphone angle to capture the image (right). When the green elements of the compass and inclinometer are properly aligned with the green triangles, the capture button turns green, enabling the photo to be taken.
The reflectance data obtained by remote (satellite) sensing are used to calculate the in-situ surface water chlorophyll concentrations in ocean waters. The same is possible with data collected with HydroColor. Unlike offshore waters, most coastal and many shelf waters are influenced by terrestrial runoff that elevates concentrations of colored dissolved organic matter and suspended organic matter; both factors alter reflectance data and thus estimates of chlorophyll using standard algorithms. However, by comparing HydroColor optical measurements of reflectance against standard laboratory measurements of chlorophyll concentrations in the same surface waters, appropriate calibrations can be made to convert HydroColor data to chlorophyll concentrations in those regions. This calibration effort has begun (see Appendix 5) and will continue over the next few years.
Each training workshop during the FishGIS project included a session in which the participants learned how to download, install, and operate the HydroColor application. Initial training was conducted on land to learn the photograph orientation system, followed by practical on-water training on shoreside (e.g., pier) visits or short vessel trips. The original HydroColor application uses English as the interface (see for example Fig. 3.11), but through working with the application developer, Thomas Leeuw, a translated version of the application was developed in Indonesian Bahasa during the project. The normal $3 USD fee for downloading the application also was generously waived for the translated version to encourage its use in Indonesia. Video training segments on HydroColor use were created during the project that were designed to “train the trainers”, and additional training videos in Bahasa are being prepared by BPPT for community members.
Currently HydroColor data are uploaded by the user with a single button and integrated directly with the FishGIS database, where data visualization reports on water quality can be generated (see Section 3.2.2; Figs. 3.5–3.7). Future plans are to have this upload occur automatically when the user is in, or moves into, cellphone range.

Section 3 The Tools for Citizen Scientists
PICES Scientific Report No. 58 25
3.4 Foldscopes The health and welfare of fishing communities depends as much on seafood safety as sustainable fisheries. Natural changes of phytoplankton community composition at times can lead to the prevalence of species that produce potent neurotoxins that bioaccumulate into wild and aquacultured fish and shellfish, ultimately impacting human health. In some cases, these events are sufficiently intense that they are visible as red colorations of the water (“red tides”, more commonly termed harmful algal blooms (HABs)), but in the vast majority of these HAB events cell numbers are too small to detect without microscopic examination. Although most commercial operations use sophisticated toxin analyses to ensure the safety of their products, local community-scale fishers remain at risk.
Identifying toxic phytoplankton species through microscopic examinations has been the mainstay of seafood safety programs in many developed nations, but these programs have depended on expensive microscopic tools which are beyond the practicalities of small-scale fisheries in developing nations. The situation has changed with the development of powerful paper (origami) microscopes (Foldscope Instruments; www.foldscope.com). Foldscope is a portable, durable, and ultra-affordable paper microscope that performs on par with conventional research microscopes (140X magnification and 2-micron resolution) (Fig. 3.12). Foldscope can be used by holding it up to the eye or by connecting it to a smartphone, and its camera then can be used to capture photos or videos of swimming phytoplankton. The image quality is suitable for a taxonomic diagnostic.
Fig. 3.12 The Foldscope microscope uses a glass ball as a lens and can generate images of phytoplankton cells that are equivalent to high cost laboratory microscopes.
Each training workshop during the FishGIS project included a session where the attendees worked in teams to build (fold) the microscopes from kits, and then to view live phytoplankton samples. Although highly enthusiastic (it was the first time they had seen what was in their waters at a microscopic level), routine operation of Foldscopes for observing phytoplankton still requires more extensive training and experience. One or two individuals from each community were identified as interested and capable of performing this activity. Recorded images are sent to the LIPI National HAB Laboratory, the central organization responsible for HAB monitoring in Indonesian waters, for rapid identification, greatly increasing LIPI’s ability to obtain samples from regions it could not adequately cover under normal circumstances. In cases where toxic species are identified, timely warnings to the community can be issued through the FishGIS application.

Database Development Section 4
26 PICES Scientific Report No. 58
4 Database Development
4.1 Current design
A database generally reflects “a large amount of information stored in a computer system in such a way that it can be easily looked at or changed” (definition from the Cambridge Academic Content Dictionary©, Cambridge University Press). However, the FishGIS project is much more than just a database – it is the Geographical Information System (GIS), as reflected in the project and application acronym (FishGIS).
GIS (Harvey, 2008) was first defined as “a system of hardware, software, data, people, organizations and institutional arrangements for collecting, storing, analyzing, and disseminating information about areas of the earth” (Duecker and Kjerne, 1989). Although this definition may shift depending on the area of study, GIS always is based on a computerized information system like a database, where all information is linked to a geographic (spatial) reference – latitude/longitude or other spatial coordinates (Venkatramanan et al., 2019). Most modern databases include support for geographic types of data and may have spatial extensions with support for referenced geographic operations and more complex functions.
The FishGIS application is a framework of databases that allows for the layering of information on base maps. This information is collected and stored in separate files in a large database to enable the representation of the information onto a coordinated, geo-localized base map. Thus, for FishGIS to be valuable for a visual understanding of the data, all samples must be properly geo-located in time and space. As such, photos of fish catch, floating garbage, or IUU vessels are automatically identified by latitude and longitude and can either singularly or in combination be layered with matching coordinates. The same is true for the water characteristics taken with the HydroColor application (automatically coded position) and associated water samples for HAB analysis using Foldscope. To achieve these visuals, the FishGIS application was developed using the world’s most advanced open source object-relational database PostgreSQL (https://www.postgresql.org/about/). It has a spatial database extension PostGIS (Strobl, 2008).
In practical terms, the FishGIS project design included three stages for data handling: (1) establishing the preliminary database on a server in Japan during development of the application, (2) creating a parallel server in Indonesia that duplicated the primary server, and (3) transitioning the primary server to Indonesian control. The first two stages were completed during the FishGIS project timeline, and transitioning the primary server to Indonesia has begun and will be continued during a new PICES/MAFF project on “Building local warning networks for the detection and human dimension of Ciguatera Fish Poisoning in Indonesian communities”) to further refine the smartphone-based application for use in Indonesia.
Currently, the FishGIS application and server is maintained by Green Front Research Laboratory (GFL, Japan), the designer of FishGIS Service. For practical and efficient facilitation during the development

Section 4 Database Development
PICES Scientific Report No. 58 27
of the FishGIS application, the data transmitted by fishers, aquaculture farmers and other community members are first stored temporarily in the database on the server in Japan before being transferred to a parallel existing database at BPPT in Indonesia (Fig. 4.1). All uploaded attribute and spatial data are kept in a table with geographical data type supported by the PostGIS extension to the PostgreSQL database connected with FishGIS Web Service. These data can be streamed to GeoJSON format in real time or exported to many other GIS formats supported by PostGIS. Researchers and administrators in Indonesia then can visualize and analyze available data using templates of scripts and prototypes of programs prepared by the FishGIS Team in RStudio (https://rstudio.com) or using their own software or open source GIS for desktops or servers, e.g., Leaflet.js (https://github.com/Leaflet/Leaflet).
Fig. 4.1 Current design of database management.
The FishGIS Team provided several simple examples of how this data can be compiled automatically into status reports that BPPT can use for environmental and fisheries assessments (see Section 3.2.2 for details). It is hoped that the status reports will serve as an important feedback mechanism about the current state of the coastal environment to those who participated in the study. Prototype status report formats have been developed in collaboration with BPPT and local community members, with the latter focusing on the information that will be most beneficial to the local fishers and their communities. It is expected that these reports likely will evolve with future expansion of the project.
4.2 Future goals for database development
The long-term goal of the FishGIS project and future citizen-science-based monitoring programs is for data collections to be controlled by the Indonesian government and for data not to be stored in databases situated in other countries. Preparations began in July 2019 to lay the groundwork for transferring

Database Development Section 4
28 PICES Scientific Report No. 58
FishGIS Service from Japan to Indonesia (Fig. 4.2). FishGIS Service will operate as a Virtual Machine on the Indonesian-based server, maintained by BPPT, while GFL will support the application through remote access from Japan. The Virtual Machine will be directly accessible only by GFL, thus protecting the GFL’s copyright to FishGIS Service, while all data will be transferred to cloud storage on the BPPT server, the point of access for interested Indonesian government agencies and researchers and their corresponding collaborators, including the FishGIS PST. Also, the data will be automatically exported to, and managed by, the Indonesian National Ocean Data Center, where linkages to other environmental datasets will be possible. According to PICES’ data management policy, PICES will respect the ownership rights and any restrictions placed on these data by the Indonesian government. It is planned that this transfer will be completed before the full-scale operation of FishGIS Service begins.
Fig. 4.2 Goals for future database management.
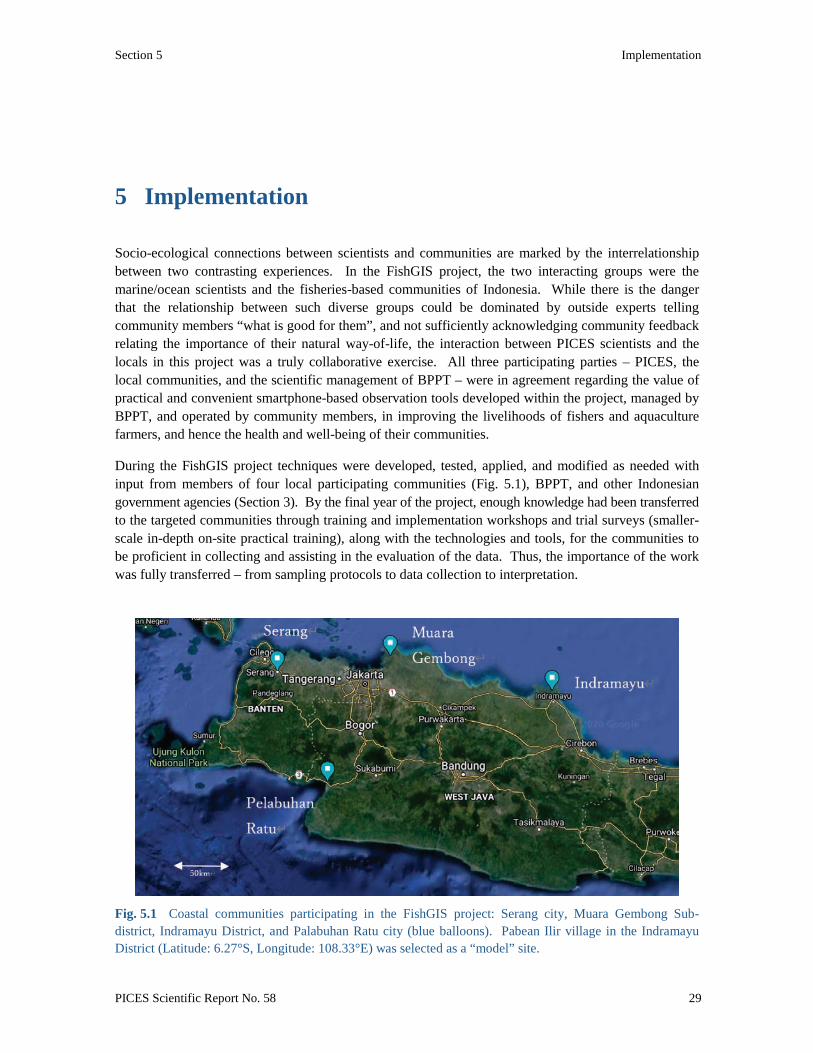
Section 5 Implementation
PICES Scientific Report No. 58 29
5 Implementation
Socio-ecological connections between scientists and communities are marked by the interrelationship between two contrasting experiences. In the FishGIS project, the two interacting groups were the marine/ocean scientists and the fisheries-based communities of Indonesia. While there is the danger that the relationship between such diverse groups could be dominated by outside experts telling community members “what is good for them”, and not sufficiently acknowledging community feedback relating the importance of their natural way-of-life, the interaction between PICES scientists and the locals in this project was a truly collaborative exercise. All three participating parties – PICES, the local communities, and the scientific management of BPPT – were in agreement regarding the value of practical and convenient smartphone-based observation tools developed within the project, managed by BPPT, and operated by community members, in improving the livelihoods of fishers and aquaculture farmers, and hence the health and well-being of their communities.
During the FishGIS project techniques were developed, tested, applied, and modified as needed with input from members of four local participating communities (Fig. 5.1), BPPT, and other Indonesian government agencies (Section 3). By the final year of the project, enough knowledge had been transferred to the targeted communities through training and implementation workshops and trial surveys (smaller-scale in-depth on-site practical training), along with the technologies and tools, for the communities to be proficient in collecting and assisting in the evaluation of the data. Thus, the importance of the work was fully transferred – from sampling protocols to data collection to interpretation.
Fig. 5.1 Coastal communities participating in the FishGIS project: Serang city, Muara Gembong Sub-district, Indramayu District, and Palabuhan Ratu city (blue balloons). Pabean Ilir village in the Indramayu District (Latitude: 6.27°S, Longitude: 108.33°E) was selected as a “model” site.

Implementation Section 5
30 PICES Scientific Report No. 58
The training and implementation workshops and trial surveys conducted in Year 2 (April 2018 to March 2019) and Year 3 (April 2019 to March 2020) are summarized in Table 5.1. Several dozen members from the initial two communities (Muara Gembong and Indramayu) were brought to Jakarta for the first workshop in July 2018 for logistical reasons and to help inform other Indonesian government agencies about the project and its longer-term goals. For the two other communities (Serang and Pelabuhan Ratu), training was conducted on-site (rather than in Jakarta) as each of these communities was larger in size, and had appropriate venues and a more significant government presence.
Table 5.1 FishGIS training and implementation workshops and trial surveys in Indonesia.
Dates Venue Type of activity Target communities July 10–12, 2018 Jakarta workshop Muara Gembong, Indramayu December 11–13, 2018 Pabean Ilir/Indramayu trial survey Pabean Ilir February 4, 2019 Karangantu Port/Serang workshop Serang February 6–7, 2019 Pelabuhan Ratu workshop Pelabuhan Ratu July 10–11, 2019 Karangantu Port/Serang workshop Muara Gembong, Indramayu,
Serang, Pelabuhan Ratu December 15–17, 2020 Pabean Ilir/Indramayu trial survey Pabean Ilir February 25, 2020 Karangantu Port/Serang workshop Serang February 27, 2020 Pelabuhan Ratu workshop Pelabuhan Ratu
All workshops in Year 2 followed the same protocol, namely reviewing the goals of the project, seeking community feedback on their issues of importance and suggestions for improving the design of smartphone-based applications, providing hands-on practice in the use of the FishGIS and HydroColor applications and phytoplankton observations with Foldscope (Section 3), as well as reminding attendees how critical their participation is, both in terms of their own communities and as a demonstration to other Indonesian coastal communities (Fig. 5.2). The workshops were primarily led by BPPT and LIPI staff (after a preliminary orientation session for “training of the trainers” run by PICES experts) to emphasize to community members that BPPT and LIPI were the leaders of the efforts in Indonesia, with PICES scientists playing a support role.
For Year 3 workshops (Figs. 5.3 and 5.4), the protocol had an important addition – significant time was devoted to information gathering with community members using a combination of socio-ecology tools such as conversational interviews and “clicker views and discussion”. The aim of this exercise was to assess the “wellness” of the human–fisheries connection and the first results of the use of smartphone-based technology to improve community understanding of the present and future fisheries.
At its second meeting (November 2, 2018), the PST learned that data uploads from the communities of Muara Gembong and Indramayu were sparse, and agreed that this fact was signaling not only were there technical difficulties in using the smartphone applications but that there also was the lack of understanding of how the collected data would be used and would contribute to the daily life and well-being of their communities. Smaller-scale on-site training was recommended as the appropriate way to help re-establish the initial enthusiasm for the project, and to clarify the benefits to the communities. In December 2018 and 2019, a Hokkaido University (HU) team led by Dr. Naoki Tojo visited Pabean Ilir, a coastal village of about 500 people in the Indramayu District (Fig. 5.1 and Table 5.1). These visits included practical training with the project observation tools, small-group interviews with fishers and other

Section 5 Implementation
PICES Scientific Report No. 58 31
community members, a “Fisheries Sustainability” game mini-workshop developed by the HU team, and the preparation of an instructive video manual for community-based surveys (Figs. 5.5 and 5.6). The outcome was that participants were able to more clearly recognize the underlying reasons for the monitoring activities and how this monitoring could contribute to the sustainability and well-being of their community lives, improve their understanding of the project tools, and effectively navigate through the smartphone applications to successfully collect environmental and fisheries data. This approach – when a single community is used as a “model” or “development” site – enabled closer exchanges between the locals and trainers to better refine and evaluate the design and use of the FishGIS application. The feedback from these trial surveys were very beneficial to help identify issues that were not readily apparent in the larger-scale training interactions. These visits also provided an opportunity to collect information on local fisheries, target species, and livelihood of local fishers and aquaculture farmers for socio-economic research.
Fig. 5.2 Training workshop held July 10–12, 2018, in Jakarta, Indonesia; first row: Participants investigate smartphone applications (left) and the Foldscopes (right); second row: Participants take part in productive discussions (left) led by Dr. Charles Trick (right); third row: Group photos of PICES Team members, BPPT staff and participants after the Closing Ceremony.

Implementation Section 5
32 PICES Scientific Report No. 58
Fig. 5.3 Training workshop held July 10–11, 2019, in Karangantu Port/Serang, Indonesia; first row: Workshop organizers prior to the Opening Session (left) and PICES Team members, BPPT staff and participants after hands-on field training (right); second row: Participants investigate the FishGIS application (left) and the Foldscope (right); third row: Hands-on field practice with the HydroColor application; bottom row: Small-group discussions.

Section 5 Implementation
PICES Scientific Report No. 58 33
Fig. 5.4 Training workshops held February 25, 2020 in Karangantu Port/Serang (left column) and February 27, 2020 in Palabuhan Ratu (right column): Workshop organizers (first row), workshops in session (second row), asking questions and getting answers (third row), and group photos of PICES Team members, BPPT staff and participants after the Closing Ceremony (bottom row).

Implementation Section 5
34 PICES Scientific Report No. 58
Fig. 5.5 Training activities during the first trial survey (December 11–13, 2018) in Pabean Ilir village in Indramayu. Local fishers discuss FishGIS application manual development (top left) and participate in the “Fisheries Sustainability” game (top right), pose prior to doing field observations (bottom left), and set out by boat to collect fisheries data (bottom right).
Fig. 5.6 Training activities during the second trial survey (December 15–17, 2019) in Pabean Ilir village in Indramayu. While fishers were primarily male, there was considerable lateral knowledge transfer through families and other community members. Many fishers returned on days following training with questions or concerns that were generated through in-family or in-community discussion.

M
aura
Gem
bong
In
dram
ayu
Sera
ng
Pela
buha
n R
atu
Rel
evan
cy
The
com
mun
ity w
as a
mod
el o
f rea
l In
done
sian
coa
stal l
ife, b
eing
mor
e aq
uacu
lture
-dep
ende
nt.
Act
iviti
es
wer
e ve
ry re
leva
nt to
par
ticip
ants
be
caus
e th
ey w
ere
high
ly m
otiv
ated
w
ith h
igh
capa
city
as a
n or
gani
zed
grou
p in
the
begi
nnin
g of
the
Proj
ect.
The
parti
cipa
ting
villa
ge (P
abea
n Ili
r)
from
the
dist
rict w
as a
goo
d re
pres
enta
tion
of a
fish
ing
com
mun
ity, w
ith e
stuar
ine
lago
on a
nd m
angr
ove
fore
st.
Com
mun
ity
mem
bers
wer
e w
ell o
rgan
ized
and
co
oper
ativ
e, a
nd sh
owed
a d
eep
unde
rsta
ndin
g of
the
Proj
ect a
nd it
s aim
s.
Act
iviti
es w
ere
very
rele
vant
to
parti
cipa
nts b
ecau
se th
eir e
fforts
wer
e su
stain
ed fr
om b
egin
ning
of t
he P
roje
ct to
th
e en
d.
Unl
ike
Mua
ra G
embo
ng a
nd In
dram
ayu,
w
hich
had
bee
n in
trodu
ced
to th
e Pr
ojec
t be
fore
the
wor
ksho
p, it
was
the
first
tim
e fo
r mos
t of t
he S
eran
g pa
rtici
pant
s to
join
the
Proj
ect a
ctiv
ities
, so
extra
tim
e w
as n
eede
d to
exp
lain
why
the
activ
ities
w
ere
rele
vant
to th
eir c
omm
unity
. (T
he
sign
ifica
nce
of th
e se
lect
ion
of th
e co
mm
unity
mem
bers
also
was
not
cle
ar
amon
g PI
CES
exp
erts
.)
It w
as th
e fir
st tim
e fo
r alm
ost h
alf o
f pa
rtici
pant
s to
join
the
Proj
ect,
so ti
me
need
ed
to b
e ta
ken
to e
xpla
in w
hy th
e ac
tiviti
es w
ere
bein
g im
plem
ente
d. P
artic
ipan
ts w
ere
very
po
sitiv
e an
d w
illin
g to
lear
n, w
hich
was
a
com
mon
feat
ure
in th
e co
mm
unity
. Pa
rtici
pant
s co
nsist
ed o
f a v
arie
ty o
f sta
keho
lder
s, in
clud
ing
non-
prof
it or
gani
zatio
ns (N
PO).
Fis
hers
wer
e hi
ghly
inte
rest
ed in
and
cap
able
of u
sing
the
appl
icat
ions
dem
onst
rate
d in
the
sess
ions
. A
ctiv
ities
wer
e re
leva
nt to
the
mem
bers
of t
he
com
mun
ity.
Ef
fect
iven
ess
Impl
emen
tatio
n of
act
iviti
es w
as
effe
ctiv
e in
tran
sfer
ring
tech
niqu
es a
t th
e be
ginn
ing
of th
e Pr
ojec
t, th
ough
ov
eral
l effe
ctiv
enes
s was
unc
erta
in
beca
use
com
mun
ity m
embe
rs w
ere
not c
ontri
butin
g re
ports
by
the
end
of
the
Proj
ect
Com
mun
ity m
embe
rs u
sed
know
ledg
e fro
m th
e Pr
ojec
t act
iviti
es to
mai
ntai
n re
porti
ng.
On-
site
inst
ruct
ions
seem
ed
effe
ctiv
e in
bui
ldin
g co
nsen
sus a
mon
g pa
rtici
pant
s wor
king
toge
ther
at w
orks
hop
as w
ell i
n tra
nsfe
rring
kno
wle
dge.
Im
plem
enta
tion
of a
ctiv
ities
was
effe
ctiv
e th
roug
h to
the
end
of th
e Pr
ojec
t
In la
ter w
orks
hops
, onl
y a
limite
d nu
mbe
r of p
artic
ipan
ts fro
m th
e fir
st
wor
ksho
p w
ere
pres
ent,
so m
uch
of th
e tra
inin
g ne
eded
to b
e re
peat
ed fo
r pa
rtici
pant
s joi
ning
for t
he fi
rst t
ime.
A
lso, m
any
parti
cipa
nts d
id n
ot a
pply
w
hat t
hey
lear
ned,
and
rare
ly re
porte
d th
eir m
onito
ring
data
afte
r tra
inin
g ac
tiviti
es w
ith P
ICES
exp
erts
. Im
plem
enta
tion
of a
ctiv
ities
was
not
su
ffici
ently
eff
ectiv
e.
In la
ter w
orks
hops
, onl
y a
limite
d nu
mbe
r of
com
mun
ity m
embe
rs w
ith e
xper
ienc
e in
the
Proj
ect w
ere
able
to a
ttend
. H
owev
er, t
he
rem
aini
ng p
artic
ipan
ts w
ere
fairl
y en
gage
d in
try
ing
to u
nder
stan
d th
e Pr
ojec
t goa
ls an
d m
onito
ring
tool
s dur
ing
the
wor
ksho
p.
Impl
emen
tatio
n of
act
iviti
es w
as e
ffect
ive,
th
ough
the
parti
cipa
nts r
arel
y re
porte
d th
eir
mon
itorin
g da
ta a
fter t
rain
ing
activ
ities
with
PI
CES
exp
erts
.
Effic
ienc
y A
t the
beg
inni
ng o
f the
Pro
ject
, co
mm
unity
eng
agem
ent w
ith th
e PS
T on
act
iviti
es w
as e
nthu
siasti
c, w
ith
man
y qu
estio
ns b
eing
ask
ed, a
nd
suffi
cien
t to
mot
ivat
e ac
tions
. H
owev
er, t
he P
ST lo
st c
onta
ct w
ith
parti
cipa
nts i
n la
ter h
alf o
f the
Pro
ject
. So
, ove
rall,
effi
cien
cy w
as lo
w.
Com
mun
ity m
embe
rs w
ere
activ
e in
bot
h w
orks
hop
and
doin
g on
-site
mon
itorin
g.
Som
e of
them
join
ed o
ther
com
mun
ity
wor
ksho
ps a
nd ta
ught
oth
er fi
sher
s.
Impl
emen
tatio
n of
act
iviti
es w
as
succ
essf
ul, t
houg
h co
sts w
ere
fairl
y hi
gh
for t
rans
porti
ng P
ICES
exp
erts
to th
e vi
llage
.
Man
y of
the
unex
perie
nced
(firs
t-tim
e) w
orks
hop
parti
cipa
nts w
ere
conf
used
dur
ing
impl
emen
tatio
n of
act
iviti
es.
Thus
, the
com
pone
nts o
f the
tech
nica
l tra
nsfe
r of k
now
ledg
e ne
eded
to b
e re
peat
ed b
y PI
CES
exp
erts
from
the
begi
nnin
g. I
mpl
emen
tatio
n of
act
iviti
es
was
not
real
ly e
ffic
ient
.
Impa
ct
BPP
T di
ssem
inat
ed in
form
atio
n on
the
wor
ksho
ps to
oth
er a
genc
ies a
nd in
tere
sted
par
ties i
n In
done
sia,
and
PIC
ES e
xper
ts p
rese
nted
the
rese
arch
out
com
es a
t the
PIC
ES 2
018
and
2019
Ann
ual M
eetin
gs, a
nd in
PIC
ES P
ress
. Th
e im
plem
enta
tion
of a
ctiv
ities
can
be
signi
fican
tly in
fluen
tial t
o ot
her c
omm
uniti
es a
nd in
divi
dual
s tho
ugh
actu
al im
pact
s to
loca
ls in
In
done
sia
are
unce
rtain
due
to la
ck o
f inf
orm
atio
n.
Susta
inab
ility
U
ncer
tain
: La
ck o
f inf
orm
atio
n af
ter
the
last
wor
ksho
p Pr
obab
ly su
stai
nabl
e (w
ith p
reco
nditi
on):
Dev
elop
men
t of s
elf-m
onito
ring
plan
s and
fo
rmin
g a
task
forc
e in
the
com
mun
ity w
ith
loca
l sci
entis
ts fro
m a
tech
nica
l ext
ensi
on
offic
e w
ere
prom
isin
g. A
larg
e flo
od a
t the
be
ginn
ing
of 2
020
dest
roye
d m
uch
of th
e co
mm
unity
’s in
frast
ruct
ure,
but
if th
ese
plan
s and
com
mun
ity ta
sk fo
rce
are
succ
essf
ully
rest
ored
, sus
tain
able
act
ions
m
ay b
e ex
pect
ed.
Hig
hly
mot
ivat
ed p
artic
ipan
ts
volu
ntar
ily c
omm
unic
ated
with
PIC
ES
expe
rts re
gard
ing
furth
er a
ctio
ns o
n fo
rmin
g co
oper
ativ
es a
nd c
ontin
uing
m
onito
ring
activ
ities
. If
ther
e is
te
chni
cal s
uppo
rt fo
r the
ir fu
rther
act
ions
to
fill
wha
t the
y m
isse
d du
ring
impl
emen
tatio
n of
act
iviti
es, s
usta
inab
le
actio
ns a
re to
be
expe
cted
.
Parti
cipa
nts o
f wor
ksho
ps in
clud
ed v
ario
us
loca
l sta
keho
lder
s who
m d
irect
ly w
orki
ng fo
r fis
hers
(coo
pera
tives
, NPO
). T
heir
mot
ivat
ions
w
ere
high
. W
ith e
fforts
to c
onne
ct th
em to
lo
cal f
ishe
rs w
ith th
e Pr
ojec
t too
ls,
susta
inab
ility
of t
he P
roje
ct o
utco
mes
may
be
expe
cted
.
Tab
le 5
.2
Eval
uatio
n of
act
iviti
es fo
r im
plem
enta
tion
in th
e Fi
shG
IS p
roje
ct in
eac
h co
mm
unity
.
Section 5 Implementation
PICES Scientific Report No. 58 35

Implementation Section 5
36 PICES Scientific Report No. 58
As with most community-based research collaborations, there were times when the implementation activities were not fully satisfactory in terms of relevancy, effectiveness, efficiency, impact, and sustainability (Table 5.2). Some activities lacked appropriate coordination and required adapting to alternative communication strategies among PICES experts, BPPT, local fishers, and other stakeholders. In addition, workshops were not always sufficient to motivate all community members, but in our experience this patchiness in enthusiasm is common and was to be expected. The PST used this situation as an opportunity to recognize and embrace the participation of local leadership (both government and fishers) who have substantial influence in the communities, and who can use their position in the community to enhance the sustainability of the effort after formal support of the project ends.
Based on the Official Development Assistance (ODA) Program scheme, it is essential that the project builds ownership of operations among participants at all levels – from national government through to local communities. PST members will continue to communicate with the local leaders using the existing social structures to gain consensus among the stakeholders and to encourage community participation in FishGIS activities so that these communities can develop and preserve a sense of pride and ownership in FishGIS technology and operations. In addition, local government extension officers in each community are charged with disseminating practical information to local fishers, and the involvement of these extension officers offers an alternative follow-up for making sure FishGIS activities are maintained in the communities.
The FishGIS project was successful in advancing the universal solutions and resonance of the broad ODA mandate to promote economic development and welfare in Indonesia. The project identified and refined a resource-problem (fisheries), and worked with the selected local communities to obtain data that will lead to improved environmental conditions that will, in turn, increase the sustainability of the resource in this country.

Section 6 Summary and Recommendations
PICES Scientific Report No. 58 37
6 Summary and Recommendations
6.1 Foundation to the project successes
Two primary factors underpinned the accomplishments in this technology-based citizen-science project: (1) the wide breadth of expertise in PST/Indonesian cooperation that spanned environmental science, fisheries science, human dimension studies, smartphone technologies, application development, database design and implementation, and previous extensive experience in international development and cooperation studies, and (2) the collaborative relationship the PST had with Indonesian government officials and researchers. The importance of the second factor – strong interactive collaborations “on the ground” – cannot be overemphasized.
The productive and synergistic relationship between FishGIS PST members and the Indonesian counterparts at BPPT and LIPI, developed during earlier PICES/MAFF projects in the region, facilitated rapid implementation of the project plans. Within a short time of beginning of the project, PICES and BPPT signed a Letter of Intent that provided an official endorsement from the federal Indonesian government, establishing the national legitimacy of the project for local Indonesian governments. In addition to opening up the support and resources of these local governments in case study communities, it also provided the impetus for establishing and transitioning the project database to the Indonesian National Ocean Data Center to show the local people that these data are properly managed and utilized. Most importantly, this official endorsement was a significant stimulus for local fishers and community members to participate in the project – the critical component for any citizen-science-based observation network.
The collaboration with BPPT and local governments also was key to selecting the four case study sites from the northern (Muara Gembong, Indramayu), western (Serang), and southern (Pelabuhan Ratu) regions of Java Island. These sites reflect a wide diversity in social and ecological backgrounds among Indonesian coastal communities, and both the local communities and governments continue to be very supportive and willing to participate in the project.
6.2 PICES FishGIS and Official Development Assistance Program
The FishGIS project was designed to achieve the mandate of various authorities – the PICES Human Dimension program, the MAFF development program, and – as it is the foundation of both bodies – the Official Development Assistance Program (ODA). The Organization for Economic Co-operation and Development (OECD) defines ODA as “activities provided to lower- and middle-income countries that promote economic development and welfare of the developing country and (in the 2020 model of ODA) of a “fit-for-purpose” statistical system that is useful for policy makers (economic, fisheries, community welfare, human wellness)”. The FishGIS project is an example of the transdisciplinary approach to

Summary and Recommendations Section 6
38 PICES Scientific Report No. 58
supplying foundational data for decision making at the community level and providing community members the tools to manage their environment for the wellness of the community.
The contents and observation tools of the FishGIS project were developed in close consultation with Indonesian partners and local community members. A number of training and implementation workshops were conducted at each case study site to discuss and define the most important issues to be addressed. This approach differs from many citizen-science projects where scientists decide on the monitoring parameters and systems. In our case, PICES researchers, Indonesian government scientists and representatives, and local community members were “at the same table”, bringing the scientific perspective to the community, and gaining the community perspective on this science. With this collaborative approach, the local communities were able to develop a strong sense of “ownership” of the technology, in some cases teaching other communities about it with pride. The training workshops also provided the local fishers a scientific point of view on coastal fisheries, adding a new perspective to their knowledge of their waters.
The two guiding questions at the beginning of the FishGIS project were: a) How do global changes in climate and economy affect coastal ecosystems? and b) How may enhanced capacity for monitoring activities by local fishers help to improve fisheries management in coastal areas? Although effective answers to these broad questions could never be achieved within the 3-year term of the project, they focused attention onto developing the tools needed to address these questions, and on the training and community interactions to foster the data collections required to give insight. Moreover, considerable detailed understanding about longer-term changes in these coastal ecosystems (for example, such as the changes in fisheries species, seasonal durations, and patterns of precipitation) was obtained through joint meetings and small-group interviews with local fishers and community members. This information was of value to both local and national government scientists. The enhanced capacity by local fishers and community members to observe and monitor basic water quality and plankton productivity, HAB incidences, fish catch trends, occurrence of IUU fishing, and plastic debris in marine waters, provides an important base for improving local decision making for more sustainable fisheries. Similarly, the local government officers now will have access to data regarding their policy effectiveness, and a good information tool to interconnect with communities more closely. These are also important ripple effects from the project.
6.3 Recommendations for success with FishGIS
The most prominent product of the project, the smartphone-enabled FishGIS application, serves only as a connection to the real value of the project – the empowerment of the community to understand and respond to a changing environment. Unlike full-scale ODAs, the PICES/MAFF FishGIS project is designed for, and directed to, communities that are formed around, and depend upon, marine resources.
Key to the successful implementation of this project is that:
1. The necessary and practical dissemination of information to the communities, and the adequate transfer of FishGIS environmental and fishery data to a database, depends on continued consensus among stakeholders and Indonesian and PICES experts. This consensus will rely on continued active assistance to the communities. It must be recognized that in many cases local community members are existing at only marginal subsistence levels, and that while their spirit and enthusiasm is high, the practicalities of time and resources are challenging. Engaging local extension officers

Section 6 Summary and Recommendations
PICES Scientific Report No. 58 39
(see below) to aid in data collection and provide community encouragement would help to foster this participation.
2. Further revision of the smartphone-based observation tools and implementation strategies likely will be needed as the program matures. This evolution will depend critically on feedback from the communities, but this ongoing direct management will stress the resource and time limitations of PICES experts and BPPT staff, particularly when attempting to manage these changes across communities. An alternate approach would be to identify a single, committed community as a “model” or “development” site, where enhanced direct interaction is used to evaluate, validate, and promote self-responsible monitoring. The lessons learned here could then be distributed to other communities as the program expands.
3. Recognition of the local agencies that they have a long-term responsibility to ensure that the data are collected properly, processed in a reasonable time, and distributed back to the communities in a systematic and useful way (i.e., established timing of the release of the report, presentation of the data, interpretation of the data in the local language, etc. and open opportunity for comments and feedback) is critical. The focus in the FishGIS project centered on the co-creation of the smartphone-enabled tools and experimentation with the methods for training, with less time directed at the data collection and reporting aspects. Efforts in future projects should be more balanced to enable better co-creation of the project outputs.
4. Regular data reporting to the communities is required. Since the ODA mandate is for long-term improvement for the community’s wellness, the local partners need a yearly compilation of the data and status report. Key questions could include:
• Is the water quality (turbidity, plastics) improving? • Is the level of fish capture/recorded effort declining or improving? • Is there evidence of illegal fishing, and should authorities respond?
• Are harmful species of phytoplankton appearing more frequently, and is LIPI aware of this?
5. In addition to the enhanced communication efforts indicated above, the local partners must routinely reconnect with all communities in the program through site visits. In Indonesia, like in many other countries, there are “extension officers” who specialize in fishing techniques and livelihood improvements, and are responsible for disseminating this information to local communities. These individuals are well-known in the communities, and thus can provide a good way for the essential repeated contacts to remind participants of the value of the data to the sustainability3 of the fisheries – including the size of catch, type of fish, and size of fish caught. Establishing a dedicated Social Networking System is one method that could facilitate communication among stakeholders and extension officers. In addition, separate enhanced training for extension officers about the concepts and practices of fisheries sustainability and use of the project tools would better equip them for leading the FishGIS efforts in their communities.
3 The communities had a well-established understanding of sustainability. Individuals were concerned about maintaining a sustainable harvest, but had few options other than fish for an alternate species when their prime fish population dwindled.

Summary and Recommendations Section 6
40 PICES Scientific Report No. 58
6.4 Dissemination of project results
Information from the FishGIS project was shared with the scientific community through presentations at the PICES Annual Meetings and publications in PICES Press (see Appendices 6 and 7).
Some results from the early stages of the project were presented by three posters at the 2018 PICES Annual Meeting (PICES-2018, Yokohama, Japan). Though all PST members and the major BPPT counterpart, Dr. Suhendar I Sachoemar, contributed to these papers, the lead was taken by two Hokkaido University students, Ayumi Kanaya and Takaaki Mori, and their mentor Dr. Naoki Tojo (Fig. 6.1):
• Ayumi Kanaya et al. “Participatory research in resource production for sustainable fisheries and estimation of option value in Indramayu, Indonesia” (FIS Paper Session);
• Takaaki Mori et al. “Economic value of ecosystem services and utility of coastal fisheries in Indramayu, Indonesia” (Workshop W8: Taking stock of marine ecosystem services in the North Pacific — Exploring examples and examining methods);
• Naoki Tojo et al. “Interactions within fisheries eco-/econo-system and impact of participatory research in a coastal community: in the model area of Indonesia” (FIS Paper Session).
Fig. 6.1 After the PICES-2018 Poster Session: Hokkaido University student presenters, Ayumi Kanaya and Takaaki Mori (third and fourth from the left, with a poster), posing with PST members, Drs. Shion Takemura (second from the left) and Mitsutaku Makino (second from the right) and early career scientists from the Japan Fisheries Research and Education Agency.

Section 6 Summary and Recommendations
PICES Scientific Report No. 58 41
The project overview and details on the development of the smartphone-based observation tools were reported in two papers at the 2019 PICES Annual Meeting (PICES-2019, Victoria, Canada):
• Mitsutaku Makino et al. “Capacity building in Indonesian fishing communities using smartphone technology to monitor the environment and fisheries: The FishGIS project” (talk at the Science Board Symposium S1; Fig. 6.2);
• Shion Takemura et al. “Developing a community-based coastal environmental monitoring system in Indonesia using smartphone app” (poster at the MONITOR Topic Session S9: Coastal Ocean Observing Systems, Essential Biological Variables and Community-based Monitoring).
Fig. 6.2 Dr. Mitsutaku Makino (FishGIS PST Co-Chairman) presents the project overview at the PICES-2019 Science Board Symposium (top row); he and Dr. Mark Wells (another FishGIS PST Co-Chairman) answer questions after this presentation (bottom row).
It was expected that the major project outcomes would be summarized in a paper “Involving Indonesian fishing communities in project design and research of their coastal ecosystem: The PICES FishGIS project” and several posters at the second international symposium on “Marine Socio-Ecological Systems” (MSEAS-2020) in May 2020, in Yokohama, Japan. Unfortunately, this meeting was cancelled due to the COVID-19 health risks and is now planned to be convened in 2021.

Summary and Recommendations Section 6
42 PICES Scientific Report No. 58
During the project lifetime, three articles were published in PICES Press (Appendix 7):
• Summer 2018, Vol. 26, No. 2, pp. 20–24 Mitsutaku Makino and Mark Wells: A new PICES/MAFF-sponsored project: Building capacity for coastal monitoring by small-scale fishers;
• Winter 2019, Vol. 27, No.1, pp. 16–18 Shion Takemura, Shigeharu Kogushi, Mark Wells and Mitsutaku Makino: The PICES MAFF-sponsored Project on “Building capacity for coastal monitoring by local small-scale fishers" (FishGIS): Mobile phone-based monitoring technology and training workshop”;
• Summer 2019, Vol. 27, No. 2, pp. 16–21 Naoki Tojo, Takaaki Mori and Charles Trick: The PICES–MAFF-sponsored Project on “Building capacity for coastal monitoring by local small-scale fishers” (FishGIS): Incorporating community-based research principles.
A final article detailing project’s outcomes will be published in the winter 2021 issue of PICES Press (Appendix 7):
• Winter 2021, Vol. 29, No. 1 Mitsutaku Makino, Mark Wells, Shion Takemura, Shigeharu Kogushi, Naoki Tojo, Charles Trick, Suhendar I Sachoemar, Vladimir Kulik, Chang-an Xu and Joon-Soo Lee: Smartphone-based tools to enhance fishery sustainability for coastal communities in developing nations: The PICES–Japan MAFF FishGIS Project.

Section 7 References
PICES Scientific Report No. 58 43
7 References
Blondeau-Patissier, D., Gower, J.F.R., Dekker, A.G., Phinn, S.R., and Brando, V.E. 2014. A review of ocean color remote sensing methods and statistical techniques for the detection, mapping and analysis of phytoplankton blooms in coastal and open oceans. Prog. Oceanogr. 123: 123–144. https://doi.org/ 10.1016/j.pocean.2013.12.008
Conrad, C.C. and Hilchey, K.G. 2010. A review of citizen science and community-based environmental monitoring: issues and opportunities. Environ. Monitor. Assess. 176: 273–291.
Dickinson, J.L., Zuckerberg, B., and Bonter, D.N. 2010. Citizen science as an ecological research tool: Challenges and benefits, pp. 149–172 in Annual Review of Ecology, Evolution, and Systematics, Vol. 41 edited by D.J. Futuyma, H.B. Shafer, and D. Simberloff.
Duecker, K. and Kjerne, D. 1989. Multipurpose cadastre: terms and definitions. Proceedings of the ACSM-ASPRS, Vol. 5, pp. 94–103.
Goddijn-Murphy, L., Dailloux, D., White, M., Bowers, D. 2009. Fundamentals of in situ digital camera methodology for water quality monitoring of coast and ocean. Sensors 9: 5825–5843.
Goddijn, L.M. and White, M. 2006. Using a digital camera for water quality measurements in Galway Bay. Estuar. Coastal Shelf Sci. 66: 429–436.
Harvey, F. 2008. A Primer of GIS: Fundamental Geographic and Cartographic Concepts. The Guilford Press, London.
Humber, F., Andriamahaino, E.T., Beriziny, T., Botosoamananto, R., Godley, B.J., Gough, C., Pedron, S., Ramahery, V., and Broderick, A.C. 2017. Assessing the small-scale shark fishery of Madagascar through community-based monitoring and knowledge. Fish. Res. 186: 131–143. doi:10.1016/j.fishres.2016.08.012
IOC-UNESCO. 2017. Global Ocean Science Report. https://en.unesco.org/gosr
Mauser, W., Klepper, G., Rice, M., Schmalzbauer, B.S., Hackmann, H., Leemans, R. and Moor, H. 2013. Transdisciplinary global change research: the co-creation of knowledge for sustainability. Current Opinion Environ. Sustainability 5: 420–431.
Mobley, C.D. 1999. Estimation of the remote-sensing reflectance from above-surface measurements. Appl. Optics 38: 7442–7455. doi:10.1364/AO.38.007442
NewZoo 2020. Market Report. https://newzoo.com/insights/trend-reports/newzoo-global-esports-market-report-2020-light-version/
Silvertown, J. 2009. A new dawn for citizen science. Trends Ecol. Evol. 24: 467–471. Stewart, P. 1954. The value of the Christmas bird counts. Wilson Bull. 66: 184–195.
Strobl, C. 2008. PostGIS, pp. 891–898 in Encyclopedia of GIS edited by S. Shekhar and H. Xiong. https://doi.org/10.1007/978-0-387-35973-1_1012
Takemura, S. 2017. Community-based monitoring toward sustainable management of mangrove forest in Okinawa, Japan. Report of National Seminar on Marine Tourism, Science and Technology Jamboree, Sail Sabang and the 4th International Workshop on Sato Umi. Jakarta, Indonesia, 21 pp.

References Section 7
44 PICES Scientific Report No. 58
Venkatramanan, S., Prasanna, M.V., Chung, S.Y., Selvam, S., Manisha, A., Vidhya, J. and Venkatramanan, S. 2019. Fundamentals of GIS, pp. 3–15 in GIS and Geostatistical Techniques for Groundwater Science edited by V. Senapathi, P.M. Viswanathan and S.Y. Chung., Elsevier. https://doi.org/10.1016/B978-0-12-815413-7.00001-8
Wikipedia 2020. https://en.wikipedia.org/wiki/List_of_countries_by_number_of_broadband_Internet_subscriptions

Appendix 1 FishGIS Principles
PICES Scientific Report No. 58 45
Appendix 1
FishGIS Principles
1. The overall goal of the project entitled “Building capacity for coastal monitoring by local small-scale fishers”, funded by the Ministry of Agriculture, Forestry and Fisheries of Japan (MAFF), through the Fisheries Agency of Japan (JFA), is to enhance the capacity of local small-scale fishers to monitor coastal ecosystems and coastal fisheries in Pacific Rim developing countries. The project key (guiding) questions are: (a) How do global changes in climate and economy affect coastal ecosystems? and (b) How can enhanced capacity for monitoring activities by local fishers help to improve fisheries management in coastal areas (e.g., increase fish stocks or implement sustainable fisheries)? The project is also intended to foster partnerships with non-PICES member countries and related international programs and organizations. The MAFF contribution is from the Official Development Assistance (ODA) Fund and therefore, involvement of developing countries in project activities is required.
2. The maximum duration of the project is 3 years, with the ending date set as March 31, 2020.
3. The following organizational principles agreed to by MAFF/JFA and PICES apply to the project:
The project will interact with, and support relevant activities of, PICES Scientific Committees on Human Dimension (HD) and Fishery Science (FIS), PICES Technical Committees on Data Exchange (TCODE) and on Monitoring (MONITOR), and PICES FUTURE (Forecasting and Understanding Trends, Uncertainty and Responses of North Pacific Marine Ecosystems) Science Program (Research Theme 3 on “How do human activities affect coastal ecosystems and how are societies affected by changes in these ecosystems?”).
The project will be directed by a Project Science Team (PST), with membership from within or outside of PICES Committees and expert groups, as deemed appropriate. All above mentioned groups are expected to be represented on PST.
The PST will be co-chaired by PICES members, with one of Co-Chairmen being from Japan. The PST Co-Chairmen are responsible for the scientific implementation of the project and annual reporting to MAFF and to PICES Science Board through the HD Committee. The report to MAFF/JFA should be submitted within 90 days after the close of each project year ending March 31, and include a summary of the activities carried out for the year, with an evaluation on the progress made, and a workplan for the following year.

FishGIS Principles Appendix 1
46 PICES Scientific Report No. 58
4. The following financial principles agreed to by MAFF/JFA and PICES apply to the project:
• A separate bank account shall be established to deposit the remitted funds.
• The PICES Executive Secretary or a Project Coordinator designated by the Executive Secretary will be responsible for the management of the fund and annual reporting on its disposition to MAFF/JFA and PICES Governing Council through the Finance and Administration Committee. The report to MAFF/JFA should be submitted within 90 days after the close of each project year ending March 31.
• The main elements of the budget are organized into the following categories:
o Travel and meetings – this category covers travel costs associated with project activities such as field studies, organizational trips, project meetings, workshops, scientific sessions and public events.
o Contracts – this category covers grants/fees to be paid to consultants and experts employed to implement the project. Tasks and deliverables for contractors are to be determined by the PST Co-Chairmen. To support the objectives of the project and to ensure that its activities have minimal impact on the workload of the existing staff of the PICES Secretariat, the Project Coordinator can employ additional staff as required.
o Publications – this category covers costs associated with publishing findings of the project in special issues of peer-reviewed journals, reports and brochures, and dissemination of these materials.
o Equipment – this category covers purchases and shipment of equipment for laboratory/ field data/sampling processing/analysis, computer hardware/software for the development of database(s) and the project website.
o Miscellaneous – this category covers expenses associated with the project (mail and phone charges, bank charges, etc.) and includes contingencies such as fluctuations in currency exchange rates.
• Transfers of up to 10% of allocations between the budget categories are allowed based solely on the decision by the PICES Executive Secretary or a Projects Coordinator. In special cases, transfers up to 20% between the budget categories can be authorized by JFA. All transfers shall be reported at the end of the fiscal year.
• A 13% overhead on the annual budget shall be retained by PICES to offset expenses related to the Secretariat’s involvement in the project.
• The interest earned by the fund shall be credited to the project and used in consultation with JFA.
• Any funds remaining after the completion of every fiscal year of the project shall be reported and disposed of in consultation with JFA.
5. Ownership of the outcomes of the project, including materials, data, copyright and intellectual property rights, will be vested to PICES and the Government of Japan. Either Party may use those outcomes, but will give full credit to their source.

Appendix 2 Project Science Team Members
PICES Scientific Report No. 58 47
Appendix 2
Project Science Team Members
Vladimir Kulik (representing MONITOR) Pacific Branch of VNIRO (“TINRO”) 4 Shevchenko Alley Vladivostok, Primorsky Kray 690091 Russia Email: [email protected] Joon-Soo Lee (representing TCODE) Korea Oceanographic Data Center National Institute of Fisheries Science Ministry of Oceans and Fisheries 216 Gijanghaean-ro, Gijang-eup Gijang-gun, Busan, 46083 Korea Email: [email protected] Mitsutaku Makino Project Science Team Co-Chairman (representing HD) Center for International Collaboration Atmosphere and Ocean Research Institute The University of Tokyo 5-1-5, Kashiwanoha, Kashiwa-shi Chiba, 277-8564 Japan E-mail: [email protected] Shion Takemura (representing HD) National Research Institute of Fisheries Science Japan Fisheries Research and Education Agency 2-12-4 Fukuura, Kanazawa-ku Yokohama, Kanagawa, 236-8648 Japan E-mail: [email protected]

Project Science Team Members Appendix 2
48 PICES Scientific Report No. 58
Naoki Tojo (representing FIS) Faculty of Fisheries Sciences Hokkaido University 3-1-1, Minato-cho Hakodate, 041-8611 Japan E-mail: [email protected] Vera L. Trainer (2018–2020) Northwest Fisheries Science Center National Marine Fisheries Service, NOAA 2725 Montlake Blvd. E Seattle, WA 98112 USA E-mail: [email protected] Charles Trick Department of Biology Western University 1151 Richmond St. N London, ON, N6A 5B7 Canada E-mail: [email protected] Mark Wells Project Science Team Co-Chairman School of Marine Sciences University of Maine 5741 Libby Hall Orono, ME 04469 USA E-mail: [email protected] Chang-an Xu Third Institute of Oceanography Ministry of Natural Resources 178, Daxue Rd., Siming District Xiamen, Fujian, 361005 China E-mail: [email protected] Alexander Bychkov ex-officio PICES Secretariat P.O. Box 6000 Sidney, BC, V8L 4B2 Canada E-mail: [email protected]

Appendix 3 Meeting Reports
PICES Scientific Report No. 58 49
Appendix 3
Project Science Team Meeting Reports
First Meeting of the Project Science Team January 17–19, 2018, Yokohama, Japan .................................................................................................. 50
Second Meeting of the Project Science Team November 2, 2018, Yokohama, Japan ...................................................................................................... 67
Third Meeting of the Project Science Team October 16, 2019, Victoria, Canada ......................................................................................................... 73
Fourth Meeting of the Project Science Team February 28, 2020, Jakarta, Indonesia ...................................................................................................... 81

First Meeting Appendix 3 – Meeting Reports
50 PICES Scientific Report No. 58
First Meeting of the Project Science Team January 17–19, 2018, Yokohama, Japan
The first meeting of the Project Science Team (PST) for the PICES project on “Building capacity for coastal monitoring by local small-scale fishers” (acronym FishGIS), funded by the Ministry of Agriculture, Forestry and Fisheries (MAFF) of Japan, through the Fisheries Agency of Japan (JFA), was held from January 17 to 19, 2018, at the Headquarters of the Japan Fisheries Research and Education Agency (FRA) in Yokohama, Japan. The meeting was co-chaired by Drs. Mitsutaku Makino (Japan) and Mark Wells (USA).
The objective for this meeting was to:
Review the goals, overall strategy and general directions for the project; Refine the project design to best integrate it with the anticipated aims and programs of BPPT; Review the scientific and technological basis underlying the project goals; Tentatively identify Indonesian communities that would meet the project requirements for case study
sites; Discuss a plan for introducing the project to BPPT and other Indonesian government agencies, and
the site visits for final selection of two communities for project implementation; Develop a draft plan for the first Indonesian training workshop early in Year 2 of the project.
The PST members and meeting participants are identified in Appendix 1.
1. WELCOME REMARKS AND ADOPTION OF THE AGENDA
The meeting was opened with a welcome address by Dr. Tokio Wada (Executive Director, FRA), who highlighted the importance of the project for both PICES and MAFF.
The provisional agenda circulated prior to the meeting was adopted without changes and can be found in Appendix 2. Dr. Wells served as the rapporteur.
2. BACKGROUND OF THE PROJECT
The overall project goal is to build capacity to monitor coastal ecosystems and coastal fisheries by local small-scale fishers and aquaculture farmers in Pacific Rim developing countries. The project guiding questions are: (a) How do global changes in climate and economy affect coastal ecosystems? and (b) How may enhanced capacity for monitoring activities by local fishers help to improve fisheries management in coastal areas?
Indonesia was selected as a country to implement the project, with the aim of co-developing technological tools and training that empower fishers and other community members as citizen scientists to gather the observations needed for better management of their fisheries (both wild and aquaculture).

Appendix 3 – Meeting Reports First Meeting
PICES Scientific Report No. 58 51
The project will focus on two major initiatives:
1. Coastal ecosystem monitoring activities by local small-scale fishers to detect ecosystem changes (e.g., changes in water quality and in plankton community composition);
2. Coastal fisheries monitoring activities by local small-scale fishers to improve coastal fisheries management (e.g., information about fishing operation or species composition in the market).
These two initiatives will be supported through training/capacity building workshops where PICES researchers will work together with Indonesian scientists, national and regional government representatives, and coastal community members to co-design the project. The general strategy is to utilize smartphones as a solid foundation for citizen-science and community-based observational programs. The objective is to develop a framework to enable better management and more adaptive/resilient communities, driven not by government but by the people themselves.
It was noted that the broad goals of the project need to be translated into more specific targets. Aspects of capacity building and the provision of analytical tools should be included and stated explicitly. The capacity building workshops should take into account the needs and goals of the government and local stakeholders, and particular effort should be placed on shaping the capacity building so that it can continue to be useful after the project has been completed.
The initial “must do” tasks under the project include:
1. Select 2 to 4 Indonesian communities that have the capacity and willingness to participate in the project;
2. Develop, test, and refine the primary smartphone-based application with the participation of Indonesian partners;
3. Organize 2 training workshops, the first to introduce the app and the second to follow-up with additional training as the app is refined;
4. Construct a database system for storing the observations; 5. Submit annual reports to MAFF/JFA within 120 days after the close of each project year ending
March 31.
Expected outputs from the project include: a PICES Scientific Report, a brochure (possibly in several languages), a database, and newsletter (PICES Press) articles. It was suggested that the PST consider creating a “case study” description output on how to set up this type of program, using the Harvard example.
3. MOTIVATION AND VALUE OF THE FISHGIS PROJECT
PST members sought to clarify the motivations for the project. Why are we doing this for Indonesia, for MAFF, for PICES?
For Indonesian coastal communities: Given the absence of fisheries monitoring and management at local community scales, the project has a considerable potential to improve human well-being.
For MAFF: Its mission is food security for communities (fishers and consumers), ultimately in Japan but through the ODA (Official Development Assistance) Program there also is interest in fostering ways to improve local management of fisheries in developing nations. MAFF recognizes the threats of

First Meeting Appendix 3 – Meeting Reports
52 PICES Scientific Report No. 58
climate change, globalization, water quality etc., and is thus closely aligned with the project goals and anticipated outcomes.
For PICES: Food security and food supply is a key concern for PICES – seeking the balance between understanding the community, its relationship to the local fisheries products, and the science that can sustain these linkages. PICES also has a very clear capacity building component, an important activity where it does not matter if the efforts are within or outside the realm of PICES member countries (e.g., summer schools, conferences for early career scientists, etc. are drawn from worldwide).
4. REVIEW OF PROJECT PLANNING
In the opening discussion phase of the meeting, several general concepts and ideas were exchanged before delving into the specifics of the planned smartphone-based tools. Emphasis was placed on considering the project in whole, rather than limiting the discussion to only the initial steps and not reflecting on the needs for Years 2 and 3.
The “main lessons” from the previous PICES/MAFF project on “Marine ecosystems and human well-being” in Indonesia (MarWeB; https://meetings.pices.int/projects/marweb) provide a good starting point for review while shaping this new project design:
Close communication is needed with the local people to identify their needs and the structure of their well-being;
A key contact person in the country/community is essential for consultations and to provide feedback;
Feedback of results to communities will be critical in order to build trust; Knowledge from both natural and social sciences needs to be integrated to address the issue. So, a
multidisciplinary team is indispensable; Collaborations with local stakeholders for dissemination of information and capacity building are
essential to further develop the program by local initiatives, and to build resilient communities.
We need to identify which climate change parameters can be measured adequately in the project and also to assess what parameters we will assess to quantify the economic effects of better fisheries management through the project. These will be important topics to cover when we consider the specifics of the case study sites.
Selection of case study sites
It was suggested that in choosing the case study sites attention at a minimum should be given to: 1) the likelihood of effective monitoring with the project design, 2) differences in potential economic effects among locations, and 3) logistical feasibility of the locations.
Feedback to the communities
A point was raised about: How do we design the feedback to the community? What form should it take? Our previous MAFF project in Indonesia, MarWeB, is not an ideal example for this project, as it focused much more on the academic findings rather than communicating results to the public. PICES operates in English, so most of this output was not much help for local Indonesians. We must think about how to feed information back to local communities and governments, beyond fisheries managers.

Appendix 3 – Meeting Reports First Meeting
PICES Scientific Report No. 58 53
Local fisheries conditions
The initial questions centered on the type of fisheries activities in the region. What proportion of the fish landings comes from local fishers vs. large-scale fishers? The PST learned from our Indonesian collaborator (Dr. Suhendar I Sachoemar) that >90% are small-scale community fishers, with the bulk of the fisheries going to local or in-country consumption. So, while the central economic importance of the coastal fisheries (to the nation) lies on the offshore export market and the larger-scale fisheries, community sustainability relies on local fishers. The main actors then are the local people, and we need to engage them in science-based discussions, provide information for their decisions/actions, and assist in developing a framework they can use during the longer period.
Fisheries catch monitoring will be based on photos of the catch, but how will we convert this to data, landing sites, fish species, etc.? The thought was to begin the effort by limiting catch information to biomass estimates, and to store photos for later breakdown to species composition. It would then be possible to explore quantifying the diversity of fisheries from data collected at the landing sites.
Data sharing
Concern was expressed that, based on experience in developed nations, there may be resistance to having fishing location data shared widely. If this reluctance is encountered, one option that has been effective for HAB data in the PICES Section on HABs is to consider a 2- to 3-year moratorium on location and catch data (i.e., data are not released for use until 2 to 3 years later). Also in the case of HAB data, those final data would be “blended” among regions to prevent identification of precise location data for problem/high catch sites. Another option would be to convert GPS locations to grid locations to lose location specificity but retain regional data insight. These options need only to be considered if there are indications that fishers are resistant to sharing this information.
We should integrate education and economic assessment into this project. These data then could be combined with the environmental component. It is not clear how to do this without more information on the situation in the case study areas. Likewise, we need to establish what the current fishing rules are, and identify potential topics for education efforts.
Longevity of the project
The project objectives in system design and implementation should be achievable within the time frame of the project but the outcomes will rely on sustained efforts after project completion. So sustainability of the monitoring efforts (i.e., use of the systems we create) will be a critical factor to consider when selecting case study sites. We must work with BPPT (Agency for the Assessment and Application of Technology) and local community members to ensure longevity. We also want to consider how we can develop collaboration with schools, students and young scientists, thereby increasing the likelihood of the program continuing after the project ends. This will be a key topic for discussion during the spring 2018 visit to Indonesia.
5. REVIEW OF OTHER CITIZEN SCIENCE MARINE PROGRAMS AND PROJECTS
There is a need to improve international interest in biodiversity conservation, and to collect large temporal and spatial biological distribution data. This need is beyond the capabilities of a single or small groups of researchers – too expensive, and subject to funding lapses.

First Meeting Appendix 3 – Meeting Reports
54 PICES Scientific Report No. 58
There is a high expectation that citizen science can fill this role. It is a new academic field and research approach to environmental and societal topics. For example, the International Citizen Science Association was established in September 2013, the first Citizen Science Conference was held in February 2015, and a new open-access peer-reviewed journal Citizen Science: Theory and Practice has been published by Ubiquity Press on behalf of the International Citizen Science Association, since May 2016. However, citizen science started back in 18th century (volunteer bird surveys and phenology surveys), and has been expanding rapidly over the past few years. One example is the Christmas Day bird survey (a contest to observe as many different bird species as possible). There also are examples in Japan such as the seasonal biological survey, alien species survey, ecological indicator survey, and agricultural damage survey caused by wildlife.
The smartphone survey tool is readily available, can accept both photographs and videos, and therefore, is a potentially powerful device to enable citizen science. The advantages of citizen science are to raise public awareness on environmental issues and to promote participation of citizens in environmental projects. The limitations of citizen science are a sampling bias that depends on citizen interests, data quality (accuracy/precision can be poor – citizens are not experts), and challenges in constructing sustainable systems. Scientific survey protocols are often a difficult task for citizens, as they are not rigorous observers. This can raise questions about the scientific value of the datasets being generated. There always will be a trade-off between researcher and participant viewpoints, and we will need to keep this in mind.
A Citizen Science Program needs to:
1. Identify and communicate the clear benefits of the effort to participants and communities. Based on experience in Africa, it also helps to provide participants with visible signs of their involvement (e.g., competitions, publication of provider name, copyright income, hats, vests, smartphone covers, etc.);
2. Have a clear strategic and stepwise project design plan: start with a simple survey, and consult with participants to develop consensus (“buy in”). The plan must provide tangible benefits for both scientists and participants.
Programs and projects
Two examples of existing citizen monitoring programs were briefly reviewed: Bleachwatch and Redmap. Bleachwatch originated as a Mote Marine lab program in the Florida Keys National Marine Sanctuary (https://floridadep.gov/rcp/coral/content/bleachwatch) and has since been established in several other locations around the world. The program comprises monitoring for coral bleaching in a mainly tourist-based reporting strategy (ecotourism). Maps are produced every month based on diver inputs. Redmap, or the “Range Extension Database and Mapping Project” in Australia (https://www.redmap.org.au/), deals with range extensions related to climate change and participants include fishers, divers, community people, and naturalists. The project has been operating since 2009, and its premise is to look for species that are unfamiliar to you, take a photo, send it in, and it will be placed on the map. The effort is government funded (national/state), and supported by the University of Tasmania. Both of these programs show the type of scientific outcomes that are possible using public assistance.
An example of a recent project is the Mangrove Project. In 2016, Dr. Shion Takemura, a PST member, developed a smartphone application for community members and ecotourists to provide temporal surveys of the largest mangrove forest in Okinawa (Japan) – the Okukubi River system. Mangroves are important ecosystems, stabilizing coasts and sustaining biodiversity, but forests are declining due to

Appendix 3 – Meeting Reports First Meeting
PICES Scientific Report No. 58 55
mariculture, land use expansion, and pollution. Seasonal floods are needed to maintain the softer soil necessary for seedlings to take hold, but bridge construction activities have led to changes in river flow resulting in altered soil conditions and degradation of forest. The goal of the project was to improve mangrove conservations through observations of dead trees, seedlings, and different tree species. The project explored the feasibility of using the convenient, user-friendly, high performance, and geo-location capabilities of modern smartphones as an observation tool for citizen scientists.
There is a lesson here. While mangrove conservation was a goal of the local government, they were unaware of the plans by the national government for bridge construction until after portions of the forest were cut down. Better communication was required between agencies. To correct this problem for the future, a council of stakeholders, including an ecotourism company, local NGO, local government, state government, and national government representatives was established to optimize communications. We should similarly consider how to optimize communication among all of the Indonesian stakeholders.
For monitoring, photos were classified into seedlings, saplings, dead trees, or other terrestrial plants (invasive in the forest). The focus was to prioritize sites for restoration, and although the participation was relatively small (<20 users), the information provided was highly useful. However, it has been hard to maintain the effort after the research funding ended, so monitoring has been decreasing. We need to identify how to continue the sustained program beyond research funding, so local government funding is needed to keep it going.
Our project will need to:
Identify the key stakeholders and on-site coordinator to help sustain the effort after the project ends; Develop a common interest based on the problem and design the project capacity to be able to apply
to other target areas or functions (e.g., coral reef monitoring by ecotourism in Indonesia or elsewhere); Set up a communication line at the start, from local to national governments, and in particular, to the
community and fishers; Involve schools in the effort to bring both education and involvement, and in the longer term, this
will be a good way to train the parents.
6. EXISTING CITIZEN SCIENCE SMARTPHONE-LINKED RESOURCES
While there is a large number of valuable parameters that contribute to quantifying aspects of water quality and environmental change, only a few are suitable for citizen-science monitoring programs. Even fewer are possible to consider when restricted to a smartphone observing platform. Even so, there are two systems that can be very informative: a smartphone-based app that allows the measurement of water irradiance, and an origami-based microscope that, when being linked with smartphone cameras, can record images of the dominant phytoplankton community.
The HydroColor application
The HydroColor application was developed by Thomas Leeuw and Professor Emmanuel Boss at the University of Maine to provide quantitative water reflectance data of quality sufficient for scientific applications (http://misclab.umeoce.maine.edu/research/HydroColor.php). It works with the camera of smartphones by breaking the color image into red, green and blue components that then are used with established algorithms to generate optically determined parameters. The details, along with uncertainties, are shown in Table 1.

First Meeting Appendix 3 – Meeting Reports
56 PICES Scientific Report No. 58
It can measure some of the primary indicators of water quality such as:
Water turbidity (NTU), Suspended particulate matter (g/cm3), Chlorophyll concentrations (when calibrated).
The application requires three photos; one of an 18% photographer’s grey scale card, one of the sky (to collect data on incoming radiation), and one of the water surface (to gather reflection data). For the latter two, the user is directed on how to point the camera to the appropriate orientation based on latitude, longitude, and time of day. Data in the form of both photos and reflectance data can be uploaded to a server automatically using a Matlab routine, at this point. (We would need to develop a smartphone-based algorithm to accomplish this step.) It is a straightforward sampling approach that, with little training, can provide high quality data in a citizen-science program.
Table 1 List of parameters derived by HydroColor along with the estimated uncertainty for each method. See http://misclab.umeoce.maine.edu/research/HydroColor.php for sources.
Parameter Equation Source Uncertainty
Remote Sensing Reflectance
�𝑏𝑏
𝑏𝑏 + 𝑎𝑝 + 𝑎𝑤�
Mobley 1999 ±15% (mean absolute relative error from Fig. 4, for all channels)
Turbidity 𝑇𝑇𝑇𝑏𝑇𝑇𝑇𝑇𝑇 =
27.7𝑅𝑟𝑟 (𝑅𝑅𝑇)0.05 − 𝑅𝑟𝑟(𝑅𝑅𝑇)
Figure 5 ±36% (mean absolute relative error from Fig. 5)
Suspended Particulate Matter
log10(𝑆𝑆𝑆) = 1.02 log10(𝑇𝑇𝑇𝑏𝑇𝑇𝑇𝑇𝑇) − 0.04 Neukermans et al. 2012
±38% (propagation of error in turbidity and the relationship between turbidity and SPM)
Backscatter Coefficient 𝑇𝑟𝑟 = 0.0949�
𝑏𝑏
𝑏𝑏 + 𝑎𝑝 + 𝑎𝑤�
+ 0.0794�𝑏𝑏
𝑏𝑏 + 𝑎𝑝 + 𝑎𝑤�2
Solved for bb assuming constant a*p
Gordon et al. 1998
±41% (propagation of error in SPM and Rrs)
These data, when calibrated against standard measurements of chlorophyll a (Chl-a) in surface waters, can provide a rapid, inexpensive method to obtain wide spatial measurements of surface concentrations of Chl-a. As the dataset grows, it also could be a resource for ground-truthing of remote sensing analyses of Indonesian coastal waters. It is possible that other Indonesian science agencies may be interested in providing some funding to continue the collection of inshore surface chlorophyll measurements after completion of the project.
The Foldscope
Foldscope is designed to be an ultra-affordable field microscope that can be built from paper. It is designed to be reasonably durable and to give optical quality similar to conventional research microscopes (www.foldscope.com). It has an optical magnification of 140×, which, when coupled to a smartphone, can be increased with the phone’s optical zoom. Its imaging resolution of 2 microns is compatible with almost all smartphones.

Appendix 3 – Meeting Reports First Meeting
PICES Scientific Report No. 58 57
Preliminary work with the Foldscope shows that it can be used to record different phytoplankton species using a smartphone. Automated identification of phytoplankton is emerging as a powerful tool in understanding phytoplankton community structure. It should be possible to use this software potential to study community composition in Indonesian coastal waters. It will be important to train the person(s) collecting the phytoplankton images to visually identify likely toxic species to enable faster notification of toxic blooms. We would want to pinpoint one or more phytoplankton experts in Indonesia who is interested in participating in the project.
Foldscopes are economical, $35 USD for a deluxe kit which contains a number of useful accessories. If it is decided to bring this technology to classrooms, 100 Foldscope classroom kits would cost $350 USD. The optical identification software is open source, so there is no cost to use it. We have a contact name for an NGO that may be very interested in helping to support this aspect of the project.
7. PROTOTYPE FISHGIS APPLICATION
Dr. Shigeharu Kogushi presented a prototype version of the FishGIS application for the Android-based smartphones (http://scfnet.com/androidtest/test.html). The iPhone version will be completed approximately 3 weeks from now. The initial focus was to be on:
1. Illegal, Unregulated and Unreported (IUU) operations (using photos) Local fishers monitor the coastal areas, collecting photos of IUU operations (vessels, gears, etc.)
and sharing them widely on the web with local people and government representatives. 2. Fisheries operations and productions (using photos and interviews) Harvested species, amount, size of fish, type of gear used, fishing efforts, recognitions by the local
people about the resource/ecosystem, etc.
After a brief introduction, PST members discussed a range of topics for consideration. The purpose was to develop a list of issues to be reviewed during and after the preliminary consultation with BPPT staff and community members during the introductory meeting in Jakarta and visits to the potential case study sites.
General issues
It will be important to gain early feedback from local fishers on this draft smartphone-based data system so that we might better modify the design before implementation in the summer 2018 training workshop. We will need to convert the app text from English to Indonesian Bahasa, from both initial training and ongoing use perspectives.
A separate essential issue is whether sufficient numbers of fishers have smartphones at the potential case study sites. The early expectation based on BPPT input is that smartphones are used widely in Indonesian society, but we will need to verify that this is true for the fishers. We also need to find out if there is sufficient cellphone signal strength to support data (and photo) transfers.
Quantification strategy
Is it necessary to have specific location data for where fish are caught, or is it sufficient to assume the fishing area based on the landing site? Conversely, can location data be gleaned by converting GPS data to a larger-scale grid area so site specificity is lost? Would a grid large enough to satisfy potential concerns of fishers be acceptable for fisheries managers? It is likely that catch photos will be done in

First Meeting Appendix 3 – Meeting Reports
58 PICES Scientific Report No. 58
port (not at sea where it is less convenient and fishers may be reluctant to give away location data). Perhaps focusing just on the size of the catch for now is best. Or do we also ask the fishers whether the catch was normal, high, or low, or if they found the normal fish species, or odd fish species; all using different color buttons to answer? Can we calibrate the catch, using maybe a PICES “fish” cutout, i.e., place it on the pile of fish and use it as a calibration tool?
Do we need to know specific number of hours for each catch, or can we decide with interviews what the average fishing day is and work with that? Do we need to know the vessel type, or are they comparatively uniform in each fishery region?
Should we consider asking port landing personnel to take photographs of fish to collect fish size/species data? Can we use results on the commodity chain analysis from the MarWeB project to help inform us for this project?
Does the type of fishing community matter for testing how well our system works? That is, would fishers embedded close to very large population centers participate differently than those in more remote regions? The opinion was expressed that socio-economic capacity (i.e., how well the community functions as a whole) likely will affect how well the fishery operates and maybe how well the smartphone approach will work.
Fishing gear
Should information about the fishing gear be recorded to better quantify the degree of fisheries catch? For example, if each fisher uses only a single gear type, we could incorporate that into the registration for downloading the app. Is it reasonable to request fishers to add other information about the catch if possible (e.g., other videos and audios could be very useful for communication among local fishers)?
Data reporting to fishers
How much information, and in what form, will fishers want to access, or be able to access? Or do we simply generate catch summaries for each month? It is feasible to set the level of information available to individual fishers, so that data reports could be customized for each community?
Database
The data server currently is based in Japan, but the server and data repository would be transitioned to BPPT or another Indonesian agency. We would want the agreement in principle that we could retain access to these data to help review and refine the data collection systems. There will be additional costs associated with these updates.
Costs for the smartphone-based system
The on-going costs for the smartphone-based system will continue after the completion of the project (e.g., system maintenance, updates to accommodate new cellphone operating systems). One approach would be for BPPT to buy the system from the company (expensive up-front cost) and then a smaller fee whenever there is an OS update for the phones), or they could rent the system (no cost for upgrades) at ~ $600/ month. Are these costs too much after the project ends? The benefit of renting is that it makes it easier to do revisions of the system down the road (maybe next MAFF project?).

Appendix 3 – Meeting Reports First Meeting
PICES Scientific Report No. 58 59
IUU
The consideration here is domestic IUU (e.g., wrong fishing times, wrong fishing gear, wrong fishing area). One idea is for fishers to take a photo of the IUU vessel, provide it to the community, and identify the responsible persons. Enforcement steps then would be up to the local government or others to undertake. It will be important that the information provider is kept anonymous. We would need to modify the software so that photographs of the IUU vessels are encrypted and protected. Otherwise it would be possible for individuals to “doctor” photographs of vessels to change the location data before uploading them to the system. This could be a critical problem, as it would be a disincentive to participate in the program.
Community surveys
Do we want to design a questionnaire on the smartphone app to acquire additional specific information? The questionnaire could ask the fishers about whether they feel fish size is increasing or decreasing. We also might consider adding a picture quiz: show different fish species and ask about relative change in their numbers over time. This type of “expert” information not only is useful but is also acknowledgement of our interest in their views may increase motivation.
Such a questionnaire might be done on a weekly/monthly basis and could be answered on the smartphone. Other information of interest includes income and operation costs (fuel, gear, etc.). Knowing income would be an important measure for assessing the overall impact of the project, but there is fear that responses will not be truthful. Should we instead estimate income based on catch size?
Student engagement
How might we work to incorporate students into the monitoring effort? We might be able to do this with the Foldscopes and phytoplankton speciation, but this will depend on what we learn about the local schools.
Observations and Recommendations
1. Create a list of existing examples of citizen-science observational programs in the Year 2 workplan to set the stage by showing what currently exists elsewhere. Developing countries do not have the same resources for monitoring, so it appears to be an ideal approach to take advantage of the existing citizen-based science elsewhere that could help to design a citizen-based fisheries/ environmental monitoring program.
2. Determine whether costs to citizen scientists for data uploading will be prohibitive. Will it be necessary to pay participants or create other financial incentives?
3. While we do whatever we can to ensure sustainability of the program, a significant output of the project will be the system itself, which can be utilized broadly in other regions and developing nations as a teaching tool. An example is the Harvard case studies, which are sold ($800).
4. We also want to consider stakeholders from outside the country, e.g., tourist divers as a means to collect data. (It was decided to shelve this idea for consideration later in the project.)
5. We must consider how we will analyze these data. This is probably more straightforward for the HydroColor data (investigate changes in water quality over time), but it is less clear for the fishery, IUU, and phytoplankton datasets. How will these be utilized?
6. We also must work on the approaches to generate the motivation for participants to engage in the program (convey tangible benefits), and work to avoid citizen science “fatigue” (i.e., minimize the level of what is asked of participants). Rapid feedback to the observers in some form (ideally what

First Meeting Appendix 3 – Meeting Reports
60 PICES Scientific Report No. 58
form?) would help to achieve this goal. How we are going to share our findings on the appropriate time scales and detail to help avoid fatigue? On the motivation side, equip the volunteers with clothing to make their participation “special”. This strategy, though simple, has worked well in other projects led by PST members.
7. We need to consider doing a “survey” of the managers/persons who might be involved to help to make sure that our research framework is solid. How do we systematically find the right stakeholders at any of the case study sites?
8. The concept of fisheries management is not well understood by local communities, which raises the question of how to develop their enthusiasm for the project. One potential approach: “Your problems with declining fisheries are not unique, we all want to reverse this problem, we have an idea of how we can start, and we want your help to test it. If it works well, as we think it could, then we can use this elsewhere in Indonesia, but you will be recognized as the leaders.”
9. Focus on resiliency and food security, etc. in relation to the communities. Use case studies as a means to learn/teach how to do this, and transform this new knowledge into a project output.
10. Think about how the project can be transferred to other regions in terms of education, monitoring, and data decisions. It was noted by one PST member that many ODA projects have failed because they did not involve the next generation.
11. The targets for capacity building by PICES in previous years were early career scientists and students, but more and more the focus has shifted to school age children. Most of these have been with English speaking schools in various countries; that would not be the case here so there will be challenges in this respect in Indonesia. It was noted that JICA (Japan International Cooperation Agency) counts education advances as a project product. But what level of school do we target? Or will this decision be simple, depending on the case study sites, as they may not have all education levels locally?
8. CASE STUDY SITES
Some key criteria for site selection include:
1. Differences in existing water quality (likely to principally be the degree of cultural eutrophication); 2. The degree of community dependence on the fishery. There was suggestion that optimal sites would
have communities that are strongly dependent on the fishery for sustenance, but then arguments that communities which shipped a significant portion of the catch to large cities might be better test cases;
3. Differences in human pressures (on the environment, on fishing practices); 4. The degree of local government support for the project; 5. Differences in the sophistication of fishing activities; 6. Sites that can be treated as independent “tests” of the system design so we can assess performance
under different conditions.
At this early stage, BPPT suggested two potential sites for PST consideration: Muara Gembong, West Java Province (Site 1), and Cilincing, North Jakarta (Site 2). Both sites are facing Jakarta Bay and may be good choices for logistics, economic, and fisheries perspectives. Site 1 has plans for a substantial increase in pond aquaculture, so looking for changes in wild fisheries here would be very useful. Site 2 is highly populated, highly polluted, and has a large number of fishers (>2,500).
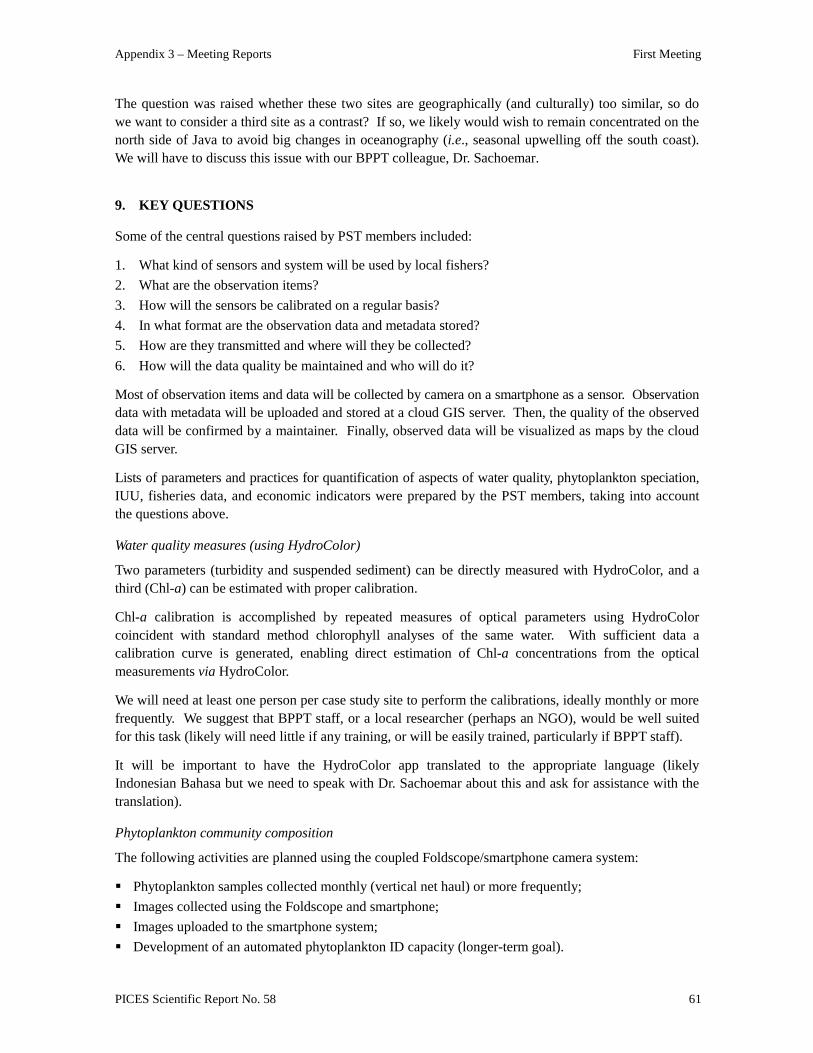
Appendix 3 – Meeting Reports First Meeting
PICES Scientific Report No. 58 61
The question was raised whether these two sites are geographically (and culturally) too similar, so do we want to consider a third site as a contrast? If so, we likely would wish to remain concentrated on the north side of Java to avoid big changes in oceanography (i.e., seasonal upwelling off the south coast). We will have to discuss this issue with our BPPT colleague, Dr. Sachoemar.
9. KEY QUESTIONS
Some of the central questions raised by PST members included:
1. What kind of sensors and system will be used by local fishers? 2. What are the observation items? 3. How will the sensors be calibrated on a regular basis? 4. In what format are the observation data and metadata stored? 5. How are they transmitted and where will they be collected? 6. How will the data quality be maintained and who will do it?
Most of observation items and data will be collected by camera on a smartphone as a sensor. Observation data with metadata will be uploaded and stored at a cloud GIS server. Then, the quality of the observed data will be confirmed by a maintainer. Finally, observed data will be visualized as maps by the cloud GIS server.
Lists of parameters and practices for quantification of aspects of water quality, phytoplankton speciation, IUU, fisheries data, and economic indicators were prepared by the PST members, taking into account the questions above.
Water quality measures (using HydroColor)
Two parameters (turbidity and suspended sediment) can be directly measured with HydroColor, and a third (Chl-a) can be estimated with proper calibration.
Chl-a calibration is accomplished by repeated measures of optical parameters using HydroColor coincident with standard method chlorophyll analyses of the same water. With sufficient data a calibration curve is generated, enabling direct estimation of Chl-a concentrations from the optical measurements via HydroColor.
We will need at least one person per case study site to perform the calibrations, ideally monthly or more frequently. We suggest that BPPT staff, or a local researcher (perhaps an NGO), would be well suited for this task (likely will need little if any training, or will be easily trained, particularly if BPPT staff).
It will be important to have the HydroColor app translated to the appropriate language (likely Indonesian Bahasa but we need to speak with Dr. Sachoemar about this and ask for assistance with the translation).
Phytoplankton community composition
The following activities are planned using the coupled Foldscope/smartphone camera system:
Phytoplankton samples collected monthly (vertical net haul) or more frequently; Images collected using the Foldscope and smartphone; Images uploaded to the smartphone system; Development of an automated phytoplankton ID capacity (longer-term goal).

First Meeting Appendix 3 – Meeting Reports
62 PICES Scientific Report No. 58
We will need at least one person per case study site to measure the plankton composition (researcher, government person, or NGO), monthly at a minimum. Samples will be examined by Foldscopes or by microscopes, with images of abundant phytoplankton captured on smartphones. Image uploads will be analyzed by phytoplankton taxonomists in Indonesia (trained in an earlier PICES/MAFF project on “Development of the prevention systems for harmful organisms’ expansion in the Pacific Rim” (2007–2012)), and ultimately using automated AI software. Ideally we would have a person in Indonesia who can oversee the effort, checking species ID or contacting those who could confirm. Initial ID would be to genus level. Species level may be beyond the scope of the project.
There is a question about how we might work this into an educational component. Foldscopes are inexpensive, but we need to identify the right individuals to bring it to the classroom.
IUU identification and reporting
Photographs to be taken with a smartphone, with location ID captured; Identification of domestic IUU type: Wrong fishing area, wrong fishing type, wrong fishing time; Reports to be forwarded to the appropriate target (national or state, government, enforcement agencies,
or other).
There was some discussion about the need to capture the image and location simultaneously, without the ability of an informed user to modify the location. The concern was that images could be doctored. Use of a HydroColor type approach for image capture would be better than the current design. Dr. Kogushi will investigate the options, recognizing that there likely will be some additional cost to the project.
Fishery monitoring
This aspect of the project is perhaps the most challenging, as it requires experimentation and assessment at both the technological level and using fisheries monitoring strategies.
Effort distribution (where does fishing occur and how does it change over time?); Duration or time spent fishing (how do we get this?); Catch (by photo with a calibration using “PICES” fish); Condition of catch (fish disease, different species appearing, species disappearing) (questionnaire?); Needs (questionnaire); Ecosystem health (questionnaire); Fishing income (questionnaire or estimated from catch size and value); Operation costs (fuel, gear, etc.) (questionnaire).
Getting information about the effort distribution may be problematic, as fishers often do not wish to have that known. We might be able to extract that from the water quality survey data, but it is uncertain that the two will coincide. Drawn from earlier discussions – perhaps we can suggest that location data are not available until after a 3-year delay. That way, ultimately the location information can be accessed. Alternatively, we could develop an algorithm that converts phone GPS data into position within a set grid pattern – losing the specificity, but still getting information on the general fishing area.
Similarly, fishing duration may be problematic, but we might be able to assume a uniform effort. Questionnaires, developed in consultation with the fishers, could be sent to each smartphone on a weekly or monthly basis. Alternatively, is it possible to use smartphone buttons at the time of photo upload to

Appendix 3 – Meeting Reports First Meeting
PICES Scientific Report No. 58 63
get some of this information? We have to be very sensitive, though, to observer fatigue for the sake of longevity of the project.
At this point we do not have enough information about the fisheries in the case study areas to know the best level of balance between data needed (vs. wished for) and willingness of the fishers to participate. We will need information about the fishers, port landing people, government officers, and researchers in the case study areas.
Other information needed
1. What are the fundamental statistics for the fisheries in the case study areas? 2. What are the landing sites in the case study region? 3. What information from the fishers can we expect to have (fishing gear, fishing duration, etc.)? 4. Are there fishing associations/cooperatives we can partner with? 5. What stakeholders should be at the table on this project (national and local governments, fisheries
agencies, fisheries enforcement, etc.)? 6. Who should be our on-site coordinators for the case study sites? 7. Are there NGOs in Indonesia that can assist with the project, particularly with sustaining the program
after the end of the project? 8. What is the value of the market, and are there value (commodity) chain data for the region? 9. What are the phone charges for data use (data and photo uploads)? 10. What is the situation with domestic IUU in the case study regions? 11. What is the degree of cultural eutrophication in the case study regions (does it differ)? 12. What are the characteristics of the community, and what level of social capital exists? 13. Will there be Indonesian funding to continue the program after project completion? 14. What are the ways that BPPT can help with the project/program?
10. SITE VISITS
One of the critical elements for the first year of the project is a visit of PST members and invited experts to Indonesia in order to:
1. Consult with BPPT colleagues on project implementation; 2. Finalize the selection of case study sites; 3. Identify the key local individuals who will participate in the project, the type of capacity building
needed, and the logistics for providing this training.
This trip will be during the week of March 19, arriving by Sunday, March 18 and leaving on Saturday, March 24. Most of the PST members are expected to participate. We plan to visit two sites: Muara Gembong West Java Province, and Cilincing area, North Jakarta. The specific tasks for the visit will be to:
1. Test the smartphone-based GIS system; 2. Visit the sites and try the system; 3. Discuss with the local community about participants; 4. Discuss whether there are there other parameters that we should consider, based on discussion with
communities;

First Meeting Appendix 3 – Meeting Reports
64 PICES Scientific Report No. 58
5. Discuss whether we need to pay or compensate participant costs and if so, how this could be done? 6. Select a third case study site if possible to add in Year 2.
The trip should involve presenting the ideas to Dr. Sachoemar and his group at BPPT for their feedback, conducting discussions with fishers in the potential case study sites, and having a follow-up meeting with the BPPT group to discuss what was learned and decide on how best to proceed. There is an extra day built into the program for additional needs (e.g., visiting a third case study site?).
Tentative Schedule for March 2018
Monday: Meeting at BPPT with Dr. Sachoemar and his group Tuesday: Site 1 visit, roundtable with fishers Wednesday: Site 2 visit, roundtable with fishers Thursday: Meeting at BPPT to review what was learned, or other people we should talk to, and discussion about a third case study site Friday: Wrap up meeting at BPPT Saturday: Depart
Issues
1. The primary issue will be: How do we engage the participants to join the program, and then sustain the program (i.e., avoid observer fatigue)? Based on experience in Africa, it was suggested that we focus on a single, informal (no front table) group interaction in each of the case study sites. Invite fishers to come and talk (bring Coke, food, and swag such as hats that would help bring them in). We could work through the fishing associations/cooperatives, if possible, to select a group of potentially interested participants (20 or so fishers). The purpose is to identify their concerns, the problems they see in the fishery, and explain our concerns and the project. It will be important to not “rush” them; let them talk and perhaps bring in other fishers. Plan to spend as much time as they wish to talk with us about their fisheries.
2. These interactions will help us understand better their perspective, which will inform us on how best to design the smartphone-based observation system. For example, how important is domestic IUU to them? Are there other issues more important that we can incorporate into our plans?
3. This is not the right time for clicker interviews because we do not know what the important questions are to ask. The goal will be to learn what the fishers feel is important but we want to develop a list of “probes” (questions) to ensure that they cover what we would like them to ask or tell us about.
4. We also need to identify who will be responsible for the Chl-a calibrations at the case study sites, and who will lead the phytoplankton sampling program. These will be among the tasks for the first meeting with Dr. Sachoemar at BPPT.
5. We also will want to use the site visit to observe the landing sites in operation (perhaps begin at 0500 h), and identify persons at the landing sites who could assist in the project.
6. We need to communicate what our wishes are for the visit to Dr. Sachoemar so that he can make the preparations. We want to make sure his team is present for the two meetings at BPPT. He will have to identify our contacts at the case study sites and arrange for the meeting times. It will be important to explain him the unusual strategy for the fisher meetings. In the previous MAFF project, community meetings were structured to convey that we were experts – we want these meetings to convey that the fishers are the experts and we are there to learn.

Appendix 3 – Meeting Reports First Meeting
PICES Scientific Report No. 58 65
11. YEAR 1 BUDGET AND BUDGET MODIFICATIONS
It was agreed to use November 23, 2017 as the starting date of the project (the date when PICES submitted a formal request of contribution to the Consulate General of Japan in Vancouver). Dr. Bychkov gave a brief summary of the budget for Year 1, and emphasized that we will not be able to roll unused funds from Year 1 over to Year 2, which begins on April 1, 2018. Our plan then, after the site visit in March 2019, is to direct any maximum possible funds to the contract for the development of the smartphone-based GIS system and to preparations for a Year 2 summer 2019 training workshop. We also need to identify all possible expenses for expendables to be used in the training workshops, etc. during the week of the first site visit. These can be then purchased on Year 1 funds.
Appendix 1
First Project Science Team meeting participants
Members Observers Alexander Bychkov (PICES, ex-officio) Shigeharu Kogushi (GFL, Japan) Vladimir Kulik (MONITOR/Russia) Tomowo Watanabe (MAFF/JFA, Japan) Joon-Soo Lee (TCODE/Korea)* Mitsutaku Makino (HD/FUTURE/Japan; Co-Chairman) Shion Takemura (HD/Japan) Naoki Tojo (FIS/Japan) Charles Trick (S-HAB/Canada) Mark Wells (S-HAB/USA; Co-Chairman) Chang-an Xu (China) * not present at the meeting Appendix 2
First Project Science Team meeting provisional agenda
Day 1 (January 17, 2018)
1. Welcome remarks, introductions, adoption of the agenda, nomination of the rapporteur Discussion 1: General framework, objectives and deliverables of the project 2. Background of the project 3. Motivation and value of the FishGIS project 4. Review of project planning Discussion 2: Scientific/analytical issues and approaches (including the review of the existing studies) 5. Review of other citizen science marine programs and projects

First Meeting Appendix 3 – Meeting Reports
66 PICES Scientific Report No. 58
Day 2 (January 18, 2018)
Discussion 3: Co-research and linkage with the local communities, government, researchers, and other stakeholders (including the trial of the mobile-phone-based GIS system developed by GFL) 6. Existing citizen science smartphone-linked resources – HydroColor and Foldscope 7. Prototype FishGIS application 8. Case study sites 9. Key questions
Day 3 (January 19, 2018)
Discussion 4: Field trip to Indonesia in March 2018 10. Site visits Discussion 5: Budget, deliverables, Year 2 workplan, and the time schedule until the end of the project (March 2020) 11. Year 1 budget and budget modifications Wrap up of the meeting
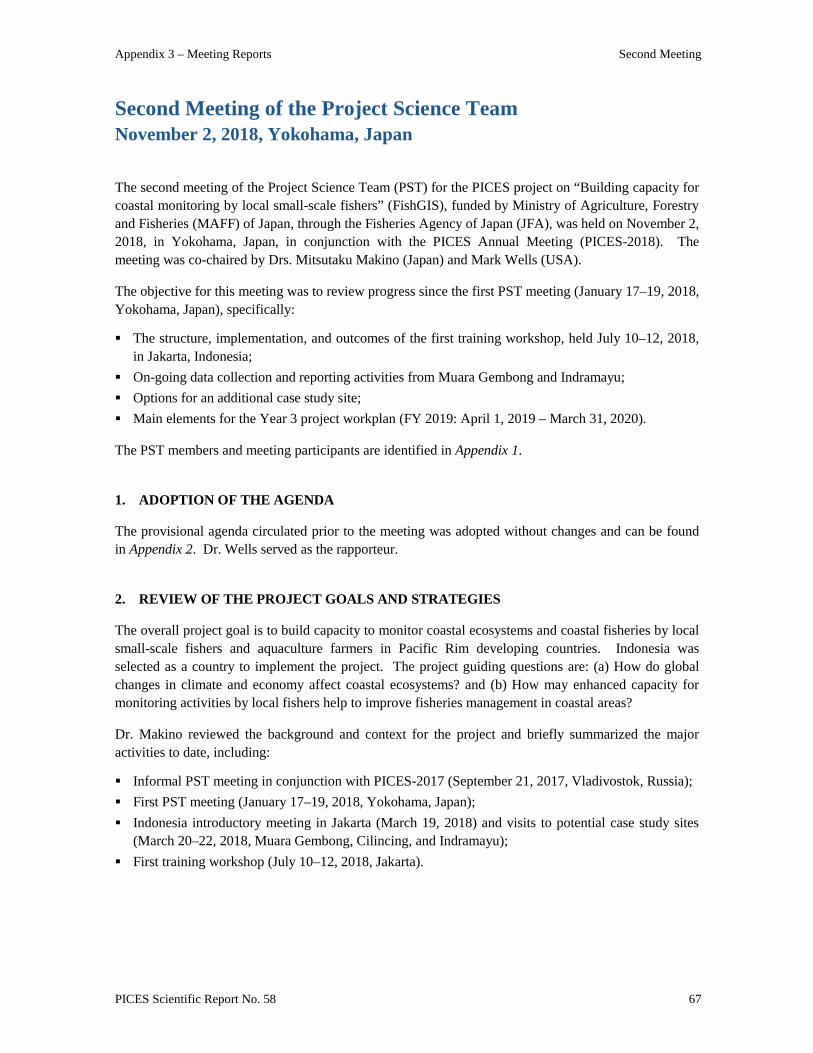
Appendix 3 – Meeting Reports Second Meeting
PICES Scientific Report No. 58 67
Second Meeting of the Project Science Team November 2, 2018, Yokohama, Japan
The second meeting of the Project Science Team (PST) for the PICES project on “Building capacity for coastal monitoring by local small-scale fishers” (FishGIS), funded by Ministry of Agriculture, Forestry and Fisheries (MAFF) of Japan, through the Fisheries Agency of Japan (JFA), was held on November 2, 2018, in Yokohama, Japan, in conjunction with the PICES Annual Meeting (PICES-2018). The meeting was co-chaired by Drs. Mitsutaku Makino (Japan) and Mark Wells (USA).
The objective for this meeting was to review progress since the first PST meeting (January 17–19, 2018, Yokohama, Japan), specifically:
The structure, implementation, and outcomes of the first training workshop, held July 10–12, 2018, in Jakarta, Indonesia;
On-going data collection and reporting activities from Muara Gembong and Indramayu; Options for an additional case study site; Main elements for the Year 3 project workplan (FY 2019: April 1, 2019 – March 31, 2020).
The PST members and meeting participants are identified in Appendix 1.
1. ADOPTION OF THE AGENDA
The provisional agenda circulated prior to the meeting was adopted without changes and can be found in Appendix 2. Dr. Wells served as the rapporteur.
2. REVIEW OF THE PROJECT GOALS AND STRATEGIES
The overall project goal is to build capacity to monitor coastal ecosystems and coastal fisheries by local small-scale fishers and aquaculture farmers in Pacific Rim developing countries. Indonesia was selected as a country to implement the project. The project guiding questions are: (a) How do global changes in climate and economy affect coastal ecosystems? and (b) How may enhanced capacity for monitoring activities by local fishers help to improve fisheries management in coastal areas?
Dr. Makino reviewed the background and context for the project and briefly summarized the major activities to date, including:
Informal PST meeting in conjunction with PICES-2017 (September 21, 2017, Vladivostok, Russia); First PST meeting (January 17–19, 2018, Yokohama, Japan); Indonesia introductory meeting in Jakarta (March 19, 2018) and visits to potential case study sites
(March 20–22, 2018, Muara Gembong, Cilincing, and Indramayu); First training workshop (July 10–12, 2018, Jakarta).

Second Meeting Appendix 3 – Meeting Reports
68 PICES Scientific Report No. 58
3. PROGRESS REVIEW
3.1 Jakarta training workshop (July 10–12, 2018)
Before the first site visit in March 2018, consultations with Dr. Shuhendar I Sachoemar (Director of BPPT Center for Development, Education and Training) led to the suggestion that a third site be added for consideration: Indramayu. This district lies on the northern shore of Java Island to the east of, and separate from Jakarta Bay. It was selected as one of the project sites, along with Muara Gembong, while Cilincing was found to not meet the selection criteria.
The PST briefly reviewed the July 2018 workshop design and implementation and discussed whether changes in format might be beneficial. In general, PST members felt the workshop achieved its planned goals for introducing the rationale of fisheries and environmental monitoring, and providing hands-on training with the smartphone apps and Foldscopes. The linkage with Harmful Algal Bloom (HAB) scientists from LIPI (Indonesian Institute of Sciences) was viewed by the PST as being highly successful and a vital component of the project.
3.2 Communication with community members
Despite the enthusiastic participation of community members during the workshop, there have been few data uploaded from the apps over the summer and early fall (only 12 datasets for HydroColor from Muara Gembong). Although some HydroColor data were uploaded in Indramayu, direct communications with community members showed that there still was some confusion about how to use this app. There were fewer data uploads from FishGIS. We need to understand why.
There are two central problems: (1) difficulty getting the apps to function on community member smartphones, and (2) confusion on how to operate the apps where they functioned. It was determined that most of the difficulties in downloading the apps and having them function are linked to the older OS versions that many fishers are using (e.g., Android version 4.0). In a few cases, the off-market cell phones lacked GPS and orientation capabilities essential for operation of the HydroColor app. It was suggested that we either look at having the apps modified so they can work on the older OS systems, or that we focus instead on a subset of community members that does not have this problem (see below).
The confusion on app operations showed that continued education was necessary. It was suggested to define a key person in each community who is highly trained in the operation of the apps, and responsible for helping other community members. That person would then be able to organize the local people to help build the datasets (see below). It was mentioned that we should continue to explore whether Indonesian satellite researchers would be interested in participating/supporting the HydroColor data collections and calibration.
3.3 Repeat training – Indramayu
Dr. Naoki Tojo has taken the lead in communicating with Indramayu community members, making several contacts in the community. They are very interested in participating but are confused on how best to proceed. He proposed a second site visit to Indramayu to assist in application of the tools and to help answer questions. This trip would allow us to better refine modifications of the FishGIS app and training for practical/sustainable citizen-science application of the project tools, and provide encouragement for continued participation. Dr. Tojo presented a form used to collect fishing information, and will investigate how to improve training for operating the apps. PST members endorsed a plan for Dr. Tojo and two Hokkaido University graduate students to travel to Indramayu in early December

Appendix 3 – Meeting Reports Second Meeting
PICES Scientific Report No. 58 69
2018. He generously offered to partially cover the expenses for this visit from independent funding sources.
3.4 Quantifying fish catch
Dr. Tojo presented some of the images of the catch taken with the FishGIS app, showing it was a complex mixture of different species, fish sizes, crustaceans, etc. Several issues then were discussed regarding how to best quantify fish catch for fisheries monitoring from these types of photos.
Would it be reasonable to have one or two fishers give a list of what was caught to go with the photo?
Should the catch photo be taken from one net haul, or at the end of the day (multiple catches, maybe with different gears)?
Is it best/most practical to have a photo taken when the catch is sorted? In this case though, we would not have position data for the catch – only local region data.
Most of these photos were obtained in Indramayu, where the locals fish mainly from the lagoon in very small boats. The situation will be different for other sites which may use larger boats for open water fishing.
4. PLANNING FOR THE REMAINDER OF YEAR 2 OF THE PROJECT
4.1 Additional case study sites
Discussions during the wrap-up meeting held after the July 2018 workshop recognized the importance of follow-up meetings with Muara Gembong and Indramayu fishers to gain more feedback on the apps. In addition, it was decided to add two more communities to the project from areas with different fisheries and fishing cultures. In consultation with Dr. Sachoemar, it was decided to explore the interest of Pelabuhan Ratu, on the southwest coast of Java, and Serang, in Banten Province on the northwest region of Java. An original plan to use Yogyakarta, due to close contacts there, was decided against because of logistical problems and high expenses associate with the necessary air travel. Both Pelabuhan Ratu and Serang responded with great interest, and with an invitation for us to conduct training in July, 2019.
PST members agreed to follow the same strategy as for the first year of the project, specifically, to plan a 5-day visit to potential case study sites (Serang and Pelabuhan Ratu) for February 2019. The purpose of this visit will be to: (1) inform these communities about the project and seek their feedback on the observational parameters of importance, (2) provide initial training in the use of the FishGIS and HydroColor apps and Foldscopes, and (3) identify a limited number of the key individuals to bring to Jakarta or Serang for a training workshop in July 2019.
4.2 Updates on the FishGIS and HydroColor apps
Consultations with Muara Gembong and Indramayu community members at the July 2018 workshop led to suggestions for a number of modifications to the initial version of the FishGIS app to improve the workflow, icon representations, and understanding. These changes were presented and reviewed by PST members.
PST members agreed that the FishGIS app needed revising so it will work back to the Android version 4.4, and translating to Indonesian Bahasa. They approved the expense (30K) for these purposes.

Second Meeting Appendix 3 – Meeting Reports
70 PICES Scientific Report No. 58
Similarly, a separate version of the HydroColor app created in Bahasa will be revised to work down to Android version 4.4 for 1K, and the normal $3 USD for downloading this app was waived by the creator (T. Leeuw). These changes will expand the opportunity for choosing the right community person to lead the effort, and allow us to have a larger pool of fishers to work with. It was also noted that some fishers, when at sea, take old phones out with them rather than their newer phones.
A file of English words for icons in the FishGIS app and instructions for using the app will be sent to Dr. Sachoemar for translation to Bahasa.
4.3 FishGIS output/reporting
Dr. Shion Takemura presented different approaches for creating data visualizations from the uploaded data. PST members discussed the use of RStudio for data visualizations. It was noted that the open source version does not work well with multiple users, and the subscribed version (10K/year) is better in this aspect. Given this expense, it seems more appropriate to using R to create maps and other information feedback. This might be an opportunity to bring in the assistance of students. It was also suggested to decrease the size of the pins in the maps generated by the FishGIS app, and expand the map size to cover more of the smartphone screen.
Products to include: fish data, water quality data, satellite data. We should consider what real-time data we can provide (e.g., red-tide warnings). Dr. Makino brought attention to a weather forecast site that covers Indonesia and wondered if this information might be useful as a product accessed through the FishGIS app. If so, we would want to reduce the scale so that it focuses on West Java, rather than globally as now.
5. PLANNING FOR YEAR 3 OF THE PROJECT
In Year 3, the PST will continue to concentrate on 4 topic areas:
1. Develop, test, and refine the tools (apps); 2. Strengthen community connections to generate the feedback that leads to sustainability; 3. Monitor for HABs (species identification); 4. Take the lessons learned during the project and publish to show what can be done for small-scale
fishers in developing (and developed) countries (a possible academic product – an article in Ambio).
The PST agreed that the following elements have to be included in the Year 3 workplan:
Order 100 Foldscopes for project monitoring, and an additional 200 Foldscopes for LIPI to facilitate their plans for HAB training in the target and other coastal communities;
Develop an improved manual for using the tools in time for the July 2019 workshop; Conduct a training workshop in July 2019 in Jakarta or Serang, followed by a meeting with BPPT
and LIPI staff to discuss workshop outcomes; Convene the third PST meeting in October 2019 in Victoria, Canada, in conjunction with PICES-2019; Organize a final evaluation trip to Indonesia, including a fourth PST meeting, in February/March
2020; Complete the evaluation and final report by June 2020.

Appendix 3 – Meeting Reports Second Meeting
PICES Scientific Report No. 58 71
Dr. Bychkov gave a summary of the remaining budget in Year 2 to support the February 2019 site visit and July 2019 training workshop planning and pointed out that Year 3 of the project is anticipated to have a 10–15% reduction in the budget.
One of the central questions is: Beyond gaining data for fisheries and environmental monitoring, what other data/findings feedback to the communities should we be developing? A range of possible products was discussed, but it was decided that BPPT should be enlisted to help in this decision.
6. OTHER BUSINESS
Remaining comments and questions:
1. Are there bathymetry data that can be made available for any modeling efforts down the road? 2. One output that could be developed is a general conceptual model for before and after the project
for at least one of our sites. 3. We should plan to present a project overview at the PICES-2019 Science Board Symposium. 4. How much progress has been made on collecting chlorophyll concentrations for calibrating the
HydroColor app? 5. What is our target for data upload events per month?
Appendix 1
Second Project Science Team meeting participants
Members Alexander Bychkov (PICES, ex-officio) Vladimir Kulik (MONITOR/Russia) Joon-Soo Lee (TCODE/Korea) Mitsutaku Makino (HD/FUTURE/Japan; Co-Chairman) Shion Takemura (HD/Japan) Naoki Tojo (FIS/Japan) Charles Trick (S-HAB/Canada) Mark Wells (S-HAB/USA; Co-Chairman) Chang-an Xu (China)
Observers Ayumi Kanaya (student, Hokkaido University, Japan) Shigeharu Kogushi (GFL, Japan) Takaaki Mori (student, Hokkaido University, Japan) Suhendar I Sachoemar (BPPT, Indonesia)
Appendix 2
Second Project Science Team meeting provisional agenda 1. Welcome remarks, introductions, adoption of the agenda, nomination of the rapporteur 2. Review of the project goals and strategies 3. Progresses review
3.1 Jakarta training workshop 3.2 Communication with community members 3.3. Repeat training – Indramayu 3.4 Quantifying fish catch

Second Meeting Appendix 3 – Meeting Reports
72 PICES Scientific Report No. 58
4. Planning for the remainder of Year 2 of the project (ending in March 31, 2019) 4.1 Additional case study sites 4.2 Updates on the FishGIS and HydroColor apps 4.3. FishGIS output/reporting
5. Planning for Year 3 of the project (ending in March 31, 2020) 6. Other business

Appendix 3 – Meeting Reports Third Meeting
PICES Scientific Report No. 58 73
Third Meeting of the Project Science Team October 16, 2019, Victoria, Canada
The third meeting of the Project Science Team (PST) for the PICES project on “Building capacity for coastal monitoring by local small-scale fishers” (FishGIS), funded by Ministry of Agriculture, Forestry and Fisheries (MAFF) of Japan, through the Fisheries Agency of Japan (JFA), was held on October 16, 2019, in Victoria, Canada, in conjunction with the PICES Annual Meeting (PICES-2019). The meeting was co-chaired by Drs. Mitsutaku Makino (Japan) and Mark Wells (USA).
The objective for this meeting was to review progress since the second PST meeting (November 2, 2018, Yokohama, Japan), specifically:
The structure, implementation, and outcomes of the second training workshop, held July 10–11, 2019, in Serang, Indonesia;
Data collections using the FishGIS app, HydroColor app and Foldscope; Migration of the primary database server from Japan to Indonesia; Planning for site visits and final PST meeting in March 2020; Timelines for project final reports and products and framework for post-project assessment.
The PST members and meeting participants are identified in Appendix 1.
1. ADOPTION OF THE AGENDA
The provisional agenda circulated prior to the meeting was adopted without changes and can be found in Appendix 2. Dr. Wells served as the rapporteur.
2. REVIEW OF THE PROJECT GOALS AND STRATEGIES
The overall project goal is to build capacity to monitor coastal ecosystems and coastal fisheries by local small-scale fishers and aquaculture farmers in Pacific Rim developing countries. Indonesia was selected as a country to implement the project. The project guiding questions are: (a) How do global changes in climate and economy affect coastal ecosystems? and (b) How may enhanced capacity for monitoring activities by local fishers help to improve fisheries management in coastal areas?
Dr. Makino reviewed the background and context for the project, the five monitoring items: (1) water quality (turbidity, suspended particulate matter, and chlorophyll), (2) fish catch, (3) Illegal, Unregulated and Unreported (IUU) operations, (4) floating garbage (plastics), and (5) toxic plankton (e.g., red tides, or harmful algal blooms), and briefly summarized the major activities to date, including:
Informal PST meeting in conjunction with PICES-2017 (September 21, 2017, Vladivostok, Russia); First PST meeting (January 17–19, 2018, Yokohama, Japan) Indonesia introductory meeting in Jakarta (March 19, 2018) and visits to potential case study sites
(March 20–22, 2018, Muara Gembong, Cilincing, and Indramayu); First training workshop (July 10–12, 2018, Jakarta); Second PST meeting in conjunction with PICES-2018 (November 2, 2018, Yokohama, Japan);
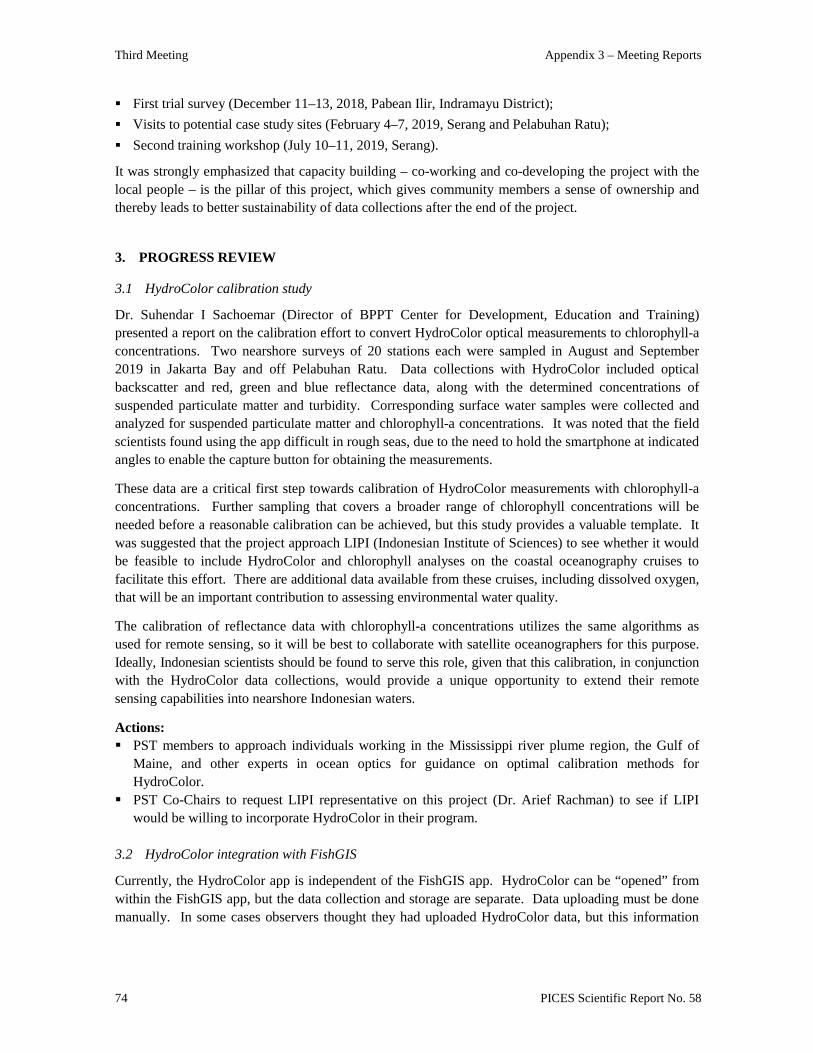
Third Meeting Appendix 3 – Meeting Reports
74 PICES Scientific Report No. 58
First trial survey (December 11–13, 2018, Pabean Ilir, Indramayu District); Visits to potential case study sites (February 4–7, 2019, Serang and Pelabuhan Ratu); Second training workshop (July 10–11, 2019, Serang).
It was strongly emphasized that capacity building – co-working and co-developing the project with the local people – is the pillar of this project, which gives community members a sense of ownership and thereby leads to better sustainability of data collections after the end of the project.
3. PROGRESS REVIEW
3.1 HydroColor calibration study
Dr. Suhendar I Sachoemar (Director of BPPT Center for Development, Education and Training) presented a report on the calibration effort to convert HydroColor optical measurements to chlorophyll-a concentrations. Two nearshore surveys of 20 stations each were sampled in August and September 2019 in Jakarta Bay and off Pelabuhan Ratu. Data collections with HydroColor included optical backscatter and red, green and blue reflectance data, along with the determined concentrations of suspended particulate matter and turbidity. Corresponding surface water samples were collected and analyzed for suspended particulate matter and chlorophyll-a concentrations. It was noted that the field scientists found using the app difficult in rough seas, due to the need to hold the smartphone at indicated angles to enable the capture button for obtaining the measurements.
These data are a critical first step towards calibration of HydroColor measurements with chlorophyll-a concentrations. Further sampling that covers a broader range of chlorophyll concentrations will be needed before a reasonable calibration can be achieved, but this study provides a valuable template. It was suggested that the project approach LIPI (Indonesian Institute of Sciences) to see whether it would be feasible to include HydroColor and chlorophyll analyses on the coastal oceanography cruises to facilitate this effort. There are additional data available from these cruises, including dissolved oxygen, that will be an important contribution to assessing environmental water quality.
The calibration of reflectance data with chlorophyll-a concentrations utilizes the same algorithms as used for remote sensing, so it will be best to collaborate with satellite oceanographers for this purpose. Ideally, Indonesian scientists should be found to serve this role, given that this calibration, in conjunction with the HydroColor data collections, would provide a unique opportunity to extend their remote sensing capabilities into nearshore Indonesian waters.
Actions: PST members to approach individuals working in the Mississippi river plume region, the Gulf of
Maine, and other experts in ocean optics for guidance on optimal calibration methods for HydroColor.
PST Co-Chairs to request LIPI representative on this project (Dr. Arief Rachman) to see if LIPI would be willing to incorporate HydroColor in their program.
3.2 HydroColor integration with FishGIS
Currently, the HydroColor app is independent of the FishGIS app. HydroColor can be “opened” from within the FishGIS app, but the data collection and storage are separate. Data uploading must be done manually. In some cases observers thought they had uploaded HydroColor data, but this information

Appendix 3 – Meeting Reports Third Meeting
PICES Scientific Report No. 58 75
does not seem to be in the designated dropbox. PST members questioned whether it was possible to have the upload done automatically, or have it triggered by FishGIS?
PST members raised the question about what the current Indonesian standards are for acceptable turbidity levels and suspended particulate matter concentrations. It is not anticipated that these levels are exceeded at the current case study sites, but incorporating these limits into data assessments will enhance the ability to use the HydroColor app in other Indonesian coastal and aquaculture regions.
Actions: Dr. Wells to discuss with the HydroColor app developer, Thomas Leeuw, the following: (1) How we
might get the data upload automatically, or triggered by FishGIS? (2) Can we have an indication shown when the data are uploaded? (3) Is it possible to change the upload destination to another server?
PST members to consider how we might create a video for fishers that emphasizes the need to upload the HydroColor data.
Dr. Sachoemar to translate the water quality criteria for coastal waters and aquaculture. 3.3 Foldscope data progress
Fishers have acquired Foldscope photographs and transmitted them via WhatsApp to Dr. Rachman for species identification. After review (for the presence of toxic phytoplankton) the photos will be uploaded to a BPPT data server that has been established for this purpose.
Action: Dr. Wells to explore the options for developing automated species identifications from images. 3.4 Quantifying fish catch from photographs
Dr. Naoki Tojo presented two potential methods for quantifying fish catch from two-dimensional images: (1) a conical approach based on the estimated dimensions of a pile of fish, and (2) a slice approach where a section is taken across the pile. Both methods gave similar values for estimated catch weight, but both were higher than actual weights. This offset, probably, is partly attributable to the volume of interstitial air in the pile (i.e., that between fish). A correction factor could be calculated to account for this offset, but it likely would change somewhat with different size fish.
An alternate approach would be to estimate the actual 3-D shape and volume of the pile, but this was deemed to be too difficult to undertake in this project.
A most favorable option would be to issue a calibrated container for the fish. This would improve the accuracy of estimating fish catch, and would serve the additional valuable purpose of improving the quality of the marketed fish by reducing the abrasion damage of fish stored in the bottom of the boat.
Action: Dr. Tojo to provide slides of the different methods to Dr. Makino for his presentation at the PICES-2019 Science Board Symposium next week. 3.5 Modifications to FishGIS software
One of the suggestions given during the training workshop in July 2019 was to expand the range of fish species in the FishGIS app to better reflect the environments of Serang and Pelabuhan Ratu. Dr. Tojo’s students began the effort, creating a subset of line drawings of different fish species. There was some question about whether color images (from an available poster of Indonesian fish) would be more easily

Third Meeting Appendix 3 – Meeting Reports
76 PICES Scientific Report No. 58
identified by fishers, but line drawings were preferred over these color images because species color can vary among regions, and thus may introduce confusion in identification. After discussing the number of fish species to be listed, it was recommended that we avoid individual species and focus on categories or genus of different fish, up to a maximum of approximately 10. Line drawings by genus might help to minimize the confusion among the complexities of numbers of species, and different names of the same species. This approach also would minimize the time requirement imposed on fishers and simplify use of the FishGIS app in different regions of Indonesia.
Other species/categories requested by fishers were squid, swordfish, and tuna. The value of adding endangered species was discussed.
Above all, it was recognized that decisions need to take into consideration how useful and practical the choices will be for the fishers, to maximize their participation. Even so, it was suggested that the available poster, showing the wide range of fish species in Indonesian waters, be somehow incorporated as information going back to the communities, as it provides the broader range of fish species.
Actions: Dr. Sachoemar to identify an Indonesian expert to help define from 8 to 10 categories of fish for
inclusion in the FishGIS app. FishGIS app developing team to add icons for swordfish, tuna, and squid to crab to the FishGIS app.
Based on feedback during the July 2019 workshop, the PST returned to the question about anonymous reporting in the categories of floating garbage and, especially, in IUU. At this point, we can identify who are making these reports, but these can be sensitive data so we need to be careful to maintain observers’ anonymity. The question was raised whether we wish these reports to be anonymous to everyone but the database managers, so that interested agencies could only acquire the information through request. But under what circumstances would this information be released? As we do not have a mandate as enforcers, and are just reporters, there was an argument that we should not store the identity data in these uploads. If identities are to be stored, there was consensus that we should convene a PICES ethical board to recommend who could access this information, and the circumstances where identities should be released.
There was no information available on the current regulation of sea garbage. There is an Indonesian agency responsible for national regulations, and we can contact them for more information.
Actions: FishGIS app developing team to strip the names of fishers doing the reporting from the dataset, so no
linkage can be made. Dr. Sachoemar to determine what is the Indonesian national regulation on sea garbage. 3.6 Data management
The PST invited participation of representatives of the Indonesian National Ocean Data Center to the July 2019 workshop, where discussions were held about transitioning the primary data server from Japan to Indonesia. A cloud server for the FishGIS app data has now been constructed, though all data uploads still are routed to the server in Japan. There are three potential approaches to migrate this control. In Plan A, all data are copied over (replicated from) the Japanese server to the NODC server so that data exist on both servers. This approach is the most straightforward. BPPT and other agencies would manage the data from the BPPT server, but updating and maintaining the FishGIS app would be

Appendix 3 – Meeting Reports Third Meeting
PICES Scientific Report No. 58 77
easily accomplished from Japan. However, keeping the management system on the Indonesian server is difficult, in part because it requires deep access from non-national (Japanese) individuals.
Plan B would be to have fishers upload data to the BPPT server, which then is replicated on the Japanese server, where the system is used to manage the data. The benefit of this approach is that it simplifies the management issues.
Plan C is that the proprietary core of the FishGIS app is moved from the Japanese to Indonesian server so that the system runs independently of GFL (Green Front Research Laboratory). This option is the most expensive and time consuming.
Action: The PST recommends Plan A for this project. Plan B is preferable from the ABS [Nagoya Protocol on Access and Benefit sharing] regulations perspective, but realistically is not feasible in the timeline left for this project.
4. NEXT STEPS
4.1 Feedback to the communities
The central idea of feedback to the community is that BPPT staff will generate reports, likely on a monthly basis, that can be tailored for all communities, or specifically for each community, depending on their wishes/needs. To aid in this effort, Dr. Shion Takemura created an RStudio-based script that enables the collection of data from the FishGIS server and the graphing/plotting of those data in various ways: maps, spatial locations, pie charts of species, fishing gear, garbage type, type of red tide, and water quality (reflectance, turbidity, suspended particulate matter). PST members were very supportive of these efforts and discussed minor improvements to graphs and text formats.
There was also a debate on whether these reports should be accessible via a hyperlink (active report on-line) versus sending out a pdf version. In this way, we could include linkages to, for example, posters on fish species, water quality standards, and explanations of why these all are important (i.e., reinforcing the information participants received during the workshops). Brief consideration was given to creating a site where fishers could tailor the report to their needs, but this level of capacity would be difficult to create, and it was not felt that there would be great interest for it in the communities. It was pointed out that we should also concentrate on including a simple interpretation of these data, much like a weather banner, or a dial that points left (good), right (bad) with changing colors.
Action: The report to be revised to have a simple presentation summarizing all communities, and to be disseminated using a web page, rather than being released as a pdf file. 4.2 Manual development:
While videos have been created to explain the operation of the FishGIS and HydroColor apps, these are not sufficient, based on the community feedback. The PST agreed that more detailed efforts are needed that go beyond simple operation to include warnings of factors affecting the quality of the data, sampling design, and other issues to watch out for when sampling. One approach would be to create YouTube videos that can be directly accessed in the app.
Action: Dr. Tojo to work with Indramayu community members in December 2019 to create a video for use of the FishGIS and the HydroColor apps.

Third Meeting Appendix 3 – Meeting Reports
78 PICES Scientific Report No. 58
4.3 Final workshop planning
The final workshop will be conducted in the week of February 23, 2020, when BPPT and PST members will meet with community members from Muara Gembong, Indramayu, Serang and Pelabuhan Ratu to get their feedback. It was decided to hold these meetings in Serang and Pelabuhan Ratu to increase the feedback from these locations, while bringing interested participants in from Indramayu and Muara Gembong.
The workshop plan will follow the lines of previous workshops. Participants will be reminded of the goals of the project, the project tools, and the operation of those tools. A google questionnaire will be generated that covers these issues as well as gathers information about their fisheries and economic levels. The planned breakout will be approximately 1.5 h for training, 1.5 h for the questionnaire and feedback, and 1 h for exploring data interpretations. The goal is to keep the participants in their environment for the assessment; they will get more out of the assessment, and spending more time in the community gives us a deeper understanding of their needs and desires.
5. SCIENTIFIC REPORT, PRODUCTS AND OUTCOMES
5.1 Final report
The final report of the project to MAFF/JFA is due by the end of June. This document will bring together all of the materials generated over the project duration, and will need input from everyone. Dr. Makino and Dr. Wells will generate a first draft for circulation by late May. 5.2 Summary presentations
Dr. Makino is presenting a summary of the project at the PICES-2019 Science Board Symposium to be convened on October 21, 2019.
He will also present a summary of the project and outcomes at the international MSEAS-2020 symposium to be held in May 2020, in Yokohama, Japan 5.3 Educational outcomes
Dr. Tojo has two graduate students who are working on aspects of this project for their M.Sc. theses. Dr. Sachoemar has a student who is working on the use of HydroColor in freshwater environments.
6. A FUTURE PICES–MAFF PROJECT
There is a high likelihood of funding for the next PICES–MAFF project focusing on using the smartphone tools developed during the FishGIS project to study the distribution of ciguatera fish poisoning (CFP) in Indonesian waters. This project is expected to include many of the existing PST members, so some time was spent discussing this aspect. Dr. Elisa Berdalet (Institute of Marine Sciences (ICM-CSIC), Barcelona, Spain), an expert in benthic toxic phytoplankton, joined the meeting and presented a summary of benthic HABs. She demonstrated the artificial substrate method for the sampling of benthic species that will be a core component on the new project. She answered questions regarding the state of knowledge of CFP, and was keen to see the project move forward.

Appendix 3 – Meeting Reports Third Meeting
PICES Scientific Report No. 58 79
In addition to monitoring for the presence of the toxic species responsible for CFP, the project would explore the use of artificial intelligence for fish stock assessment, and incorporate tsunami warning features. There is an expectation of >1000 data uploads for the next project, and there was discussion about how to ensure this level of participation.
There also was discussion about how the project will merge with new strict laws on regulations for research to be conducted by foreign scientists being implemented in Indonesia. PICES will need to get a permit for the project. We should know about the status of project funding by December 2019, which should provide enough time to get the permit under present PICES leadership.
Appendix 1
Third Project Science Team meeting participants
Members Alexander Bychkov (PICES, ex-officio) Vladimir Kulik (MONITOR/Russia) Joon-Soo Lee (TCODE/Korea)* Mitsutaku Makino (HD/FUTURE/Japan; Co-Chairman) Shion Takemura (HD/Japan) Vera Trainer (S-HAB/USA)* Naoki Tojo (FIS/Japan) Charles Trick (S-HAB/Canada) Mark Wells (S-HAB/USA; Co-Chairman) Chang-an Xu (China)* * not present at the meeting
Observers Elisa Berdalet (ICM-CSIC, Spain) Tetsuo Fujii (MAFF/FRA, Japan) Shigeharu Kogushi (GFL, Japan) Suhendar I Sachoemar (BPPT, Indonesia) Nobuaki Suzuki (MAFF/JFA, Japan)
Appendix 2
Third Project Science Team meeting provisional agenda 1. Welcome remarks, introductions, adoption of the agenda, nomination of the rapporteur 2. Review of the project goals and strategies 3. Progress review
3.1 HydroColor calibration study 3.2 HydroColor integration with FishGIS 3.3 Foldscope data progress 3.4 Quantifying fish catch 3.5 Modifications to FishGIS software 3.6 Data management
4. Next Steps 4.1 Feedback to the communities 4.2 Development of the manual 4.3 Final workshop planning

Third Meeting Appendix 3 – Meeting Reports
80 PICES Scientific Report No. 58
5. Scientific Report, Products and Outcomes
5.1 Final report 5.2 Summary presentations 5.3 Educational outcomes
6. A future PICES–MAFF project

Appendix 3 – Meeting Reports Fourth Meeting
PICES Scientific Report No. 58 81
Fourth Meeting of the Project Science Team February 28, 2020, Jakarta, Indonesia
The fourth and final meeting of the Project Science Team (PST) for the PICES project on “Building capacity for coastal monitoring by local small-scale fishers” (FishGIS), funded by Ministry of Agriculture, Forestry and Fisheries (MAFF) of Japan, through the Fisheries Agency of Japan (JFA), was held on February 28, 2020, at the BPPT Center for Development, Education and Training (CDET) in Jakarta, Indonesia. The meeting was chaired by Dr. Mark Wells. The objective for this meeting was to review progress since the third PST meeting (October 16, 2019, Victoria, Canada), specifically:
The structure, implementation, and outcomes of the final site visits and training workshops in Serang (February 25, 2020) and Pelabuhan Ratu (February 27, 2020);
Remaining issues with the FishGIS app, HydroColor app and Foldscope use; Migration of the primary database server to Indonesian control; Plans for moving forward; Final project reports and products.
The PST members and meeting participants are identified in Appendix 1. 1. ADOPTION OF THE AGENDA The provisional agenda circulated prior to the meeting was adopted without changes and can be found in Appendix 2. Dr. Wells served as the rapporteur. 2. REVIEW OF THE FINAL TWO PROJECT WORKSHOPS The PST meeting was devoted mainly to reviewing the structure and implementation strategies of the final training workshops of the project, and to establishing what the outcomes are from these events. Two one-day workshops were held in Serang (February 25, 2020) and Pelabuhan Ratu (February 27, 2020) to follow up on the training of the FishGIS and HydroColor apps that was done in these communities in July 2019. The goals were to evaluate how the small-scale fisher and aquaculture farmer communities were using/not using the apps, and what steps might be done to increase their use. 2.1 Workshop logistics
Both workshops were organized by BPPT, and attended by BPPT staff who worked hard to make the workshops run smoothly. Each workshop opened with a series of presentations from local government officials, followed by a general introduction of the workshop goals. There were approximately 50 participants at each workshop which was a mixture of capture fishers and aquaculture farmers, local government officials and Ministry representatives. In each case, these local government officials and Ministry representatives expressed their strong support for the project and how it would help their communities.

Fourth Meeting Appendix 3 – Meeting Reports
82 PICES Scientific Report No. 58
Although it had been decided to try a new approach with these February 2020 workshops, PST members were unable to meet to go through a detailed plan until the afternoon before the first (Serang) workshop. As a result, the BPPT staff were unsure what we intended, which led to some confusion at the start of the Serang workshop. This confusion should have been prevented by more pre-meeting communication to develop consensus and more efficient facilitation. However, the BPPT staff responded quickly and efficiently once we made our plans clear. Based on our experience in Serang, the approach for the second workshop in Pelabuhan Ratu was modified, with the BPPT staff again being very efficient at implementing our plans. We owe a deep gratitude to them. 2.2 Workshop background
The original intention was that these workshops would largely include the same fishers and aquaculture farmers that were present at the July 2019 workshop, and there was effort by BPPT and the local governments to make this happen. However, a number of the original fishers from each community were unable to attend, as they were fishing. As a consequence, roughly half of the participants present at the workshops were unfamiliar with the FishGIS app, HydroColor app and the Foldscopes, or the reasons underlying the need for these observations. It also became clear that even among the participants of the July 2019 workshop, there remained some confusion. The mixture of participants was unexpected, so we revised our workshop plan during the day to add some basic instruction and review of the apps. As it turned out, these activities were an essential part of both workshops and illustrated for the PST the necessary path forward (see below). 2.3 Workshop design
The first workshop, in Serang, began with a focus on the value of making the FishGIS and HydroColor measurements, and how these data would be used to understand whether the environment and fisheries were changing with time. It was followed by an exercise (Fig. 1) led by Dr. Charles Trick on understanding the difference between “fact” and “opinion”, where participants worked in groups to answer four basic questions about the four PST members (holding sheets of paper with A, B, C, D): who is the tallest, who is the shortest, who is the best dressed, and who is the smartest? The answers to the first two questions are based on facts, while the two others are based on opinions, i.e., positions that need facts or “environmental norms”. Dr. Trick then compared these to their fisheries, and made the connection between the collection of facts (using the FishGIS and HydroColor apps) to answer the bigger questions (opinions) of how the fisheries will be in the future.
Fig. 1 An exercise on understanding the difference between “fact” and “opinion” at the training workshop in Serang, Indonesia: (left) PST members hold identification signs; (right) Dr. Charles Trick provides explanations and leads discussion.

Appendix 3 – Meeting Reports Fourth Meeting
PICES Scientific Report No. 58 83
Dr. Naoki Tojo then led participants to work in groups on three questions: (1) How many have used the apps, (2) how can the monitoring be increased, and (3) how can we work together to improve their fisheries? Participants were given sheets of paper and markers so that they could answer these questions and add their thoughts. This activity was followed by presentations on the FishGIS app and how it works (by Dr. Shion Takemura) and on how fishers in Indramayu have been using the apps to gather information about their fisheries (by Dr. Tojo).
The second workshop was held in Pelabuhan Ratu, and this effort benefited from our experience in Serang. We again began the workshop with Dr. Trick’s general introduction to “facts” and “opinions”. Dr. Tojo followed with a Google questionnaire that focused on the participants’ fishing and community perspectives. There were five benefits to this activity:
1. PST members were able to see how many fishers had cellphones (more than appeared at first (more than 17 phones total) as many initially were hesitant until placed in a small team setting);
2. Participants were obliged to use their cell phones to enter information (a first for many); 3. Participants were allowed to work together on these questionnaires, which developed collaboration
among fishers and across groups; 4. PST members were able to gather useful information for understanding the community; 5. This approach provided an easy transition to use the FishGIS app in the next step.
Then, Dr. Takemura led a practical demonstration of the FishGIS app, working through the various windows, and had the participants take photographs of things or views in the meeting room or outside. Though active changes in their physical locations was not our original intent, their “walking about” helped to enhance the involvement of participants in the workshop. They were shown how to upload these photos, after which Dr. Takemura displayed what they had uploaded live on the screen, which exhibited not only their photos but also the geo-locations where the photos were taken (displayed on a map of Pelabuhan Ratu). This was a powerful illustration of how the app could be used, which appeared to be clearly communicated to the participants. We then followed with the group activity to answer the same three questions as given in Serang: (1) How many have used the apps, (2) how can the monitoring be increased, and (3) how can we work together to improve their fisheries? 2.4 Workshop participation
Both workshops had a large attendance, and participants stayed for the entire day. They maintained their enthusiasm throughout the activities and, in some cases, were quite passionate in their discussion. Of particular note were two aquaculture farmers in Serang, who were very concerned about water quality in their ponds. It became clear that the HydroColor app would be of limited help to them in their concerns, but in an extended discussion after the workshop they recognized that the HydroColor data could provide them with basic information on which they could approach the government representatives to request further assistance. Both workshops were videotaped, and participant discussions were recorded. They will be transcribed so that we have better insight to the participant concerns.
Of the two locations, the Pelabuhan Ratu fishers showed a higher level of understanding and better recognized the importance of the data that would be collected. They seemed more aware of the problems in their fisheries, and in some ways appeared more eager to fix the problems. This assessment is based on a small number of senior fishers speaking up. However, more than half of participants were members of a cooperative, and it was apparent that they regarded their fishing grounds as a “commons”. By comparison, it appeared to be the aquaculture farmers who were most strongly engaged during the workshop in Serang, with their individual economic incentives (though motivated farmers had been trying to form a farmer’s cooperative).

Fourth Meeting Appendix 3 – Meeting Reports
84 PICES Scientific Report No. 58
3. ISSUES LIMITING SMARTPHONE APP USE
The primary question we had before these workshops was why so few data were being uploaded from these two communities. Was it due to problems/unfamiliarity with the apps or a lack of motivation in these communities? While we were at a bit of a disadvantage because only about half of the participants in these workshops were those at the initial training workshop in July 2019, it became clear from our discussions that there still was some confusion about the purpose of the apps, and a level of uncertainty or lack of confidence about how to use the apps. It seems obvious that more training/follow up is necessary to increase familiarity with the tools. There is a need for intermediate-level connections between BPPT and the community; individuals who, once trained, can be present in the community to facilitate teaching and use of the apps by the fishers.
Of the responses to the Google questionnaire in Pelabuhan Ratu, 8 of 17 were individuals or groups who had experience with the project apps. Of these, 3 of 8 said that using the apps was not difficult, although the others did not comment on this aspect; their comments focused instead about difficulty of understanding and interpreting results on their mobile phone. Of those who had not previously been trained in use of the apps, only one participant (or group) responded saying that the apps were “difficult to understand” (Tidak mengerti). These responses suggest that a one-day training workshop may be enough for simple technical transfers, but that understanding the meaning of data outputs, and the incentive to continuously monitor, will take much more interaction. Workshop activities should be designed to better illustrate how the outputs have meaning in their livelihoods, and to instill greater incentive for sustaining the activities on their own.
The workshop participants in Pelabuhan Ratu included members of a Community Surveillance Group (POKMASWAS), a local organization that works under the Ministry of Marine Affairs and Fisheries. Their role is to act as a go-between the fishers and government agencies, and they serve as observers and facilitators. By directly interacting with the fishers, these members could provide the missing link to enhance the dissemination of the apps, refresh training when needed, and encourage use of the apps to continue entering data.
Another possible solution to enhance familiarity with the apps for those who have had training, or who have not but wish to participate, is to generate a series of videos, or video manuals on usage of the apps. Dr. Tojo has been working on this with community members in Indramayu, and it is close to being completed. A suggestion that came up during our discussions was to make these videos accessible directly from the FishGIS app though help buttons. Additional videos could be created that would cover field sampling as well as the background information that was provided in the introduction presentations during these workshops. 4. DATABASE TRANSITION
Two central questions regarding the FishGIS database were: (1) the logistical challenge of moving the database from the server in Japan to the server at BPPT and (2) how to begin the process of transferring data from BPPT to the Indonesian National Oceanographic Data Center (NODC). Currently, the database and FishGIS web interface reside on the same server and it will require some effort to separate these. Dr. Vladimir Kulik pointed out that in addition to the programming tasks for separating the two, it will be important to stress-test the linkages (i.e., ensuring non-failure with high data transfer demands) and to maintain the security of the linkages. There are procedures for such a transfer on which we can

Appendix 3 – Meeting Reports Fourth Meeting
PICES Scientific Report No. 58 85
draw, and Dr. Kulik is familiar with these. BPPT has established a cloud server that will function as the central database server for the FishGIS project and the next PICES–MAFF project. Drs. Kogushi, Takemura and Kulik will work together to develop a list of steps and tasks that will be needed to transfer the FishGIS database to this server. Dr. Kogushi and Dr. Takemura will also develop a budget and timeline for this process for presentation at the first PST meeting for the new MAFF (Ciguatera) project (planned for May 25, 2020 in Yokohama).
The database experts from BPPT and NODC were present at a preliminary meeting after the Serang workshop, and discussed the linkage of these data to the NODC database. NODC is very interested in acquiring copies of these data, and they will be happy to work with us. NODC requested that we begin by forwarding a meta-data description to them in order to determine how best to set up their system for these data. We will begin porting over data as soon as they are ready. It also will be necessary to begin establishing procedures when requests to access the data are submitted. 5. MOVING FORWARD
The two workshops and our discussions made it clear that we need to focus on revising our dissemination plans for the FishGIS and HydroColor apps in the new PICES–MAFF project (2020–2023). The key finding from the workshops is that while the initial training efforts appear to be successful, more emphasis on follow-up training and encouragement is necessary. This follow-on, as with the training workshops, needs to be a collaborative effort with the fishers and and other community members. They will know best how to optimize these efforts. To maintain close interactions we need to identify intermediaries either within the communities, as motivated fishers or other, or in the local government. In the case of Pelabuhan Ratu, POKMASWAS appears to be a good potential collaborator. For the new project, we should consider this perspective when selecting the communities to work with.
The new project will utilize and expand on the FishGIS and HydroColor apps for use in Ciguatera Fish Poisoning (CFP) affected communities. CFP issues in Indonesian waters will have a bearing on the further development of that country’s coastal fisheries and the sustaining of its small-scale fisheries. PST and BPPT personnel shared consensus that we should continue to motivate our past communities and inspire the new target communities as one of objectives in the new project. 6. PROJECT OUTCOMES
The PST considered five separate products as the project outcomes (Fig. 2):
1. A formal final project report will be submitted to MAFF/JFA by June 30, 2020 (a draft is due to April 30). The expanded version of this report will be published in the PICES Scientific Report series in 2020.
2. Dr. Trick will lead the writing of a one-page analysis and communication to the World Health Organization Bulletin, with the projected timeline of August 1, 2020.
3. An article for PICES Press will be prepared based on the report to MAFF/JFA. The article would include the perspective of BPPT on expectations for the role of technology, such as what was developed in this project, in marine fisheries in Indonesia, and its practical limitations and challenges for expanding its use in Indonesian coastal waters. An article outline will be developed by the end of

Fourth Meeting Appendix 3 – Meeting Reports
86 PICES Scientific Report No. 58
summer, with writing tasks to be completed in time for publication in the winter 2021 issue of PICES Press.
4. Dr. Tojo will work with his student, Mr. Takaaki Mori, to develop his MSc thesis on interactions with the Indramayu community into a peer-reviewed journal publication.
5. Dr. Tojo is working with BPPT to develop video manuals describing the use of the FishGIS and HydroColor apps in Indonesian Bahasa language. Field sampling methods as well as a general introduction along the lines that was given at the workshops will be included as videos that can be accessed through buttons installed on the FishGIS app early in the new project.
Fig. 2 At the fourth PST meeting held February 28, 2020, in Jakarta, Indonesia: (top left) Dr. Mark Wells summarizes the outcomes from the training workshops, (top right) Drs. Vladimir Kulik and Naoki Tojo discuss various ways of presenting fishery data, (bottom left) Dr. Tojo reviews the trial surveys in Pabean Ilir in Indramayu District and the status of the FishGIS operational manual, and (bottom right) Drs. Shion Takemura and Charlie Trick take notes on the tasks for the preparation of a final scientific report.

Appendix 3 – Meeting Reports Fourth Meeting
PICES Scientific Report No. 58 87
Appendix 1 Fourth Project Science Team meeting participants
Members Alexander Bychkov (PICES, ex-officio)* Vladimir Kulik (MONITOR/Russia) Joon-Soo Lee (TCODE/Korea)* Mitsutaku Makino (HD/FUTURE/Japan; Co-Chairman)* Shion Takemura (HD/Japan) Vera Trainer (S-HAB/USA)* Naoki Tojo (FIS/Japan) Charles Trick (S-HAB/Canada) Mark Wells (S-HAB/USA; Co-Chairman) Chang-an Xu (China)* * not present at the meeting
Observers Agus Dwiono (CDET, BPPT, Indonesia) Indra Hartati (CDET, BPPT, Indonesia) Shigeharu Kogushi (GFL, Japan) Syidik Nurdin (CDET, BPPT, Indonesia) Arief Rachman (LIPI, Indonesia)
Appendix 2
Fourth Project Science Team meeting agenda 1. Welcome remarks, introductions, adoption of the agenda, nomination of the rapporteur 2. Review the outcome of the workshops in Pelabuhan Ratu and Serang
2.1 Workshop logistics, 2.2 Workshop background, 2.3 Workshop design strengths and weaknesses 2.4 Workshop participation
3. Issues limiting smartphone app use 4. Database transition 5. Moving forward 6. Project outcomes

FishGIS Operation Appendix 4
88 PICES Scientific Report No. 58
Appendix 4
FishGIS Operation
The following description provides a detailed, screen-by-screen summary of the FishGIS application. It begins with the home screen which appears as the application is opened, and works through the submenu screens that enable the operation of all current aspects of the application. The FishGIS application is downloadable in either English or Indonesian Bahasa.
On each opening of the application, the home screen (Fig. A) requires the user to register or to log in (Fig. B). There also are links shown here for weather information and harmful algal bloom (HAB) notices. The ID, group ID, and password are to be entered to gain access to the system on the registration screen. The group ID is designed to allow local teams of community members, government officers and researchers to readily share/view their subset of local monitoring data (vs. the larger regional feedback reports generated from multiple community datasets).
From the menu screen (Fig. C), the user can select “Report” to display the monitoring categories (Fig. D) or, alternatively, select “View” to generate real-time maps of the current data in their region.
In the Report screen (Fig. D), once the user selects the monitoring category—fish, vessels, garbage, red tide, or HydroColor—the application automatically collects the date, time and location information (GPS) on the smartphone, and then a screen appears for the user to select the type of media (photo or video) to report (Fig. E). After the user takes a photo or video, a screen appears to select the meta-information about the report, which varies based on the monitoring item. For fish landings, the fish species (Fig. F) or size and quantity of fish (Fig. G) can be reported. When reporting IUU (Illegal Unregulated and Unreported) fishing, information on fishing gear (Fig. H), vessel size and frequency of IUU fishing (Fig. I) can be recorded, in accordance with Indonesian government regulations. Thus, the application for iPhone also uses Bahasa icons for choosing IUU fishing gears. In the case of floating garbage, the type and frequency of trash can be reported (Fig. J). For red tide (discoloration of the water), the type and the frequency of red tide and/or fish kills can be selected (Fig. K).
Users can directly access the HydroColor application from within the FishGIS report screen (Fig. D), where selecting it will launch a separate app for data collection. The HydroColor optical data then are transferred to the FishGIS application for uploading to the server.
When seeking to view the monitoring results (Fig. C), users can select the type of data viewing (Fig. L): list format (Fig. M) or map (Figs. N, O). These application components are still under development in an on-going project. The reported results will be filtered by clicking on the monitoring item icon at the top of either the list or map type. More details can be seen by selecting the report icon of interest (Fig. P). Users will be able to review and modify their own reports, or delete the report on this screen. The application is currently designed to temporarily store submitted report data if there is no cellphone signal, or if the cellphone signal strength is low. Users can manually upload the report data to the server from this screen when the cellphone signal is strong (e.g., when returning to port).
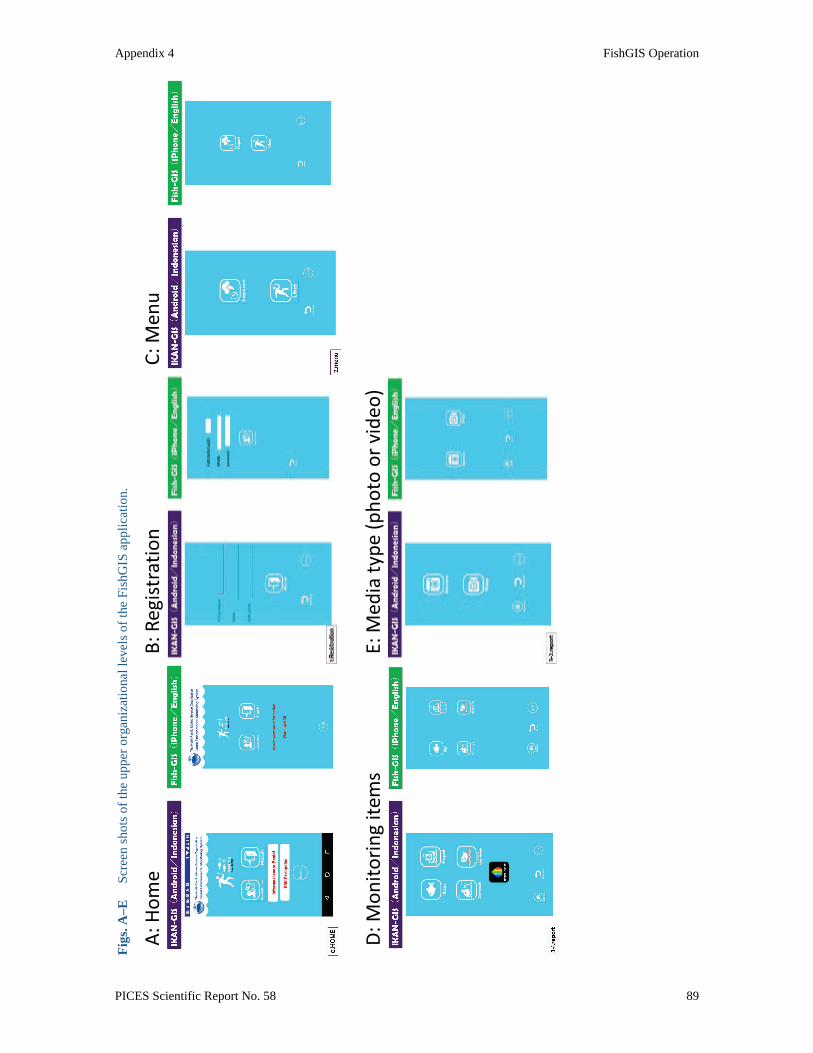
Figs
. A–E
Sc
reen
shot
s of t
he u
pper
org
aniz
atio
nal l
evel
s of t
he F
ishG
IS a
pplic
atio
n.
A: H
ome
B: R
egist
ratio
n
C: M
enu
D: M
onito
ring
item
s
E: M
edia
type
(pho
to o
r vid
eo)
Appendix 4 FishGIS Operation
PICES Scientific Report No. 58 89

Figs
. F–
K
Con
tinue
d.
F: F
ish la
ndin
g 1
(spe
cies
)
G: F
ish la
ndin
g 2
(size
/cat
ch)
H: I
UU
fish
ing
1 (g
ears
)*
I: I
UU
fish
ing
2 (v
esse
ls)
J: F
loat
ing
garb
age
K: R
ed ti
de
*
The
iPho
ne ic
ons a
re c
urre
ntly
ava
ilabl
e on
ly in
Bah
asa.
FishGIS Operation Appendix 4
90 PICES Scientific Report No. 58

Figs
. L–
Q
Con
tinue
d.
L: M
enu
of d
ata
view
M: L
ist o
f mon
itorin
g re
sults
N: M
ap o
f fish
O: M
ap o
f Hyd
roCo
lor
P: D
etai
led
info
rmat
ion
Q: R
epor
t at n
o sig
nal a
rea
Appendix 4 FishGIS Operation
PICES Scientific Report No. 58 91

Report of Water Quality Analysis Appendix 5
92 PICES Scientific Report No. 58
Appendix 5
Report of Water Quality Analysis
REPORT OF WATER QUALITY ANALYSIS (Chlorophyll-a, SPM and Turbidity)
of
Jakarta Bay and Pelabuhan Ratu Indonesia
Prepared by: Sindu Akhadiarto
Suhendar I Sachoemar
2019

Appendix 5 Report of Water Quality Analysis
PICES Scientific Report No. 58 93
1 INTRODUCTION
1.1 Background
When healthy, coastal fisheries and marine resources can be relied upon to improve the economy, especially for fishermen in coastal communities. But allowing open access to these fisheries and resources without oversight often leads to over exploitation that pushes resources past their carrying capacity; a trend seen around the world, including in Indonesia. The various threats and pressures against fisheries, coastal and ocean resources reflect an imbalance between utilization and the rate of resource recovery. As a result, the continued existence of the resources is threatened, and there is declining capacity to provide sustainable supplies of food.
In line with global efforts to reduce the excessive exploitation of natural resources, and in light of progressive coastal changes related to climate drivers, PICES-MAFF has launched a new Project titled “Building Capacity for Coastal Monitoring by Local Small-scale Fishers” from April 2017–March 2020. One of the primary activities of this project is to introduce smartphone-based technologies for ecosystem and fisheries monitoring by small-scale coastal fishers in Indonesia. The objective is to achieve better enforcement of local fisheries rules (decrease of domestic IUU), to quantify fisheries catch, and to increase understanding about ecosystem changes that affect local communities (e.g., HABs, invasive species, etc.).
One of these technologies, the HydroColor app, uses the smartphone camera to measure water quality parameters: turbidity, suspended sediments, and, with calibration, concentrations of chlorophyll-a. In support of the PICES-MAFF project, the Indonesian Researcher Union of BPPT (Himpenindo-BPPT) made optical measurements with the HydroColor application and collected surface water samples for standard laboratory analyses from 80 locations in the coastal areas of Jakarta Bay and Pelabuhan Ratu. These field collections begin the necessary datasets for validation of the optical measurements, and can be used to start developing site-specific algorithms for estimating chlorophyll-a with the HydroColor app.
1.2 Objective
The objective of field data collection was to contribute to validation of HydroColor water quality measurements (turbidity, SPM) and to begin tuning satellite-based algorithms for optical estimation of chlorophyll-a concentrations in the nearshore waters of Indonesia.
2. METHOD
2.1 Sampling Sites and Field Data Collection
Water quality data of turbidity, SPM and chlorophyll-a were collected from 80 sampling points in two regions in August and September 2019. Jakarta Bay was sampled on August 14 and September 4, and Pelabuhan Ratu was sampled on August 17 and September 7. The sampling site area and survey activity are shown on Figure 1.

Report of Water Quality Analysis Appendix 5
94 PICES Scientific Report No. 58
Fig. 1. Sampling sites in Jakarta Bay (top panel) and Pelabuhan Ratu (bottom panel) in August (left) and September 2019 (right).
2.2 Data Analysis
Turbidity was measured in-situ using a Horiba U-52G Multi-Parameter Water Meter, while SPM and chlorophyll-a were measured after filtration (0.45 µm-47 mm) from 500 ml of sea surface water, water pond and brackish river water using standard methods for the analysis of water (APHA 23rd edition 10200H, 2017).
2.3 HydroColor
HydroColor is a smartphone application that utilizes the camera sensors to measure optical reflectance from natural water bodies. In essence, the smartphone digital camera functions as a three-band radiometer. The user is directed by the application to collect three images. These images are used to calculate remote sensing reflections in the red, green and blue broad wavelength bands. As with satellite measurements, reflectance can be reversed to estimate the concentration of absorbent and scattering substances in water, which consists mainly of suspended sediment, chlorophyll, and dissolved organic matter. HydroColor can measure remote sensing reflection within 26% of that from a precision radiometer, and turbidity within 24% of a portable turbidimeter. HydroColor is different from determining water quality by using other methods

Appendix 5 Report of Water Quality Analysis
PICES Scientific Report No. 58 95
because its operation is based on radiometric measurements rather than image colors. HydroColor is one of the few cellular applications that uses smartphones as a fully objective sensor, in contrast to subjective user observations or color matching using the human eye. This makes HydroColor a powerful tool for non-scientists to collect aquatic optical data (Leeuw and Boss 2018).
According to Leeuw and Boss (2018), the working principle of the HydroColor app is identical to that used in remote sensing applications for oceanography. This application can present turbidity data (in NTU units) and Suspended Particle Material (in units of grams / m3). The main features of smartphones that must be available to support this application are color digital cameras and the internal compass and gyroscope. In addition, the measurement of grey card reflectance is also needed. The working principle of this application is presented in Figure 2. The HydroColor app specifications are shown in Table 1.
Fig. 2. The working principle of the HydroColor Application (Source: Leeuw and Boss 2018). Table 1. HydroColor application specifications.
Specification Remarks
Image required Gray card, sky, and water surface images Reference material No reference needed RGB transfer function From sRGB grey cards, sky, and water surface images to RGB Color conditions RGB color; depending on the device used. This is because it is
influenced by the specific spectral response function of the capture device, it also depends on the lighting conditions at which the picture was taken
Estimated water quality variable Water turbidity (0–80 NTU), SPM (g / m3), and backscattering coefficient in the red (m−1)
Advantage In deriving RGB using three images, an error occurred from each image obtained by a smartphone is cancelled. Thus, the smartphone camera does not require calibration.
Weakness Does not take into account weather conditions such as wind that can affect the output produced (Fig. 3)
Source: Ouma et al. 2018

Report of Water Quality Analysis Appendix 5
96 PICES Scientific Report No. 58
Fig. 3. Examples of grey cards, sky, and water surface images taken on sunny (a) and cloudy (b) days.
The rectangular area shows the true color representative of the water.
3. RESULT AND DISCUSSION
The water quality field data of turbidity, SPM and chlorophyll-a of Jakarta Bay and Pelabuhan Ratu are shown on Tables 2 and 3, respectively. The water quality data obtained optically with the HydroColor app are included here. Chlorophyll-a in Jakarta Bay was roughly ten times higher compared with Pelabuhan Ratu. This difference is reasonable because Jakarta Bay is heavily eutrophied by high nutrient loads from anthropogenic activities (industrial waste, raw domestic sewage, etc.) carried by the many rivers that empty into the bay, while Pelabuhan Ratu has a much smaller population and the embayment is comparatively well flushed. In contrast to chlorophyll concentrations, the levels of turbidity in Jakarta Bay and Pelabuhan Ratu were not significantly different. The sampling activities at Jakarta Bay and Pelabuhan Ratu are shown in Figures 4 and 5, and a video of sampling can be found at the web address: https://drive.google.com/file/d/1FoP0wjZvkcgtLjRwHTPOJb_kEpEc7746/view?usp=drivesdk

Appendix 5 Report of Water Quality Analysis
PICES Scientific Report No. 58 97
Fig.4. Photos of the survey activity in Jakarta Bay.
Fig.5. Photos of the survey activity in Pelabuhan Ratu.

HORI
BALa
titud
eLo
ngitu
deTu
rbid
ity (N
TU)
SPM
(g/m
3 )bb
Red
(1/m
)Re
flec.
Red
(1/s
r)Re
flec.
Gre
en (1
/sr)
Refle
c. B
lue
(1/s
r)Tu
rbid
ity (N
TU)
SPM
(mg/
l)Ch
loro
phyl
l-a (µ
g/l)
JB 1
.1M
arin
e 1
8/14
/201
910
.12
-6.0
8006
106.
7299
75
50.
050.
008
0.00
90.
007
2.1
2541
.774
JB 1
.2M
arin
e 2
8/14
/201
910
.22
-6.0
7348
106.
7329
41
10.
010.
002
0.00
20.
002
0.0
2635
.293
JB1.
3M
arin
e 3
8/14
/201
910
.40
-6.0
6521
106.
7365
13
30.
030.
005
0.00
50.
003
0.0
3110
.867
JB 1
.4M
arin
e 4
8/14
/201
910
.53
-6.0
5536
106.
7407
05
50.
050.
008
0.00
80.
006
0.0
3411
.305
JB 1
.5M
arin
e 5
8/14
/201
911
.10
-6.0
5426
106.
7443
68
80.
080.
011
0.01
10.
008
1.5
1418
.086
JB 1
.6M
arin
e 6
8/14
/201
911
.22
-6.0
5182
106.
7471
06
50.
050.
009
0.00
90.
007
2.1
2023
.581
JB 1
.7M
arin
e 7
8/14
/201
911
.33
-6.0
5767
106.
7490
48
70.
070.
011
0.01
10.
009
2.0
2834
.904
JB 1
.8M
arin
e 8
8/14
/201
911
.42
-6.0
6028
106.
7525
610
100.
100.
014
0.01
30.
009
4.4
1535
.796
JB 1
.9M
arin
e 9
8/14
/201
911
.51
-6.0
6380
106.
7564
15
40.
040.
007
0.00
80.
006
2.9
1329
.493
JB1.
10M
arin
e 10
8/14
/201
912
.01
-6.0
6019
106.
7588
56
60.
060.
009
0.00
90.
007
1.3
1428
.532
JB 1
.11
Mar
ine
118/
14/2
019
12.1
1-6
.056
3210
6.75
576
65
0.05
0.00
90.
009
0.00
71.
529
27.1
40JB
1.1
2M
arin
e 12
8/14
/201
912
.23
-6.0
5387
106.
7518
05
50.
050.
008
0.00
80.
006
1.5
3244
.332
JB 1
.13
Mar
ine
138/
14/2
019
12.3
4-6
.049
6510
6.74
645
43
0.03
0.00
60.
006
0.00
41.
97
41.5
88JB
1.1
4M
arin
e 14
8/14
/201
912
.47
-6.0
4488
106.
7399
23
30.
030.
005
0.00
50.
003
1.4
2932
.224
JB 1
.15
Mar
ine
158/
14/2
019
14.2
7-6
.033
7510
6.73
079
55
0.05
0.00
70.
007
0.00
61.
810
43.1
90JB
1.1
6M
arin
e 16
8/14
/201
914
.42
-6.0
4041
106.
7275
72
20.
020.
003
0.00
30.
002
0.0
2232
.450
JB 1
.17
Mar
ine
178/
14/2
019
14.5
2-6
.046
7010
6.72
576
11
0.01
0.00
20.
002
0.00
10.
030
29.4
57JB
1.1
8M
arin
e 18
8/14
/201
915
.01
-6.0
5207
106.
7260
82
20.
020.
004
0.00
40.
003
0.9
636
.084
JB 1
.19
Mar
ine
198/
14/2
019
15.1
4-6
.058
5410
6.72
535
11
0.01
0.00
20.
002
0.00
12.
629
31.8
84JB
1.2
0M
arin
e 20
8/14
/201
915
.25
-6.0
6716
106.
7214
51
10.
010.
002
0.00
20.
001
2.3
1151
.820
JB 2
.2M
arin
e 2
9/4/
2019
10.5
6-6
.071
8710
6.73
368
22
0.02
0.00
30.
004
0.00
30.
03
3.09
4JB
2.3
Mar
ine
39/
4/20
1911
.16
-6.0
5853
106.
7391
33
30.
030.
005
0.00
50.
004
1.3
735
.659
JB 2
.4M
arin
e 4
9/4/
2019
11.3
0-6
.051
7310
6.74
192
44
0.04
0.00
60.
006
0.00
43.
410
45.2
34JB
2.5
Mar
ine
59/
4/20
1911
.41
-6.0
4597
106.
7381
73
30.
030.
005
0.00
50.
004
2.4
737
.488
JB 2
.6M
arin
e 6
9/4/
2019
11.5
5-6
.038
6310
6.71
818
44
0.04
0.00
70.
007
0.00
50.
56
28.2
50JB
2.7
Mar
ine
79/
4/20
1912
.04
-6.0
3363
106.
7261
03
30.
030.
005
0.00
50.
003
0.7
820
.958
JB 2
.8M
arin
e 8
9/4/
2019
12.2
0-6
.026
7010
6.72
178
33
0.03
0.00
50.
005
0.00
31.
25
24.6
29JB
2.9
Mar
ine
99/
4/20
1912
.29
-6.0
2252
106.
7153
74
40.
040.
007
0.00
70.
005
0.9
832
.675
JB 2
.10
Mar
ine
109/
4/20
1912
.41
-6.0
165
106.
7164
53
30.
030.
005
0.00
50.
003
0.6
721
.818
JB 2
.11
Mar
ine
119/
4/20
1912
.53
-6.0
1473
106.
7224
84
40.
040.
006
0.00
60.
004
0.6
516
.963
JB 2
.12
Mar
ine
129/
4/20
1913
.30
-6.0
2222
106.
7276
73
30.
030.
005
0.00
50.
004
0.8
721
.275
JB 2
.13
Mar
ine
139/
4/20
1913
.41
-6.0
2443
106.
7328
33
30.
030.
005
0.00
60.
004
0.9
720
.458
JB 2
.14
Mar
ine
149/
4/20
1913
.54
-6.0
3110
106.
7387
32
20.
020.
004
0.00
40.
003
1.2
830
.173
JB 2
.15
Mar
ine
159/
4/20
1914
.04
-6.0
3287
106.
7450
83
30.
030.
005
0.00
50.
003
0.3
58.
101
JB 2
.16
Mar
ine
169/
4/20
1914
.19
-6.0
4157
106.
7455
52
20.
020.
003
0.00
30.
002
0.0
511
.395
JB 2
.17
Mar
ine
179/
4/20
1914
.32
-6.0
4830
106.
7494
73
20.
020.
004
0.00
40.
003
0.0
615
.496
JB 2
.18
Mar
ine
189/
4/20
1914
.42
-6.0
5627
106.
7452
82
20.
020.
004
0.00
40.
002
2.0
950
.979
JB 2
.19
Mar
ine
199/
4/20
1914
.51
-6.0
6217
106.
7461
32
20.
020.
003
0.00
30.
002
2.4
832
.733
JB 2
.20
Mar
ine
209/
4/20
1915
.12
-6.0
8107
106.
7335
34
30.
030.
006
0.00
50.
004
5.8
1180
.291
Tab
le 2
. Wat
er q
ualit
y of
Jak
arta
Bay
III
HYDR
OCO
LOR
Sam
plin
gSt
atio
nRe
mar
ksDa
teCl
ock
Labo
rato
rium
Report of Water Quality Analysis Appendix 5
98 PICES Scientific Report No. 58

HORI
BALa
titud
eLo
ngitu
deTu
rbid
ity (N
TU)
SPM
(g/m
3 )bb
Red
(1/m
)Re
flec.
Red
(1/s
r)Re
flec.
Gre
en (1
/sr)
Refle
c. B
lue
(1/s
r)Tu
rbid
ity (N
TU)
SPM
(mg/
l)Ch
loro
phyl
l-a (µ
g/l)
PL 1
.1M
arin
e 1
8/17
/201
915
.08
-6.9
8738
106.
5418
05
50.
050.
008
0.00
90.
007
3.2
154.
982
PL 1
.2M
arin
e 2
8/17
/201
915
.14
-6.9
8878
106.
5412
53
20.
020.
004
0.00
50.
004
0.0
134.
780
PL 1
.3M
arin
e 3
8/17
/201
915
.20
-6.9
8933
106.
5359
03
30.
030.
004
0.00
60.
004
0.0
144.
632
PL 1
.4M
arin
e 4
8/17
/201
915
.27
-6.9
9017
106.
5370
02
20.
020.
003
0.00
50.
003
0.0
73.
824
PL 1
.5M
arin
e 5
8/17
/201
915
.33
-6.9
9327
106.
5352
83
30.
030.
006
0.00
70.
005
0.0
103.
415
PL 1
.6M
arin
e 6
8/17
/201
915
.41
-6.9
9627
106.
5330
53
30.
030.
005
0.00
60.
004
0.0
14.
731
PL 1
.7M
arin
e 7
8/17
/201
915
.46
-7.0
0215
106.
5304
83
30.
030.
005
0.00
70.
005
0.0
44.
179
PL 1
.8M
arin
e 8
8/17
/201
915
.52
-7.0
0933
106.
5284
54
40.
040.
006
0.00
80.
005
0.0
95.
492
PL 1
.9M
arin
e 9
8/17
/201
915
.58
-7.0
1370
106.
5269
34
40.
040.
006
0.00
90.
006
0.5
125.
098
PL 1
.10
Mar
ine
108/
17/2
019
16.0
4-7
.019
0010
6.52
572
55
0.05
0.00
80.
010
0.00
82.
712
2.65
4PL
1.1
1M
arin
e 11
8/17
/201
916
.15
-7.0
2123
106.
5173
12
20.
020.
003
0.00
50.
004
0.0
134.
345
PL 1
.12
Mar
ine
128/
17/2
019
16.2
3-7
.014
9110
6.51
964
22
0.02
0.00
30.
004
0.00
30.
015
4.01
8PL
1.1
3M
arin
e 13
8/17
/201
916
.29
-7.0
0758
106.
5193
52
20.
020.
003
0.00
40.
003
0.0
113.
820
PL 1
.14
Mar
ine
148/
17/2
019
16.3
7-7
.998
4310
6.51
935
22
0.02
0.00
40.
005
0.00
40.
012
3.29
0PL
1.1
5M
arin
e 15
8/17
/201
916
.46
-7.9
8910
106.
5176
32
20.
020.
004
0.00
50.
003
0.0
173.
100
PL 1
.16
Mar
ine
168/
17/2
019
16.5
6-7
.977
2610
6.51
248
33
0.03
0.00
50.
006
0.00
50.
010
3.38
4PL
1.1
7M
arin
e 17
8/17
/201
917
.04
-7.0
9699
106.
5049
54
40.
040.
007
0.00
80.
006
0.0
93.
485
PL 1
.18
Mar
ine
188/
17/2
019
17.1
1-7
.966
1810
6.49
664
44
0.04
0.00
60.
008
0.00
70.
010
2.57
7PL
1.1
9Fr
esw
ater
Pon
d8/
18/2
019
08.5
3-7
.959
8310
6.47
699
1514
0.15
0.01
80.
017
0.00
930
.635
68.7
65PL
1.2
0Ba
rcki
sh R
iver
Wat
ers
8/18
/201
909
.44
-7.9
7152
106.
5237
417
170.
170.
019
0.01
90.
016
12.8
222.
646
PL 2
.1M
arin
e 1
9/7/
2019
14.1
9-6
.986
6810
6.53
928
43
0.03
0.00
60.
007
0.00
50.
017
4.25
2PL
2.2
Mar
ine
29/
7/20
1914
.26
-6.9
9192
106.
5377
22
20.
020.
004
0.00
50.
003
0.0
94.
582
PL 2
.3M
arin
e 3
9/7/
2019
14.3
7-6
.998
3310
6.53
603
22
0.02
0.00
40.
006
0.00
40.
05
3.69
5PL
2.4
Mar
ine
49/
7/20
1914
.47
-7.0
0763
106.
5327
83
30.
030.
005
0.00
60.
004
0.0
33.
460
PL 2
.5M
arin
e 5
9/7/
2019
14.5
7-7
.018
8510
6.53
030
33
0.03
0.00
60.
008
0.00
50.
04
3.50
9PL
2.6
Mar
ine
69/
7/20
1915
.12
-7.0
2890
106.
5252
01
10.
010.
002
0.00
50.
003
0.0
42.
822
PL 2
.7M
arin
e 7
9/7/
2019
15.2
0-7
.036
5810
6.52
327
22
0.02
0.00
30.
004
0.00
20.
08
3.25
7PL
2.8
Mar
ine
89/
7/20
1915
.30
-7.0
3532
106.
5196
01
10.
010.
003
0.00
50.
003
0.0
32.
642
PL 2
.9M
arin
e 9
9/7/
2019
15.4
0-7
.032
1010
6.51
120
21
0.02
0.00
30.
004
0.00
30.
03
2.47
9PL
2.1
0M
arin
e 10
9/7/
2019
15.5
1-7
.026
4210
6.50
342
11
0.01
0.00
20.
003
0.00
20.
06
2.56
1PL
2.1
1M
arin
e 11
9/7/
2019
16.0
1-7
.018
3210
6.50
092
11
0.01
0.00
10.
002
0.00
10.
03
2.93
8PL
2.1
2M
arin
e 12
9/7/
2019
16.1
7-7
.002
0310
6.49
898
21
0.01
0.00
30.
003
0.00
10.
03
2.74
1PL
2.1
3M
arin
e 13
9/7/
2019
16.2
7-6
.991
3310
6.49
948
11
0.01
0.00
20.
003
0.00
20.
04
2.62
8PL
2.1
4M
arin
e 14
9/7/
2019
16.3
7-6
.977
4310
6.50
083
22
0.02
0.00
30.
004
0.00
20.
03
4.24
5PL
2.1
5M
arin
e 15
9/7/
2019
16.4
3-6
.973
9310
6.50
615
22
0.02
0.00
30.
003
0.00
20.
05
4.77
4PL
2.1
6M
arin
e 16
9/7/
2019
16.5
4-6
.972
0810
6.51
002
22
0.02
0.00
30.
005
0.00
20.
06
6.48
7PL
2.1
7M
arin
e 17
9/7/
2019
17.0
4-6
.973
8510
6.51
655
11
0.01
0.00
10.
002
0.00
10.
04
5.14
0PL
2.1
8M
arin
e 18
9/7/
2019
17.1
6-6
.976
1710
6.52
587
22
0.02
0.00
30.
006
0.00
40.
06
4.42
4PL
2.1
9Fr
esw
ater
Pon
d9/
8/20
1908
.35
-7.9
5983
106.
4769
96
60.
060.
009
0.00
90.
007
36.3
2421
3.15
0PL
2.2
0Ba
rcki
sh R
iver
Wat
ers
9/8/
2019
09.0
3-7
.971
5210
6.52
374
1413
0.13
0.01
70.
016
0.01
221
.820
86.6
36
Tab
le 3
. Wat
er q
ualit
y of
Pel
abuh
an R
atu
III
Sam
plin
gSt
atio
nsRe
mar
ksDa
teCl
ock
HYDR
OCO
LOR
Labo
rato
rium
Appendix 5 Report of Water Quality Analysis
PICES Scientific Report No. 58 99

Report of Water Quality Analysis Appendix 5
100 PICES Scientific Report No. 58
4. SUMMARY
Data collection of water quality parameters (Turbidity, SPM and cholorophyll-a) in Jakarta Bay and Pelabuhan Ratu was conducted to support the PICES-MAFF Project for “Building Capacity for Coastal Monitoring by Local Small-scale Fishers”. These data are the start for validating turbidity and SPM data, and calibration of HydroColor optical data/remote sensing algorithms for estimating chlorophyll a concentrations in the coastal areas of Indonesia. Difference in water quality measures between Jakarta Bay and Pelabuhan Ratu illustrate the different environmental characteristics of these ecosystems. The results will aid in refining the HydroColor application so that it can monitor water quality parameters more accurately in Indonesian coastal regions.
References
Baird, R.B., Eaton, A.D., and Rice, A.W. 2017. Standard Methods For the Examination of Water and Wastewater, 23rd edition. Leeuw, T. and Boss, E. 2018. The HydroColor App: Above Water Measurements of Remote Sensing Reflectance and Turbidity Using a Smartphone Camera. Sensors 18(1): 256. doi: 10.3390/s18010256

Appendix 6 Session Descriptions and Papers Presented at PICES Annual Meetings
PICES Scientific Report No. 58 101
Appendix 6
Session Descriptions and Presented Papers at PICES Annual Meetings
PICES-2018, Yokohama, Japan HD Workshop on “Taking stock of Marine Ecosystem Services in the North Pacific—exploring examples and examining methods” ........................................................................................................ 102 Fishery Science Committee (FIS) Paper Session ................................................................................... 103
PICES-2019, Victoria, Canada Science Board Symposium on “Connecting science and communities in a changing North Pacific” .. 106 MONITOR Topic Session on “Coastal Ocean Observing Systems, Essential Biological Variables and community-based monitoring” ........................................................................................................ 108

Session Descriptions and Papers Presented at PICES Annual Meetings Appendix 6
102 PICES Scientific Report No. 58
PICES-2018, Yokohama, Japan October 25–November 4, 2018
HD Workshop (W8) Taking stock of Marine Ecosystem Services in the North Pacific—exploring examples and examining methods
Convenors: Shang Chen (China), Daniel K. Lew (USA)
Background
The purpose of this workshop was to advance understanding of the character and value of marine ecosystem services under the aegis of the Working Group on Marine Ecosystem Services (WG 41/WG-MES). Participation by local scientists was encouraged. The main tasks of this workshop included: (1) reviewing MES studies from the North Pacific region; (2) identifying gaps in understanding the status and trends of MES in North Pacific region; (3) developing a draft typology of marine ecosystem services and various approaches and methods for assessing those services and their value.
Economic value of ecosystem services and utility of coastal fisheries in Indramayu, Indonesia
Takaaki Mori1, Ayumi Kanaya1, Naoki Tojo2, Mitsutaku Makino3, Mark Wells4, Vladimir Kulik5, Joon-Soo Lee6, Shion Takemura3, Charles Trick7, Chang-an Xu8, Suhendar Sachoemar9
1 School of Fisheries Sciences, Hokkaido University, 3-1-1, Minato Cho, Hakodate, Japan 041-8611 2 Faculty of Fisheries Sciences, Hokkaido University, 3-1-1, Minato Cho, Hakodate, Japan 041-8611 3 National Research Institute of Fisheries Science, Japan Fisheries Research and Education Agency, 2-12-4
Fukuura, Kanazawa-ku, Yokohama, Kanagawa, Japan 236-8648 4 School of Marine Sciences, University of Maine, 5741 Libby Hall, Orono, ME, U.S.A. 04469 5 TINRO-Center, 4 Shevchenko Alley, Vladivostok, Primorsky Kray, Russia 690091 6 Korea Oceanographic Data Center, National Institute of Fisheries Science, Ministry of Oceans and
Fisheries, 216 Gijanghaean-ro, Gijang-eup, Gijang-gun, Busan, Korea, R 46083 7 Department of Biology, Western University, Room 402, North Campus Bldg., 1151 Richmond St. N.,
London, ON, Canada N6A 5B7 8 Third Institute of Oceanography, State Oceanic Administration, 178, Daxue Road, Siming District,
Xiamen, Fujian, China, 361005 9 Professor of Coastal Oceanography and Marine Science, Director of Center for Development, Education
and Training, Agency for The Assessment and Application of Technology (BPPT), BPPT II Bld, 6 Fl, JL. M.H.Thamrin No. 8, Jakarta 10340, Indonesia
Ecosystem provide benefit to people as a variety of services. Services from coastal aquatic systems, such as lagoon and estuaries, associated to coastal forests is essential for coastal fishers’ livelihoods. Especially, the contributions from coastal mangrove forest cannot be negligible for coastal fishing and fisheries communities in tropical and subtropical coast of the Pacific Rim. We aim to quantify services from coastal aquatic ecosystem to smallscale fishing community, especially with mangrove and coastal aquatic vegetations. The selected model area, a local village in the western Indramayu, Indonesia is under influence of the coastal environmental changes and industrialization in recent years, and fishers
Appendix 6 Session Descriptions and Papers Presented at PICES Annual Meetings
PICES Scientific Report No. 58 103
concern sustainability of their fishing and households. Younger fishers prefer to continuously have benefits that they have received from the environment around lagoon, but they are not sure to be satisfied from the changing environment and lives with fishing in the recent urbanization. In the FishGIS project, we involved local fishers to examine the environment with fisheries then have made efforts to find sustainable future alternatives based on the scientific knowledges from the North Pacific and the economic utility of local fishers. The present and future ecosystem services to the community should be quantified with fishers, and sustainable alternatives should be explored with their satisfactions. We also compare among the economic utility before the project activities, the economic utility after the project activities and the utility in expected future alternatives.
Fishery Science Committee (FIS) Paper Session
Convenors: Xianshi Jin (China), Jackie King (Canada)
Background
This session invited papers addressing general topics in fishery science and fisheries oceanography in the North Pacific and its marginal seas, except those covered by Topic Sessions sponsored by the Fishery Science Committee (FIS).
Interactions within fisheries eco-/econo-system and impact of participatory research in a coastal community: In the model area of Indonesia
Naoki Tojo1, Takaaki Mori2, Ayumi Kanaya2, Mitsutaku Makino3, Mark Wells4, Vldmir Kulik5, Joon-Soo Lee6, Shion Takemura3, Charles Trick7, Chang-an Xu8, Suhendar Sachoemar9
1 Faculty of Fisheries Sciences, Hokkaido University, 3-1-1, Minato Cho, Hakodate, Japan 041-8611. Email: [email protected]
2 School of Fisheries Sciences, Hokkaido University, 3-1-1, Minato Cho, Hakodate, Japan 041-8611 3 National Research Institute of Fisheries Science, Japan Fisheries Research and Education Agency, 2-12-4
Fukuura, Kanazawa-ku, Yokohama, Kanagawa, Japan 236-8648 4 School of Marine Sciences, University of Maine, 5741 Libby Hall, Orono, ME, U.S.A. 04469 5 TINRO-Center, 4 Shevchenko Alley, Vladivostok, Primorsky Kray, Russia 690091 6 Korea Oceanographic Data Center, National Institute of Fisheries Science, Ministry of Oceans and
Fisheries, 216 Gijanghaean-ro, Gijang-eup, Gijang-gun, Busan, Korea, R 46083 7 Department of Biology, Western University, Room 402, North Campus Bldg., 1151 Richmond St. N.,
London, ON, Canada N6A 5B7 8 Third Institute of Oceanography, State Oceanic Administration, 178, Daxue Road, Siming District,
Xiamen, Fujian, China, 361005 9 Professor of Coastal Oceanography and Marine Science, Director of Center for Development, Education
and Training, Agency for The Assessment and Application of Technology (BPPT), BPPT II Bld, 6 Fl, JL. M.H.Thamrin No. 8, Jakarta 10340, Indonesia
More than 90 percent of world population is depending upon the capture fisheries or fisheries industries based on the small-scale fisheries in developing countries. Many livelihoods of the population face to the dynamics of coastal marine environment and under influences of human activities. Sustainability

Session Descriptions and Papers Presented at PICES Annual Meetings Appendix 6
104 PICES Scientific Report No. 58
would be attained by continuous efforts to balance activities in the given dynamics, but it is not easy task for locals to precisely find the optimal in changing environment and economics without assistances of sciences. Also, resiliency of communities has been discussed as one of the important factors to respond well to external factors around their livelihood, but discussions of resiliency has not really been made in the levels of self-involvement of fishers. In the Project “Fish GIS”, a citizen-science approach has been taken to monitor environment and small-scale fisheries by fishers themselves with the cumulated scientific knowledges from the North pacific while assisting motivation for selfsustainability of communities in Indonesian fields. Firstly, we aim to explore the present state of eco-/econosystem of the one of model areas, Indramayu in Indonesia, with the productions and interactions of the functional groups and fishers with fair estimations. Then, we quantitatively conceptualize the expected state based on the interviewed information in economic utilities. Finally, we expect to examine the changes after the participatory research activities in the Project in the interaction model.
Participatory research in resource production for sustainable fisheries and estimation of option value in Indoramayu Indonesia
Ayumi Kanaya1, Takaaki Mori1, Naoki Tojo2, Mitsutaku Makino3, Mark Wells4, Vldmir Kulik5, Joon-Soo Lee6, Shion Takemura3, Charles Trick7, Chang-an Xu8, Suhendar Sachoemar9
1 School of Fisheries Sciences, Hokkaido University, 3-1-1, Minato Cho, Hakodate, Japan 041-8611. E-mail: [email protected]
2 Faculty of Fisheries Sciences, Hokkaido University, 3-1-1, Minato Cho, Hakodate, Japan 041-8611 3 National Research Institute of Fisheries Science, Japan Fisheries Research and Education Agency, 2-12-4
Fukuura, Kanazawa-ku, Yokohama, Kanagawa, Japan 236-8648 4 School of Marine Sciences, University of Maine, 5741 Libby Hall, Orono, ME, U.S.A. 04469 5 TINRO-Center, 4 Shevchenko Alley, Vladivostok, Primorsky Kray, Russia 690091 6 Korea Oceanographic Data Center, National Institute of Fisheries Science, Ministry of Oceans and
Fisheries, 216 Gijanghaean-ro, Gijang-eup, Gijang-gun, Busan, Korea, R 46083 7 Department of Biology, Western University, Room 402, North Campus Bldg., 1151 Richmond St. N.,
London, ON, Canada N6A 5B7 8 Third Institute of Oceanography, State Oceanic Administration, 178, Daxue Road, Siming District,
Xiamen, Fujian, China, 361005 9 Professor of Coastal Oceanography and Marine Science, Director of Center for Development, Education
and Training, Agency for The Assessment and Application of Technology (BPPT), BPPT II Bld, 6 Fl, JL. M.H.Thamrin No. 8, Jakarta 10340, INDONESIA
Major fishing targets are often found in near-shore over continental shelf, and coastal fishers have sustained their livelihoods upon those resources. Demand of fisheries resources are increasing globally although more than half of resources are already utilized by present fishing activities. Sustainability has been one of the common goals for coastal fisheries though uncertainties associated changes of climate and marine environment are challenging. Resource biological informations are fundamental references for sustainable fishery management. Applications 210 PICES-2018 of scientific approach is more expected to contribute in the management measures. However, such scientific management methods by scientists are often costly, and developed measures may not be inacceptable for coastal fishers because of the difference in their perspectives over the obtained information. It is probably practical to involve locals to their own fisheries management through co-workings. In the Project “Fish GIS” of the North Pacific Science Organization (PICES), participatory research efforts have been made to enhance

Appendix 6 Session Descriptions and Papers Presented at PICES Annual Meetings
PICES Scientific Report No. 58 105
motivation of local fishers toward sustainable future. A village of Indramayu, Indonesia was selected as the model area in our study. We expect to analyze necessary biological information collected from fishers, such as size and weight. We estimate future returns as the partial option value from target fishes in two scenarios: (1) no change in fishing/ present management and (2) applying suggested measures from fishers during the Project using this scientific information. Communication over the analyses are planned to be made frequently with fishers directly and electrically through the planned activities in the Project.
Session Descriptions and Papers Presented at PICES Annual Meetings Appendix 6
106 PICES Scientific Report No. 58
PICES-2019, Victoria, Canada October 16–27, 2019
Science Board Symposium (S1) Connecting science and communities in a changing North Pacific
Convenors: Hiroaki Saito (SB) corresponding, Vera L. Trainer (SB), Se-Jong Ju (BIO), Xianshi Jin (FIS), Keith Criddle (HD), Guangshui Na (MEQ), Jennifer Boldt (MONITOR), Emanuele Di Lorenzo (POC), Joon-Soo Lee (TCODE), Steven Bograd (FUTURE), Sukyung Kang (FUTURE), Igor Shevchenko (Russia), and Motomitsu Takahashi (Japan)
Background
The North Pacific Ocean is rapidly changing due to an increasing number of stressors. This presents challenges for understanding, collaboration, and communication. More specifically: 1) What are the effects of human activities and climate change on ecosystems and the services they provide?, 2) Are there ways to improve collaboration among organizations and integrate a variety of knowledge sources to answer this question?, and 3) How can we communicate this knowledge effectively to the public? Climate change is an over-arching stressor that delivers a non-stationary background upon which other stressors act. Further, there are a wide variety of human stressors, such as fishing, aquaculture, microplastics/marine litter, invasive species, and shipping that can alter ecosystem structure, function, productivity, and biodiversity. Anticipating and detecting ecosystem responses to these stressors is a challenge, especially when responses may be non-linear and synergistic or antagonistic. Additional challenges include integrating the complexity of multiple spatial and temporal scales and incorporating climate change into sustainable ecosystem management. PICES provides a unique forum for collaboration among North Pacific member nations and other science organizations to address these challenges. There are, however, opportunities for further collaborations to better improve our understanding of the North Pacific, such as engagement with Indigenous people, citizen science programs, collaborative surveys, and coupled coastal - deep water oceanographic monitoring programs. Communicating the results of ecosystem science to the public and coastal societies is another area for advancement, as many scientists receive little or no training in communicating their results to a layperson audience or in two-way communication, where feedback can inform science. We welcome submission of abstracts to S1 that address these integrative and complex issues. In particular, the PICES FUTURE (Forecasting and Understanding Trends, Uncertainty and Responses of North Pacific Marine Ecosystems) Integrative Science program would benefit from better information on: 1) the effects of human activities on coastal ecosystems, ecosystem services, and human societies; forecasting the effects of climate change on the distribution and productivity of species and communities; incorporating climate change, multiple stressors, and different temporal and spatial scales into sustainable resource and ecosystem management; tools to evaluate ecosystem response thresholds and common ecosystem reference points; and forecasting impacts of coastal stressors (e.g., microplastics, pollution, invasive species, shipping, aquaculture); 2) collaborative work with Indigenous people, with citizen science programs, with other science organizations, and across the western and eastern North Pacific; and 3) methods for more effectively communicating science to the public.

Appendix 6 Session Descriptions and Papers Presented at PICES Annual Meetings
PICES Scientific Report No. 58 107
Capacity building in Indonesian fishing communities using smartphone technology to monitor the environment and fisheries: The FishGIS project
Mitsutaku Makino1, Mark L. Wells2, Suhendar I Sachoemar3, Naoki Tojo4, Shion Takemura5, Shigeharu Kogushi6, Vladimir Kulik7, Joo-Soo Lee8, Charles Trick9, Chang-an Xu10
and Alexander Bychkov11
1 AORI, The University of Tokyo, Kashiwa, Japan 2 School of Marine Sciences, University of Maine, Orono, USA 3 Agency for the Assessment and Application of Technology, Jakarta, Indonesia 4 Faculty of Fisheries Sciences, Hokkaido University, Hakodate, Japan 5 National Research Institute of Fisheries Science, FRA, Yokohama, Japan 6 Greenfront Research Laboratory Co., Ltd., Aichi, Japan 7 Russian Research Institute of Fisheries and Oceanography, Pacific Branch, Vladivostok, Russia 8 National Institute of Fisheries Science, MOF, Busan, Korea 9 Western University, London, Canada 10 Third Institute of Oceanography, SOA, Xiamen, China 11 PICES Secretariat
Fisheries management is often challenged by the limitations in survey data, and this weakness is particularly intense for developing nations. The overall goal of the PICES-MAFF FishGIS project is to enhance the capacity of local small-scale fishers in Pacific Rim developing countries to monitor their local coastal ecosystems and coastal fisheries. The project uses smartphone GIS-based technology (applications) to enable Indonesian fishing communities to quantify some aspects of water quality, the presence of toxic (red-tide) phytoplankton, fish landings accompanied by information on fishing operations (including illegal, unreported or unregulated fishing activities), and floating garbage. Fishers and other community members are acting as citizen scientists to transmit these coastal ecosystem and fisheries data to the relevant Indonesian agencies. This type of citizen sampling is proving to provide greater temporal and spatial data coverage than conventional scientific monitoring. Furthermore, feedback from local community members has been used to refine the FishGIS applications, including cultural design aspects such as translating the application steps into the Indonesian language. Perhaps most importantly, this integration has created a collaborative enterprise between PICES, Indonesian researchers and government, and the local communities, with new synergies that are improving knowledge and awareness of sustainable fisheries practices and food safety. The primary outcomes of the FishGIS project activities are: 1) local community members have developed a sense of ownership and are taking pride in their monitoring activities; 2) the Indonesian government is including these citizen scientist data into its National Ocean Data Center; and 3) the autonomous data streams provided by the fishing communities are now laying a foundation for the Indonesian government to scientifically manage and predict the future of its coastal ecosystems and fisheries. Two training workshops on the new smartphone technologies for fishers, community leaders, as well as for Indonesian researchers and central and local government officers, have been conducted in Indonesia in July 2018 and July 2019. The final workshop of this project is scheduled for February 2020 when reports prepared based on the collected data will be delivered to the participating communities. Future plans are to continue assessing the changing perceptions in local communities, and to include broader range of Indonesian stakeholders, such as NGOs.

Session Descriptions and Papers Presented at PICES Annual Meetings Appendix 6
108 PICES Scientific Report No. 58
MONITOR Topic Session (S9) Coastal Ocean Observing Systems, Essential Biological Variables and community-based monitoring
Convenors: Charles Hannah (Canada) corresponding, Sung Yong Kim (Korea), Kim Juniper (Canada)
Background The goals of FUTURE require systematic and sustained observations of marine ecosystems, especially in the coastal regions where the interactions between humans and the marine environment are most intense. The goals also require the integration of physical, chemical and biological state of the ocean. The Advisory Panel on North Pacific Coastal Ocean Observing Systems is responsible for advising PICES on the linkages between coastal ocean observing systems and the PICES FUTURE Science Program, and the Pacific Ecosystem Status Report. We propose a Science Session that will assess the current state of coastal ocean observing systems in the north Pacific Ocean with respect to the biological and ecosystem Essential Ocean Variables (eEOVs) recently developed by the Global Ocean Observing System (Miloslavich et al 2018 DOI: 10.1111/gcb.14108), and evaluate the potential for expanding the inclusion of eEOVs in coastal ocean observing in the North Pacific. The session will provide a basis for identifying gaps in observing systems relative to FUTURE’s goals of providing a synthesis of knowledge on: a) ecosystem resilience and vulnerability; b) ecosystems response to natural and anthropogenic forcing; and c) future ecosystem change. We invite contributions from researchers, community based monitoring programs, and data managers that will address the questions: 1) which eEOVs should be measured; 2) does the technology exist to make the required measurements in a systematic fashion; 3) how do we integrate eEOVs into current and future coastal ocean observing programs?
Developing a community-based coastal environmental monitoring system in Indonesia using smartphone app
Shion Takemura1, Mitsutaku Makino2, Shigeharu Kogushi3, Naoki Tojo4 and Mark Wells5
1 National Research Institute of Fisheries Science, FRA, Yokohama, Japan 2 AORI, The University of Tokyo, Kashiwa, Japan 3 Greenfront Research Laboratory Co., Ltd., Aichi, Japan 4 Faculty of Fisheries Sciences, Hokkaido University, Hakodate, Japan 5 School of Marine Sciences, University of Maine, Orono, USA
Citizen science is an effective research approach used to understand large-scale patterns of change in the distribution, abundance, and presence of organisms across time and space. There are many successful examples of citizen-based monitoring in developed countries. However, this approach has not been widely applied yet for collecting environmental and fisheries data in developing nations. The objective of this research was to develop a community-based coastal environmental monitoring system using a smartphone app in Indonesia where coastal ecosystems face various challenges due to ecological and social changes. In March 2018, based on discussions with fishers and other community members in several Indonesian villages, the FishGIS Project Science Team (PST), composed of scientists from all PICES member countries, identified five items to monitor in the local marine environment. Then, we created an initial version of a smartphone app and conducted two training workshops in Indonesia (in

Appendix 6 Session Descriptions and Papers Presented at PICES Annual Meetings
PICES Scientific Report No. 58 109
July 2018 and July 2019) for local fishers, community leaders, as well as for researchers and central and local government officers, on how to use this new technology for coastal monitoring. Finally, we developed an initial version of a data sharing system that provides immediate feedback to the fishers on the results of their monitoring efforts. Working on the smartphone app, we faced various challenges. However, these challenges proved to be an opportunity for the local fishers and government officers, and Indonesian and PICES researchers to learn from each other. For example, while the local fishers and government officers learned the concepts and importance of coastal monitoring from the PST, we learned the realities and needs of the local communities on how to implement the monitoring using smartphone technology. In this presentation, we will discuss effectiveness and difficulties of community-based coastal monitoring in Indonesia.

PICES Press Articles Appendix 7
110 PICES Scientific Report No. 58
Appendix 7
FishGIS Articles in PICES Press
A new PICES MAFF-sponsored project: Building capacity for coastal monitoring by small-scale fishers by Mitsutaku Makino and Mark Wells
PICES Press, Vol. 26, No. 2, Summer 2018 .................................................................................... 111
The PICES–MAFF-sponsored Project on “Building capacity for coastal monitoring by local small-scale fishers” (FishGIS): Mobile phone-based monitoring technology and training workshop by Shion Takemura, Shigeharu Kogushi, Mark Wells and Mitsutaku Makino
PICES Press, Vol. 27, No. 1, Winter 2019 ...................................................................................... 116
The PICES–MAFF-sponsored Project on “Building capacity for coastal monitoring by local small-scale fishers” (FishGIS): Incorporating community-based research principles by Naoki Tojo, Takaaki Mori and Charles Trick
PICES Press, Vol. 27, No. 2, Summer 2019 .................................................................................... 120
Smartphone-based tools to enhance fishery sustainability for coastal communities in developing nations: The PICES–Japan MAFF FishGIS Project by Mitsutaku Makino, Mark Wells, Shion Takemura, Shigeharu Kogushi, Naoki Tojo, Charles Trick, Suhendar I Sachoemar, Vladimir Kulik, Chang-an Xu and Joon-Soo Lee
PICES Press, Vol. 29, No. 1, Winter 2021 ...................................................................................... 126

Appendix 7 PICES Press Articles
PICES Scientific Report No. 58 111
A new PICES MAFF-sponsored project: Building capacity for coastal monitoring by small-scale fishers
by Mitsutaku Makino and Mark Wells
Natural and anthropogenic pressures have been generating changes in the marine ecological system, and effects of these changes to the well-being of people living in coastal areas are difficult to predict because of the lack of understanding and many uncertainties in social and ecological systems (Guillotreau et al., 2017). Therefore, one of the most important tasks for marine researchers is to scientifically assist local people in adapting to social and ecological changes for their sustainable livelihood and better well-being (Armitage at al., 2017). This was the rationale for a new 3-year (2017–2020) PICES project on “Building capacity for coastal monitoring by local small-scale fishers” (FishGIS), funded by the Ministry of Agriculture, Forestry and Fisheries (MAFF) of Japan, through the Fisheries Agency of Japan (JFA), from the Official Development Assistance (ODA) Fund. PICES member countries have resources for monitoring environmental conditions and fisheries in coastal waters, while developing nations are far more limited in their capacity for collecting data needed to advance their management practices. Citizen-based monitoring is an approach designed to improve the efficiency and effectiveness of monitoring efforts when technical and financial resources are not sufficient. There are successful examples of citizen-based monitoring in developed countries. However, this approach has not been widely applied yet to the collection of environmental and fisheries data in developing nations. The overall goal of the FishGIS project is to enhance the capacity of local small-scale fishers in Pacific Rim developing countries to monitor coastal ecosystems and coastal fisheries. The extensive use of smartphones in these countries offers a creative potential for implementing the project through a smartphone-based monitoring system used by local fishers and fish farmers. The project key questions are: (a) How do global changes in climate and economy affect coastal ecosystems? and (b) How may enhanced capacity for monitoring activities by local fishers help to improve fisheries management in coastal areas? To investigate these questions, the project will focus on the following major initiatives to be supported by a series of capacity building workshops led by scientists from PICES member countries: 3. Coastal ecosystem monitoring activities by local
small-scale fishers to detect ecosystems changes (e.g., deviations in water quality and the changes in plankton community composition);
4. Coastal fisheries monitoring activities by local small-scale fishers to improve coastal fisheries management
(e.g., information about fishing operations or species composition on the market);
5. Coastal and estuarine water monitoring activities by local small-scale aquaculture fishers to measure the effects of government clean water initiatives on water quality for aquaculture operations.
The project is expected to interact with, and support relevant activities of, PICES Scientific Committees on Human Dimensions (HD) and Fishery Science (FIS), PICES Technical Committees on Data Exchange (TCODE) and on Monitoring (MONITOR), and PICES FUTURE Science Program (Research Theme 3 on “How do human activities affect coastal ecosystems and how are societies affected by changes in these ecosystems?”). The project is being directed by the Project Science Team (PST) formed in November 2017 based on principles and procedures detailed in the PICES Policy for approval and management of special projects (http://meetings.pices.int/ publications/ annual-reports/2017/2017-GC-Decisions-Vladivostok.pdf; Decision 2017/A/7). All PICES member countries and all the above mentioned Committees are represented on the PST (Table 1 and Fig. 1). The PST Co-Chairs, Dr. Mitsutaku Makino and Dr. Mark Wells, are responsible for the scientific implementation of the project and annual reporting to MAFF and to PICES Science Board through the HD Committee. The Project Coordinator, Dr. Alexander Bychkov, is responsible for the management of the fund and annual reporting on its disposition to MAFF/JFA and to PICES Governing Council through the Finance and Administration Committee. The first PST meeting was held January 17–19, 2018, at the Headquarters of the Japan Fisheries Research and Education Agency in Yokohama, Japan (Fig. 2). The participants reviewed the overall strategy and general directions for the project and developed timelines for project initiatives, activities and deliverables. A framework for a smartphone-based system for coastal ecosystem monitoring, including a prototype GIS fisheries data application to be used by local small-scale fishers, was introduced by Dr. Shigeharu Kogushi (GFL, Japan) and some additional considerations were suggested by PST members. Another discussion point was on possible approaches to selection of case study sites. The workplan for Year 1 was refined, and the workplan for Year 2 was drafted. Indonesia was chosen as a developing Pacific Rim country to implement the project because of its role in the fisheries production of the world and large population of small-scale fishers. The importance of having more effective fisheries

PICES Press Articles Appendix 7
112 PICES Scientific Report No. 58
Table 1 Membership of the Project Science Team
Name Affiliation Country/Group Vladimir Kulik TINRO-Center Russia/MONITOR Joon-Soo Lee KODC, National Institute of Fisheries Science Korea/TCODE Mitsutaku Makino Japan Fisheries Research and Education Agency Japan/HD Shion Takemura Japan Fisheries Research and Education Agency Japan/HD Naoki Tojo Hokkaido University Japan/FIS Charles Trick Western University Canada/S-HAB Mark Wells University of Maine USA/S-HAB Chang-an Xu Third Institute of Oceanography, SOA China
Fig. 1 PICES (North Pacific Marine Science Organization) structure for 2017–2018 showing links between the FishGIS Project and PICES Committees
and expert groups.
Fig. 2 Group photo taken during the first PST meeting in Yokohama, Japan (from left to right): Mitsutaku Makino, Naoki Tojo, Mark Wells, Shigeharu
Kogushi (lead for the development of a GIS-based fisheries data smartphone application), Vladimir Kulik, Chang-an Xu, Alexander Bychkov, Shion Takemura, Charles Trick and Tomowo Watanabe (MAFF/JFA representative).

Appendix 7 PICES Press Articles
PICES Scientific Report No. 58 113
management practices is widely recognized in Indonesia, and this leads to support by the government and the willingness of local communities and stakeholders to consider new approaches such as the development and implementation of a fisher/citizen-based observation system linked with fisheries scientists and managers. One of the first, and strongest, lessons learned from the previous PICES/MAFF projects is the importance of connecting with organizations in a developing country, which can facilitate and advance the project (Makino and Perry, 2017). The organization and the key people in it are crucial to understand the project and to translate it into the local context. The PST agreed that the Indonesian Agency for the Assessment and Application of Technology (BPPT) is the ideal partner for this project for two main reasons: (1) BPPT is responsible for leveraging advances in technology for the study of environmental systems to enhance Indonesian economic and societal development, and (2) a productive working relationship with BPPT was developed during the PICES/MAFF project on “Marine ecosystem health and human well-being (MarWeB)” (2012–2017), and the current project can build on this collaborative foundation.
The strategy was to introduce the project to BPPT colleagues to seek their advice on possible ways to implement it, including suggestions on potential locations for the demonstration case studies. On March 19–23, 2018, a group of PICES experts visited Indonesia to finalize the selection of case study sites, and to identify the key local individuals who will participate in the project, the type of training/capacity building needed, and the logistics for providing this training. This group included all PST members, Dr. Kogushi and two students, Takaaki Mori and Rinako Nakano, from Hokkaido University. On March 19, the Letter of Intent (LOI) between BPPT and PICES was signed as a basis for collaboration on the project, and a Focus Group discussion was held with researchers from BPPT, the Indonesian Ministry of Marine Affairs and Fisheries (MMAF), the Indonesian Institute of Sciences (LIPI), and local fishers and fish farmers on project implementation (Fig. 3). On March 20–22, the PICES Team and BPPT staff visited three potential case study sites (Fig. 4): Muara Gembong (an aquaculture area with issues such as decreasing seaweed production due to the water quality degradation/pollution), Indramayu District (a capture fisheries-oriented area with
Fig. 3 Visit of the PICES Team to the Indonesian Agency for the Assessment and Application of Technology (BPPT) on March 19, 2018: Signing
ceremony for the Letter of Intent between BPPT, represented by the BPPT Chairman, Mr. Unggul Priyanto, and PICES, represented by Dr. Mitsutaku Makino (top left); PICES Team members and BPPT leadership posing after the ceremony (top right); Focus Group discussion (bottom left), and Prof. Suhendar I Sachoemar, local coordinator of the MarWeB and FishGIS projects (left), leading discussion (bottom right).

PICES Press Articles Appendix 7
114 PICES Scientific Report No. 58
Fig. 4 Potential case study sites in Indonesia.
Fig. 5 Visits of the PICES Team and BPPT staff (March 20–22, 2018) to Indonesian communities considered as potential case study sites: Discussions
with local fishers and fish/seaweed farmers at Muara Gembong (top row), Indramayu District (middle row) and Cilincing (bottom row).

Appendix 7 PICES Press Articles
PICES Scientific Report No. 58 115
issues such as overfishing, water quality degradation/ pollution, and loss of fish habitat), and Cilincing (a highly populated area of small-scale fishers near Jakarta, facing water quality degradation and biochemical pollution), to evaluate which sites have the overall best conditions for implementing the project. Joint meetings and small group interviews were held in each community with local fishers and aquaculture farmers who were interested in hearing about the project, and willing to communicate their knowledge of the region (Fig. 5). The primary goal was to learn from these local citizen-experts on the state of their fisheries, their environment, and their primary concerns for local fisheries in the future. On completion of these community forums, the three sites were ranked in terms of the project goals using several criteria relevant to success of the project, including the presence of a strong local coordinator (considered vital to project success), ecosystem changes recognized by the people, evaluation of their recognition of the relationship between environment and fisheries (wild caught and aquaculture), and the overall interest in the community for education and training. Community members in all three case study sites were found to have mobile phones suited for the project, and each site had sufficient cellular signal strength to support the planned data transfer needs of the smartphone applications. The PICES Team was able to test out the prototype fisheries data application, both in terms of connectivity to data storage sites and in the ease of use for community members. A revision plan for the prototype application was designed based upon these efforts. The established
application for measuring water quality (HydroColor) was also tested and found to work well – no significant modification was considered necessary. At a wrap-up discussion with Indonesian partners on March 23, Muara Gembong and Indramayu District were selected as the demonstration sites. Cilincing was reluctantly ruled out for several reasons, with the main ones being the high level of pollution from Jakarta, and that the community and its fishing operations are likely to be in transition over the next 5 years because of local commercial development. At this meeting, linkages with other components of BPPT (BPPT Center of Technology Development for Regional Resources Development) and other agencies (MMAF and LIPI) were identified as being beneficial to the project, and preparations were initiated for a series training/capacity building workshops to be held early in summer 2018. In the next issue of the PICES Press, we are planning to introduce the technological aspects of the project. References Armitage, D., Charles, A. and Berkes, F. (Eds.) 2017.
Governing the Coastal Commons: Communities, Resilience and Transformation. Routledge, Oxford, 286 pp.
Guillotreau, P., Bundy, A. and Perry, R.I. (Eds.) 2017. Global Change in Marine Systems: Integrating Natural, Social and Governing Responses, Routledge, Oxford, 348 pp.
Makino, M. and Perry, R.I. (Eds.) 2017. Marine Ecosystems and Human Well-being: The PICES-Japan MAFF MarWeB Project. PICES Sci. Rep. No. 52, 234 pp.
Dr. Mitsutaku Makino ([email protected]) is Head of the Fisheries Management Research Group at the National Research Institute of Fisheries Science, Fisheries Research and Education Agency of Japan. He specializes in fisheries and ecosystem-based management analysis. He teaches in several universities in Japan, and currently serves as an Editor of ICES Journal of Marine Science. His book entitled “Fisheries Management in Japan” was published by Springer in 2011. Within PICES, he is Vice-Chair of the Human Dimensions Committee and a member of the FUTURE Scientific Steering Committee and Working Group (WG 36) on Ecosystem Reference Points across PICES Member Countries. He co-led, with Dr. Ian Perry, the previous (2012–2017) PICES/MAFF project on “Marine ecosystem health and human well-being (MarWeB)” and now co-chairs the FishGIS project with Dr. Mark Wells.
Dr. Mark L. Wells ([email protected]) is a Professor of Oceanography in the School of Marine Sciences, University of Maine, USA. His fields and topics of research are marine biogeochemistry, trace metal chemistry, and biological oceanography with emphasis on harmful algal blooms. Within PICES, he is a member of the Section on Ecology of Harmful Algal Blooms in the North Pacific. Mark was also involved in the PICES/MAFF project on “Marine ecosystem health and human well-being (MarWeB)” and now co-chairs the FishGIS project with Dr. Mitsutaku Makino.

PICES Press Articles Appendix 7
116 PICES Scientific Report No. 58
The PICES–MAFF-sponsored Project on “Building capacity for coastal monitoring by local small-scale fishers” (FishGIS):
Mobile phone-based monitoring technology and training workshop
by Shion Takemura, Shigeharu Kogushi, Mark Wells and Mitsutaku Makino
The overall goal of a 3-year (2017–2020) PICES project on “Building capacity for coastal monitoring by local small-scale fishers” (FishGIS), funded by the Ministry of Agriculture, Forestry and Fisheries (MAFF) of Japan, is to enhance the capacity of local small-scale fishers to monitor coastal ecosystems and coastal fisheries in Pacific Rim developing countries. Indonesia was chosen as a country to implement the project, and our local counterpart is Prof. Suhendar I Sachoemar of the Agency for the Assessment and Application of Technology (BPPT), who works in close cooperation with the Ministry of Maritime Affairs and Fisheries (MMAF), Indonesian Institute of Science (LIPI), and local governments of Muara Gembong, Indramayu, and Banten. Key questions of the project are: a) How do global changes in climate and economy affect coastal ecosystems? and b) How can enhanced capacities for monitoring activities by local fishers help to improve fisheries management in coastal areas? The project is expected to interact with, and support relevant activities of PICES Scientific Committees on Human Dimension (HD) and Fishery Science (FIS), PICES Technical Committee on Monitoring (MONITOR), and PICES FUTURE (Forecasting and Understanding Trends, Uncertainty and Responses of North Pacific Ecosystems) Program (specifically, Research Theme 3 on “How do human activities affect coastal ecosystems and how are societies affected by changes in these ecosystems?”). The project is being directed by the Project Science Team (PST), and all PICES member countries and all above mentioned groups are represented on the PST co-chaired by Drs. Mitsutaku Makino (Fisheries Research and Education Agency, Japan) and Mark Wells (University of Maine, USA). Mobile-phone-based technology for local fishers In March 2018, we visited three communities in Indonesia to discuss the concrete design of this project with local people (see Makino and Wells’s article, pp. 20–24 in PICES Press, Vol. 26, No. 2, 2018). Based on these discussions, it was decided to introduce new easy-to-use technologies for the local communities to monitor the following 5 items: 1) aspects of water quality (suspended sediments, chlorophyll), 2) phytoplankton community composition, with emphasis on harmful algal bloom (HAB) species, 3) fish landings, 4) illegal fishing vessels, and 5) floating garbage. These items are expected to be monitored by local people (mainly fishers) in close collaboration with Indonesian scientists, as described below.
The water quality assessment application HydroColor (Apple App Store, Google Play Store, Facebook Page) employs a similar methodology as precision radiometers and Ocean Color satellites to estimate three key water quality parameters: turbidity (NTU), suspended particulate matter (g/cm3), and chlorophyll concentrations (when calibrated). Three images are collected using the smartphone camera (Fig. 1). The first is an 18% photographer’s grey card to calibrate the camera, the second is the incoming (sky) radiation, and the third is the light leaving the water surface. The application uses internal GPS, compass, gyroscope, and clock to compute the position of the sun, and with this information it directs the user to hold the smartphone at the correct angles where sun glint off the water surface is minimal and at 135° from the azimuth angle of the sun (Fig. 2). This ensures the image is either taken at 40° (for the water image) or 130° (for the sky image) from nadir.
Fig. 1 Example images of the 18% photographer’s grey card (left), the
sky (middle), and the water surface (right) collected by a HydroColor user for calculating the remote sensing reflectance (http://misclab.umeoce.maine.edu/research/HydroColor.php).
Fig. 2 The HydroColor user interface showing the prompts for the three
images: grey card, sky, and water (left). On selecting the image, the screen changes to display the inclinometer and compass to guide the user to the correct smartphone angle to capture the image (right). When the green elements of the compass and inclinometer are properly aligned with the green triangles, the capture button turns green enabling the photo to be taken.

Appendix 7 PICES Press Articles
PICES Scientific Report No. 58 117
Table 1 The parameters derived by HydroColor along with the estimated uncertainty for each method (http://misclab.umeoce.maine.edu/research/HydroColor.php).
When the incoming radiation is normalized, it is proportional to the water backscattering coefficient and inversely proportional to the water absorption coefficient. Any increase in turbidity then will increase the intensity of light returning from the water. Phytoplankton and other particles containing pigments alter the color emanating from the water, which can be estimated from the ratios of radiance at different wavelengths. Colored dissolved organic matter (CDOM) absorbs light with only negligible scattering, decreasing the intensity of light emanating from water. HydroColor saves the remote sensing reflectance data and estimates of turbidity, suspended particulate matter, and the backscatter coefficient (Table 1) as well as the three images, and these are uploaded to a central server at BPPT when cellphone coverage is strong. HydroColor provides high technology but simple methodology for accurate measurement of remote sensing reflectance data. It is available for both Android and iPhone products, and has been translated into Indonesian Bahasa for community member use. The second technology being used in the project aims at collecting phytoplankton community composition data and, in particular, the presence of toxin-producing dinoflagellates. This effort utilizes Foldscopes: origami-based microscopes for the masses (https://www.foldscope.com). Foldscopes are ultra-affordable ($3 USD), durable field microscopes that give remarkably high optical qualities, similar to that of standard research microscopes. Foldscopes can provide optical magnifications of 140× with resolutions down to 2 µm. They can be attached to any smartphone, and the camera then used to collect still images or videos of swimming phytoplankton, which can be a taxonomic diagnostic. The image quality is remarkably good, and with little training it is possible to obtain high quality images that then are uploaded to a central server. The project is collaborating closely with LIPI which is the central organization responsible for HAB monitoring in Indonesian waters. Initially, images collected by community
members will be sent to LIPI staff for manual examination. These communities harvest bivalves from coastal waters for consumption, and LIPI currently lacks the personnel to monitor the presence of toxins or HAB species. The Foldscope program enables LIPI to provide this service to the participating communities. For monitoring fish landing, the project has developed a new smartphone application software named “FishGIS App” (Fig. 3). Using this software, local fishers can take photos of their catch with additional information such as locations, gear used, species, and catch trends (size and amount). This information will be then used for the preliminary stock assessment by local fisheries researchers, and shared with the local community.
Fig. 3 The FishGIS App user interfaces: user registration (left), top
menu (center), and monitoring items (right). The local fishers follow fisheries rules such as national laws, local regulations, traditional norms, religious taboos, etc. However, illegal or unregulated vessels sometimes violate such rules. The FishGIS App can be used to take a photo and record the date and location of such vessels, and share this information with the local community and governmental authorities. Another very serious problem for coastal communities is floating garbage, and FishGIS App can also be used to record the abundance and location of garbage, to enable clean-up as well as to monitor changing community practices.

PICES Press Articles Appendix 7
118 PICES Scientific Report No. 58
All the monitoring results, from water quality to garbage, are shown on a map provided by the FishGIS App (Fig. 4). Using this application, local fishers will be able to keep track of the coastal environmental conditions and share that information in their communities. Training workshop for the community On July 10–12, 2018, PICES and BPPT, with support from MMAF and LIPI, conducted a training workshop in Jakarta on the new technologies described above (Fig. 5). Overall, more than 100 participants (fishers, community leaders, local government officers, etc.) from Muara Gembong, Indramayu, and Banten attended the workshop where they learned how to install and practice HydroColor and FishGIS applications. Also noteworthy is that two scientists from LIPI who gave lectures on HABs at this forum were the trainees of the past PICES MAFF-funded project entitled “Development of prevention systems for harmful organisms’ expansion in the Pacific Rim” (2007–2012). We believe the reason the community members showed such strong interest during the 3 days of training was due to
us laying the groundwork by holding community meetings in March 2018 to understand the local needs and issues (see Makino and Wells’ article, pp. 20–24 in PICES Press, Vol. 26, No. 2, 2018), and then developing a training course based on those needs and issues. We were gratified that they were all very willing and enthusiastic to contribute to the project. The participants expressed deep interest and lots of excitement when they were able to view images of phytoplankton on their own mobile phone with Foldscope. Some of them also took additional training on the use of plankton nets. At the last session of the workshop, very productive discussions were held among community members, central and local government officers, researchers, and PICES experts. For example, it was decided to develop simple guidelines for using the applications in the local languages. Part of the design would be the YouTube movie performed by local community members. It was also found that the OS version of many of participants’ mobile phones was too old, and the applications could not be installed. For those phones, down-graded versions of the applications need to be developed. Some people who successfully downloaded
Fig. 5 Training workshop in Jakarta: community members investigate the Foldscope (left) and smartphone applications (middle), and take part in very
productive discussions (right).
Fig. 4 FishGIS App maps: the fish, catch trends (size and amount), illegal fishing vessels, and floating garages, and turbidity by HydroColor.

Appendix 7 PICES Press Articles
PICES Scientific Report No. 58 119
the applications found the icons very difficult to understand. Moreover, many community members were uncertain what kind of feedback they would be getting from the data they collect, and how such feedback would contribute to their daily life and well-being. However, overall, participants concluded that the training course was very worthwhile and
that the project will make a great contribution to coastal communities in Indonesia. Based on the results from the workshop, we will modify the software, and develop guidelines for using the applications. The PST will also act on the feedback we have received from the community. The next training workshop will be organized early 2019.
Dr. Shion Takemura ([email protected]) is Researcher in the Fisheries Policy Research Group at the National Research Institute of Fisheries Science, Fisheries Research and Education Agency of Japan. He specializes in fisheries, GIS, and citizen science and is involved in the FishGIS project in order to develop community-based monitoring system with local fishers. Within PICES, he is a member of the Human Dimensions Committee. Dr. Shigeharu Kogushi ([email protected]) is CEO of Greenfront Research Laboratory Co., Ltd. His research interests include landscape ecology, GIS, and citizen science. He is involved in the FishGIS project in order to develop FishGIS App. Dr. Mark Wells ([email protected]) is a Professor of Oceanography in the School of Marine Sciences, University of Maine. His fields and topics of research are marine biogeochemistry, trace metal chemistry, and biological oceanography with emphasis on harmful algal blooms. Within PICES, he is a member of the Section on Ecology of Harmful Algal Blooms in the North Pacific. Mark was involved in the previous (2012–2017) PICES–MAFF project on “Marine ecosystem health and human well-being (MarWeB)” and now co-chairs the FishGIS project with Dr. Mitsutaku Makino. Dr. Mitsutaku Makino ([email protected]) is Head of the Fisheries Policy Research Group at the National Research Institute of Fisheries Science, Fisheries Research and Education Agency of Japan. He specializes in fisheries and ecosystem-based management analysis. He teaches in several universities in Japan, and currently serves as an Editor of ICES Journal of Marine Science. His book entitled “Fisheries Management in Japan” was published in 2011 by Springer. Within PICES, he is Vice-Chair of the Human Dimensions Committee and a member of the FUTURE Scientific Steering Committee and Working Group on Ecosystem Reference Points across PICES Member Countries. He co-led, with Dr. Ian Perry, the previous (2012–2017) PICES–MAFF project on “Marine ecosystem health and human well-being (MarWeB)” and now co-chairs the FishGIS project with Dr. Mark Wells.
PICES Press Articles Appendix 7
120 PICES Scientific Report No. 58
The PICES–MAFF-sponsored Project on “Building capacity for coastal monitoring by local small-scale fishers” (FishGIS):
Incorporating community-based research principles
by Naoki Tojo, Takaaki Mori and Charles Trick Zora Neale Hurston, the famed author and anthropologist stated: “Research is formalized curiosity. It is poking and prying with a purpose” (Hurston, 1942). Most members of PICES–scientists, resource managers, national scientific decision-makers would probably agree with the statement, but most would have difficulty in defining the use of the word “purpose” in the quote. For most of us, “purpose” is the transformation of ideas into information, then to knowledge, and for many individuals in PICES, taking this knowledge and passing it along to decision makers. This pattern has served us well for decades. In this day and age, many of the pressing problems that face us are not this simple, and thus we cannot follow the general teachings of the generations before us (even when it has a very successful track record). As environmental issues are now claiming the health and wellness of society, we have a new master–the affected communities, and for many projects, we must alter our research strategies in ways that are not natural in our scientific progression. The “purpose” is not to serve managers and decision makers. The “purpose” is to serve communities–and by doing so, enlighten decision-makers with the one (or many) path(s) of action. Accepting the altered research “purpose” is not a simple transition and requires a very non-traditional approach. No two studies are alike. Many projects are reflective or narratives or case studies–not based on first principles. Each path starts with understanding “community-based participatory research” (CBPR). Several projects under the PICES umbrella are community-centric studies. Here, we discuss the PICES project on “Building capacity for coastal monitoring by local small-scale fishers” (FishGIS). The project is funded by the Ministry of Agriculture, Forestry and Fisheries (MAFF) of Japan, through the Fisheries Agency of Japan (JFA), from the Official Development Assistance (ODA) Fund. The official goal of FishGIS is “to enhance the capacity of local small-scale fishers to monitor coastal ecosystems and coastal fisheries in Pacific Rim developing countries”. To improve capacity, we have introduced several smart-phone driven technical surveillance apps/approaches that record water turbidity, fish catch, and water quality (plastics, for example). These technological approaches were provided to the communities along with training and opportunities to contribute to the assessment of changes in local fishing grounds over time. Details will be formalized soon as the project is entering the final phase of the three-year study. The word “study” here is a bit misleading as the goal is not
to gather data but to transform the communities into “sentries of their own economy” and it follows that their voice will now be heard when environmental concerns arrive. The power is based within the community, not with the scientists flying in to clarify the day. In the FishGIS project, three groups are full participants. They are the participating fishers and aquaculture farmers, the broader family-oriented community, and the community of government managers. We recognized, based on previous PICES-MAFF projects (e.g., MarWeB’s investigation into “sato umi” and “Improving aquaculture, marine ecosystems and human well-being: A social-ecological systems approach” in Indonesia and Guatemala); https://meetings.pices.int/projects/MarWeB) that strict ad-herence to the principles of CBPR was essential to achieve our goals (and to get ethical approval to work with communities to problem-solve environmental situations). For strong historical reasons, there are many “outlines” for what CBPR entails. One of the most comprehensive and accurate CBPR assessments is that of Viswanathan et al. (2004). CBRP is a strategy where scientists, researchers, or observers enter into a relationship with a community long before any work has been attempted or considered. The aim is to create a shared knowledge base on a problem, the approach, and the solutions long before attempts are made to “study” the problem. From our experience, the first question that will be shared is, “Is there a problem?” Sometimes researchers stake out defined “stakeholders” but we find this a flawed approach since stakeholders are often “egocentric” managers of problems (“What’s in it for them?”). Instead, we seek out relationship managers who have a broader perspective of the problem–solution–effects (“How will my life be better?”). Here are our FishGIS communities and their stories. In February of this year, several members of the FishGIS In February of this year, several members of the FishGIS Project Science Team (Mitsutaku Makino and Mark Wells, co-chairs; Shion Takemura, Joon-Soo Lee, Chang-an Xu, Naoki Tojo, Vera L. Trainer, and Charles Trick) were joined with two grad students, Takaaki Mori, one is the authors of this article and from Hokkaido University visited Indonesia to finalize the selection of additional case study sites, test the updated tools used in the 2018 workshop (see Takemura et al.’s article, page 16 in PICES Press, Vol. 27, No. 1), speak with the local communities to evaluate the

Appendix 7 PICES Press Articles
PICES Scientific Report No. 58 121
potential for a longer-term project vision, and to collect additional information about the local fisheries and socio-economic conditions. This was the third visit to Indonesia by the PICES Team for the FishGIS project. The Team went to Jakarta, then Pelabuhan Ratu, southwestern Java (Fig. 1) and two communities associated with economically vibrant fishing ports: Karangantu (of Banten) and Ratu (Fig. 2).
Fig. 1 PST and community members from the 3rd visit by the PICES
Team to Pelabuhan Ratu.
For each community, four phases were predefined to train stakeholders for undertaking sustainable smartphone monitoring in Indonesia:
1. Training of fishers (defined here as including both wild- and aquaculture-based fisheries) to use the smartphone-based GIS-system to obtain and document fish landings and locations;
2. Training of fishers in use of the supplied HydroColor smartphone application to monitor and estimate water quality characteristics (primarily the level of chlorophyll in the surface waters).
3. Training of prominent community members in sample collection and analysis of phytoplankton community structure (with emphasis on key taxa associated with toxin production).). Here they use individual inexpensive portable microscopes from Foldscope Instruments>. They also use their smartphones to document the taxa of interest for confirmation by experts;
4. Instructing the BPPT staff and scientists on calibrating the HydroColor application to enable automated determination of chlorophyll concentrations, and verification of data on suspended sediments and turbidity measurements.
Fig. 2 Locations of the port communities, Karangantu and Ratu, where the PICES Team visited February 3–8, 2019. (Maps are modified from Google
LLC, 2019).
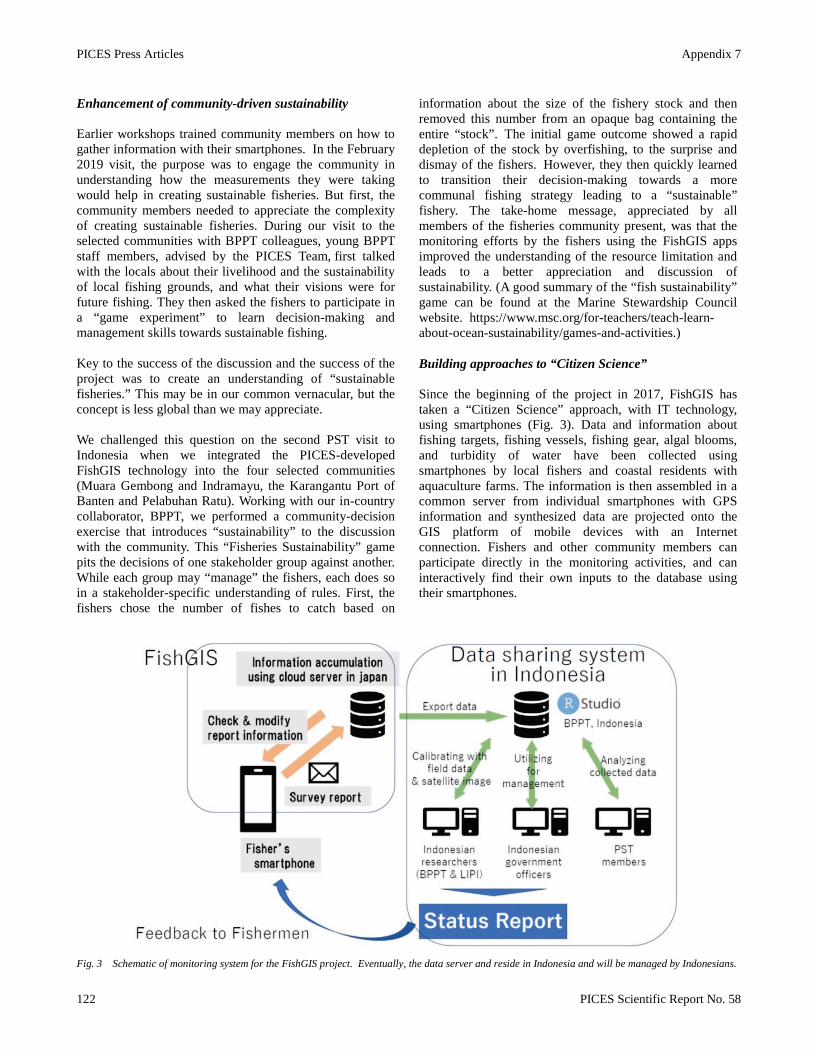
PICES Press Articles Appendix 7
122 PICES Scientific Report No. 58
Enhancement of community-driven sustainability Earlier workshops trained community members on how to gather information with their smartphones. In the February 2019 visit, the purpose was to engage the community in understanding how the measurements they were taking would help in creating sustainable fisheries. But first, the community members needed to appreciate the complexity of creating sustainable fisheries. During our visit to the selected communities with BPPT colleagues, young BPPT staff members, advised by the PICES Team, first talked with the locals about their livelihood and the sustainability of local fishing grounds, and what their visions were for future fishing. They then asked the fishers to participate in a “game experiment” to learn decision-making and management skills towards sustainable fishing. Key to the success of the discussion and the success of the project was to create an understanding of “sustainable fisheries.” This may be in our common vernacular, but the concept is less global than we may appreciate. We challenged this question on the second PST visit to Indonesia when we integrated the PICES-developed FishGIS technology into the four selected communities (Muara Gembong and Indramayu, the Karangantu Port of Banten and Pelabuhan Ratu). Working with our in-country collaborator, BPPT, we performed a community-decision exercise that introduces “sustainability” to the discussion with the community. This “Fisheries Sustainability” game pits the decisions of one stakeholder group against another. While each group may “manage” the fishers, each does so in a stakeholder-specific understanding of rules. First, the fishers chose the number of fishes to catch based on
information about the size of the fishery stock and then removed this number from an opaque bag containing the entire “stock”. The initial game outcome showed a rapid depletion of the stock by overfishing, to the surprise and dismay of the fishers. However, they then quickly learned to transition their decision-making towards a more communal fishing strategy leading to a “sustainable” fishery. The take-home message, appreciated by all members of the fisheries community present, was that the monitoring efforts by the fishers using the FishGIS apps improved the understanding of the resource limitation and leads to a better appreciation and discussion of sustainability. (A good summary of the “fish sustainability” game can be found at the Marine Stewardship Council website. https://www.msc.org/for-teachers/teach-learn-about-ocean-sustainability/games-and-activities.) Building approaches to “Citizen Science” Since the beginning of the project in 2017, FishGIS has taken a “Citizen Science” approach, with IT technology, using smartphones (Fig. 3). Data and information about fishing targets, fishing vessels, fishing gear, algal blooms, and turbidity of water have been collected using smartphones by local fishers and coastal residents with aquaculture farms. The information is then assembled in a common server from individual smartphones with GPS information and synthesized data are projected onto the GIS platform of mobile devices with an Internet connection. Fishers and other community members can participate directly in the monitoring activities, and can interactively find their own inputs to the database using their smartphones.
Fig. 3 Schematic of monitoring system for the FishGIS project. Eventually, the data server and reside in Indonesia and will be managed by Indonesians.

Appendix 7 PICES Press Articles
PICES Scientific Report No. 58 123
“Community participation” has two major connotations in this type of research-oriented project. First, the community participatory in sampling allows a cost-effective means to collect data. Many individuals can collect data simultaneously within the region. Second, the involvement of fishers and other community members in the project allows them to take responsibility for their activities (building project ownership and capacity improvement in the human dimension in the development). There were some scientific concerns about the data collected by locals having the other purposes of visiting and using the sites, for example, the spatial coverages of the sampled data. On the other hand, it is also essential to track the information in specific fishing grounds from an applied scientific perspective. Data qualities may not be where/what status surveyors belong but be the matter of the training and attitude of surveyors in both the researcher’s survey and citizen science monitoring activity. Spatial dynamics in the efforts and fishing grounds may also be necessary. More importantly, a citizen science approach may allow people who need or want to know the biological and ecological targets and associated issues to connect with others who are collecting the data. From the perspective of a developmental assistant, “ownership” in project activities and responsibilities in the monitoring are precious to solve problems and to participants attain the sustainable developmental goals. Extracting knowledge through conversation and sharing
Takaaki Mori, who assisted in the field work of the FishGIS project, recalled his surprise during the December 2018 mission to Pabean Ilir village in Indramaya. “Though we expected to document many types of fish, I was astonished that there were more than 25 species in the
catch each day.” The diversity of species in their catch was one of the improvements the locals noticed as they became adept in using the project tools (Fig. 4). Mori also noted that what fishes were targeted fishes depended on the location of the communities, and which fish we bi-catch or fish of opportunity. For the locals whose livelihoods depend on fishing are, the categorization of the fishing targets should be simple and distinguishable for their monitoring operation, but it also should be ecologically meaningful. With the assistance of locals and managers, PICES team has been improving the selectable fish category for reporting through smartphones. “It was also a surprise to see how enthusiastic the locals were for participatory monitoring. They were passionate. The changing surroundings, especially the hard rains in the rainy season that disturb their fishing activities with their small boats, and financial hardships in their reality motivated them to find what they could do for their sustainable livelihood. Having information has been very important for their knowledge.” The technology of the FishGIS apps is a work in progress. Many of the initial concerns of the members of the Pabean Ilir village (Fig. 5), dealt with the use and structure of the languages of the interface. The app interface was translated into Bahasa Indonesia, the national language, for local users (termed “IKAN GIS”). Oversimplified selection of fishes of the interface was confusing to the local fishes and the traditional names were replaced with regional, common titles. This was a significant change as the local users reported that they felt “ownership” of the data they collected because they now understood the relationship between “catch,” “abundance,” and “resource.” The semantic match is a critical step in the community's approach to sustainability.
Fig. 4 Diversity of species in the catch in Pabean Ilir village in a single day. More than 20 species were identified in the catch in every day.

PICES Press Articles Appendix 7
124 PICES Scientific Report No. 58
Fig.5 Pabean Ilir village. Maps are modified from Google LLC (2019).
Fig. 6 Snapshots from the technical workshops with locals in Pabean Ilir village. These workshops were held in both the field and in common meeting
places for locals with voluntarily participated residents
Workshops were held in the village on December 11 and 13 (Fig. 6). For example, uses of the project tools such as the FishGIS interface, HydroColor application and portable microscopes were reviewed with villagers in the meetings and field trainings. Site visits, observations of target species and fishing activities and field experiments from socio-economic perspective were made in the intervals of the technical workshops. Locals that participated in these workshops, expressed the following feelings: “We hope to see the future with what we have learned in both some years later and generations later, with the project tools.” “We also hope that improvements are made in the tools and systems by experts, continuously! …work hard!”
Not only information from the villages but also the comments of villagers have been collected and discussed in the PICES team after the visits and have been reflected to the technical improvement of the project and dissemination activities. Working with reality and wills toward futures After the first two years of interactions the PST recognized that the community members are discussing “sustainability” more than just fishing. As “sustainability” is a complex concept the local community members are having a difficulty maintain an appreciation of the long-term in On the other hand, the team also began to understand the difficulty faced by the locals; such as limited available technologies (e.g., types of smartphone) and limited resources (capital, time) to invest in monitoring activities. According to locals, changes in the environment,

Appendix 7 PICES Press Articles
PICES Scientific Report No. 58 125
especially the changes in rain regimes and pollution are inhibiting their fishing activities and livelihoods in recent years. Over the next year, the FishGIS project faces the new phase–handing over the management to the local BPPT fisheries managers, ensuring quality control of the data, and supporting community access to the data and fish inventory information.
References Hurston, Z.N. 1942. Dust Tracks on a Road: An
Autobiography. Hutchinson & Co., London. Viswanathan, M., Ammerman, A., Eng, E., Garlehner, G.,
Lohr, K.N., Griffith, D., Rhodes, S., Samuel-Hodge, C., Maty, S., Lux, L., Webb, L., Sutton, S.F., Swinson, T., Jackman, A. and Whitener, L. 2004. Community-based participatory research: Assessing the evidence: Summary. In: AHRQ Evidence Report Summaries. Rockville, MD, Agency for Healthcare Research and Quality (US); 1998-2005. 99 pp.
Dr. Naoki Tojo ([email protected]) is Assistant Professor of the Faculty of Fisheries Sciences, Hokkaido University (FFS/HU), Japan. He is also a member of the International Education Office (IEO) of the FFS/HU and travels around the world to develop and lead educational programs, especially in southeastern Asia and northern Africa. He specializes in developmental fisheries sciences, community development with biological conversations and international developmental assistance. He has participated nationally/internationally and advised several research and developmental projects with his technical background in GIS, remote sensing and spatio-temporal analyses. Within PICES, he is a member of the Fishery Science Committee (FIS). Mr. Takaaki Mori ([email protected]) is a graduate student (M.S. candidate) in the Graduate School of Fisheries Sciences, Hokkaido University of Japan. He studies developmental fisheries, especially in the area of coastal community development and is involved in the FishGIS project as a student assistant. Dr. Charles Trick ([email protected]) is a Distinguished Research Professor for Ecosystem Health at Western University, London, Canada, a position that emphasizes the merging of science, health/medicine, social and psychological aspects of environmental programs. In PICES, he is a member of the Section on Ecology of Harmful Algal Blooms in the North Pacific and a member of the Project Science Team in FishGIS.

PICES PRESSNORTH PACIFIC MARINE SCIENCE ORGANIZATION Vol. 29, No. 1 | Winter 2021
IntroductionMany coastal communities depend on fisheries as their primary source of food and livelihood, so coastal environmental degradation and ecosystem changes have had substantial adverse effects on their well-being over the past decades. One of the crucial tasks for marine researchers is to scientifically assist coastal communities in adapting to ecological and social changes in ways that maintain or enhance their sustainable livelihoods and well-being. This perspective was the motivation for PICES (North Pacific Marine Science Organization) to accept a request to undertake a project entitled “Building capacity for coastal monitoring by local small-scale fishers” (acronym: FishGIS). The project was funded by the Ministry of Agriculture, Forestry and Fisheries (MAFF) of Japan, through the Fisheries Agency of Japan (JFA), from the Official Development Assistance (ODA) Fund, and ran from November 2017 to March 2020.
The overall goal of the FishGIS project was to enhance the capacity of local small-scale fishers and aquaculture farmers to monitor coastal ecosystems and coastal fisheries in Pacific Rim developing countries. The project focused on developing smartphone-based technology and evaluating and implementing its use for citizen-science observations and reporting by local community members on aspects of environmental quality and fisheries status in coastal waters. Towards this end, PICES began working with Indonesian government scientists and representatives, and in close collaboration with four local coastal communities (Figure 1), using the Transdisciplinary Research Concept of Future Earth (Makino and Wells, PICES Press Vol. 26, No. 2, pp. 20–24).
The guiding questions for the project were:
• How may enhanced capacity for monitoring activities by local fishers help to improve fisheries management in coastal areas? And can this monitoring become sustainable?
• How do global changes in climate and economy affect coastal ecosystems?
This article summarizes the 3-year activities of the project and considers the path forward. The full scientific report, which covers the project background, organization, meetings and events, products, and the membership of the Project Science Team (PST), can be found on the project webpage (https://meetings.pices.int/projects/FishGIS).
Figure 1. Coastal communities (yellow pins) participating in the FishGIS project: Muara Gembong (Sub-District), Pabean Ilir (Indramayu District), Pelabuhan Ratu (Sukabumi District) of West Java Province, and Karangantu (Serang District) of Banten Province.
Technologies developed in the project
Several workshops were organized to seek support and input from local communities and to involve community members in the co-design of the project framework and objectives. Through this collaboration, the local issues essential for their well-being were identified, and plans were outlined for what monitoring could be done by developing smartphone-based technologies. The keystone parameters selected for monitoring are summarized in Figure 2 and included: (1) water quality, (2) toxic phytoplankton (i.e., red-tides or harmful algal blooms (HABs)), (3) fish catch, (4) localized Illegal Unregulated and Unreported (IUU) fishing, and (5) floating garbage (plastics).
Smartphone -based tools to enhance fishery sustainability for coastal
communities in developing nations: The PICES–Japan MAFF FishGIS project Mitsutaku Makino, Mark Wells, Shion Takemura, Shigeharu Kogushi, Naoki Tojo, Charles Trick,
Suhendar I Sachoemar, Vladimir Kulik, Chang-an Xu and Joon-Soo Lee
Figure 2. Parameters identified during local community training and implementation workshops, each to be monitored using smartphone-based tools.
PICES Press Articles Appendix 7
126 PICES Scientific Report No. 58

PICES PRESS NORTH PACIFIC MARINE SCIENCE ORGANIZATIONVol. 29, No. 1 | Winter 2021
With the scientific support of PICES researchers, the project developed and implemented smartphone-based tools (applications, sampling methods, and reporting protocols) that enabled local fishers and community members to collect and electronically share fisheries and environmental data with relevant Indonesian government authorities and university researchers. Takemura et al. reported the basic structure of these tools in the winter 2019 issue of PICES Press (Vol. 27, No. 1, pp. 16–18).
The FishGIS application development was a genuinely transdisciplinary effort in which scientists, local community members, and local government officials participated in the mutual learning and technology adoption process. An example of the development process, repeated in each community, is depicted in Figure 3, where researchers created and presented an early prototype version of the application that was further modified and improved based on interactions across multiple trainings and trials with the local people. Among the several changes incorporated to the application were broadening the fish categories, enhancing their descriptions, and integrating local fish names. Examples of observation reports prepared using the FishGIS application based on data submitted by the local people are illustrated in Figure 4.
Figure 3. The transdisciplinary research process for developing the FishGIS application.
Figure 4. Examples of observation reports prepared using the FishGIS application based on the data collected by fishers and aquaculture farmers in Indramayu (upper panel) and based on turbidity level measurements in the Banten and West Java Provinces (lower panel).
Appendix 7 PICES Press Articles
PICES Scientific Report No. 58 127
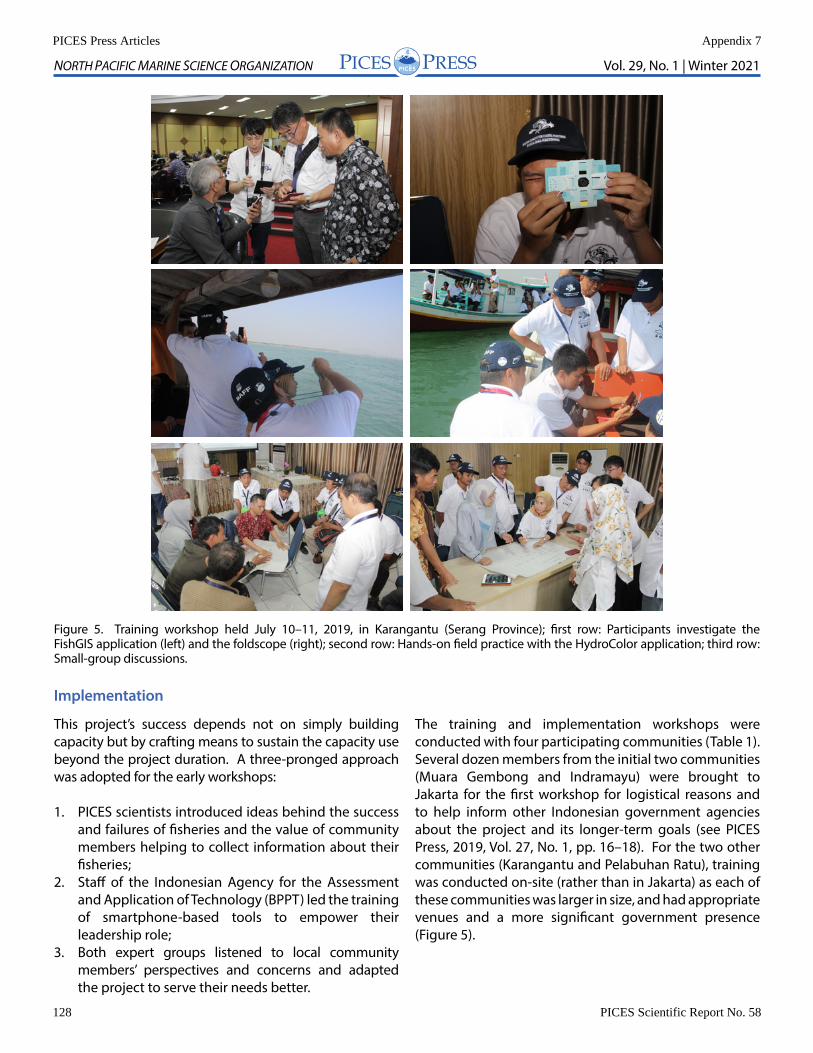
PICES PRESSNORTH PACIFIC MARINE SCIENCE ORGANIZATION Vol. 29, No. 1 | Winter 2021
This project’s success depends not on simply building capacity but by crafting means to sustain the capacity use beyond the project duration. A three-pronged approach was adopted for the early workshops:
1. PICES scientists introduced ideas behind the success and failures of fisheries and the value of community members helping to collect information about their fisheries;
2. Staff of the Indonesian Agency for the Assessment and Application of Technology (BPPT) led the training of smartphone-based tools to empower their leadership role;
3. Both expert groups listened to local community members’ perspectives and concerns and adapted the project to serve their needs better.
The training and implementation workshops were conducted with four participating communities (Table 1). Several dozen members from the initial two communities (Muara Gembong and Indramayu) were brought to Jakarta for the first workshop for logistical reasons and to help inform other Indonesian government agencies about the project and its longer-term goals (see PICES Press, 2019, Vol. 27, No. 1, pp. 16–18). For the two other communities (Karangantu and Pelabuhan Ratu), training was conducted on-site (rather than in Jakarta) as each of these communities was larger in size, and had appropriate venues and a more significant government presence (Figure 5).
Figure 5. Training workshop held July 10–11, 2019, in Karangantu (Serang Province); first row: Participants investigate the FishGIS application (left) and the foldscope (right); second row: Hands-on field practice with the HydroColor application; third row: Small-group discussions.
Implementation
PICES Press Articles Appendix 7
128 PICES Scientific Report No. 58

PICES PRESS NORTH PACIFIC MARINE SCIENCE ORGANIZATIONVol. 29, No. 1 | Winter 2021
Table 1 FishGIS training and implementation workshops and trial surveys in Indonesia.
Dates Venue Type of activity Target communitiesJuly 10–12, 2018 Jakarta workshop Muara Gembong, IndramayuDecember 11–13, 2018 Pabean Ilir/Indramayu trial survey Pabean IlirFebruary 4, 2019 Karangantu/Serang workshop SerangFebruary 6–7, 2019 Pelabuhan Ratu workshop Pelabuhan RatuJuly 10–11, 2019 Karangantu/Serang workshop Muara Gembong, Indramayu, Serang, Pelabuhan RatuDecember 15–17, 2019 Pabean Ilir/Indramayu trial survey Pabean IlirFebruary 25, 2020 Karangantu/Serang workshop SerangFebruary 27, 2020 Pelabuhan Ratu workshop Pelabuhan Ratu
Figure 6. The operation manual in Indonesian Bahasa language and scenes from presentations on the use of the IKAN-GIS application by BPPT researchers at the training workshops.
The FishGIS application and the water quality application HydroColor, both designed initially using an English language interface, were converted with the help of BPPT staff to Indonesian Bahasa versions (IKAN-GIS) for use in the local communities. With guidance from PICES experts, BPPT researchers led the training workshops for community members on how to use IKAN-GIS applications (Figure 6). The training materials covered how to install the applications onto the smartphones, the structure and operation of the applications, and provided data collection examples.
The “large-scale” training workshops were interspersed with “trial surveys” – smaller-scale independent visits by a Hokkaido University (HU) team led by Dr. Naoki Tojo to Pabean Ilir, a coastal village of about 500 people in the Indramayu District in December 2018 and 2019. These visits included in-depth on-site practical training with the project observation tools, small-group interviews with community members, and a “Fisheries Sustainability” game mini-workshop developed by the HU team (Figure 7). The trial surveys enabled closer exchanges between the locals and trainers, helped participants more clearly recognize the need to monitor coastal environment and fisheries resources and landings, explained how this monitoring could contribute to the sustainability and well-being of their community lives, and improved their understanding of the project tools. This approach also allowed the PST to better evaluate and refine the design and use of the FishGIS application. For example, from the interviews the HU team learned about a very high species diversity of the local catch composition (more than 20 species could be found in daily catches in the landing site, according to an HU student Mr. Takaaki Mori). Therefore, the categories and names of the fish in the FishGIS application were modified to improve the information return and ease of use by the local fishermen. In addition, these visits provided an opportunity to collect information on local fisheries, target species, and livelihood of local fishers and fish farmers for socio-economic research.
Appendix 7 PICES Press Articles
PICES Scientific Report No.58 129

PICES PRESSNORTH PACIFIC MARINE SCIENCE ORGANIZATION Vol. 29, No. 1 | Winter 2021
Evaluation of the implementation activities in four communities showed both accomplishment and remaining challenges. Project implementation went very well in some communities in terms of relevancy, effectiveness, efficiency, and impact. Other communities showed less sustained success, due in part to logistical challenges surrounding workshop execution. The lessons learned here have led to ideas for alternative communication strategies for future projects in the region.
Conclusions and next stepsThe foundations of the FishGIS project successes can be attributed to three primary factors:
1. The wide breadth of expertise in the PST/Indonesian cooperation spanned fisheries science, environmental science, human dimension studies, smartphone technologies, and previous extensive experience in international development and cooperation studies;
2. The productive collaborative relationship between PST members and Indonesian BPPT scientists developed during earlier PICES/MAFF projects in the region;
3. Strong official support and endorsement by the Indonesian national governments, which importantly provided a legitimacy to the project for local governments, stimulated participation by the local communities, and resulted in a commitment to establishing data storage at the Indonesia National Ocean Data Center.
While these logistical and organizational underpinnings reinforced the project, the more critical aspect was close communication and consultation with local community members. A number of training and implementation workshops and trial surveys were conducted at each case study site to discuss and define the most critical issues to be addressed and follow up with the community assessments. This approach differs from many citizen-science projects where scientists alone decide on the monitoring parameters and systems. In our case, PICES researchers, Indonesian government scientists and representatives, and local community members were “at the same table”, bringing the scientific perspective to the community, and gaining the community input and perspective on this science. This collaborative approach enabled the local communities to develop a strong sense of “ownership” of the technology, in some cases teaching about it, with pride, to other communities. The training workshops also provided the local fishers a scientific point of view on coastal fisheries, adding a new perspective to their knowledge of their waters. Local students and teachers were included in some training workshops to help foster these data collection programs’ sustainability.
Figure 7. Training activities during trial surveys in Pabean Ilir village (Indramayu District) (Top to bottom): On-site practical training, setting out by boat to collect fisheries data, small-group interviews, and playing a “Fisheries Sustainability” game.
PICES Press Articles Appendix 7
130 PICES Scientific Report No. 58

PICES PRESS NORTH PACIFIC MARINE SCIENCE ORGANIZATIONVol. 29, No. 1 | Winter 2021
Although effective answers to the two broad guiding questions of the FishGIS project could never be achieved within the 3-year term of the project, they focused attention onto developing the tools needed to address these questions, and on the training and community interactions to foster the data collections required to give insight. Moreover, considerable detailed understanding of longer-term changes in these coastal ecosystems (such as the changes in fisheries species, seasonal durations, and patterns of precipitation) was obtained through joint meetings and small-group interviews with local fishers and community members. This information was of value to both local and national government scientists. The enhanced capacity by local fishers and community members to observe and monitor basic water quality and plankton productivity, HAB incidences, fish catch trends, occurrence of IUU fishing, and plastic debris in marine waters provides an essential base for improving local decision making for more sustainable fisheries. Similarly, the local government officers now will have access to data regarding their policy effectiveness and a useful information tool to interconnect with communities more closely.
A new 3-year PICES–MAFF project on “Building local warning networks for the detection and human dimension of Ciguatera Fish Poisoning in Indonesian communities”, beginning in April 2020, will expand the FishGIS project to include new tools and improvements based on a community need for prophylactic understanding on benthic-borne fish toxins (https://meetings.pices.int/projects/Ciguatera). In this project, more efforts will be devoted to evolving data reporting features to provide better feedback to the community. We also need to pay more attention to the daily lives of local community people. In many cases, these communities exist mainly at only marginal subsistence levels, so the practicalities of time and resources are challenging. In Indonesia, like in many other developing countries, there are “extension officers” who specialize in fishing techniques and livelihood improvements, and are responsible for disseminating this information to local communities. Engaging these local extension officers will be an important strategy. In the longer term, this collective collaboration between government and local communities could foster the co-creation of new knowledge to scientifically envision the future of coastal ecosystems and livelihoods in Indonesia.
Participants of the second PST meeting held November 2, 2018, in Yokohama, Japan (left to right): Takaaki Mori (HU student, Japan), Naoki Tojo (Japan), Mark Wells (USA, PST Co-Chair), Chang-an Xu (China), Shion Takemura (Japan), Suhendar I Sachoemar (BPPT, Indonesia), Alexander Bychkov (PICES), Ayumi Kanaya (HU student, Japan), Mitsutaku Makino (Japan, PST Co-Chair), Charles Trick (Canada), Shigeharu Kogushi (GFL, Japan) and Vladimir Kulik (Russia); missing from photo: Joon-Soo Lee (Korea).
This article is prepared by the FishGIS Project Science Team, a group of scientists responsible for the detailed planning and execution of the project.
Appendix 7 PICES Press Articles
PICES Scientific Report No. 58 131


![No, 58] PERTH : FRIDAY, 19th JUNE [1970](https://static.fdokumen.com/doc/165x107/6328b636cedd78c2b50e3033/no-58-perth-friday-19th-june-1970.jpg)

