The effect of aging on the fracture characteristics and ductility of self-compacting concrete
12
The effect of aging on the fracture characteristics and ductility of self-compacting concrete Morteza H.A. Beygi a,1 , Mohammad T. Kazemi b,2 , Iman M. Nikbin a,⇑ , Javad Vaseghi Amiri a,1 a Department of Civil Engineering, Babol University of Technology, Iran b Department of Civil Engineering, Sharif University of Technology, P.O. Box 11155-9313, Iran article info Article history: Received 7 August 2013 Accepted 24 October 2013 Available online 6 November 2013 Keywords: Fracture behavior Self-compacting concrete Toughness Brittle fracture abstract Good knowledge of fracture parameters and cracking behavior of self-compacting concrete (SCC) from early ages until the SCC becomes mature plays an important role in design of SCC structure and also in evaluation of durability and consequently prevention of damage. In this paper, variation of fracture parameters and corresponding ductility behavior of SCC at different ages (e.g. 3 days, 7 days, 28 days and 90 days) for SCC mixes with w/c ratios of 0.45 and 0.65 have been experimentally studied. To do so, three-point bending tests were carried out on 120 notched beams. Then, size effect method (SEM) and work of fracture method (WFM) were applied to interpret the results. The results of analyses indi- cated that as the concrete is aging from 3 days to 90 days: (a) fracture energies from SEM (G f ) and WFM (G F ) are increased: (b) effective size of the process zone (C f ) in SEM and characteristic length (L ch ) in WFM are considerably decreased indicating increase of concrete brittleness: (c) fracture surface of concrete passing through the aggregate is increased which is attributed to strength improvement of hardened cement paste and aggregate–paste transition zone: (d) fracture toughness is significantly increased: (e) brittleness number is almost doubled. Also, the ratio of G F /G f , which is applied for calibra- tion of numerical models of cracking at different ages, is equal to 2.70. Ó 2013 Elsevier Ltd. All rights reserved. 1. Introduction Self-compacting concrete (SCC) as a milestone was first devel- oped in japan in the late 1980s in order to achieve durable concrete in building industry [1]. SCC is able to flow and compact under its own weight, without the use of mechanical vibrations or outer im- pact in any place of the formwork [2]. SCC offers several benefits such as better working environment, excellent surface finish, high workability and improved durability and permeability [3,4]. Fur- thermore, there are sufficient examples of economic benefits in application of SCC in excess of the normal vibrated concrete (NVC) [5]. Therefore, use of SCC all over the world in both the pre- cast industry and ready-mix markets has considerably increased. In the past few years, a number of experimental works have been conducted in order to understand mechanical properties of SCC [6,7]. Despite many recent studies on mechanical properties of SCC, very few investigations are available concerning the fracture mechanical behavior of SCC. Fracture mechanic as a revolution in concrete design is an extremely important aspect to be considered for the design and analysis of the structural response of concrete element especially for massive structures [8]. In the literature, many investigations have been carried out on the fracture behavior of NVC taking into account main aspects such as water to cement ratio, aging, aggregate volume and size [9]. On the other hand, pre- diction of fracture behavior and cracking of structures with aging is an obvious research interest in structure engineering [10,11]. This interest is undoubtedly due partly to the importance of the design and construction of the concrete structures especially massive structures such as dams, foundations, nuclear containment struc- tures and tunnels specially at early age and partly to for the eval- uation of durability and serviceability of these structures. Thus, a good understanding of the fracture parameters at early ages plays a paramount role in the determination of risk of cracking in SCC structures. Consequently, deterioration in structural integrity and high costs and time spent on repair or renovation are reduced. Researchers [12] generally agree that one of the factors that influ- ences the fracture properties of concrete is attributed to the inter- facial transition zone (ITZ) where the greatest number of microcracks form and thus is the most sensitive zone within the structure of concrete. Earlier investigations showed that there are many parameters affecting porosity of the ITZ such as mix compo- sition [12]. Since there are principal differences in mix composi- tions of SCC and NVC (e.g. higher amount of fine particles and paste volume and also lake of external vibration in SCC), the 0261-3069/$ - see front matter Ó 2013 Elsevier Ltd. All rights reserved. http://dx.doi.org/10.1016/j.matdes.2013.10.066 ⇑ Corresponding author. Tel.: +98 (112) 5280914. E-mail addresses: [email protected] (M.H.A. Beygi), [email protected] (M.T. Kazemi), [email protected] (I.M. Nikbin), [email protected] (J. Vaseghi Amiri). 1 Tel.: +98 (112) 5280914. 2 Tel.: +98 (21) 6616 4237. Materials and Design 55 (2014) 937–948 Contents lists available at ScienceDirect Materials and Design journal homepage: www.elsevier.com/locate/matdes
Transcript of The effect of aging on the fracture characteristics and ductility of self-compacting concrete

Materials and Design 55 (2014) 937–948
Contents lists available at ScienceDirect
Materials and Design
journal homepage: www.elsevier .com/locate /matdes
The effect of aging on the fracture characteristics and ductilityof self-compacting concrete
0261-3069/$ - see front matter � 2013 Elsevier Ltd. All rights reserved.http://dx.doi.org/10.1016/j.matdes.2013.10.066
⇑ Corresponding author. Tel.: +98 (112) 5280914.E-mail addresses: [email protected] (M.H.A. Beygi), [email protected]
(M.T. Kazemi), [email protected] (I.M. Nikbin), [email protected] (J. Vaseghi Amiri).1 Tel.: +98 (112) 5280914.2 Tel.: +98 (21) 6616 4237.
Morteza H.A. Beygi a,1, Mohammad T. Kazemi b,2, Iman M. Nikbin a,⇑, Javad Vaseghi Amiri a,1
a Department of Civil Engineering, Babol University of Technology, Iranb Department of Civil Engineering, Sharif University of Technology, P.O. Box 11155-9313, Iran
a r t i c l e i n f o a b s t r a c t
Article history:Received 7 August 2013Accepted 24 October 2013Available online 6 November 2013
Keywords:Fracture behaviorSelf-compacting concreteToughnessBrittle fracture
Good knowledge of fracture parameters and cracking behavior of self-compacting concrete (SCC) fromearly ages until the SCC becomes mature plays an important role in design of SCC structure and also inevaluation of durability and consequently prevention of damage. In this paper, variation of fractureparameters and corresponding ductility behavior of SCC at different ages (e.g. 3 days, 7 days, 28 daysand 90 days) for SCC mixes with w/c ratios of 0.45 and 0.65 have been experimentally studied. To doso, three-point bending tests were carried out on 120 notched beams. Then, size effect method (SEM)and work of fracture method (WFM) were applied to interpret the results. The results of analyses indi-cated that as the concrete is aging from 3 days to 90 days: (a) fracture energies from SEM (Gf) andWFM (GF) are increased: (b) effective size of the process zone (Cf) in SEM and characteristic length(Lch) in WFM are considerably decreased indicating increase of concrete brittleness: (c) fracture surfaceof concrete passing through the aggregate is increased which is attributed to strength improvement ofhardened cement paste and aggregate–paste transition zone: (d) fracture toughness is significantlyincreased: (e) brittleness number is almost doubled. Also, the ratio of GF/Gf, which is applied for calibra-tion of numerical models of cracking at different ages, is equal to 2.70.
� 2013 Elsevier Ltd. All rights reserved.
1. Introduction
Self-compacting concrete (SCC) as a milestone was first devel-oped in japan in the late 1980s in order to achieve durable concretein building industry [1]. SCC is able to flow and compact under itsown weight, without the use of mechanical vibrations or outer im-pact in any place of the formwork [2]. SCC offers several benefitssuch as better working environment, excellent surface finish, highworkability and improved durability and permeability [3,4]. Fur-thermore, there are sufficient examples of economic benefits inapplication of SCC in excess of the normal vibrated concrete(NVC) [5]. Therefore, use of SCC all over the world in both the pre-cast industry and ready-mix markets has considerably increased.In the past few years, a number of experimental works have beenconducted in order to understand mechanical properties of SCC[6,7]. Despite many recent studies on mechanical properties ofSCC, very few investigations are available concerning the fracturemechanical behavior of SCC. Fracture mechanic as a revolution inconcrete design is an extremely important aspect to be considered
for the design and analysis of the structural response of concreteelement especially for massive structures [8]. In the literature,many investigations have been carried out on the fracture behaviorof NVC taking into account main aspects such as water to cementratio, aging, aggregate volume and size [9]. On the other hand, pre-diction of fracture behavior and cracking of structures with aging isan obvious research interest in structure engineering [10,11]. Thisinterest is undoubtedly due partly to the importance of the designand construction of the concrete structures especially massivestructures such as dams, foundations, nuclear containment struc-tures and tunnels specially at early age and partly to for the eval-uation of durability and serviceability of these structures. Thus, agood understanding of the fracture parameters at early ages playsa paramount role in the determination of risk of cracking in SCCstructures. Consequently, deterioration in structural integrity andhigh costs and time spent on repair or renovation are reduced.Researchers [12] generally agree that one of the factors that influ-ences the fracture properties of concrete is attributed to the inter-facial transition zone (ITZ) where the greatest number ofmicrocracks form and thus is the most sensitive zone within thestructure of concrete. Earlier investigations showed that there aremany parameters affecting porosity of the ITZ such as mix compo-sition [12]. Since there are principal differences in mix composi-tions of SCC and NVC (e.g. higher amount of fine particles andpaste volume and also lake of external vibration in SCC), the
Nomenclature
A slope of linear regression equation (mm�1 MPa�2)a0 initial notch depth (mm)b beam width (mm)C intercept of linear regression equation (MPa�2)Cf effective size of the process zone (mm)Cf28 effective size of the process zone at the age of 28 days
(mm)d beam height (mm)dmax maximum aggregate size (mm)E Young’s modulus (GPa)fc compressive strength (Mpa)ft tensile strength (MPa)gða0Þ dimensionless energy release rateg0ða0Þ derivative of gða0Þ at the relative initial crack lengthGF total fracture energy (N/m)GF28 total fracture energy at the age of 28 days (N/m)Gf initial fracture energy (N/m)Gf28 initial fracture energy at the age of 28 days (N/m)g acceleration due to gravity (m/s2)KIC fracture toughness (MPa mm0.5)
KIC28 fracture toughness at the age of 28 days (MPa mm0.5)Lch characteristic length (mm)Lch28 characteristic length at the age of 28 days (mm)Ln length of specimen (mm)mn mass of the specimens (kg)m relative width of scatter bandn number of tests conductedPu peak load (N)P0
n corrected peck load (N)Pn peak load measured by test equipment (N)Sn span of specimen (mm)t age (in days)WF area under load displacement curve (mm2)wA coefficient of variation of the slope of the regression linewC coefficient of variation of the intercept of the regression
linern nominal failure stress (MPa)b brittleness numberdc critical effective crack opening displacement (mm)
938 M.H.A. Beygi et al. / Materials and Design 55 (2014) 937–948
porosity of ITZ is probably different for SCC from NVC [13]. This isleading to a different tendency to microcracking, especially at earlyage and consequently a different fracture behavior in SCC. Roziereet al. [14] indicated that higher early age cracking potential occursin SCC than NVC. This behavior is attributed to higher paste volumeand low water in SCC mixture. Also, according to previous experi-mental studies, it has been reported that presence of mineral addi-tions besides the effect of paste volume can have a significant rolein concrete cracking [15]. Previous studies have shown that the useof a large quantity of mineral admixture such as limestone powderwith different fineness in SCC mixes leads to higher autogenousshrinkage especially at early ages compared to NVC and enhancescracking tendency [16]. On the other hand, due to presence of lime-stone powder, hydration process is accelerated and as a result, theheat of hydration increases and because of thermal stress, early agecracking potential of SCC increases [17]. Additionally, Zhu and Bar-tos [18] found that because of water retention of limestone powderin SCC, some of the mechanical properties such as the strengthdevelopment rate are higher than NVC. In the literature, manyresearchers obtained the early-age development of the fractureparameters for NVC [19]. Petersson [10], concluded varying agesof 2, 7, 28 and 91 days respectively have higher fracture energy,while the characteristic length decreases with age. The same ten-dency has been reported with age by Brameshuber and Hilsdorf[20] from 4 h until 28 days with water to cement ratio of 0.54.Lee and Kim [21] conducted a systematic testing at early agesand showed that the critical crack tip opening displacement de-creases with NVC ages in the period of 1–28 days while, the criticalstress intensity factor and fracture energy increase with age. Witt-mann et al. [22] studied the fracture mechanical behavior of NVCby taking into account water–cement ratio and age effects. Theage of tests was varied from 2 to 28 days with different water–cement ratios in the range of 0.40–0.65. Again, the results of thisinvestigation confirmed earlier researches. Gettu et al. [19] usingthe size effect and cohesive crack models concluded that aging ofhigh strength concrete from 4 to 232 days decreases the fractureresistance and the effective fracture process zone length whileincreasing brittleness of concrete. Zollinger et al. [23] reported thatthe failure of NVC at 12 h was characteristically more brittle thanthat of NVC at 28 days, while it is contrary to that reported by Berraand Castellani [24]. Hariri [25] investigated the influence of age on
fracture properties and the width of the fracture process zone inNVC with water to cement ratios of 0.29–0.55. It was found thatfracture energy increases with age while characteristic lengthbased on cohesive crack model decreases. Alexander [26] indicatedthat due to aging, the fracture energy of the cement pasteremarkably drops while its brittleness increases. Schutter andTaerwe [11], stated that at early ages there is a remarkable link be-tween the fracture parameters and the degree of hydration. Theirinvestigation indicated that the softening behavior of early ageconcrete is unavoidably dependent upon the degree of hydration.Nevertheless, in spite of an increasing amount of experimentalresearch on the effect of aging on fracture behavior of NVC, thereis rare information that focused on fracture behavior of SCC withaging.
The main objective of the present research is to experimentallyexamine the effect of aging on the fracture parameters of SCC con-sidering two different strength levels and ages between 3 days and90 days. The three point bending test set up is conducted on 120notched specimens by means of closed-loop servo-controlled test-ing system. The SCC fracture parameters are studied based on theconcepts of the effective elastic crack model and the cohesive crackmodel using two main methods, the work-of-fracture method(WFM) and the size effect method (SEM), according to RILEM rec-ommendations [27,28]. For all ages, the fracture parameters aredetermined by the two methods, to provide input information forcalibration of numerical fracture simulations in finite elementdeformation analysis of SCC structures at different ages.
2. Determination of fracture parameters
In order to determine experimental fracture parameters of con-crete, different methods have been proposed by researchers [8].However, two methods are more common and recommended byRILEM standards [27,28]. These methods involve three-point bend-ing tests on notched beams. In the first method, introduced by RI-LEM 50-FMC [27], which is very common, the main fractureparameters of concrete are determined according to work-of-frac-ture method. The basis of this method is based on cohesive crackmodel and since Hillerborg et al. [29] originally established thismethod for concrete, this is known as Hillerborg method. In this
M.H.A. Beygi et al. / Materials and Design 55 (2014) 937–948 939
method, fracture energy is calculated as the energy required to cre-ate a crack with unit surface area. Accordingly, fracture energy isdefined as total energy consumed by the whole crack surface areaand is determined dividing the total area under load–displacementcurve for a notched beam in a stable test under three-point bend-ing by the surface area of fracture concrete as shown in the follow-ing equation.
GF ¼WF
bðd� a0Þð1Þ
where WF is the total fracture energy consumed corresponding tothe area under load displacement curve, b is the beam width, d isthe beam height and a0 is the initial notch depth. From the view-point of some researchers, the fracture energy obtained in thismethod is doubted, because it heavily depends on the shape andsize of the specimen and has high extent of scattering [8]. Malvarand Warren [30] concluded that the fracture energy increases withincrease of size of specimen. However, some researchers argue thatthe fracture energy is not size-dependent and the results are notreliable due to lack of accuracy in measurement of displacement[31]. According to Elices et al. [31] the main reason for scatteringin the results is related to energy absorption sources outside thefracture zone and the weight of the specimen. Most researchershave reported that the weight of specimen has significant effecton the fracture energy [8]. A common method to eliminate the ef-fect of specimen weight, which is the main reason of size-depend-ing of fracture energy is weight compensation method proposedby Elices et al. [31]. This method has been used in this study. In thismethod, the fracture energy GF alone cannot be used to describebrittleness of the concrete. In order to describe brittleness of con-crete, Hillerborg et al. [29] introduced the characteristic length,Lch, as follows:
Lch ¼ EGF=f 2t ð2Þ
where E is Young’s modulus, GF is the total fracture energy and ft isthe tensile strength. Smaller values of Lch represents higher brittle-ness and lower strength against cracking of concrete.
Researchers proposed several methods as standard recommen-dation to determine fracture energy in 1990 [32]. Since size-depen-dency of the fracture parameters is one of the concerns ofresearchers, they introduced other methods to determine fractureparameters. In 1990, Bazant and Pfeiffer [32] and Bazant and Kaz-emi [33] introduced a method based on size effect law in which theobtained fracture energy is size-independent. This method isknown as the size effect method (SEM) and is able to complementWFM. According to this method, which is recommended by RILEMTC89-FMC [28], the fracture energy is determined by means ofpeak loads of geometrically similar specimens of different sizes.In SEM, extrapolating peak loads of the specimens to a specimenof infinite size fracture energy is obtained which is independentof size, type and shape of the specimen. Bazant and Pfeiffer [32]proposed the following general nonlinear relation based on size ef-fect law in which the nominal failure stress is dependent on thespecimen size.
rN ¼Bffiffiffiffiffiffiffiffiffiffiffiffi
1þ bp ;b ¼ d
d0ð3Þ
where B and d0 are empirical coefficients and depend on the geom-etry of the structure and properties of the materials and b is thebrittleness number proposed by Bazant and Kazemi [33] whichdetermine the failure mode of structure (whether the failure modeis brittle or ductile) in the design process.
The nominal failure stress of specimens that are geometricallysimilar in two dimensions can be determined through substitutingexperimental results in the following equation:
rN ¼ CnPu
bdð4Þ
where Pu is the peak load, Cn is a constant coefficient introduced forconvenience, b is the width and d is the reference dimension (usu-ally beam depth).
The B and d0 can be obtained from peak load, Pu, of geometri-cally similar specimens of different sizes and nominal stress rN
through the following linear regression equation:
Y ¼ AX þ C ð5Þ
In which:
X ¼ d;Y ¼ ð1=rNÞ2;d0 ¼ C=A;B ¼ 1=ffiffiffiCp
According to the above method, major fracture parametersincluding initial fracture energy (Gf), effective length of processzone (Cf) and fracture toughness (KIC) can be determined as:
Gf ¼gða0Þ
AEð6Þ
Cf ¼gða0Þg0ða0Þ
� CA
ð7Þ
K IC ¼ffiffiffiffiffiffiffiffiEGf
qð8Þ
where E is the modulus of elasticity of concrete, A is the slope ofregression line, C is the intercept of the regression line, gða0Þ isthe dimensionless energy release rate and g0ða0Þ is its derivativeat the relative initial crack length (a0 ¼ a0=d). Other intended frac-ture parameters such as critical effective crack opening displace-ment (dc) can be expressed as:
dc ¼8K IC
E�
ffiffiffiffiffiffifficf
2p
rð9Þ
3. Experimental program
3.1. Materials and mix proportions
In this study, in order to evaluate the fracture parameters ofconcrete at different ages, SCC mixes were designed for two differ-ent strength levels. To achieve this aim, two mixes with w/c ratiosof 0.45 and 0.65 were made. In each mix, the cement used is type IIPortland cement made by Mazandaran cement factory (Neka, Iran)and the fine aggregate used is natural river sand with a finenessmodulus of 2.85 with a specific gravity of 2.68 and absorption per-centage of 0.8%. The natural crushed gravel passing the 12.5 mmsieve was used as the coarse aggregate with a specific gravity of2.7 and absorption percent of 1.5%. Also a superplasticizer (Gleni-um 110), made by BASF company, was used to obtain acceptablefresh properties. Ultra-fine limestone powder as a mineral admix-ture, provided by Negin factory (Neka, Iran) with a specific gravityof 2.66 was used to enhance viscosity. In order to achieve betteruniformity in all mixes, the concrete was mixed for 6 min. Aftermixing, workability properties of the SCC such as flowability, pass-ing ability and segregation resistance were evaluated by measuringthe slump flow, L-Box and sieve tests according to EFNARC recom-mendation [34]. Mix proportions and properties of the fresh con-crete for both mix designs are presented in Table 1.
3.2. Specimens preparation and test set-up
In the present experimental research, in order to study the ef-fects of age on fracture parameters of SCC in two strength levels,

Table 1Compositions and fresh properties of the mixtures.
Materials Weight (kg/m3)
Mix1 Mix2
Cement (C) 386 309Coarse aggregate 917 917Sand 750 750Limestone powder 205 205Free water (W) 174 202Superplasticizer 7 2.9Vol. of paste (l) 380 380w/c (by weight) 0.45 0.65w/p (by weight) 0.29 0.39w/p (by volume) 0.87 1.15Unit weight (kg/m3) 2439 2386Slump flow (mm) 730 680Flow time (s) 3.3 2Sieve test (%) 9.9 0.5L-Box (h2/h1) 0.92 0.88
Fig. 2. Geometry of the three-point bending specimens used.
Fig. 3. Test setup. Specimen with d = 304.8 mm.
940 M.H.A. Beygi et al. / Materials and Design 55 (2014) 937–948
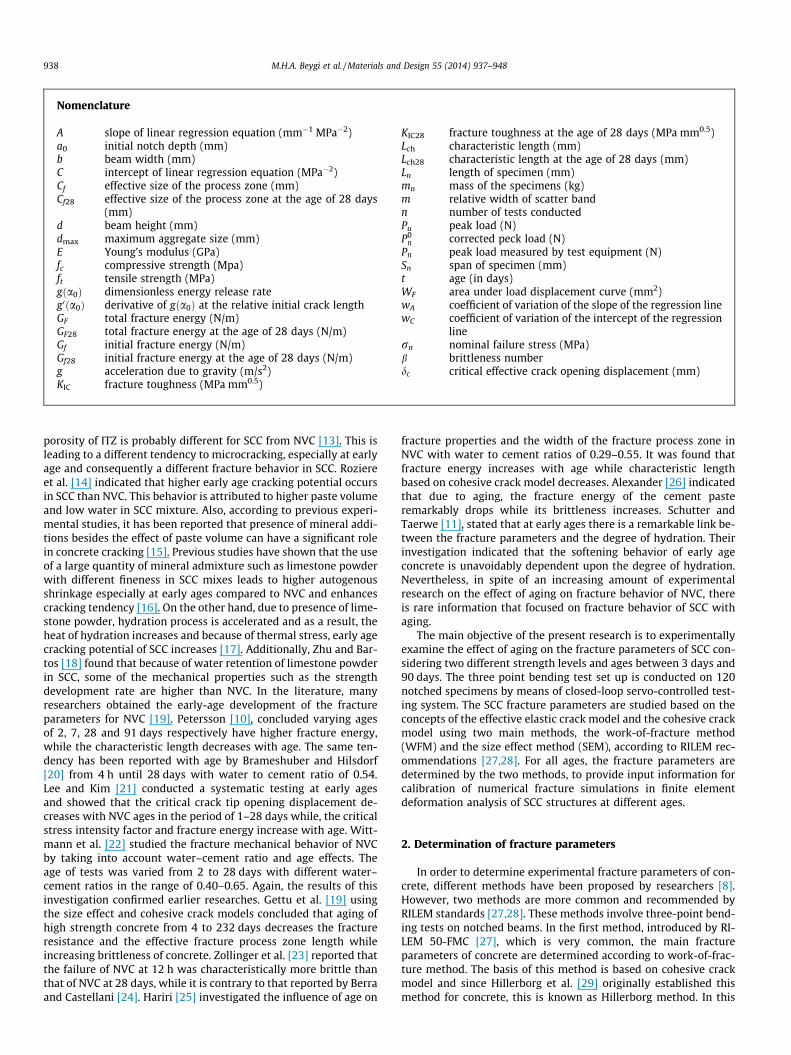
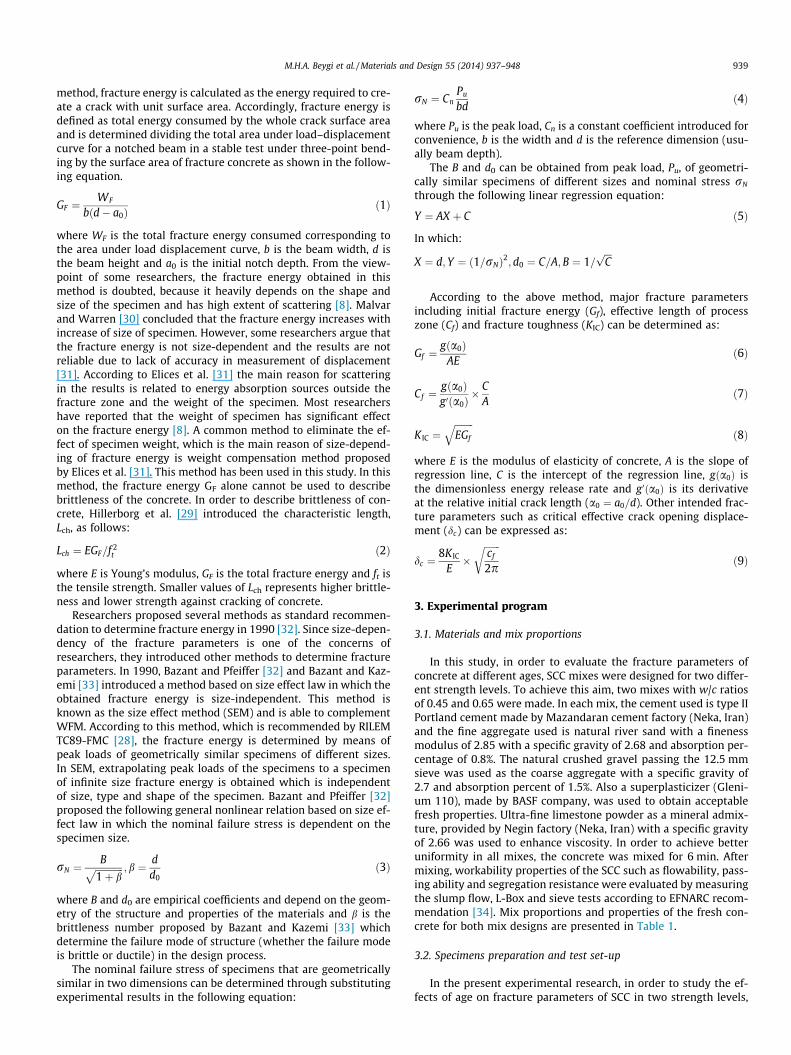
the notched beams were subjected to three-point bending. In orderto evaluate the fracture parameters based WFM, for each mix threenotched beams with the same dimensions of 100� 100� 840 mm(depth �width � length) with a span equal to 800 mm (Fig. 1)were considered according to RILEM recommendation [27]. Theinitial vertical notch (pre-crack) on the beam was made by insert-ing an acrylic plate inside the tensile face of beam with a constantwidth of 3 mm during the concrete casting. This vertical notch hada notch to depth ratio of 0.5. Beside WFM, a series of notchedbeams were considered based on maximum size of aggregateaccording to RILEM TC89-FMC [28] to evaluate the fracture param-eters using SEM. All specimens are geometrically similar in twodimensions and have four different heights. The beams had thesame width (b) of 38.1 mm, depths (d) of 38.1, 76.2, 152.4 and304.8 mm, constant length to depth of 2.67 and constant span todepth of 2.5. Three beams were considered for each depth. A con-stant vertical notch with depth of a0 = 0.2d was produced at themid span of each beam with an acrylic plate during the concretecasting in the tensile face of the beams. Fig. 2 shows the configura-tion of the notched beams used in this test procedure. The three-point bending tests of notched beams were conducted in a150 kN servo electro universal machine under displacement con-trol (Fig. 3). Constant displacement rates were imposed such thatthe peak load occurred at about 1 min and 5 min in WFM andSEM respectively according to RILEM recommendations [27,28].In each experimental series of tests beside the bending test speci-mens, three 100� 100� 100 mm cubes were also cast to
Fig. 1. Three-point bending specimens used in WFM.
determine the compressive strength, fc, according to BS EN 12390[35] and six standard 150� 300 mm cylinders were made andtested to obtain modulus of elasticity, E, and splitting tensilestrength, ft, according to ASTM:C 469 and ASTM:C 496 respectively.The specimens were cured under water at about 20 �C. All speci-mens were tested at ages 3,7,28 and 90 days.
4. Analysis and evaluation of results
4.1. Fracture properties based on WFM
As mentioned in Section 2, fracture energy known as the totalfracture energy in WFM (GF) is the required energy to create a crackwith unit surface area. GF in WFM, according to RILEM 50-FMC rec-ommendation [27], is obtained through the determination of thearea under load–displacement curve and substituting it into Eq.(1). It should be noted that elimination of all probable errors indetermination of area under load–displacement curve such as en-ergy absorption outside the fracture zone is not possible. Thus,considerable scattering of the obtained results for GF has oftenbeen reported by many researchers [8]. The variation of GF regard-ing the age of NVC has been studied in many investigations. Peters-son [10] reported that the variation of GF in the ages of 2–91 days isbetween 82.5 and 114 N/m. Bordelon [36] demonstrated that withincrease of age from 7 to 90 days, GF increases from 83 to 141 N/m.Wittmann et al. [22] reported that GF increases from 80.6 to 113 N/m when the age increases from 1 to 28 days. Studying threestrength levels in ages of 1–28 days, Lee and Kim [21] found thatthe fracture energy for low, medium, and high strength levels in-creases from 25.8 to 132.6 N/m, 93.1 to 173.1 and 99.2 to147.1 N/m respectively. In the present study, as shown in Table 2,total fracture energy of SCC in each strength level is dependent onthe age of concrete and as it was expected the concrete ages from 3

Table 2Value of GF measured from beam tested in all mixes.
Mix ID Age (days) fc (MPa) E (GPa) ft (MPa) GF (N/m) Average GF (N/m) Coefficient of variation (%) Lch (mm)
Beam 1 Beam 2 Beam 3
Mix1 3 27.3 22.3 2.19 91.2 104.8 103.3 99.7 7.5 463.87 39.0 30.2 3.12 105.5 118.9 102.9 109.1 7.9 338.428 60.0 37.4 4.06 121.5 134 119.3 124.9 6.3 283.390 75.5 39.5 4.41 123.9 125.6 130.1 126.5 2.5 256.9
Mix2 3 17.2 20.2 1.65 81.2 66.3 70.1 72.5 10.7 538.17 22.3 22.3 2.04 90.8 86.7 82.4 86.6 4.8 461.928 35.5 29.8 2.74 106.7 116.7 98.5 107.3 8.5 425.990 48.2 31.5 3.41 120.1 128.4 121.9 123.4 3.5 334.4
M.H.A. Beygi et al. / Materials and Design 55 (2014) 937–948 941
to 90 days, the fracture energy increases from 72.5 to 123.4 N/mand 99.7 to 126.5 N/m for w/c ratios of 0.65 and 0.45 respectively.The reason for this increase, as the concrete become older, is theprogress of hydration process and also because the ITZ and cementpaste becomes stronger. Thus, the content and size of pores in ITZand cement paste decreases and fracture mode of concrete changesfrom these zones to through the aggregates directly instead ofaround the aggregates. Studies of Elsharief et al. [37] on the effectof age on the microstructure of ITZ in NVC showed that the pres-ence of large amount of unhydrated cement grains in ITZ at earlyages causes high porosity in this zone and with the passage of time,the pores in ITZ are filled with hydration products and conse-quently the strength of this zone is increased.
Considering Table 2, it can be concluded that in SCC with w/c ra-tios 0.45 and 0.65, respectively 67% and 80% of 28-day GF occurs inthe first 3 days. Also 85% and 87% of 28-day GF of SCC mixes withw/c ratios 0.45 and 0.65 respectively occurs in the first 7 days.However, the results of studies by Wittmann et al. [22] and Bord-elon [36] on NVC showed that respectively 79% and 81% of 28-dayGF occurs in the first 7 days. Considering the above values, it can besaid that rate of GF development at early ages for the two differentw/c ratios is slightly higher than those of NVC. The reason is that inSCC the limestone powder, as filler, accelerates the hydration pro-cess of some clinker components at early ages on the one hand andon the other hand, due to high capacity of water retention, yieldshigh performance in strength development. Such phenomena indevelopment of other mechanical properties of SCC with age hasbeen previously reported by other researchers [17]. Also, it canbe said that with decrease of w/c ratio, rate of GF development atearly ages is increased. This trend has been previously reportedin NVC [38]. As can be seen from Table 2, at each age, decreaseof w/c ratio and increase of compressive strength cause GF to in-crease. In other words, previous studies showed that GF is a func-tion of compressive strength [10]. Beygi et al. [39] also studiedSCC and showed that there is a relationship between compressive
Fig. 4. Plot of experimental results versus predicted values of GF from Beygi et al.formula.
strength and GF and proposed an equation to predict GF based on28-day compressive strength for SCC. The results of this study atdifferent ages and according to compressive strength at each ageagainst the prediction value based on Beygi’s formula has been de-picted in Fig. 4. It can be observed that the prediction values of dif-ferent ages are not in good agreement with the experimentalresults of this study. Thus, it can be said that Beygi’s formula isdependent on concrete age and is applicable only for the age of28 days. Previous studies on NVC by Zollinger et al. [23] and Bord-elon [36] showed that assessment of fracture properties at differ-ent ages based on a reference age (e.g. 28 day) which has lowerscattering is very convenient. On the other hand, since many inter-national codes assess the mechanical properties of concrete at dif-ferent ages based on its properties at the age of 28 days, the resultsof the present study have been normalized so that the GF at differ-ent ages is expressed based on GF at 28 days. This relation is deter-mined through regression analysis according to Fig. 5 as:
GF
GF28¼ t
28
� �0:1234
ð10Þ
where GF is the total fracture energy at the age of t (in days), GF28 isthe total fracture energy at the age of 28 days and t is age (in days).
Load–displacement curves for notched beams for each mix atdifferent ages in WFM have been shown in Figs. 6 and 7. As canbe seen, as w/c ratio increases and compressive strength decreases,the peak load at each age decreases. Also for both mixes, pre-peakslope increases as the age increases which is due to fact thatstrength and stiffness of concrete increase with age. Moreover, ineach mix post-peak slope which indicates the brittleness of theconcrete rapidly increases with age. This is because of strengthen-ing of ITZ due to crystallization of new products in ITZ pores as theconcrete becomes older and also due to decrease of stress concen-tration around the aggregate. Thus, bridging effect and pulling theaggregate out of matrix are reduced and fracture mode approachesaggregate fracture. Furthermore, considering Figs. 6 and 7, it can beconcluded that with increase of strength at each age and strength-ening of ITZ and cement paste, failure resulting from pulling the
Fig. 5. Normalized GF at 28 days as a function of age.

Fig. 6. Load–displacement curves obtained at different ages for w/c = 0.45.
Fig. 7. Load–displacement curves obtained at different ages for w/c = 0.6.
Fig. 8. Plot of experimental results versus predicted values of Lch from Beygi et al.formula.
Fig. 9. Normalized Lch and Cf at 28 days as a function of age.
942 M.H.A. Beygi et al. / Materials and Design 55 (2014) 937–948
aggregate out of the matrix is much more brittle and fracture pathgradually changes from around the aggregate to through the aggre-gate and slope of the declining part in the softening branch in-creases. Also in mixes with lower w/c ratio at the age of 28 days,as the cement paste and ITZ have higher strength compared toaggregate, aggregate bridging almost vanishes and fracture occursthrough the aggregates. With further strengthening of cementpaste and ITZ at the age of 90 days, the fracture mode, similar tothat of 28 days, is through the aggregate and thus the behavior ofload–displacement curves in the softening region at these ages(28 and 90 days) follow the same pattern. As discussed earlier,characteristic length, Lch, in WFM is introduced in Eq. (2) as thesuitable parameter to estimate the brittleness of concrete. Thesmaller the Lch, the more brittleness the material and vice versa.In NVC, Lch varies between 200 and 500 mm [40]. However, Beygiet al. [39] showed that in SCC with w/c ratios between 0.35 and0.7 the value of Lch varies between 251 and 427 mm. In the presentstudy, Lch for different ages and two different w/c ratios is pre-sented in Table 2. As it can be observed, the value of Lch decreasesfrom 538.1 to 334.4 mm and from 463.8 to 256.9 mm for high andlow w/c respectively. These results confirm those of NVC reportedby most researchers [41]. Petersson [10], investigating NVC in aconstant w/c in ages between 2 and 91 days, showed that Lch variesbetween 593 and 258 mm. The decrease of Lch with age shows thatconcrete is more ductile at early ages. The reason of this ductilityincrease is the change of fracture path and consequently fractaldimension of concrete due to bridging and more aggregate pullout in concrete. Previous studies showed that at early ages it isvery unlikely that fracture occurs through the aggregate and thelowest fracture dimension occur for the fracture surface [37,41].This is because, at early ages, there is large content of water inITZ, which has not undergone the hydration reaction yet and thusITZ has high porosity. Thus, it can be said that the fracture path
becomes longer and with increase of fracture dimension, whichis related to ductility index, Lch increases. From the results pre-sented in Table 2 it can be observed that for low w/c concrete, thereis not much difference between Lch at 28 and 90 days. As it was dis-cussed earlier, this can be due to the fact that for the mix with low-er w/c in the age of 28, as ITZ and the paste have high strengths andfracture mode is often through the aggregate, the fracture path andconsequently fracture mode do not change considerably when ITZand paste are strengthened at 90 days. Many researchers have pro-posed relations in which Lch is related to compressive strength andLch decreases with increase of compressive strength [42]. For SCCwith varying w/c ratios, Beygi et al. [39] have proposed a relationbased on which, Lch is a function of compressive strength. The re-sults of the present study at different ages and according to com-pressive strength at each age against the prediction value basedon Beygi’s formula has been plotted in Fig. 8. Based on Fig. 8, itcan be said that Beygi’s formula is approximately suitable to pre-dict Lch regardless of the age of concrete. Also, normalizing the re-sults of Lch for all mixes at different ages based on Lch at the age of28 days, the following relation is determined using regressionanalysis according to Fig. 9 as:
Lch
Lch28¼ t
28
� ��0:146
ð11Þ
where Lch is the characteristic length at the age of t (in days), Lch28 isthe characteristic length at the age of 28 days and t is age (in days).
Based on Eq. (11) the value of Lch at any age can be determinedas a function of Lch at the age of 28 days.

Table 3Corrected maximum loads for mixes.
Mix ID Age (days) fc (MPa) a0/d Depth d (mm) Corrected maximum load P0 (N)
Beam 1 Beam 2 Beam 3
Mix 1 3 27.3 0.2 38.1 1461 1365 129876.2 2133 2071 2221152.4 3567 3887 3574304.8 6462 6279 6249
7 39 0.2 38.1 1755 1736 170376.2 2431 2672 2696152.4 4958 5009 4678304.8 8111 7610 7548
28 60 0.2 38.1 2145 2196 228876.2 3402 3406 3130152.4 6046 5733 5583304.8 9390 8412 10149
90 75.5 0.2 38.1 2700 2822 275276.2 3866 3634 3630152.4 6302 6296 6175304.8 10283 10330 10230
Mix 2 3 17.2 0.2 38.1 835 857 89776.2 1512 1534 1419152.4 2618 2610 2603304.8 4780 4399 4314
7 22.3 0.2 38.1 1192 1045 107476.2 1787 1736 1703152.4 3351 3056 3574304.8 5506 5282 5179
28 35.5 0.2 38.1 1516 1427 139876.2 2409 2567 2387152.4 3986 3942 4187304.8 6981 6908 6702
90 48.2 0.2 38.1 2045 1867 185076.2 2986 3012 2736152.4 4553 4674 3935304.8 7912 8100 7169
Table 4Fracture parameters obtained from the size effect method.
Mix ID Age (days) fc (MPa) E (GPa) a0/d g ða0Þ Gf (N/m) Cf (mm) B (MPa) d0 (mm) KIC (MPa. m0.5) dC (mm) xA xc m
Mix1 3 27.3 22.3 0.2 7.28 41.4 28.5 0.96 137.7 30.4 0.0232 0.09 0.12 0.167 39 30.2 0.2 7.28 45.7 25.6 1.24 123.7 37.1 0.0199 0.09 0.14 0.1728 60 37.4 0.2 7.28 48.1 18.9 1.64 91.5 42.4 0.0158 0.11 0.22 0.2290 75.5 39.5 0.2 7.28 53.1 15.6 1.96 75.3 45.8 0.0146 0.07 0.18 0.17
Mix2 3 17.2 20.2 0.2 7.28 25.9 38.4 0.62 185.7 22.8 0.0224 0.08 0.08 0.137 22.3 22.3 0.2 7.28 31.5 32.1 0.79 155.2 26.5 0.0210 0.10 0.12 0.1628 35.5 29.8 0.2 7.28 35.8 24.2 1.07 126.9 32.6 0.0172 0.06 0.09 0.1190 48.2 31.5 0.2 7.28 37.2 17.4 1.38 84.2 34.2 0.0140 0.13 0.29 0.28
Fig. 10. Linear regression for size effect parameters.
M.H.A. Beygi et al. / Materials and Design 55 (2014) 937–948 943
4.2. Fracture properties based on SEM
In order to take account of the effect of weight in the peak load,according to RILEM TC89-FMC [28] the following equation is usedto obtain fracture energy:
P0n ¼ Pn þ
2Sn � Ln
2Sn� g �mn ð12Þ
where P0n is the corrected peck load, Pn is the peak load measured by
test equipment, mn is mass of the specimens, Sn is the span of spec-imen, Ln is the length of specimen and g is the acceleration due togravity and n is the number of tests conducted.
Table 3 shows the corrected peak loads for all beams understudy according to Eq. (12). By fitting the corrected peak loads ofgeometrically similar beams, according to Table 3 and Eq. (4) andusing linear regression analysis for each age, two major fractureparameters in SEM, the initial fracture energy (Gf), effective sizeof the process zone (Cf) and other applied fracture parameters dis-cussed earlier were achieved according to RILEM TC89-FMC [28]
and tabulated in Table 4. One of the results of linear regressionfor concrete with w/c = 0.45 and at the age of 3 days is shown inFig. 10. As can be seen in Fig. 10, for the above mix the slope andintercept of linear regression equation are A = 0.0079

Fig. 12. Variation of properties with the age for w/c = 0.45.
Fig. 13. Variation of properties with the age for w/c = 0.65.
Fig. 14. Plot of experimental results versus predicted values of Gf from Beygi et al.formula.
944 M.H.A. Beygi et al. / Materials and Design 55 (2014) 937–948
(mm�1 MPa�2) and C = 1.08 (MPa�2) respectively. Also coefficientof variation of slope (xA) and intercept (xC) are 0.09 and 0.12respectively. It should be said that, according to RILEM TC89-FMC [28], in order to improve the accuracy of the analysis, thecoefficient of variation of the slope and intercept of the regressionline and relative width of the scatter band (m) should be not ex-ceed of, 0.1, 0.2 and 0.2 respectively. As can be seen in Table 4,most of the results satisfy the above condition, except for a fewthat have negligible difference with the allowable values. Fig. 11shows the variation of Gf against the SCC age with different w/cratios. As it is clear from Fig. 11, Gf increases as the concrete ages.Such trend for NVC has been previously reported by researchers[43,44]. Yu and Ansari [43] showed that variation of Gf for agesof 1–28 days varies between 66.6 and 99.9 N/m. investigating con-cretes with w/c ratios of 0.4 and 0.29 at ages of 1–28 days, Shahet al. [44] concluded that Gf varies from 20.6 to 37.5 N/m and from36.7 to 62.3 N/m respectively. In the present study, as can be seenfrom Fig. 11 and Table 4, Gf with w/c ratios of 0.65 and 0.45 fromage of 3 to 90 days changes from 25.9 to 37.2 N/m and from 41.4to 53.1 respectively. Considering Fig. 11, the trend of Gf increase,especially at early ages for SCC studied in this research, is moreconsiderable than those reported for NVC [36]. The reason, as men-tioned before, may be the effect of limestone filler in accelerationhydration process and formation of a more compact structure inITZ. A graphical comparison between mechanical properties andGf in SEM for SCC with two w/c ratios at different ages againstthe same properties normalized according to the age of 28 dayshas been presented in Figs. 12 and 13. It can be detected fromFigs. 12 and 13 that the rate of Gf increase with concrete age isslightly higher than those of other mechanical properties. The rea-son of such increase of Gf at early ages, compared to other mechan-ical properties, is that the effect of ITZ strengthening at early ageson Gf and microcracking properties is more considerable than onother mechanical properties such as compressive strength. Peraet al. [17] reported such effect on tensile strength increase com-pared to compressive strength in SCC at early ages. Also, fromFigs. 12 and 13, it can be seen that increase rate of Gf, as concretematures, is higher for the concrete containing lower w/c ratio. Alsofrom Fig. 11 it can be observed that at each age, decrease of w/cratio and increase of compressive strength cause Gf to increase.Beygi et al. [39] also proposed an empirical relationship for Gf inSCC to be used in the prediction of Gf based on compressivestrength. The results of the present study at different ages andaccording to compressive strength at each age against the predic-tion value based on Beygi’s formula has been plotted in Fig. 14.Based on Fig. 14, it is clear that the prediction values at differentages are not in good agreement with the experimental results ofthis study. Thus, it can be said that Beygi’s formula is not suitable
Fig. 11. Variation of the initial fracture energy and fracture toughness at different ages with two different w/c.

Fig. 15. Normalized Gf at 28 days as a function of age.
M.H.A. Beygi et al. / Materials and Design 55 (2014) 937–948 945
to predict Gf and is a function of the concrete age. Also normalizingthe results of Gf for all mixes, at different ages and based on Gf atthe age of 28 days, according to Fig. 15, the following equation isdetermined using regression analysis:
Gf
Gf 28¼ t
28
� �0:0888
ð13Þ
where Gf is the initial fracture energy at the age of t (in days), Gf28 isthe initial fracture energy at the age of 28 days and t is age (in days).
Fig. 16 shows the value of Cf as the second major fractureparameter and brittleness index of in SEM at different ages fortwo w/c ratios. As can be seen, as the concrete mature, Cf decreases.This shows that the size of process zone shrinks as concrete ages. Inother words, the concrete become more brittle. On the other hand,as w/c ratio decreases, Cf is decreased at each age which indicatesthat brittleness increases when w/c ratio is decreased. As men-tioned before, increase of brittleness at old ages is related to con-siderable change of fractal dimensions due to change of fracturepath from around the aggregate to through the aggregate(Fig. 17). As it is clear from Fig. 17, the fracture surface is alsochanging remarkably with the age of the concrete. After observa-tion the surface of broken beams, at an age of 3 days absolutelyno aggregate are fracturing and aggregate bridging really plays aparamount role in the fracture, which makes the fracture surfacevery rough. The fracture surface is much smoother at 90 dayswhich is due to the considerable fracture of aggregates instead ofbeing pulled out. The trend of Cf reduction with age in NVC waspreviously reported by Gettu et al. [39]. Also normalizing the re-sults of Cf for all mixes, at different ages and based on Cf at theage of 28 days, according to Fig. 9, the following equation is deter-mined using regression analysis:
Cf
Cf 28¼ t
28
� ��0:206
ð14Þ
Fig. 16. Variation of the fracture process zone length at different ages with twodifferent w/c.
where Cf is the effective size of the process zone at the age of t (indays), Cf28 is the effective size of the process zone at the age of28 days and t is age (in days).
Considering Eq. (14) the brittleness of concrete at any age canbe determined according to Cf at 28 days. Fig. 11 shows the relationbetween fracture toughness, KIC, and age for SCC mixes containingdifferent w/c ratios. As can been seen, for each w/c ratio, the valueof KIC increases with age. For specimens from 3 to 90 days, KIC in-creases from 22.8 to 34.2 MPa mm0.5 and from 30.4 to45.8 MPa mm0.5 for w/c ratios of 0.65 and 0.45 respectively. A sim-ilar trend was previously reported for concrete with ratios between0.3 and 0.7 by Lee and Kim [21]. In a similar research, Shah et al.[44] showed that in NVC with w/c ratios of 0.4 and 0.29 at agesof 1–28 days, the value of KIC increases from 22.7 to37.4 MPa mm0.5 and from 30.9 to 47.1 MPa mm0.5 respectively.Testing NVC at ages 1–28 days, Li et al. [38] found out that KIC var-ies between 21.8 and 42 MPa mm0.5. Moreover, Zollinger et al. [23]launched extensive research on the effect of concrete age on KIC
and concluded that as the concrete ages from 1 to 28 days KIC
changes from 17.5 to 29.3 MPa mm0.5. They also proposed a rela-tion based on which KIC at any age can be determined accordingto KIC at 28 days. In the present study, normalizing the results ofKIC for all mixes, at different ages and based on KIC at the age of28 days, according to Fig. 18, the following equation is determinedusing regression analysis:
K IC
K IC28¼ t
28
� �0:1307
ð15Þ
where KIC is the fracture toughness at the age of t (in days), KIC28 isthe fracture toughness at the age of 28 days and t is age (in days).
Also in Fig. 18 is presented a comparison between the relationproposed by Zollinger et al. [23] and the one obtained in the pres-ent study. It can be observed that at early ages, the results of thepresent study are slightly higher than those proposed by Zollingeret al. [23]. This was quite expected and as mentioned before, theeffect of limestone filler on cement hydration in SCC at early agesis more evident. At the age of 90 days, the difference betweenthe two curves become more apparent which is due to the fact thatthe equation proposed by Zollinger et al. [23] is based on theexperimental data at the age of 1–28 days while wider age range(1–90 days) was considered in the present study. It can be con-cluded from Fig. 11 that when w/c decreases and consequentlycompressive strength increases, fracture toughness of SCC is in-creased which was previously reported by Beygi et al. [39] andEskandari et al. [42]. Also, recently Beygi et al. [39] proposed anempirical relation between compressive strength and fracturetoughness in SCC. Thus, the results of the present study at differentages have been plotted in Fig. 19 the against prediction value basedon Beygi’s formula according to compressive strength at each age.It can be seen that deviation of the prediction values from experi-mental results at different ages is negligible and it may be said thatBeygi’s formula based on compressive strength is acceptable topredict KIC of SCC at each age. Fig. 20 provides a comparison be-tween the experimental peak loads with those predicted by SEMusing fracture parameters Gf and Cf. Considering Fig. 20 it can beclaimed that Gf and Cf obtained from SEM for each mix at eachage can be appropriately used to predict the peak loads of struc-tural members of SCC at each age. According to calculated fractureparameters, the size effect curve for SCC beams at age of 3 days to90 days are shown in Fig. 21. As can be seen in Fig. 21, the nominalstress decreases with increase of beam depth and the results ob-tained from experimental studies are in good agreement with theprediction based on size effect law. Comparing the experimentalresults in Fig. 21, it can be claimed that as the concrete matures,a shift occurs from left to right and the experimental results

Fig. 17. Fracture surface for w/c = 0.65 at 3 day (right) and at 28 day (left).
Fig. 18. Normalized KIC at 28 days as a function of age.
Fig. 19. Plot of experimental results versus predicted values of KIC from Beygi et al.formula.
Fig. 20. Experimental and predicted peak load.
Fig. 21. Size effect plot of SCC mixes at different ages.
Fig. 22. Variation of b with depth of beam.
946 M.H.A. Beygi et al. / Materials and Design 55 (2014) 937–948
approach linear elastic fracture mechanics (LEFM) criteria. How-ever, as w/c increases, a shift from LEFM to strength criteria is de-tected. In other words, as the concrete ages and w/c ratio increase,failure behavior becomes more brittle and SCC structure will havesmaller fracture process zone (FPZ). One of the parameters used inSEM to predict failure pattern of SCC is brittleness number, b,which can be determined through Eq. (3) and d0 (see Table 4). Ba-zant and Kazemi [33] stated that b characterizes the brittleness ofthe member and when b < 0:1, the member have ductile behaviorand is analyzing according to strength criteria and when b > 10analysis is performed based on LEFM. Also when 0:1 6 b 6 10, non-linear fracture mechanics governs the behavior of the structure. Inthe present study, increase of age and decrease of w/c will decrease

Fig. 24. GF/Gf ratios for all mixes.
M.H.A. Beygi et al. / Materials and Design 55 (2014) 937–948 947
the characteristic dimension d0 thereby increasing the brittlenessof the member. Fig. 22 shows the variation of b in regard to con-crete age with different w/c ratios. As it is observed, all resultsare within the nonlinear fracture mechanic criteria. However,when the specimen size increases compared to FPZ size, the designcriterion approaches LEFM. Also, considering the slope of thecurves, it is apparent that in mature specimens with lower w/c,compared to younger specimens with higher w/c, LEFM assump-tions can be applied in design of larger beams with lower error. Ba-zant and Becq-Giraudon [45], collecting 238 sets of experimentalresults obtained in different laboratories across the world and con-ducting tests on concretes of different mixes and then optimizingthe results developed an age-independent approximate relationfor fracture energy based on compressive strength, w/c ratio andmaximum size of coarse aggregate as:
Gf ¼ 1:44fc
0:051
� �0:46
1þ dmax
11:27
� �0:22 wc
� ��0:3ð16Þ
where fc is the compressive strength of cylindrical specimen, dmax isthe maximum aggregate size and w/c is proportion of w/c. The pre-dicted error for fracture energy in the above relation is 17.8%.
Many researchers have confirmed that the above equation givesreliable results as prediction values. Bharatkumar et al. [46]showed that Bazant’s formula is suitable for estimation of fractureenergy for high performance concrete (HPC). The results of thepresent study, for SCC mixes at ages of 3–90 days are comparedto prediction values proposed by Bazant’s formula (Fig. 23). As itis clear from Fig. 23 and considering the introduced variation rangefor Bazant’s formula, the results of the present study approxi-mately lie within the specified range. The results, especially thosefor 28 days, are in satisfactory agreement with values obtainedfrom Eq. (16). However, in SCC beside major mix parameters, amore accurate prediction equation is needed to be developedbased on concrete age, type of filler and other parameters relatingto microstructure. Bordelon [36] reported a weak correlation be-tween fracture energy measured in the lab and that predicted byBazant’s formula in NVC. Bordelon [36] attributed this weak corre-lation to exclusion of other effective parameters such as cementcontent, fine to coarse aggregate ratio and the age at which speci-mens are tested. However, according to Bazant and Becq-Giraudon[45] recommendation, the proposed formula is only useful for theinitial design and is not applicable for sensitive structures such asdams and nuclear power plants.
Bazant and Kazemi [33] showed that fracture energies GF basedon WFM and Gf based on SEM are two different properties of con-crete. Their investigation proved that GF can be estimated from Gf
and vice versa. However, some researchers believe that such esti-mation (Gf from GF) suffers poor accuracy [47]. This is due to thefact that GF is heavily dependent on size and the testing process.
Fig. 23. Plot of experimental results versus predicted values of Gf from Bazant andBesq-Giraudon formula.
Since experimental determination of Gf is more simple than GF, itis recommended that GF be estimated from the results of Gf so thatsoftening curve of concrete can be calibrated for finite elementanalysis based on the cohesive crack model. Planas et al. [48] esti-mated the ratio of GF/Gf to be between 2 and 2.5 while Bazant andBecq-Giraudon [45], conducting an extensive statistical analysisand based on the results of previous studies, roughly concludedthat GF/Gf = 2.5. Einsfeld and Velasco [47] reported that for HPCGF/Gf = 2.88 with variation coefficient of 38.1%. In the presentstudy, considering Fig. 24, the ratio of GF/Gf was estimated to be2.7 with variation coefficient of 12.3% at different ages. Since Ba-zant and Becq-Giraudon [45] reported a quite large variation coef-ficient of 40% for estimation of GF/Gf in NVC, the ratio of GF/Gf
estimated in the present study is in good agreement with the re-sults of NVC.
5. Conclusions
In the present study, the effects of concrete age and strength onfracture characteristics of SCC using notched beams of differentsizes according to RILEM recommendation were investigated andthe results can be summarized as follows:
(1) From the experimental results obtained through both WFMand SEM it was shown that the fracture energy of SCCincreases with age. This can be due to completion of hydra-tion process and reduction in number and volume of pores.
(2) With increase of age and decrease of w/c ratio, the slope ofthe pre-peak region of the load–displacement curve, whichis indicative of concrete stiffness, and the slope of the declin-ing part, which is corresponding to concrete brittleness, areincreased.
(3) When concrete matured from 3 days to 90 days, fracturetoughness increases by 50% for all mixes.
(4) At early ages of SCC, a failure mode through the aggregates isvery rare and crack tortuosity is high, indicating ductilebehavior.
(5) Characteristic length, Lch, which reflects the brittleness ofmaterials in WFM, is significantly affected by aging from3 days to 90 days and is remarkably decreased (from 538.1to 334.4 mm for w/c = 0.65 and from 463.8 to 256.9 mmfor w/c = 0.45) With increase of age, indicating brittlebehavior.
(6) Effective length of process zone, Cf, which reflects the brittle-ness of materials in SEM is significantly affected by agingfrom 3 days to 90 days and is remarkably decreased (from38.4 to 17.4 mm for w/c = 0.65 and from 28.5 to 15.6 mmfor w/c = 0.45) With increase of age, indicating brittlebehavior.

948 M.H.A. Beygi et al. / Materials and Design 55 (2014) 937–948
(7) The results indicated that the rate of gain in fracture energywith age for different grades of SCC is slightly more than theexpected fracture energy of NVC. This behavior is attributedto effect of limestone filler in acceleration of cementhydration.
(8) Suitable relations with good accuracy are developedbetween fracture parameters at each day according to thesame parameters at 28 days of different grades of SCC.
(9) From the size effect curve, it has been recognized that withincreasing age of SCC specimens for all mixes, failure mech-anisms of the specimens shift toward the region of LEFM.
(10) It can be deduced that the ratio GF/Gf between the fractureenergy obtained by WFM and SEM was determined approx-imately equal to 2.7 for the SCC mixes used in this studywith variation coefficient of 12.3%. These values are in goodagreement with the previous predictions by Bazant andBecq-Giraudon for NVC and Einsfeld and Velasco for HPC.
Acknowledgment
The authors wish to acknowledge the financial support of theBabol University of Technology that made this research possible.
References
[1] Siddique R. Properties of self-compacting concrete containing class F fly ash.Mater Des 2011;32:1501–7.
[2] Dinakar P, Sethy KP, Sahoo OC. Design of self-compacting concrete withground granulated blast furnace slag. Mater Des 2013;43:161–9.
[3] Jalal M, Mansouri E, Sharifipour M, Pouladkhan A. Mechanical, rheological,durability and microstructural properties of high performance self-compactingconcrete containing SiO2 micro and nanoparticles. Mater Des2012;34:389–400.
[4] Zhao H, Sun W, Xiaoming W, Gao B. The effect of coarse aggregate gradation onthe properties of self-compacting concrete. Mater Des 2012;40:109–16.
[5] Bingol AF, Tohumcu I. Effects of different curing regimes on the compressivestrength properties of self-compacting concrete incorporating fly ash and silicafume. Mater Des 2013;51:12–8.
[6] Jawahar JG, Sashidhar C, Reddy R, Peter JA. Micro and macro level properties offly ash blended self-compacting concrete. Mater Des 2013;46:696–705.
[7] Rambo DAS, Silva FDA, Filho RDT. Mechanical behavior of hybrid steel-fiberself-consolidating concrete: materials and structural aspects. Mater Des2014;54:32–42.
[8] Bazant ZP, Planas J. Fracture and size effect in concrete and other quasi-brittlematerials. CRC Press; 1998.
[9] Carpinteri A, Brighenti R. Fracture behavior of plain and fiber-reinforcedconcrete with different water content under mixed mode loading. Mater Des2010;31:2032–42.
[10] Petersson PE. Fracture energy of concrete: practical performance andexperimental results. Cem Concr Res 1980;10(1):91–101.
[11] Schutter GD, Taerwe L. Fracture energy of concrete at early ages. Mater Struct1997;30:67–71.
[12] Akcaoglu T, Tokyay M, Celik T. Effect of coarse aggregate size and matrixquality on ITZ and failure behavior of concrete under uniaxial compression.Cem Concr Compos 2004;26:633–8.
[13] Leemann A, Loser R, Münch B. Influence of cement type on ITZ porosity andchloride resistance of self-compacting concrete. Cem Concr Compos2010;32:116–20.
[14] Rozière E, Granger S, Turcry Ph, Loukili A. Influence of paste volume onshrinkage cracking and fracture properties of self-compacting concrete. CemConcr Compos 2007;29:626–36.
[15] Heirmana G, Vandewalle L, Van Gemerta D, Boel V, Audenaert K, De Schutter G,et al. Time-dependent deformations of limestone powder type self-compacting concrete. Eng Struct 2008;30:2945–56.
[16] Craeye B, De Schutter G, Desmet B, Vantomme J, Heirman G, Vandewalle L,et al. Effect of mineral filler type on autogenous shrinkage of self-compactingconcrete. Cem Concr Res 2010;40:908–13.
[17] Pera J, Husson S, Guilhot B. Influence of finely ground limestone on cementhydration. Cem Concr Compos 1991;21:99–105.
[18] Zhu W, Bartos PJ. Permeation properties of self-compacting concrete. CemConcr Res 2003;33:921–6.
[19] Gettu R, Garcia Alvarez VO, Aguado A. Effect of aging on the fracturecharacteristics and brittleness of a high-strength concrete. Cem Concr Res1998;28:349–55.
[20] Brameshuber W, Hilsdorf HK. Development of strength and deformability ofvery young concrete. In: Fracture of concrete and rock. Springer-Verlag; 1987.p. 409–21.
[21] Lee Y, Kim JK. Fracture characteristics of concrete at early ages. Int J ConcrStruct Mater 2006;18:191–8.
[22] Wittmann FH, Roelfstra PE, Mihashi H, Huang YY, Zhang XH. Influence of age ofloading, water–cement ratio and rate of loading on fracture energy of concrete.Mater Struct 1987;20:103–10.
[23] Zollinger DG, Tang T, Yoo RH. Fracture toughness of concrete at early ages. ACIMater J 1993;90:463–71.
[24] Berra M, Castellani A. Fracture mechanics of concrete structures. In:Proceedings FRAMCOS-2. Freiburg, Germany: Aedificatio Publishers; 1995. p.85–94.
[25] Hariri K. Bruchmechanisches Verhalten jungen Betons. Laser-Speckle-Interferometrie und Modellierung der Rißprozeßzone. Number 509.Deutscher Auss-chuß fur Stahlbeton; 2000.
[26] Alexander MG. Effect of aging on mechanical properties of the interfacial zonebetween cement paste and rock. Cem Concr Res 1994;24:1277–85.
[27] RILEM FMC-50. Determination of the fracture energy of mortar and concreteby means of three-point bend tests on notched beams. Mater Struct1985;18(4): p. 287–90.
[28] RILEM FMT 89. Size-effect method for determining fracture energy andprocess zone size of concrete. Mater Struct 1990;23(6): p. 461–65.
[29] Hillerborg A, Modeer M, Petersson PE. Analysis of crack formation and crackgrowth in concrete by means of fracture mechanics and finite elements. CemConcr Res 1976;6:773–82.
[30] Malvar LJ, Warren GE. Fracture energy for three point bend tests on single edgenotched beams. Exp Mech 1988;28:266–72.
[31] Elices M, Guinea GV, Planas J. On the measurement of concrete fracture energyusing three-point bend tests. Mater Struct 1997;30:375–6.
[32] Bazant ZP, Pfeiffer PA. Determination of fracture energy from size effect andbrittleness number. ACI Mater J 1987;84(6):463–80.
[33] Bazant ZP, Kazemi MT. Determination of fracture energy, process zone lengthand brittleness number from size effect, with application to rock and concrete.Int J Fract 1990;44:111–31.
[34] EFNARC. Specification & guidelines for self-compacting concrete. English ed.Norfolk, UK: European Federation for Specialist Construction Chemicals andConcrete Systems; 2002.
[35] BS EN 12390. Part 3: Testing hardened concrete. Method of determination ofcompressive strength of concrete cubes. British Standards Institution; 2000.
[36] Bordelon AC. Fracture behavior of concrete materials for rigid pavementsystems. MS thesis. Champaign: University of Illinois at Urbana; 2007.
[37] Elsharief A, Cohen MD, Olek J. Influence of aggregate size, water cement ratioand age on the microstructure of the interfacial transition zone. Cem Concr Res2003;33:1837–49.
[38] Li Z, Jin X, Lin C. Fracture toughness and microstructure of concrete at earlyages. Advances in civil engineering materials. In: Proceedings of the 50-yearteaching and research anniversary of prof. Sun Wei. Nanjing, China: RILEMpublications; 2008.
[39] Beygi HA, Kazemi MT, Nikbin IM, Vaseghi Amiri J. The effect of water tocement ratio on fracture parameters and brittleness of self-compactingconcrete. Mater Des 2013;50:267–76.
[40] Petersson PE. Crack growth and development of fracture zone in plain concreteand similar materials. Report No. TVBM-1006. Lund, Sweden: Division ofBuilding Materials Lund Institute of Technology; 1981.
[41] Ostergaard L, Lange D, Stang S. Early-age stress–crack opening relationshipsfor high performance concrete. Cem Concr Compos 2004;26:563–72.
[42] Eskandari H, Muralidhara S, Prasad BKR, Venkataramareddy B. Size effect inself-consolidating concrete beams with and without notches. Sadhana2010;35:303–17.
[43] Yu BJ, Ansari F. Method and theory for nondestructive determination offracture energy in concrete structure. ACI Struct J 1996;93:602–13.
[44] Shah SP, Ouyang C, Marikunte S, Yang W, Becq-Giraudon E. A method topredict shrinkage cracking of concrete. ACI Mater J 1999;95:339–46.
[45] Bazant ZP, Becq-Giraudon E. Statistical prediction of fracture parameters ofconcrete and implications for choice of testing standard. Cem Concr Res2002;32:529–56.
[46] Bharatkumar BH, Raghuprasad BK, Ramachandramurthy DS, Narayanan R,Gopalakrishnan S. Effect of fly ash and slag on the fracture characteristics ofhigh performance concrete. Mater Struct 2005;38:63–72.
[47] Einsfeld RA, Velasco MSL. Fracture parameters for high-performance concrete.Cem Concr Res 2006;36:576–83.
[48] Planas J, Elices M, Guinea GV. Measurement of the fracture energy using three-point bend tests: Part 2 Influence of bulk energy dissipation. Mater Struct1992;25:305–12.