The educational attainment of immigrants: changes over time
15
The Quarterly Review of Economics and Finance, Vol. 37, Special Issue, 1997, pages 229-243 Copyright 0 1997 ‘lkustees of the University of Illinois All rights of reproduction in any form reserved ISSN 1062-9769 IMMIGRANTSKILLS The Educational Attainment of Immigrants: Changes Over Time YINON COHEN Tel Aviv University TZIPPI ZACH Stanford University BARRY CHISWICK University of Illinois at Chicago Using data pooled across four Current Population Surveys from 1979 to 1988, this paper ana- lyzes the dzferences in the level and inequality of schooling across immigrant cohorts that &fleer by period of arrival and region of origin. The decline in schooling attainment of immigrants observed in the 1970s ti reversed in the 198Os, as the schooling level of tk most recent cohorts has increased. The increase in the 1980s is found among immigrants as a group and among European/Canadian and Asian immigrants but not among Mexican and other Latin American immigrants. The inequality of schooling has been greater among immigrants aniving in the last 20 years compared to earlier post-war cohorts, in part, because of the increasing share among immigrants of the highly educated Asians and low educated Mexican immigrants. Moreover, the inequality of schooling among the foreign born within regions of origin and period of immigration has also exceeded that of the native born. I. INTRODUCTION An issue of long standing concern regarding immigration is the skills that immi- grants bring to the labor market.’ Much of the literature on the skills of immi- grants has focused on earnings as an all encompassing measure of the multidimensional aspects of immigrant skills. Occupational attainment has also been used as a measure of immigrant skills, particularly when earnings data are not available. These measures, however, reflect labor market outcomes and are therefore influenced by many factors, including temporary adjustments during an initial transition period, long-term disadvantages due to the foreign origin of some of their skills, discrimination and other factors. More recently there has 229
Transcript of The educational attainment of immigrants: changes over time
The Quarterly Review of Economics and Finance, Vol. 37, Special Issue, 1997, pages 229-243 Copyright 0 1997 ‘lkustees of the University of Illinois All rights of reproduction in any form reserved ISSN 1062-9769
IMMIGRANTSKILLS
The Educational Attainment of Immigrants: Changes Over Time
YINON COHEN Tel Aviv University
TZIPPI ZACH Stanford University
BARRY CHISWICK University of Illinois at Chicago
Using data pooled across four Current Population Surveys from 1979 to 1988, this paper ana-
lyzes the dzferences in the level and inequality of schooling across immigrant cohorts that &fleer by period of arrival and region of origin. The decline in schooling attainment of immigrants observed in the 1970s ti reversed in the 198Os, as the schooling level of tk most recent cohorts has increased. The increase in the 1980s is found among immigrants as a group and among
European/Canadian and Asian immigrants but not among Mexican and other Latin American
immigrants. The inequality of schooling has been greater among immigrants aniving in the last 20 years compared to earlier post-war cohorts, in part, because of the increasing share among
immigrants of the highly educated Asians and low educated Mexican immigrants. Moreover, the inequality of schooling among the foreign born within regions of origin and period of immigration
has also exceeded that of the native born.
I. INTRODUCTION
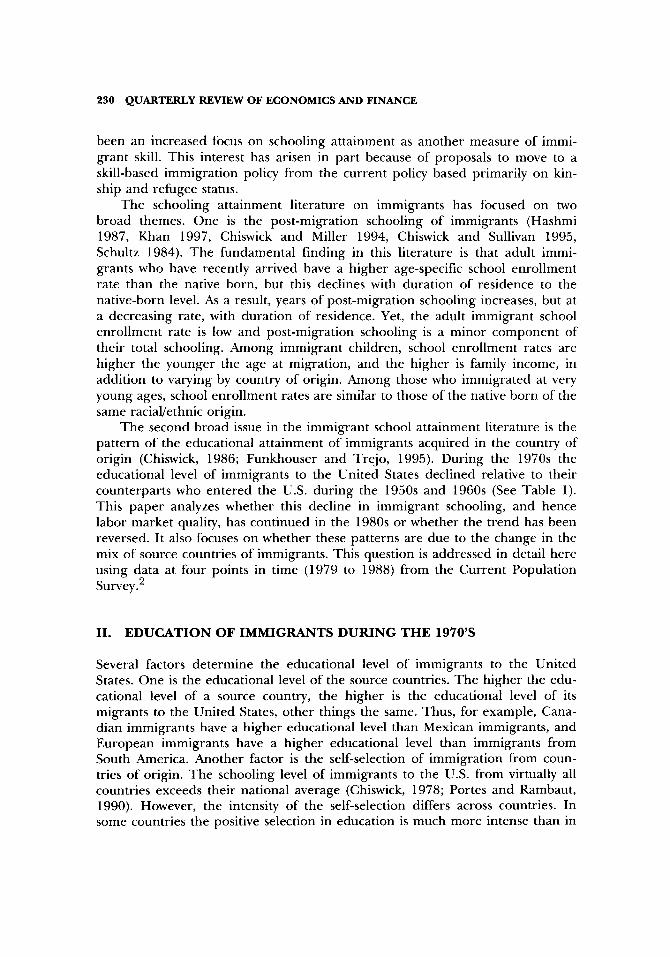
An issue of long standing concern regarding immigration is the skills that immi- grants bring to the labor market.’ Much of the literature on the skills of immi- grants has focused on earnings as an all encompassing measure of the multidimensional aspects of immigrant skills. Occupational attainment has also been used as a measure of immigrant skills, particularly when earnings data are not available. These measures, however, reflect labor market outcomes and are therefore influenced by many factors, including temporary adjustments during an initial transition period, long-term disadvantages due to the foreign origin of some of their skills, discrimination and other factors. More recently there has
229
230 QUARTERLY REVIEW OF ECONOMICS AND FINANCE
been an increased focus on schooling attainment as another measure of immi- grant skill. This interest has arisen in part because of proposals to move to a skill-based immigration policy from the current policy based primarily on kin- ship and refugee status.
The schooling attainment literature on immigrants has focused on two broad themes. One is the post-migration schooling of immigrants (Hashmi 1987, Khan 1997, Chiswick and Miller 1994, Chiswick and Sullivan 1995, Schultz 1984). The fundamental finding in this literature is that adult immi- grants who have recently arrived have a higher age-specific school enrollment rate than the native born, but this declines with duration of residence to the native-born level. As a result, years of post-migration schooling increases, but at a decreasing rate, with duration of residence. Yet, the adult immigrant school enrollment rate is low and post-migration schooling is a minor component of their total schooling. Among immigrant children, school enrollment rates are higher the younger the age at migration, and the higher is family income, in addition to varying by country of origin. Among those who immigrated at very young ages, school enrollment rates are similar to those of the native born of the same racial/ethnic origin.
The second broad issue in the immigrant school attainment literature is the pattern of the educational attainment of immigrants acquired in the country of origin (Chiswick, 1986; Funkhouser and Trejo, 1995). During the 1970s the educational level of immigrants to the United States declined relative to their counterparts who entered the U.S. during the 1950s and 1960s (See Table 1). This paper analyzes whether this decline in immigrant schooling, and hence labor market quality, has continued in the 1980s or whether the trend has been reversed. It also focuses on whether these patterns are due to the change in the mix of source countries of immigrants. This question is addressed in detail here using data at four points in time (1979 to 1988) from the Current Population Survey.2
II. EDUCATION OF IMMIGRANTS DURING THE 1970’S
Several factors determine the educational level of immigrants to the United States. One is the educational level of the source countries. The higher the edu- cational level of a source country, the higher is the educational level of its migrants to the United States, other things the same. Thus, for example, Cana- dian immigrants have a higher educational level than Mexican immigrants, and European immigrants have a higher educational level than immigrants from South America. Another factor is the self-selection of immigration from coun- tries of origin. The schooling level of immigrants to the U.S. from virtually all countries exceeds their national average (Chiswick, 1978; Portes and Rambaut, 1990). However, the intensity of the self-selection differs across countries. In some countries the positive selection in education is much more intense than in
CHANGES IN EDUCATIONAL LEVELS OF IMMIGRANTS 231
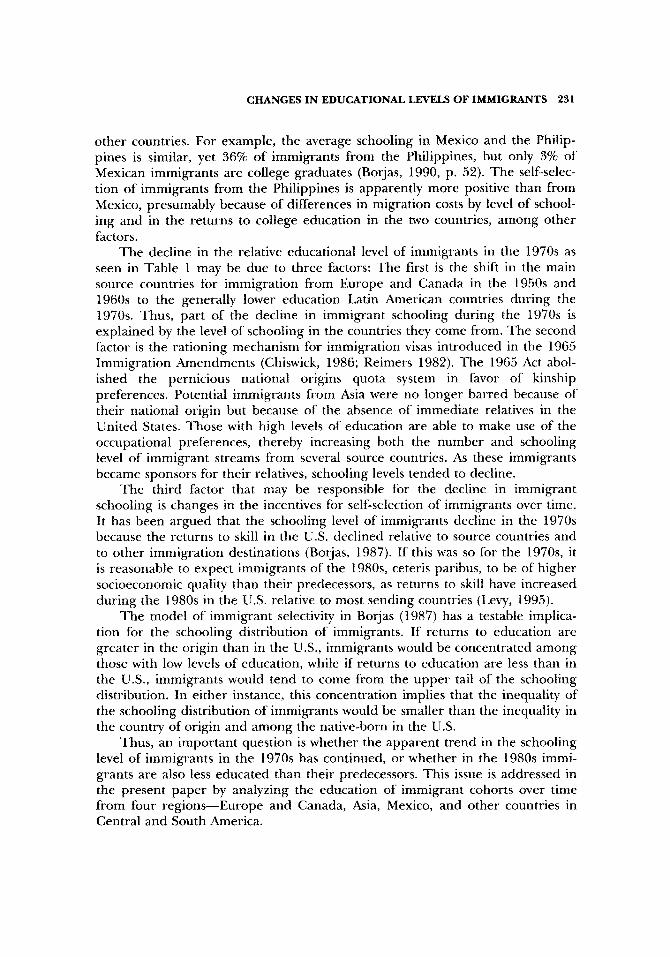
other countries. For example, the average schooling in Mexico and the Philip- pines is similar, yet 36% of immigrants from the Philippines, but only 3% of Mexican immigrants are college graduates (Borjas, 1990, p. 52). The self-selec- tion of immigrants from the Philippines is apparently more positive than from Mexico, presumably because of differences in migration costs by level of school- ing and in the returns to college education in the two countries, among other factors.
The decline in the relative educational level of immigrants in the 1970s as seen in Table 1 may be due to three factors: The first is the shift in the main source countries for immigration from Europe and Canada in the 1950s and 1960s to the generally lower education Latin American countries during the 1970s. Thus, part of the decline in immi~ant schooling during the 1970s is explained by the level of schooling in the countries they come from. The second factor is the rationing mechanism for immigration visas introduced in the 1965 Immigration Amendments (Chiswick, 1986; Reimers 1982). The 1965 Act abol- ished the pernicious national origins quota system in favor of kinship preferences. Potential immigrants from Asia were no longer barred because of their national origin but because of the absence of immediate relatives in the United States. Those with high levels of education are able to make use of the occupational preferences, thereby increasing both the number and schooling level of immigrant streams from several source countries. As these immigrants became sponsors for their relatives, schooling levels tended to decline.
The third factor that may be responsible for the decline in immigrant schooling is changes in the incentives for self-selection of immi~ants over time. It has been argued that the schooling level of immigrants decline in the 1970s because the returns to skill in the U.S. declined relative to source countries and to other immigration destinations (Borjas, 1987). If this was so for the 197Os, it is reasonable to expect immigrants of the 198Os, ceteris paribus, to be of higher socioeconomic quality than their predecessors, as returns to skill have increased during the 1980s in the U.S. relative to most sending countries {Levy, 1995).
The model of immigrant selectivity in Borjas (1987) has a testable implica- tion for the schooling distribution of immigrants. If returns to education are greater in the origin than in the U.S., immigrants would be concentrated among those with low levels of education, while if returns to education are less than in the U.S., immigrants would tend to come from the upper tail of the schooling distribution. In either instance, this concentration implies that the inequality of the schooling distribution of immigrants would be smaller than the inequality in the country of origin and among the native-born in the U.S.
Thus, an important question is whether the apparent trend in the schooling level of immigrants in the 1970s has continued, or whether in the 1980s immi- grants are also less educated than their predecessors. This issue is addressed in the present paper by analyzing the education of immigrant cohorts over time from four regions-Europe and Canada, Asia, Mexico, and other countries in Central and South America.
232 QUARTERLY REVIEW OF ECONOMICS AND FINANCE
III. THE DATA AND ESTI~TIN~ EQUATION
The data for this study are drawn from four Current Population Surveys (CPS) conducted between 1979 and 1988. Special immigration questions were included in the questionnaires in November 1979, April 1983, June 1986, and June 1988. These data have been used primarily for estimating the number of immigrants and the frequency of return migration (see Passe1 and Woodrow, 1987; Bachu and O’Connell, 1984), although the data on labor market status, schooling and earnings have also been studied (Chiswick, Cohen and Zach, 1997; Funkhouser and Trejo, 1995).
Two subsamples were extracted from each of the four CPS samples, one for immi~ants, and the other for the native-born, white population. The analysis is limited to men as this has been the group studied most intensely in the immi- grant adjustment literature. The native-born sample is a 10 percent random sample of white native-born men age 25 to 64 years taken from each CPS file. Immigrant subsamples include all foreign-born men aged 25-64 who migrated to the U.S. at age 18 or later. The age at immigration resriction is imposed to include only those men who received most of their schooling in the origin coun- tries. Some immigrants arriving when they were older than age 18 attained additional schooling in the U.S. (Hashmi, 1987; Khan, 1997). This could bias downward the relative schooling of recent immigrants, who are relatively young and have not yet completed their schooling in the U.S. In order to control for this possibility, the model includes a measure of years since migration (YSM) to the United States. Age and age squared are also included in the model to con- trol for the tendency of younger generations in the U.S. and in most countries of origin have more years of schooling than older generations.
The following regression model is estimated:
EDUC = F(AGE, AGESQ, YSM, COHORT, REGION), (1)
where EDUC is years of schooling completed, AGE and AGESQ (age squared) are in years, and YSM is years since migration. COHORT is a series of dummy variables referring to the period of arrival in the U.S. There are 7 dichotomous variables referring to period of arrival: before 1960, 1960-64, 1965-69, 1970- 74, 1975-79, 1980-8 1, and 1982-88. REGION is a series of dummy variables referring to region of birth. Due to the small number of cases, the model cannot be estimated for individual countries, with the exception of MEXICO. EUROPE includes immigrants born in Europe, Canada, Australia and New Zealand. ASIA includes all Asian-born immigrants, with separate analyses for Laos, Cambodia and Vietnam (LCV) and the rest of Asia. AMERICA includes those born in Cen- tral and South America (excluding Mexico). African immigrants and immigrants whose country of birth is unknown were excluded from the analysis because of their small sample size.
CHANGES IN EDUCATIONAL LEVELS OF IMMIGRANTS 233
The model is estimated for immigrants and for the pooled sample of immi- grants and the native-born. This statistical procedure permits an estimate of the effects of the main independent variables of interest-arrival cohort and region of birth-on schooling, controlling for years since migration and age.
IV. EMPIRICAL ANALYSIS
A. Mean Level of Schooling
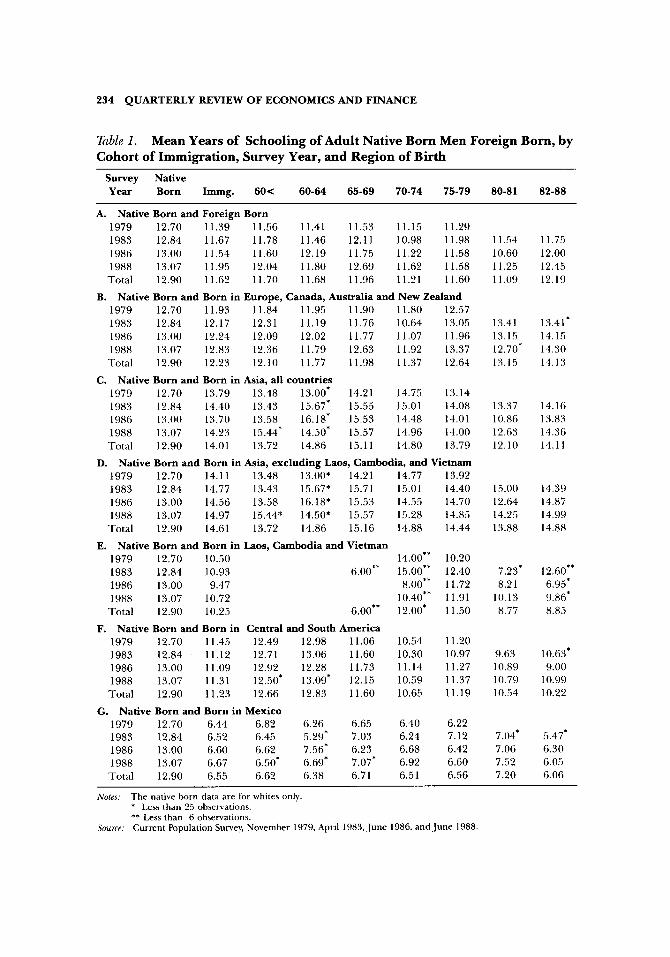
Table 1 presents mean years of schooling for the foreign-born and the native-born by region of birth, cohort of arrival, and survey year. The first panel presents the results for all immigrants. Between the 1979 CPS and the 1988 CPS schooling increased more among immigrants than among the native born, by 0.6 years and 0.4 years, respectively. Among immigrant cohorts, there is no clear pattern in their mean schooling, with one important exception. Immigrants arriving in the most recent cohort, during 1982-88, have a higher educational level than immigrants arriving in the earlier cohorts.
The pattern appears to be more complex when the analysis is performed by region of birth (Table 1). Not surprisingly, the educational level of Mexican immigrants is much lower than that of other immigrants, an average of 6.6 years for Mexican immigrants compared to 11.6 years for all immigrants and 12.7 years for non-Mexican immigrants. Moreover, there is little variation in the schooling level of different cohorts of Mexican immigrants. By contrast, the edu- cational level of immigrants from all other regions largely depends on period of arrival. Central and South American immigrants who arrived before 1965 have a relatively high educational level, reaching 12.8 years for the cohort arriving dur- ing 1960-64. Since 1965, however, there is a clear decline in the schooling of successive cohorts of immigrants from Central and South America, falling to 10.2 years for the more recent immigrants.
Earlier European/Canadian immigrants (pre-1960) also had a higher educa- tional level than those arriving in the next 15 years. During the period 1960-75 there were no major differences in the mean schooling across cohorts. The aver- age European/Canadian immigrant arriving during that period appears to have as many years of schooling as the average immigrant from all other regions. Starting in 1975, however, there is an increase in the average schooling of Euro- pean/Canadian immigrants, reaching 14.1 years among the recent cohort.
Asian immigrants in the U.S. have a high educational attainment, even higher than that of European/Canadian immigrants. With the exception of a sharp decline in 1980-81, immigrant cohorts from Asia have more years of schooling than any other immigrant group.3 The most educated Asians (mean schooling of 15.1 years) arrived during the late 1960s. Since then, and until 1980-8 1, the schooling of successive cohorts of Asian immigrants has declined, reaching 12.1 years in 1980-81. The latest wave of Asian immigrants, like their
234 QUARTERLY REVIEW OF ECONOMICS AND FINANCE
Table 1. Mean Years of Schooling of Adult Native Born Men Foreign Born, by
Cohort of Immigration, Survey Year, and Region of Birth
Survey Native Year Born Immg. 60< 60-64 65-69 70-74 75-79 80-81 82-88
A. Native Born and Foreign Born 1979 12.70 11.39 11.56 11.41 11.53 11.15 11.29 1983 12.84 11.67 11.78 11.46 12.11 10.98 11.98 1986 13.00 11.54 11.60 12.19 11.75 11.22 11.58 1988 13.07 11.95 12.04 11.80 12.69 11.62 11.58 Total 12.90 11.62 11.70 11.68 11.96 11.21 11.60
B. Native Born and Born in Europe, Canada, Australia and New Zealand 1979 12.70 11.93 11.84 11.95 11.90 11.80 12.57 1983 12.84 12.17 12.31 11.19 11.76 10.64 13.05 1986 13.00 12.24 12.09 12.02 11.77 11.07 11.96 1988 13.07 12.83 12.36 11.79 12.63 11.92 13.37 Total 12.90 12.23 12.10 11.77 11.98 11.37 12.64
C. Native Born and Born in Asia, all countries 1979 12.70 13.79 13.48 13.00* 14.21 14.75 13.14 1983 12.84 14.40 13.43 15.67’ 15.55 15.01 14.08 1986 13.00 13.70 13.58 16.18* 15.53 14.48 14.01 1988 13.07 14.23 15.44* 14.50* 15.57 14.96 14.00 Total 12.90 14.01 13.72 14.86 15.11 14.80 13.79
D. Native Born and Born in Asia, excluding Laos, Cambodia, and Vietnam 1979 12.70 14.11 13.48 13.00* 14.21 14.77 13.92 1983 12.84 14.77 13.43 15.67* 15.71 15.01 14.40 1986 13.00 14.56 13.58 16.18* 15.53 14.55 14.70 1988 13.07 14.97 15.44* 14.50* 15.57 15.28 14.85 Total 12.90 14.61 13.72 14.86 15.16 14.88 14.44
E. Native Born and Born in Laos, Cambodia and Vietman 1979 12.70 10.50 14.00** 10.20 1983 12.84 10.93 6.00” 15.00” 12.40 1986 13.00 9.47 S.OO** 11.72 1988 13.07 10.72 10.40** 11.91 Total 12.90 10.25 6.00** 12.00* 11.50
F. Native Born and Born in Central and South America 1979 12.70 11.45 12.49 12.98 11.06 10.54 11.20 1983 12.84 11.12 12.71 13.06 11.60 10.30 10.97 1986 13.00 11.09 12.92 12.28 11.73 11.14 11.27 1988 13.07 11.31 12.50* 13.09’ 12.1.5 10.59 11.37 Total 12.90 1 1 .25 . 12.66 12.83 11.60 10.65 11.19
G. Native Born and Born in Mexico 1979 12.70 6.44 6.82 6.26 6.65 6.40 6.22 1983 12.84 6.52 6.45 5.29* 7.03 6.24 7.12 1986 13.00 6.60 6.62 7.56’ 6.23 6.68 6.42 1988 13.07 6.67 6.50’ 6.69* 7.07’ 6.92 6.60 Total 12.90 6.55 6.62 6.38 6.71 6.5 1 6.56
1 1.54 11.75 10.60 12.00 11.25 12.45 11.09 12.19
13.41 13.41’ 13.15 14.15 12.70’ 14.30 13.15 14.13
13.37 14.16 10.86 13.83 12.63 14.36 12.10 14.11
15.00 14.39 12.64 14.87 14.25 14.99 13.88 14.88
7.23’ 12.60** 8.21 6.95*
10.13 9.86* 8.77 8.85
9.63 10.63’ 10.89 9.00 10.79 10.99 10..54 10.22
7.04’ 5.47’ 7.06 6.30 7.52 6.05 7.20 6.06
Nokx The native born data are for whites only. * Less than 25 observations. ** Less than 6 observations.
Source: Current Population Survey, November 1979, April 1983, June 1986, and June 1988.
CHANGES IN EDUCATIONAL LEVELS OF IMMIGRANTS 235
European/Canadian counterparts, has a higher level of schooling, reaching a mean of 14.1 years for immigrants arriving during 1982-1988.
The Asian immigrant data, however, includes a high proportion of low-edu- cation refugees from Laos, Cambodia and Vietnam, who arrived in the U.S. after the fall of Saigon in April 1975. Although the initial group of refugees had a high educational attainment (11.5 years for the 1975-79 cohort), subsequent immigrant cohorts, many of whom Bed by boat, included many farmers and fish- erman and have less than 9 years of schooling on average. Immigrants from Asia other than Laos, Cambodia and Vietnam have a very high educational level- 14.6 years overall with a level of 15.2 years in the period just after the 1965 Immigration Amendments, after which the schooling level declined. In the 1980’s it increased to 14.9 years (1982-88).
For the purposes of this study, the most important comparison is between the schooling of immigrants arriving in the 1970s and immigrants arriving during 1982-88. For the entire immigrant sample, the mean level of schooling increased from 11.2 years for the 1970-74 cohort, to 11.6 years for the 1975-79 cohort, and to 12.2 years for those arriving during 1982-88. This increase is statistically sig- nificant. As a result, the schooling gap between the native born and the foreign born declined from 1.3 years in the 1979 CPS to 1.1 years in the 1988 CPS.
Thus, it appears that the data support the hypothesis of an increase in the schooling attainment of immigrants arriving during the 1980s. This result is mainly due to Eastern Hemisphere immigrants, whose latest cohort has more schooling than earlier immigrant cohorts. By contrast, the schooling of the latest cohort of Western Hemisphere immigrants has either not changed or declined compared to their counterparts who arrived during the 1970s.
B. Inequality of Schooling
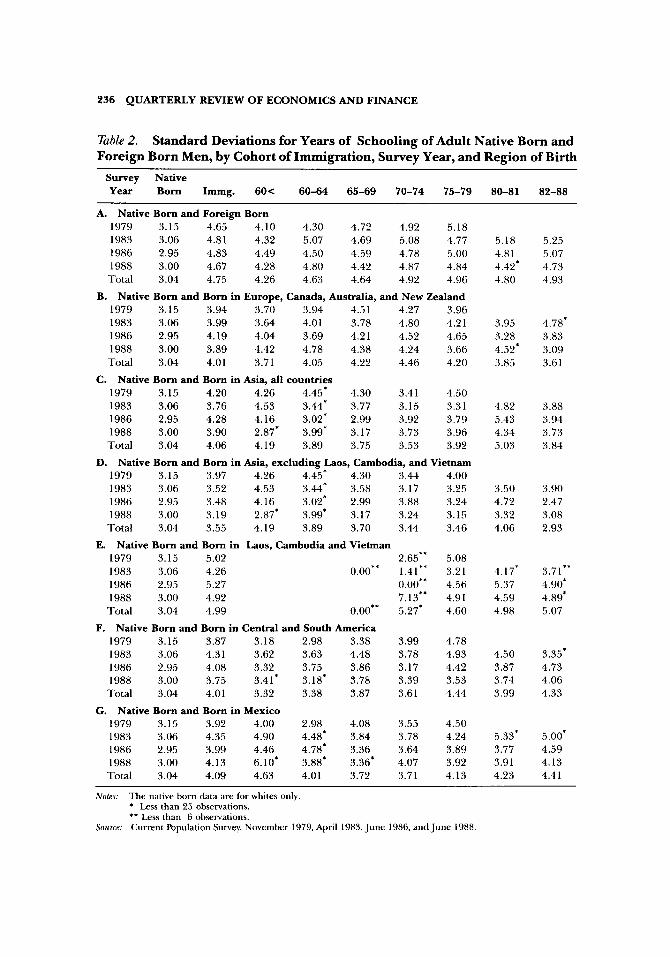
Another dimension of the schooling of immigrants is the standard deviation of years of schooling (Table 2). These data show a much greater inequality of schooling among immigrants (standard deviation of 4.8 years) than among the native born (3.0 years) and that among the foreign born the standard deviation increased from the pre-1960 cohort (4.3 years) to the cohorts arriving in the 1960’s (4.6 years), and then increased again in the 1970s and 1980s (4.9 years). The widening inequality in schooling among more recent immigrant cohorts is in part due to the larger shares in recent cohorts of highly educated Asian immi- grants and low education Mexican immigrants.
The foreign born exhibit a greater inequality of schooling than the native born not only overall, but also within region of origin and period of immigra- tion. Except for the 1982-88 cohort of immigrants from Asia net of the three refugee countries, in nearly every instance in which the sample size for the for- eign born exceeds 24, the foreign born by region of origin and period of immigration have a significantly larger inequality of schooling than do the native born. 4 This greater within region of origin and within cohort inequality is
236 QUARTERLY REVIEW OF ECONOMICS AND FINANCE
Table 2. Standard Deviations for Years of Schooling of Adult Native Born and Foreign Born Men, by Cohort of Immigration, Survey Year, and Region of Birth
Survey Native Year Born Immg. 60< 60-64 65-69 70-74 75-79 80-81 82-88
A. Native Born and Foreign Born 1979 3.15 4.65 4.10 4.30 4.72 4.92 5.18 1983 3.06 4.81 4.32 5.07 4.69 5.08 4.77 1986 2.95 4.83 4.49 4.50 4.59 4.78 .5.00 1988 3.00 4.67 4.28 4.80 4.42 4.87 4.84 Total 3.04 4.75 4.26 4.63 4.64 4.92 4.96
B. Native Born and Born in Europe, Canada, Australia, and New Zealand 1979 3.15 3.94 3.70 3.94 4.51 4.27 3.96 1983 3.06 3.99 3.64 4.01 3.78 4.80 4.21 1986 2.95 4.19 4.04 3.69 4.21 4.52 4.65 1988 3.00 3.89 4.42 4.78 4.38 4.24 3.66 Total 3.04 4.01 3.71 4.05 4.22 4.46 4.20
C. Native Born and Born in Asia, all countries 1979 3.15 4.20 4.26 4.45* 4.30 3.41 4.50 1983 3.06 3.76 4.53 3.44* 3.77 3.15 3.31 1986 2.95 4.28 4.16 3.02’ 2.99 3.92 3.79 1988 3.00 3.90 2.87* 3.99’ 3.17 3.73 3.96 Total 3.04 4.06 4.19 3.89 3.75 3.53 3.92
D. Native Born and Born in Asia, excluding Laos, Cambodia, and Vietnam 1979 3.15 3.97 4.26 4.45’ 4.30 3.44 4.00 1983 3.06 3.52 4.53 3.44; 3.58 3.17 3.25 1986 2.95 3.48 4.16 3.02* 2.99 3.88 3.24 1988 3.00 3.19 2.87* 3.99* 3.17 3.24 3.15 Total 3.04 3.55 4.19 3.89 3.70 3.44 3.46
E. Native Born and Born in Laos, Cambodia and Vietman 1979 3.15 5.02 2.65** 5.08 1983 3.06 4.26 o.oo** 1.41** 3.21 1986 2.95 5.27 o.oo** 4.56 1988 3.00 4.92 7.13** 4.9 1 Total 3.04 4.99 o.oo** 5.27* 4.60
F. Native Born and Born in Central and South America 1979 3.15 3.87 3.18 2.98 3.38 3.99 4.78 1983 3.06 4.31 3.62 3.63 4.48 3.78 4.93 1986 2.95 4.08 3.32 3.75 3.86 3.17 4.42 1988 3.00 3.7.5 3.41’ 3.18’ 3.78 3.39 3.53 Total 3.04 4.01 3.32 3.38 3.87 3.61 4.44
G. Native Born and Born in Mexico 1979 3.15 3.92 4.00 2.98 4.08 3.55 4.50 1983 3.06 4.35 4.90 4.48’ 3.84 3.78 4.24 1986 2.95 3.99 4.46 4.78’ 3.36 3.64 3.89 1988 3.00 4.13 6.10* 3.88; 3.36% 4.07 3.92 Total 3.04 4.09 4.63 4.01 3.72 3.71 4.13
5.18 5.2.5 4.81 5.07 4.42; 4.73 4.80 4.93
3.95 4.78* 3.28 3.83 4.52: 3.09 3.85 3.61
4.82 3.88 5.43 3.94 4.34 3.73 5.03 3.84
3.50 3.90 4.72 2.47 3.32 3.08 4.06 2.93
4.17* 3.71** 5.37 4.90* 4.59 4.89* 4.98 5.07
4.50 3.35’ 3.87 4.73 3.74 4.06 3.99 4.33
5.33’ 5.00’ 3.77 4.59 3.91 4.13 4.23 4.41
Notes: The native born data are for whites only. * Less than 25 observations. ** Less than 6 observations.
SOU~CCY: Current Population Survey, November 1979, April 1983, June 1986, and June 1988.
CHANGES IN EDUCATIONAL LEVELS OF IMMIGRANTS 237
not consistent with the Borjas (1987) model of immigrant selectivity which sug- gests a narrower schooling inequality for immigrants, ceteris paribus.
C. Regression Analysis of Schooling
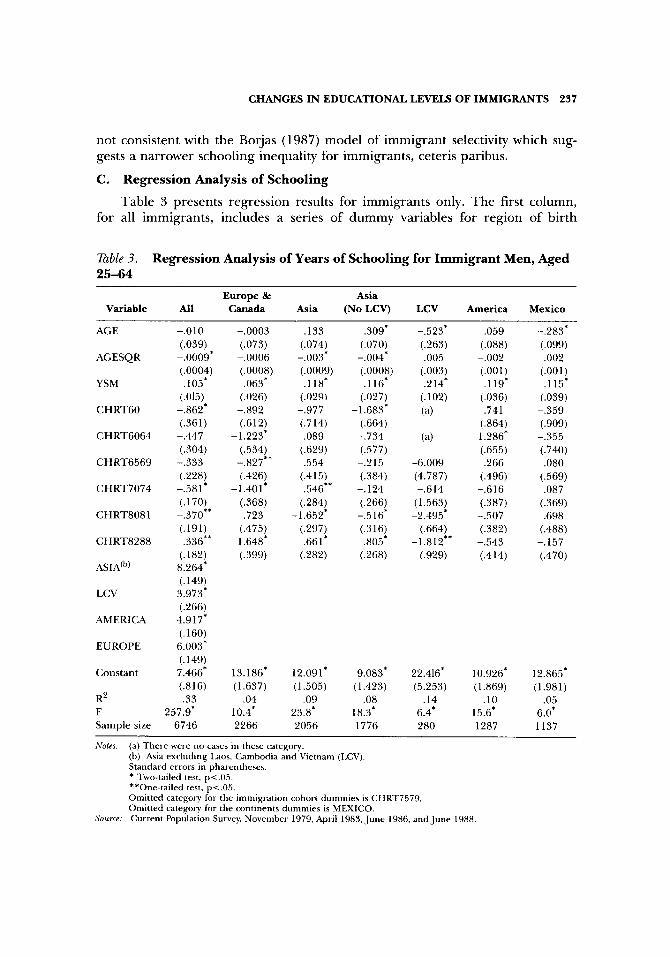
Table 3 presents regression results for immigrants only. The first column, for all immigrants, includes a series of dummy variables for region of birth
Table 3. Regression Analysis of Years of Schooling for Immigrant Men, Aged
25-64
Variable All Europe &
Canada Asia Asia
(No LCV) LCV America
AGE
AGESQR
YSM
CHRTGO
CHRT6064
CHRT6569
CHRT7074
CHRT808 1
CHRT8288
AS IA(“)
IGV
AMERICA
EUROPE
Constant
R2
F
Sample size
-.OlO
(.039)
-.0009*
(.0004)
.105*
(.015)
-.862*
(.361)
-.447
(.304)
-.333
(.228)
-.581*
(.170)
-.370**
(.191)
.336**
(.182)
8.264*
(.149)
3.973*
(.266)
4.917*
(.160)
6.003*
(.149)
7.466:
(.816)
.33
257.9’
6746
-.0003 ,133
(.073) (.074) -.0006 -.003* (.OOOS) (.0009) .063* .118*
(.026) (.029) -.a92 -.977 (.612) (.714)
-1.223* ,089 (.534) (.629)
-.827** ,554 (.426) (.415)
-1.401* .546** (.368) (.284) ,723 -1.652*
(.475) (.297) 1.648* ,661: (.399) (.282)
13.186*
(1.637)
.04
10.4‘
2266
12.091* (1.505)
.09 23.8’ 2056
,309’
(.070)
-.004*
(.OOOS)
.116*
(.027)
-1.683’
(.664)
-.734
(.577)
-.215
(.384)
-.124
(.266)
-.516*
(.316)
.805*
(.268)
9.oa3*
(1.423)
.08
18.3’*
1776
-.523*
(.263)
,005
(.003)
.214*
(.102)
(a)
(a)
-6.009
(4.787)
-.614
(1.563)
-2.495*
(.664)
-1.s12**
(.929)
22.416:
(5.253)
.I4
6.4*
280
,059 (.088)
-.002
(.OOl)
.119*
(.036)
.741
(.864)
1.286*
(.655)
,266
(.496)
-.616
(.387)
-507
(.382)
-.543
(.414)
10.926*
(1.869)
.lO
15.6:
1287
Mexico
-.283* (.099) .002
(.OOl) .115*
(.039) -.359 (.909)
-.355 (.740) ,080
(.569) -.087 (.369) .698
(.488) -.157 (.470)
12.865* (1.981)
.05 6.0: 1137
Nokx (a) There were no cases in these category. (b) Asia excluding Laos, Cambodia and Vietnam (LCV). Standard errors in pharentheses. * Two-tailed test, pc.05. **One-tailed test, pc.05. Omitted category for the immigration cohort dummies is CHRT7579. Omitted category for the continents dummies is MEXICO.
Source: Current Population Survey, November 1979, April 1983, June 1986, and June 1 988.
238 QUARTERLY REVIEW OF ECONOMICS AND FINANCE
(Mexico is the omitted category). Among the adult foreign born, the older the person, the lower the level of schooling. The effect of age is not significant, but the effect of age squared is negative and statistically significant. This reflects the secular rise in the level of schooling in nearly all countries of origin.
The coefficient for years since migration (YSM) indicates that immigrants’ schooling level increases with duration in the U.S., but not by much. Every year in the U.S. increases schooling by 0.1 years. In other words, the average immi- grant increases his schooling by one year after 10 years in the U.S. It is not possible to discern from these data the extent to which this is an actual increase in schooling among those who immigrated at age 18 or older, a higher propen- sity for return migration among those with less schooling, or an upward bias in reported schooling the longer an immigrant is in the United States.
Not surprisingly, immigrants from all regions have more schooling than Mexican immigrants. The schooling advantage of immigrants from other regions over their Mexican counterparts ranges between 4.0 years for immigrants from Cambodia, Laos, and Vietnam, to 8.3 years for other Asian immigrants.
The coefficients for period of immigration cohorts should be interpreted relative to the omitted category, the cohort of 1975-79. For some cohorts, the results are not statistically significant. The schooling of the immigrants arriving during the 1960s and early 1980s is similar to the schooling of the 1975-79 cohort. The earliest immigrants (those arriving before 1960) and those who arrived in 1970-74 have lower schooling than immigrants of the late 1970s. For the purpose of this study, the coefficient for recent immigrants is of most inter- est. The coefficient for this immigrant cohort (1982-88) is positive and statistically significant. Other things the same, the average adult male immigrant arriving during 1982 to 1988 had about one-third of a year more schooling (0.34 years) than the average adult male immigrant arriving during the late 1970s and nearly a full year more schooling (0.92 years) than those arriving in the early 1970s. This finding is consistent with the main hypothesis of this study, namely, that immigrant schooling has been increasing since its nadir in the early 197Os, other things being the same.
The next six columns in Table 3 present the analysis by region of birth. In all regressions, the omitted cohort category is the 1975-79 cohort. For Europe/ Canada and Asia, the coefficient for recent immigrants is positive and statisti- cally significant. Controlling for age and years since migration, European/ Canadian immigrants arriving during 1982-88 have about 1.6 years more schooling than their predecessors arriving during the late 1970s and 3.0 years more than those arriving in the early 1970s. The advantage of recent Asian immigrants (excluding those from Laos, Cambodia, and Vietnam) over the 1975-79 benchmark is 0.8 years of schooling. By contrast, recent immigrants from Laos, Cambodia and Vietnam have a lower level of schooling than those who arrived just after the fall of Saigon (1975-79). No significant change in schooling was detected among recent immi~ants from Central and South Amer-
CHANGES IN EDUCATIONAL LEVELS OF IMMIGRANTS 239
ica nor among Mexican immigrants; their schooling is similar to the schooling of those arriving during the 1970s.
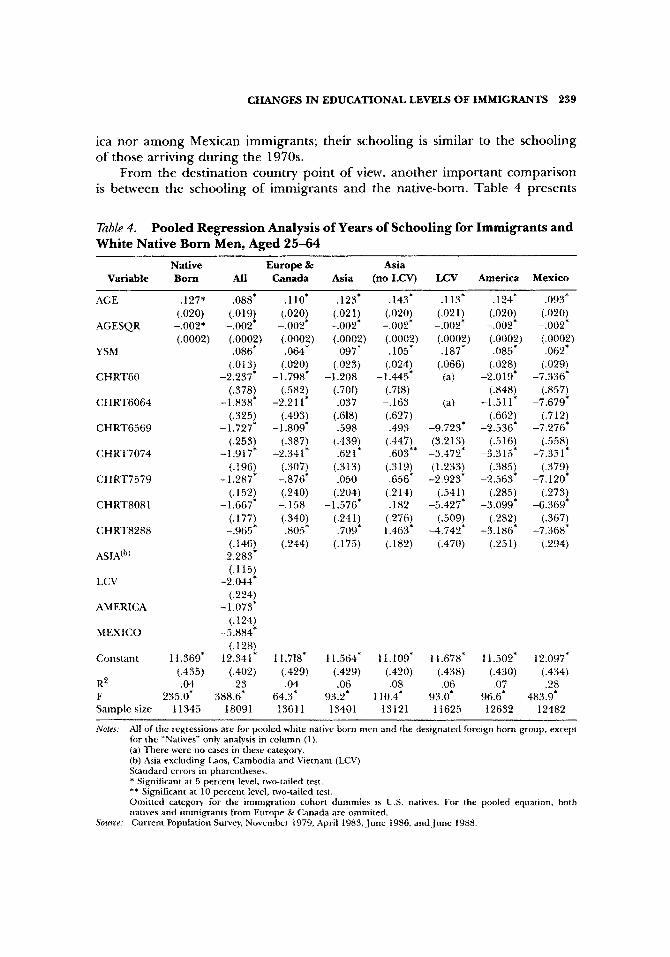
From the destination country point of view, another important comparison is between the schooling of immigrants and the native-born. Table 4 presents
Table 4. Pooled Regression Analysis of Years of Schooling for Immigrants and
White Native Born Men, Aged 25-64
Native Europe & Asia Variable Born All Canada Asia (no LCV) LCV America Mexico
AGE .127* .088* .110* ,123’ .143* .113* .124* .093*
(.020) (.019) (.020) (.OZl) (.020) (.02 1) (.020) (.020)
AGESQR -.002* -.002’ -.002* -.002* -.002* -.002* -.002* -.002*
(.OOOZ) (.0002) (.0002) (.0002) (.0002) (.0002) (.0002) (.0002) YSM .086’ .064* .097* .105’ ,187’. .oa5’ ,062’
(.013) (.020) (.023) (.024) (.066) j.028) 1.029) CHRTGO -2.237* - 1.798’ -1.208 -1.445* (a) -2.019” -7.336*
(.378) (.582) (.701) (.718) (.84X) (.857) CHRT6064 -1.838’ -2.211” ,037 -.163 (a) -1.511* -7.679*
(.325) (.493) (.618) (.627) (.662) (.712) CHRT656Q -1.727’ - 1.809* .598 ,493 -9.723* -2.536* -7.276’
(.253) j.387) (‘439) (.447) (3.213) 1.516) (.558) CHRT7074 -1.917* -2.341* .621’ .603** -3.472* -3.315* -7.351’
(.lQ6) (.307) (.313) (.3 19) (1.233) C.385) (.379f CHRT7579 -1.287’ -.876+ ,050 .656* -2.923* -2.563* -7.120*
(.152) (.240) (.204) (.214) (.541) (.285) (.273) CHRTSOX 1 -1.667* -. 158 -1.576* ,182 -5.427* -3.099” -6.369’
(.177) (.340) (.241) (.276) (.509) (.282) (.367) CHRT8288 -.965* .805* .709* 1.463* -4.742’ -3.186* -7.368*
f.146) ASIA(“)
(.244) j.175) (.182) (.470) (251) (.294) 2.283* (.115)
LCV -2.044* (.224)
AMERICA -1.073’ (.124)
MEXICO -5.884* 1.128)
Constant 11.369* 12.341’ 11.718* l I .564* 11.109* 11.678* l I ..502* 12.097* (.435) (.402) (.429) (.429) (.420) (.438) (.430) (.434)
RZ .04 .23 .04 .06 .08 .06 .07 .28 F 235.0. 388.6’ 64.3* 93.2* 110.4* 93.0* 96.6’ 483.9* Sample size 11345 18091 13611 13401 13121 11625 12632 12482
All of the regressions arc for pooled white native born men and the designated foreign born group, except for the “Natives” only analysis in column (I). (a) There were no cases in these category. (b) Asia excluding Laos, Cambodia and Vietnam (LCV) Standard errors in pharentheses. * Significant at 5 percent level, two-tailed test. *+ Significant at 10 percent level, two-tailed test. Omitted category for the immigration cohort dummies is U.S. natives. For the pooled equation, hoth natives and immi~ants from Europe & Canada are ommited. Current Population Survey, November 1979, April 1983, ,fune 1986, and June 1988.
240 QUARTERLY REVIEW OF ECONOMICS AND FINANCE
the schooling model for the pooled sample of both immigrants and the native- born adult white men. The coeffkients for cohort dummy variables indicate the schooling of immigrants relative to natives, which are the omitted “cohort” cate- gory in the pooled equations. In addition, the differences between the coefficients for recent immigrants and the other cohorts indicate the improve- ment or deterioration in schooling between these immigrant cohorts.
Among European/Canadian immigrants, the cohort coefficient is negative for the 1975-79 cohort, and positive for recent immigrants. In other words, while the schooling of European and Canadian immigrants of the late 1970s were lower by 0.9 years than that of the native born, those who arrived during 1982-88 have 0.8 years more schooling than the native born of the same age. Asian immigrants who arrived during the late 1970s but who are not from LCV had 0.7 years more schooling than the native-born. This schooling advantage has increased to 1.5 years among the immigrants of the 1982-88 cohort.
The Western Hemisphere pattern is quite different. Among Central and South American immigrants, immigrant cohorts of the late 1970s and the 1980s have a lower schooling level than the native born. The schooling disadvantage is larger among those arriving during 1982-88 (3.2 years) than among those arriv- ing during 1975-79 (2.6 years). Among Mexican immigrants there are no significant changes in the schooling of recent cohorts relative to those arriving during the late 1970s. During the entire period from the 1960s to the present the average schooling of Mexican immigrant cohorts was more than 7 years lower than that of adult white native-born men, except for the 1980-81 cohort for whom the differential was 6.4 years.
In summary, the regression analysis reveals a rise in the educational level of immigrants arriving during 1982-88, compared to both the native-born and immigrants of the 1970s. This improvement in the schooling of the recent cohort of immigrants is mainly due to the increase in the schooling of European/ Canadian and Asian immigrants (not including those from Laos, Cambodia and Vietnam). The schooling of Mexican immigrants is appreciably lower than that of the native born and has shown no significant trend over the last few decades, while the schooling level of Central and South American and Laos, Cambodian and Veitnamese immigrants has declined in the 1980’s.
V. SUMMARY AND CONCLUSION
This paper has analyzed the schooling attainment of adult male immigrants by immigrant cohort and region of origin using data pooled from four Current Population Surveys.
The analysis indicates that among the foreign born, Asian immigrants have a schooling level greater than that of the native born, while European/Canadian immigrants have a schooling level similar to the native born. Central and South
CHANGES IN EDUCATIONAL LEVELS OF IMMIGRANTS 241
American immigrants have a lower level of schooling, followed by those from Laos, Cambodia and Vietnam, with immigrants from Mexico having the lowest level.
Overall, the schooling level of male immigrants increased in the 1980s over the level in the 197Os, especially the early 1970s. Trends vary by region of ori- gin. The schooling level increased in the 1980s among those from Europe/ Canada and Asia, remained at a constant low level among Mexican immigrants, and declined among those from Central and South America and Laos, Cambo- dia and Vietnam.
The inequality of schooling among immigrants has been larger than among the native born, and has increased over the last few decades. The generally greater degree of inequality of schooling among immigrants analyzed within regions of origin and period of immigration in contrast to the native born is noteworthy. The increase in immigrant schooling inequality over time is largely due to the increase in between group means, as the within group inequality shows offsetting trends over time. The increasing share and high schooling level of Asian immigrants and the increasing share and low schooling level of Mexi- can immigrants has contributed to the overall increase in schooling inequality. There has been a thickening in both tails in the schooling distribution.
A key finding of this study is the new trend in the educational attainment of immigrants to the United States. While previous research suggested a trend of decline in the skills of immigrants arriving in the U.S. in the 197Os, this study demonstrates that this trend has been stopped and even reversed during the 1980s regarding immigrants overall and, in particular, from Europe/Canada and Asia. Europe/Canada and Asia accounted for over 60 percent of U.S. immigrants during the 1980s and they are responsible for the rise in the average schooling of all U.S. immigrants during the 1980s. Recent cohorts of Mexican immigrants have essentially the same schooling level as earlier cohorts. Only among Central and South American immigrants and Indochinese refugees was there a decline in the average schooling during the 1980s. The changes in the share of immi- grants from the major source regions and their schooling levels have contributed to an increase in the inequality of schooling among the foreign born.
Morz research is necessary for understanding these changes in the schooling distribution of the foreign born and the extent to which they are related to changes in the economic attractiveness of the U.S. to potential immigrants by level of education and to changes in U.S. immigration policies.
NOTES
*Direct all correspondence to: Yinon Cohen, Department of Labor Studies, Tel Aviv University, Tel Aviv, Israel.
242 QUARTERLY REVIEW OF ECONOMICS AND FINANCE
1. This interest earlier in this century was well expressed by the title of Paul Dou- glas’ 1919 article “Is the New Immigration More Unskilled than the OId?” and has been a subject of lively discussion since the rebirth of the immigrant adjustment literature after a 6 decade hiatus in Chiswick (1978).
2. A similar question is addressed in Funkhouser and Trejo (1995) also using sev- eral CPS surveys. This paper places a particular emphasis on analyses by country of ori- gin in contrast to the Funkhouser and Trejo study. In addition, unlike any previous study, it examines the trends in the inequality of schooling of immigrants, overall and by country of origin and period of immigration, Funkhouser and Trejo (1995) find that overall the schooling level of new immigrants declined in the 1970s but increased in the 1980s. Barrett (1996) comes to a similar conclusion on immigrant skill using data on the occupational attainment of immigrants as reported at the time of application for a visa, which is generally their occupation in the country of origin.
3. Using the very large samples in the decennial census, Chiswick and Sullivan (1995) show that the very small group of immigrants from Africa have an educational attainment that exceeds that of even Asian immigrants.
4. The F-ratio for testing the hypothesis of the equality of the variance in schooling for the foreign born and the native born is:
where the subscript 1 designates one group and the subscript 2 designates the other. For a native born variance of 9.24 (the square of 3.04) and sample size in excess of 11,000, the critical F-ratio at the 5 percent level is a function of the foreign born sample size:
Foreign Born Sample Size Critical Value
24 1.53 100 1.26 500 1.13
REFERENCES
Bachu, Amora and Martin O’Connell. 1984. “Developing Current Fertility Indicators for Foreign-Born Women from the Current Population Survey.” Review of Public Data Use, 12: 185-195.
Barrett, Alan. (1996). “Did the Decline Continue? Comparing the Labor-Market Quality of the United States Immigrants from the Late 1970’s and Late 1980’s” Journal of Population Economics, 9: 55-63.
Borjas, George. 1987. “Self-Selection and the Earnings of Immigrants,” American Economic Review, 77: 531-553.
-. 1990. Friends or Strangers: The Impact of immigrants on the U.S. Economy. New York: Basic Books.
Chiswick, Barry R. 1978. “The Effect of ~ericanization on the Earnings of Foreign Born Men,” Journal of Political Economy, 86(5): 897-92 1.
p. 1986. “Is the New Immigration Less Skilled Than the Old?,” Journul of Labor Economics, 4: 168-192.
CHANGES IN EDUCATIONAL LEVELS OF IMMIGRANTS 243
Chiswick, Barry R., Yinon Cohen and Tzippi Zach. 1997. “The Labor Market Status of Immigrants: Effects of the Unemployment Rate at Arrival and Duration of Residence.” Industrial and Labor Relations Review, 52(2): 289-303.
Chiswick, Barry R. and Paul W. Miller. 1994. “The Determinants of Post-Immigration Investments in Education,” Economics ofEducation Review, 13(2): 163-177.
Chiswick, Barry R. and Teresa A. Sullivan. 1995. “The New Immigrants.” Pp. 22-270 in State of the Union: America in the 1990s. Volume Two: Social Trends, edited by Reynolds Farley. New York: Russell Sage Foundation. .
Douglas, Paul H. 1919. “Is the New Immigration More Unskilled than the Old?“Journal of the American Statistical Association, lb(June): 393-403.
Funkhouser, Edward and Stephen J. Trejo. 1995. “The Labor Market Skills of Recent Immigrants: Evidence from the CPS,” Industrial and Labor Relations Review, 48(4): 792-811.
Hashmi, Aliya. 1987. Post-Migration Investments in Education by Immigrants in the United States. Ph.D. Dissertation, University of Illinois at Chicago.
Jasso, Guillermina and Mark R. Rosenzweig. 1990. The New Chosen People: Immigrants in the United States. New York: Russell Sage Foundation.
Khan, Aliya Hashmi. 1997. “Post-Migration Investments in Education by Immigrants in the United States.” In Essays on the Economics of Immigrant Skills and Adjustment, Quarterly Review of Economics and Finance,(Special Issue): 285-3 13.
Levy, Frank. 1995. “Incomes and Income Inequality.” Pp. l-58 in State of the Union: America in the 1990’s, Vol. 1, Economic Trends. New York: Russell Sage Foundation.
Passel, Jeffrey S. and Karen A. Woodrow. 1987. “Changes in the Undocumented Alien Population in the U.S., 1979-1983,” International Migration Review 21: 1304-1334.
Portes, Alejandro and Ruben G. Rambaut. 1990. Immigrant America. Berkeley: University of California Press.
Reimers, David M. 1982. “Recent Immigration Policy: An Analysis.” Pp. 13-53 in The Gateway: U.S. Immigration Issues and Policies, edited by Barry R. Chiswick. Washington, D.C.: American Enterprise Institute.
Schultz, T. Paul. 1984. “The Schooling and Health of Children of U.S. Immigrants and Natives.” PP. 251-288 in Research in Population Economics, Vol. 5, edited by T. Paul Shultz. Greenwich, CT: JAI Press.