Examining the complexity of educational attainment for Black ...
Upload
khangminh22Category
view
2download
0
1
Document Classification: Public
An analysis of educational attainment in Malta
Tiziana M. Gauci1
Policy Note
June 2021
1 Tiziana M. Gauci is a senior Research Economist at the Economic Research Department of the Central Bank of Malta. The author would like to thank Prof. Edward Scicluna, Mr Alexander Demarco, Dr Aaron G. Grech and Dr Brian Micallef for their helpful comments. The views expressed in this paper are those of the author and do not necessarily reflect those of the Central Bank of Malta. Any errors are the author’s own.
Any queries or requests should be sent to [email protected].

2
Document Classification: Public
Abstract
This study looks at the trends in educational attainment of the Maltese population over the last 15 years.
Data obtained from the Labour Force Survey (LFS) show that the educational attainment of the Maltese
workforce has ameliorated significantly during this period, though it still falls short of the European Union
(EU) benchmarks in some respects. The first part of this study looks at the long-term trends in education
attainment in Malta and how it compared with other EU countries. In terms of EU targets, Malta had
reached its national target with respect to the percentage of persons aged between 30 and 34 years
having a tertiary level of education already in 2017. On the contrary, despite the country managed to
half the rate of early school leavers from its 2005 levels, the rate of early school leavers in 2020 is still
short of the EU’s benchmark. The second part compares the earnings, employment and unemployment
of high skilled workers compared to those with lower levels of education. The third section looks at the
main factors behind the increase in education attainment. The share of the population having a tertiary
level of education increased to 28.0% in 2020, up from 10.3% in 2005. In addition, this section attempts
to measure the efficiency of public spending in Malta, with indicators for primary, secondary and tertiary
indicators, as well as the role of migration.
JEL classification: I21, I26, J24
Keywords: educational attainment, skills, public spending, Malta

3
Document Classification: Public
Table of contents
Executive summary ................................................................................................................................. 4
What are the trends in educational attainment? ..................................................................................... 6
What are the economic consequences of educational attainment on individuals? .............................. 16
What lies behind the increase in educational attainment? .................................................................... 22
4
Document Classification: Public
Executive summary
This study looks at the trends in the educational attainment of the Maltese population over the last 15
years. Data obtained from the Labour Force Survey (LFS) show that the educational attainment of the
Maltese workforce has ameliorated significantly during this period, though it still falls short of the
European Union (EU) benchmarks in some respects. In this light, this policy note attempts to answer
three questions:
i) What are the trends in educational attainment?
Since EU membership, Malta has registered a significant improvement in educational attainment. The
share of population having a tertiary level of education almost trebled between 2005 and 2020, from
10.3% to 28.0%. Persons aged between 25 and 34 years are the most highly educated while older
generations have a lower level of education with the vast majority of those between 55 and 64 having a
basic level of education. Amongst the younger generation, one in five persons have achieved a basic
level of education at best. The EU regards upper secondary education as the minimum desirable
educational attainment level for its citizens and has set targets in this respect (Eurostat, 2020a). In 2017,
Malta reached its national target with respect to the percentage of persons aged between 30 and 34
years having a tertiary level of education, having more than 33% of the population with a high level of
education. Malta has managed to half the rate of early school leavers from 33.0% in 2005 to 16.7% in
2020, though still short of the EU’s benchmark, which stands at 10%, with men tending to leave
education and training earlier than women. Early school leaving is believed to lead to several problems
in the labour market. While early school leavers may still find a job, lacking basic qualifications
compromises employability later in life due to lacking skills and has economic and social costs. The
rising role of women in society and in the labour market, together with the increasing share of foreigners,
have proved decisive in ameliorating Malta’s overall education level. The improvement in education is
also reflected in the HDI index following an increase in the mean and expected years of schooling.
Participation in life-long learning is also on the increase with Malta exceeding the EU 27 average in
recent years.
ii) What are the economic consequences of educational attainment on individuals?
Through education, individuals gain skills that will make them more productive in performing their work
tasks. In general, people with higher levels of education earn more than others with lower levels of
education, have better job prospects and a smaller chance of being unemployed. Moreover, education
may increase individuals’ ability to deal with changing conditions, thereby enhancing employability in
times of rapid technological changes. Data for 2018 shows that the median gross hourly earnings for
those with a tertiary level of education were 40% higher than the median earnings of those with a
secondary level of education and 65% more than those with only a basic level of education. Employment
rates of those with a tertiary level of education have consistently been higher than for those with a low
5
Document Classification: Public
and medium level of education while the opposite holds true in case of unemployment rates. By reducing
unemployment and increasing earnings, improvements in human capital can also help to avoid poverty,
reduce social exclusion and inequality. The Covid-19 pandemic highlighted further the importance of
education given that the pandemic hit the less-educated workers the hardest. While the employment
rates of those with a medium and high level of education increased in 2020, the employment rate of
those with a low level of education declined. At the same time, the increase in the unemployment rate
for those with a basic level of education was larger than that for other workers.
iii) What lies behind the increase in educational attainment?
The improvement in educational attainment in recent years follows the increased focus on education
and significant investment that was directed towards this sector. Malta invests heavily in education with
general government expenditure exceeding the EU average, demonstrating the strong commitment
towards education and training. Between 2012 and 2019, Malta recorded the second highest growth
rate amongst EU 27 Member States with respect to government expenditure on education with spending
increasing by 70%. Analysing the input-output relationship for different levels of schooling shows that
public expenditure in Malta appears relatively efficient at the primary level of schooling but less so at
the secondary level. In case of tertiary level, Malta has a high graduation ratio although this is achieved
at a high level of expenditure, partly because of the relatively generous students’ maintenance grants
offered.
The strong investment in the education sector was met with major changes in the Maltese labour market
following the country’s accession to the EU. As of 2004, Malta had the lowest female participation rate
amongst EU countries. Following several initiatives aimed at attracting more females to join the labour
market, coupled with other structural factors, the female employment rate rose consistently. As more
women joined the labour market, potential earnings from education increased, incentivising more
women to invest in their education which led to a higher share of the population having a tertiary level
of education. Migration has also played a role in the educational attainment of the Maltese workforce
with the inflow of foreign workers contributing to rising attainment levels. Most foreigners employed in
Malta, the majority of whom are below 40 years of age, have a medium or high level of education.
Looking at the occupational structure, we find that today, there is a smaller share of foreigners employed
in top occupations, despite increasing in absolute terms, and a bigger concentration employed in the
lower end of the occupation spectrum. Foreigners face several obstacles in putting their skills to use in
the host country. This seems to hold especially for third-country nationals (TCNs) residing in Malta,
whereby over a half of TCNs are employed in elementary occupations and as services & sales workers,
jobs that are not usually associated with a tertiary level of education. On the other hand, Maltese
nationals are increasingly occupying higher-end jobs and as of 2019 over 40% of nationals were
employed as managers, professionals or technicians.
6
Document Classification: Public
What are the trends in educational attainment?
The OECD defines human capital as “the knowledge, skills, competencies and other attributes
embodied in individuals that are employed in the creation of individual, social and economic well-being”
(OECD, 2001, p. 18). The most common approach used for measuring skills is the indirect approach,
where qualifications are used to measure skills supply. Official qualifications only certify skills developed
in formal education programmes and, thus, do not cover soft skills acquired by individuals outside of the
formal education system. While such skills are increasingly becoming more important, they are very
difficult to measure. It is therefore important to complement information on formal educational attainment
and training with information on participation in non-formal educational activities and in lifelong learning.
The analysis in this study will be based on the International Standard Classification of Education
(ISCED) 2011 classification which is the standard framework used to categorise and report comparable
education statistics internationally. 2 This framework enables comparisons across countries and allows
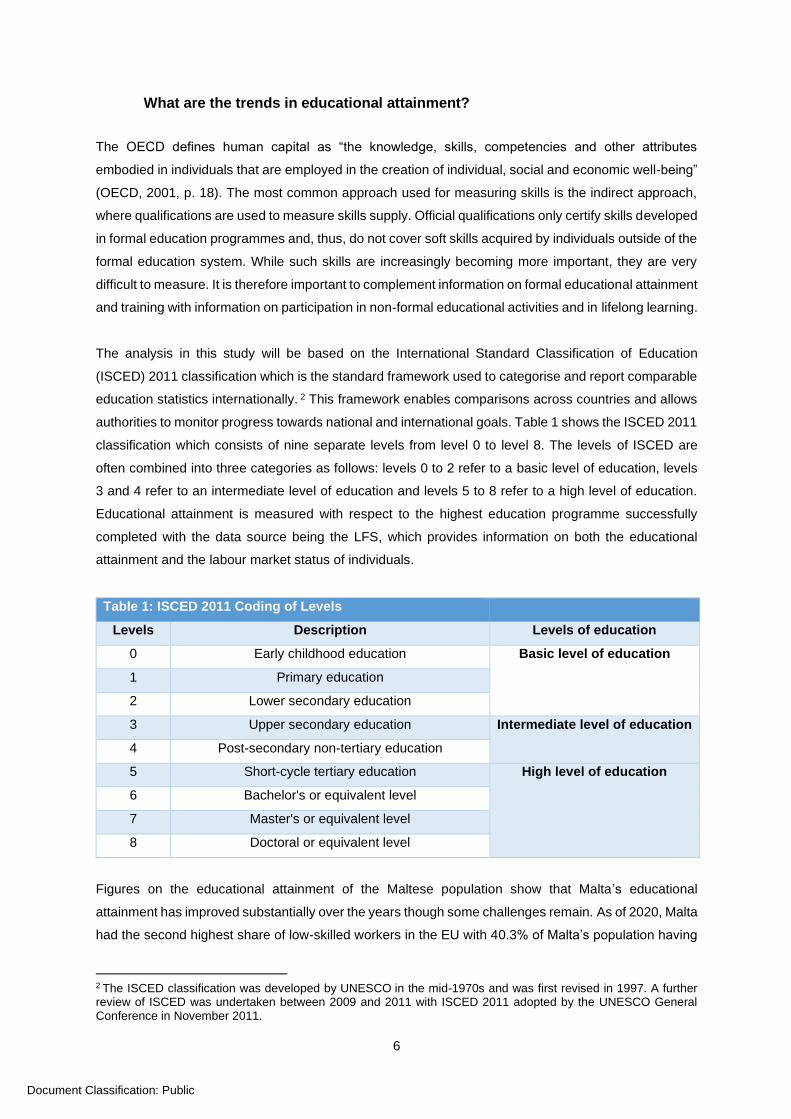
authorities to monitor progress towards national and international goals. Table 1 shows the ISCED 2011
classification which consists of nine separate levels from level 0 to level 8. The levels of ISCED are
often combined into three categories as follows: levels 0 to 2 refer to a basic level of education, levels
3 and 4 refer to an intermediate level of education and levels 5 to 8 refer to a high level of education.
Educational attainment is measured with respect to the highest education programme successfully
completed with the data source being the LFS, which provides information on both the educational
attainment and the labour market status of individuals.
Table 1: ISCED 2011 Coding of Levels
Levels Description Levels of education
0 Early childhood education Basic level of education
1 Primary education
2 Lower secondary education
3 Upper secondary education Intermediate level of education
4 Post-secondary non-tertiary education
5 Short-cycle tertiary education High level of education
6 Bachelor's or equivalent level
7 Master's or equivalent level
8 Doctoral or equivalent level
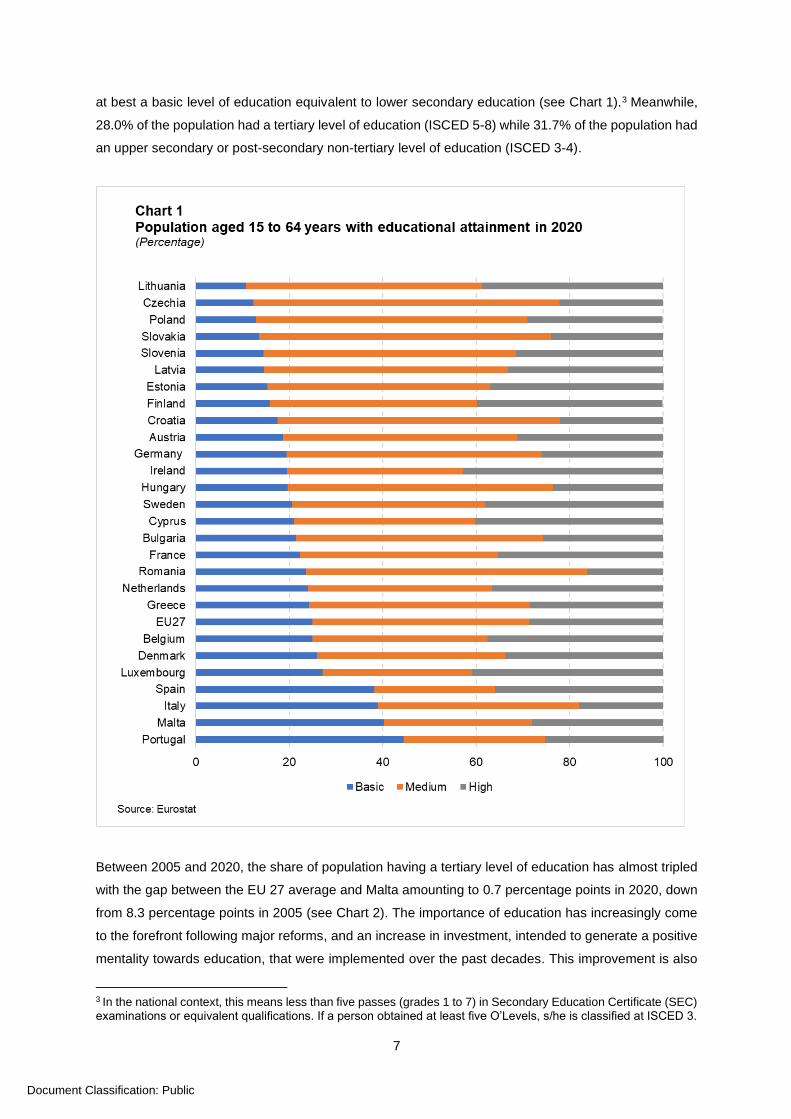
Figures on the educational attainment of the Maltese population show that Malta’s educational
attainment has improved substantially over the years though some challenges remain. As of 2020, Malta
had the second highest share of low-skilled workers in the EU with 40.3% of Malta’s population having
2 The ISCED classification was developed by UNESCO in the mid-1970s and was first revised in 1997. A further review of ISCED was undertaken between 2009 and 2011 with ISCED 2011 adopted by the UNESCO General Conference in November 2011.
7
Document Classification: Public
at best a basic level of education equivalent to lower secondary education (see Chart 1).3 Meanwhile,
28.0% of the population had a tertiary level of education (ISCED 5-8) while 31.7% of the population had
an upper secondary or post-secondary non-tertiary level of education (ISCED 3-4).
Between 2005 and 2020, the share of population having a tertiary level of education has almost tripled
with the gap between the EU 27 average and Malta amounting to 0.7 percentage points in 2020, down
from 8.3 percentage points in 2005 (see Chart 2). The importance of education has increasingly come
to the forefront following major reforms, and an increase in investment, intended to generate a positive
mentality towards education, that were implemented over the past decades. This improvement is also
3 In the national context, this means less than five passes (grades 1 to 7) in Secondary Education Certificate (SEC) examinations or equivalent qualifications. If a person obtained at least five O’Levels, s/he is classified at ISCED 3.

8
Document Classification: Public
attributed to the rising role of women in the labour market, reflecting several policy initiatives (see
Micallef, 2018) and a cultural change that led a greater number of females to further their studies. In
fact, since 2009 the percentage of females with a tertiary level of education has consistently exceeded
the male counterpart with the share of women tertiary graduates increasing to 30.0% in 2020, from 9.6%
in 2005. For men, increases in tertiary educational attainment have progressed at a slightly slower pace
– from 11.1% to 26.3% over the same period. An increasing share of foreign population, which has a
relatively higher share of people with tertiary qualifications and a smaller share of people with lower
secondary education, has also contributed to the improvement in Malta’s overall education level
(European Commission, 2016).
Table 2 shows that persons aged between 25 and 34 years are the most highly educated mirroring also
the situation in the EU27. In fact, 40% of those aged between 25 and 34 had a tertiary level of education.
On the other hand, the older generations have a lower level of educational attainment with 65% of those
between 55 and 64 having a basic level of education. Amongst the younger generation, those between
20 and 24 years, almost one in five persons have achieved a basic level of education at best. Knoppe
(2018) finds that the level of education differs substantially between different generations, but each
generation has reached higher education levels than the previous one leading to an upward trend in
education of the Maltese labour force. Nonetheless, Eurostat (2013) observes that low levels of
education are persistent in Malta. While in the EU there is a movement, mainly to an intermediate level
of education, for those with parents with a low level of education, this was not the case for Malta. In fact,
almost 75% of the respondents whose parents had a low level of education had a low level of education
themselves. This was the highest persistence across the EU countries indicating that children belonging
to parents with low education face bigger obstacles to transition to a higher level of education.

9
Document Classification: Public
Table 2: Educational attainment in Malta by age cohorts as of 2020 (Percentage)
20-24 25-34 35-44 45-54 55-64
ISCED Level
Levels 0-2 18.9 29.2 38.1 45.0 65.0
Levels 3-4 57.4 30.6 26.7 30.9 18.8
Levels 5-8 23.7 40.2 35.2 24.0 16.1
Source: Eurostat
The EU regards upper secondary education as the minimum desirable educational attainment level for
its citizens with the EU’s educational targets being interlinked with other Europe 2020 goals (Eurostat,
2020a). Early school leaving can lead to several problems in the labour market – the most important of
which are related to unemployment and the risk of poverty or social exclusion. Eurostat defines early
school leaving as the percentage of the population aged between 18 and 24 years having achieved
secondary education or less (ISCED 0-2) and who were not pursuing further education or training in the
previous four weeks. In this respect, the EU set-out two education-related targets in 2010, as part of
eight headline indicators, to be reached by 2020 as part of Europe 2020 strategy – i) for the share of
early school leavers to be reduced to 10% and ii) for at least 40% people aged 30 to 34 to have
completed tertiary or equivalent education. These targets were then translated into national targets,
reflecting different situations and circumstances. Malta adopted the same target in respect of early
school leavers but set out the target in respect of tertiary educational attainment for 30- to 34-year-olds
to 33%.
The share of early school leavers has fallen continuously in Malta, from 33.0% in 2005 to 16.7% in 2020
(see Chart 3).4 Reducing early school leaving is a priority for the country and, in recent years, there has
been increased emphasis on tackling early-school leavers (Ministry for Education and Employment,
2014). The decline in early school leaving follows the reduction in secondary school absenteeism which
has declined from around 30% in 2013 to 22% in 2017 (Directorate-General for Education, Youth, Sport
and Culture, 2019). Also, in a bid to respond to different educational needs, as of 2019, secondary
school students have the option to choose between general, vocational or applied subjects. While
reductions in early school leaving can be observed for both men and women, men tend to leave
education and training earlier than women, a trend that is also observed in other Member States. Despite
the improvement in the rate of early school leavers, Malta is the furthest adrift from its target (by 6.7
percentage points) among the EU27 and has the highest rate of early school leavers (see Chart 4). 15
countries had reached their national target in 2020.
4 In 2013, after discussions with Eurostat, the NSO carried out a re-mapping exercise, whereby persons who obtained at least five O’Levels were classified in ISCED 3. Prior to the re-mapping exercise these persons were categorised in ISCED 2. Using this new criterion, the rate of early school leavers was revised downwards. For more information see NSO (2013). Also, in 2017, there is a break-in-series due to a modification in the national LFS question relating to life-long learning. The change was intended to better capture any lifelong learning being undertaken by LFS respondents which also affects the rate of early school leavers.

10
Document Classification: Public
Research has shown that labour market trends, apart from other factors such as social-economic status,
affect early school leaving decisions. In particular, studies have found that the unemployment rate has
a positive impact on enrolment in post-secondary education (Pissarides, 1981; Clark, 2011). This is in
line with the opportunity cost argument whereby high rates of unemployment reduce the cost of
remaining in education and so increase post-compulsory enrolment (Tumino and Taylor, 2013). Given
the strong growth experienced by the Maltese economy in recent years, unemployment rates fell to
record lows. In such circumstances, the incentive to invest in one’s education may have declined, in
part explaining why the rate of early school leavers has remained high in Malta. Even though leaving
11
Document Classification: Public
school with a basic level of education, data shows that most early school leavers in Malta were still
employed. In fact, almost seven out of ten early school leavers in Malta were employed in 2020, the
highest employment rate of early school leavers across the EU. On the other hand, less than half of
early school leavers in the EU were employed. This suggests that the despite the lack of official
qualifications, early school leavers in Malta may still possess skills that are relevant for the labour
market. Nonetheless. lacking basic qualifications compromises employability later in life and has
economic and social costs (Cedefop, 2017).
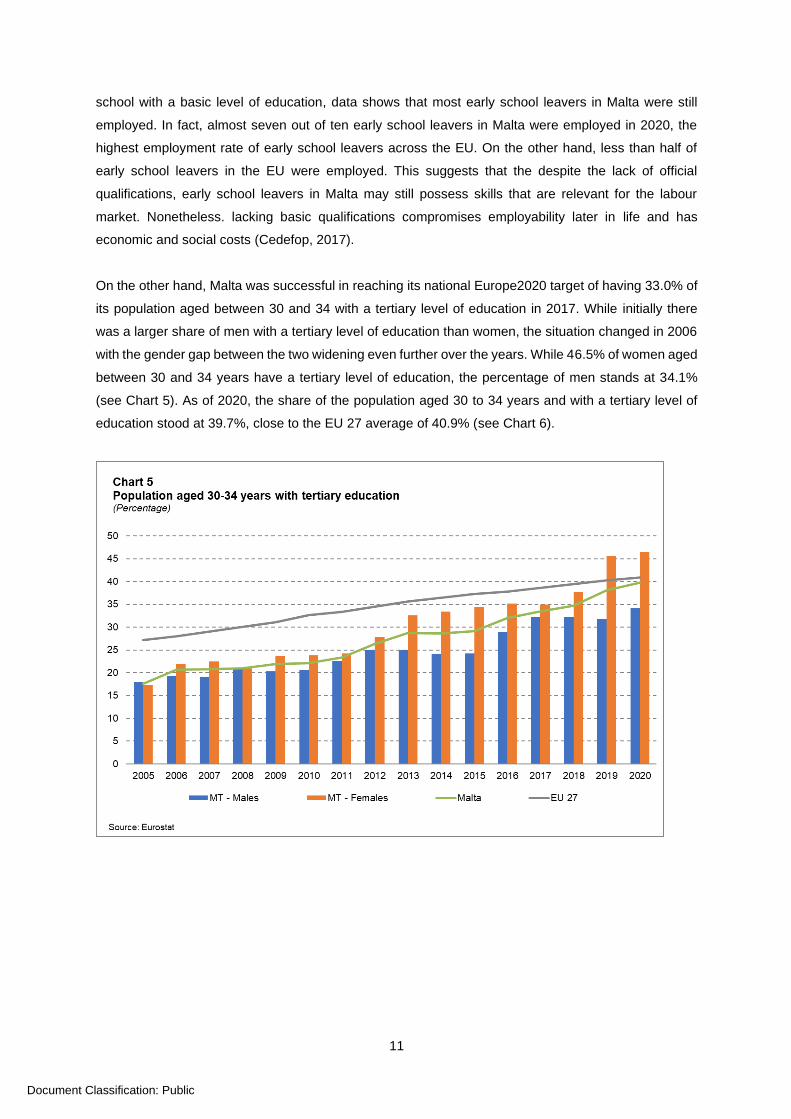
On the other hand, Malta was successful in reaching its national Europe2020 target of having 33.0% of
its population aged between 30 and 34 with a tertiary level of education in 2017. While initially there
was a larger share of men with a tertiary level of education than women, the situation changed in 2006
with the gender gap between the two widening even further over the years. While 46.5% of women aged
between 30 and 34 years have a tertiary level of education, the percentage of men stands at 34.1%
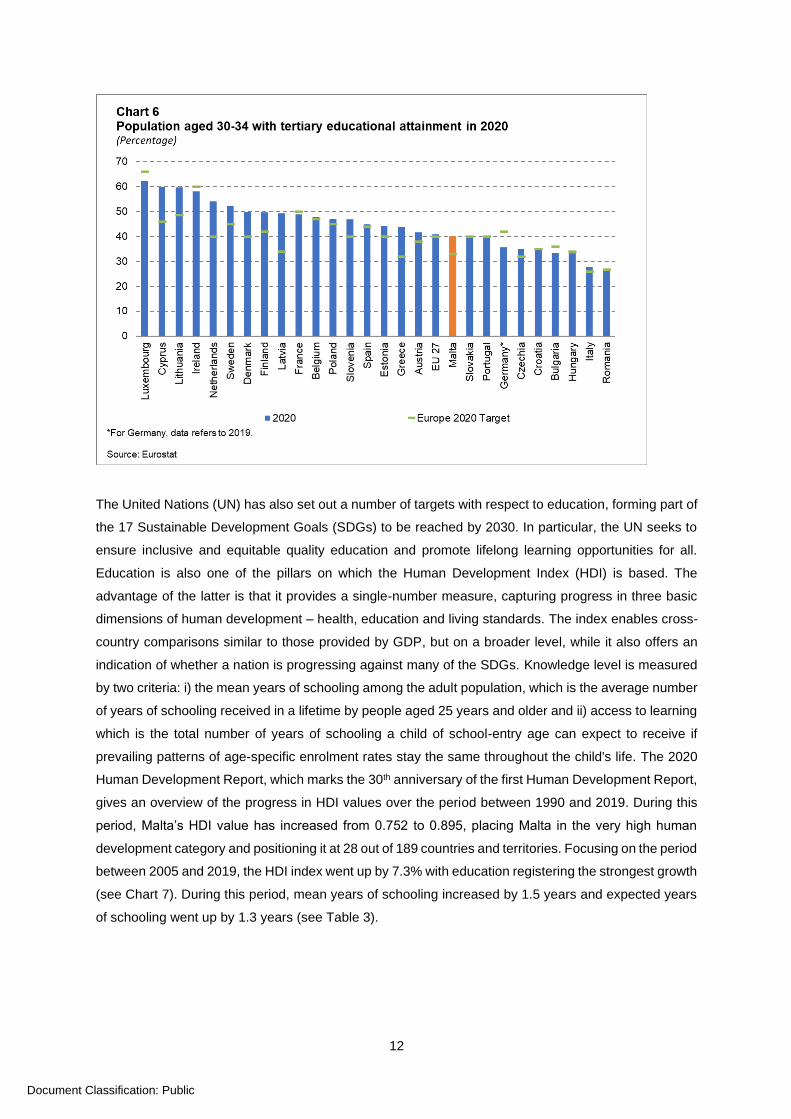
(see Chart 5). As of 2020, the share of the population aged 30 to 34 years and with a tertiary level of
education stood at 39.7%, close to the EU 27 average of 40.9% (see Chart 6).
12
Document Classification: Public
The United Nations (UN) has also set out a number of targets with respect to education, forming part of
the 17 Sustainable Development Goals (SDGs) to be reached by 2030. In particular, the UN seeks to
ensure inclusive and equitable quality education and promote lifelong learning opportunities for all.
Education is also one of the pillars on which the Human Development Index (HDI) is based. The
advantage of the latter is that it provides a single-number measure, capturing progress in three basic
dimensions of human development – health, education and living standards. The index enables cross-
country comparisons similar to those provided by GDP, but on a broader level, while it also offers an
indication of whether a nation is progressing against many of the SDGs. Knowledge level is measured
by two criteria: i) the mean years of schooling among the adult population, which is the average number
of years of schooling received in a lifetime by people aged 25 years and older and ii) access to learning
which is the total number of years of schooling a child of school-entry age can expect to receive if
prevailing patterns of age-specific enrolment rates stay the same throughout the child's life. The 2020
Human Development Report, which marks the 30th anniversary of the first Human Development Report,
gives an overview of the progress in HDI values over the period between 1990 and 2019. During this
period, Malta’s HDI value has increased from 0.752 to 0.895, placing Malta in the very high human
development category and positioning it at 28 out of 189 countries and territories. Focusing on the period
between 2005 and 2019, the HDI index went up by 7.3% with education registering the strongest growth
(see Chart 7). During this period, mean years of schooling increased by 1.5 years and expected years
of schooling went up by 1.3 years (see Table 3).

13
Document Classification: Public
Table 3: Malta’s HDI trends in education
Year Expected years of schooling
Mean years of schooling
Education index
HDI value
2005 14.8 9.8 0.737 0.834
2006 14.4 9.8 0.729 0.832
2007 14.6 9.9 0.734 0.837
2008 14.4 10 0.733 0.839
2009 14.6 10.2 0.744 0.840
2010 15.3 10.3 0.769 0.853
2011 14.9 10.5 0.763 0.853
2012 15.0 10.8 0.777 0.860
2013 15.2 11.0 0.789 0.867
2014 15.4 11.1 0.798 0.874
2015 15.4 11.2 0.802 0.880
2016 15.7 11.3 0.813 0.885
2017 15.8 11.3 0.816 0.888
2018 16.1 11.3 0.824 0.894
2019 16.1 11.3 0.825 0.895
Source: United Nations Development Programme
Several studies have shown that higher educational attainment is bound to translate into better working
conditions including the flexibility to telework (Drucker and Khattak, 2000; Bureau of Labour Statistics,
2019). The latter has proved itself to be an important aspect of ensuring business continuity during the
Covid-19 pandemic. Though the number of people teleworking part-time or on a full-time basis has
increased gradually over the years, the pandemic has fast-tracked the adoption of teleworking
modalities by employers. Figures for Malta from the National Statistics Office (NSO) show that, prior to
mid-March 2020, only 12% of all employed persons were working from home. By end-March, this rose
to 33% with the share being sustained in April (NSO, 2020). A similar scenario was witnessed in several
14
Document Classification: Public
countries (Eurofound, 2020). Interestingly, the study by Eurofound finds that the strongest single
correlate of working from home during the crisis was the educational level of the employee. In fact,
three-quarters of employees with tertiary qualifications (74%) worked from home, compared to 34% of
those with secondary qualifications and 14% of those with primary education only. The occupation
structure of the population also plays a role as countries with a large proportion of jobs in sectors such
as ICT, professional services, finance, and insurance can mobilise a greater proportion of the workforce
from home, whereas countries with a heavy reliance on sectors such as manufacturing, agriculture,
construction and tourism are less able to do so (ILO, 2020). Debono (2021) estimates Malta’s telework
potential under three different scenarios and finds that Malta’s potential to work from home exceeds that
of the EU under all three scenarios given the structure of its industry, with a large share of service-
oriented sectors whose occupations are more conducive to remote working arrangements.
In the context of globalisation and technological change, together with demographic and industry
developments, the structure of the labour markets and the skill requirements in advanced economies,
including Malta, are rapidly changing. Due to the rising demand for highly skilled employees, it is
increasingly important to boost the skills of low skilled workers. Predictions of future skills need in Europe
suggest that in the coming years only one in ten jobs will be within reach for those with a basic level of
education as the demand for those with low qualifications is projected to fall as more employers seek
highly skilled employees (Cedefop, 2018). In this regard, upskilling and on-the-job training as part of
lifelong-learning schemes could prove to be an alternative to formal education and help individuals to
progress further up in their careers, or find alternative employment, even at stages where they are
unlikely to return to formal education.
Lifelong learning refers to the process that learning in not limited to a single, specific phase, in life but
also happens in different contexts, over the course of a lifetime, including those taken outside the formal
educational sector (European Parliamentary Research Service, 2021). In this regard, the EU has set
out the ET2020 framework, a strategic framework for European cooperation in education and training,
with one of the four main objectives being to make lifelong learning a reality.5 The framework sets out a
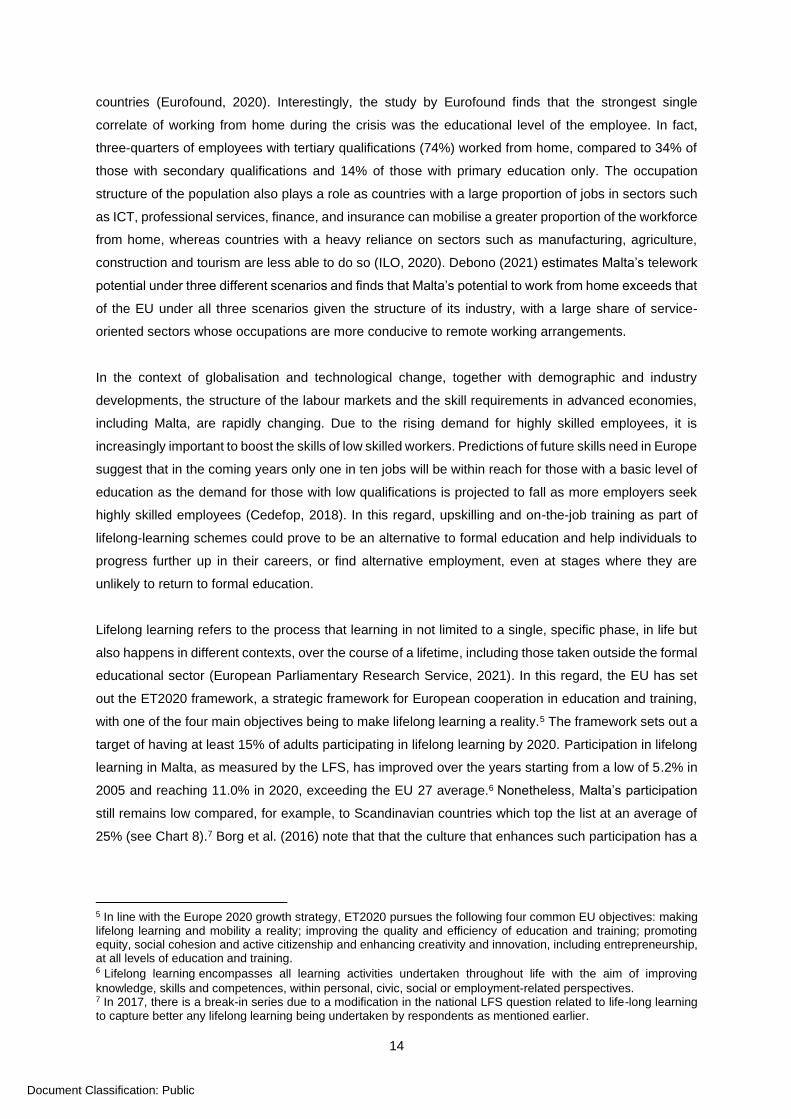
target of having at least 15% of adults participating in lifelong learning by 2020. Participation in lifelong
learning in Malta, as measured by the LFS, has improved over the years starting from a low of 5.2% in
2005 and reaching 11.0% in 2020, exceeding the EU 27 average.6 Nonetheless, Malta’s participation
still remains low compared, for example, to Scandinavian countries which top the list at an average of
25% (see Chart 8).7 Borg et al. (2016) note that that the culture that enhances such participation has a
5 In line with the Europe 2020 growth strategy, ET2020 pursues the following four common EU objectives: making lifelong learning and mobility a reality; improving the quality and efficiency of education and training; promoting equity, social cohesion and active citizenship and enhancing creativity and innovation, including entrepreneurship, at all levels of education and training. 6 Lifelong learning encompasses all learning activities undertaken throughout life with the aim of improving
knowledge, skills and competences, within personal, civic, social or employment-related perspectives. 7 In 2017, there is a break-in series due to a modification in the national LFS question related to life-long learning to capture better any lifelong learning being undertaken by respondents as mentioned earlier.
15
Document Classification: Public
short history in Malta, with the country not having similar traditions to those of Scandinavian countries,
for example.
Turning to the linguistic capabilities, Malta has registered a decline in the linguistic capabilities of its
citizens. In 2007, 28.1% of employed persons could speak three languages or more, placing Malta with
the highest-ranking European countries in terms of linguistic capabilities.8 Data for 2016, the latest
available, shows that only 18.6% of those employed reported to know three languages or more. One
reason may be related to more diversified entertainment and media sources following the introduction
of pluralism in television in 1993, which offered viewers a larger variety of programmes in Maltese and
in English. This has led to a considerable reduction in exposure to the Italian language and,
consequently, decreased competence in Italian (Caruana, 2003).
8 The knowledge of foreign languages is self-reported by the respondents and there were no actual tests of proficiency.
16
Document Classification: Public
What are the economic consequences of educational attainment on individuals?
Through education, individuals can gain skills that will make them more productive in performing their
work tasks. This usually translates into higher earnings and enhanced job opportunities. Moreover,
education may increase individuals’ ability to deal with changing conditions, thereby enhancing
employability in times of rapid technological changes (Schultz, 1975). Policymakers have tried to boost
the educational attainment of citizens as education is also bound to alleviate poverty, reduce social
exclusion and cut inequality in society (Woessman, 2014). These implications will have an effect at the
national level as, ultimately, growth in a nation’s productivity is closely tied to that of its workforce. There
are also other costs associated with a lower level of education, including lower levels of health, higher
levels of anxiety and social costs such as increased criminal activities (Barnardos, 2009; Wolfe and
Haveman, 2002). Empirical evidence strongly supports these theoretical considerations, both at the
individual and macro level (OECD and Statistics Canada, 2000; Vinod and Kauchik, 2007; Holland et
al., 2013).
a) Educational attainment and earnings
Productivity is affected by many factors including the education level attained and the skills that the
workers possess. If an individual with a higher human capital contributes a larger marginal product to
the production process of a firm, it is expected that the firm will pay the person a higher wage, although
the financial return to education may vary considerably across individuals and the degree obtained
(Walker and Zhu, 2003).
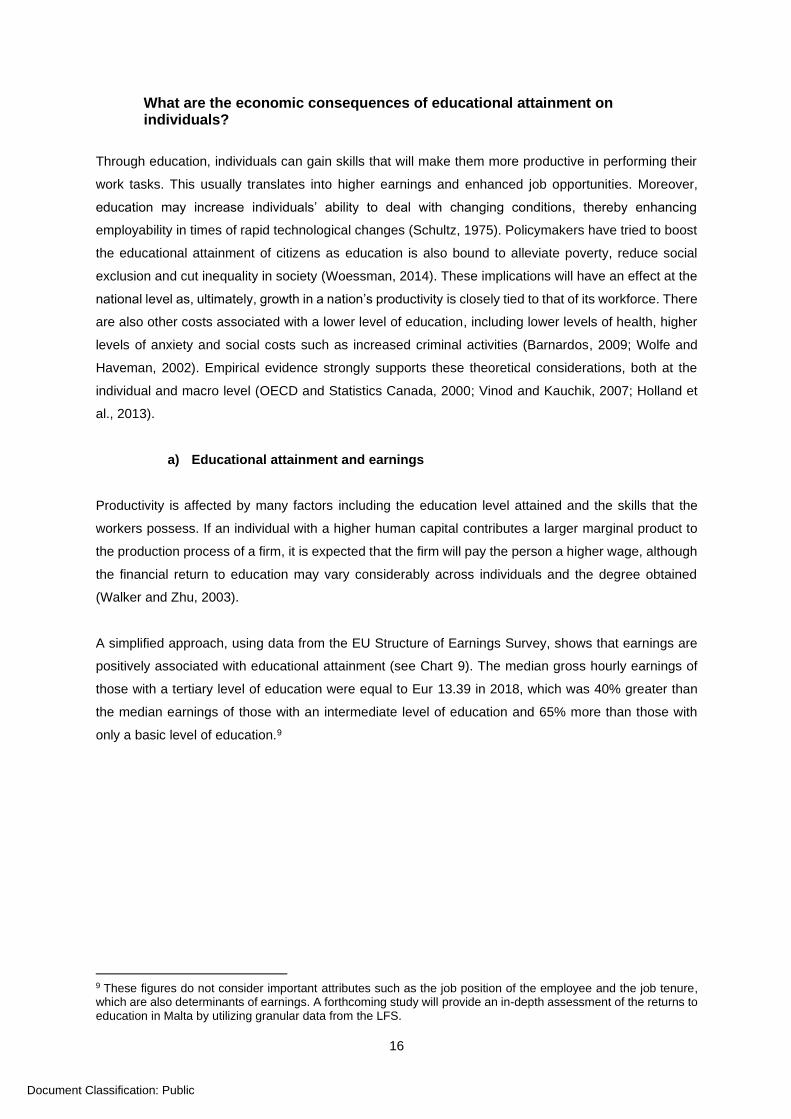
A simplified approach, using data from the EU Structure of Earnings Survey, shows that earnings are
positively associated with educational attainment (see Chart 9). The median gross hourly earnings of
those with a tertiary level of education were equal to Eur 13.39 in 2018, which was 40% greater than
the median earnings of those with an intermediate level of education and 65% more than those with
only a basic level of education.9
9 These figures do not consider important attributes such as the job position of the employee and the job tenure, which are also determinants of earnings. A forthcoming study will provide an in-depth assessment of the returns to education in Malta by utilizing granular data from the LFS.

17
Document Classification: Public
b) Educational attainment and employment rates
Education levels and employment rates are correlated with the employment rate of those with a high
education being generally the highest, followed by those with a medium level of education and finally
those with a low the level of education (OECD, 1989; Psacharopoulos and Tzannatos, 1991; Kennedy
and Hedley, 2003). Data obtained from the LFS shows that the employment rate for persons aged
between 15 and 64 with a higher education qualification was 89.4% as at 2020, 14.2 percentage points
higher than that of people with a medium level of education and 27.6 percentage points higher than that
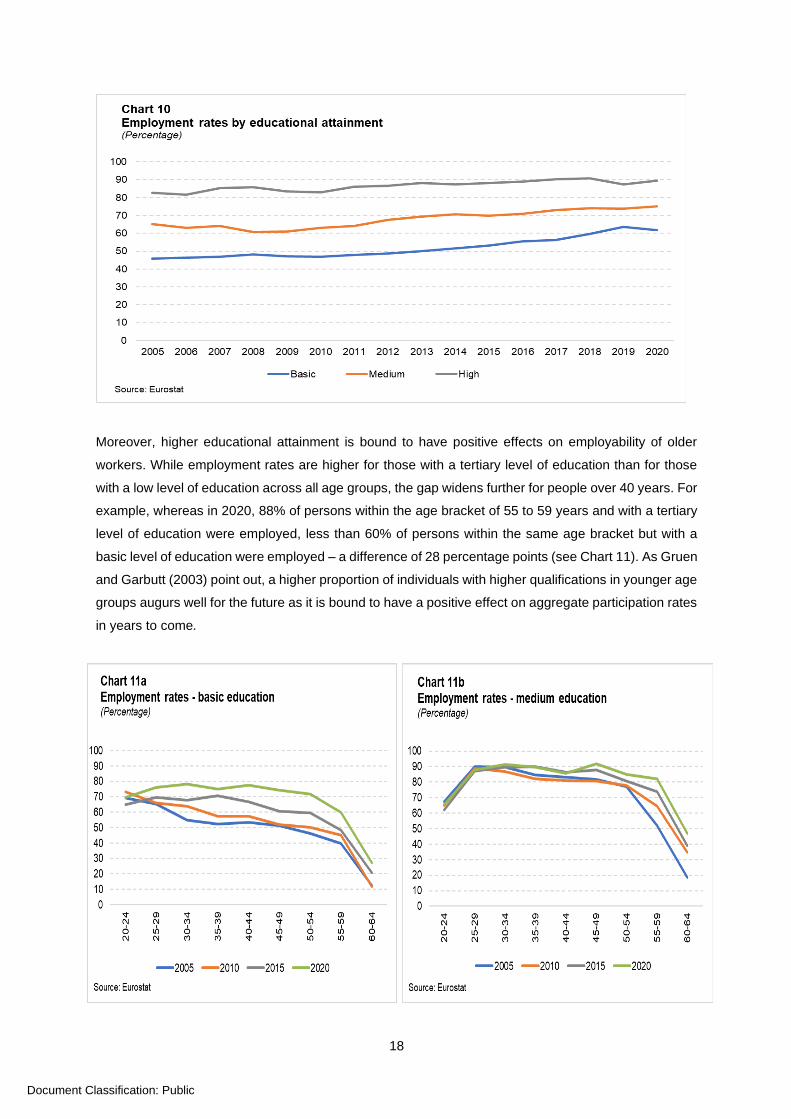
of people with a basic level of education (see Chart 10). While the employment rates of those with a
medium and high-level of education rose in 2020, the employment rate for those with a low level of
education declined suggesting that the Covid-19 pandemic hit the less-educated workers the hardest.
Amongst the hardest hit sectors were the wholesale, retail, accommodation, food and beverage service
activities, sectors which typically do not require workers to have a tertiary level of education, and which
require workers to be physically present at the workplace most of the time. Darvas (2020) shows that
the inequality between low-educated and tertiary-educated workers was experienced in all EU countries,
highlighting the fact that the pandemic increased income inequality.
18
Document Classification: Public
Moreover, higher educational attainment is bound to have positive effects on employability of older
workers. While employment rates are higher for those with a tertiary level of education than for those
with a low level of education across all age groups, the gap widens further for people over 40 years. For
example, whereas in 2020, 88% of persons within the age bracket of 55 to 59 years and with a tertiary
level of education were employed, less than 60% of persons within the same age bracket but with a
basic level of education were employed – a difference of 28 percentage points (see Chart 11). As Gruen
and Garbutt (2003) point out, a higher proportion of individuals with higher qualifications in younger age
groups augurs well for the future as it is bound to have a positive effect on aggregate participation rates
in years to come.

19
Document Classification: Public
Overall employment rates and trends mask important gender differences. OECD (2016) notes that
gender employment gaps exist across all levels of education but tend to be widest among men and
women with low levels of education. The gender gap in employment rates narrows as educational
attainment increases. This is also the case for Malta whereby low educated females are much more
likely to be out of employment than males (see Chart 12).10 As of 2020, the employment rate of men
with a basic education exceeded 76% while that of women was much lower at around 44%, implying a
gender gap of 32 percentage points. Gender gaps at medium and higher educational attainment levels
are narrower at 10.7 percentage points and 6.4 percentage points, respectively. Following the increase
in the Maltese female labour force participation, the gender gaps in employment rates have narrowed
progressively.
10 Undeclared work is a feature of the Maltese labour market. The employment rate of women with a low level of education may be higher than officially recorded if these women engage in work which goes unrecorded.

20
Document Classification: Public
c) Educational attainment and unemployment
Data obtained from the LFS shows that the unemployment rate is higher for persons with lower levels
of education when compared with persons having a tertiary level of education (see Chart 13), a
phenomenon that can also be observed for all other EU Member States. The unemployment rate for
those with a basic level of education has, on average, been around four times higher in the last 16 years
than the corresponding rate for the highly skilled. The unemployment rate for those with a medium level
qualification, although higher than the rate for high skilled people, has, on average, been around half of
the unemployment rate of those with a basic level of education. Women tend to record a higher
unemployment rate than men, a situation which is also observed in most other EU countries (Eurostat,
2020b).

21
Document Classification: Public
In recent years, following the robust economic growth registered by the Maltese economy coupled with
the initiatives taken by the authorities to reduce unemployment, the unemployment rate has fallen to a
historical low. Through targeted initiatives, individuals with a basic level of education have been
identified and received individual attention and traineeships to help them enter the labour market.
Consequently, the unemployment rate of low skilled people has halved between 2013 and 2019.
Nonetheless, a discrepancy in the unemployment rate of highly skilled and low skilled people still
persisted. This is in line with ILO’s (2016) analysis on educational attainment and unemployment
whereby the authors conclude that higher levels of education tend to protect workers from
unemployment in high income economies. Following the Covid-19 pandemic, unemployment rates
edged up. However, the increase was much bigger for those persons with a basic level of education
than for the rest. The unemployment rate for the former increased by 1.5 percentage points between
2019 and 2020 while the unemployment rate for those with a medium and high-level of education went
up by 0.3 percentage points.
Data from OECD also shows that there is also a correlation between the educational attainment and
the duration of unemployment. In general, those with a low level of education take longer to find a job
than those with a higher level of education. This difference is persistent across all age groups and
worsens the older a person is.
22
Document Classification: Public
What lies behind the increase in educational attainment?
The improvement in educational attainment in recent years follows the increased focus on education
and significant investment that was directed towards this sector. As in other EU Member States, the
funding of education in Malta mainly comes from government, with a smaller role for private sources
(Eurostat, 2020c). Malta invests heavily in education as shown by general government expenditure on
education. Data covering formal education, administered jointly by the UNESCO Institute for Statistics,
OECD and Eurostat, referred to as “UOE” data, shows that among the EU Member States, Malta has
registered amongst the highest rate of increase for government expenditure on education.11 Between
2012 and 2018, the latest date for which data are available, Malta increased its expenditure on
education by over 50% or by around 7.5% each year.
COFOG data presents another source of information on public expenditure on education.12 Government
expenditure on education in Malta was among the highest in the EU, in relative terms, as of 2019 and
exceeded the EU 27 average both as a proportion of GDP (MT 5.3% vs EU 27 4.7%) and as a proportion
of total general government expenditure (MT 14.2% vs EU 27 10.0%), demonstrating the strong
commitment to education and training. Over the period 2012-2019, Malta recorded the second highest
growth rate amongst EU 27 Member States with respect to government expenditure on education with
spending increasing by 70%. Wages and salaries of education personnel represent the largest share of
expenditure. In fact, as of 2019, compensation of employees meaning wages, salaries and employers’
social contributions for personnel accounted for around 60% of expenditure. Intermediate consumption,
meaning purchases of goods and services, accounted for around 9% of government expenditure while
14.5% was in the form of other current transfers. The latter incorporates payments to private schools.
Capital investments accounted for around 10% of education expenditure which was higher than the EU
27 average of 7%.
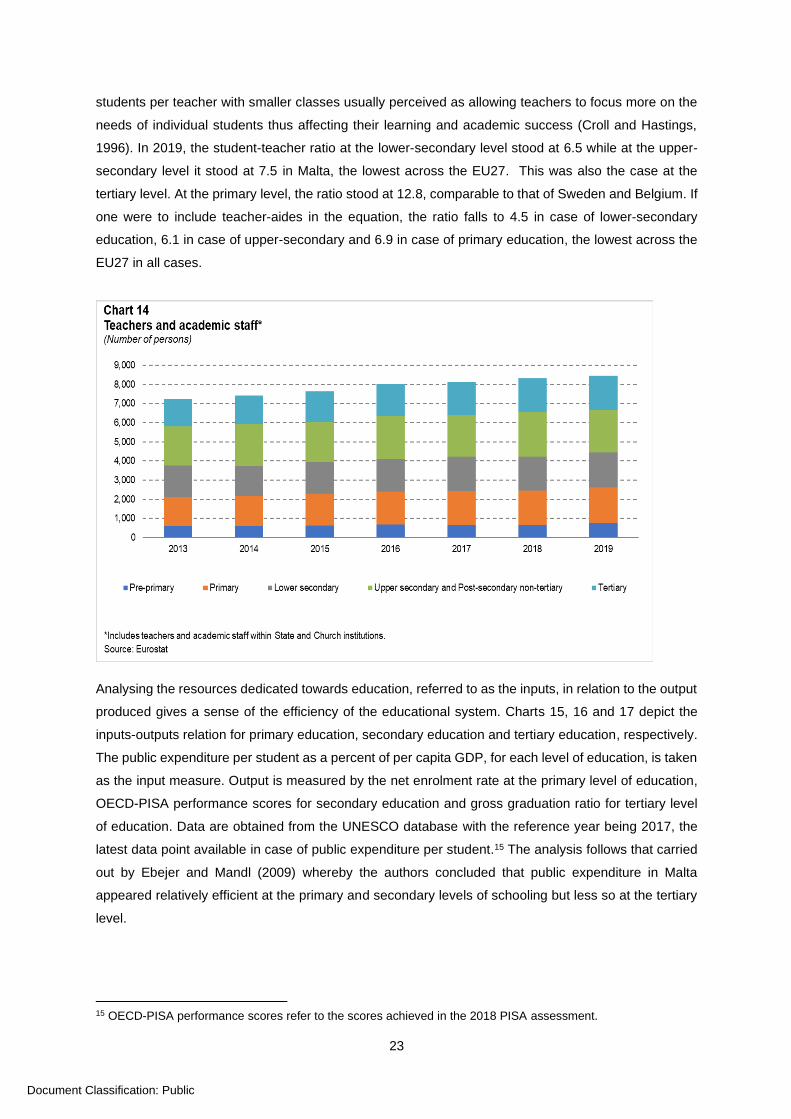
The number of educational personnel has grown consistently between 2013 and 2019, with teachers
and academic staff amounting to 8,459 in 2019 (see Chart 14).13 Education personnel includes also
non-teaching staff with the latter amounting to over 8,000 in 2019, with almost half being teacher aides,
up from around 5,000 in 2013.14 The latter refers to personnel who support teachers in providing
instruction to students and includes Learning Support Educators (LSEs) and technical officers amongst
others. Malta has amongst the lowest student-teacher ratios when compared to other EU countries. The
student-teacher ratio is an indirect measure of educational quality. It refers to the average number of
11 Data for 2018 were not available for a number of countries. 12 There are strong links between COFOG and UOE data collection. Both are based on ISCED although COFOG relies on ISCED 1997 whilst UOE has adopted ISCED 2011. The main difference concerns expenditure on pre-primary education. Furthermore, COFOG covers non-formal education whereas UOE focuses only on formal education. In this regard, educational programmes designated as “adult education” (e.g. literacy programmes for adults) are excluded from UOE but not COFOG. Also, there are differences in the treatment of R&D expenditure. For more information, see Eurostat (2019). 13 This figure refers to teachers and academic staff within State and Church institutions whose wage bill is footed by the government. 14 This figure refers non-academic staff within State, Church and Private institutions.
23
Document Classification: Public
students per teacher with smaller classes usually perceived as allowing teachers to focus more on the
needs of individual students thus affecting their learning and academic success (Croll and Hastings,
1996). In 2019, the student-teacher ratio at the lower-secondary level stood at 6.5 while at the upper-
secondary level it stood at 7.5 in Malta, the lowest across the EU27. This was also the case at the
tertiary level. At the primary level, the ratio stood at 12.8, comparable to that of Sweden and Belgium. If
one were to include teacher-aides in the equation, the ratio falls to 4.5 in case of lower-secondary
education, 6.1 in case of upper-secondary and 6.9 in case of primary education, the lowest across the
EU27 in all cases.
Analysing the resources dedicated towards education, referred to as the inputs, in relation to the output
produced gives a sense of the efficiency of the educational system. Charts 15, 16 and 17 depict the
inputs-outputs relation for primary education, secondary education and tertiary education, respectively.
The public expenditure per student as a percent of per capita GDP, for each level of education, is taken
as the input measure. Output is measured by the net enrolment rate at the primary level of education,
OECD-PISA performance scores for secondary education and gross graduation ratio for tertiary level
of education. Data are obtained from the UNESCO database with the reference year being 2017, the
latest data point available in case of public expenditure per student.15 The analysis follows that carried
out by Ebejer and Mandl (2009) whereby the authors concluded that public expenditure in Malta
appeared relatively efficient at the primary and secondary levels of schooling but less so at the tertiary
level.
15 OECD-PISA performance scores refer to the scores achieved in the 2018 PISA assessment.
24
Document Classification: Public
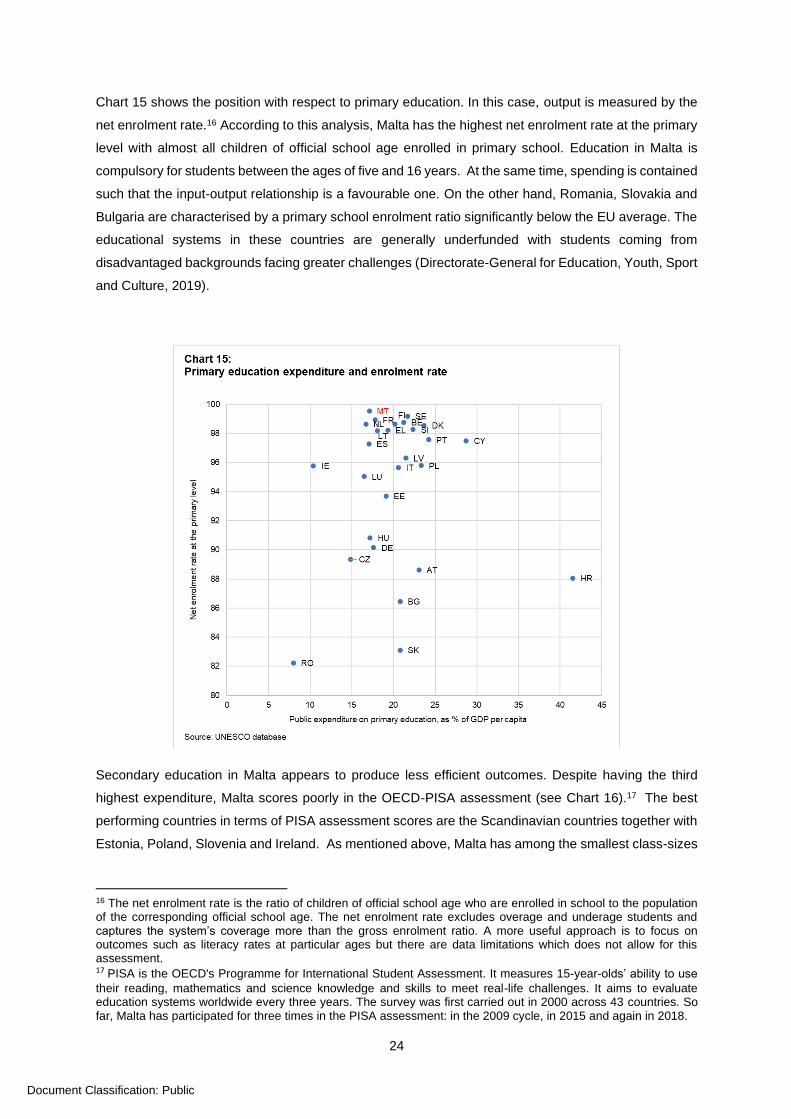
Chart 15 shows the position with respect to primary education. In this case, output is measured by the
net enrolment rate.16 According to this analysis, Malta has the highest net enrolment rate at the primary
level with almost all children of official school age enrolled in primary school. Education in Malta is
compulsory for students between the ages of five and 16 years. At the same time, spending is contained
such that the input-output relationship is a favourable one. On the other hand, Romania, Slovakia and
Bulgaria are characterised by a primary school enrolment ratio significantly below the EU average. The
educational systems in these countries are generally underfunded with students coming from
disadvantaged backgrounds facing greater challenges (Directorate-General for Education, Youth, Sport
and Culture, 2019).
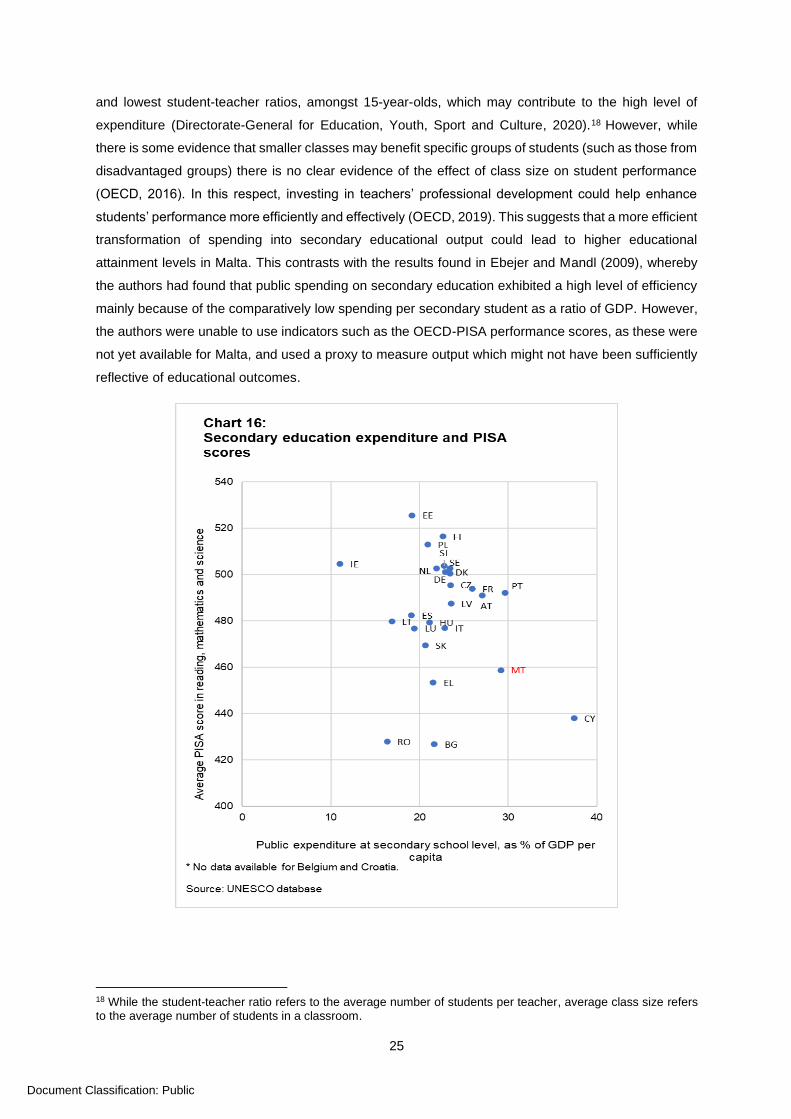
Secondary education in Malta appears to produce less efficient outcomes. Despite having the third
highest expenditure, Malta scores poorly in the OECD-PISA assessment (see Chart 16).17 The best
performing countries in terms of PISA assessment scores are the Scandinavian countries together with
Estonia, Poland, Slovenia and Ireland. As mentioned above, Malta has among the smallest class-sizes
16 The net enrolment rate is the ratio of children of official school age who are enrolled in school to the population of the corresponding official school age. The net enrolment rate excludes overage and underage students and captures the system’s coverage more than the gross enrolment ratio. A more useful approach is to focus on outcomes such as literacy rates at particular ages but there are data limitations which does not allow for this assessment. 17 PISA is the OECD's Programme for International Student Assessment. It measures 15-year-olds’ ability to use
their reading, mathematics and science knowledge and skills to meet real-life challenges. It aims to evaluate education systems worldwide every three years. The survey was first carried out in 2000 across 43 countries. So far, Malta has participated for three times in the PISA assessment: in the 2009 cycle, in 2015 and again in 2018.
25
Document Classification: Public
and lowest student-teacher ratios, amongst 15-year-olds, which may contribute to the high level of
expenditure (Directorate-General for Education, Youth, Sport and Culture, 2020).18 However, while
there is some evidence that smaller classes may benefit specific groups of students (such as those from
disadvantaged groups) there is no clear evidence of the effect of class size on student performance
(OECD, 2016). In this respect, investing in teachers’ professional development could help enhance
students’ performance more efficiently and effectively (OECD, 2019). This suggests that a more efficient
transformation of spending into secondary educational output could lead to higher educational
attainment levels in Malta. This contrasts with the results found in Ebejer and Mandl (2009), whereby
the authors had found that public spending on secondary education exhibited a high level of efficiency
mainly because of the comparatively low spending per secondary student as a ratio of GDP. However,
the authors were unable to use indicators such as the OECD-PISA performance scores, as these were
not yet available for Malta, and used a proxy to measure output which might not have been sufficiently
reflective of educational outcomes.
18 While the student-teacher ratio refers to the average number of students per teacher, average class size refers to the average number of students in a classroom.
26
Document Classification: Public
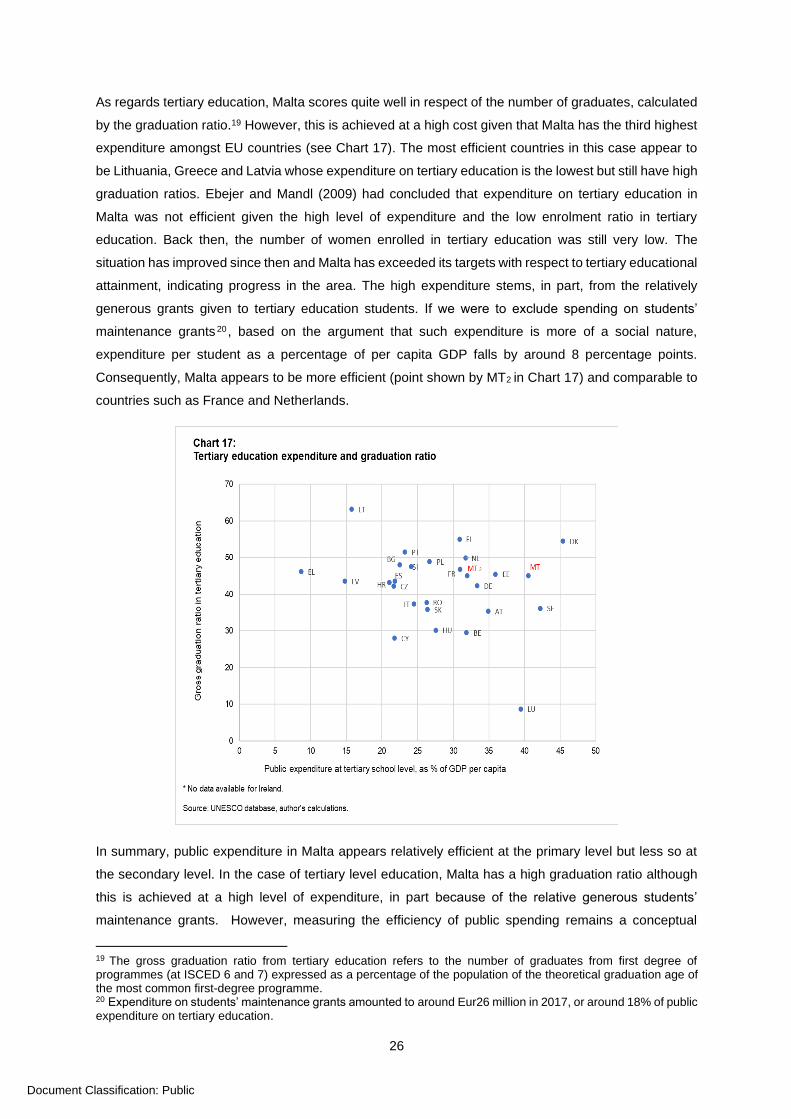
As regards tertiary education, Malta scores quite well in respect of the number of graduates, calculated
by the graduation ratio.19 However, this is achieved at a high cost given that Malta has the third highest
expenditure amongst EU countries (see Chart 17). The most efficient countries in this case appear to
be Lithuania, Greece and Latvia whose expenditure on tertiary education is the lowest but still have high
graduation ratios. Ebejer and Mandl (2009) had concluded that expenditure on tertiary education in
Malta was not efficient given the high level of expenditure and the low enrolment ratio in tertiary
education. Back then, the number of women enrolled in tertiary education was still very low. The
situation has improved since then and Malta has exceeded its targets with respect to tertiary educational
attainment, indicating progress in the area. The high expenditure stems, in part, from the relatively
generous grants given to tertiary education students. If we were to exclude spending on students’
maintenance grants 20 , based on the argument that such expenditure is more of a social nature,
expenditure per student as a percentage of per capita GDP falls by around 8 percentage points.
Consequently, Malta appears to be more efficient (point shown by MT2 in Chart 17) and comparable to
countries such as France and Netherlands.
In summary, public expenditure in Malta appears relatively efficient at the primary level but less so at
the secondary level. In the case of tertiary level education, Malta has a high graduation ratio although
this is achieved at a high level of expenditure, in part because of the relative generous students’
maintenance grants. However, measuring the efficiency of public spending remains a conceptual
19 The gross graduation ratio from tertiary education refers to the number of graduates from first degree of programmes (at ISCED 6 and 7) expressed as a percentage of the population of the theoretical graduation age of the most common first-degree programme. 20 Expenditure on students’ maintenance grants amounted to around Eur26 million in 2017, or around 18% of public expenditure on tertiary education.
27
Document Classification: Public
challenge and there is no simple relationship between overall spending on education and student
performance. Public spending has multiple objectives while output cannot be quantified in monetary
terms thus complicating the analysis. For instance, the share of expenditure may be inflated by
measures designed to mitigate inequities which at face value may seem inefficient but may be
necessary to reach other objectives. Analysing the input-output relationships is the simplest form of
examining efficiency and a more in-depth analysis, covering all aspects of the educational sector, would
be required to truly determine the efficiency of the system. 21
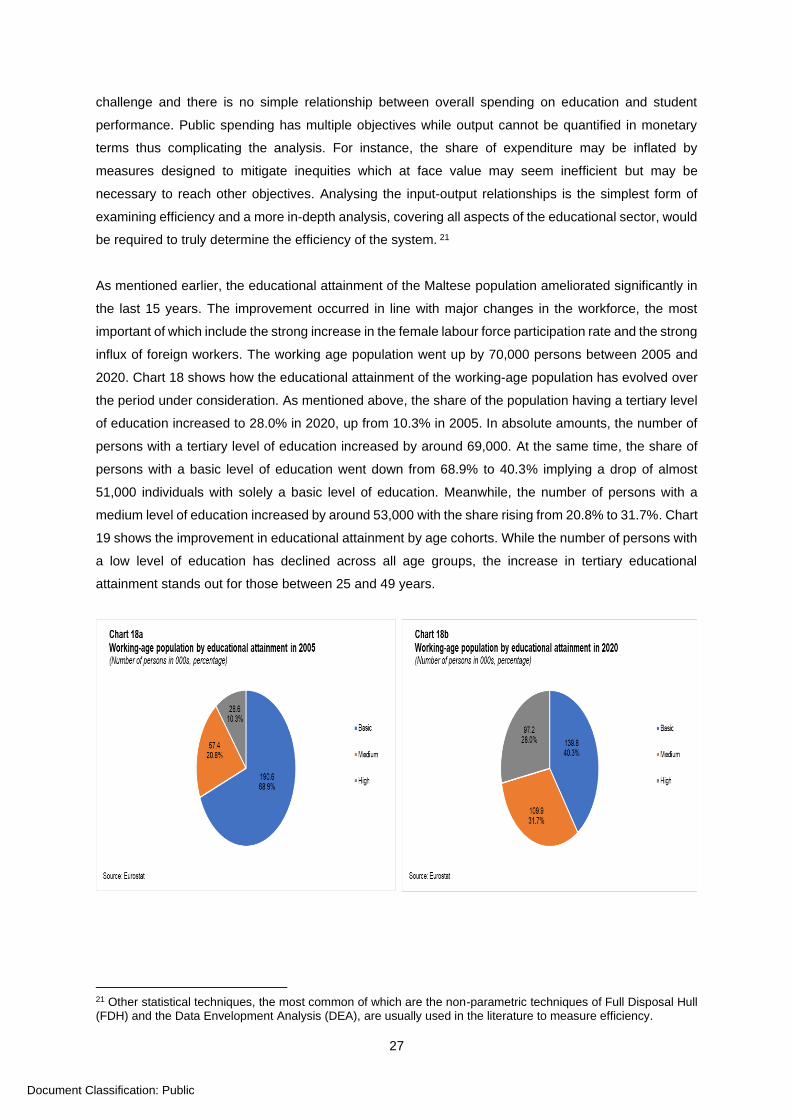
As mentioned earlier, the educational attainment of the Maltese population ameliorated significantly in
the last 15 years. The improvement occurred in line with major changes in the workforce, the most
important of which include the strong increase in the female labour force participation rate and the strong
influx of foreign workers. The working age population went up by 70,000 persons between 2005 and
2020. Chart 18 shows how the educational attainment of the working-age population has evolved over
the period under consideration. As mentioned above, the share of the population having a tertiary level
of education increased to 28.0% in 2020, up from 10.3% in 2005. In absolute amounts, the number of
persons with a tertiary level of education increased by around 69,000. At the same time, the share of
persons with a basic level of education went down from 68.9% to 40.3% implying a drop of almost
51,000 individuals with solely a basic level of education. Meanwhile, the number of persons with a
medium level of education increased by around 53,000 with the share rising from 20.8% to 31.7%. Chart
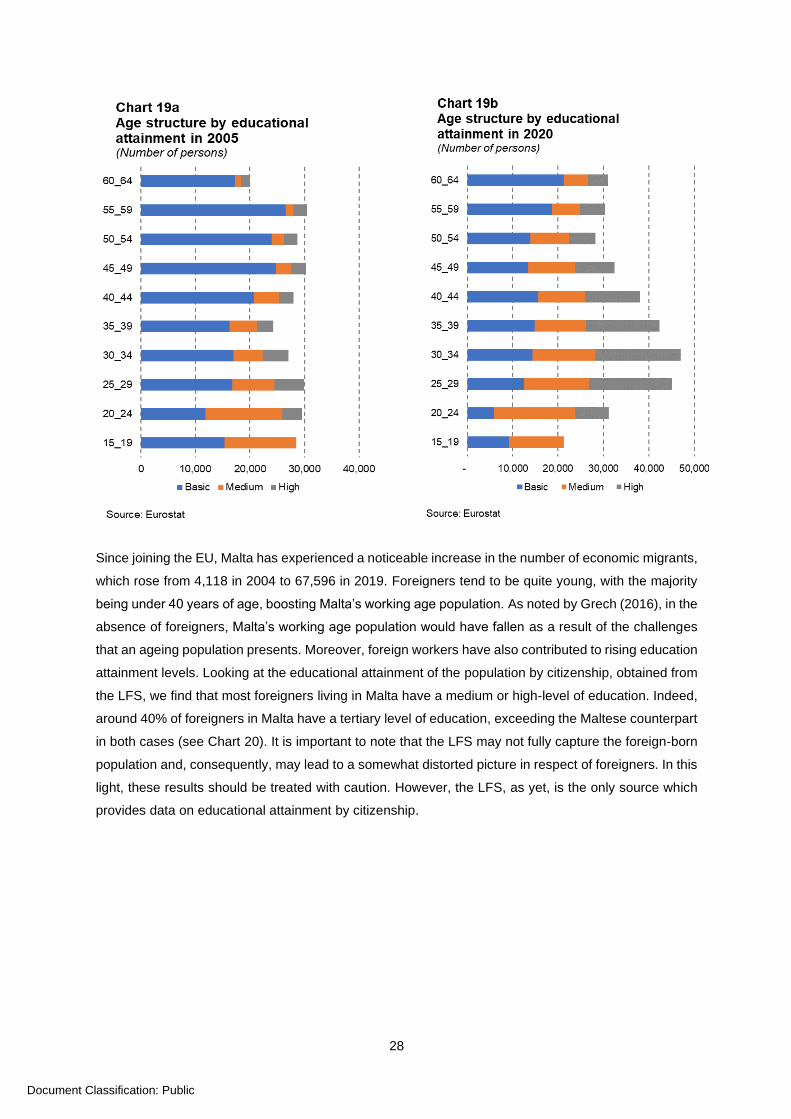
19 shows the improvement in educational attainment by age cohorts. While the number of persons with
a low level of education has declined across all age groups, the increase in tertiary educational
attainment stands out for those between 25 and 49 years.
21 Other statistical techniques, the most common of which are the non-parametric techniques of Full Disposal Hull (FDH) and the Data Envelopment Analysis (DEA), are usually used in the literature to measure efficiency.
28
Document Classification: Public
Since joining the EU, Malta has experienced a noticeable increase in the number of economic migrants,
which rose from 4,118 in 2004 to 67,596 in 2019. Foreigners tend to be quite young, with the majority
being under 40 years of age, boosting Malta’s working age population. As noted by Grech (2016), in the
absence of foreigners, Malta’s working age population would have fallen as a result of the challenges
that an ageing population presents. Moreover, foreign workers have also contributed to rising education
attainment levels. Looking at the educational attainment of the population by citizenship, obtained from
the LFS, we find that most foreigners living in Malta have a medium or high-level of education. Indeed,
around 40% of foreigners in Malta have a tertiary level of education, exceeding the Maltese counterpart
in both cases (see Chart 20). It is important to note that the LFS may not fully capture the foreign-born
population and, consequently, may lead to a somewhat distorted picture in respect of foreigners. In this
light, these results should be treated with caution. However, the LFS, as yet, is the only source which
provides data on educational attainment by citizenship.

29
Document Classification: Public
As discussed above, the number of persons aged 15 to 64 with a high level of education increased by
around 69,000 between 2005 and 2020. This increase was driven by both higher education attainment
by Maltese students and the importation of skilled labour from abroad although data limitations do not
allow for a clear distinction between these two categories. For instance, the number of tertiary graduates
from Maltese institutions went up by around 58,000 between 2005 and 2020.22 However, this is likely to
overstate the share of the local increase in tertiary education as it includes foreign students that graduate
in Malta but subsequently return to their native country, individuals that graduated more than once (e.g.
obtaining a bachelors and Masters’ degree), and Maltese graduates that emigrated to pursue a career
abroad after their graduation. At the same time, disaggregated data by citizenship from LFS show that
most of the increase in the population during this period – irrespective of whether one looks at the total
population aged 15 to 64, the active population or the employed population – was driven primarily by
foreign labour, which as shown in Chart 20, tend to have a higher level of education attainment.
The improved attainment in case of Maltese nationals reflects, in part, the rising role of women following
a transformation in the role of women in society. On joining the EU, Malta had the lowest female
employment rate amongst EU countries. Raising the female participation rate was high on the agenda
and several reforms were implemented aimed at attracting more women to the labour market. As more
women joined the labour market, the potential earnings from higher education increased thus creating
an incentive for females to invest in their education. Indeed, women accounted for around 56% of the
increase in tertiary educational attainment of Maltese nationals between 2005 and 2020.
A common finding in the literature refers to the challenges faced by some categories of migrant workers
to access jobs consistent with their skills. Hence, one should look not only at the education level of
foreign workers but, perhaps more importantly, to their occupations in the destination country. Looking
22 This figure refers to graduates from institutions such as MCAST, ITS, University of Malta and public and private institutions offering courses at ISCED levels 5 to 8. This figure does not capture those who pursued their studies with, and consequently graduated from, foreign institutions. Data for 2020 is an estimate given that official data is not yet available.
30
Document Classification: Public
at the occupational classification structures, known as the International Standard Classification of
Occupations 2008 (ISCO 08) gives a representation of the types of jobs pursued by Maltese and
foreigners. This allows us to analyse how nationals and foreigners are putting their skills to use in Malta.
For this purpose, data on the occupation structure from Jobsplus, which is based on administrative data,
is used. While the LFS would have been the preferred data source, this was not possible because of
issues of under-representation of foreigners. In this regard, Jobsplus data is better suited to capture the
foreign workforce.
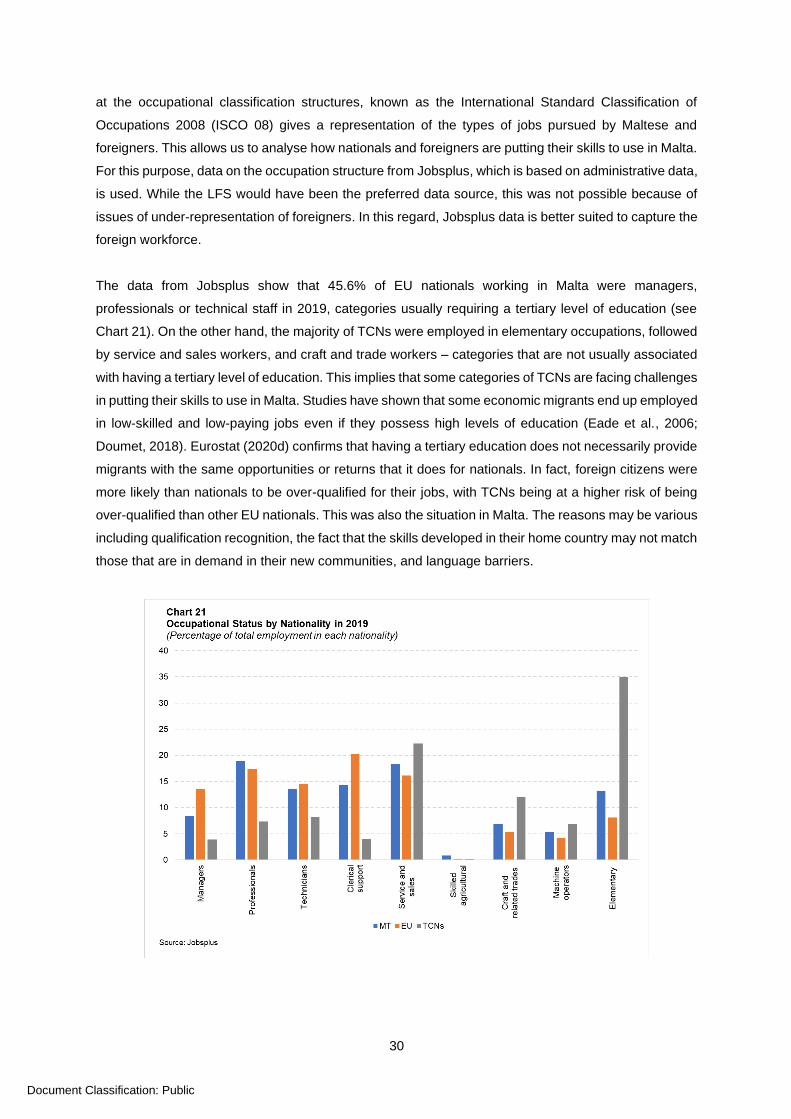
The data from Jobsplus show that 45.6% of EU nationals working in Malta were managers,
professionals or technical staff in 2019, categories usually requiring a tertiary level of education (see
Chart 21). On the other hand, the majority of TCNs were employed in elementary occupations, followed
by service and sales workers, and craft and trade workers – categories that are not usually associated
with having a tertiary level of education. This implies that some categories of TCNs are facing challenges
in putting their skills to use in Malta. Studies have shown that some economic migrants end up employed
in low-skilled and low-paying jobs even if they possess high levels of education (Eade et al., 2006;
Doumet, 2018). Eurostat (2020d) confirms that having a tertiary education does not necessarily provide
migrants with the same opportunities or returns that it does for nationals. In fact, foreign citizens were
more likely than nationals to be over-qualified for their jobs, with TCNs being at a higher risk of being
over-qualified than other EU nationals. This was also the situation in Malta. The reasons may be various
including qualification recognition, the fact that the skills developed in their home country may not match
those that are in demand in their new communities, and language barriers.
31
Document Classification: Public
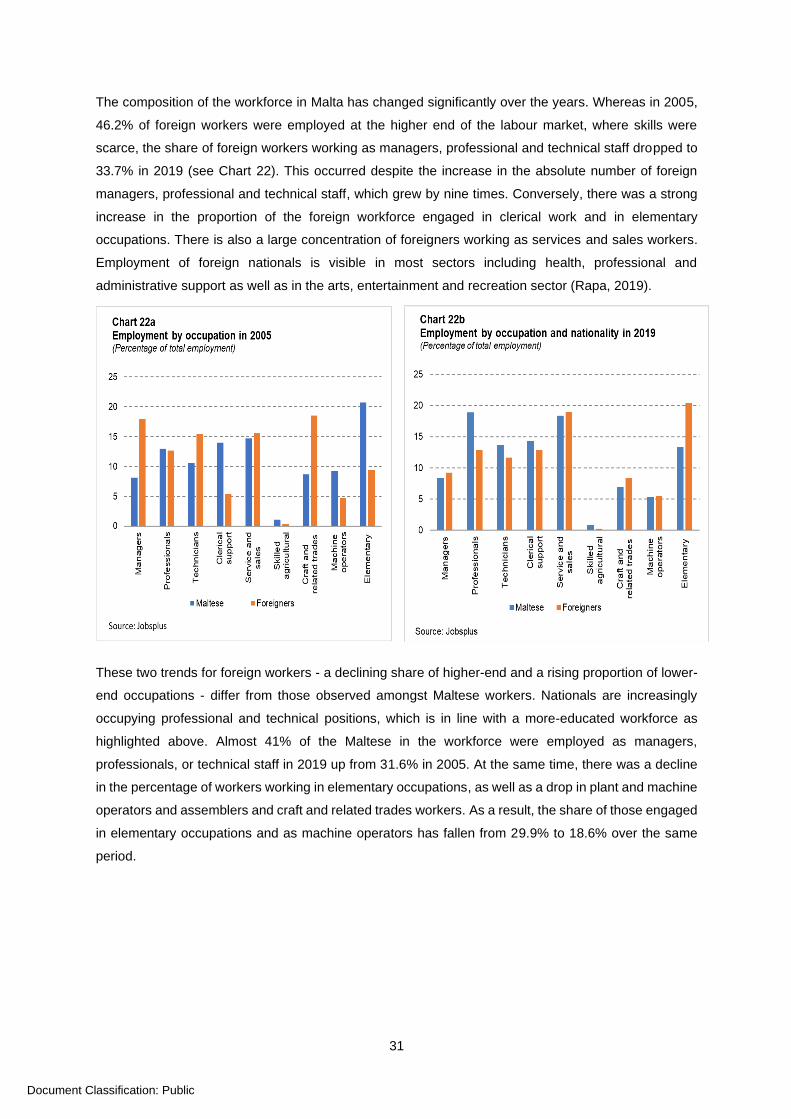
The composition of the workforce in Malta has changed significantly over the years. Whereas in 2005,
46.2% of foreign workers were employed at the higher end of the labour market, where skills were
scarce, the share of foreign workers working as managers, professional and technical staff dropped to
33.7% in 2019 (see Chart 22). This occurred despite the increase in the absolute number of foreign
managers, professional and technical staff, which grew by nine times. Conversely, there was a strong
increase in the proportion of the foreign workforce engaged in clerical work and in elementary
occupations. There is also a large concentration of foreigners working as services and sales workers.
Employment of foreign nationals is visible in most sectors including health, professional and
administrative support as well as in the arts, entertainment and recreation sector (Rapa, 2019).
These two trends for foreign workers - a declining share of higher-end and a rising proportion of lower-
end occupations - differ from those observed amongst Maltese workers. Nationals are increasingly
occupying professional and technical positions, which is in line with a more-educated workforce as
highlighted above. Almost 41% of the Maltese in the workforce were employed as managers,
professionals, or technical staff in 2019 up from 31.6% in 2005. At the same time, there was a decline
in the percentage of workers working in elementary occupations, as well as a drop in plant and machine
operators and assemblers and craft and related trades workers. As a result, the share of those engaged
in elementary occupations and as machine operators has fallen from 29.9% to 18.6% over the same
period.
32
Document Classification: Public
References
Barnardos, (2009), “Written out, written off: Failure to invest in education deprives children of their
potential”, Dublin: Barnardos.
Borg, C., Mayo, P. and Raykov, M., (2016), “Adult learning in Malta: Insights into current participation,
content and forms of adult learning”, Msida: Faculty of Education, University of Malta.
Bureau of Labor Statistics, U.S., Department of Labor, (2019), The Economics Daily, Workers with
advanced degrees were more likely to work at home than those without in 2018, 31 July. [Viewed 8
February 2021]. Available from: https://www.bls.gov/opub/ted/2019/workers-with-advanced-degrees-
were-more-likely-to-work-at-home-than-those-without-in-2018.htm
Caruana, S., (2003), “Television programmes as a resource for teaching Italian”, Journal of Maltese
Education Research, 1(1), pp. 3-24.
Cedefop, (2017), “Vocational education and training in Malta: short description”, Luxembourg:
Publications Office.
Cedefop, Eurofound, (2018), “Skills forecast: trends and challenges to 2030”, Cedefop reference series;
No 108, Luxembourg: Publications Office.
Clark, D., (2011), “Do Recessions Keep Students in School? The impact of Youth Unemployment on
Enrolment in Post-compulsory Education in England”, Economica, 78, pp. 523-545.
Croll, P., and Hastings, N., (1996), “Effective primary teaching –research based classroom strategies”,
London: David Fulton.
Darvas, Z., (2020), ‘COVID-19 has widened the income gap in Europe’, Bruegel Blog, 3 December
Debono, N., (2021), “An analysis of Malta’s potential to telework”, Central Bank of Malta Quarterly
Review, 2021(1), pp. 32-39.
Directorate-General for Education, Youth, Sport and Culture, (2019), Education and Training Monitor
2019: Country Analysis, Luxembourg: Publications Office of the European Union.
Directorate-General for Education, Youth, Sport and Culture, (2020), Education and Training Monitor
2020: Country Analysis, Luxembourg: Publications Office of the European Union.
Doumet, M.H., (2018), “For immigrant adults, a higher education does not always lead to equal
employment opportunities”, oecdedutoday.com, 18 August. [Viewed 30 January 2021]. Available from:
https://oecdedutoday.com/for-immigrant-adults-a-higher-education-does-not-always-lead-to-equal-
employment-opportunities/
Drucker, J., and Khattak, A.J., (2000), “Propensity to Work from Home: Modeling Results from the 1995
Nationwide Personal Transportation Survey”, Transportation Research Record: Journal of the
Transportation Research Board, 1706(1), pp. 108–117.
Eade, J., Drinkwater, S., and Garapich, M., (2006) “Class and Ethnicity – Polish Migrants in London”,
CRONEM, Guildford: University of Surrey.
Ebejer, I., and Mandl, U., (2009), “The efficiency of public expenditure in Malta”, European Commission
Directorate-General for Economic and Financial Affairs, ECFIN Country Focus, Vol 6 (2).
Eurofound, (2020), “Living, working and COVID-19: COVID-19 series”, Luxembourg: Publications Office
of the European Union.
European Commission, (2016), Country report Malta 2016: staff working document. Available from:
https://ec.europa.eu/info/sites/info/files/cr_malta_2016_en.pdf
European Parliamentary Research Service (2021), Lifelong Learning in the EU. [Viewed 8 February
2021]. Available from: https://www.europarl.europa.eu/thinktank/infographics/lifelonglearning/
33
Document Classification: Public
Eurostat, (2013), “Educational attainment: persistence or movement through the generations?”, News
release 188/2013. Available from: https://ec.europa.eu/eurostat/documents/2995521/5168314/3-
11122013-AP-EN.PDF/7cb8cff9-50f5-4ee7-920a-64b415af50ee
Eurostat, (2019), “Manual on sources and methods for the compilation of COFOG statistics:
CLASSIFICATION OF THE FUNCTIONS OF GOVERNMENT (COFOG) 2019 edition”, Luxembourg:
Publications Office of the European Union.
Eurostat, (2020a), Europe 2020 indicators – education: Statistics Explained. Available from:
https://ec.europa.eu/eurostat/statistics-explained/index.php?title=Europe_2020_indicators_-
_education&oldid=301033%20#Continuous_decrease_in_early_school_leaving
Eurostat, (2020b), Unemployment statistics and beyond: Statistics Explained. Available from:
https://ec.europa.eu/eurostat/statistics-
explained/index.php?title=Unemployment_statistics_and_beyond
Eurostat, (2020c), Educational expenditure statistics: Statistics Explained. Available from:
https://ec.europa.eu/eurostat/statistics-
explained/index.php?title=Educational_expenditure_statistics#Overall_educational_expenditure
Eurostat, (2020d), Migrant integration statistics – over-qualification. Available from:
https://ec.europa.eu/eurostat/statistics-explained/index.php?title=Migrant_integration_statistics_-
_over-qualification.
Fredriksson, P., B. Öckert and Oosterbeek, H., (2013), “Long-Term effects of class size”, Quarterly
Journal of Economics, Vol. 128(1), pp: 249-285.
Grech, A.G., (2016), “Assessing the economic impact of foreign workers in Malta”, Central Bank of Malta
Quarterly Review, 2016(1), pp. 39-44.
Gruen, D. and Garbutt, M., (2003), “The Output Implications of Higher Labour Force Participation”,
Treasury Working Paper 2003 — 02, The Treasury, Australian Government.
Holland, D., Liadze, I., Rienzo, C. and Wilkinson, D., (2013), “The relationship between graduates and
economic growth across countries”, BIS Research paper No. 110.
ILO, (2016), “Key indicators of the labour market: ninth edition”, Geneva: ILO.
ILO, (2020), “Teleworking during the Covid-19 pandemic and beyond: A Practical Guide”, Geneva: ILO.
Kennedy, S., and Hedley, D., (2003), “A note on educational attainment and labour force participation
in Australia”, The Treasury, Australian Government Treasury Working Paper 2003-03.
Knoppe, C., (2018), “Wage Income Distribution and Mobility in Malta,” Central Bank of Malta Working
Paper WP/06/2018.
Mandl, U., Dierx, A., and Ilzkovitz, F., (2008), “The effectiveness and efficiency of public spending”,
Economic Papers 301, European Commission Directorate-General for Economic and Financial Affairs.
Micallef, B., (2018), “Estimating the impact of structural reforms to increase the female participation in
Malta”, International Journal of Social Science Studies, 6(8), pp. 73-84.
Ministry for Education and Employment, (2014), “A Strategic Plan for the Prevention of Early School
Leaving in Malta”, Malta: Ministry for Education and Employment.
NSO, (2013), “Re-mapping of information relating to the rate of Early Leavers from Education and
Training”. Available from:
https://nso.gov.mt/en/nso/Media/News/press_information_notice/previous_notices/Documents/2013/PI
N03_Remapping_of_information_relating_to_the_rate_of_Early_Leavers_from_Education_and_Traini
ng.pdf

34
Document Classification: Public
NSO, (2020), “The Effect of COVID-19 on the Laour Market: A comparison between March and April
2020”. Available from: https://nso.gov.mt/en/News_Releases/Documents/2020/06/News2020_107.pdf
OECD, (1989), “Employment Outlook 1989”, Paris: OECD.
OECD, (2001), “The Well-being of Nations: The role of human and social capital”, Paris: OECD
Publishing.
OECD, (2016), “Education at a Glance 2016: OECD indicators”, Paris: OECD Publishing.
OECD, (2019), “Education at a Glance 2019: OECD Indicators”, Paris: OECD Publishing.
OECD and Statistics Canada, (2000), “Literacy in the information age: Final report of the international
adult literacy survey”, Paris: OECD.
Pissarides, C. A., (1981),” Staying-on at School in England and Wales”, Economica, 48, pp. 345-363.
Psacharopoulos, G., and Tzannatos, Z., (1991). "Female Labor Force Participation and Education" in
G. Psacharopoulos (ed.) Essays in Equity, Poverty and Growth, Oxford: Pergamon Press.
Rapa, A.M., (2019), “Developments in the foreign workforce in Malta”, Central Bank of Malta Quarterly
Review, 2019(4), pp. 35-40.
Schultz, T.W., (1975), “The value of the ability to deal with disequilibria”, Journal of Economic Literature,
13, pp. 827–846.
Tumino, A. and Taylor, M., (2013), “The impact of local labour market conditions on school leaving
decisions” presented during IZA Workshop on the future of Labor: The Effects of the Economic Crisis
on the Labour Market, Unemployment and Income Distribution, 21 February 2013.
Vinod, H.D. and Kaushik, S.K., (2007), “Human capital and economic growth: Evidence from developing
countries”, American Economist, Vol. 51, No. 1, pp. 29–39.
Walker, I. & Zhu, Y., (2003), Education, earnings and productivity: Recent UK evidence. Labour Market
Trends, 111(3), pp. 145-152.
Woessman, L., (2014), “The Economic Case for Education”, EENEE Analytical Report No. 20, Prepared
for the European Commission.
Wolfe, B.L., and Haveman, R.H., (2002), “Social and Nonmarket Benefits from Education in an
Advanced Economy”, Conference Series; [Proceedings], Federal Reserve Bank of Boston, 47 (Jun),
pp. 97-142.
Copyright © 2022 FDOKUMEN