
Iodine deficiency and schooling attainment in Tanzania
59
IODINE DEFICIENCY AND SCHOOLING ATTAINMENT IN TANZANIA † Erica Field Harvard University Omar Robles Harvard University Maximo Torero IFPRI May 2007 Abstract: An estimated one billion people globally are at risk of iodine deficiency disorder (IDD), the only micronutrient deficiency known to have significant, irreversible effects on cognitive development. Reductions in human capital due to cognitive damage from IDD have potentially important implications for economic growth in afflicted settings. To gauge the magnitude of this influence, we evaluate the impact of reductions in fetal IDD on child schooling attainment that resulted from an intensive distribution of iodized oil capsules (IOC) in Tanzania between 1986 and 1997. We look for evidence of improvements in cognitive ability attributable to the intervention by assessing whether children who benefited from iodine supplements in utero exhibit higher rates of grade progression at ages 10 to 14 relative to siblings and older and younger children in the district who did not. Our findings suggest that reducing fetal IDD has significant benefits for child cognition: Protection from IDD in utero is associated with 0.36 years of additional schooling. Furthermore, the effect appears to be substantially larger for girls, consistent with new evidence from laboratory studies indicating greater cognitive sensitivity of the female fetus to maternal thyroid deprivation. There is weak evidence that the program also reduced child but not fetal or infant mortality, which may bias downward the estimated effect on education. There is no indication that IOC improved rates of illness or school absence due to illness among children 10 to 14, suggesting that IOC improves schooling through its effect on cognition rather than its effect on health. Cross- country regression estimates also indicate a strong negative influence of total goiter rate and strong positive influence of salt iodization on female school participation. These findings provide micro-level evidence of the direct influence of ecological conditions on economic development, in addition to suggesting a potentially important role of variation in rates of learning disability in explaining cross-country growth patterns and gender differences in schooling attainment. † We thank Lisa Vura-Weis and Sonali Murarka for excellent research assistance. We are also grateful for feedback and discussion from seminar participants at Yale, Columbia, Harvard, Princeton and the University of Michigan, and 2006 SITE conference participants. Please direct correspondence to [email protected] .
Transcript of Iodine deficiency and schooling attainment in Tanzania
IODINE DEFICIENCY AND SCHOOLING ATTAINMENT IN TANZANIA†
Erica Field
Harvard University
Omar Robles Harvard University
Maximo Torero IFPRI
May 2007 Abstract: An estimated one billion people globally are at risk of iodine deficiency disorder (IDD), the only micronutrient deficiency known to have significant, irreversible effects on cognitive development. Reductions in human capital due to cognitive damage from IDD have potentially important implications for economic growth in afflicted settings. To gauge the magnitude of this influence, we evaluate the impact of reductions in fetal IDD on child schooling attainment that resulted from an intensive distribution of iodized oil capsules (IOC) in Tanzania between 1986 and 1997. We look for evidence of improvements in cognitive ability attributable to the intervention by assessing whether children who benefited from iodine supplements in utero exhibit higher rates of grade progression at ages 10 to 14 relative to siblings and older and younger children in the district who did not. Our findings suggest that reducing fetal IDD has significant benefits for child cognition: Protection from IDD in utero is associated with 0.36 years of additional schooling. Furthermore, the effect appears to be substantially larger for girls, consistent with new evidence from laboratory studies indicating greater cognitive sensitivity of the female fetus to maternal thyroid deprivation. There is weak evidence that the program also reduced child but not fetal or infant mortality, which may bias downward the estimated effect on education. There is no indication that IOC improved rates of illness or school absence due to illness among children 10 to 14, suggesting that IOC improves schooling through its effect on cognition rather than its effect on health. Cross-country regression estimates also indicate a strong negative influence of total goiter rate and strong positive influence of salt iodization on female school participation. These findings provide micro-level evidence of the direct influence of ecological conditions on economic development, in addition to suggesting a potentially important role of variation in rates of learning disability in explaining cross-country growth patterns and gender differences in schooling attainment.
† We thank Lisa Vura-Weis and Sonali Murarka for excellent research assistance. We are also grateful for feedback and discussion from seminar participants at Yale, Columbia, Harvard, Princeton and the University of Michigan, and 2006 SITE conference participants. Please direct correspondence to [email protected].
- 1 -
1 Introduction
There is an unresolved debate in the economic growth and development literature regarding
the role of geographic variation in health environment on long-run economic outcomes. A number of
recent cross-country studies provide evidence that ecological conditions related to health environment,
such as malaria transmission rates, have a direct effect on economic growth (Sachs, 2003; Sachs and
Gallup, 2001). One critical aspect of health environment that has received little attention in the
literature is the concentration of trace elements in soil and rock, which differs widely across settings as
a result of geographic variation in the age of surface rock (Marett, 1936). Among minerals found in
soil, iodine is potentially one of the most important for human growth and development since it is the
only micronutrient known to have significant, irreversible effects on brain development (Cao et al.,
1994; Hetzel and Mano, 1989; Pharoah and Connolly, 1987).1
If dietary iodine is indeed a key determinant of cognitive capacity in humans, its deficiency
could have important consequences for human capital accumulation and labor productivity in afflicted
settings. Given that an estimated one billion people globally are at risk of brain damage from iodine
deficiency disorder (IDD) worldwide, this influence may account for a significant fraction of
unexplained variation in cross-country growth rates. Iodine deficiency may also constitute an
important missing link in explaining abysmal rates of growth in Africa: Geological “shields”, which
cover a large and populous ring of Central Africa, are associated with particularly low concentrations
of iodine in soil and ground water due to their geological age.2 Although dietary patterns vary
geographically with respect to a variety of micronutrients important for human development, iodine
availability is likely to exert a stronger independent influence on economic outcomes than dietary
prevalence of other micronutrients and many climatic conditions due to the fact that it has little
correlation with local food availability. Hence, while other human micronutrient deficiencies are likely
to be resolved with economic development by way of rising caloric intake, iodine deficiency is more
likely to exert a persistent influence on economic outcomes. Furthermore, since fetal IDD permanently
limits intellectual functioning, its impact is likely to be particularly acute and persistent.
This research looks for evidence of the influence of iodine deficiency on human capital by
examining the effect on child schooling of an intensive and repeated distribution of iodine
supplements in several districts of Tanzania between 1986 and 1997. Since iodine is thought to matter
most at the time of fetal brain development, we look for evidence of improvements in cognitive ability
attributable to the intervention by assessing whether children who benefited from supplements in utero
1 Epidemiological criteria for assessing sufficient iodine intake is 100 μg or above. 2 Shields are large areas of exposed Precambrian rock found in regions that have been little affected by tectonic processes, which occur near plate boundaries. As a result, surface rock on shields is over 570 million years old.
- 2 -
exhibit higher rates of grade progression ten to fourteen years later. Since supplements offer protection
for two years but distribution rounds occurred less frequently, we exploit gaps in coverage specific to
each district using household and district fixed effects models that compare children likely to benefit
from the program in utero based on month and year of birth to slightly older and younger cohorts
within the district who were in utero during program gaps and delays.
In addition to providing evidence of a direct link between geography and development our
analysis contributes to the growing body of micro-level studies on malnutrition and human capital.3
Assessing the importance of physiological determinants of schooling informs a fundamental debate in
the literature on barriers to education in developing countries surrounding the importance of supply-
driven explanations for low levels of human capital investment relative to differences in returns to
education. Schooling responses to reductions in fetal brain damage provide evidence that patterns of
human capital investment also reflect biological differences in the cognitive cost of schooling.
Of particular interest is the possible role of iodine deficiency in explaining gender differences
in schooling outcomes in light of new evidence from laboratory studies in animals which find greater
sensitivity of the female fetus to maternal thyroid deprivation on cognitive development. If girls are
more susceptible to cognitive damage from IDD in utero as the laboratory evidence suggests,
geography may contribute directly to gender disparities in schooling outcomes by way of sex
differences in rates of learning disability. This is a particularly compelling explanation for gender
differences in schooling in Tanzania, where lower female attainment is almost entirely accounted for
by the extremely low rate at which girls pass the national secondary school qualifying exam.
The long-run effect of fetal iodine intake is also of interest in light of recent worldwide
progress in reducing IDD through universal salt iodization (USI) legislation passed in many countries
during the 1990s. Between 1980 and 2000, at least 28 countries reduced goiter, a common indicator of
IDD, by more than 20% through national salt iodization, and several others that lack data are believed
to have made similarly important gains. Because children born after the majority of these changes are
only now reaching school age, there has been little opportunity to evaluate the impact of these reforms
on health and well-being or to determine whether resulting reductions in IDD will alter the global
pattern of schooling attainment in the near future.
Although a number of countries undertook iodine supplementation programs during the 1990s,
there are two important advantages to studying the case of Tanzania. First, Tanzania was one of the 3 The influence of macro-nutrients (energy and protein intake) has been examined through subsidized school meal programs and nutrition supplements, which were found to increase school participation and test scores (Vermeersch, 2003; Behrman et al, 2003). While little attention has been paid to the effect of specific micronutrients on schooling, many studies find benefits of micronutrients on health and labor productivity (Thomas et al, 2003; Basta et al, 1979; Husain et al, 1981; Sommer et al., 1986, 1981; West et al., 1995; Glasizou et al, 1993; Beaton et al, 1992).

- 3 -
largest and most intensive programs, ultimately reaching approximately 25% of the population. As a
result, an estimated 1.9 million babies born during and immediately after the program were protected
from fetal IDD.4 The breadth of the program and well-defined target population are critical for
retrospective evaluation because they enable follow-up studies of these cohorts based solely on year
and district of birth. Second, Tanzania was one of the earliest countries to distribute iodine
supplements. Hence, evaluation of the program’s initial effect on children born during the intervention
provides a first glimpse of long-run patterns that can be expected to emerge over the coming decade in
a number of other settings.
Our findings suggest that reducing fetal IDD has significant benefits for children’s cognition
as evidenced by its effect on schooling attainment: Children likely to be protected from iodine
deficiency during their first trimester in utero attain an average of 0.36 – 0.51 years of education above
siblings and older and younger children in their district who were not. This result supports the
common claim that the first three months of fetal growth are a critical period for cognitive
development. Furthermore, the estimated effects are substantially larger and more robust for girls,
indicating a potentially important role of micronutrient deficiencies in explaining gender differences in
schooling attainment in many parts of the developing world. The pattern of results is similar in
household and district fixed effects models and consistent across datasets and points in time. In
addition, the observed variation in estimated effects matches predictions regarding the relative
vulnerability of subpopulations to fetal IDD based on amount of iodine-depleting foods in the local
diet. Our results also indicate that the program reduced child but not fetal or infant mortality. Since
there is no evidence of gender differences in the program effect on survival and no apparent
differences in health status of survivors according to program participation, this influence is unlikely
to account for the schooling results and could bias downward the estimated effects on education.
To examine the implications of our findings at a macro level, we also run cross-country
regressions of school participation on baseline IDD and fraction of population consuming adequately
iodized salt. The results reveal a negative correlation between baseline iodine deficiency and female
secondary schooling, and indicate that early salt iodization has already exerted a positive effect on
female primary schooling attainment. Based on our micro-level estimates from Tanzania and cross-
country data on baseline IDD and recent reductions in TGR, we calculate that the average increase in
schooling attainment in Central and Southern Africa attributable to USI could ultimately be as large as
7.2% of baseline average schooling levels.
A remaining policy question is the value of devoting further resources necessary to fully
eradicate IDD. Although USI is arguably the most successful micronutrient intervention in world 4 Estimation based on 1988-1994 population and (crude) birth rate.
- 4 -
history, legal regulations on salt production are rarely sufficient to guarantee dietary change among
rural populations that consume mainly subsistence food products. In several African countries less
than 30% of households presently consume iodized salt despite universal legislation, and even iodized
salt may be insufficient to reduce IDD in populations whose diets contain sufficient amounts of
iodine-depleting foods (UNICEF, 2005). With respect to the estimated 10% of the population that
remains at risk in spite of salt iodization legislation and the more than 40 countries that have yet to
undertake any control program, the magnitudes of our estimated returns to eliminating IDD well
justify more costly approaches.5
2 Background
2.1 Iodine Deficiency
Iodine is produced in the ocean and deposited in the soil, where it is stored in underground
rock layers. Dietary iodine availability is determined primarily by soil composition and amount of
seafood consumed. Because soil is depleted of iodine gradually over time, older soil surfaces are more
iodine deficient, so rates of IDD increase with distance to coast and altitude and decrease with level of
recent tectonic activity. For this reason, Precambrian rock shields are associated with particularly low
concentrations of iodine. Since iodine deposits are concentrated in deep soil layers, well water is also
an important source in areas where bedrock is rich in iodine (Hetzel, 1989).
Humans require iodine for the biosynthesis of thyroid hormone. In utero development of the
central nervous system required for intellectual functioning depends on an adequate supply of thyroid
hormone, which influences the density of neural networks established in the developing brain
(Lamberg, 1991).6 Cretinism, a relatively rare form of mental retardation that occurs under extreme
deprivation, is the most severe manifestation of cognitive damage from insufficient maternal and fetal
thyroid hormone.7 In utero IDD has also been associated with physical impairments in the fetus other
than brain damage such as congenital anomalies, perinatal mortality and deaf mutism, as well as
retarded physical development in childhood and adolescence, although the evidence is mixed.8 In
general, existing evidence from human studies suggests that non-cognitive outcomes occur only under
extreme deprivation and that in utero damage from IDD is overwhelmingly cognitive (Zimmerman,
2005; Hetzel, 1983). Furthermore, animal and human studies indicate that cognition is sensitive to
5 Hetzel (2000) estimates that less than half the population in 83 developing countries consumed adequately iodized salt in the mid-1990s. 6 The recommended daily iodine intake is 50 mcg for infants under 12 months, 150 mcg for adults and 200 mcg for pregnant and lactating women (WHO, 1996). 7 Though cretinism is rare, severely affected populations may have rates as high as 15%, imposing a major social and economic burden on the community (Boyages et al., 1988; Halpern et al., 1991; Pandav et al., 1982) 8 See Allen L and Gillespie S (2001) for a review of the evidence.
- 5 -
iodine deficiency during early fetal life, prior to mid-gestation, whereas physical growth and
psychomotor development are believed to be most severely affected by iodine deficiency in childhood
(Cao et al., 1994a; Zaleha et al., 2000).
Although iodine deficiency has been associated with goiter and cretinism for centuries, only
during the past decade has IDD been widely recognized as a leading cause of intellectual impairment
(Merke, 1984; Delange, 2000; Haddow, 1999).9 Furthermore, the effect of iodine deficiency on mental
development is no longer believed to be limited to rare cases of severe mental retardation from
extreme deprivation. Recent evidence from laboratory studies indicates a continuous process by which
brain development is sensitive to minor adjustments in thyroid hormone (Lavado-Autric R, 2003;
Sundqvist et al, 1998; Dugbarty, 1998; Pop et al, 1999). As a result, even mild maternal iodine
deficiency is now hypothesized to reduce intelligence quotients by a noticeable margin.
While there have been no experimental or large-scale observational studies of the cognitive
effects of moderate iodine deficiency in humans, there is suggestive but mixed evidence from
community-based assessments of iodine intervention trials that supplementation can improve
performance on cognitive tests (Bleichrodt et al., 1994; Bautista et al., 1982). One oft-cited study in
Ecuador found that iodine prophylaxis given before or during pregnancy resulted in improved
cognitive functioning in 50 offspring examined two to three years later (Shrethsa, 1994). The
difference corresponded to a 10-15 point improvement in IQ relative to children in untreated
communities. To our knowledge, the long-term impact of increased iodine intake during pregnancy on
children’s human capital attainment has not been measured in any setting.
2.2 Gender Differences in Iodine Deficiency
Evidence from multiple sources indicates gender differences in the importance of iodine for
brain development. Notably, in both of the above studies that analyzed results by gender, cognitive
improvements were only found among girls, although in both cases the findings were merely
suggestive given limited numbers of subjects, lack of statistical significance and questionable validity
of the comparison groups (Bautista et al., 1982; Shrethsa, 1994). Similarly, practitioners have noted
that adolescent IDD, including rates of goiter and average severity among sufferers, is systematically
higher among females (Allen et al, 2001; Simon, 1990). A central limitation of observational studies is
their inability to attribute gender differences in IDD to physiological sex differences in iodine
sensitivity as opposed to sex-specific dietary patterns.
9 The World Health Organization labeled IDD “the most common cause of preventable mental retardation (WHO, 1992).”
- 6 -
More conclusive evidence of biologically-driven gender differences in iodine sensitivity
comes from recent laboratory experiments of maternal thyroid deficiency in animals. Despite the fact
that thyroid conditions of all types are consistently higher among women, scientific investigation of
gender differences in in utero iodine sensitivity has only recently been undertaken, consistent with the
general absence of research into the role of biochemicals of maternal origin on sex differences in fetal
neurodevelopment (Friedhoff et al., 2000). However, two studies lend strong support to the hypothesis
of sex-specific sensitivity to iodine deficiency in utero. First, a 2000 study by Friedhoff et al. found
that the effect of artificially restricting maternal thyroid hormone in utero on fetal neurodevelopment
and behavioral outcomes was significantly larger in female relative to male rat progeny.
Although the mechanism underlying sex-selective effects of maternal nutrient deprivation on
brain development could not be directly addressed by their experiment, a recent study of gene
expression in nutrient deprived fetal guinea pigs by Chan et al (2005) provides insight into the cellular
pathways. In particular, in utero nutrient deprivation led to a significant increase in the male fetal
brain and decrease in the female fetal brain of mRNA expression of nuclear thyroid hormone receptors
(TRs), which mediate thyroid hormone action. Increased TRs in key regions of the fetal brain help
regulate thyroid hormone during development and thereby have the potential to compensate for lower
maternal thyroid transfers. Although the biological pathway underlying the gender difference is not
fully understood, the finding was hypothesized to be related to elevated male androgen levels at the
height of neural TR expression, a gender difference also found in humans.
3 Setting
3.1 Iodine deficiency in Tanzania
Our study examines the long-run impact of an iodized oil supplementation program in
Tanzania. Tanzania, like many countries on the African continent, traditionally suffered high rates of
IDD. According to a nationwide survey of iodine levels in the early 1970s, about 40% of the
Tanzanian population, or 10 million people, lived in iodine-deficient areas and 25% of the population
was estimated to suffer from IDD, including 3% with severe and 22% with moderate symptoms (van
der Haar et al, 1998). In endemic regions, 13% of children under five and 52% of pregnant and
lactating women showed manifestations of iodine deficiency prior to the intervention.
3.2 Schooling in Tanzania
The Tanzanian formal education system involves seven years of primary education, four years
of junior secondary, and two years of senior secondary. In 2001, gross enrollment in primary school
was 85% but only 7% in secondary school, largely due to an insufficient supply of secondary schools.
- 7 -
In 2001, one quarter of rural households reported being over 20 kilometers from a secondary school
while distance to primary schools was an issue only for a minority of rural households, 8% of which
reported the nearest primary school to be more than 6 kilometers away (THBS, 2001). Throughout the
country, gross enrollment ratios are higher than net enrollment ratios because many over-age children
are present in primary schools due to beginning schooling late and progressing slowly.
Although gender parity in primary enrollment was more or less achieved by 1998, female
students represented only 36% of the secondary level student population in 2000. In the standard
primary age group of 7 to 13, boys have a slightly lower participation rate than girls because they start
school slightly later, while the reverse is true for older children since girls drop out earlier. However,
not all of this is due to faster progression: Girls are less likely than boys to be in school beginning at
13, and the difference increases steadily thereafter as a disproportionate fraction of boys proceed to
secondary school. Admission to secondary schools is screened by performance on the mandatory
Primary School Leaving Exam (PSLE), which students take one or two years after grade 6, and gender
differences in secondary enrollment are almost entirely accounted for by differences in PSLE pass
rates. Although in 2001 roughly the same numbers of boys and girls completed primary school and sat
for the national exam required for secondary school, boys were 69% more likely to pass. As there is
cost and no benefit other than admission to taking the test, this fact alone suggests that parents’
preferences for male schooling are not fully responsible for gender differences in education.
3.3 Iodized Oil Capsule (IOC) Distribution in Tanzania
Tanzania was targeted for iodine supplementation relatively early compared to similarly
afflicted countries. In 1986, a massive supplementation intervention was scheduled to begin in the
most affected districts of the country as a short-term measure until nationwide production of iodized
salt could be phased in in the mid-1990s. The objective of the program was to cover all iodine
deficient sub-populations for ten years with iodized oil capsules (IOC). Iodized oil, taken either orally
or through injection, is considered one of the most effective short-term measures for combating IDD
on account of the immediacy of health improvements and duration of coverage, which lasts from one
to four years depending on the dosage (Delange, 1998). Program districts were chosen based on 1984
field measurements of visible goiter rate (VGR) among school children. The minimum VGR for
inclusion was 10%, which resulted in 25 treatment districts encompassing 25% of the country’s
population (Peterson, 2000).10 As show in Figure 1, intervention districts were spread across ten
regions of the country but concentrated geographically in the lake district of the western border,
opposite the coast, which corresponds to a major geological shield and region of endemic IDD. 10 Two districts, Bukoba Rural, Kagera, and Mbinga, Ruvuma, were added late and are excluded from the study.
- 8 -
In program districts, women of child-bearing age were targeted to receive 380 mg capsules
once every two years, the expected duration of protection from this dose.11 From 1986–1994,
approximately five million women and children received at least one supplement through the program.
Program roll-out and coverage rates across districts, collected from the archives of the Tanzania
Health and Nutrition Office annual reports of program activity, are detailed in Table 1. Although all
districts were scheduled to begin IOC by 1988, in practice there were significant delays in program
implementation in many of them. Only ten of the districts had begun by 1988, and three did not start
until 1992. Furthermore, penetration rates were lower than planned, ranging from 60 to 90 percent of
the target population with average coverage across all districts and all years of 64%.12 Coverage
declined inversely to distribution round, at least in part due to rumors that IOC was a family planning
aide (Magombo, 1990). Finally, districts were reached less frequently than once every two years due
to administrative problems and caution over administering supplements frequently (Peterson, 2000).
Although the long-term impact of the program has not been evaluated, the program was
deemed a success early on due to the number of IOC distributed, overall cost-effectiveness (the
average cost per dose was $0.51–$0.56), and a handful of initial studies indicating that visible and
total goiter rates (VGR and TGR) had decreased among children who received supplements directly. A
1991 evaluation in three districts found that VGR had decreased by over 50% and TGR by over 25%
(Peterson, 2000). Among school children aged 7-18 in the district of Mahenge, TGR was 74.9%
before IOC and 51.9% three years after (Kavishe, 2000). In light of the importance of adequate thyroid
hormone during brain development and increased need for iodine during pregnancy, the program
impact on children of women protected from IDD during pregnancy is likely to be even higher.
4 Empirical Analysis
4.1 Data
We examine the program effect on children born to mothers targeted for IOC during
pregnancy using micro-level data from the 2000 Tanzanian Household Budget Survey (THBS) and the
2004 Tanzanian Demographic and Health Survey (TDHS), to which we append the district-level
information from Table 1 on timing of IOC distribution rounds in intervention districts. The THBS is a
nationally representative survey of 22,178 households conducted by the National Statistics Office of
Tanzania, 25.2% of which live in districts targeted for IOC. The 2004 TDHS covers a total of 4,987
11 The target groups for supplementation were, in order of importance: 1) women of childbearing age; 2) children 1-5 years; 3) older children; and 4) adult men 15-45 years of age (Peterson, 2000). In people older than 45, iodized oil was not encouraged due to increased risks of hyperthyroidism (Dunn 1987b). 12 The average coverage rate among districts and years included in our analysis sample was 68%, although the coverage rate among the target population of women of child-bearing age in unknown, and likely to be higher.
- 9 -
households, 1,034 of which reside in intervention areas. Both surveys collect individual information
on school enrollment and grade attainment of all household members, in addition to a variety of
community and family background characteristics. The THBS has particularly rich information on
household consumption and production and childhood health status, while the TDHS focuses heavily
on reproductive health histories, including fertility and infant health.
For the empirical analysis, we restrict the analysis samples to all children between ages 10 and
13 in 2000 or between 10 and 14 in 2004 that are residing in the household and that could be linked to
mothers in the household. In the THBS, 20.8% of children were dropped because they could not be
matched to mothers based on age and relationship to household head, and in the TDHS, 20.1% of
children are missing month of birth data.13,14 Excluding non-resident children is necessary due to the
fact that schooling outcomes are only available for household members. Excluding observations that
cannot be linked to mothers is necessary to minimize the number of children born outside the district
and hence measurement error in program participation given relatively high incidence of orphanhood
in rural Tanzania. However, as a robustness check we run analogous regressions on the full sample.
The lower bound on age was based on the modal age of school enrollment. In intervention
districts as well as rural districts outside of the intervention areas, enrollment rates for both boys and
girls peak at 10 and fall monotonically thereafter. Across the entire rural sample, only slightly more
than 50% of nine-year-old children are enrolled. Since no data are available from either survey on age
of school entrance, which is determined largely by local school policies and norms, restricting the
sample to ages by which most children can be assumed to have entered minimizes variation in grade
attainment that is independent of children’s cognitive or physical health. The upper age limit in 2000
reflects the fact that oldest children in intervention districts affected by the program are 13 in 2000. In
2004, the upper age limit is driven by the fact that children in the sample leave their parents’
household at high rates beginning at age 15, and reasons for leaving are likely to be systematically
different for boys and girls and highly correlated with schooling attainment.15 Because schooling data
13 Birth month is missing for 1,313 (~20%) children of the head between 9 and 17 in the THBS either because their mother did not live in the household or because she did not participate in the birth history survey. 14 In the THBS sample, we matched mothers to children with the following algorithm: A woman was considered the mother of the child of the head or spouse if she herself was the head or spouse and fell within the right age range (12 to 45 at birth of that child). Out of 3397 kids 8 to 14, 725 could not be linked to mothers; of these, 342 are not the child of the head, 191 live in households in which there are no eligible women (no female head or no spouse in right age range), and 192 live in households in which there is more than one eligible mother due to polygamy. By this method, some fraction of mother-child pairs is likely to be matched incorrectly, reducing the precision of the estimates without introducing any obvious bias. In contrast, incorrectly matching sibling pairs in the household fixed effects estimates is unlikely to matter for either the efficiency or consistency of the estimates since the predictions regarding fetal iodine deficiency are the same for children born in the same district. 15 Comparing birth history data to the household roster, 32% of 15-year-olds are no longer in the household. Furthermore, beginning at 15 boys are significantly more likely to have left the household than girls. At 15, they
- 10 -
were collected only for children living in the household, it was necessary to restrict the sample to
children under the age of 15 to avoid sample selection issues arising from age- and sex-specific
attrition rates.
The full THBS analysis sample contains 1785 children in 1352 households living in the 25
intervention districts that began IOC by 1992. Within-household estimates reduce this sample to 846
kids in the 413 households that have more than one family member aged 10-13. Sex-specific
estimates, which further restrict the analysis sample to households with more than one child of the
same sex in this age distribution, are limited to 251 boys and 231 girls. Among children in our sample,
89% are enrolled in Standards I to VII (primary school) and 11% are not studying.16 The TDHS
analysis sample contains 3672 children ages 10-14 in 2521 households across the country, 515 of
which reside in intervention districts. Within-household estimates reduce this sample to 2160 kids in
1009 households with more than one family member aged 10 to 14, and sex-specific estimates reduce
the sample to 643 boys and 534 girls. In the 2004 sample, 85.4% are enrolled in Standards I to VII,
4.3% are enrolled in Standards VIII to X and 9.76% are not studying.
Although the TDHS sample is considerably smaller than the THBS, it has two principal
advantages. First, information on birth month allows us to construct a more precise indicator of IOC
treatment, described in the proceeding section. Second, the data capture schooling outcomes for
children born during a wider set of program years, allowing us to make use of greater variation in
program activity within and across districts. In particular, as a result of the age cut-offs and the
delayed start of the program in ten districts, only 17 districts contain program activity that affects
children in the 2000 sample, while treated kids are found in all 25 districts in 2004.
4.2 Definition of Program Participation
To analyze the impact of IOC distribution, we defined an indicator of treatment based on the
likelihood that the mother of a child was protected from IDD at some point during her first trimester of
pregnancy given an IOC dosage of 380mg.17 First trimester was chosen based on laboratory studies
indicating that maternal hypothyroxinemia increases the risk of neuro-developmental deficits of the
fetus only prior to mid-gestation, a period during which the mother is the only source of thyroid
hormone (Cao et al., 1994a; Hetzel & Mano, 1989; Pharoah & Connolly, 1987). Furthermore, since
brain development of the fetus takes place during the first month of pregnancy, it is believed that most are 25% more likely and at 17 they are 64% more likely to have left. Common reasons for leaving before age 18 are likely to be marriage for girls and high school attendance for boys. 16 Three 13-year-olds report enrollment in secondary school. 17 According to program rules, women under age 23 were instructed to receive half the dosage of older women (200mg). However, according to one program report, this rule was rarely followed on account of distribution scheme designed to administer as many pills as possible in a short amount of time (Peterson et al., 1998).
- 11 -
of the consequences become permanent by the second trimester.18 This view is consistent with a wider
body of scientific thought regarding the importance of micronutrients during the “critical period” of
the first three months of pregnancy (Barker et al., 1989; Painter et al., 2005).
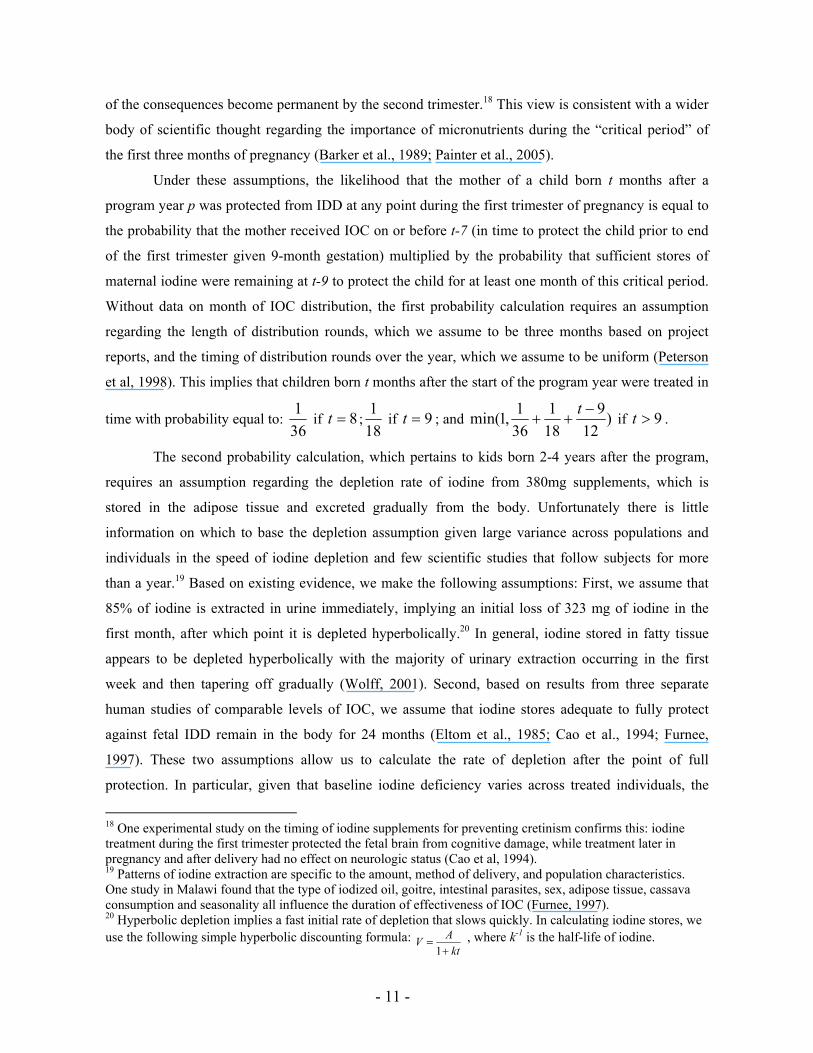
Under these assumptions, the likelihood that the mother of a child born t months after a
program year p was protected from IDD at any point during the first trimester of pregnancy is equal to
the probability that the mother received IOC on or before t-7 (in time to protect the child prior to end
of the first trimester given 9-month gestation) multiplied by the probability that sufficient stores of
maternal iodine were remaining at t-9 to protect the child for at least one month of this critical period.
Without data on month of IOC distribution, the first probability calculation requires an assumption
regarding the length of distribution rounds, which we assume to be three months based on project
reports, and the timing of distribution rounds over the year, which we assume to be uniform (Peterson
et al, 1998). This implies that children born t months after the start of the program year were treated in
time with probability equal to: 361
if 8=t ;181
if 9=t ; and )12
9181
361,1min( −
++t
if 9>t .
The second probability calculation, which pertains to kids born 2-4 years after the program,
requires an assumption regarding the depletion rate of iodine from 380mg supplements, which is
stored in the adipose tissue and excreted gradually from the body. Unfortunately there is little
information on which to base the depletion assumption given large variance across populations and
individuals in the speed of iodine depletion and few scientific studies that follow subjects for more
than a year.19 Based on existing evidence, we make the following assumptions: First, we assume that
85% of iodine is extracted in urine immediately, implying an initial loss of 323 mg of iodine in the
first month, after which point it is depleted hyperbolically.20 In general, iodine stored in fatty tissue
appears to be depleted hyperbolically with the majority of urinary extraction occurring in the first
week and then tapering off gradually (Wolff, 2001). Second, based on results from three separate
human studies of comparable levels of IOC, we assume that iodine stores adequate to fully protect
against fetal IDD remain in the body for 24 months (Eltom et al., 1985; Cao et al., 1994; Furnee,
1997). These two assumptions allow us to calculate the rate of depletion after the point of full
protection. In particular, given that baseline iodine deficiency varies across treated individuals, the
18 One experimental study on the timing of iodine supplements for preventing cretinism confirms this: iodine treatment during the first trimester protected the fetal brain from cognitive damage, while treatment later in pregnancy and after delivery had no effect on neurologic status (Cao et al, 1994). 19 Patterns of iodine extraction are specific to the amount, method of delivery, and population characteristics. One study in Malawi found that the type of iodized oil, goitre, intestinal parasites, sex, adipose tissue, cassava consumption and seasonality all influence the duration of effectiveness of IOC (Furnee, 1997). 20 Hyperbolic depletion implies a fast initial rate of depletion that slows quickly. In calculating iodine stores, we use the following simple hyperbolic discounting formula:
ktAV+
=1
, where k-1 is the half-life of iodine.
- 12 -
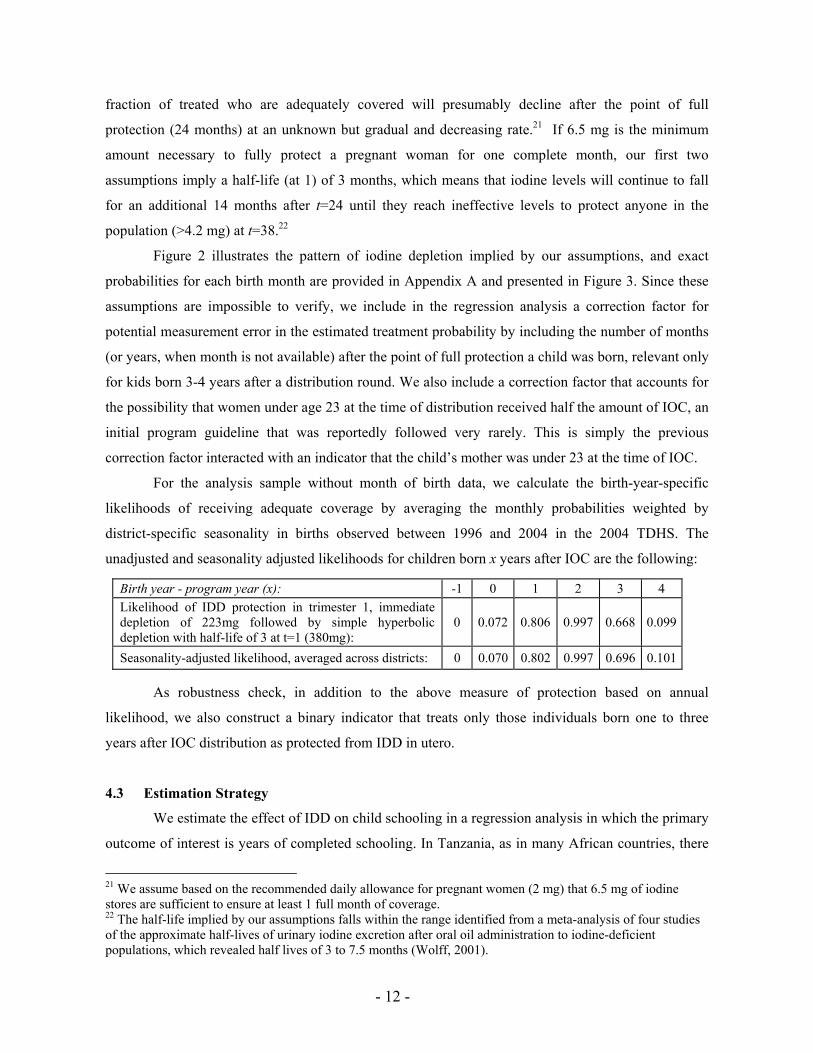
Birth year - program year (x): -1 0 1 2 3 4 Likelihood of IDD protection in trimester 1, immediate depletion of 223mg followed by simple hyperbolic depletion with half-life of 3 at t=1 (380mg):
0 0.072 0.806 0.997 0.668 0.099
Seasonality-adjusted likelihood, averaged across districts: 0 0.070 0.802 0.997 0.696 0.101
fraction of treated who are adequately covered will presumably decline after the point of full
protection (24 months) at an unknown but gradual and decreasing rate.21 If 6.5 mg is the minimum
amount necessary to fully protect a pregnant woman for one complete month, our first two
assumptions imply a half-life (at 1) of 3 months, which means that iodine levels will continue to fall
for an additional 14 months after t=24 until they reach ineffective levels to protect anyone in the
population (>4.2 mg) at t=38.22
Figure 2 illustrates the pattern of iodine depletion implied by our assumptions, and exact
probabilities for each birth month are provided in Appendix A and presented in Figure 3. Since these
assumptions are impossible to verify, we include in the regression analysis a correction factor for
potential measurement error in the estimated treatment probability by including the number of months
(or years, when month is not available) after the point of full protection a child was born, relevant only
for kids born 3-4 years after a distribution round. We also include a correction factor that accounts for
the possibility that women under age 23 at the time of distribution received half the amount of IOC, an
initial program guideline that was reportedly followed very rarely. This is simply the previous
correction factor interacted with an indicator that the child’s mother was under 23 at the time of IOC.
For the analysis sample without month of birth data, we calculate the birth-year-specific
likelihoods of receiving adequate coverage by averaging the monthly probabilities weighted by
district-specific seasonality in births observed between 1996 and 2004 in the 2004 TDHS. The
unadjusted and seasonality adjusted likelihoods for children born x years after IOC are the following:
As robustness check, in addition to the above measure of protection based on annual
likelihood, we also construct a binary indicator that treats only those individuals born one to three
years after IOC distribution as protected from IDD in utero.
4.3 Estimation Strategy
We estimate the effect of IDD on child schooling in a regression analysis in which the primary
outcome of interest is years of completed schooling. In Tanzania, as in many African countries, there
21 We assume based on the recommended daily allowance for pregnant women (2 mg) that 6.5 mg of iodine stores are sufficient to ensure at least 1 full month of coverage. 22 The half-life implied by our assumptions falls within the range identified from a meta-analysis of four studies of the approximate half-lives of urinary iodine excretion after oral oil administration to iodine-deficient populations, which revealed half lives of 3 to 7.5 months (Wolff, 2001).

- 13 -
is high variance in the rate at which children progress through school. Meanwhile, since few children
drop out of school in the age range to which our analysis is restricted (primary school) progression is
presumably a considerably more sensitive indicator of future schooling attainment than enrollment.
Table 2 presents summary statistics from the full THBS sample divided according to the
timing of IOC implementation. Comparisons across intervention and non-intervention districts show
clearly that the program favored needier areas, as was its intention. Relative to non-participating
districts, IOC districts are more rural, have greater distance between households and secondary
schools, and have lower consumption of fish, a rich source of iodine. Such differences clearly bias
comparisons between participating and non-participating districts.
Comparisons among participating districts according to program timing are less clear. School
enrollment and access to safe drinking water fall monotonically with program start date, while illness
due to fever or malaria and average distance to school are significantly higher for districts in which the
program started late. In contrast, the average annual consumption of durables is significantly higher in
late districts, while the average number of meals and frequency of fish consumed are relatively
constant across program start dates. Nonetheless, the general pattern suggests that districts in which
IOC began early were better off than late districts, consistent with the most common source of delay
being poorly organized distribution networks. Hence, program effect estimates based on comparisons
across participating districts are also likely to be biased towards finding a program effect.
For this reason, we restrict our regression estimates to within-district comparisons with the
following fixed-effects regression:
Here Ti is the likelihood child i in family f was protected from IDD during the first trimester, A
is a vector of birth year dummies, and X includes binary controls for gender and sex-specific birth
order. The only difference in regression specification across the 2000 and 2004 analysis samples is the
use of birth month data in the TDHS estimates, which is used to refine the definition of treatment and
also added to the controls to account for the independent effect of small differences in age on school
entrance or progression. The household fixed effects model minimizes the potential confounding role
of unobservable cohort effects that might vary systematically by district and increases the precision of
our estimates by holding family background constant. However, these estimates are necessarily
restricted to the subset of households with more than one child in the relevant age range and the
gender-specific regressions are run on the subset of families with at least two children of the same
gender. To gauge the program effect among the larger and constant set of households, we also estimate
the above regression replacing household with district fixed effects.
iffif3if2if1if )(X )(A )(T εμβββα +++++=grade
- 14 -
Since within districts and households treatment is determined entirely by age, in the above
equation 1β reflects the program effect averaged across all treated cohorts. As in all fixed effect
estimates, identification of the causal effect of T requires that the error term be uncorrelated with the
outcome conditional on the observables contained in X and district or sibling average grade attainment
( fμ ). If cohort differences in treatment are positively correlated with other trends that affect grade
attainment, the estimates will overstate the true effect of iodine on schooling.
Importantly, there are few potential confounding factors that would not be absorbed in the
fixed effects. First, since treatment occurred at the district level, potential confounders must be district-
wide trends that coincide with multiple rounds of IOC distribution in timing and duration.
Furthermore, unless such trends systematically lagged IOC by several years, they would have to
impact children in utero but not early childhood in order to have had a lasting effect on their outcomes
relative to slightly older peers. This reduces the set of potential confounders to changes in fetal health
environment other than iodine that coincided with IOC distribution. For instance, if the timing of
distribution rounds were driven by intermittent declines in the quality of district prenatal health
services, children in utero during program gaps may have experienced other deficiencies in fetal health
inputs relative to those born immediately before or after, which could lead to permanently poorer
health – and possibly schooling – among children who did not benefit from IOC that is independent of
reductions in IDD. Similarly, if program timing was driven by district-level income shocks, children in
utero during the program may have received better nutrition at a critical stage of development.
Information from program reports also provides evidence that variation in treatment was
independent of other fetal or infant health shocks. A post-intervention study by Peterson (2000)
provides a detailed account of sources of delay gleaned from IOC program reports and administrative
records, interviews with past and present program managers, and supervision visits to selected
districts. In all cases, start date was ultimately determined by an external rather than an internal force.
According to the study, lags in program start date were due to administrative delays resulting from the
logistical challenges of district-wide IOC distribution. Delays of one to three years most likely resulted
from delayed receipt of IOC from the government, which sent capsules to district health centers as late
as 1989. Meanwhile, the eight districts delayed beyond 1989 started late because they were slow to
organize a distribution system, which was eventually resolved externally through the establishment by
the central government of national district teams.23 Given the central role of external resource
23 Distribution involved organizing mass campaigns on one particular day in each village through one of two strategies: In addition to IOC, some districts received central funding for fuel and health worker per-diems and set up a “district team” which toured the area using government vehicles. Other districts initially received only IOC and were told to integrate distribution into primary health care facilities. Eight of nine districts attempting
- 15 -
provision in determining distribution timing there is little reason to suspect that variation in program
timing was related to income shocks or changes in the quality of health care services within districts.
In addition, we assess the degree to which possible health shocks pose a threat to our
estimation strategy by testing whether variation in IOC is related to observable health status of
children and reported number of school days missed due to illness. The latter is a particularly strong
test of our identifying assumption since alternative explanations would almost by definition operate
through increased schooling absence due to sickness. Hence, the absence of observable differences in
health status between treated and untreated children is evidence that the treatment effect is driven by
IOC. Testing for a program effect on childhood health status is also useful for assessing the possibility
that IOC operates through reducing childhood illness rather than improving cognition.
5 Results
5.1 Grade Attainment
Regressions of grade attainment on program participation yield large and significant estimates
of the impact of IOC on progression through school, presented in Tables 3-4. In household fixed-
effects regressions from 2000 (Table 3), adequate maternal iodine in utero is associated with 0.358
years of additional schooling relative to siblings who are unprotected among children living in
households with more than one child 10-13 (column 1). Since enrollment is virtually unchanged over
this interval, the results indicate that fetal IDD influences the rate at which students progress through
school. When the regressions are run separately by gender, the estimated effect is twice as large and
statistically significant among girls but not boys. When the binary measure of program participation is
used in place of the likelihood measure (columns 4-5), the results are almost identical in magnitude
and retain significance. Furthermore, results are robust to the inclusion of the ~20% of children that
could not be precisely matched to mothers (columns 6-7), which suggests that orphaned children are
likely to live in the district where they were born. In district fixed effects regressions that include all
children 10-13 the estimated treatment effect is once again only significant for girls but considerably
smaller than the household fixed effect result (columns 8-9). The difference between the two
specifications appears to reflect greater vulnerability to IDD among households with many children
close in age relative to smaller households, likely due to the correlation between family size and
poverty. This is evident from the similarity between household and district fixed effect results when
both samples are restricted to households with more than one sample member (columns 10 and 11).
the latter did not accomplish this before the capsules were close to expiring. To ensure rapid distribution before expiration, in four of the eight districts, the central government established “national district teams” in which staff from the national program initiated and supported distribution with cars, money for fuel and per-diem pay. This discussion and the empirical analysis ignore two districts that were added late and began 1994 to 1995.
- 16 -
The 2004 estimates of schooling attainment detailed in Table 4 are strikingly consistent with
the 2000 estimates despite the fact that sample members were born in different years and enumeration
areas from the THBS sample. Across the pooled sample of children with siblings close in age, the
estimated program effect is slightly larger (0.52 years) but not statistically distinct from the Table 3
estimate, and gender-specific estimates are once again large and significant for girls but not boys.
Once again the district fixed effect estimate on the full sample is half the size of the household fixed
effect estimate (0.29 years), but in this case it retains significance at the 10% level. Since treatment
status pertaining to kids of a given age and district is not constant across samples, the similarity of
2000 and 2004 estimates alone indicates that the findings are not driven by time-invariant patterns of
grade attainment by age that are spuriously correlated with treatment.
In both sets of results, the coefficient estimates on the correction factors for rate of iodine
depletion 3-4 years after the program are insignificant in almost every regression, indicating that
coverage falls at the assumed rate and that the majority of women received 380mg supplements
regardless of age, as was claimed in program reports. The coefficient estimate on the indicator of
young mother is only significant in the district fixed effect regression on the female sample, and the
finding is not robust to the more precise measure of depletion in 2004.
The measured effects underestimate the cognitive impact of IDD to the extent that not all
pregnant women in a district were reached by the program. Data on program coverage rates by district
(Table 1) indicate that 68% of the target population was reached in program areas between 1986 and
1990 and 65% between 1986 and 2004.24 If the rate applies equally to pregnant women, the estimates
imply an average effect of IOC of 0.52-0.76 years. However, for three reasons it may be inappropriate
to inflate the baseline estimate by average coverage. First, women of childbearing age were reportedly
first in the priority list for receiving IOC, so are likely to have been targeted more aggressively by
practitioners and program administrators. Even if they were not, coverage is likely to be higher than
average among pregnant women since they are more likely than men or children over age 1 to visit
health centers where IOC were frequently distributed in regions with low coverage. Third, an
evaluation of program implementation suggested that coverage rates were higher in areas with higher
incidence of goiter, which also implies that effective coverage (coverage of those in need) was over
68% (Peterson, 2000).
One of the most striking patterns in both sets of results is the consistently higher estimated
program effect on girls. In both within-sibling and within-district estimates, girls appear to benefit
twice as much as boys from IOC in utero, although the difference is only significant in the district-
level fixed effects regressions. In the household fixed effect model, girls gain an estimated 0.81-0.90 24 Rate calculated by multiplying a district’s coverage rate by district’s fraction of children in our sample.
- 17 -
years of schooling with in utero IDD protection, which is statistically significant throughout, while
boys gain an estimated 0.29-0.43 years that is not statistically distinguishable from zero. Including
households with only one girl 10-13, the estimated effect of IOC is 0.36-0.42 years and again close to
zero and insignificant for boys. Inflating by average coverage, this implies an effect of IOC on girls’
schooling of 1.2 years.
Importantly, the above estimates of grade attainment are biased measures of the program
effect on final schooling attainment since education outcomes are right-censored, although the
direction of bias is ambiguous. In general, gaps in grade attainment widen over time as a
disproportionate number of slow achievers drop out of school. Furthermore, it is possible that
schooling outcomes are more sensitive to learning disabilities at the secondary relative to the primary
level. On the other hand, if there is sufficient catch-up at the point of primary school transition, the
program effect on final schooling attainment could be significantly lower. Since less than 5% of our
2004 analysis sample has entered high school (consistent with the modal age of high school entrance
of 16), there is little ability to observe transitions to secondary school with available data, and
censored data models are unlikely to be appropriate for estimating the total effect of the program on
schooling attainment given the substantial barriers to secondary school enrollment which are likely to
generate sharp discontinuities in grade attainment around age 14.
In the 2004 TDHS estimates we gauge the nature of the bias by including in the regression the
interaction between program year and age to determine whether the program effect widens or narrows
over time (columns 7-12). In this specification, the baseline program effects are larger and more
precise in both district and household fixed effects models, while the coefficient estimate on the
interaction term between age of child and IOC is strongly negative, suggesting that the results
overestimate the effect of IOC on final schooling attainment. The gender difference is particularly
stark – and statistically significant – when the program effect is allowed to vary by age. This indicates
catch-up among slower girls as those who progressed rapidly through primary school begin to drop out
at the point of secondary school transition. The pattern is illustrated graphically in Figure 4, which
plots average grade progression by gender and the binary indicator of treatment status. Although
between ages 10 and 12 boys in program districts who received IOC have significantly lower
schooling attainment than boys who did not benefit from the program, there is no significant
difference in girls’ rate of progression through school according to in utero IOC at the same ages.
However, at ages 13 and 14, girls’ schooling in program cohorts and districts falls below that of
untreated girls, suggesting drop out at completion of primary school.
While observed gender differences in the impact of IOC may reflect physiological differences
in the importance of iodine for fetal brain development similar to those observed in animal studies,
- 18 -
there are two other possible interpretations for the gender findings. First, gender differences may
reflect the fact that girls in Tanzania systematically enter school at an earlier age than boys, a pattern
observed in the 1988 Census data as well as the 2000 THBS and 2004 TDHS data. If the importance
of cognitive ability on school pass rates increases with grade, as is likely to be the case, girls between
10 and 13 will benefit more from the intervention simply because they are more likely to be on the
margin of influence. Although the two trends are impossible to separate without information on age of
entry (unavailable from these sources), baseline gender differences in age of entry are relatively small.
To account for the full gender difference in IOC, a 0.2 year difference in age of entry would have to
correspond to twice the effect of IOC on attainment, which could only happen if the influence of
ability on pass rates were highly non-linear with age.
A more compelling reason for differences across girls and boys in the impact of IOC is that
parents’ decision to invest in girls’ schooling may be more sensitive to differences in cognitive
capacity. This could be the case if, for instance, the opportunity, financial or social cost of enrolling
girls in school were higher than that of boys due to girls’ higher productivity at home or greater
opportunities for marrying young. If so, the same cognitive benefit of IOC could translate into greater
schooling improvements for girls. Unfortunately, without data on cognitive capacity, there is no
simple way to distinguish this explanation from a disproportionate improvement in cognitive capacity
among girls. However, we can investigate the possibility by assessing whether girls’ rate of school
progression is more sensitive to ability in a regression of educational attainment on ability measures
available in an outside sample of Tanzanian school children. To do so, we use data from the 1993
Tanzanian Living Standards Measurement Survey, one of the few nationally representative household
surveys to collect cognitive test scores from a subset of survey respondents. In particular, 404 children
between the ages of 7 and 14 who were present in the home at the time of the interview were randomly
chosen to take a streamlined 16-question version of the Sabot’s test of cognitive ability, a test that
measures basic math and reading skills which has been used in evaluations of the Tanzanian school
system since the 1970s (Knight and Sabot, 1990). With this sample, we regress grade attainment on
gender, test score, and their interaction, controlling for year of birth. The results are presented in
Appendix B. If our previous results reflect parents’ gender-specific responses to ability, test score
should be a more powerful predictor of female than of male schooling attainment. Instead, the
estimates indicate that male and female school progression and enrollment are equally sensitive to
ability, which supports the interpretation that gender differences in schooling responses to IOC reflect
gender differences in the effect of IOC on ability.
- 19 -
5.2 Program Effects According to Local Diet
The final regression exercise divides districts in the sample according to level of cassava
consumption in order to examine variation in program effect according to intake of goitrogenous
foods. Goitrogens – including cabbage, legumes, chaya leaves, and cassava – are foods that contain
cyanogenic glycosides, which impede absorption of iodine by the thyroid gland (Bourdoux et al,
1978). Frequent consumption of such foods is one of the leading causes of IDD, and diets high in
natural goitrogens can induce IDD even if the diet is rich in iodine (Gaitan 1990; Thilly 1992).
Consistent with this, laboratory evidence suggests that goitrogens play a significant role in influencing
biochemical events that are unique to the developing brain (Rao and Lakshmy, 1995).
Cassava, one of the most goitrogenous food products, is a staple in much of Africa and a large
part of the diet in rural Tanzania. According to the 1991 THBS data, which contain detailed
information on household food items consumed, cassava (either flour, dried or fresh) was the second
most important food product after maize in terms of calories per day, and in 2000 was ranked third
after maize and sorghum.25 Cassava has the potential to significantly decrease iodine absorption if not
properly fermented.26 While the adverse effects of cassava can be countered with proper processing,
there have been few efforts to train local communities in alternative processing methods (Bilabina et
al, 1995; Delange et al, 1994).27
We predict a highly non-linear relationship between cassava consumption and program
impact. Although the need for iodine increases with consumption of goitrogenous foods, so does the
rate at which iodine – including that provided by the supplement – is depleted from the body by
regular intake of goitrogens. Hence, if consumed in high enough quantities, the cyogenic effect of high
cassava is likely to impair the impact of IOC. As a result, we anticipate a threshold level of cassava
consumption below which rates of IDD are too low to observe a significant average treatment effect,
and a second threshold above which 380 mg of iodine will be insufficient to protect against IDD due
to heightened daily requirements for iodine intake.
To test these predictions, the district rate of cassava production in 2000 is used to proxy for
variation in dietary intake 10 to 15 years prior. Specifically, a household was defined as a cassava
producer if they reported consuming during the past month any fresh or dried cassava or cassava flour
that was produced at home, and districts were classified according to the fraction of households in the
district that reported consuming home-produced cassava. In the regressions districts are divided into 25 For a description of these data, see Appendix 3. CALCULATING THE FOOD POVERTY LINE IN 2000/01 of the IFPRI document, “Analysis of the Tanzanian Household Budget Survey – Income poverty: Technical note on estimating poverty levels in Tanzania” prepared by Trudy Owens in March 2002. 26 According to Hetzel (2000), “Although a number of other staple foods contain potential goitrogens, in contrast to cassava the goitrogens are in the inedible portions of the plants and do not contribute importantly to IDD.” 27 In one study in Tanzania, insufficient cassava processing was correlated with TGR (Peterson, 1994).
- 20 -
terciles of cassava production. In high production regions, between 41 and 60% of households
consume home-grown cassava, compared with between 11 and 40% in medium production regions
and fewer than 10% of households in low productions districts. Given that households also eat cassava
produced outside, this clearly underestimates actual intake of goitrogens. However, geographic
variation in produce availability is likely to constitute a reasonable predictor of dietary differences a
decade earlier, which is arguably a preferable proxy of past diet than is current diet given recent
changes in household diet.
As predicted, the regression estimates reveal an inverted u-shaped relationship between
cassava consumption and impact of IOC on fetal brain development (Table 5). In areas with highly
goitrogenous diets the program appears to have had little effect, suggesting that maternal iodine from
IOC was depleted by intake of goitrogens. Meanwhile, in areas with relatively little cassava
consumption, the program effect is also small, which presumably reflects the fact that these were the
districts with relatively low baseline TGR. Figure 5 splits the sample into five categories of cassava
production and plots coefficient estimates from regressions on the separate sub-samples. These results
indicate that only the extreme outliers were unaffected by the intervention. Most striking is the
indication that areas with the highest TGR benefit the least from even a program as intensive as IOC.
5.3 Robustness Checks
One possible concern is that, because we are making inferences about program effect based on
cohort differences, our results may simply reflect time trends in schooling attainment that vary
systematically with program start dates. For instance, the age gap between 10 and 12 year-olds may be
lower in districts in which younger but not older siblings were treated simply because education is
increasing faster in districts that received IOC later. Importantly, because IOC was rarely distributed
according to the intended 2-year schedule, there are multiple instances of an older but not a younger
sibling receiving IOC, allowing us to check whether the program both reduces the grade attainment
gap when a younger sibling is treated and increases the gap when an older sibling is treated. In total,
among sibling pairs in the 2000 sample in which only one individual was treated, the older sibling was
treated in 23% of cases.28
Figure 6 shows the average difference in grade attainment across all sibling pairs in the 2000
sample, for three categories of siblings classified according to the binary indicator of treatment: (1)
those in which both or neither benefited from IOC; (2) those in which the older but not the younger
sibling benefited from IOC; and (3) those in which the younger but not the older sibling benefited
28 The asymmetry reflects the fact that most variation in program activity in this age group arises from program delays rather than gaps.
- 21 -
from IOC. Comparison across these groups reveals that the program effect is symmetric across the
latter two cases: When an older but not younger sibling is protected from IDD in utero, the difference
in schooling attainment widens, and when the younger but not older sibling is protected, the difference
narrows. Such a pattern could only be explained by a very complicated non-monotonic and district-
specific time trend in schooling. Furthermore, there is no measurable difference in average schooling
attainment when both siblings are treated versus when neither is treated. Regression estimates of grade
differences on sibling age gaps and indicators of which sibling received IOC reveal statistically
significant (at the 10% level) program effects of the expected sign in both comparisons (Table 6).
To verify that estimated program effects are not driven by time invariant district-specific
patterns of schooling attainment by age, we estimate a placebo regression of grade attainment among
children in the sample districts that were 10 to 13 in 1988 on a pseudo-indicator of IOC that pertains to
kids of the same age and district in 2000. Since children who were between 10 and 13 in 1988 were
too old to benefit from IOC in utero, if our results truly reflect an effect of IOC we should observe no
relationship between the treatment variable and schooling outcomes in this sample. These results are
presented in Table 7. For consistency with the previous estimates, we run the regressions separately by
gender using both household and district fixed effects. All household fixed effect regressions yield
small and insignificant estimates of the effect of program participation on 1988 schooling. In the
district fixed effects estimates, due to very large sample, estimated treatment effects achieve statistical
significance but the point estimates are close to zero and of the opposite sign as the previous results, so
cannot explain the treatment effects observed in 2000 and 2004.
5.4 Health Effects of IOC
The patterns of results observed in Tables 3-7 are consistent with a change in the cognitive
cost of schooling resulting from lower incidence of fetal IDD. However, since IQ is unobservable, the
channel of influence is impossible to verify. Since IDD has also been associated with infant and child
health outcomes in some but not all experimental studies in humans, it is possible that program
participation influenced schooling attainment of children in utero by improving their long-run physical
health which in turn increased the ability to attend and progress through school.29 Iodine deficiency
has been demonstrated in laboratory studies to influence fetal brain development much more readily
than physical development, however it is possible that its influence is distinct in this particular setting
such that the impact on physical health is more acute than the impact on cognition. Furthermore, even
if cognitive damage from IDD exceeds physical health damage, schooling attainment may be more
sensitive to physical health status than to cognitive ability at this level. 29 The evidence on the health effects of in utero IDD is mixed. See Allen and Gillespie (2001) for an overview..
- 22 -
To examine this possibility, we make use of health data on children in utero during the
program from the 2000 and 2004 surveys. The TDHS provides information on age of death of all
children born during the program years as part of each sample member’s reproductive history. Using
these data, we construct a new sample composed of all births to mothers of children in our sample
between 1990 and 1995, and regress binary indicators of fetal (less than 30 days), infant (30 days to 1
year), and child (1 to 15 years) mortality on the same program indicator of IDD protection in trimester
1. We define child mortality to include deaths occurring up to the highest age of sample members (14)
rather than the standard measure of deaths under age 5 in order to gauge the program effect on attrition
at any time prior to the survey. In addition, we approximate the program effect on conception and
early fetal mortality by looking at the program effect on births. To do so, we construct a panel dataset
in which an observation is a person-month between 1990 and 1995 and the outcome of interest is
whether the woman gave birth, regressed on the probability of IDD protection 7-9 months earlier
specific to women in a given district and month. Coefficient estimates on the variable of interest for
each regression are presented in Table 8, beginning with the fertility estimates.
The results indicate no effect of maternal iodine in early pregnancy on fecundity, fetal death
rates, or infant mortality rates (columns 1-9). However, there is some indication that the program
influenced child mortality after age 1 (columns 10-12). Regression results from the pooled sample
imply that IOC is associated with a 10 percentage point reduction in the probability of death between
ages of 1 and 15. This is strikingly high given baseline child mortality of 8.9% in treatment districts.
This result not only provides new evidence of the health benefits of IOC, but also has
relevance for the findings on grade attainment. The magnitude of the estimated effect and the fact that
previous studies have only found reductions in child mortality in combination with similar
improvements in neo- and peri-natal mortality, this finding should be interpreted with caution.
Nonetheless, there are three implications worth noting. First, the child mortality result indicates that
the education estimates may be contaminated by higher survival among children who received IOC in
utero. However, even if IOC reduced mortality, it is unlikely that higher child survival would give rise
to higher schooling attainment at ages 10-13 ceteris paribus given that child mortality presumably
selects out the most vulnerable. As a result, the average child who benefited from IOC in utero is
likely to have lower anticipated schooling attainment in the absence of the program, biasing our
estimates downward rather than upward. Furthermore there is no indication of gender differences in
the effect of IOC on survival at any age.
While selection on unobservables from differences in rates of child mortality associated with
IOC is not likely to bias our estimates towards finding an effect or account for the gender results, it is
possible that lower mortality among treated children corresponds to higher average health status
- 23 -
among survivors. Not only does this imply that the program effect may operate through differences in
health status rather than cognition, but it could also account for the gender difference if girls’
schooling is more sensitive to illness. To study this more closely, Table 9 presents results from
regressions of survivors’ health status at ages 10-13 on program participation analogous to the Table 3
estimates. The following health outcomes are available from the THBS: whether the child experienced
fever/malaria, diarrhea, an ear/nose/throat condition, a skin condition, an eye condition, or an
accidental injury during the last four weeks, frequency of illness over the past month, and total days of
work or school missed during the last four weeks due to any sickness or injury. The latter outcome is a
particularly useful test of whether the program effect operates through illness since school days missed
due to illness is the mechanism through which in utero health damage would most likely account for
the observed program effect on schooling.
Regression results indicate that children in utero during the program are no more likely to
experience illness at ages 10-13, suggesting no significant program effect on the average health status
of survivors. The estimates also indicate no relationship between IOC and school days missed due to
illness (column 1), nor is there any evidence that children covered by the program report fewer
episodes of ill health (column 2). Although the long run effects of in utero health shocks might show
up in a number of different childhood health outcomes given that fetal micronutrient deficiencies are
thought to weaken an individual’s overall immune system, the estimates in columns 2 through 6
indicate no program effect on a wide range of observable measures of child health at ages 10-13. This
set of findings suggests that the measured program effect of IOC operates through cognitive rather
than physical health improvements. Similarly, results from tables 8 and 9 provide evidence that the
estimated program effects are not driven by shocks to fetal health environment other than IOC that
coincided with the program.
6 PSLE Test Scores
In order to better connect our results on schooling attainment to improvements in cognitive
ability, we make use of district-level aggregate data on 2004 Primary School Leaving Examination
(PSLE) pass rates. At the end of primary school, children sit for the PSLE, which is required for
admittance to any lower secondary school in the country. The pass rate for this examination has
traditionally been abysmal despite the government’s ongoing goal of increasing the proportion of
children passing to 50%. In 1997, only 20.1% of pupils who sat for the PSLE passed the examination,
which has since increased to 22.0% in 2000 and 28.6% in 2001. Although roughly equal numbers of
boys and girls take the test, gender differences in PSLE pass rates are striking: In 2001, only 21.4% of
girls who sat for the PSLE passed the examination compared to 36.2% of boys. By 2004, although the
- 24 -
number and gender ratio of test-takers had changed little, the pass rate had improved considerably,
most likely due to a reported (though poorly documented) change in the grading policy: 43% of female
and 57% of male test-takers passed the exam, reducing the gender difference considerably in terms of
pass rates while maintaining roughly the same percentage point gender gap.
Our empirical analysis tests whether secondary school transition rates in 2004 are higher in
IOC districts conditional on district secondary school enrollment reported in the 1988 population
census, and whether transition rates improved disproportionately for girls.30 Test-takers in 2004 are
likely to fall between the ages of 14 and 18, so correspond almost perfectly to the cohort of children
most affected by IOC distribution, or kids aged 10-14 in the 2000 THBS data. The following PSLE
data are available from the Ministry of Education for 93 of the 106 districts in the country: number of
boys and girls who take the test in 2004, and number of boys and girls who receive each of five
categories of test grade, three of which constitute passing grades.31 With this information, we examine
the fraction of students who take the PSLE, and the fraction of test-takers who pass and therefore
transition to secondary school by running the following regressions separately by gender:
dd4d3d2d1d )( )88( ))04ln(( )(T )04kerln( εββββα +++++= Xhsratepopstestta (2)
dd4d3d2d1d )( )88( ))04kerln(( )(T )04ln( εββββα +++++= Xhsratestesttarstesttpasse (3)
In both estimates, an observation is a district. The first outcome, testtakers04d, is the number
of male or female individuals in district d who take the PSLE in 2004, T is whether there was IOC
distribution in district d between 1986 and 1992, pop04d is the number of males or females in district d
between the ages of 10 and 14 in the 2002 Census (therefore the high-school-age population in 2004),
and hsrate88d is the fraction of females or males age 21-25 in district d who were ever enrolled in
Form 1 or above according to the 1988 Census. In the second regression, the outcome is number of
girls or boys who pass the 2004 PSLE (achieve a grade of C or above), and the regression conditions
on number of test-takers. In both regressions, Xd contains the following set of district-level controls:
2000/2001 Gini coefficient of income inequality and percent of population below poverty line.32
Unfortunately, 2002 census data on school enrollment are currently unavailable, but 2004 PSLE pass
30 Since 2002 Census data is only available in five-year age groups, the transition rate is approximated by dividing the number of boys and girls passing the exam in 2004 by the number of boys and girls between the ages of 10 and 14 in 2002, or 12 to 16 in 2004. This is slightly younger than the average age of test-takers, which is unavailable in 2004, but the population figures are unlikely to differ across cohorts close in age. 31 PSLE data are missing for the islands of Pemba and Zanzibar, and the mainland region of Iringa, comprising 6 districts. No explanation is available from the Ministry of Education for the absence of data from these regions. 32 Data on education come from the 2004 Ministry of Education Basic Education Statistics (MoEC) and the 2000/01 THBS, as reported in R&AWG (2005).
- 25 -
rates are likely to be a reasonable proxy for the secondary school transition rate in the cohort of test-
takers given the extreme competition for slots in secondary schools and low PSLE pass rates.
Results from these regressions are presented in Table 10. The estimates in the first two
columns reveal that the rate at which students take the PSLE is not significantly higher for IOC
districts for either gender. The point estimates are positive but small and fall short of statistical
significance, which may reflect the fact that all students who have access to secondary school attempt
to enter. We do, however, observe that the number of individuals passing the PSLE is significantly
higher in IOC districts and particularly so for females. The point estimates of 0.24 and 0.15 on the
coefficients for IOC are significant at 5% for females and males respectively. While far from
conclusive, these results suggest that the IOC intervention may have positively affected the
distribution of scores on the PSLE, particularly the distribution of female scores. This is also observed
in a comparison of test score distributions across gender and program participation (Figure 7), which
reveals little difference in the distribution of male test scores across program and non-program regions
and a significantly lower fraction of scores in the lower tail of the grade distribution for girls.
Corresponding regression estimates suggest that districts that participated in IOC experienced a
significant decrease in the number of individuals receiving the lowest grade “F” while there is no
visible difference in the proportion of individuals in the upper tail of the distribution (columns 5-8).
The decrease is statistically significant for both genders but larger in magnitude for females.
7 Impact of universal salt iodization on cross-country comparisons
The magnitude of the estimated effect of IOC on schooling in Tanzania implies that
comparable reductions in iodine deficiency worldwide that have resulted from universal salt iodization
(USI) over the past two decades should be visible in improvements in aggregate schooling between
1980 and 2000. Hence, partly as a robustness check, the last section of the paper examines whether
cross-country differences in reductions in iodine deficiency that resulted from differences in the timing
and intensity of USI and differences in baseline levels of IDD are correlated with improvements in
schooling attainment over the same period.
7.1 Global trends in IDD and Salt Iodization
The International Council for the Control of Iodine Deficiency Disorders (ICCIDD) was
established in 1985 with the single purpose of achieving optimal iodine nutrition worldwide, and has
since worked closely with UNICEF and the World Health Organization towards this objective. The
resulting Universal Salt Iodization (USI) movement was based on the notion that IDD is easily and
inexpensively preventable through iodized salt (Mannar, 1996). In 1990, participants in the World
- 26 -
Summit for Children set a goal to eliminate IDD by the year 2000 through USI. Approximately 40
countries passed USI legislation between 1970 and 2000, the majority during the 1990s, resulting in an
increase of iodized salt intake from 20% of the world population to over 70%. Figure 8 shows current
prevalence of IDD and Figure 9 current estimates on the fraction of households consuming iodized
salt. On account of USI legislation and local distribution efforts, approximately two-thirds of the
previously IDD-affected population of Africa now consumes adequately iodized salt (Unicef, 2005).
7.2 Cross-country regression analysis
For the cross-country empirical analysis, data were compiled from 81 countries on the
following four key variables: primary and secondary enrollment in 1980 and 2000, which spans the
period during which the bulk of USI activity took place33; the most common indicator of iodine
deficiency, total goiter rate (TGR); and a widely available indicator of recent improvements in iodine
coverage, the percentage of households consuming iodized salt. All countries for which these four
measures were available were included in the analysis. School enrollment information was taken from
the World Bank’s World Development Indicators supplemented by the Barro-Lee Educational
Attainment Data for the 1980s; household consumption of iodized salt was gathered from UNICEF’s
Global Database on Universal Salt Iodization; and goiter rates were taken from the World Health
Organization’s Database on Iodine Deficiency and supplemented with Current Iodine Deficiency
Status (CIDDS) database maintained by the ICCIDD.34 To approximate the level of iodine deficiency
prior to salt iodization, TGR from a year prior to 1980 was used whenever possible, although in many
cases it was necessary to include TGR measured between 1990 and 1995. Figure 10 plots IDD and
degree of salt iodization for countries in Africa. As can be seen in the scatter plot, within Africa alone
there is substantial variation in both baseline IDD (TGR) and policy measures taken to reduce IDD.
In the first set of estimates, we examine the impact of iodine deficiency on changes in
schooling attainment over the past two decades by regressing male and female primary and secondary
enrollment in 2000 on 1980 enrollment along with baseline TGR and a standard set of control
variables.35 We then test whether reductions in IDD over this period are associated with improvements
33 The year 1980 is an appropriate pre-legislation measure of schooling for all countries that passed USI after 1975 due to the fact that children even in primary school in 1980 were born prior to the policy change. 34 WHO data, along with a detailed description of data sources and inclusion criteria are accessible on-line at: http://www3.who.int/whosis/mn/mn_iodine/. Both sources of TGR information compile estimates from a number of government and scientific sources, and there is a great deal of overlap. However, whenever more than one estimate was available, data were taken from the WHO database given that CIDDS estimates of goiter prevalence appear to be noisier due to the variety of ways TGR is calculated (palpation vs. ultrasound; range of the goiter rate vs. a single number, etc). 35 Control variables collected primarily from the World Bank Group’s World Development Indicators. All regressions include the following set of controls: Malaria prevalence, HIV prevalence, urbanicity (urban

- 27 -
in schooling attainment by adding to the regression the fraction of households consuming iodized salt
in 2000. All cross-country regression results are presented in Table 10.
Three important findings emerge: First, iodine deficiency is negatively associated with
improvements in female secondary school enrollment between 1980 and 2000. In particular, baseline
TGR appears to have a significant adverse effect on female secondary enrollment in 2000 conditional
on enrollment rates in 1980. Our results suggest that reducing TGR from 30 to 10 will increase
average female secondary school participation by approximately 7%.36 The point estimates are also
negative but lower and insignificant for males. Surprisingly, the estimated effect of baseline TGR on
1980 and 2000 primary school participation is not significantly different from zero in any of the
regressions. This is likely due to the higher degree of collinearity between TGR and 1980 primary
enrollment relative to TGR and 1980 secondary enrollment. In particular, secondary school enrollment
was so low in 1980 in many affected countries that IDD was less likely to pose a binding constraint.
Second, reductions in IDD between 1980 and 2000 appear to have had an important positive
effect on both male and female primary school participation, evidenced by the fact that both measures
are increasing in the fraction of households consuming iodized salt. The absence of a concomitant
effect of USI on secondary enrollment is consistent with this interpretation of the estimates given that
the bulk of changes in household use of iodized salt were too recent to affect the cohort of children
eligible for secondary school (children above age 12 in 2000).
Third, the effect of reductions in IDD on primary school enrollment appears to be significantly
larger for females. The influence of iodized salt on primary schooling enrollment is estimated to be
0.137 for females and significant at the 5% level (column 3). This estimate suggests that moving from
the current sample average of 60% to universal salt iodization (100%) would increase female primary
school participation by as much as 7%. Meanwhile, the point estimate remains positive but lower and
insignificant for males (column 4), consistent with our estimated effects of IOC in Tanzania.
These findings suggest that recent increases in iodine intake have had a beneficial impact on
cognitive development worldwide, particularly for females, and are consistent with the directions and
magnitudes of effects found in the micro-level estimates in Tanzania. Together with the previous
results, they underscore the importance of universal salt legislation for endemic regions, along with
complimentary measures to ensure deeper penetration in countries, including the majority of Western
Africa, for which legislation has failed to provide adequate protection. population as % of total population), population density (per square kilometer), log GDP per capita, log GDP per capita squared, and terms of trade (Export value Index / Import value index). 36 A 10% reduction in TGR is equivalent to a 3 point drop in average TGR from 30.66 in our dataset. We calculate the average increase in female secondary school participation (0.7) based on the estimated effect of TGR in Table 10 (column 5). We calculate the percentage increase in female secondary school participation (1.5%) by dividing the increase in participation (0.7) by the average participation rate of 50.71 in our dataset.

- 28 -
7.3 Projections
Based on the estimated impact of IOC in Tanzania, we calculate the expected gains in
education that should be observed by 2015 among the 42 countries that experienced unambiguous
reductions in IDD through USI legislation passed in the 1980s and 1990s. Baseline levels of TGR in
these countries ranged from 10% to 52%, compared with an average of 30% and range of 10-75%
among districts that participated in the Tanzanian IOC program. In each country, we estimate the
number of children that were newly protected from fetal IDD over the past decade by multiplying the
number of children at risk pre-legislation by the fraction of households using adequately iodized salt in
2000, which varies from 7% in Niger to 86.1% in Nicaragua. The number of children previously at
risk is the population of children aged 5-9 in 2002 times the rate of in utero IDD. The pre-legislation
rate of in utero IDD is conservatively assumed to be twice the baseline TGR among school-age
children based on the fact that TGR is approximately three times more prevalent and the ratio of
recommended iodine intake twice as high in pregnant women compared to school-age children.
According to our estimates, approximately 41.1 million children between the ages of 5 and 9
in 2002 have benefited from increases in iodine intake over the past decade, with the largest
populations of newly protected children found in Algeria, Indonesia and Nigeria. Based on our
previous estimates, the expected increase in grade attainment for a child protected from fetal IDD is a
minimum of 0.73 years.37 Multiplying the expected increase in schooling per treated child by the
estimated number of children who are newly protected, we calculate an anticipated overall impact of
USI for each country ranging from 0.5% to 40%, with the largest gains in Africa. Based on our
estimates, 13 countries should experience more than a 10% improvement in schooling attainment by
the year 2015. Among all affected countries, the increase in average schooling due to USI amounts to
4.8%. For Central and Southern Africa, the predicted improvement in average schooling across all
countries in the region is 7.5%.
8 Conclusions
We emphasize three conclusions from this analysis. First, our findings provide micro-level
evidence of an important role of geography in economic development that operates through the
influence of mineral availability on cognition. Our estimates indicate that variation in iodine
availability likely plays an important role in economic growth as human capital investment falls with
rates of learning disability. Even holding schooling attainment constant, small differences in average
IQ at the group level could have large effects on social and economic outcomes.
37 This effect is calculated from the baseline effect (0.36 years) observed in Tanzania adjusted for an average IOC take-up rate assumed to be 78% and the average rate of maternal IDD (60%) in the target population.

- 29 -
Second, our findings support laboratory evidence that the female fetus is more sensitive to in
utero iodine exposure, such that endemic iodine deficiency may give rise to gender differences in
cognitive ability. The possibility that physiological gender differences exert a significant influence on
schooling has important implications for how we interpret gender differences in schooling attainment
across the globe and over time.
Finally, reduced levels of IDD due to wide-scale salt iodization in the 1990s are likely to have
a visible impact on schooling attainment in previously afflicted areas over the next two decades, and
these changes are likely to disproportionately benefit girls. Our estimates indicate that at least 41
million children have been affected by these reforms, which could increase average schooling
attainment in many countries by over 10%. In areas with baseline IDD comparable to districts in the
middle range of our sample, universal salt iodization could go far towards achieving gender parity in
schooling attainment. Reduced fetal IDD among the birth cohorts of 1990-2000 will be important to
bear in mind when interpreting changes in schooling attainment in much of Africa and other parts of
the developing world over the coming decade.
However, our findings also provide evidence that universal salt iodization will not eliminate
the adverse cognitive effects of fetal IDD among populations in the most afflicted settings where diets
high in goitrogens require higher supplement levels or other dietary changes in order to overcome
maternal IDD. In these areas, more intensive interventions such as IOC or introducing new methods of
cassava processing are necessary to achieve current Millennium Development Goals regarding
micronutrient deficiencies. Although such approaches are significantly more costly than salt
iodization, the resulting gains in schooling attainment suggested by our findings indicate that future
returns well outweigh the costs.
- 30 -
9 References
Acemoglu, D, S Johnson, and J Robinson (2002). Reversal of Fortune: Geography and Development in the Making of the Modern World Income Distribution. Quarterly Journal of Economics 117(4): 1231-1294.
Allen L and S Gillespie (2001). What Works? A review of efficacy and effectiveness of nutrition interventions. UN (ACC/SN).
Bautista, A, PA Barker, JT Dunn, M Sanchez, and DL, Kaiser (1982). The effects of oral iodized oil on intelligence, thyroid status, and somatic growth in school-age children from an area of endemic goiter. The American Journal of Clinical Nutrition 35:127-134.
Barker DJ, PD Winter, C Osmond, B Margetts, SJ Simmonds (1989). Weight in Infancy and Death from ischaemic heart disease. Lancet 2: 577-80.
Basta SS, Soekirman Karyadi D, Scrimsha NS. (1979). Iron deficiency anemia and the productivity of adult males in Indonesia. American Journal of Clinical Nutrition 32: 916-25.
Beaton GH, Martorell R, L’Abbe KA, Edmonston B, McCabe G, Ross AC and Harvey B. (1992). Effectiveness of Vitamin A Supplementation in the Control of Young Child Morbidity and Mortality in Developing Countries. SCN State-of-the-Art Nutrition Policy Discussion Paper No. 13.
Behrman JR, Hoddinott J, Maluccio J, Martorell R, Quisumbing A, Stein A (2003). The Impact of Experimental Nutritional Intervention in Childhood on Education Among Guatemalan Adults. International Food Policy Research Institute: Brief Discussion Paper 207.
Biassoni P, Ravera G, Schenone F, Green J, Bertocchi J (1990). Ouham-Pende: A new endemic goiter area in the Centroafrican Republic (CAR): Epidemiological survey on 7261 subjects. Thyriodology 2: 35-40.
Benoist B, Andersson M, Egli I, Takkouche B, Allen H (2004). Iodine Status Worldwide: WHO Global Database on Iodine Deficiency. World Health Organization. ISBN 92 4 159200 1.
Bleichrodt N, Born MA (1994). A meta-analysis of research on iodine and its relationship to cognitive development. Report of the Franklin Symposium: Iodine deficiency and brain damage. Cognizant Communications Corporation.
Boyages SC, Halpern JP, Maberly GF, Eastman CJ, Morris J, Collins J, Jupp JJ, Jin CE, Wang ZH, You CY (1988). A comparitive study of neurological and myxedematous endemic cretinism in Western China. Journal of Clinical. Endocrinology & Metabolism. v67: 1262-66.
Bourdoux P, Delange F, Gerard M, Mafuta M, Hanson A, Ermans AM (1978). Evidence that Cassava Ingestion Increases Thiocyanate Formation: A Possible Etiological Factor in Endemic Goitre. Journal of Clinical. Endocrinology & Metabolism 46: 613-621.
Cao XY, Jiang XM, Dou ZH (1994). Timing of vulnerability of the brain to iodine deficiency in endemic cretinism. New England Journal of Medicine 331: 1739–44.
Chan SY, MH Andrews, R Lingas, CJ McCabe, JA Franklyn, MD Kilby, and SG Matthews (2005). Maternal nutrient deprivation induces sex-specific changes in thyroid hormone receptor and deiodinase expression in the fetal guinea pig brain. Journal of Physiology 566(Pt 2): 467–480.
Connolly KJ, Pharoah PO, and Hetzel BS (1979). Fetal iodine deficiency and motor performance during childhood. Lancet 2:1149 –51.
- 31 -
Delange F, Lecomte P (2000). Iodine supplementation: benefits outweigh risks. Drug Safety 22(2):89-95.
Delange F (2000). The role of iodine in brain development, Proceedings of Nutrition Society 59(1): 75-80.
Delange F, Ekpechi L, Rosling H. (1994). Cassava cyanogenesis and iodine deficiency disorders. Paper presented to the International workshop on cassava safety, Ibadan, Nigeria, Acta Horticulturae, International Society for Horticultural Sciences.
Delange F (1998). Risks and benefits of iodine supplementation. Lancet 351(9107): 923-924, March 28.
Dugbartey, A (1998). Neurocognitive aspects of hypothyroidism, Archives of Internal Medicine.158(13):1413-1418, July 13.
Eltom M, Karlsson FA, Kamal AM, Bostrom H, and Dahlberg PA (1985). The effectiveness of oral iodized oil in the treatment and prophylaxis of endemic goiter. Journal of Clinical Endocrinology and Metabolism 61(6):1112-7.
Friedhoff AJ, Miller JC, Armour M, Schweitzer JW, and Mohan S. (2000). Role of maternal biochemistry in fetal brain development: effect of maternal thyroidectomy on behaviour and biogenic amine metabolism in rat progeny. International Journal of Neuropsychopharmacoogy 3: 89–97.
Furnee CA (1997). Prevention and control of iodine deficiency: a review of a study on the effectiveness of oral iodized oil in Malawi. European Journal of Clinical Nutrition 51(Suppl 4):S9-10.
Gaitan E and Dunn J (1990). Goitrogens in food and water. Annual Review of Nutrition 10: 21-39.
Galler JR, Ramsey F, Solimano G, Kucharski LT, Harrison R. (1983). The influence of early malnutrition on subsequent behavioral development, II, Classroom behavior. Journal of the American Academy of Child Psychiatry 22 : 16-22.
Galler JR (1984). Behavioral consequences of malnutrition in early life. In : JR Galler (ed.) Nutrition and Behavior. New York : Plenum Press.
Glasizou PP, Mackerras DEM (1993). Vitamin A supplementation in infectious diseases: a meta-analysis. British Medical. Journal 306: 366-70.
Haddow, J, Palomaki G, Allan W, Williams J, Knight G, Gagnon J, O’Heir C, Mitchell M, Hermos Rosalie, Waisbren S, Faix J, Klein R. (1999). Maternal thyroid deficiency during pregnancy and subsequent neuropsychological development of the child, New England Journal of Medicine.August; 341(8):549-555.
Halpern J-P, Boyages SC, Maberly GF, Collins JK, Eastman CJ, Morris JG. (1991). The neurology of endemic cretinism: A study of two endemias. Brain 114: 825-41.
Henderson, J and A Venables (2001). Geography and Development, Journal of Economic Geography: 81-105.
Hetzel, BS (1983). IDD and Their Eradication. Lancet ii: 1126-1129.
- 32 -
Hetzel, BS (1988). The Prevention and Control of Iodine Deficiency Disorders. Nutrition Policy Discussion Paper No. 3, ACC/SCN State-of-the-Art Series, United Nations Administrative Commitee on Coordination/Subcommittee on Nutrition.
Hetzel BS (1989). The story of iodine deficiency. Oxford University Press, Oxford, UK.
Hetzel BS, Mano M (1989). A review of experimental studies of iodine deficiency during fetal development, Journal of Nutrition 119: 145-151.
Hetzel BS (2000). Iodine and neuropsychological development. Journal of Nutrition 130(2S Suppl): 493S-495S.
Hussain KHD. (1981). Evaluation of nutritional anemia intervention among anemic female workers on a tea-plantation. Iron Deficiency and Work Performance 73. Washington DC: Nutrition Fund.
Knight, J and R Sabot (1990). Education, Productivity, and Inequality, Oxford University Press for the World Bank.
Lamberg BA (1991). Endemic goiter-iodine deficiency disorders. Annalsof Medecine 23: 367-72.
Lavado-Autric R, Auso E, Garcia-Velasco JV, Arufe Mdel C, Escobar del Rey F, Berbel P, Morreale de Escobar G (2003). Early maternal hypothyroxinemia alters histogenesis and cerebral cortex cytoarchitecture of the progeny. Journal of Clinical Investigation 111:1073–82.
Maberly G, Trowbridge F, Yip R, Sullivan K, West C. (1994). Programs against micronutrient malnutrition: Ending hidden hunger. Annual Review of Public Health 15:277-301.
Magombo F (1990). An investigation into factors leading to some resistance to a new innovation: The case of iodinated oil capsule distribution: Rukwa Region, Tanzania. Tanzania Food and Nutrition Centre, TFNC report No 1242.
Mannar M (1996). The iodization of salt for the elimination of iodine deficiency disorders. SOS for a Billion. Hetzel & C. Pandav. Dehli: Oxford University Press.
Marett, JRH (1936). Race, Sex and Environment: A Study of Mineral Deficiency in Human Evolution. London: Hutchinson’s Scientific and Technical Publications, 342 pgs.
Merke F (1984). The History and Ichnography of Endemic Goitre and Cretenism. Lancaster: MTP Press.
Miguel E, Kremer M (2004). Worms: Identifying Impacts On Education And Health In The Presence Of Treatment Externalities. Econometrica 72: 159-217.
Painter RC, TJ Roseboom, OP Bleker (2005). Prenatal Exposure to the Dutch Famine and disease in later life: an overview. Reproductive Toxicology 0(3): 345-352
Pandav CS, Kochupillai N. (1982). Endemic goitre in India: Prevalence, etiology, attendant disabilities and control measures. Indian Journal of Pediatrics 50: 259
Peterson S (2000). Controlling Iodine Deficiency Disorders: Studies for Program Management in Sub-Saharan Africa. Uppsula Dissertations from the Faculty of Medecine 943.
- 33 -
Peterson S, Assey V, Forsberg B, Greiner T, Kavishe FP, Mduma B, Rosling H, Sanga B, Gebre-Medhin M (1998). Coverage and cost of iodized oil capsule distribution in Tanzania. Health Policy and Planning 14(4):390-399.
Pharoah PO, Connolly KJ (1987). A controlled trial of iodinated oil for the prevention of endemic cretinism: a long-term follow-up. International Journal of Epidemiology 16:68 –73.
Pop V, Kuijpens J, van Baar A, Verkerk G, van Son M, Vijlder J, Vulsma T, Wiersinga W, Drexhage H, Vader H. (1999). Low maternal free thyroxine concentrations during early pregnancy are associated with impaired psychomotor development in infancy. Clinical Endocrinology 50(2):149-155.
Rao PS, and R Lakshmy (1995). Role of goitrogens in iodine deficiency disorders & brain development. Indian Journal of Medical Research 102: 223-6.
Research and Analysis Working Group (R&AWG) (2005). Tanzania poverty and human development report 2005. Ministry of Planning, Economy and Empowerment, Poverty Eradication Division. Dar es Salaam, Tanzania. Available at: www.povertymonitoring.go.tz
Richardson (1995). The behavior of children at home who were severely malnourished in the first 2 years of life. Journal of Biosocial Science 7: 255-67.
Rodrik, D, A Subramanian, F Trebbi (2004). Institutions rule: The Primacy of institutions over geography and integration in economic development, Journal of Economic Growth 9(2).
Sachs, J (2003). Institutions don't rule: Direct effects of geography on per capita income. NBER Working Paper 9490.
Sachs, J and JL Gallup (2001). The Economic burden of malaria. The Supplement to The American Journal of Tropical Medicine & Hygiene, 64(1): 85-96.
Shrestha, RM and CE West (1994). Role of Iodine in Mental and Psychomotor Development: An Overview. Wageningen, Netherlands: Grafisch Service Centrum.
Simon, PA, DT Jamison and MA Manning. (1990). Gender differences in Goiter prevalence: A review. Los Angeles, CA: University of California Press.
Sommer A. Tarwotjo I, Hussaini G, Susanto D, Soegiharto T. (1981). Incidence, prevalence, and scale of blinding malnutrition. Lancet 1: 1407-8
Sommer A Tarwotjo I, Djunaedi E, West KP, Loeden AA, Tilden R, Mele L. (1986). Impact of vitamin A supplementation on childhood mortality: A randomized controlled community trial. Lancet 1: 1169-73
Sundqvist J, Wijetunga M, Assey V, Gebre-Medhin M, Peterson S. (1988). Salt iodation and risk of neonatal brain damage. Lancet 352(9121):34-35.
Tanzanian Census (1988). Dar Es Salaam: Bureau of Statistics, Ministry of Finance, Economic Affairs and Planning.
Thomas D and Frankenberg E. (2002). Bulletin of the World Health Organization. 80.2: 106-113.
Thomas D, Frankenberg E, Friedman J, Habicht J-P, Hakimi M, Jaswadi, Jones N, McKelvey C, Pelto G, Sikoki B, Seeman T, Smith H, Sumantri C, Suriastini W, Wilopo S. (2003). Iron Deficiency and the Well Being of Older Adults: Early Results from a Randomized Nutrition Intervention. Mimeo, UCLA
- 34 -
UNICEF (2004). A pinch of salt can go further In West Africa. Press center: http://www.unicef.org/media/media_23686.html
Untoro, J, Schultink W, Gross R, West CE, Hautvast JG. (1998). Efficacy of different types of iodised oil. Lancet 351(9104): 752-753, March 7.
Utiger, RD (1999). Maternal hypothyroidism and fetal development. New England Journal of Medicine 341(8):601-602.
Van der Haar F, Kavishe P, Medhin MG (1988). The public health importance of IDD in Tanzania. Central African Journal of Medicine 34(3): 60-5.
Vermeersch, C (2003). School Meals, Educational Achievement and School Competition: Evidence from a Randomized Evaluation. Mimeo, University of Oxford.
West KP, Howard JR, Sommer A. (1989). Vitamin A and Infection: Public health implications. Annual Review of Nutrition 9: 63-86.
Jun W and L Jianqun (1985). Metabolism of iodized oil after oral administration in guinea pigs. Nutrition Reports International 31, 1085-1087.
Wolff, J (2001). Physiology and pharmacology of iodized oil in goiter prophylaxis. Medicine 80: 20-36.
WHO (1991). National strategies for overcoming micronutrient malnutrition, EB 89/27.
WHO (1992). National strategies for overcoming micronutrient malnutrition, A45/17.
Zaleha, I, IZ Alias, KA Kadir, and O Ali (2000). Effect of iodized oil supplementation on thyroid hormone levels and mental performance among Orang Asli schoolchildren and pregnant mothers in an endemic goitre area in Peninsular Malaysia. Asia Pacific Journal of Clinical Nutrition 9 (4): 274–281.
Zimmermann MB, Aeberli I, Torresani T, Burgi H. Increasing the iodine concentration in the Swiss iodized salt program markedly improved iodine status in pregnant women and children: a 5-y prospective national study. American Journal of Clinical Nutrition. Aug 2005; 82(2): 388-92.
Zoeller, RT and J Rovet (2004). Timing of Thyroid Hormone Action in the Developing Brain: Clinical Observations and Experimental Findings [REVIEW ARTICLE]. Journal of Neuroendocrinology 16: 809–818.

- 35 -
Figure 1: Intervention districts
Tabora
Mpanda
Nkansi
Sumbawanga Rural
Chunya
Mbozi
Sumbawanga Urban
Kigoma Rural
Sikonge
Urambo
Mbarali
MaketeRungweIleje
Kyela
MbeyaMbeya Urban
Ludewa
Mbinga
Njombe
Mufindi
Iringa
Manyoni
Singida
Dodoma
KondoaTabora Urban
Kahama
Kasulu
Kigoma Urban
Kibondo
Bukombe
Bukoba Rural
NgaraBiharamulo
Karagwe
Sengerema
Geita
Muleba
Bukoba Urban
Maswa
IrambaIgungaNzega
ShinyangaShinyanga Urban
Mbulu
Singida UrbanHanang
Meatu
Ngorongoro
Kwimba
Mwanza
Misungwi
Magu
Ukerewe
Tarime
Serengeti
Bariadi
Musoma
Bunda
Musoma Urban
Morogoro Urban
Rufiji
Ulanga
Tunduru
Nachingwea
Liwale
Mpwapwa
Kilombero
Iringa Urban
Morogoro RuralKilosa
Kilwa
NewalaMasasi
RuangwaLindi Rural
Mtwara RuralTandahimba
Lindi Urban
Matwara Urban
MkulangaKisarawe
Mafia
Temeke
Bagamoyo
Same
Kiteto
Dodoma UrbanKongwa
Handeni
Simanjiro
ArushaArumeruMoshi Rural
Mwanga
HaiMoshi Urban
Rombo
Kaskazini 'B'
KinondoniKibaha
Kusini
Ilala
MagharibiMjiniKati
Tanga
Pangani
Lushoto
KorogweMuheza
Mkoani
Kaskazini 'A'
WeteChake Chake
Micheweni
Songea TownSongea Rural
Babati
Karatu
Monduli
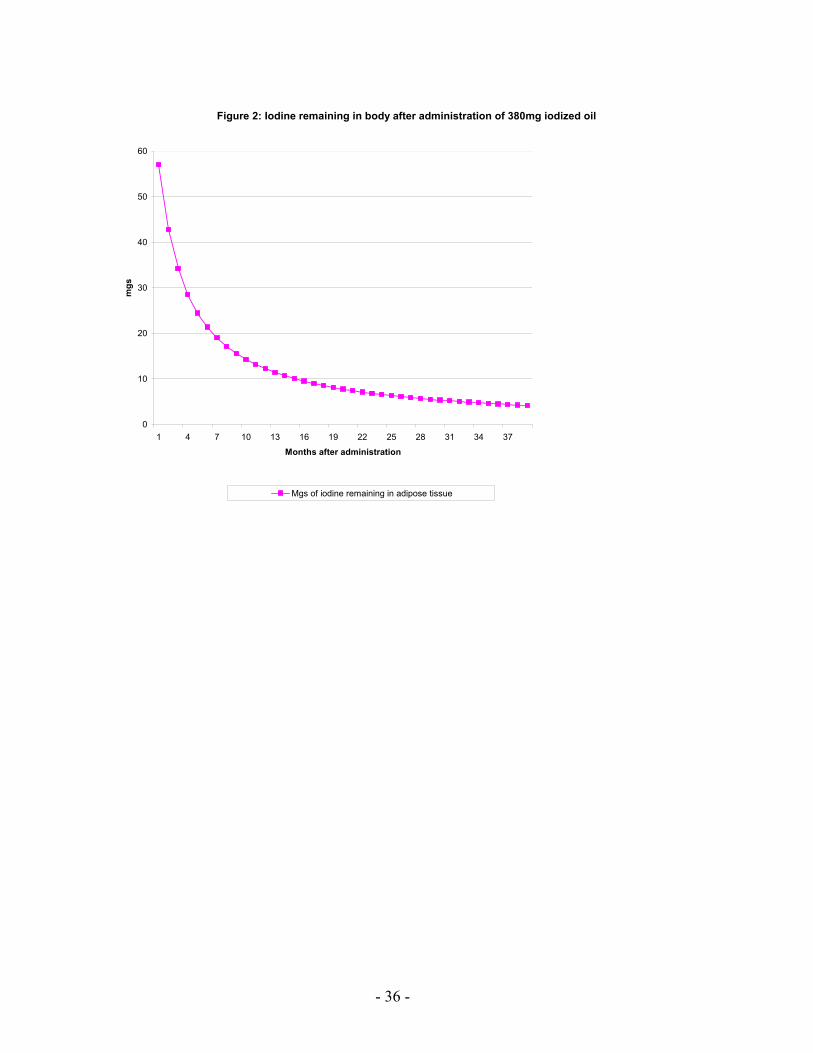
- 36 -
Figure 2: Iodine remaining in body after administration of 380mg iodized oil
0
10
20
30
40
50
60
1 4 7 10 13 16 19 22 25 28 31 34 37
Months after administration
mgs
Mgs of iodine remaining in adipose tissue
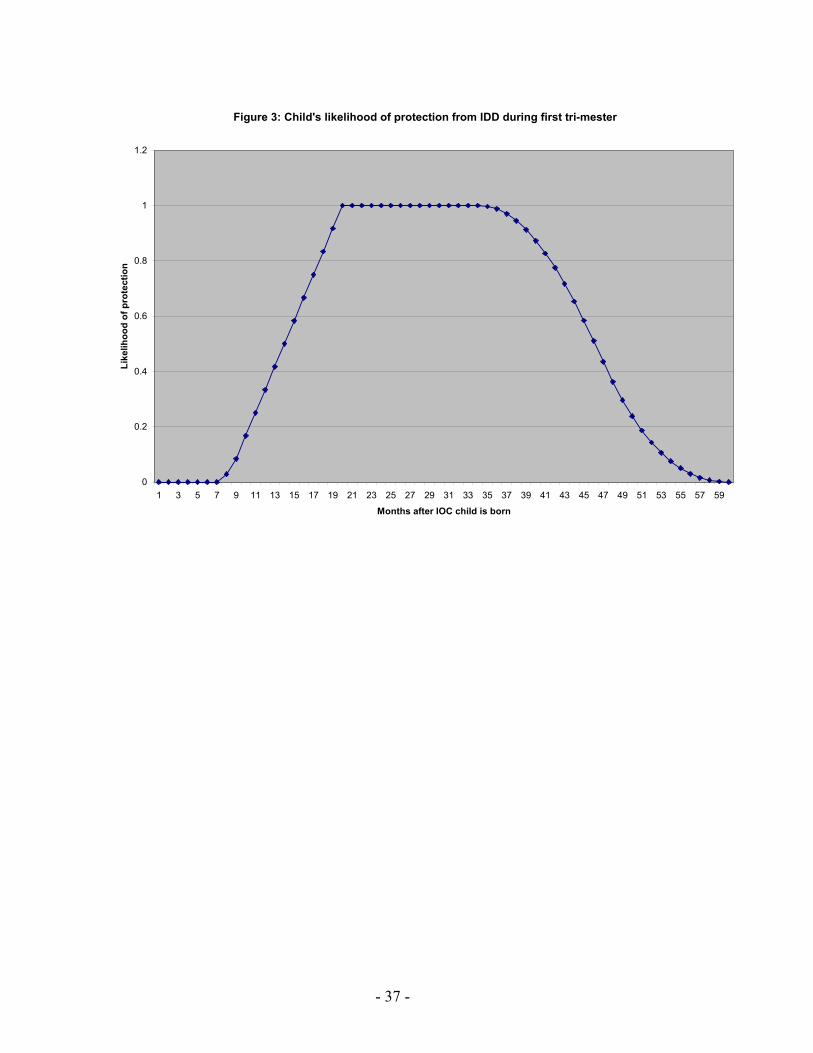
- 37 -
Figure 3: Child's likelihood of protection from IDD during first tri-mester
0
0.2
0.4
0.6
0.8
1
1.2
1 3 5 7 9 11 13 15 17 19 21 23 25 27 29 31 33 35 37 39 41 43 45 47 49 51 53 55 57 59
Months after IOC child is born
Like
lihoo
d of
pro
tect
ion
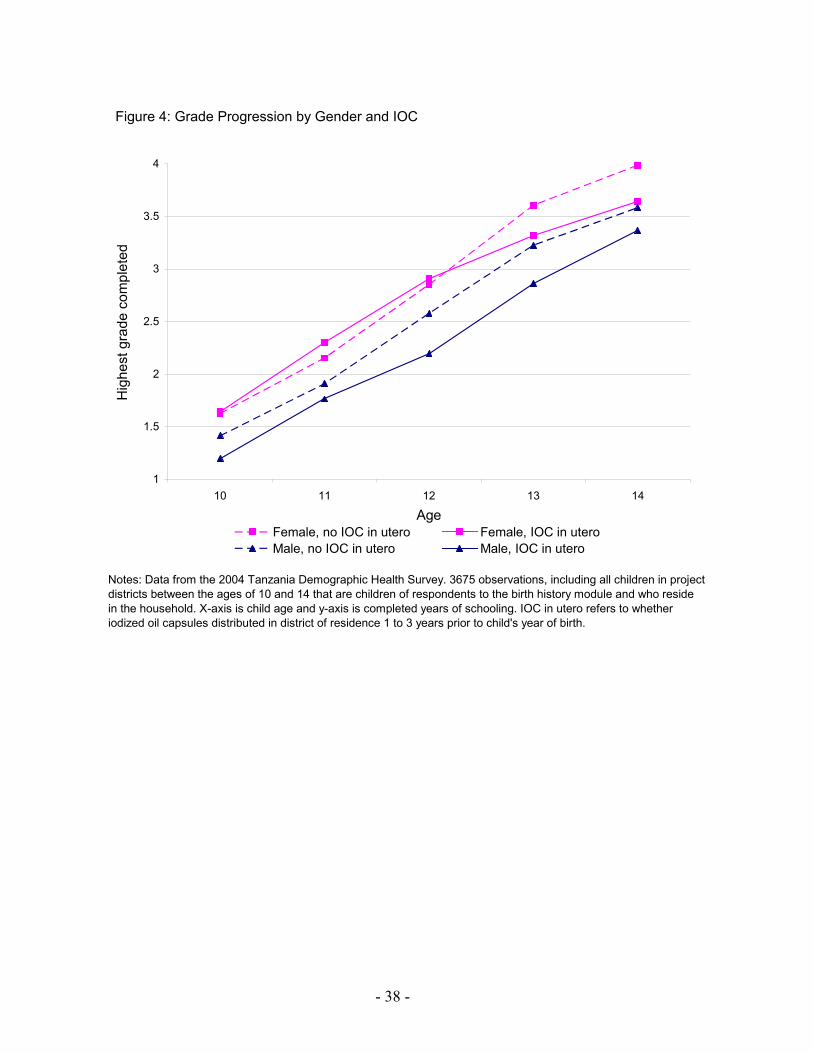
- 38 -
Notes: Data from the 2004 Tanzania Demographic Health Survey. 3675 observations, including all children in project districts between the ages of 10 and 14 that are children of respondents to the birth history module and who reside in the household. X-axis is child age and y-axis is completed years of schooling. IOC in utero refers to whether iodized oil capsules distributed in district of residence 1 to 3 years prior to child's year of birth.
Figure 4: Grade Progression by Gender and IOC
1
1.5
2
2.5
3
3.5
4
10 11 12 13 14
Age
Hig
hest
gra
de c
ompl
eted
Female, no IOC in utero Female, IOC in uteroMale, no IOC in utero Male, IOC in utero
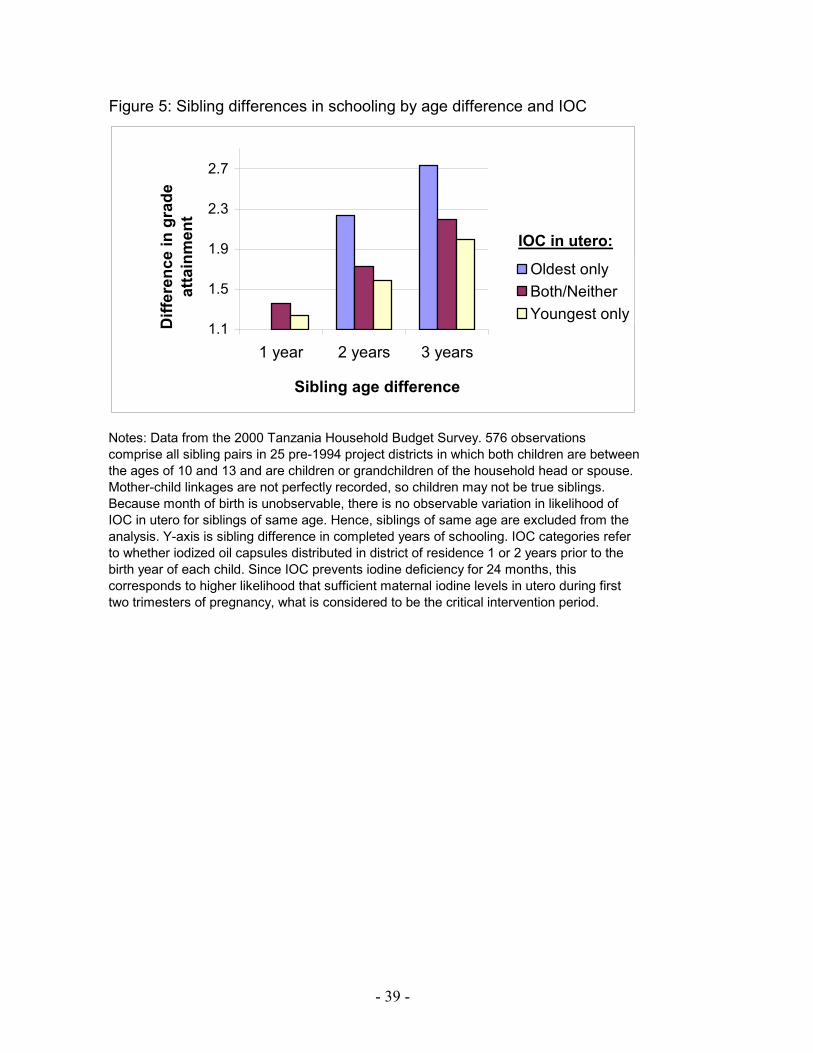
- 39 -
Figure 5: Sibling differences in schooling by age difference and IOC
Notes: Data from the 2000 Tanzania Household Budget Survey. 576 observations comprise all sibling pairs in 25 pre-1994 project districts in which both children are between the ages of 10 and 13 and are children or grandchildren of the household head or spouse. Mother-child linkages are not perfectly recorded, so children may not be true siblings. Because month of birth is unobservable, there is no observable variation in likelihood of IOC in utero for siblings of same age. Hence, siblings of same age are excluded from the analysis. Y-axis is sibling difference in completed years of schooling. IOC categories refer to whether iodized oil capsules distributed in district of residence 1 or 2 years prior to the birth year of each child. Since IOC prevents iodine deficiency for 24 months, this corresponds to higher likelihood that sufficient maternal iodine levels in utero during first two trimesters of pregnancy, what is considered to be the critical intervention period.
1.1
1.5
1.9
2.3
2.7
1 year 2 years 3 years
Sibling age difference
Diff
eren
ce in
gra
de
atta
inm
ent
Oldest onlyBoth/NeitherYoungest only
IOC in utero:
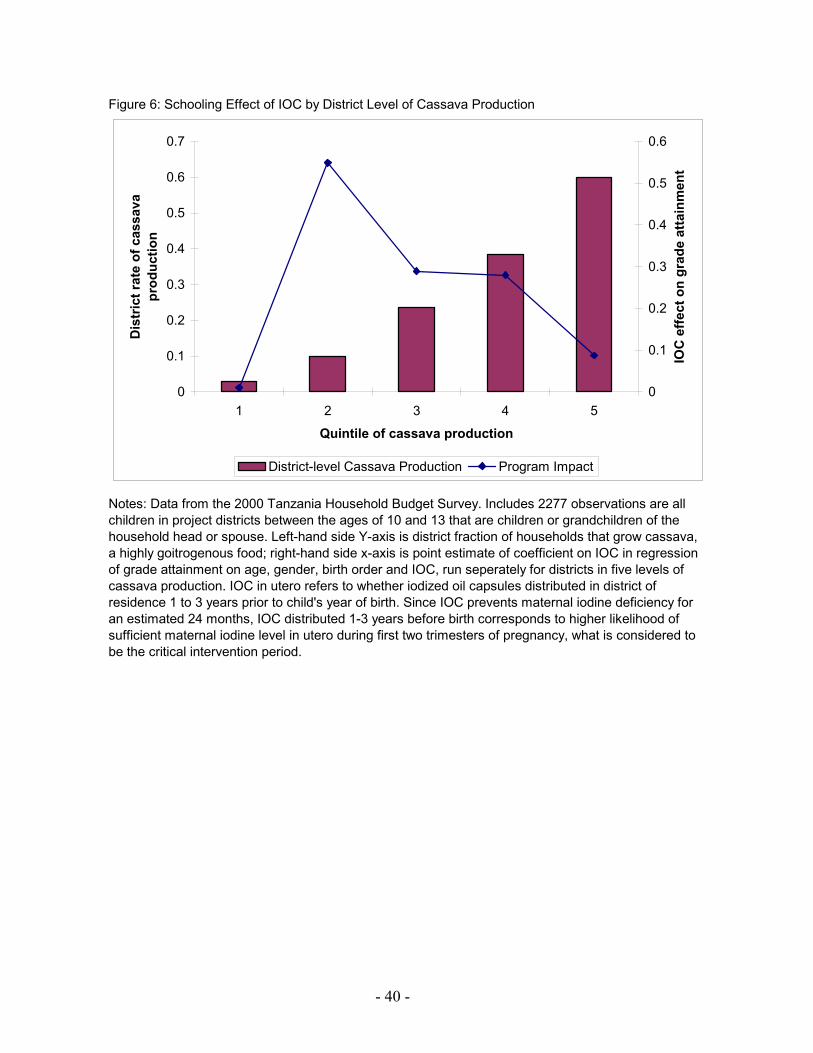
- 40 -
Figure 6: Schooling Effect of IOC by District Level of Cassava Production
Notes: Data from the 2000 Tanzania Household Budget Survey. Includes 2277 observations are all children in project districts between the ages of 10 and 13 that are children or grandchildren of the household head or spouse. Left-hand side Y-axis is district fraction of households that grow cassava, a highly goitrogenous food; right-hand side x-axis is point estimate of coefficient on IOC in regression of grade attainment on age, gender, birth order and IOC, run seperately for districts in five levels of cassava production. IOC in utero refers to whether iodized oil capsules distributed in district of residence 1 to 3 years prior to child's year of birth. Since IOC prevents maternal iodine deficiency for an estimated 24 months, IOC distributed 1-3 years before birth corresponds to higher likelihood of sufficient maternal iodine level in utero during first two trimesters of pregnancy, what is considered to be the critical intervention period.
0
0.1
0.2
0.3
0.4
0.5
0.6
0.7
1 2 3 4 5
Quintile of cassava production
Dis
tric
t rat
e of
cas
sava
pr
oduc
tion
0
0.1
0.2
0.3
0.4
0.5
0.6
IOC
effe
ct o
n gr
ade
atta
inm
ent
District-level Cassava Production Program Impact
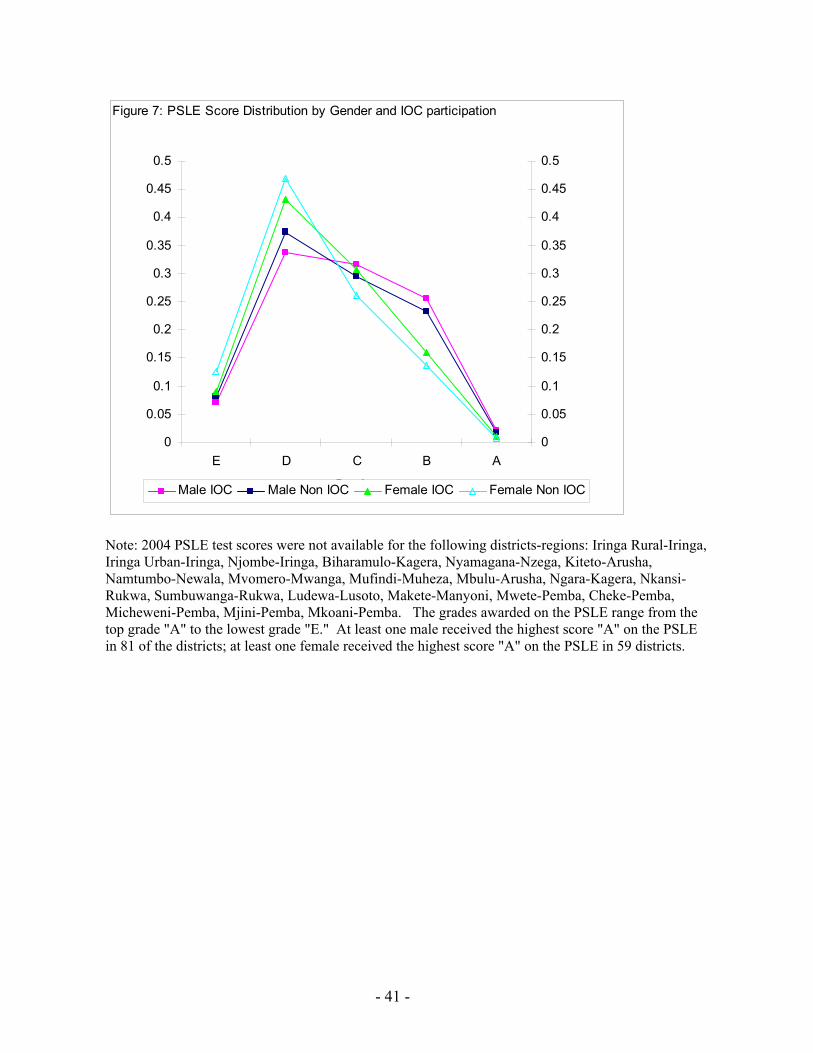
- 41 -
Figure 7: PSLE Score Distribution by Gender and IOC participation
0
0.05
0.1
0.15
0.2
0.25
0.3
0.35
0.4
0.45
0.5
E D C B A
Grades
0
0.05
0.1
0.15
0.2
0.25
0.3
0.35
0.4
0.45
0.5
Male IOC Male Non IOC Female IOC Female Non IOC
Note: 2004 PSLE test scores were not available for the following districts-regions: Iringa Rural-Iringa, Iringa Urban-Iringa, Njombe-Iringa, Biharamulo-Kagera, Nyamagana-Nzega, Kiteto-Arusha, Namtumbo-Newala, Mvomero-Mwanga, Mufindi-Muheza, Mbulu-Arusha, Ngara-Kagera, Nkansi-Rukwa, Sumbuwanga-Rukwa, Ludewa-Lusoto, Makete-Manyoni, Mwete-Pemba, Cheke-Pemba, Micheweni-Pemba, Mjini-Pemba, Mkoani-Pemba. The grades awarded on the PSLE range from the top grade "A" to the lowest grade "E." At least one male received the highest score "A" on the PSLE in 81 of the districts; at least one female received the highest score "A" on the PSLE in 59 districts.
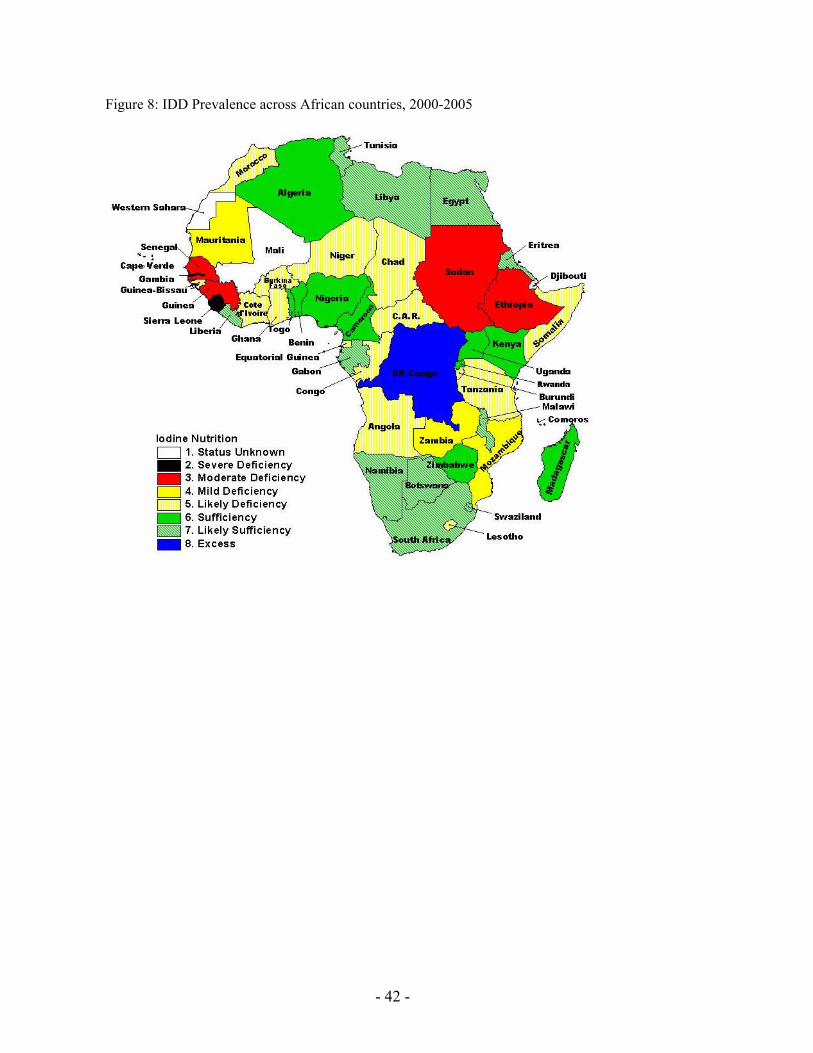
- 42 -
Figure 8: IDD Prevalence across African countries, 2000-2005
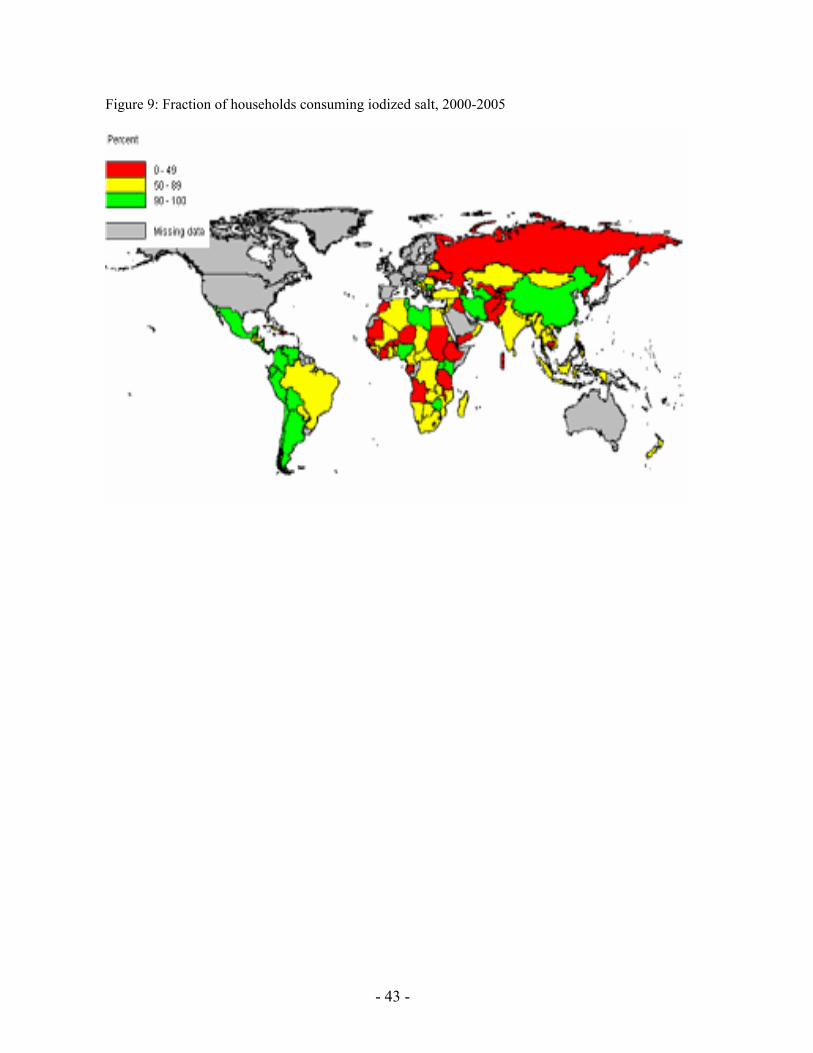
- 43 -
Figure 9: Fraction of households consuming iodized salt, 2000-2005
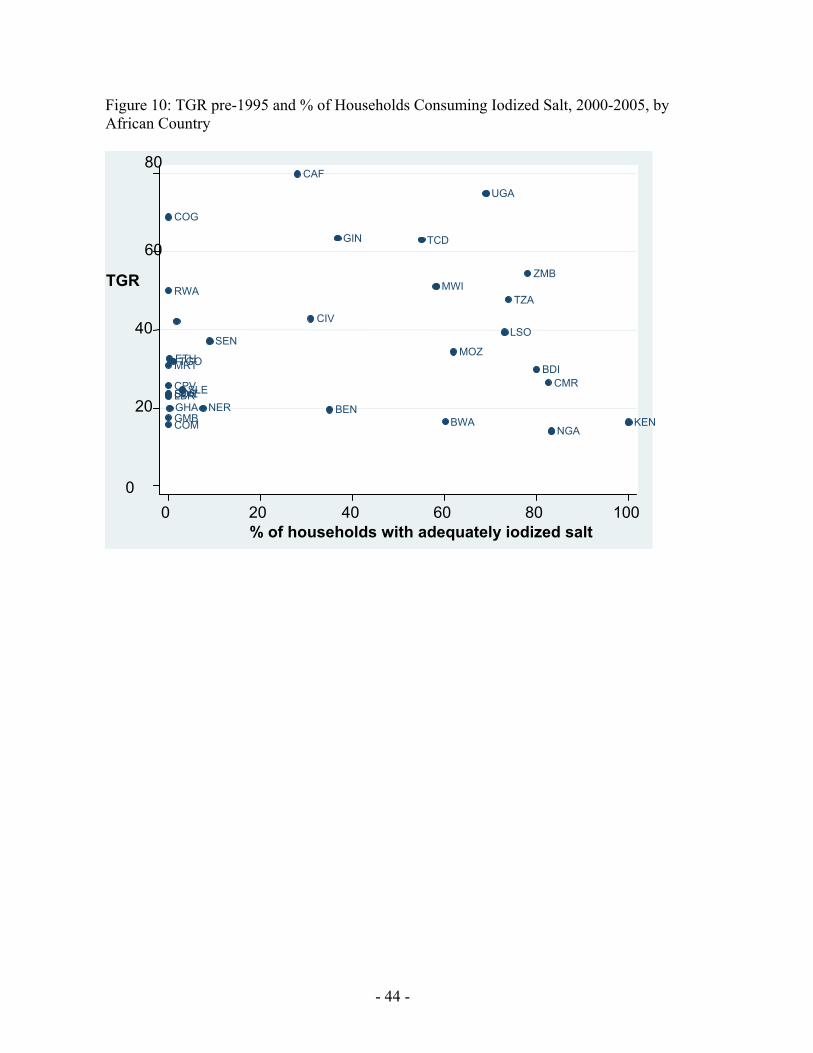
- 44 -
Figure 10: TGR pre-1995 and % of Households Consuming Iodized Salt, 2000-2005, by African Country
BENBWA
BDICMR CPV
CAF
TCD
COM
COG
CIV
ETH
GMB GHA
GIN
KEN
LSO
LBR
MWI
MRT MOZ
NER NGA
RWA
SEN
SLE SDN SWZ
TZA
TGO
UGA
ZMB
0
20
40
60
80
TGR
0 20 40 60 80 100 % of households with adequately iodized salt
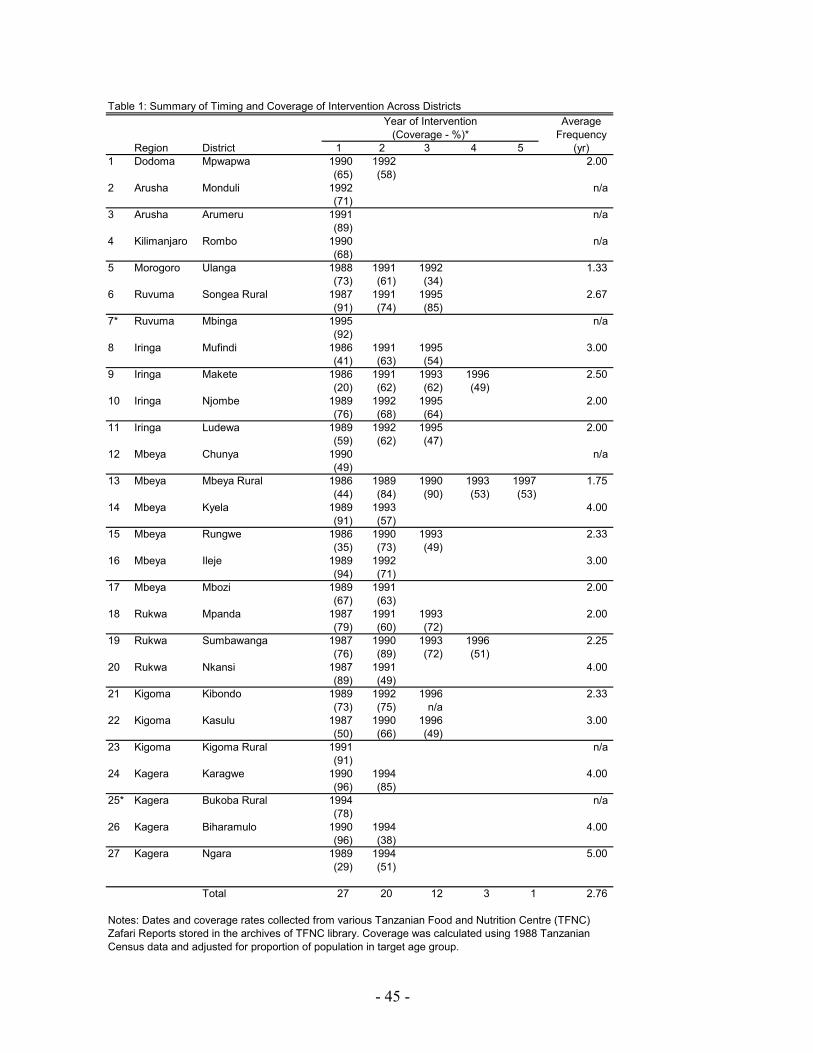
- 45 -
Table 1: Summary of Timing and Coverage of Intervention Across DistrictsAverage
FrequencyRegion District 1 2 3 4 5 (yr)
1 Dodoma Mpwapwa 1990 1992 2.00 (65) (58)
2 Arusha Monduli 1992 n/a (71)
3 Arusha Arumeru 1991 n/a (89)
4 Kilimanjaro Rombo 1990 n/a (68)
5 Morogoro Ulanga 1988 1991 1992 1.33 (73) (61) (34)
6 Ruvuma Songea Rural 1987 1991 1995 2.67 (91) (74) (85)
7* Ruvuma Mbinga 1995 n/a (92)
8 Iringa Mufindi 1986 1991 1995 3.00 (41) (63) (54)
9 Iringa Makete 1986 1991 1993 1996 2.50 (20) (62) (62) (49)
10 Iringa Njombe 1989 1992 1995 2.00 (76) (68) (64)
11 Iringa Ludewa 1989 1992 1995 2.00 (59) (62) (47)
12 Mbeya Chunya 1990 n/a (49)
13 Mbeya Mbeya Rural 1986 1989 1990 1993 1997 1.75 (44) (84) (90) (53) (53)
14 Mbeya Kyela 1989 1993 4.00 (91) (57)
15 Mbeya Rungwe 1986 1990 1993 2.33 (35) (73) (49)
16 Mbeya Ileje 1989 1992 3.00 (94) (71)
17 Mbeya Mbozi 1989 1991 2.00 (67) (63)
18 Rukwa Mpanda 1987 1991 1993 2.00 (79) (60) (72)
19 Rukwa Sumbawanga 1987 1990 1993 1996 2.25 (76) (89) (72) (51)
20 Rukwa Nkansi 1987 1991 4.00 (89) (49)
21 Kigoma Kibondo 1989 1992 1996 2.33 (73) (75) n/a
22 Kigoma Kasulu 1987 1990 1996 3.00 (50) (66) (49)
23 Kigoma Kigoma Rural 1991 n/a (91)
24 Kagera Karagwe 1990 1994 4.00 (96) (85)
25* Kagera Bukoba Rural 1994 n/a (78)
26 Kagera Biharamulo 1990 1994 4.00 (96) (38)
27 Kagera Ngara 1989 1994 5.00 (29) (51)
Total 27 20 12 3 1 2.76
Year of Intervention(Coverage - %)*
Notes: Dates and coverage rates collected from various Tanzanian Food and Nutrition Centre (TFNC) Zafari Reports stored in the archives of TFNC library. Coverage was calculated using 1988 Tanzanian Census data and adjusted for proportion of population in target age group.
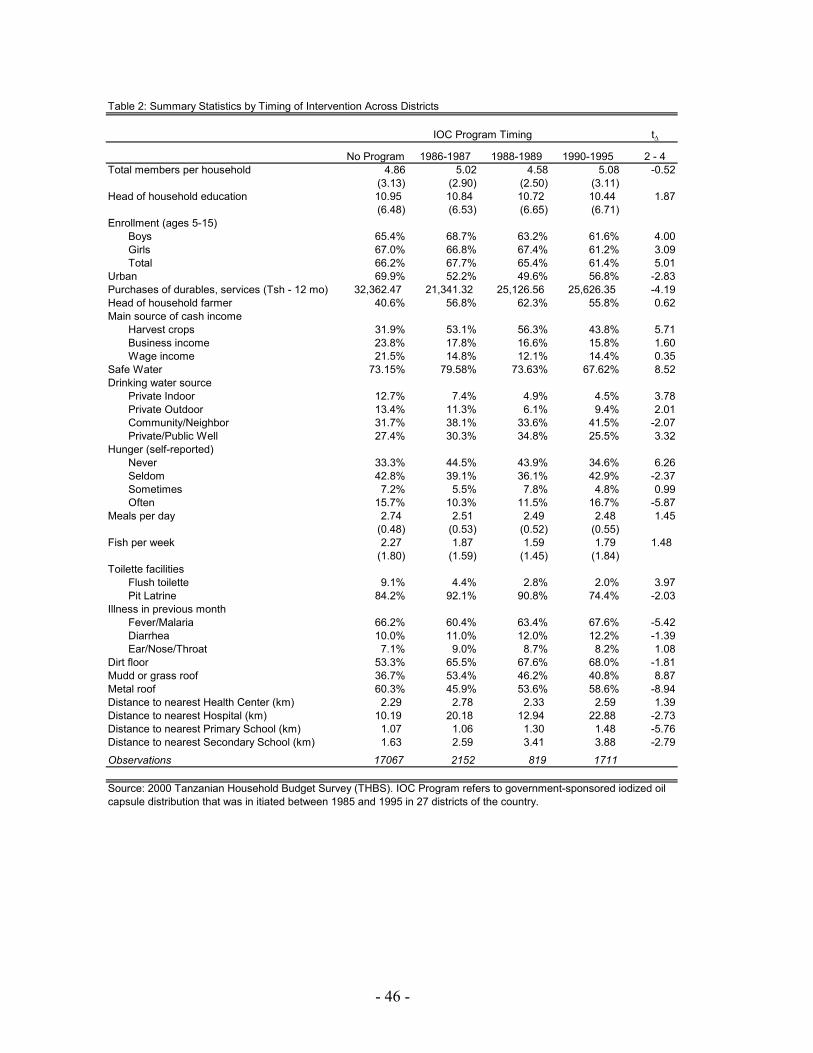
- 46 -
Table 2: Summary Statistics by Timing of Intervention Across Districts
tΔ
No Program 1986-1987 1988-1989 1990-1995 2 - 4Total members per household 4.86 5.02 4.58 5.08 -0.52
(3.13) (2.90) (2.50) (3.11)Head of household education 10.95 10.84 10.72 10.44 1.87
(6.48) (6.53) (6.65) (6.71)Enrollment (ages 5-15)
Boys 65.4% 68.7% 63.2% 61.6% 4.00Girls 67.0% 66.8% 67.4% 61.2% 3.09Total 66.2% 67.7% 65.4% 61.4% 5.01
Urban 69.9% 52.2% 49.6% 56.8% -2.83Purchases of durables, services (Tsh - 12 mo) 32,362.47 21,341.32 25,126.56 25,626.35 -4.19Head of household farmer 40.6% 56.8% 62.3% 55.8% 0.62Main source of cash income
Harvest crops 31.9% 53.1% 56.3% 43.8% 5.71Business income 23.8% 17.8% 16.6% 15.8% 1.60Wage income 21.5% 14.8% 12.1% 14.4% 0.35
Safe Water 73.15% 79.58% 73.63% 67.62% 8.52Drinking water source
Private Indoor 12.7% 7.4% 4.9% 4.5% 3.78Private Outdoor 13.4% 11.3% 6.1% 9.4% 2.01Community/Neighbor 31.7% 38.1% 33.6% 41.5% -2.07Private/Public Well 27.4% 30.3% 34.8% 25.5% 3.32
Hunger (self-reported)Never 33.3% 44.5% 43.9% 34.6% 6.26Seldom 42.8% 39.1% 36.1% 42.9% -2.37Sometimes 7.2% 5.5% 7.8% 4.8% 0.99Often 15.7% 10.3% 11.5% 16.7% -5.87
Meals per day 2.74 2.51 2.49 2.48 1.45(0.48) (0.53) (0.52) (0.55)
Fish per week 2.27 1.87 1.59 1.79 1.48 (1.80) (1.59) (1.45) (1.84)
Toilette facilitiesFlush toilette 9.1% 4.4% 2.8% 2.0% 3.97Pit Latrine 84.2% 92.1% 90.8% 74.4% -2.03
Illness in previous monthFever/Malaria 66.2% 60.4% 63.4% 67.6% -5.42Diarrhea 10.0% 11.0% 12.0% 12.2% -1.39Ear/Nose/Throat 7.1% 9.0% 8.7% 8.2% 1.08
Dirt floor 53.3% 65.5% 67.6% 68.0% -1.81Mudd or grass roof 36.7% 53.4% 46.2% 40.8% 8.87Metal roof 60.3% 45.9% 53.6% 58.6% -8.94Distance to nearest Health Center (km) 2.29 2.78 2.33 2.59 1.39Distance to nearest Hospital (km) 10.19 20.18 12.94 22.88 -2.73Distance to nearest Primary School (km) 1.07 1.06 1.30 1.48 -5.76Distance to nearest Secondary School (km) 1.63 2.59 3.41 3.88 -2.79
Observations 17067 2152 819 1711
IOC Program Timing
Source: 2000 Tanzanian Household Budget Survey (THBS). IOC Program refers to government-sponsored iodized oil capsule distribution that was in itiated between 1985 and 1995 in 27 districts of the country.
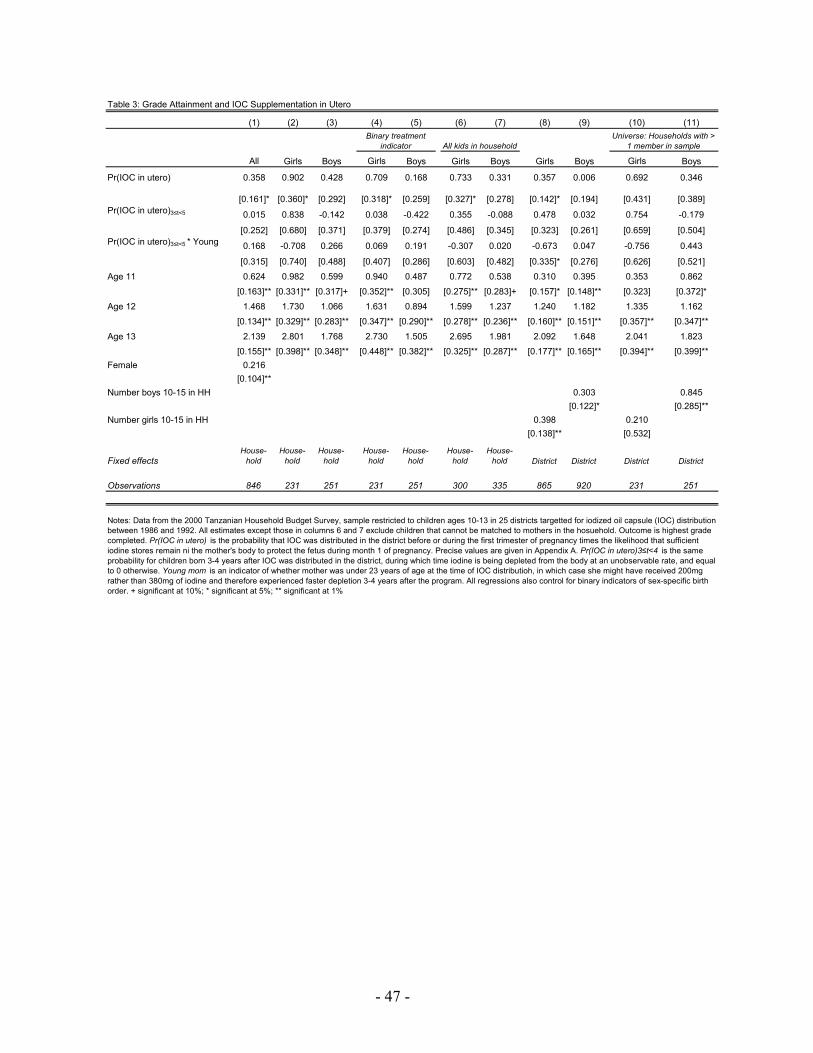
- 47 -
Table 3: Grade Attainment and IOC Supplementation in Utero
(1) (2) (3) (4) (5) (6) (7) (8) (9) (10) (11)
All Girls Boys Girls Boys Girls Boys Girls Boys Girls Boys
Pr(IOC in utero) 0.358 0.902 0.428 0.709 0.168 0.733 0.331 0.357 0.006 0.692 0.346
[0.161]* [0.360]* [0.292] [0.318]* [0.259] [0.327]* [0.278] [0.142]* [0.194] [0.431] [0.389]
0.015 0.838 -0.142 0.038 -0.422 0.355 -0.088 0.478 0.032 0.754 -0.179
[0.252] [0.680] [0.371] [0.379] [0.274] [0.486] [0.345] [0.323] [0.261] [0.659] [0.504]
0.168 -0.708 0.266 0.069 0.191 -0.307 0.020 -0.673 0.047 -0.756 0.443
[0.315] [0.740] [0.488] [0.407] [0.286] [0.603] [0.482] [0.335]* [0.276] [0.626] [0.521]
Age 11 0.624 0.982 0.599 0.940 0.487 0.772 0.538 0.310 0.395 0.353 0.862
[0.163]** [0.331]** [0.317]+ [0.352]** [0.305] [0.275]** [0.283]+ [0.157]* [0.148]** [0.323] [0.372]*
Age 12 1.468 1.730 1.066 1.631 0.894 1.599 1.237 1.240 1.182 1.335 1.162
[0.134]** [0.329]** [0.283]** [0.347]** [0.290]** [0.278]** [0.236]** [0.160]** [0.151]** [0.357]** [0.347]**
Age 13 2.139 2.801 1.768 2.730 1.505 2.695 1.981 2.092 1.648 2.041 1.823
[0.155]** [0.398]** [0.348]** [0.448]** [0.382]** [0.325]** [0.287]** [0.177]** [0.165]** [0.394]** [0.399]**Female 0.216
[0.104]**Number boys 10-15 in HH 0.303 0.845
[0.122]* [0.285]**Number girls 10-15 in HH 0.398 0.210
[0.138]** [0.532]
Fixed effectsHouse-
holdHouse-
holdHouse-
holdHouse-
holdHouse-
holdHouse-
holdHouse-
hold District District District District
Observations 846 231 251 231 251 300 335 865 920 231 251
Pr(IOC in utero)3≤t<5 * Young
All kids in household
Notes: Data from the 2000 Tanzanian Household Budget Survey, sample restricted to children ages 10-13 in 25 districts targetted for iodized oil capsule (IOC) distribution between 1986 and 1992. All estimates except those in columns 6 and 7 exclude children that cannot be matched to mothers in the hosuehold. Outcome is highest grade completed. Pr(IOC in utero) is the probability that IOC was distributed in the district before or during the first trimester of pregnancy times the likelihood that sufficient iodine stores remain ni the mother's body to protect the fetus during month 1 of pregnancy. Precise values are given in Appendix A. Pr(IOC in utero)3≤t<4 is the same probability for children born 3-4 years after IOC was distributed in the district, during which time iodine is being depleted from the body at an unobservable rate, and equal to 0 otherwise. Young mom is an indicator of whether mother was under 23 years of age at the time of IOC distributioh, in which case she might have received 200mg rather than 380mg of iodine and therefore experienced faster depletion 3-4 years after the program. All regressions also control for binary indicators of sex-specific birth order. + significant at 10%; * significant at 5%; ** significant at 1%
Universe: Households with > 1 member in sample
Pr(IOC in utero)3≤t<5
Binary treatment indicator
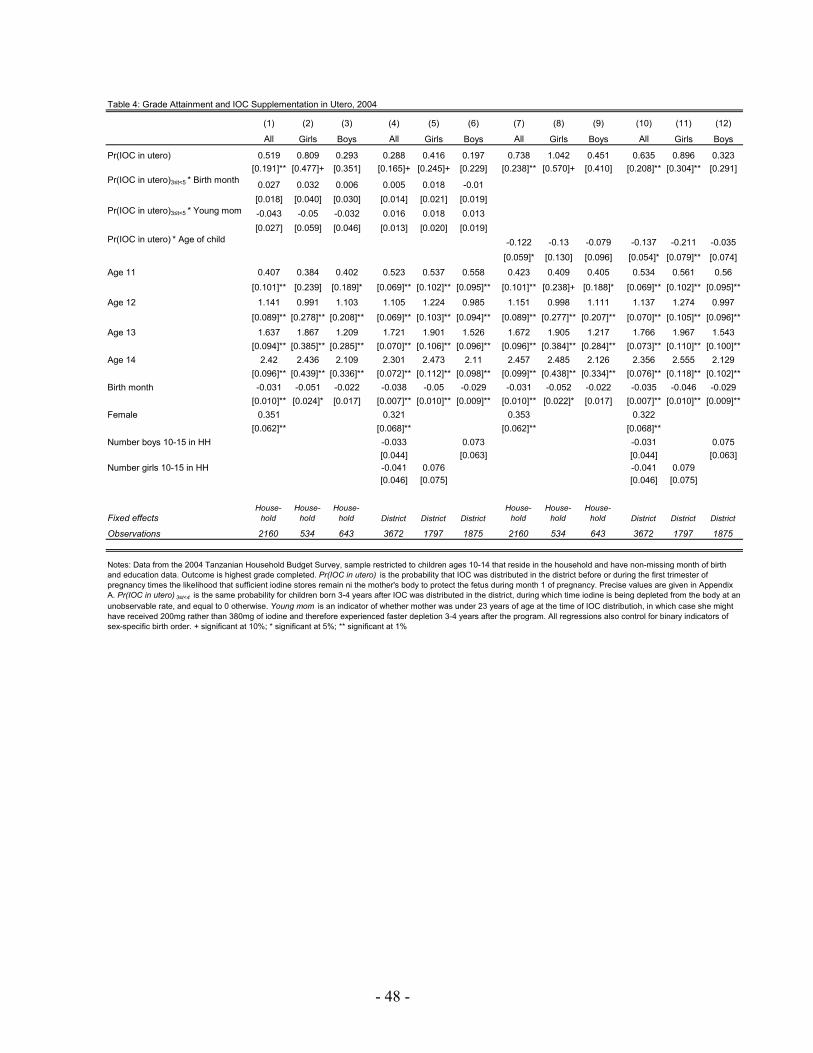
- 48 -
Table 4: Grade Attainment and IOC Supplementation in Utero, 2004
(1) (2) (3) (4) (5) (6) (7) (8) (9) (10) (11) (12)
All Girls Boys All Girls Boys All Girls Boys All Girls Boys
Pr(IOC in utero) 0.519 0.809 0.293 0.288 0.416 0.197 0.738 1.042 0.451 0.635 0.896 0.323[0.191]** [0.477]+ [0.351] [0.165]+ [0.245]+ [0.229] [0.238]** [0.570]+ [0.410] [0.208]** [0.304]** [0.291]
0.027 0.032 0.006 0.005 0.018 -0.01[0.018] [0.040] [0.030] [0.014] [0.021] [0.019]-0.043 -0.05 -0.032 0.016 0.018 0.013[0.027] [0.059] [0.046] [0.013] [0.020] [0.019]
-0.122 -0.13 -0.079 -0.137 -0.211 -0.035
[0.059]* [0.130] [0.096] [0.054]* [0.079]** [0.074]
Age 11 0.407 0.384 0.402 0.523 0.537 0.558 0.423 0.409 0.405 0.534 0.561 0.56
[0.101]** [0.239] [0.189]* [0.069]** [0.102]** [0.095]** [0.101]** [0.238]+ [0.188]* [0.069]** [0.102]** [0.095]**
Age 12 1.141 0.991 1.103 1.105 1.224 0.985 1.151 0.998 1.111 1.137 1.274 0.997
[0.089]** [0.278]** [0.208]** [0.069]** [0.103]** [0.094]** [0.089]** [0.277]** [0.207]** [0.070]** [0.105]** [0.096]**
Age 13 1.637 1.867 1.209 1.721 1.901 1.526 1.672 1.905 1.217 1.766 1.967 1.543[0.094]** [0.385]** [0.285]** [0.070]** [0.106]** [0.096]** [0.096]** [0.384]** [0.284]** [0.073]** [0.110]** [0.100]**
Age 14 2.42 2.436 2.109 2.301 2.473 2.11 2.457 2.485 2.126 2.356 2.555 2.129[0.096]** [0.439]** [0.336]** [0.072]** [0.112]** [0.098]** [0.099]** [0.438]** [0.334]** [0.076]** [0.118]** [0.102]**
Birth month -0.031 -0.051 -0.022 -0.038 -0.05 -0.029 -0.031 -0.052 -0.022 -0.035 -0.046 -0.029[0.010]** [0.024]* [0.017] [0.007]** [0.010]** [0.009]** [0.010]** [0.022]* [0.017] [0.007]** [0.010]** [0.009]**
Female 0.351 0.321 0.353 0.322[0.062]** [0.068]** [0.062]** [0.068]**
Number boys 10-15 in HH -0.033 0.073 -0.031 0.075[0.044] [0.063] [0.044] [0.063]
Number girls 10-15 in HH -0.041 0.076 -0.041 0.079[0.046] [0.075] [0.046] [0.075]
Fixed effectsHouse-
holdHouse-
holdHouse-
hold District District DistrictHouse-
holdHouse-
holdHouse-
hold District District District
Observations 2160 534 643 3672 1797 1875 2160 534 643 3672 1797 1875
Pr(IOC in utero)3≤t<5 * Birth month
Pr(IOC in utero)3≤t<5 * Young mom
Notes: Data from the 2004 Tanzanian Household Budget Survey, sample restricted to children ages 10-14 that reside in the household and have non-missing month of birth and education data. Outcome is highest grade completed. Pr(IOC in utero) is the probability that IOC was distributed in the district before or during the first trimester of pregnancy times the likelihood that sufficient iodine stores remain ni the mother's body to protect the fetus during month 1 of pregnancy. Precise values are given in Appendix A. Pr(IOC in utero) 3≤t<4 is the same probability for children born 3-4 years after IOC was distributed in the district, during which time iodine is being depleted from the body at an unobservable rate, and equal to 0 otherwise. Young mom is an indicator of whether mother was under 23 years of age at the time of IOC distributioh, in which case she might have received 200mg rather than 380mg of iodine and therefore experienced faster depletion 3-4 years after the program. All regressions also control for binary indicators of sex-specific birth order. + significant at 10%; * significant at 5%; ** significant at 1%
Pr(IOC in utero) * Age of child
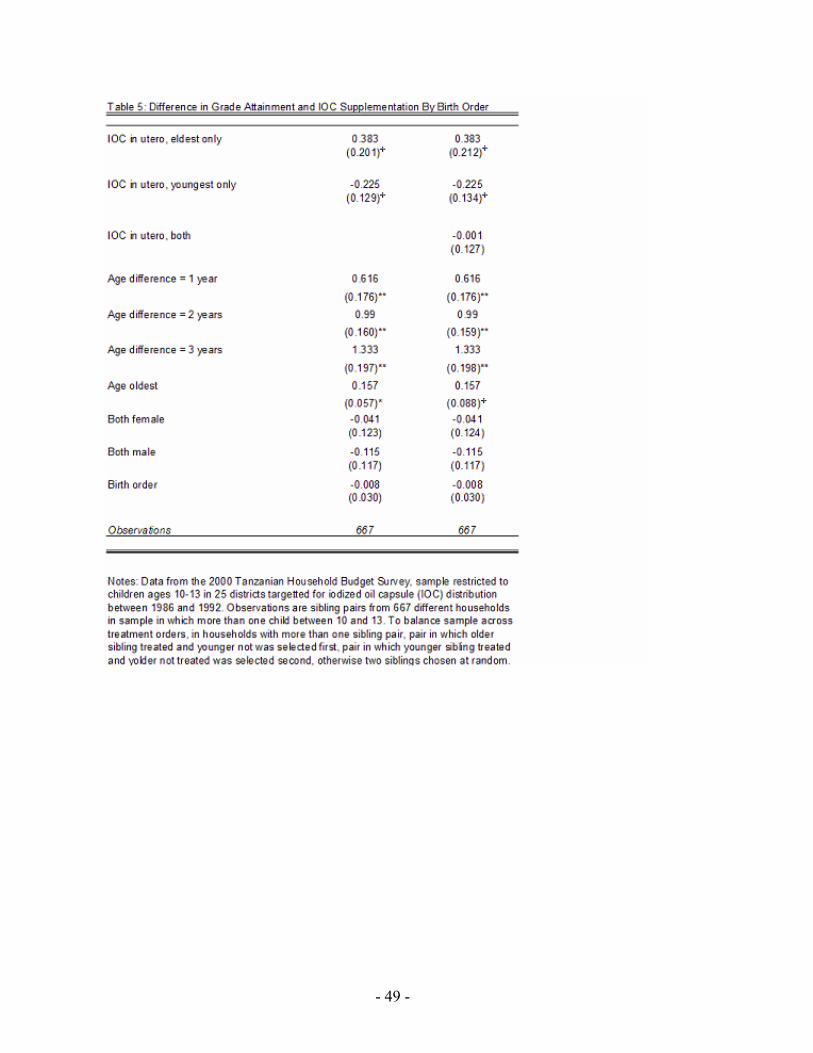
- 49 -
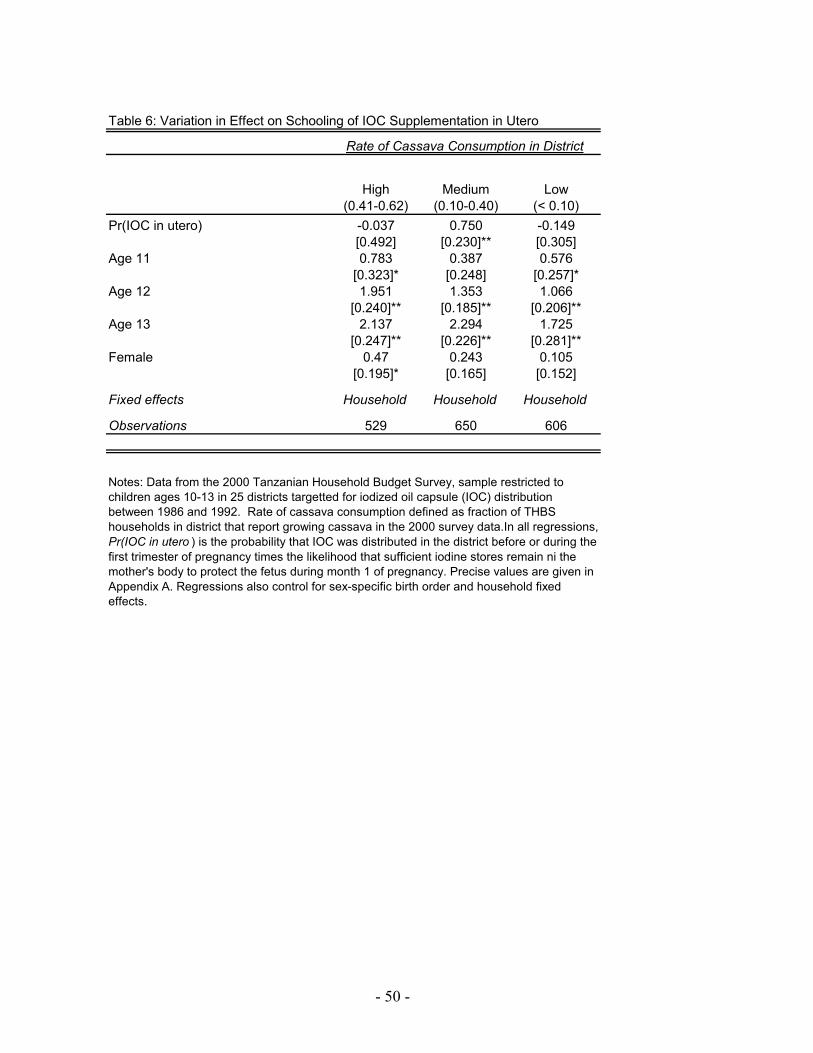
- 50 -
Table 6: Variation in Effect on Schooling of IOC Supplementation in Utero
High (0.41-0.62)
Medium (0.10-0.40)
Low (< 0.10)
Pr(IOC in utero) -0.037 0.750 -0.149[0.492] [0.230]** [0.305]
Age 11 0.783 0.387 0.576[0.323]* [0.248] [0.257]*
Age 12 1.951 1.353 1.066[0.240]** [0.185]** [0.206]**
Age 13 2.137 2.294 1.725[0.247]** [0.226]** [0.281]**
Female 0.47 0.243 0.105[0.195]* [0.165] [0.152]
Fixed effects Household Household Household
Observations 529 650 606
Notes: Data from the 2000 Tanzanian Household Budget Survey, sample restricted to children ages 10-13 in 25 districts targetted for iodized oil capsule (IOC) distribution between 1986 and 1992. Rate of cassava consumption defined as fraction of THBS households in district that report growing cassava in the 2000 survey data.In all regressions, Pr(IOC in utero ) is the probability that IOC was distributed in the district before or during the first trimester of pregnancy times the likelihood that sufficient iodine stores remain ni the mother's body to protect the fetus during month 1 of pregnancy. Precise values are given in Appendix A. Regressions also control for sex-specific birth order and household fixed effects.
Rate of Cassava Consumption in District
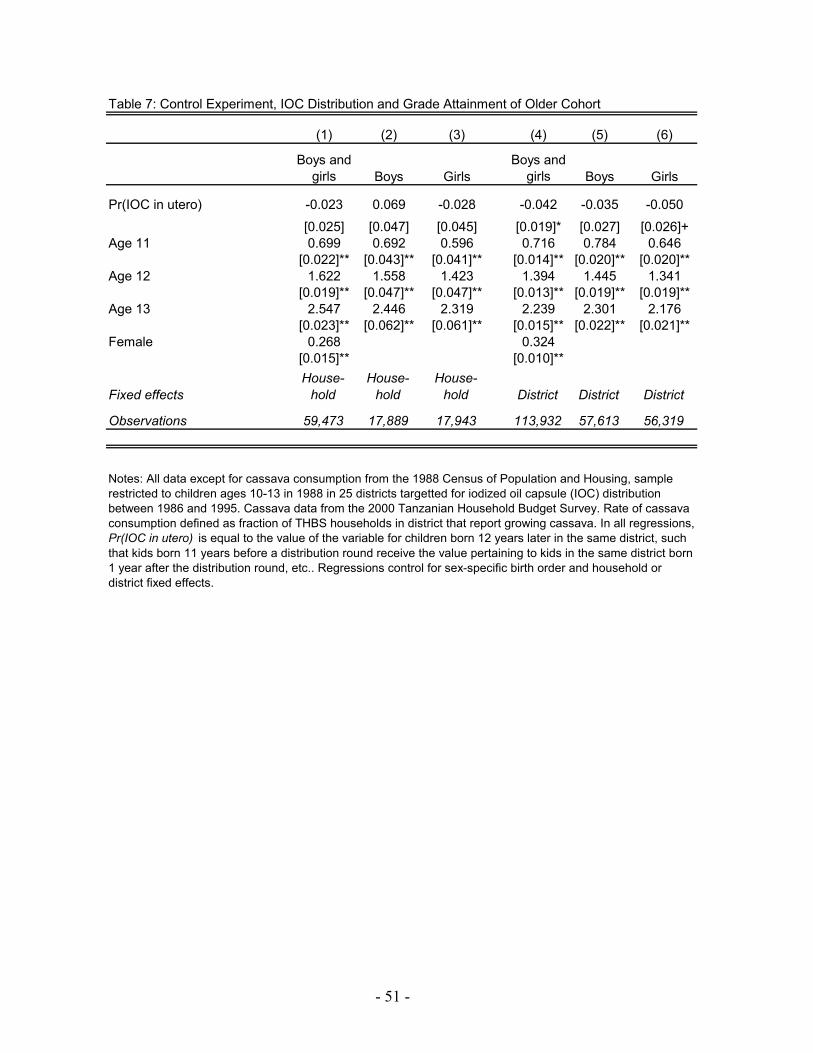
- 51 -
Table 7: Control Experiment, IOC Distribution and Grade Attainment of Older Cohort
(1) (2) (3) (4) (5) (6)
Boys and girls Boys Girls
Boys and girls Boys Girls
Pr(IOC in utero) -0.023 0.069 -0.028 -0.042 -0.035 -0.050
[0.025] [0.047] [0.045] [0.019]* [0.027] [0.026]+Age 11 0.699 0.692 0.596 0.716 0.784 0.646
[0.022]** [0.043]** [0.041]** [0.014]** [0.020]** [0.020]**Age 12 1.622 1.558 1.423 1.394 1.445 1.341
[0.019]** [0.047]** [0.047]** [0.013]** [0.019]** [0.019]**Age 13 2.547 2.446 2.319 2.239 2.301 2.176
[0.023]** [0.062]** [0.061]** [0.015]** [0.022]** [0.021]**Female 0.268 0.324
[0.015]** [0.010]**
Fixed effectsHouse-
holdHouse-
holdHouse-
hold District District District
Observations 59,473 17,889 17,943 113,932 57,613 56,319
Notes: All data except for cassava consumption from the 1988 Census of Population and Housing, sample restricted to children ages 10-13 in 1988 in 25 districts targetted for iodized oil capsule (IOC) distribution between 1986 and 1995. Cassava data from the 2000 Tanzanian Household Budget Survey. Rate of cassava consumption defined as fraction of THBS households in district that report growing cassava. In all regressions, Pr(IOC in utero) is equal to the value of the variable for children born 12 years later in the same district, such that kids born 11 years before a distribution round receive the value pertaining to kids in the same district born 1 year after the distribution round, etc.. Regressions control for sex-specific birth order and household or district fixed effects.
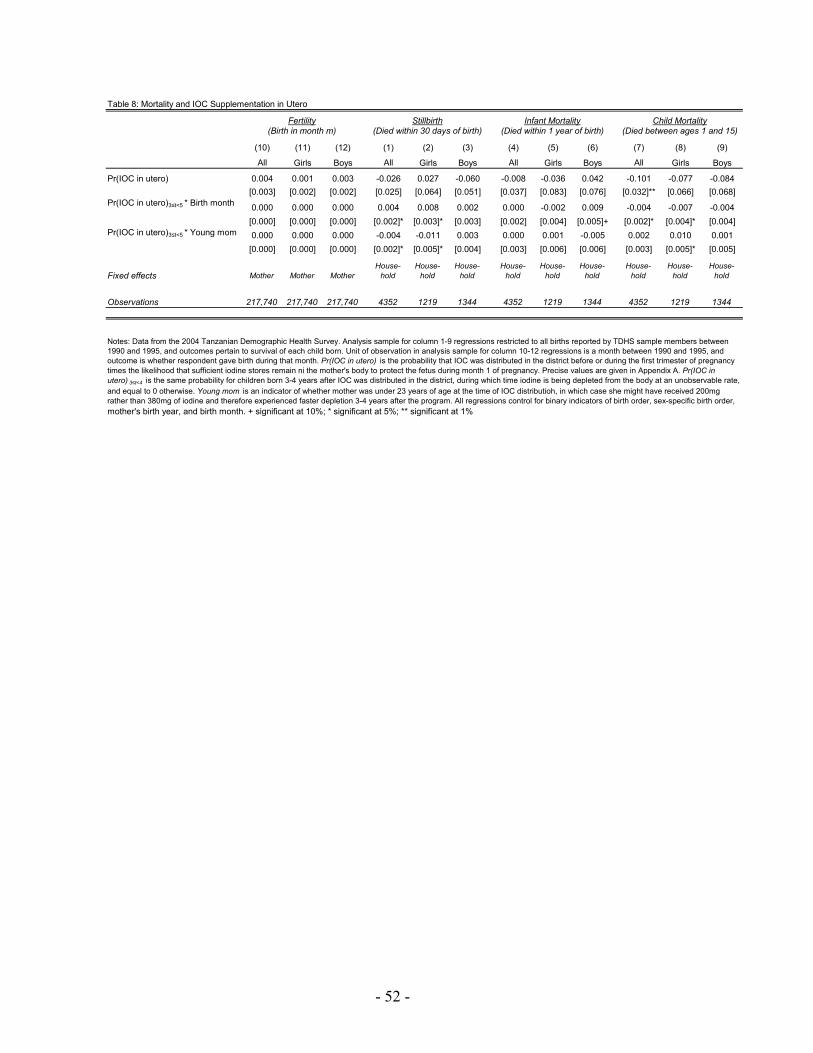
- 52 -
Table 8: Mortality and IOC Supplementation in Utero
(10) (11) (12) (1) (2) (3) (4) (5) (6) (7) (8) (9)
All Girls Boys All Girls Boys All Girls Boys All Girls Boys
Pr(IOC in utero) 0.004 0.001 0.003 -0.026 0.027 -0.060 -0.008 -0.036 0.042 -0.101 -0.077 -0.084[0.003] [0.002] [0.002] [0.025] [0.064] [0.051] [0.037] [0.083] [0.076] [0.032]** [0.066] [0.068]
0.000 0.000 0.000 0.004 0.008 0.002 0.000 -0.002 0.009 -0.004 -0.007 -0.004[0.000] [0.000] [0.000] [0.002]* [0.003]* [0.003] [0.002] [0.004] [0.005]+ [0.002]* [0.004]* [0.004]0.000 0.000 0.000 -0.004 -0.011 0.003 0.000 0.001 -0.005 0.002 0.010 0.001[0.000] [0.000] [0.000] [0.002]* [0.005]* [0.004] [0.003] [0.006] [0.006] [0.003] [0.005]* [0.005]
Fixed effects Mother Mother MotherHouse-
holdHouse-
holdHouse-
holdHouse-
holdHouse-
holdHouse-
holdHouse-
holdHouse-
holdHouse-
hold
Observations 217,740 217,740 217,740 4352 1219 1344 4352 1219 1344 4352 1219 1344
mother's birth year, and birth month. + significant at 10%; * significant at 5%; ** significant at 1%
(Died within 1 year of birth) (Died between ages 1 and 15)
Pr(IOC in utero)3≤t<5 * Birth month
Pr(IOC in utero)3≤t<5 * Young mom
(Died within 30 days of birth)
Notes: Data from the 2004 Tanzanian Demographic Health Survey. Analysis sample for column 1-9 regressions restricted to all births reported by TDHS sample members between 1990 and 1995, and outcomes pertain to survival of each child born. Unit of observation in analysis sample for column 10-12 regressions is a month between 1990 and 1995, and outcome is whether respondent gave birth during that month. Pr(IOC in utero) is the probability that IOC was distributed in the district before or during the first trimester of pregnancy times the likelihood that sufficient iodine stores remain ni the mother's body to protect the fetus during month 1 of pregnancy. Precise values are given in Appendix A. Pr(IOC in utero) 3≤t<4 is the same probability for children born 3-4 years after IOC was distributed in the district, during which time iodine is being depleted from the body at an unobservable rate, and equal to 0 otherwise. Young mom is an indicator of whether mother was under 23 years of age at the time of IOC distributioh, in which case she might have received 200mg rather than 380mg of iodine and therefore experienced faster depletion 3-4 years after the program. All regressions control for binary indicators of birth order, sex-specific birth order,
Stillbirth Infant Mortality Child MortalityFertility(Birth in month m)
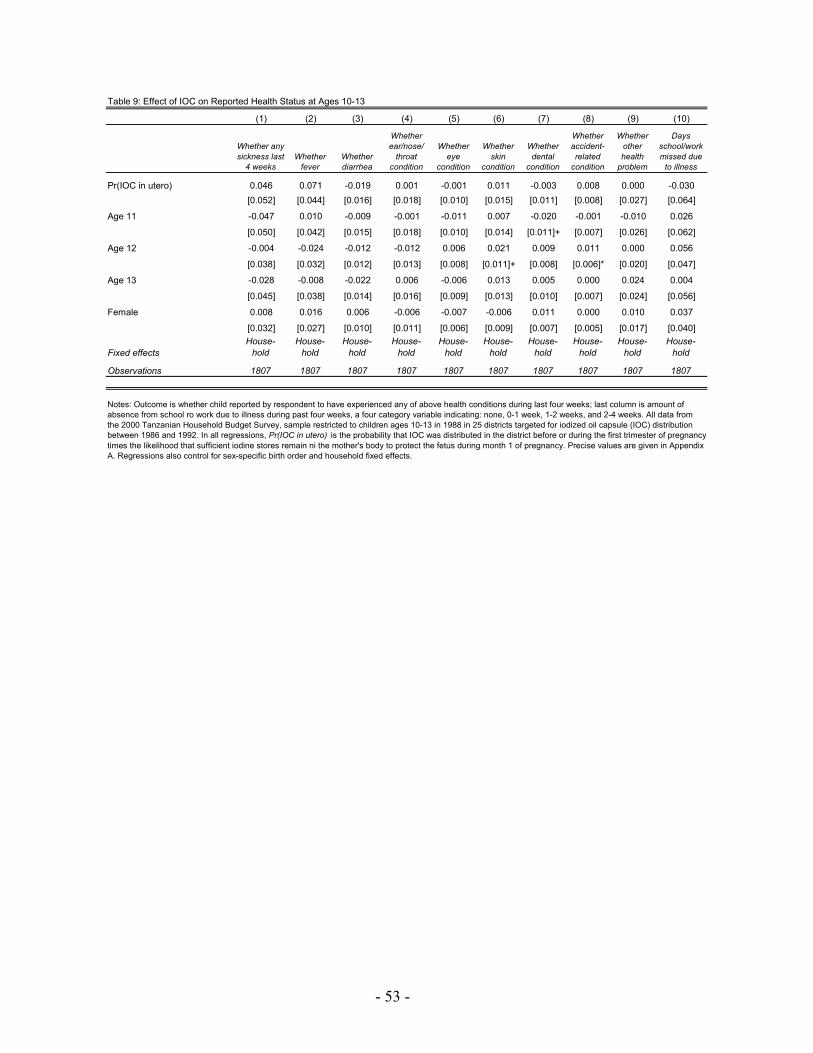
- 53 -
Table 9: Effect of IOC on Reported Health Status at Ages 10-13
(1) (2) (3) (4) (5) (6) (7) (8) (9) (10)
Whether any sickness last
4 weeksWhether
feverWhether diarrhea
Whether ear/nose/
throat condition
Whether eye
condition
Whether skin
condition
Whether dental
condition
Whether accident-related
condition
Whether other health
problem
Days school/work missed due
to illness
Pr(IOC in utero) 0.046 0.071 -0.019 0.001 -0.001 0.011 -0.003 0.008 0.000 -0.030[0.052] [0.044] [0.016] [0.018] [0.010] [0.015] [0.011] [0.008] [0.027] [0.064]
Age 11 -0.047 0.010 -0.009 -0.001 -0.011 0.007 -0.020 -0.001 -0.010 0.026
[0.050] [0.042] [0.015] [0.018] [0.010] [0.014] [0.011]+ [0.007] [0.026] [0.062]
Age 12 -0.004 -0.024 -0.012 -0.012 0.006 0.021 0.009 0.011 0.000 0.056
[0.038] [0.032] [0.012] [0.013] [0.008] [0.011]+ [0.008] [0.006]* [0.020] [0.047]
Age 13 -0.028 -0.008 -0.022 0.006 -0.006 0.013 0.005 0.000 0.024 0.004
[0.045] [0.038] [0.014] [0.016] [0.009] [0.013] [0.010] [0.007] [0.024] [0.056]
Female 0.008 0.016 0.006 -0.006 -0.007 -0.006 0.011 0.000 0.010 0.037
[0.032] [0.027] [0.010] [0.011] [0.006] [0.009] [0.007] [0.005] [0.017] [0.040]
Fixed effectsHouse-
holdHouse-
holdHouse-
holdHouse-
holdHouse-
holdHouse-
holdHouse-
holdHouse-
holdHouse-
holdHouse-
hold
Observations 1807 1807 1807 1807 1807 1807 1807 1807 1807 1807
Notes: Outcome is whether child reported by respondent to have experienced any of above health conditions during last four weeks; last column is amount of absence from school ro work due to illness during past four weeks, a four category variable indicating: none, 0-1 week, 1-2 weeks, and 2-4 weeks. All data from the 2000 Tanzanian Household Budget Survey, sample restricted to children ages 10-13 in 1988 in 25 districts targeted for iodized oil capsule (IOC) distribution between 1986 and 1992. In all regressions, Pr(IOC in utero) is the probability that IOC was distributed in the district before or during the first trimester of pregnancy times the likelihood that sufficient iodine stores remain ni the mother's body to protect the fetus during month 1 of pregnancy. Precise values are given in Appendix A. Regressions also control for sex-specific birth order and household fixed effects.
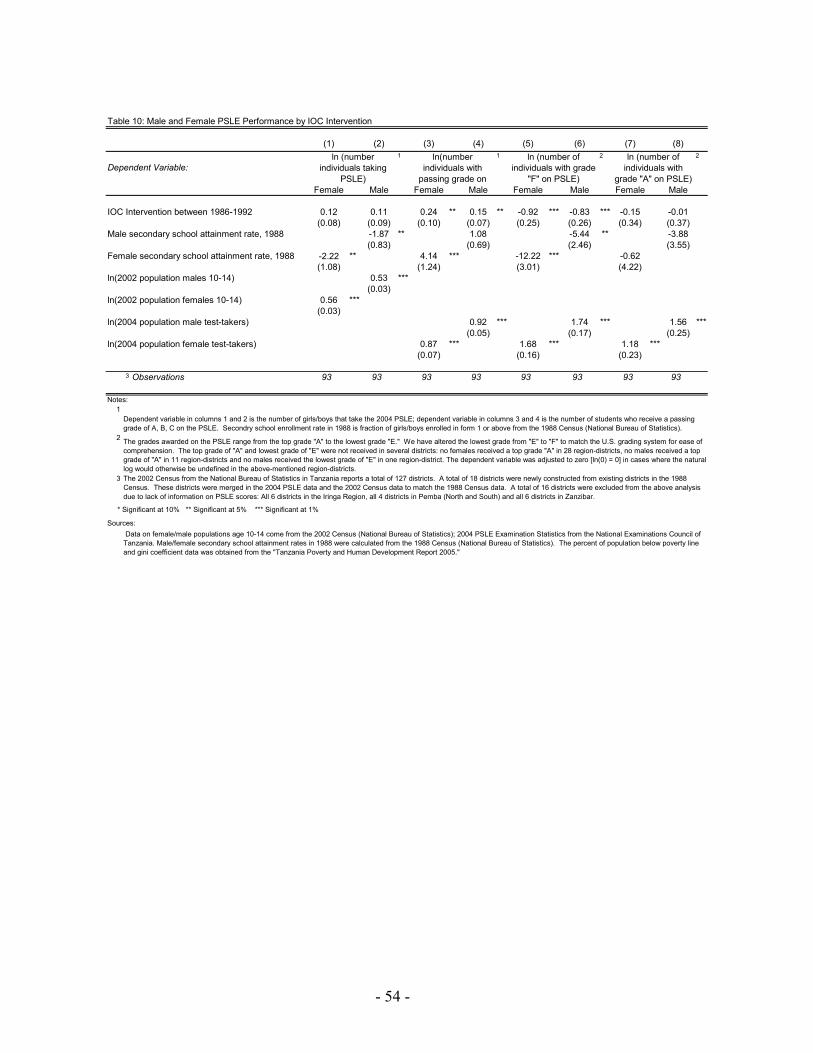
- 54 -
Table 10: Male and Female PSLE Performance by IOC Intervention
(1) (2) (3) (4) (5) (6) (7) (8)1 1 2 2
Female Male Female Male Female Male Female Male
IOC Intervention between 1986-1992 0.12 0.11 0.24 ** 0.15 ** -0.92 *** -0.83 *** -0.15 -0.01(0.08) (0.09) (0.10) (0.07) (0.25) (0.26) (0.34) (0.37)
Male secondary school attainment rate, 1988 -1.87 ** 1.08 -5.44 ** -3.88(0.83) (0.69) (2.46) (3.55)
Female secondary school attainment rate, 1988 -2.22 ** 4.14 *** -12.22 *** -0.62(1.08) (1.24) (3.01) (4.22)
ln(2002 population males 10-14) 0.53 ***(0.03)
ln(2002 population females 10-14) 0.56 ***(0.03)
ln(2004 population male test-takers) 0.92 *** 1.74 *** 1.56 ***(0.05) (0.17) (0.25)
ln(2004 population female test-takers) 0.87 *** 1.68 *** 1.18 ***(0.07) (0.16) (0.23)
3 Observations 93 93 93 93 93 93 93 93
Notes:1
2
3
* Significant at 10% ** Significant at 5% *** Significant at 1%
Sources:
Dependent variable in columns 1 and 2 is the number of girls/boys that take the 2004 PSLE; dependent variable in columns 3 and 4 is the number of students who receive a passing grade of A, B, C on the PSLE. Secondry school enrollment rate in 1988 is fraction of girls/boys enrolled in form 1 or above from the 1988 Census (National Bureau of Statistics).
The grades awarded on the PSLE range from the top grade "A" to the lowest grade "E." We have altered the lowest grade from "E" to "F" to match the U.S. grading system for ease of comprehension. The top grade of "A" and lowest grade of "E" were not received in several districts: no females received a top grade "A" in 28 region-districts, no males received a top grade of "A" in 11 region-districts and no males received the lowest grade of "E" in one region-district. The dependent variable was adjusted to zero [ln(0) = 0] in cases where the natural log would otherwise be undefined in the above-mentioned region-districts. The 2002 Census from the National Bureau of Statistics in Tanzania reports a total of 127 districts. A total of 18 districts were newly constructed from existing districts in the 1988 Census. These districts were merged in the 2004 PSLE data and the 2002 Census data to match the 1988 Census data. A total of 16 districts were excluded from the above analysis due to lack of information on PSLE scores: All 6 districts in the Iringa Region, all 4 districts in Pemba (North and South) and all 6 districts in Zanzibar.
Data on female/male populations age 10-14 come from the 2002 Census (National Bureau of Statistics); 2004 PSLE Examination Statistics from the National Examinations Council of Tanzania. Male/female secondary school attainment rates in 1988 were calculated from the 1988 Census (National Bureau of Statistics). The percent of population below poverty line and gini coefficient data was obtained from the "Tanzania Poverty and Human Development Report 2005."
ln (number of individuals with
grade "A" on PSLE)Dependent Variable:
ln (number individuals taking
PSLE)
ln(number individuals with
passing grade on
ln (number of individuals with grade
"F" on PSLE)

- 55 -
Table 11: 2000 School Participation by Gender
Dependent Variable: Female Male Female Male Female Male Female Male
(1) (2) (3) (4) (5) (6) (7) (8)
1 TGR -0.01 0.11 -0.06 0.08 -0.26 ** -0.16 -0.29 ** -0.18(0.13) (0.12) (0.13) (0.12) (0.12) (0.13) (0.12) (0.13)
2 % Household use of adequately iodized salt 0.14 ** 0.09 0.10 0.04(0.07) (0.07) (0.07) (0.08)
1980 Female Primary School Participation 0.22 *** 0.21 *** 0.24 ** 0.24 **(0.08) (0.08) (0.10) (0.10)
1980 Male Primary School Participation 0.26 *** 0.25 *** 0.18 * 0.18 *(0.07) (0.07) (0.10) (0.10)
Prevelance of Malaria (2000/01) 3.82 -8.62 6.48 -7.49 -7.47 -4.95 -5.59 -4.17(15.08) (14.30) (14.77) (14.26) (14.02) (15.24) (13.98) (15.40)
Prevalence of HIV (2003) 0.59 0.50 0.46 0.42 0.67 0.44 0.57 0.40(0.35) (0.32) (0.35) (0.32) (0.31) (0.34) (0.32) (0.35)
Urban Population (1990 - % of Total) 0.17 0.05 0.19 0.06 0.75 0.67 0.76 0.67(0.14) (0.14) (0.14) (0.13) (0.14) (0.15) (0.14) (0.15)
Population Density (1990 - per sq. km) 0.02 0.02 0.02 0.02 0.00 0.00 0.01 0.01(0.14) (0.02) (0.02) (0.02) (0.02) (0.02) (0.02) (0.02)
Log GDP per capita (1990 - Constant LCU) 15.50 13.23 11.10 10.59 15.63 16.19 12.72 15.05(7.00) (6.60) (7.17) (6.89) (6.63) (7.32) (6.90) (7.67)
Log GDP per capita 2 (1990) -1.84 -1.40 -1.44 -1.16 -1.78 -1.79 -1.52 -1.69(0.81) (0.76) (0.82) (0.78) (0.77) (0.84) (0.78) (0.87)
3 Terms of Trade (1980) 5.52 3.84 6.78 4.52 5.28 4.70 6.15 5.07(3.07) (2.89) (3.06) (2.92) (0.35) (3.11) (2.90) (3.21)
Region Effect Yes Yes Yes Yes Yes Yes Yes Yes
4 TGR Controls Yes Yes Yes Yes Yes Yes Yes Yes
5 Observations 81 81 81 81 81 81 81 81
Notes:123 Terms of Trade is the ratio of the Export Value Index and Import Value Index for year 2000.45
Sources:
Enrollment data is from the World Bank's WDI database and supplemented by data from UNESCO (United Nations Educational, Scientific and Cultural Organization) and NBER (National Bureau of Economic Research). Other national statistic data is from the World Bank's WDI database and supplemented by data from the WHO (World Health Organization) and UN (United Nations). Information on goiter rates and salt legislation years were culled from the Current Iodine Deficiency Status (CIDDS) database maintained by the International Council for the Control of Iodine Deficiency Disorders and supplemented by the WHO's Micronutrient Deficiency Information System.
TGR is a reported measure of TGR prior to 1995.Reported % of households using adequately iodized salt in mid-1990s.
TGR Controls include information from the sample used to calculate TGR: minimum age, maximum age, gender (both, male, female), sample level (national, province, local, etc.), year of sample.A number of countries were excluded from the above analysis do to partial or missing data: 18% of countries were missing primary school enrollment data; 14% of countries were missing secondary school participation data; and 15% were missing other variables included in the above analysis.
2000 Primary School Participation 2000 Secondary School Participation
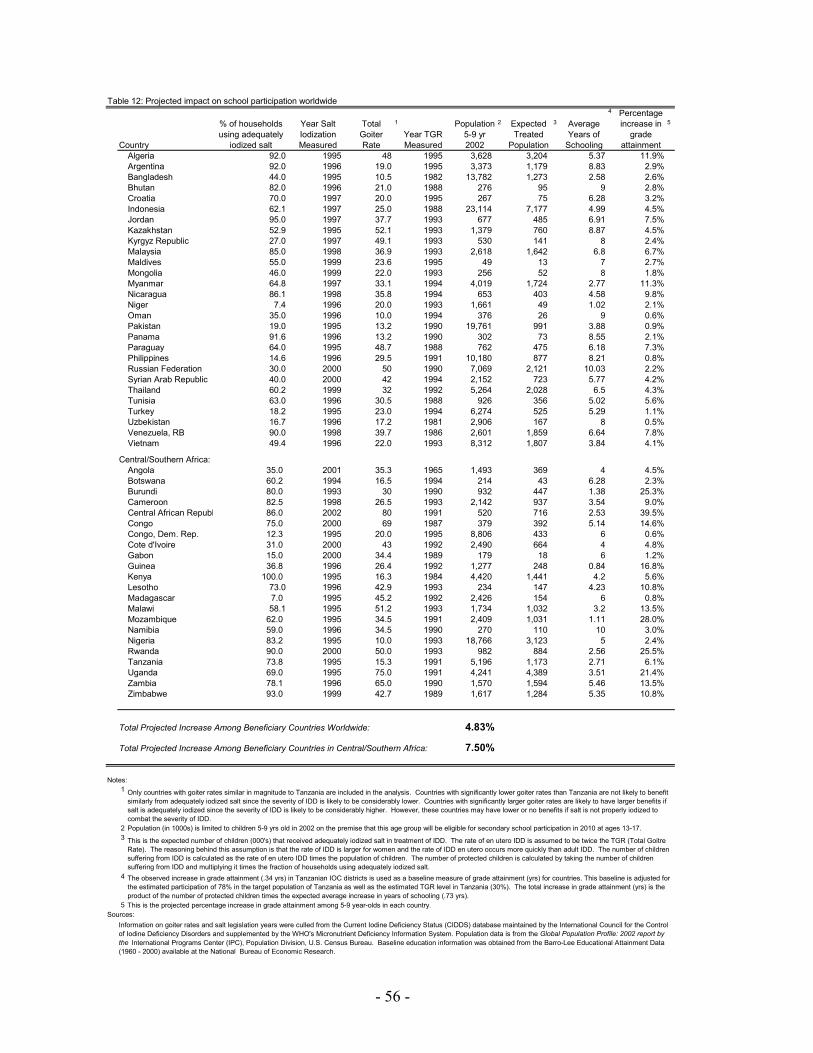
- 56 -
Table 12: Projected impact on school participation worldwide4
1 Population 2 3 Average 5
5-9 yr Years ofCountry 2002 Schooling
Algeria 92.0 1995 48 1995 3,628 3,204 5.37 11.9%Argentina 92.0 1996 19.0 1995 3,373 1,179 8.83 2.9%Bangladesh 44.0 1995 10.5 1982 13,782 1,273 2.58 2.6%Bhutan 82.0 1996 21.0 1988 276 95 9 2.8%Croatia 70.0 1997 20.0 1995 267 75 6.28 3.2%Indonesia 62.1 1997 25.0 1988 23,114 7,177 4.99 4.5%Jordan 95.0 1997 37.7 1993 677 485 6.91 7.5%Kazakhstan 52.9 1995 52.1 1993 1,379 760 8.87 4.5%Kyrgyz Republic 27.0 1997 49.1 1993 530 141 8 2.4%Malaysia 85.0 1998 36.9 1993 2,618 1,642 6.8 6.7%Maldives 55.0 1999 23.6 1995 49 13 7 2.7%Mongolia 46.0 1999 22.0 1993 256 52 8 1.8%Myanmar 64.8 1997 33.1 1994 4,019 1,724 2.77 11.3%Nicaragua 86.1 1998 35.8 1994 653 403 4.58 9.8%Niger 7.4 1996 20.0 1993 1,661 49 1.02 2.1%Oman 35.0 1996 10.0 1994 376 26 9 0.6%Pakistan 19.0 1995 13.2 1990 19,761 991 3.88 0.9%Panama 91.6 1996 13.2 1990 302 73 8.55 2.1%Paraguay 64.0 1995 48.7 1988 762 475 6.18 7.3%Philippines 14.6 1996 29.5 1991 10,180 877 8.21 0.8%Russian Federation 30.0 2000 50 1990 7,069 2,121 10.03 2.2%Syrian Arab Republic 40.0 2000 42 1994 2,152 723 5.77 4.2%Thailand 60.2 1999 32 1992 5,264 2,028 6.5 4.3%Tunisia 63.0 1996 30.5 1988 926 356 5.02 5.6%Turkey 18.2 1995 23.0 1994 6,274 525 5.29 1.1%Uzbekistan 16.7 1996 17.2 1981 2,906 167 8 0.5%Venezuela, RB 90.0 1998 39.7 1986 2,601 1,859 6.64 7.8%Vietnam 49.4 1996 22.0 1993 8,312 1,807 3.84 4.1%
Central/Southern Africa:Angola 35.0 2001 35.3 1965 1,493 369 4 4.5%Botswana 60.2 1994 16.5 1994 214 43 6.28 2.3%Burundi 80.0 1993 30 1990 932 447 1.38 25.3%Cameroon 82.5 1998 26.5 1993 2,142 937 3.54 9.0%Central African Republ 86.0 2002 80 1991 520 716 2.53 39.5%Congo 75.0 2000 69 1987 379 392 5.14 14.6%Congo, Dem. Rep. 12.3 1995 20.0 1995 8,806 433 6 0.6%Cote d'Ivoire 31.0 2000 43 1992 2,490 664 4 4.8%Gabon 15.0 2000 34.4 1989 179 18 6 1.2%Guinea 36.8 1996 26.4 1992 1,277 248 0.84 16.8%Kenya 100.0 1995 16.3 1984 4,420 1,441 4.2 5.6%Lesotho 73.0 1996 42.9 1993 234 147 4.23 10.8%Madagascar 7.0 1995 45.2 1992 2,426 154 6 0.8%Malawi 58.1 1995 51.2 1993 1,734 1,032 3.2 13.5%Mozambique 62.0 1995 34.5 1991 2,409 1,031 1.11 28.0%Namibia 59.0 1996 34.5 1990 270 110 10 3.0%Nigeria 83.2 1995 10.0 1993 18,766 3,123 5 2.4%Rwanda 90.0 2000 50.0 1993 982 884 2.56 25.5%Tanzania 73.8 1995 15.3 1991 5,196 1,173 2.71 6.1%Uganda 69.0 1995 75.0 1991 4,241 4,389 3.51 21.4%Zambia 78.1 1996 65.0 1990 1,570 1,594 5.46 13.5%Zimbabwe 93.0 1999 42.7 1989 1,617 1,284 5.35 10.8%
Total Projected Increase Among Beneficiary Countries Worldwide: 4.83%
Total Projected Increase Among Beneficiary Countries in Central/Southern Africa: 7.50%
Notes:1
23
4
5Sources:
Population (in 1000s) is limited to children 5-9 yrs old in 2002 on the premise that this age group will be eligible for secondary school participation in 2010 at ages 13-17.
This is the expected number of children (000's) that received adequately iodized salt in treatment of IDD. The rate of en utero IDD is assumed to be twice the TGR (Total Goitre Rate). The reasoning behind this assumption is that the rate of IDD is larger for women and the rate of IDD en utero occurs more quickly than adult IDD. The number of children suffering from IDD is calculated as the rate of en utero IDD times the population of children. The number of protected children is calculated by taking the number of children suffering from IDD and multiplying it times the fraction of households using adequately iodized salt. The observed increase in grade attainment (.34 yrs) in Tanzanian IOC districts is used as a baseline measure of grade attainment (yrs) for countries. This baseline is adjusted for the estimated participation of 78% in the target population of Tanzania as well as the estimated TGR level in Tanzania (30%). The total increase in grade attainment (yrs) is the product of the number of protected children times the expected average increase in years of schooling (.73 yrs).
Information on goiter rates and salt legislation years were culled from the Current Iodine Deficiency Status (CIDDS) database maintained by the International Council for the Control of Iodine Deficiency Disorders and supplemented by the WHO's Micronutrient Deficiency Information System. Population data is from the Global Population Profile: 2002 report by the International Programs Center (IPC), Population Division, U.S. Census Bureau. Baseline education information was obtained from the Barro-Lee Educational Attainment Data (1960 - 2000) available at the National Bureau of Economic Research.
This is the projected percentage increase in grade attainment among 5-9 year-olds in each country.
Only countries with goiter rates similar in magnitude to Tanzania are included in the analysis. Countries with significantly lower goiter rates than Tanzania are not likely to benefit similarly from adequately iodized salt since the severity of IDD is likely to be considerably lower. Countries with significantly larger goiter rates are likely to have larger benefits if salt is adequately iodized since the severity of IDD is likely to be considerably higher. However, these countries may have lower or no benefits if salt is not properly iodized to combat the severity of IDD.
Expected Treated
Population
Percentage increase in
grade attainment
% of households using adequately
iodized salt
Year Salt Iodization Measured
Total Goiter Rate
Year TGR Measured
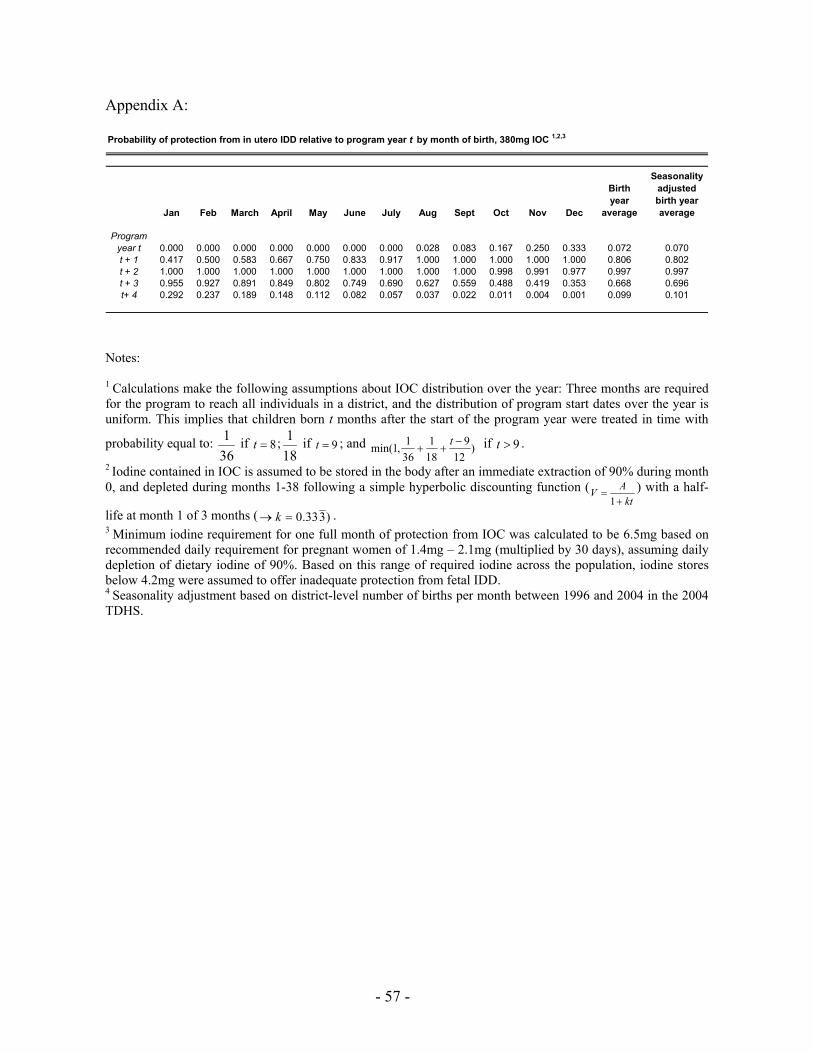
- 57 -
Appendix A: Probability of protection from in utero IDD relative to program year t by month of birth, 380mg IOC 1,2,3
Jan Feb March April May June July Aug Sept Oct Nov Dec
Birth year
average
Seasonality adjusted birth year average
Program year t 0.000 0.000 0.000 0.000 0.000 0.000 0.000 0.028 0.083 0.167 0.250 0.333 0.072 0.070t + 1 0.417 0.500 0.583 0.667 0.750 0.833 0.917 1.000 1.000 1.000 1.000 1.000 0.806 0.802t + 2 1.000 1.000 1.000 1.000 1.000 1.000 1.000 1.000 1.000 0.998 0.991 0.977 0.997 0.997t + 3 0.955 0.927 0.891 0.849 0.802 0.749 0.690 0.627 0.559 0.488 0.419 0.353 0.668 0.696t+ 4 0.292 0.237 0.189 0.148 0.112 0.082 0.057 0.037 0.022 0.011 0.004 0.001 0.099 0.101
Notes: 1 Calculations make the following assumptions about IOC distribution over the year: Three months are required for the program to reach all individuals in a district, and the distribution of program start dates over the year is uniform. This implies that children born t months after the start of the program year were treated in time with
probability equal to: 361 if 8=t ;
181 if 9=t ; and )
129
181
361,1min( −
++t if 9>t .
2 Iodine contained in IOC is assumed to be stored in the body after an immediate extraction of 90% during month 0, and depleted during months 1-38 following a simple hyperbolic discounting function (
ktAV+
=1
) with a half-
life at month 1 of 3 months ( )333.0=→ k . 3 Minimum iodine requirement for one full month of protection from IOC was calculated to be 6.5mg based on recommended daily requirement for pregnant women of 1.4mg – 2.1mg (multiplied by 30 days), assuming daily depletion of dietary iodine of 90%. Based on this range of required iodine across the population, iodine stores below 4.2mg were assumed to offer inadequate protection from fetal IDD. 4 Seasonality adjustment based on district-level number of births per month between 1996 and 2004 in the 2004 TDHS.
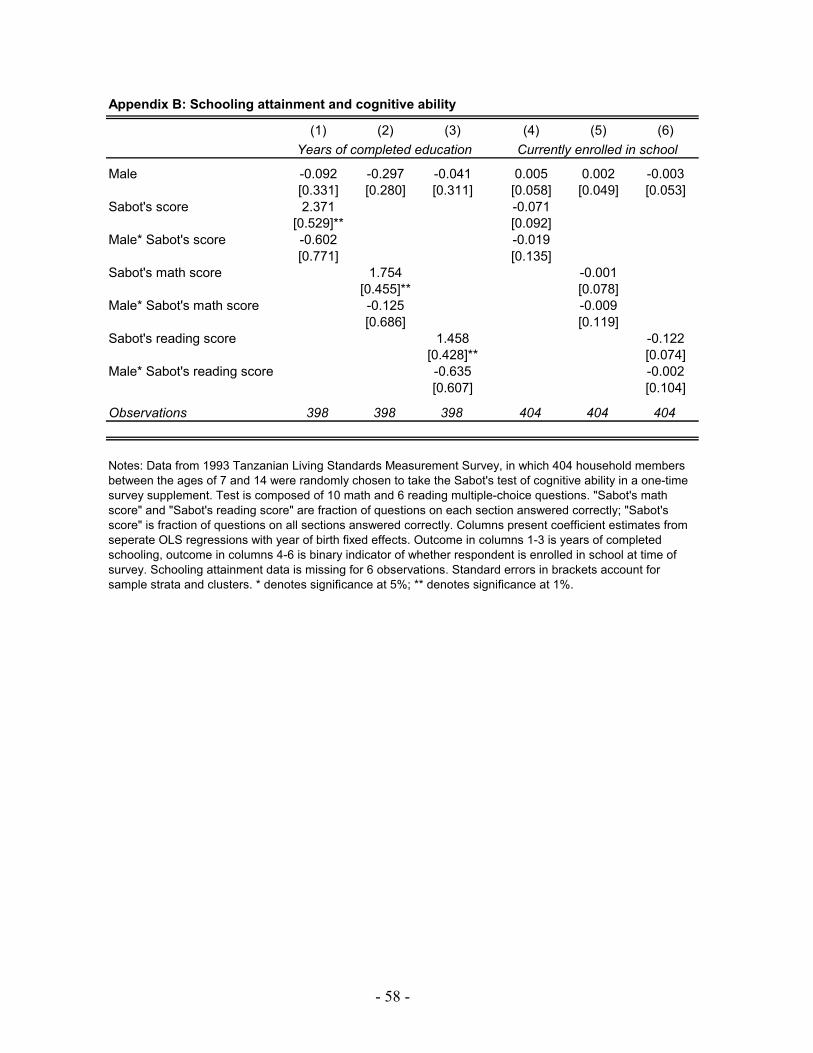
- 58 -
Appendix B: Schooling attainment and cognitive ability
(1) (2) (3) (4) (5) (6)
Male -0.092 -0.297 -0.041 0.005 0.002 -0.003[0.331] [0.280] [0.311] [0.058] [0.049] [0.053]
Sabot's score 2.371 -0.071[0.529]** [0.092]
Male* Sabot's score -0.602 -0.019[0.771] [0.135]
Sabot's math score 1.754 -0.001[0.455]** [0.078]
Male* Sabot's math score -0.125 -0.009[0.686] [0.119]
Sabot's reading score 1.458 -0.122[0.428]** [0.074]
Male* Sabot's reading score -0.635 -0.002[0.607] [0.104]
Observations 398 398 398 404 404 404
Notes: Data from 1993 Tanzanian Living Standards Measurement Survey, in which 404 household members between the ages of 7 and 14 were randomly chosen to take the Sabot's test of cognitive ability in a one-time survey supplement. Test is composed of 10 math and 6 reading multiple-choice questions. "Sabot's math score" and "Sabot's reading score" are fraction of questions on each section answered correctly; "Sabot's score" is fraction of questions on all sections answered correctly. Columns present coefficient estimates from seperate OLS regressions with year of birth fixed effects. Outcome in columns 1-3 is years of completed schooling, outcome in columns 4-6 is binary indicator of whether respondent is enrolled in school at time of survey. Schooling attainment data is missing for 6 observations. Standard errors in brackets account for sample strata and clusters. * denotes significance at 5%; ** denotes significance at 1%.
Years of completed education Currently enrolled in school