schooling and crime in the exclusive society
407
The Journey of the Excluded: Schooling and Crime in the Exclusive Society Author Bouhours, Thierry Published 2007 Thesis Type Thesis (PhD Doctorate) School School of Criminology and Criminal Justice DOI https://doi.org/10.25904/1912/2964 Copyright Statement The author owns the copyright in this thesis, unless stated otherwise. Downloaded from http://hdl.handle.net/10072/365275 Griffith Research Online https://research-repository.griffith.edu.au
-
Upload
khangminh22 -
Category
Documents
-
view
1 -
download
0
Transcript of schooling and crime in the exclusive society

The Journey of the Excluded: Schooling and Crime in theExclusive Society
Author
Bouhours, Thierry
Published
2007
Thesis Type
Thesis (PhD Doctorate)
School
School of Criminology and Criminal Justice
DOI
https://doi.org/10.25904/1912/2964
Copyright Statement
The author owns the copyright in this thesis, unless stated otherwise.
Downloaded from
http://hdl.handle.net/10072/365275
Griffith Research Online
https://research-repository.griffith.edu.au

THE JOURNEY OF THE EXCLUDED:
SCHOOLING AND CRIME IN THE EXCLUSIVE SOCIETY
Thierry Bouhours BBehavioural Science
BA (Hons) Criminology and Criminal Justice
School of Criminology and Criminal Justice
Faculty of Arts
Griffith University
Submitted in fulfilment of the requirements of the Degree of Doctor of Philosophy
December 2006


ABSTRACT
Over the last 30 years, Western school systems have intensified their use of
exclusionary practices as a means of social control in schools. Suspensions, exclusions,
and segregation in special facilities have become the main disciplinary strategies in
what used to be the most inclusive institution since the instauration of compulsory
schooling at the beginning of the twentieth century. In Australian school systems, a
similar growth in educational exclusion has also been observed. During the same
period, educational expenditure in Australia has plummeted while investment in
criminal justice institutions has soared. The emerging international literature on school
exclusion has linked the phenomenon with a greater likelihood of concurrent and future
engagement in crime.
Suggestions have been made that the causes of these exclusionary trends in Western
school systems are situated at three distinct, but possibly interacting, levels. At an
individual level, it has been claimed that the problem is associated with a growing
number of children suffering from defective personal constitutions and deleterious
experiences: hence school disruption has increased. At an institutional level, the
phenomenon has been associated with changes and problems in school discipline and
culture. At a societal level, these trends have been linked to the wider problem of social
exclusion in an increasingly exclusive society.
Using data that permit analyses at these three levels of interpretation, this thesis
investigates the problem of educational exclusion and its association with crime.
Through matching official records from educational, social services, and criminal

ii
justice institutions, the study involves a detailed analysis of the socio-educational
contexts and journeys of 300 individuals who, between 1973 and 2003, were removed
from Queensland regular primary schools and placed in a withdrawal unit. The thesis
examines who they were, where they came from, what happened to them, and where
they ended up. Criminal trajectories data were specifically analysed in relation to three
major competing theories, which are representative of the taxonomic, static, and
dynamic perspectives constituting the field of life course criminology.
The thesis confirms the main findings of extant research about the growing trends in
educational exclusion, the characteristics of the schools and the students involved, and
the link with crime. The thesis concludes that all three levels of analysis (individual,
institutional, and societal) may be used to interpret educational exclusion. However, a
strong version of social exclusion where opportunities are totally blocked for an
underclass actively rejected by exclusionary powers in society, better explains the
growing phenomenon of educational exclusion. The societal level of interpretation also
provides a framework in which the individual and institutional levels can be understood.
The dynamic perspective of criminal trajectories better accounts for the data, despite its
gender and class bias, which it shares with the taxonomic and static perspectives. With
its concepts of social support and structurally-facilitated human agency, which open
opportunity for change (turning points), the dynamic perspective offers more prospects
for social intervention than the taxonomic and static perspectives. These concepts can
be reframed within a structural and more critical analysis of social exclusion,
educational exclusion, and crime.

iii
The thesis proposes that widespread mechanisms of individualisation are essential
components in the processes of exclusion, their maintenance, and reproduction. It is
argued that the implementation of individualised and individualising remedial
programs, at the school or community levels, often further atomisation and processes of
exclusion. It suggests that, instead, school systems and communities, particularly in
disadvantaged areas, need to focus on what could be called “the pedagogy of the
oppressed.” This long-term, educational, comprehensive, and liberating social
intervention places structural oppression, including institutionalised and inter-individual
violence and social exclusion, as objects of study around which school organisations,
curriculum, and pedagogies, are articulated.


v
STATEMENT OF ORIGINAL AUTHORSHIP
The work contained in this thesis has not previously been submitted for a degree or
diploma in any university. To the best of my knowledge and belief, the thesis contains
no material previously published or written by another person except where due
reference is made in the thesis itself.
Signed: _________________________________________________________
Date: / / 2006
DISCLAIMER
The views expressed in this thesis are only the author’s and do not represent the views
of Queensland Department of Education, Queensland Department of Communities,
Queensland Department of Child Safety, or Queensland Police Service. Any errors of
omission or commission are the sole responsibility of the author.


vii
TABLE OF CONTENTS
FIGURES AND TABLES............................................................................................. xi ACKNOWLEDGEMENTS ........................................................................................ xiii LIST OF ACRONYMS............................................................................................... xvi
INTRODUCTION ...........................................................................................................1 I - CONTEXT ..................................................................................................................2 II - RESEARCH QUESTIONS..............................................................................................4 III - SIGNIFICANCE ...........................................................................................................5 IV - OUTLINE OF THE THESIS ..........................................................................................6
A. Part I: Empirical and Theoretical Background ..............................................6 B. Part II: Methods and Setting..........................................................................9 C. Part III: Results and Analyses .......................................................................9 D. Part IV: Summary and Discussion...............................................................11
V - THE PEDAGOGY OF THE OPPRESSED ......................................................................11
PART I: EMPIRICAL AND THEORETICAL BACKGROUNDCHAPTER 1: THE PHENOMENON OF SCHOOL EXCLUSION.......................17
I - KEPT IN THE DARK .................................................................................................18 II - DEFINING SCHOOL EXCLUSION ...............................................................................19 III - VOLUME AND TRENDS............................................................................................22
A. Changing Forms of Social Control ...............................................................22 B. Rising Rates of Official Educational Exclusion ...........................................22 C. The Dark Figure............................................................................................30
IV - THE COST OF SCHOOL EXCLUSION .........................................................................31 V - WHO IS EXCLUDED? ...............................................................................................31
A. Gender, Class, and Race Nexus....................................................................31 B. EBD: School Exclusion Connections and Controversies ............................32 C. Children in Care and School Exclusion........................................................33
VI - REASONS FOR EXCLUSION ......................................................................................33 VII - UNFAIR PRACTICES .................................................................................................35 VIII - SITES OF EXCLUSION ..............................................................................................37
A. Secondary Schools........................................................................................37 B. Primary Schools............................................................................................37
IX - ALTERNATIVE PLACEMENT SITES ...........................................................................39 A. Alternative Placements: Volume and Trends ..............................................40 B. Who is Referred to Alternative Placements?................................................41 C. The Problems with Alternative Placements..................................................41 D. Students’ Feelings about Alternative Placements ........................................43
X - THE EXPERIENCE OF EXCLUSION............................................................................44 XI - EXCLUSIONARY PRACTICES: THE CRIMINAL CONNECTION....................................45
A. Evidence from the UK..................................................................................45 B. Evidence from the USA................................................................................46 C. Evidence from Australia ...............................................................................46
XII - ZERO DE CONDUITE: ZERO TOLERANCE EXPERIMENTS IN SCHOOL SYSTEMS .......47 XIII -CONCLUSION AND RESEARCH QUESTIONS..............................................................48

viii
CHAPTER 2: SCHOOLING AND SOCIETY..........................................................51 I - THEORETICAL FRAMEWORK....................................................................................51 II - SCHOOLING IN LATE MODERNITY...........................................................................53
A. The Exclusive Society ..................................................................................53 B. Schooling and Society ..................................................................................62 C. Schooling in the New World Order ..............................................................69 D. A Critical Theory of School Exclusion ........................................................71
CHAPTER 3: DISCIPLINARY CONTROL IN SCHOOLS...................................79I - SCHOOL DISCIPLINE: A CRITICAL PERSPECTIVE.....................................................80
A. The Four Dimensions of Schooling..............................................................80 B. Barriers Against Change...............................................................................83 C. From the Cane to Ritalin ..............................................................................84 D. EBD Controversies .......................................................................................85 E. The Paradoxes of Inclusion ..........................................................................87 F. The Bulimia Hypothesis ...............................................................................89
II - SCHOOLING AND THE MICRO-PHYSICS OF POWER.................................................90 A. The Power of the Microscope.......................................................................91 B. The Disciplinary Method..............................................................................92 C. The Disciplines .............................................................................................94
CHAPTER 4: THE JOURNEYS OF THE EXCLUDED.......................................101I - BLACK SHEEP IN THE FLOCK ................................................................................101 II - THE SHEPHERDS....................................................................................................101 III - THREE TALES........................................................................................................102
A. Common Ground ........................................................................................104 B. Divergences ................................................................................................108
IV - HYPOTHESES FROM THE TALES ............................................................................116 A. Shared Predictions ......................................................................................116 B. Taxonomic Predictions ...............................................................................117 C. Static Predictions ........................................................................................118 D. Dynamic Predictions...................................................................................118
PART II: METHODS AND SETTINGCHAPTER 5: METHODS.........................................................................................123I - RATIONALE FOR AN ARCHIVAL ANALYSIS...........................................................123 II - GETTING ACCESS ..................................................................................................125 III - DATA SELECTION, CODING, AND MATCHING .......................................................126
A. Excavating the Evidence ............................................................................129 B. The Haven Stories ......................................................................................130 C. The DFS Stories..........................................................................................137 D. The QPS Stories..........................................................................................140 E. Matching the Three Sources and Designing the Dataset ............................142

ix
CHAPTER 6: THE HAVEN .....................................................................................145I - THE SCHOOL HISTORY ..........................................................................................146
A. Origins as a Regular Primary School: 1934-1973 .....................................148 B. The 1st Decade (1973-1982): The Therapeutic Environment ....................149 C. The 2nd Decade (1983-1992): The Rise of “The Behavioural” .................152 D. The 3rd Decade (1993-2003): Crises and Transformations .......................157 E. Summary of Changes during the Last 30 Years .........................................163 F. The Current Regime (1998-2006) ..............................................................166
II - THE ART OF PUNISHMENT ....................................................................................171 III - THE PARADOXES OF INCLUSION ...........................................................................181
A. We Are Not Magicians ...............................................................................181
PART III: RESULTS AND ANALYSESCHAPTER 7: THE EXCLUDED: THE EARLY YEARS ....................................189I - WHERE DID THEY COME FROM? ..........................................................................192
A. Familial Environment .................................................................................192 II - WHAT HAD HAPPENED TO THEM?........................................................................201
A. Child Abuse ................................................................................................201 B. Transient Existence, Instability, and Insecurity..........................................205 C. Schooling Before Referral ..........................................................................208
III - WHO WERE THEY? ...............................................................................................213 A. Psychosocial Profile ...................................................................................214 B. Health Profile..............................................................................................214 C. Cognitive Profile.........................................................................................216 D. Academic Profile ........................................................................................218
IV - WHAT HAPPENED DURING THEIR TRANSIT THROUGH THE HAVEN? ....................219 A. Academic and Social-Behavioural Progress...............................................219
V - CONCLUSION.........................................................................................................221
CHAPTER 8: THE EXCLUDED: THE LATER YEARS ....................................225 I - WHERE DID THEY END UP?..................................................................................225
A. Educational Situation..................................................................................225 B. Health and Medical Situation .....................................................................227 C. Occupational Situation ...............................................................................229 D. Domestic Situation .....................................................................................230 E. Criminal Involvement.................................................................................231
II - CONCLUSION.........................................................................................................246
CHAPTER 9: CRIMINAL TRAJECTORIES ........................................................247I - GROUP-BASED TRAJECTORY MODELLING ............................................................248
A. The Technique ............................................................................................248 B. Application of GBTM in my Study............................................................249 C. Type of Criminal Data Used in the Models................................................250
II - OFFENDING TRAJECTORY GROUPS........................................................................251 A. Youth to Early Adulthood Trajectories: Cohort B, 10-25 Years...............252

x
III - INDIVIDUAL PROFILES AND TRAJECTORY GROUPS ...............................................257A. Constructing the Profiles: Risk and Protective Factors .............................257 B. Aims of Analyses........................................................................................259 C. Types of Statistical Analyses Performed....................................................260 D. Profiles of Youth to Early Adulthood: Cohort B, 10-25 Years .................261
IV - DISCUSSION OF RESULTS......................................................................................275 A. The Age-Crime Curve Controversy............................................................275 B. Questions about Causal Processes..............................................................276
CHAPTER 10: SEVENTEEN LIVES ......................................................................281I - FOUR MAJOR SCENARIOS......................................................................................281 II - GROUPS’ PROFILES AND CASE STUDIES ...............................................................286
A. Not Abused .................................................................................................286 B. Broken Kids ................................................................................................291
III - SUMMARY AND DISCUSSION.................................................................................312A. History Repeats Itself .................................................................................312 B. Neglectful Families and Neglectful Institutions .........................................313 C. School Exclusion, Crime, and the Role of Education ................................313
PART IV: SUMMARY AND DISCUSSIONCHAPTER 11: DISCUSSION...................................................................................319I - SCHOOL EXCLUSION IS PART OF WIDER SOCIAL EXCLUSIONS .............................321 II - MECHANISMS OF INDIVIDUALISATION..................................................................323 III - OUTCOMES OF SCHOOL EXCLUSION .....................................................................325 IV - CLASS CANNOT BE DISMISSED .............................................................................326 V - THE PEDAGOGY OF THE OPPRESSED ....................................................................328
A. Intellectual Quality .....................................................................................328 B. Connectedness ............................................................................................331 C. Recognition of Differences.........................................................................333
IV - EDUCATION AND CRIME REVISITED .....................................................................335
REFERENCES ............................................................................................................337 APPENDICES..............................................................................................................363

xi
LIST OF FIGURES AND TABLES
Figure 0.1. Trend in prison population: 1984-2004 ................................................................... 3 Table 0.1. Expenditure on crime control, Australia, by time periods ........................................ 3 Table 1.1. Rates per 1,000 of disciplinary sanctions reported in England, New Zealand, and
USA ................................................................................................................... 24 Table 1.2. Rates per 1,000 of disciplinary sanctions reported in Australian states ................. 26 Table 1.3. Reasons for Student Disciplinary Absences ........................................................... 35 Table 1.4. Characteristics of children excluded from English primary schools ...................... 39 Figure 2.1. Theoretical framework............................................................................................ 52Table 2.1. Ideological poles and schooling in society ............................................................. 73 Figure 2.2. Functions of schooling and ideological “movement” 1966-99 in England and
Wales ................................................................................................................. 74 Figure 2.3. A framework for understanding school exclusion.................................................. 76 Table 4.1. Commonalities and differences between the three tales ....................................... 103 Table 5.1. Number of individual files available from each source across the three decades .............. 128 Table 5.2. Combination of individual files available from each source across the three decades........ 129 Table 5.3. Amount of records in a sample of 18 files from The Haven ................................ 133 Figure 5.1. Data coding map across institutions for The Haven’s cohort ............................... 143 Figure 6.1. Historical time-line for The Haven....................................................................... 147 Table 6.1. Characteristics of The Haven’s referring and receiving schools 1973-2003, per
decade and for entire period ............................................................................ 151 Table 6.2. Demographics of The Haven historical student population at entry to The Haven
per decade and for entire population ............................................................... 153 Figure 6.2. Ground map of The Haven ................................................................................... 162 Table 6.3. The Haven’s Behaviour Management Plan: reactive strategies .......................... 169 Table 6.4. Typical micro-monitoring of a student’s behaviour during one day at The Haven ...... 173 Figure 6.3. Behaviourogram ................................................................................................... 174Figure 6.4. Behaviour sheet .................................................................................................... 178Table 7.1. Denominators used in reporting results in Chapter 7 ........................................... 190 Table 7.2. Racial-ethnic classification................................................................................... 193 Table 7.3. Family structure.................................................................................................... 194Table 7.4. Family health ........................................................................................................ 196 Table 7.5. Patterns of family violence ................................................................................... 198 Table 7.6. Patterns of family members’ contact with the criminal justice system ................ 200 Table 7.7. Patterns of officially recorded child abuse ........................................................... 203 Table 7.8. Maltreaters ............................................................................................................ 204 Table 7.9. Placements during the length of students’ contact with DFS ............................... 206 Table 7.10. Additional traumas ............................................................................................... 209Table 7.11. Schooling pattern before entry to The Haven ...................................................... 209 Table 7.12. Formal and informal suspensions and exclusions before entry to The Haven...... 210 Table 7.13. Educational supports before entry to The Haven.................................................. 212 Table 7.14. Non-educational support in recorded histories ..................................................... 213 Table 7.15. Psychosocial profiles at entry to The Haven ........................................................ 214

xii
Table 7.16. Health profiles up to entry to The Haven ............................................................. 216 Table 7.17. Cognitive profiles at entry to The Haven.............................................................. 217 Table 7.18. Academic profiles at entry to The Haven ............................................................. 219 Table 7.19. Academic and social-behavioural progress during placement at The Haven ....... 221 Table 8.1. Post-The Haven grade repetition and Student Disciplinary Absences ................. 226 Table 8.2. Academic completion for students aged 17 or over in 2005 for whom a full
schooling history was available....................................................................... 227 Table 8.3. Post-The Haven health/medical situation ............................................................. 228 Table 8.4. Occupational situation at last available report...................................................... 230 Table 8.5. Volume and type of alleged offences not proved for students with an official
criminal history up to 01/01/2005 ................................................................... 232 Table 8.6. Contacts with the criminal justice system (CJS) up to 01/01/2005 ...................... 234 Table 8.7. Patterns of offending (officially and unofficially recorded) up to 01/01/2005..... 236 Table 8.8. Patterns of alleged offending for students with an official criminal history up to
01/01/2005....................................................................................................... 238 Table 8.9. Volume and type of alleged offending for students with an official criminal history
up to 01/01/2005.............................................................................................. 239 Table 8.10. Comparisons of rates of criminal court contacts, convictions, and jail sentences
between general population studies and the population of The Haven ........... 242 Table 8.11. Patterns of sentences to serve time in detention and patterns of incarceration for
students with an official criminal history ........................................................ 243 Table 8.12. The effect of school exclusion on offending: Comparative analysis ................... 245 Table 9.1. Movement between cohorts in the GBTM ........................................................... 250 Table 9.2. Model selection: Cohort B, 10-25 years .............................................................. 252 Figure 9.1. Predicted group trajectories: Cohort B, 10-25 years............................................ 253 Table 9.3. Summary of groups’ statistics: Cohort B, 10-25 years ........................................ 253 Table 9.4. Occasional offenders (10-25 years): most serious offences proved (juvenile and
adult)................................................................................................................ 254 Table 9.5. Slow-rising low-level offenders (10-25 years): most serious offences
proved (juvenile and adult).............................................................................. 255 Table 9.6. Steadily-rising medium-level offenders (10-25 years): most serious offences
proved (juvenile and adult).............................................................................. 256 Table 9.7. Sharply-rising high-level offenders (10-25 years): most serious offences
proved (juvenile and adult).............................................................................. 257 Table 9.8. Risk and protective factor scales .......................................................................... 258 Figure 9.2. Level of risk factors per trajectory group: Cohort B, 10-25 years....................... 262 Table 9.9. Means of risk factor subscales per trajectory group: Cohort B, 10-25 years....... 264 Table 9.10. Moffitt’s taxonomy (based on alleged offending up to age 25)............................ 271 Figure 9.3. Effects of neuropsychological problems and dysfunctional parenting on the
volume of offending up to age 25.................................................................... 272 Figure 9.4. Mean level of dysfunctional parenting per Moffitt’s taxonomy........................... 273 Figure 9.5. Mean level of neuropsychological problems per Moffitt’s taxonomy.................. 274 Figure 9.6. Mean level of violent offences up to age 25 per Moffitt’s taxonomy .................. 274 Table 10.1. Wide sample characteristics ................................................................................. 284 Table 10.2. Deep sample characteristics.................................................................................. 285

xiii
ACKNOWLEDGEMENTS
To start with I would like to thank my supervisors, Professor Kathleen Daly and Dr
Hennessey Hayes from the School of Criminology and Criminal Justice, and Dr Fiona
Bryer from the School of Cognition, Language, and Special Education at Griffith
University. With Kathy, my primary supervisor, I could not hope for a harder master,
but at the same time and consequently for a more committed, generous, stimulating,
sharper, and better one. Thank you Kathy for suggesting at crucial times major
theoretical perspectives to consider and steps to take. Thank you for giving me $2,000
out of your own research budget at a time when I needed financial help so urgently to be
able to employ a research assistant. Thank you for reading so many drafts and
suggesting many conceptual and stylistic changes without which the quality of my
thesis would have greatly suffered. Without Fiona, my associate supervisor, it would
have been impossible to bring this complex interdisciplinary study to completion.
Thank you Fiona for guiding my first steps in the field of special education,
encouraging me to publish papers and present my work with you at professional
conferences. Thank you too for reading through my numerous drafts and suggesting
ways to improve on them.
A special thank you goes to Professor Roger Slee, former Deputy Director General of
Education Queensland and Dean of the Faculty of Education at McGill University,
Montreal, Canada. Roger opened many doors for me in the Queensland Department of
Education and his academic work inspired many aspects of my thesis.

xiv
I am especially grateful for the help, openness, and participation of Susan Fleming,
principal of The Haven since 1999. Without her support and contribution this thesis
would not exist. Thank you also to the administrative and teaching staff at The Haven
who welcomed me in their school and provided me with additional information to
conduct my research. I wish to express my gratitude to Shane Anderson, who taught at
The Haven from 1994 to 1998 and was the principal of The Haven between 1998 and
1999, and gave me valuable information about The Haven’s history.
In addition to The Haven, I want to thank Queensland Department of Education,
Queensland Department of Communities, Queensland Department of Child Safety, and
Queensland Police Service, for allowing unrestricted access to their records. My special
gratitude goes to the Queensland Department of Premier for providing much needed
help through a $10,000 Smart State PhD Grant and to Griffith University for its
scholarships ($89,000). I want to greatly thank Lynn De-Lange, Acting Principal
Education Officer, for her ongoing support and her valuable comments on my early
drafts. Thank you also to Gayle Anderton, Policy Research Officer at the former
Department of Family Services. Without Gayle who facilitated access to DFS data and
negotiated research agreements and additional resources ($3,000) this thesis would not
have been possible. A warm thank you also goes to Rick Williams, Manager Research
at the Department of Communities and my helpful mentor in the Department.
I will never forget the great hospitality, generosity, and patience, of all the staff from the
Performance and Measurement Unit at the former Department of Family Services.
These people not only hosted me in their office for nearly a year, but also provided great
assistance during the complex and lengthy stage of data gathering.

xv
Six diligent and highly skilled individuals directly helped me with their indispensable
research assistance. My sincere gratitude goes to Daniel Rechlin, Virginia Molyneux,
Janelle McCarthy, Kate Burchill, and Brigitte Bouhours for their excellent and
painstaking work in helping me gather and code a huge amount of data, and to Michael
Livingston for his expert assistance with complex statistical techniques. Many others
helped me in more indirect ways, particularly all the students, academics, and social
policy advisers who contributed in the Roundtable Network to inspiring debates on
schooling and society and school discipline.
I cannot thank my wife Brigitte enough, not only for her love and her patience with me,
but also for her immense support and intellectual stimulation. Thanks Brigitte for
reading and editing so many drafts, helping me with the design of figures and tables,
and engaging in many discussions about my thesis, discussions so valuable for me that I
often abused your great fortitude. My love and gratitude to our daughter Natasha who
contributed to this thesis with her professional photographic work.
Finally, although I did not meet them in person, I want to particularly thank the children
of The Haven and their families. They are the true actors and writers of the story I
wished to tell. To you, to your tragic existence, to the great injustice you suffer, to the
terrible and undeserved harms you endure, and to your struggle in the midst of
intolerable oppression, I dedicate this thesis.
Thierry Bouhours
Brisbane, December 2006

xvi
LIST OF ACRONYMS
ABC Australian Broadcasting Corporation ADD Attention Deficit Disorder ADHD Attention Deficit Hyperactivity Disorder AL Adolescence-Limited AOBH Assault Occasioning Bodily Harm BBH Brisbane Boys Home BIC Bayes Information Criteria BMP Behaviour Management Plan CAP Centre for Alternative Programs CCTV Closed Circuit Television CD Conduct Disorder CJS Criminal Justice System CLAD Centre for Learning and Adjustment Difficulties CMC Crime and Misconduct Commission CPN Child Protection Notification DB Dangerous Behaviour DCS Department of Child Safety DFS Department of Families DOC Department of Communities EAL Ensnared Adolescence-Limited EBD Emotional and Behavioural Disorder FOI Freedom of Information GBTM Group-Based Trajectory Modelling IL Inappropriate Language IQ Intelligence Quotient JAB Juvenile Aid Bureau LCP Life-Course-Persistent LD Learning Difficulties LLC Low-Level Chronic LR Locked Room NA Not Applicable NFI Not Following Instruction NR Not Reported NRO Not Respecting Others NRP Not Respecting Property NRS Not Respecting Self NSW New South Wales ODD Opposition Defiant Disorder PRU Pupils Referral Unit QPS Queensland Police Service QSRLS Queensland School Reform Longitudinal Study SDA Student Disciplinary Absence S1 Stage One Time-Away S2 Stage Two Time-Away S3 Stage Three Time-Away SES Socio-Economic Status TAFE Technical and Further Education UK United Kingdom USA United States of America WISC Wechsler Intelligence Scale For Children

INTRODUCTION
Since childhood, I have always been fascinated by stories of escapees. From Jean
Valjean1 to Papillon,2 those who have been locked up, those who have been encaged,
those who are under tight surveillance, those who are tracked and who resist, struggle,
break prison bars, dig tunnels, plot great escapes and run away, have been my special
friends. At home, as long as I could remember, my working class parents had been
involved in a violent war against each other; a violent man at the throat of an aggressive
woman diagnosed schizophrenic. At school, I was an unruly and rebellious child who
refused to write the letter “u” and rejected all forms of collective punishment. I was
made to repeat Grade 5. At the end of my second go at it, I was excluded from school.
I was 10, and placed in a boarding school for recalcitrant boys. From this place you
were only allowed to go home once every fortnight. At night if, after the special time
allocated for this ritual, you felt like going to the toilets and your steps were heard by
the warden (and most of the time the creaking floorboards insured they were), you were
punished. Once, chasing a beautiful butterfly, I went outside the allowed boundaries
and got caught. I was punished. For my penance, I was kept in detention during the
home-visit weekend, and had to spend a great part of Sunday standing still in front of
the principal’s office. Why is it that I found so many parallels between my own school
life as well as others’ stories about schools, and les bagnes of Henri Charrière’s
Papillon (1970), the convict culture he described, a world where, if you did not want to
be completely subjugated, you had to be cunning, you had to learn “how to use the
1 Fictional character, convicted escapee, from Victor Hugo’s novel Les Misérables (1862). 2 Henri Charrière’s alias in his autobiographical novel Papillon (1970).

2
system,” and develop dissimulation to a fine art? Probably because both are places of
punishment.
In 2002, when I embarked on this doctoral journey, my luggage, therefore, included a
lifelong concern with questions of power, aggression, and violence, and an enduring
struggle for social justice. Over the years, I had also acquired the conviction that
education was a key process through which these questions could be understood, as well
as an arena in which the struggle for social justice should be carried out. I revisited this
lifelong theme when I added The Pedagogy of the Oppressed (Freire, 1970) to my
luggage.
I – CONTEXT
Research in the English-speaking world has documented how educational exclusion has
increased steadily over the last 20 years. The same body of research suggests a strong
link between school exclusion and crime. In Australia, societal engagement with
education has plummeted, and investment in criminal justice institutions is soaring.
Figures from the Australian Institute of Criminology (2006) reveal that the overall rate
of adult imprisonment nearly doubled between 1984 and 2004, from 88 to 158 per
100,000 adult population (Figure 0.1). State expenditure on crime control has also
increased in the 1980s and 1990s (Table 0.1) (Hinds, 2002). At the same time, in
Australia, educational expenditure as a percentage of GDP has been at its lowest since
the educational crisis of the sixties and well below the average for OECD countries

3
(Australian Library and Information Association, 2002; Lingard, Mills, & Hayes, 2001;
Martin, 2000).
Figure 0.1. Trend in prison population: 1984-2004 (reproduced from AIC, 2006, p. 85)
Years
Rat
e per
100,0
00 a
dult p
opula
tion
Table 0.1. Expenditure on crime control, Australia, by time periods (from Hinds, 2002,
p. 104)
1980s 1990s Employee rates and $ expenditure Mean Sdt Dev Mean Sdt Dev
Police employee rate (per 100,000 population)
304.7 136.7 332.3 105.2
Corrections employee rate (per 100,000 population)
69.6 61.9 71.4 48.4
$ spent on police per capita 109.3 60.4 318.9 147.3
$ spent on legal per capita 30.7 25.5 50.6 27.6
$ spent on corrections per capita 32.4 20.7 106.3 90.4

4
II - RESEARCH QUESTIONS
The phenomenon of increasing school exclusion and the literature about its association
with further exclusionary processes and mechanisms, including crime and
criminalisation, have evoked and suggested three broad questions. Can this
phenomenon be explained by: (a) increasing individual misbehaviour and school
disruption, (b) changes and problems in school discipline, or (c) the societal problem of
social exclusion? These questions suggest that educational exclusion can be framed at
three levels: individual, institutional, and societal.
At the individual level, school exclusion can be viewed as an individual problem
associated with personal constitution and experience. At the institutional level, it can be
viewed as an educational problem associated with school operations. At the societal
level, it can be viewed as a society-wide problem associated with the phenomenon of
social exclusion in an increasingly exclusive society. The major aim of this thesis is to
explore these three levels and determine how they interact and affect the problem of
educational exclusion. Another aim is to identify whether the policies and practices of
school exclusion lead to further social exclusion, including long-term unemployment
and criminal involvement, and how they influence such a negative outcome.
My thesis draws from official records kept by educational, social services, and criminal
justice institutions. I assemble several datasets to depict the socio-educational contexts
and journeys of 300 individuals who were removed from Queensland primary schools
between 1973 and 2003, and placed in a special educational facility (“The Haven”) after

5
their withdrawal from regular school. The process of reconstructing the life course of
these 300 individuals includes examination and matching of records held by four
Queensland departments (Education Queensland, Department of Communities,
Department of Child Safety, and Queensland Police Service). I investigate who they
were, where they came from, what happened to them, and where they ended up. The
research highlights the negative consequences of school exclusion, and the exacerbating
or buffering role that can be played by educational and social institutions.
III - SIGNIFICANCE
In Australia, few studies have been conducted on educational exclusion (particularly
from primary schools) and alternative placements, and the impact on the socio-
educational trajectory of students, including concurrent and later offending. My
empirical material answers key questions relating to young children’s educational
experiences and post-education behaviour. The results elucidate the links between
exclusionary practices and post-education negative life events, such as chronic
unemployment and criminal activity.
My project is unique. Apart from a study by Berridge et al. (2001) on “the independent
effects of permanent exclusion from school on the offending careers of young people”
in the UK, my methodology is unprecedented in the English-speaking world. For many
researchers, it has been nearly impossible to obtain access to official records from major
government departments for the purpose of data linkage. The longitudinal design and
the nature of the data (multisource, multilevel, as well as quantitative and qualitative)

6
permit an analysis of the impact of evolving educational, child protection, health, and
youth justice policies and practices on children’s and youths’ trajectories.
IV - OUTLINE OF THE THESIS
My thesis is in four parts. Part I outlines the contexts of educational and social
exclusion. It investigates and discusses the empirical and theoretical literature about
school exclusion, social exclusion, and criminal trajectories. Part II presents the
methods and the setting used for the study. Part III provides detailed results and
analyses about the 300 individuals in the study, as well as the socio-economic, familial,
and educational contexts in which they developed. It tells who they were, where they
came from, what happened to them, and where they ended up. Using both statistical
techniques and case studies, it analyses and interprets their socio-educational
trajectories with a focus on criminal pathways. Part IV offers a general discussion of
the major findings of the study.
A. Part I: Empirical and Theoretical Background
Chapter 1, The Phenomenon Of School Exclusion, reviews the international and
Australian empirical literature on educational exclusion. This chapter outlines the
diverse forms of exclusionary practices from official school exclusion to placement in
alternative educational facilities. I document the growing trends in educational
exclusion across the various school systems of the English-speaking Western world and
present the characteristics of the schools involved in such practices. I report on the
demographics of the children who are removed from regular schools, particularly during

7
their primary years, and on the socio-educational outcomes associated with such
practices.
Chapter 2, Schooling and Society, presents my theoretical framework, which is
organised around three levels of analysis (societal, institutional, and individual). The
societal/macro level investigates the roles, aims, functions, and processes of schooling
in late modernity. At this level, I draw primarily from the literature on the sociology of
education, and the problem of social exclusion, especially from Young’s (1999) thesis,
The Exclusive Society. Then, I discuss the critical theory of school exclusion proposed
by Parsons (1999), which I present as a synthesis of the questions encountered at the
societal level of analysis.
Chapter 3, Disciplinary Control in Schools, investigates the institutional/meso level. At
this level, I draw from three theoretical sources. First, I draw from Cohen’s (1985)
thesis, Visions Of Social Control, in which he discusses changes in the master patterns
of social control during the last century. Then I outline Slee’s (1995a) critical
perspective on school discipline in which he proposes to view school discipline
educationally, that is, in relation to a school’s philosophy and values, organisation,
curriculum, and pedagogies. Slee’s perspective stands in opposition to an
individualised “medical” model, which views school discipline solely as a matter of
social control and punishment. Finally, for discipline and punishment, I draw from
Foucault’s analysis of the micro-physics of power in the school institution. In Chapter
3, I also discuss the theme of individualisation, whereby social problems such as

8
educational and social exclusion are reduced to individual agency, hence furthering the
processes of exclusion.
The individual/micro level, which I investigate in Chapter 4, The Journeys of the
Excluded, draws from theoretical works in the field of developmental and life course
criminology. To theorise this individual level, I select and discuss three major
representative “tales” in this field: (a) Moffitt’s (1993) taxonomic theory between
Adolescence-Limited and Life-Course Persistent offenders, (b) Gottfredson and
Hirschi’s (1990) static theory of individual low self-control, and (c) Laub and
Sampson’s (2003) general age-graded dynamic theory of informal social control.
Moffitt proposes that criminal trajectories can be understood in terms of two distinct
types of offenders and aetiologies: The Life-Course Persistent offenders whose
persistent trajectory is caused by an interaction between childhood neuropsychological
problems and dysfunctional parenting, and the Adolescence-Limited offenders who
have not been affected by neuropsychological problems or dysfunctional parenting. The
temporary offending of the Adolescence-Limited offenders is caused by their imitation
of the Life-Course Persistent offenders whom they perceived as more mature.
Gottfredson and Hirschi propose that criminal trajectories can all be understood in term
of a single causal process, low individual self-control, which results from defective
parenting and continues throughout life. Laub and Sampson propose that criminal
trajectories can be understood in terms of one central causal process, informal social
controls, and two subsidiary processes, routine activity and human agency. Nothing is
fixed because these three processes can operate at any stage of an individual life course
and constitute turning points that precipitate or deflect criminal involvement. In

9
Chapter 4, I compare these three theories, discuss their commonalities and divergences,
point to their limitations and individualising characteristics, and formulate hypotheses
drawn from their respective propositions.
B. Part II: Methods and Setting
Chapter 5, Methods, outlines my research methodology. I explain my rationale for
choosing the archival analysis (i.e., the examination of institutional records) as the
method for my study. This chapter describes the process of data collection and the
procedures used for coding data and designing the datasets. In Chapter 6, The Haven,3 I
present the unique setting where the 300 individuals in my study were placed for a
period of time, when they were on average 10 years old, after their removal from
mainstream primary schools. This chapter describes the history of this special setting,
variations in the characteristics of its student population, periods of crisis and renewal,
and changes in pedagogical approaches and disciplinary regimes. Using Foucault’s
microscope, I analyse and discuss these changes and show how they relate to
mechanisms of individualisation and processes of exclusion.
C. Part III: Results and Analyses
In Chapter 7, The Excluded: The Early Years, I produce a detailed account of the
characteristics of the 300 individuals in the study. At an aggregate level, I report on
who they were, where they came from, and what happened to them. I examine their
psychosocial, cognitive, and health profiles, and their socio-economic, familial, and
3 I chose this pseudonym for two reasons. First, it reflects the general attitude and purpose of the withdrawal unit. Second, as Mongon (1988) remarked, withdrawal units have often used appellations such as “Sanctuary” or “Retreat” to indicate the respite functions of their facilities.

10
educational backgrounds as well as what happened to them in these institutions. I
analyse and discuss these results in the light of the empirical and theoretical literature on
educational and social exclusion.
Chapter 8, The Excluded: The Later Years, charts the individuals’ socio-educational
journeys. In Chapter 9, Criminal Trajectories, I present results from a Group-Based
Trajectory Modelling (GBTM) of individual offending patterns. To test, analyse, and
discuss the competing taxonomic, static, and dynamic theories of criminal trajectories,
using additional statistical techniques, such as ANOVA, and multiple and logistic
regressions, I examine the relations between the individual socio-educational profiles
and the distinct criminal trajectories indicated by GBTM. My thesis shows that the
dynamic theory of criminal trajectories, despite limitations associated with its gender
and class bias, provides a better account of offending and desistence than do the static
and taxonomic accounts.
In Chapter 10, Seventeen Lives, I present and analyse 17 case studies of life course
development constructed from a rich pool of qualitative data. These 17 biographies
provide further insights into the mechanisms of educational and social exclusion. They
show a number of pathways to offending and desistence, and document how institutions
can either increase the risks of social exclusion and offending or buffer against these
risks. The major theme emerging from the case studies is a story of social reproduction:
reproduction of social disadvantage, reproduction of educational and social exclusion,
and reproduction of harms. They illustrate how exclusion or inclusion influences the
patterns of criminal involvement.

11
What emerges from my analysis are 300 lives structured largely (although not
exclusively) by utter deprivation, violence, crime, and criminalisation, in which school
exclusion is part of a wider process of social exclusion. At the same time, the very
nature of exclusionary processes is to occlude social/structural problems through
mechanisms of individualisation and the rhetoric of individual constitution and agency.
D. Part IV: Summary and Discussion
In my discussion (Chapter 11), I argue that the three levels (individual, institutional, and
societal) feature as forces promoting school exclusion, but societal/structural factors
exert more power on the phenomenon. Yet, through the erasure of social class and
other mechanisms of individualisation, the phenomenon is treated as an individual
problem. Contrary to what the three developmental crime theories suggest, social class
is relevant to both school exclusion and crime; however, the concepts of turning points,
social support, and structurally-facilitated human agency, proposed by the dynamic
theory, offer more prospects for social interventions than the tenets of the taxonomic
and static theories. I propose that education and, borrowing from Freire (1970), what I
call the pedagogy of the oppressed, are means to structurally facilitate the human
agency of the truly disadvantaged.
V - THE PEDAGOGY OF THE OPPRESSED
The most marginalised and disadvantaged children in our societies are the primary
targets of exclusionary practices in education around the Western world. My thesis

12
shows that state and local agencies (education, health, families, communities, and
criminal justice) have precisely documented the problems of disadvantaged children,
but have not altered individual trajectories towards life failure. The files reveal an
extensive record keeping of a downward spiral in the lives of these children, but little
sharing of this information. Case-by-case treatment of information from child to child,
from time to time, and from setting to setting has been a barrier to systemic change
towards social inclusion. It has contributed to the reproduction of inequality.
All along I have noted a particular mechanism that facilitates the processes of exclusion,
their reinforcement, and their maintenance. This is the mechanism of individualisation,
which not only excludes but also renders the excluded impotent. To reverse the
deleterious effects of this mechanism, I suggest the introduction of a comprehensive
educational alternative, which, borrowing from Freire (1970), I call the pedagogy of the
oppressed.
Alinsky (1971) points out that being organised generates both psychological and
political power and reduces the need for violence. Rappaport (1987) proposes that
educating the dispossessed about the social structures facilitates “social empowerment.”
He suggests that social empowerment has the potential to transform the individual angst
of the dispossessed, which often manifests in interpersonal violence and crime, into
collective action that can change exploitative and violent power relations. As Freire
(1970, p. 31) explains “any situation in which A objectively exploits B or hinders his
(sic) pursuit of self-affirmation as a responsible person is one of oppression and such a
situation in itself constitutes violence.” Unfortunately, as Young (1999) remarks, the

13
oppressed instead of striving for liberation, particularly where no political solution is
possible, often become oppressors, or “sub-oppressors,” that is, they turn aggressively
against their immediate social environment.
The combination of relative deprivation and individualism is a potent cause of crime in situations where no political solution is possible: it generates crime, but it also generates crime of a more internecine and conflictive nature. The working class area, for instance, implodes upon itself: neighbours burglarise neighbours, incivilities abound, aggression is widespread. … It is only in circumstances where people experience social injustice that discontent will occur and only in those societies where there is no political or perhaps religious outlet for discontent that crime is likely to occur (Young, 1999, pp. 16, 159).
The relevant pedagogy is therefore about “curriculing” what the oppressed bring with
them, for instance, into the school. It is aggression and violence, both the interpersonal
and the institutionalised types, dispossession, deprivation, power relations and
dominance hierarchies, as they exist in their lives, taken as objects for their collective
study. The goal of this pedagogy is to provide weapons; it is to arm the oppressed.
However, these weapons are not offensive weapons, but detectors of illusions and
deceptions. The aim is to raise the consciousness of the oppressed and help them
understand that the “cross of inequities” (Young, 1999, p. 157) is not just a risk factor
that should be alleviated but also an injustice that should be seen for what it is and
fought. The role of the pedagogue is to support the oppressed learner in his/her search
for and the judicious use of these weapons.
Although compared to traditional individualised remedial programs this proposal may
appear radical, it is not utopian. In great part, it draws from and is situated within the
theoretical works and the practices of the inclusive and democratic education movement
represented, amongst many other educationists, by renowned scholars such as Knight
(1985, 2000), Levin (1998), Pearl (1988), and Slee (1988, 1992, 1995a, 1997, 1998b,

14
1999). It is found in the practical recommendations of the Queensland School Reform
Longitudinal Study (QSRLS) (School of Education-UQ, 2001) about the development
of “productive pedagogies” that focus on “intellectual quality,” “connectedness,” and
“recognition of differences,” which the QSRLS found were rarely delivered to the truly
disadvantaged.

PART I:
EMPIRICAL AND
THEORETICAL BACKGROUND


CHAPTER 1
THE PHENOMENON OF SCHOOL EXCLUSION
The two main socialising institutions for children and youth, over the past two centuries
and today, have been the family and the school. Failure in school and a difficult family
life feature in virtually all theories of youthful lawbreaking, past and present. School
failure - both a child’s inability to fit in and learn in school, and a school’s exclusionary
practices that alienate a child - are the focus of this thesis. In particular, I am interested
in the phenomenon of educational exclusion and its relationship to social exclusion and
crime.
A large body of empirical evidence from the Western world connects students’
schooling and crime (for Australia, see National Crime Prevention, 1999; for the USA,
see Skiba & Peterson, 2000; for the UK, see Farrington, 1996). Precisely how
schooling (and in particular, certain types of pedagogical regimes) is connected to crime
is highly complex and not well understood. There is evidence, however, that
educational exclusion is associated with subsequent offending (Berridge et al., 2001;
O’Halloran, 1999; Pritchard & Cox, 1998; Skiba et al., 2003). Rather than a direct
causal link, it is likely that exclusionary practices precipitate or accelerate a number of
crime-promoting processes. By analysing the records of 300 excluded students in one
Queensland school district over a 30-year period, I shall show in which ways these
crime-promoting processes develop and evolve. In Australia and in other Western
countries, such as the USA and England, exclusionary practices in schools are

18
increasing. In this chapter I review the data on exclusionary practices, consider their
diverse forms and their effects on children, and examine the profile of these children.
I - KEPT IN THE DARK
An important problem for this study is the lack of transparency about the phenomenon
of educational exclusion, particularly in Australia. Because of this lack of transparency,
Australian media, at least in Queensland and Victoria, have several times used Freedom
Of Information (FOI) legislation to obtain data on the rates of school suspensions and
exclusions from education departments (see below). In this country only two
jurisdictions (Victoria and Western Australia) have received some research attention
(Dettman, 1972; Edwards, 1996; Hyde & Robson, 1984; Partington, 2001; Slee, 1995a).
In the states of New South Wales and South Australia, there have been reports of patchy
figures and mentions of increasing rates from one year to the next (Colman & Colman,
2002; Taylor, 1995), but no direct investigation of this phenomenon. In the state of
Queensland, the jurisdiction where my study is located, little has been published (apart
from Hearle, 1994; Howard, 2004; and Mackie, 1994).
Most of the empirical literature reviewed in this chapter comes from the UK, where the
topic has received more attention, and to a lesser extent from the USA. Given the
acknowledged importance of school processes in the crime equation, there are at least
two reasons for the scarcity of research. First, as a disciplinary sanction, school
exclusion is relatively recent. Second, education departments, including in Australia,
are extremely reticent to release data. Taylor (1995) published a report commissioned

19
by the National Children’s and Youth Law Centre in an attempt to obtain a nationwide
picture of the situation. She pointed out that “literature searches revealed limited
information on suspension, exclusion and expulsion from schools in Australia” (p. 3).
Taylor did not use FOI legislation to obtain her data, but in her recommendations she
emphasised:
The lack of reliable statistical evidence is itself disturbing: apart from South Australia there is no breakdown indicating which students are being excluded from which schools on what grounds. Because of this it is impossible to ascertain the extent to which exclusion policies are targeting already disadvantaged groups such as young people with disability, young Aboriginal and Torres Strait Islander people, young people of ethnic minority background and young people from one parent families. The failure to collect and publish statistical data may amount to indirect discrimination as it conceals the extent to which exclusion policies are discriminatory in their impact (Taylor, 1995, p. 20).
Twice, in 1998 and 2004 in the state of Queensland, and in 2003 in the state of Victoria,
Australian media used Freedom Of Information (FOI) legislation to force education
departments to release data on the extent of the phenomenon, especially on the
characteristics of the students and the schools involved in it. The recent use of FOI
legislation in two Australian jurisdictions in order to obtain detailed statistical
information demonstrates that Taylor’s (1995) important recommendations have not
been implemented. However, as a result of FOI legislation, education departments in
Queensland and Victoria released some figures that were published by the Courier Mail
in Queensland (Dullroy, 2004; Templeton, 1998) and by the Sunday Herald Sun in
Victoria (Rindfleisch, 2003).
II - DEFINING SCHOOL EXCLUSION
Broadly speaking, exclusionary practices cover both formal and informal disciplinary
sanctions that remove a student temporarily or permanently from the regular classroom

20
or the mainstream school, and school processes that deny students adequate education
and exclude them from full participation. There are two main types of official
exclusionary sanctions: (a) school suspension, a temporary exclusion from the school
or mainstream classroom (Dupper, 1998; Morrison, Anthony, & Storino, 2001;
Morrison & Skiba, 2001; Vulliamy & Webb, 2000), and (b) school exclusion, a
permanent exclusion from the school or the mainstream school system (Taylor, 1995;
Vulliamy & Webb, 2000).
In the Queensland public school system, at the present time, there is a gradient of
official “school disciplinary absences” (SDA) ranging from short suspension (up to 5
days), long suspension (between 6 and 20 days), exclusion from a particular school, and
exclusion from all Queensland state schools. In the case of both short and long
suspensions, students are allowed to return to their school at the end of the sanction;
however, in the case of long suspensions, the school applying the sanction is supposed
to find an alternative educational provision where the student should be placed during
the period covered by the sanction. To this effect, school districts have created facilities
called Centres for Alternative Programs (CAP). In the case of exclusion, students are
permanently expelled from the school applying the sanction; however, they can
negotiate their enrolment in another state school, which may or may not accept their
enrolment. In the case of exclusion from all Queensland state schools, students can
only enrol in public distance education (i.e., correspondence schooling). Alternatively
they can seek enrolment in the private school system or in the public system of another
jurisdiction. Exclusion occurring when students have passed the age limit of

21
compulsory schooling (15 years in Queensland until 2005, then 16 years from 2006) the
sanction is referred as “cancellation of enrolment” rather than school exclusion.
Independently of regulated SDA, some Queensland schools have created on-site (i.e.,
within the school grounds) withdrawal facilities in order to temporarily remove students
from their regular classroom. There are also a number of off-site (i.e., outside the
school grounds) withdrawal units where students can be referred and placed (following
or not a disciplinary sanction) for a variable period, but generally subject to a
predetermined limit. Other exclusionary practices (less obvious and direct than official
disciplinary sanctions such as suspension and exclusion, and unofficial strategies that
“ease out” students) alienate students from schooling. These practices, which are part
of what is often referred to as the “school culture” (Smyth & Hattam, 2000), pertain to
the core elements of schooling (Slee, 1992) and include the philosophy and values of
the school, its organisation, curriculum, and pedagogies.
The literature tends to use the term “school exclusion” in a generic sense, which
includes many different forms of exclusionary practices. At times this broad
terminology can be confusing. From now on, to avoid confusion, as far as possible, I
will use the term school exclusion for official permanent exclusion and the term school
suspension for official temporary exclusion. I will use the term educational exclusion
for both official and unofficial exclusion and suspension, as well as withdrawal in
special units. Finally, I will use the expression school exclusionary practices for all

22
practices that remove students from their school or classroom, permanently or
temporarily, officially or unofficially, and practices that alienate students from school.4
III - VOLUME AND TRENDS
I turn now to a snapshot picture of the extent and development of official suspensions
and exclusions in the UK, the USA, and Australian states. Before doing so, I briefly
discuss a major change in the schools’ disciplinary arsenal that a number of authors
have associated with the growing use of SDA.
A. Changing Forms of Social Control
In the UK and Australia, a rise in the number of suspensions and exclusions and the
introduction of such sanctions in primary schools have coincided with the abolition of
corporal punishment (Edwards, 1996; Howard, 2004; Slee, 1995a). Edwards (1996)
notes that official exclusions in Victoria primary schools were unknown before 1983,
the year when corporal punishment was abolished in the state. Howard (2004) reports a
similar development in Queensland primary schools in the 1990s. Corporal punishment
was officially abolished in Queensland in 1995.
B. Rising Rates of Official Educational Exclusion
A significant increase in the rates of official educational exclusion has occurred during
the last 15 years. This trend is reported in England and Wales (Bagley & Pritchard,
1998; Gillborn & Gipps, 1996; Hallam & Castle, 2001; Hayden, 2002; Hayden & Ward
4 In Chapter 2, I will also define my use of the following terms: education, education systems, school systems, school processes, schooling, and pedagogy.

23
1996; OFSTED, 1996; Parsons, 1996, 1999; Sanders & Hendry, 1997; Slee, 1995a;
Vulliamy & Webb, 2000); the USA (Fuentes, 2003; Skiba et al., 2003); Canada
(Sautner, 2001); and Australia (Colman & Colman, 2002; Dullroy, 2004; Edwards,
1996; Partington, 2001; Slee, 1998a; Taylor, 1995). Tables 1.1 and 1.2 present the rates
of official suspensions and exclusions in these countries (in all the tables throughout the
thesis NR stands for Not Reported and NA stands for Not Applicable).

24
Tabl
e 1.
1. R
ates
per
1,0
00 o
f dis
cipl
inar
y sa
nctio
ns re
porte
d in
Eng
land
, New
Zea
land
, and
USA
a
EN
GLA
ND
(Fi
gure
s fr
om
Dep
artm
ent
of
Educa
tion a
nd S
kills
, 2005,
unle
ss o
ther
wis
e st
ated
)Yea
rsFi
xed t
erm
exc
lusi
ons
(susp
ensi
ons)
Pe
rman
ent
excl
usi
ons
Note
s or
dat
a s
ourc
es
1991-9
224.0
2.1
H
ayden
(1997)
1990-9
6
num
ber
of
tem
pora
ry a
nd p
erm
anen
t ex
clusi
ons
trip
led
Bag
ley
& P
ritc
har
d (
1998)
1997-9
8
NR
1.6
boys
: 2.6
, girls
: 0.5
Num
ber
of
per
man
ent
excl
usi
ons
rose
by
433%
bet
wee
n 1
990-9
2 a
nd
1997-9
8 (
Vulli
amy
& W
ebb,
2000)
2000-0
1
20.0
(H
ayden
, 2002)
1.2
boys
: 1.9
, girls
: 0.4
Hay
den
(2002):
11%
incr
ease
in n
um
ber
of
per
man
ent
excl
usi
ons
duri
ng
2000-0
1 s
chool ye
ar
2003-0
4
50.0
boys
: 67.0
, girls
: 21.0
(es
tim
ates
) Eth
nic
min
ori
ties
: 67.0
, W
hites
: 49.0
M
ean len
gth
: 3 d
ays
1.3
boys
: 2.0
, girls
: 0.5
Bla
cks:
2.9
�84%
of
sanct
ions
from
sec
ondar
y sc
hools
�
Boys
: 77%
of
susp
ensi
ons,
81%
of
excl
usi
ons
�Stu
den
ts r
ecei
ved o
n a
vera
ge
2 s
usp
ensi
ons
(26 s
usp
ended
stu
den
ts p
er
1,0
00 s
tuden
ts)
NEW
ZEA
LA
ND
Yea
rsSta
nd-d
ow
ns
(short
susp
ensi
ons)
Susp
ensi
ons
(ove
r 5 d
ays)
Exc
lusi
ons/
ex
puls
ions
Note
s
1999-2
000
(NZ M
oE,
2000)
23.2
boys
: 33.4
girls
: 12.3
7.0
boys
: 10.4
girls
: 3.6
M
aori:
16.7
2.4
�
Sec
ondar
y sc
hools
acc
ount
for
around 8
0%
of
all sa
nct
ions
�M
aori s
tuden
ts r
epre
sent
20%
of th
e sc
hool popula
tion,
but
40%
of
all
studen
ts s
tood-d
ow
n a
nd 4
8%
of
all su
spen
ded
stu
den
ts
�16%
of
studen
ts w
ere
susp
ended
more
than o
nce
2004
(NZ M
oE,
2005)
28.1
boys
: 39.0
girls
: 17.0
M
aori:
70.0
6.6
boys
: 9.0
girls
: 4.0
M
aori:
19.0
1.0
�
Sec
ondar
y sc
hools
acc
ount
for
73-7
9%
of
all sa
nct
ions
�M
aori s
tuden
ts r
epre
sent
21%
of th
e sc
hool popula
tion,
but
41%
of
all
studen
ts s
tood-d
ow
n a
nd 4
7%
of
all su
spen
ded
stu
den
ts
US
A Yea
rsSusp
ensi
ons
Exp
uls
ions
Note
s or
dat
a s
ourc
es
2000
(US D
oE,
2005,
Tab
le
143)
66.0
boys
: 92.0
, girls
: 39.0
Bla
cks:
133.0
, H
ispan
ics
& W
hites
: 51.0
2.1
boys
: 3.1
, girls
: 1.0
Bla
cks:
4.0
, H
ispanic
s &
Whites
: 2.0
�O
ver-
repre
senta
tion o
f boys
and e
thnic
min
orities
�
Bla
cks
repre
sent
17%
of
the
studen
t popula
tion,
but
ove
r 30%
of
susp
ended
and e
xclu
ded
stu
den
ts (
Fuen
tes,
2003)

25
MA
SS
AC
HU
SETTS
Yea
rsSusp
ensi
ons
Exp
uls
ions
Note
s on o
verr
epre
senta
tion o
r dat
a so
urc
es
1997-9
8
NR
1.4
boys
: 2.2
, g
irls
: 0.6
�Afr
ican-A
mer
icans:
3.1
, H
ispanic
s: 5
.0,
Whites
: 0.8
(M
ass
DoE,
2000)
1998-9
9
NR
1.4
boys
: 2.2
, g
irls
: 0.5
�Afr
ican-A
mer
icans:
3.1
, H
ispanic
s: 4
.5,
Whites
: 0.8
(M
ass
DoE,
2000)
1999-0
0
NR
1.5
boys
: 2.3
, g
irls
: 0.6
�Afr
ican-A
mer
icans:
4.1
, H
ispanic
s: 4
.7,
Whites
: 0.7
(M
ass
DoE,
2000)
2000-0
1
NR
1.7
boys
: 2.5
, g
irls
: 0.8
�Afr
ican-A
mer
icans:
5.1
, H
ispanic
s: 4
.6,
Whites
: 0.9
(M
ass
DoE,
2003)
2001-0
2
NR
1.9
boys
: 2.8
, g
irls
: 0.8
�Afr
ican-A
mer
icans:
5.0
, H
ispanic
s: 4
.8,
Whites
: 1.1
(M
ass
DoE,
2003)
2002-0
3
NR
2.0
boys
: 3.0
, g
irls
: 0.9
�Afr
ican-A
mer
icans:
6.1
, H
ispanic
s: 5
.5,
Whites
: 1.0
(M
ass
DoE,
2003)
IND
IAN
A
Yea
rsIn
-sch
ool
susp
ensi
ons
Out-
of-
school
susp
ensi
ons
Exc
lusi
ons
Note
s or
dat
a s
ourc
es
1996-9
7
158.0
143.0
9.5
Ree
d (
1999)
1998-9
9
NR
NR
9.2
Ree
d (
2002)
1999-0
0
168.0
130.0
7.4
Ree
d (
2002)
2000-0
1
161.0
129.0
6.2
Ree
d (
2002)
2001-0
2
177.0
135.0
6.2
Ree
d (
2004)
2002-0
3
179.0
141.0
prim
ary:
50.6
, ju
nio
r hig
h:
239.5
, se
nio
r hig
h:
214.0
Bla
cks:
404.7
, H
ispan
ics:
187.7
, W
hites
: 101.1
5.9
prim
ary:
0.2
,
junio
r hig
h:
8.3
, se
nio
r hig
h:
12.9
Bla
cks:
11.7
, H
ispanic
s: 7
.4,
Whites
: 5.0
Ree
d (
2004)
Rau
sch &
Ski
ba
(2004)
2003-0
4
294.0
6.7
only
aggre
gate
dat
a pro
vided
(Ree
d,
2005)
Note
:a
Dat
a pre
sente
d in t
his
tab
le r
eport
on t
he
num
ber
of
dis
ciplin
ary
sanct
ions
impose
d.
Rat
es a
re r
eport
ed a
s th
e num
ber
of
sanct
ions
per
1,0
00 s
tuden
ts;
thus
they
ref
lect
a d
uplic
ated
count
of
inci
den
ts w
hen
stu
den
ts r
ecei
ved m
ore
than
one
sanct
ion in a
giv
en p
erio
d o
f tim
e.
Although t
his
met
hod o
f re
port
ing lim
its
the
concl
usi
ons
that
can
be
dra
wn,
it is
routinel
y use
d in b
oth
off
icia
l re
port
s an
d t
he
rese
arch
liter
ature
, an
d it
pro
vides
com
par
able
indic
es o
f th
e am
ount
of
dis
ciplin
ary
sanct
ions
occ
urr
ing w
ithin
a g
iven
popula
tion.
Inci
den
t ra
tes
are
calc
ula
ted b
y div
idin
g t
he
tota
l num
ber
of
sanct
ions
impose
d in a
stu
den
t popula
tion
with t
hat
popula
tion’s
stu
den
t en
rolm
ent,
then
multip
lyin
g b
y 1,0
00.

26
Tabl
e 1.
2. R
ates
per
1,0
00 o
f dis
cipl
inar
y sa
nctio
ns re
porte
d in
Aus
tralia
n st
ates
a
NEW
SO
UTH
WA
LES
Yea
rShort
susp
ensi
ons
Long
susp
ensi
ons
(ove
r 5 d
ays)
Exc
lusi
ons
Note
s on o
verr
epre
senta
tion o
r dat
a so
urc
es
1993
21.6
2.3
0.3
1994
28.8
4.4
0.3
Tay
lor
(1995);
all
types
of
sanct
ions
incr
ease
d b
y 27%
bet
wee
n 1
993
and 1
994
2005
NR
15.0
0.5
(N
SW
DoE,
2006)
VIC
TO
RIA
1987
27.8
NR
Dat
a fr
om
sec
ondar
y sc
hools
only
(Edw
ards,
1996)
1991
68.2
N
RD
ata
from
sec
ondar
y sc
hools
only
(Edw
ards,
1996)
2000-0
256.6
3 t
ypes
of
dis
ciplin
ary
sanct
ions
(Vass
allo
et
al.,
2002)
2000-0
2
NR
NR
0.6
(p
er y
ear)
Exc
lusi
ons
only
(Rin
dflei
sch,
2003)
SO
UTH
AU
STR
ALIA
1993
(Tay
lor,
1995)
8.2
(T
erm
3,
1993 o
nly
) 1.2
(T
erm
3,
1993 o
nly
)1994
(Tay
lor,
1995)
12.4
(T
erm
3,
1994 o
nly
) N
R
1998
(Llo
yd,
2000)
20.2
NR
Roth
man (
1999):
Indig
enous
and low
SES s
tuden
ts o
verr
epre
senta
tion in
abse
nce
s fr
om
sch
ool due
to d
isci
plin
ary
sanct
ions:
1997:
In
dig
enous
3.1
%,
non-I
ndig
enous
1.9
%
low
SES s
tuden
ts 2
.6%
, m
iddle
to h
igh S
ES 1
.5%
1998:
In
dig
enous
3.6
%,
non-I
ndig
enous
1.7
%
low
SES s
tuden
ts 2
.6%
, m
iddle
to h
igh S
ES 1
.4%
1999:
In
dig
enous
2.7
%,
non-I
ndig
enous
2.2
%
low
SES s
tuden
ts 2
.9%
, m
iddle
to h
igh S
ES 1
.8%
1999
23.7
NR
Est
imat
ed u
sing s
ame
enro
lmen
t figure
as
1998 (
Lloyd
, 2000)
2001
20.0
N
RSugges
ts 2
0%
incr
ease
com
par
ed t
o 2
000 (
Colm
an &
Colm
an,
2002)
TA
SM
AN
IASusp
ensi
ons
up
to 2
wee
ks
Susp
ensi
ons
ove
r 2 w
eeks
Exc
lusi
ons
1996
38.3
N
R0.1
5
Tas
DoE (
2002)
1997
47.8
1.4
N
RTas
DoE (
2002)
1998
48.9
boys
: 75.0
,
girls
: 22.0
1.1
0.1
3
Tas
DoE (
1999)

27
TA
SM
AN
IA c
on
t’d
Yea
rSusp
ensi
ons
up
to 2
wee
ks
Susp
ensi
ons
ove
r 2 w
eeks
Exc
lusi
ons
Note
s an
d d
ata
sourc
es
1999
56.6
1.3
0.0
14
Tas
DoE (
2002)
2000
56.2
1.4
0.0
7
Tas
DoE (
2002)
2001
66.4
boys
: 101.5
,
girls
: 31.5
prim
ary:
17.8
, ju
nio
r hig
h:
220.4
, se
nio
r hig
h:
11.9
1.2
prim
ary:
0.2
,
junio
r hig
h:
4.3
, se
nio
r hig
h:
0.2
0.0
6
(all
boys
)
�Ave
rage
of
1.9
susp
ensi
ons
per
stu
den
t (T
as
DoE,
2002)
2004
93.2
boys
: 139.0
,
girls
: 46.0
prim
ary:
39.9
, ju
nio
r hig
h:
239.4
, se
nio
r hig
h:
20.2
Ave
rage
length
: boys
: 7.1
day
s,
girls
: 5.7
day
s
1.2
boys
: 2.0
,
girls
: 0.4
4
prim
ary:
0.5
,
junio
r hig
h:
3.5
, se
nio
r hig
h:
0.0
None
�Ave
rage
of
2 s
usp
ensi
ons
per
stu
den
t �
Indig
enous
ove
rrep
rese
nta
tion in s
usp
ensi
on:
257 p
er 1
,000
Indig
enous
studen
ts,
but
80 p
er 1
,000 n
on-I
ndig
enous
studen
ts
�H
igher
rat
e of
susp
ensi
on in low
SES s
chools
(T
as
DoE,
2005)
WES
TER
N A
US
TR
ALIA
Yea
rSusp
ensi
ons
Exc
lusi
ons
1999
40.0
N
RW
A D
oE (
2003)
2000
40.0
N
RW
A D
oE (
2003)
2001
38.0
N
RW
A D
oE (
2003)
2002
37.0
0.2
0
WA D
oE (
2003)
2003
49.6
0.1
2
WA D
oE (
2004)
2004
53.7
0.0
9
WA D
oE (
2005)

28
QU
EEN
SLA
ND
Short
susp
ensi
ons
(up t
o 5
day
s Lo
ng s
usp
ensi
ons
(6-2
0 d
ays)
Exc
lusi
ons b
Note
s an
d d
ata
sourc
es
1996-9
7
Tay
lor
(1995):
16%
incr
ease
in t
he
num
ber
of
sanct
ions
bet
wee
n 1
996
and 1
997
1997
36.3
1.3
8
2.9
O
vera
ll ra
te S
DAs
40.5
(Tem
ple
ton,
1999)
1998
38.7
2.2
3.4
O
vera
ll ra
te S
DAs
44.4
[boys
: 34.8
, girls
: 9.5
; In
dig
enous:
50.3
, non-
Indig
enous:
20.5
] (C
ouri
er M
ail, 1
999)
2002-0
3
64.5
5.5
3.4
Est
imat
e fo
r th
e ye
ar u
sing d
ata
from
3 t
erm
s (Q
ld D
oE,
2004)
2003-0
4
71.4
6.6
3.3
Q
ld D
oE (
2005)
2004-0
5
73.3
6.5
3.1
Q
ld D
oE (
2006)
Note
s:a
Dat
a pre
sente
d in t
his
tab
le r
eport
on t
he
num
ber
of
dis
ciplin
ary
sanct
ions
impose
d.
Rat
es a
re r
eport
ed a
s th
e num
ber
of
sanct
ions
per
1,0
00 s
tuden
ts;
thus
they
ref
lect
a d
uplic
ated
count
of
inci
den
ts w
hen
stu
den
ts r
ecei
ved m
ore
than
one
sanct
ion in a
giv
en p
erio
d o
f tim
e.
Although t
his
met
hod o
f re
port
ing lim
its
the
concl
usi
ons
that
can
be
dra
wn,
it is
routinel
y use
d in b
oth
off
icia
l re
port
s an
d t
he
rese
arch
liter
ature
, an
d it
pro
vides
com
par
able
indic
es o
f th
e am
ount
of
dis
ciplin
ary
sanct
ions
occ
urr
ing w
ithin
a g
iven
popula
tion.
Inci
den
t ra
tes
are
calc
ula
ted b
y div
idin
g t
he
tota
l num
ber
of
sanct
ions
impose
d in a
popula
tion w
ith t
hat
popula
tion’s
stu
den
t en
rolm
ent,
then
multip
lyin
g b
y 1,0
00.
b I
ncl
udes
can
cella
tion o
f en
rolm
ent,
an e
uphem
ism
for
excl
usi
on d
uri
ng t
he
post
-com
puls
ory
sch
ool ye
ars.

29
The overall pattern in most jurisdictions during the last ten years shows a slight
reduction in the rates of official permanent exclusions, but a steady increase in the rates
of official suspensions. Given that suspensions, in any school year, constitute the bulk
of disciplinary absences, this pattern indicates that a growing number of students in the
English-speaking Western world are subjected to official educational exclusion. Across
the jurisdictions that I examined, Queensland appears to have one of the most
exclusionary school systems. Apart from the state of Indiana (USA), which, according
to Skiba et al. (2003), registers the highest rates of suspensions and exclusions in the
USA, and the state of Tasmania (Australia), Queensland has the highest rates of school
suspensions. For rates of permanent exclusions, only Indiana surpasses Queensland.
While Tasmania has higher rates of suspensions than Queensland, it has the lowest rates
of permanent exclusions across all the jurisdictions.
Comparisons over the years and across jurisdictions are difficult because data are not
consistently reported or they are sometimes about the number of suspensions and/or
exclusions and sometimes about the number of students who are subjected to
suspensions and/or exclusions. Due to many ambiguities in the reports about the
periods covered (a term, a semester, a whole year), the type of sanctions mentioned
(suspensions, exclusions, or both), the rates considered (number of incidents versus
number of students), and the school levels included (primary, secondary, or both),
sometimes the trends suggested from one year to the next are not consistent between
reports. However, across several years, the figures presented in Tables 1.1 and 1.2
show: (a) a general rise in the rates of school suspensions, and (b) the high position of

30
Queensland for rates of suspensions and permanent exclusions in comparison to other
jurisdictions.
C. The Dark Figure
Official educational exclusions are likely to be a gross underestimate of the problem.
Stirling (1993) estimates that only 10% of the total number of UK exclusions are
officially recorded. The causes of this underestimation are documented by several
authors (Blyth & Milner, 1996; Davies, 1998; Gewirtz, Ball, & Bowe, 1995; Hayden &
Ward, 1996; Smith, 1998; Stirling, 1992; Vulliamy & Webb, 2000). Mechanisms
involve more or less coerced arrangements with parents of a “cooling off period” and
the “massaging of figures” (Vulliamy & Webb, 2001, pp. 361-7) in order to preserve a
school’s image in a climate of interschool competition, which is fuelled by the “quasi-
marketisation” (Le Grand & Bartlett, 1993, p. 1) of education. Another mechanism,
which contributes to this underestimation, is the use of placement in withdrawal units,
because in one context a student may be formally removed from the school without any
official exclusion taking place, and in another context a permanent exclusion may be
required to trigger a placement (Vulliamy & Webb, 2000). Edwards (1996) indicates
that unofficial suspensions and exclusions through processes similar to those reported in
the British literature, such as cooling off periods and being “eased out” (e.g., remove
your child or s/he will be formally excluded), are also occurring in Australia.

31
IV - THE COST OF SCHOOL EXCLUSION
A few researchers in England and Wales (Bagley & Pritchard, 1998; Parsons, 1996;
Pritchard & Cox, 1998) have attempted to estimate the educational and financial costs
of these growing exclusionary trends. Their findings suggest that the social and
financial costs of school exclusion are high and spread over several systems (Bagley &
Pritchard, 1998; Parsons & Castle, 1998). Their evaluations describe a seriously
reduced educational provision, in terms of both quality and quantity, accompanied by
higher financial costs. Parsons and Castle (1998, pp. 277-93) estimate that the
additional cost associated with the 1996/97 official permanent school exclusions of
students of compulsory age in England was around £34 millions. Replacement teaching
(i.e., home tuition and Pupil Referral Units) accounts for 66% of this additional cost,
administration (including appeals) for 17%, and extra support (e.g., educational
psychologists) for another 17%.
V - WHO IS EXCLUDED?
A. Gender, Class, and Race Nexus
The literature from England and Wales, the USA, and the few studies in Australia point
to a strong gender, class, and race nexus of overrepresentation. Boys, socially
disadvantaged students, students with special educational needs, those caught up in
family breakdowns, and students from racial and ethnic minorities are most frequently
excluded (e.g., Blyth & Milner, 1996; Bourne, Bridges, & Searle, 1994; Gillborn, 1999;
Hayden, 2002; Hayden & Ward, 1996; Osler, 1997; Parsons & Castle, 1998; Taylor,

32
1995; Townsend, 2000; Vickers, 1993; Wright et al., 1998). Rates of suspensions and
exclusions in Queensland state schools during 1998 were 34.75 per 1,000 boys,
compared to 9.5 per 1,000 girls, and 50.25 per 1,000 Aboriginal students compared to
20.5 per 1,000 non-Aboriginal students. Howard (2004) reports that, in Western
Australia, Aboriginal students are four times more likely to be excluded than non-
Aboriginal students.
B. EBD: School Exclusion Connections and Controversies
The concept of emotional and behavioural disorders (EBD), their aetiology, and the
discourses around the topic have led to passionate debates among educators in the
special education system (e.g., Kauffman & Hallahan, 1995) and educators in the
inclusive education movement (e.g., Slee, 1995b). More or less well defined
developmental problems such as Conduct Disorder (CD), Oppositional Defiant Disorder
(ODD), and Attention Deficit Hyperactivity Disorder (ADHD) are at the centre of many
controversies. The questions raised in these debates are whether the increasing number
of children diagnosed with such problems (and subsequently removed from regular
schools) actually reflects child pathology or school pathology, or both. In any case,
most children “at risk” in Western school systems, whether diagnosed or not as EBD,
either do not attract extra support from family and school services or attract such
support only when their problems become very troublesome to schools and wider
communities. Their problems, however, rarely trigger an examination of school
processes.

33
C. Children in Care and School Exclusion
Current exclusionary practices are most disadvantageous to students who need the most
help (Howard, 2004). A recent study from Australia suggests that a disproportionate
number of excluded children are involved with social services and welfare agencies,
have family members suffering from psychiatric problems, or both (Howard, 2004).5
Many children placed in care are particularly at risk of school exclusion (Hayden, 2002;
Howard, 2004). In the UK, the Department of Health’s (1997) Social Services
Inspectorate reveals that 75% of these individuals end up with no academic
qualifications, and represent 38% of juvenile and 23% of adult prisoners.
VI - REASONS FOR EXCLUSION
Physical aggression, generally toward other students and occasionally toward staff, is
often invoked as an official reason to suspend and exclude students. However, it does
not represent the majority of cited reasons (Donovan & Kenway, 1998; Hallam &
Castle, 2001; OFSTED, 1996). In the USA, Morrison et al. (2001) remark that
suspensions are generally applied for relatively “minor offences such as tardiness,
absenteeism, physical conflict between students, disobedience, general disruption and
defiance” (p. 276). Data from South Australia indicate that between two-thirds and
three-quarters of suspensions and exclusions are for non-violent behaviours such as
threat to good order,6 interference with learning, illegal acts, and inattention and
5 The study did not provide exact figures. 6 As pointed out by Taylor (1995) the definitions of the grounds for suspension and exclusion can be confusing. The Education Act 1972 and Regulations in South Australia stipulates in r124B(1) “(a) the student has threatened or perpetrated violence; or (b) the student has acted in a manner that threatens the good order of the school or the safety or well being of a student or member of staff of the school; or (c) the student has interfered with the ability of a teacher to instruct students or of a student to benefit from

34
indifference (Taylor, 1995). Templeton (1998) reports 26,000 instances of SDAs
during terms 1, 2, and 3 of 1998 in Queensland state schools. Refusal to obey school
rules and being disruptive in class account for 44% of the SDAs; verbal harassment,
violence or assault against students, and smoking cigarettes represent 27% of the SDAs
total volume.7 The grounds for 29% of SDAs are not provided. Recent figures
obtained from Education Queensland show that “physical misconduct” represents 30%
of the reasons invoked to suspend and exclude students (Table 1.3).
Physical aggression seems to be more often invoked to suspend and exclude primary
school students. For example, in England and Wales, Parsons et al. (1994) notice that
aggression and violence are commonly reported as the reasons for exclusion from
primary schools. In 1997, the Queensland Principal Education Officer for Behaviour
Management indicated that assault was more common among primary school students
and verbal abuse more prevalent in secondary schools as a ground for suspensions and
exclusions (Metcalf, 1997). Across 1997 and 1998, the number of SDAs for physical
harassment or violence against other students or teachers reached 5,800, that is, 16% of
the total number of SDAs across all primary and secondary grades in Queensland state
schools. This figure includes 1,780 SDAs for physical aggression in primary grades,
which represents 31% of the total volume of SDA in Queensland state primary schools
(Templeton, 1999).
that instruction; or (d) the student shows persistent and wilful inattention or indifference to school work; or (e) the student has acted illegally.” 7 Given that verbal harassment and smoking cigarettes are included in this category, the proportion of SDAs for physical aggression is less than 27%.

35
Table 1.3. Reasons for Student Disciplinary Absences (SDAs) in Queensland state
schools, July 2004 - June 2005 (from Queensland Department of Education and the
Arts, 2006, p. 114)
VII - UNFAIR PRACTICES
Researchers in the UK and the USA cast doubt on the fairness of exclusionary processes
and procedures. In the UK, Garner (1994) reports that “due process is not followed” (p.
4). In the USA, Morrison et al. (2001, p. 282) note that the majority of “first time
offenders” are suspended for “aggressive behaviours,” but that students with a previous
history of discipline have higher rates of suspensions for “attitude problems.” Morrison

36
et al. (1997) also note that students who have previous discipline problems are
increasingly under the gaze of school administrators, making it easier to catch these
students in future transgressions. Morrison et al. (2001) point to the arbitrariness of the
process. An examination of the nature of “suspendable” offences shows that school
administrators differentially apply the suspension depending on the student’s previous
history of misbehaviour.
Although research on educational exclusion in Australia is sparse, the few authors who
have examined the policies and their implementation give credence to claims by
excluded students that the practices are generally unfair (Edwards, 1996; Hearle, 1994;
Mackie, 1994; Taylor, 1995). In his study of suspended students in the Australian state
of Victoria, Edwards (1996) reports labelling processes similar to those identified by US
researchers. According to Taylor (1995), exclusion of students from school disrupts or
terminates their right to education as stated in Article 28 of the Convention of the Rights
of the Child. Overall, Taylor (1995) finds that the policies are sometimes “unclear,
inconsistent, ambiguous, archaic, biased and often fail to observe the principle of
natural justice” (p. 8). Mackie (1994) argues that the methods used in Queensland to
suspend and exclude students from school are “grossly unfair and that these procedures
are either sanctioned or ignored by the Education Department” (p. 10).

37
VIII - SITES OF EXCLUSION
A. Secondary Schools
Secondary schooling is the time during which the largest number of students is
excluded. In Australia, Slee (1992) reports a major change in the pattern of suspensions
in public schools when students transfer from primary to secondary schools (from 1.9%
of the total volume of suspensions across all school grades during the last year of
primary to 15.5% during the first year of secondary). Templeton (1998) reports data
that suggest that out of 26,000 instances of SDAs in Queensland schools during terms 1,
2, and 3 in 1998, only about 5,000 (19%) occurred in primary school Grades 1 to 6.8 In
England, 80% of suspensions and exclusions are from secondary schools and over 45%
of all permanent exclusions are from Grades 10 and 11. However, primary school
exclusions are growing (Hayden, 2002; Hayden & Ward, 1996; Parsons, 1996).
B. Primary Schools
Little attention has been paid to primary school exclusions. The few studies of
exclusion from primary schools and placement in alternative provisions are from
England and Wales (Gersch & Nolan, 1994; Hayden, 1997; Hayden, Sheppard, &
Ward, 1996; Hayden & Ward, 1996; Marks, 1995; Parsons et al. 1994). Howard (2004)
reports that, in the UK, exclusion in the primary school years leads to negative
consequences in the secondary school years such as truancy and further School
Disciplinary Absences. Primary school years determine the likelihood of a student
completing high school: “If a student in Year 3 or 4 misses at least 20% of their school
8 I had to tease out these figures from a report that only stipulated: “almost 26,000 official Enforced Behavioural Absences … almost 16,800 occurred for students in Years 8-10 … over 80% for students in Years 7-11.” Note that Year 7 is the last grade in primary school in Queensland.

38
year, it is a strong indicator that they won’t stay on to finish Year 12” (Vickers, 2003, p.
1). Gersch and Nolan (1994) interviewed six children attending a withdrawal unit after
their exclusion from secondary schools. To get some insight into the children’s early
experience with schooling, they asked them to talk about their previous experiences in
primary schools. Negative experiences during their primary years included difficulties
with their schoolwork and their behaviour, difficulties with teacher and peer
relationships, significant problems in the family, and frequent change of primary
school.9 Hayden (1997) lists three overlapping sets of common variables about the
characteristics and circumstances of excluded primary age children, their families, and
their schools (Table 1.4). Because these variables are situated at the three levels of
analysis (individual, institutional, and societal) considered in my thesis, and refer to
primary school children, I draw from them to select and code my data on the socio-
educational profiles of The Haven’s students (Chapter 5).
In Australia, the House of Representatives Standing Committee on Employment,
Education, and Training (1996) suggests that primary school students who are at
disproportionate risk of exclusion tend to be male, Indigenous, from low socio-
economic or unstable family backgrounds (or both), resident in government care
facilities, or exhibit low achievement in numeracy and literacy. The only Australian
study on primary school exclusion (Howard, 2004) was conducted in South-East
Queensland and investigated the beliefs of primary school educators. Primary school
educators are more likely to agree with the use of suspensions and exclusions if they
simultaneously express the belief that they lack alternatives and support.
9 These students also had some positive experience in the withdrawal unit as described in section IX-D below.

39
Table 1.4. Characteristics of children excluded from English primary schools (from
Hayden, 1997)
IX - ALTERNATIVE PLACEMENT SITES
Alternative placement is a special form of school exclusionary practices, which may or
may not follow an official exclusion. Most research on alternative placement sites has
been carried out in the UK. Slee (1999, p. 33) describes the Pupils Referral Units
(PRUs) in the UK as a place, usually off the school campus, where “difficult” students
are referred “to attend an alternative education program, in smaller, more intensive
groups.” The focus of the curriculum is on “training students in basic academic and
social skills” (emphasis added).

40
Almost 20 different official names have been used in relation to such units in the UK
(Mongon, 1988). The variety of appellations (e.g., “adjustment unit,” “guidance
centre,” “opportunity group,” “sanctuary”) complicates the estimation of the number of
students referred every year to these alternative educational provisions. Adding to the
confusion, Mongon (1988, p. 183) documents the lack of clarity about the behaviours
with which these units are dealing. The most frequent labels are “aggressive, asocial,
autistic, behaviour problem, character disorder, delinquent, deviant, disaffected,
disruptive, disturbed, maladjusted, neurotic, personality disorder, sociopathic, and
unsocialised.”
A. Alternative Placements: Volume and Trends
Statistics on the number of withdrawal units and the number of students transiting
through them each year are even less accessible to public scrutiny than information
about the volume and trends in suspensions and exclusions (Mongon, 1988). However,
researchers from the UK estimate that the placement of students in withdrawal units has
greatly increased since the end of the 1960s. Newell (1980) calls such units “sin bins”
(p. 8). He associates the growth of withdrawal units with a 638% increase in the
number of students considered “maladjusted” from 1960 to 1976 in the UK, in a school
population that had increased by no more than 35% during the same period. Solomon
and Roger (2001, p. 332) drawing on Lloyd-Smith (1984) suggest that the rapid growth
of special units in the UK was spawned, in part, out of concern for pupils excluded from
mainstream education, and, in part, by the belief that mainstream schools were

41
“handicapped in their function of advancing economic development (emphasis added)
by the presence of pupils who were disturbing in their behaviour.”
In Australia, teachers’ unions appear to frequently call for the creation of such
withdrawal units, and recently eleven new “positive learning centres” have been open in
Queensland (personal communication with an education district senior officer, March
2006). The creation of new alternative provisions in Queensland seems to confirm the
growing trends estimated by UK researchers in the 1980s.
B. Who is Referred to Alternative Placements?
The gender, class, and race nexus, documented in studies of official suspensions and
exclusions, is evident in British and American studies of alternative placement.
Research from the UK shows that boys are more likely to transit through the “sin bins”
than girls (Powis et al., 1998; Solomon & Rogers, 2001), particularly if they come from
the lower class or belong to an ethnic minority (Artiles & Trent, 1994; Brantlinger,
1993, 1994; Harry, 1992, 1994; Powis et al., 1998; Robertson et al., 1994; Utley,
Haywood, & Masters, 1991). In the USA, McIntyre (1996) and Webb-Johnson (1999)
report similar findings.
C. The Problems with Alternative Placements
In the research from the UK into the problems associated with alternative placement
(Drew, 1990; Mongon, 1988; Newell, 1980; Slee, 1999), the picture painted by
researchers is grim. First, regular schools referring students to withdrawal units
generally expect improvement in a relatively short period of time and a smooth return to

42
the mainstream system. Most of the returning students, however, re-engage in the
problem behaviour that initiated the original referral. Slee (1999) finds no evidence that
the general level of disruption diminishes in schools that refer students to withdrawal
units. As disruptive students are removed, others are found disruptive. To Slee, this
suggests school rather than student pathology.
Second, exit from mainstream schools is far easier than re-entry into mainstream
schools. Mongon (1988) remarks that withdrawal units are not designed to serve the
needs of students who are referred to them, but to provide respite for mainstream
schools. Mainstream schools that refer students to withdrawal units are often reticent to
have these students back. Moreover, some students do not wish to return to mainstream
schools where they have experienced failure and ostracism (Gersch & Nolan, 1994).
Third, the academic provision in alternative placements is generally poor and costly.
After visiting the new Pupil Referral Units (PRU) of the UK, Garner (1996) concludes
that, there is “[n]o new wine…only old bottles,” which amounts to “a well-meaning but
hopelessly inadequate response to the needs of these children” (p. 194). Solomon and
Rogers (2001) conclude from interviews with students and their teachers in a PRU that
difficulties with the curriculum often lead to student alienation and disruptive
behaviour, but that regular classrooms are the most appropriate setting in which to
improve low self-efficacy in specific curriculum areas such as literacy and numeracy.
Fourth, concern over stigmatisation and labelling is often highlighted in the literature
(Garner, 1996; Jahnukainen, 1999; Rustemier, 2004). Garner (1996) reports feelings of

43
despondency and a fear of being labelled by staff and peers in the receiving schools, an
apprehension that is shared by both teachers and secondary students in the pupil referral
units. Rustemier (2004) provides educational and social-psychological evidence of the
damage caused by segregation into withdrawal units and the link with stigma,
stereotyping, prejudice, and discrimination. The absence of Australian research on the
course and effects of alternative educational provisions is a deficiency that my thesis
attempts to remedy.
D. Students’ Feelings about Alternative Placements
Students’ experience and views about alternative placements do not always support the
bleak portrayal suggested by the literature that focuses on post-alternative placement
outcomes. Gersch and Nolan (1994) interviewed six excluded pupils to get their views
on alternative placements and anticipated reintegration into the mainstream. These
secondary students (four males and two females) emphasise the positive relationships
with special teachers, their liking for the small group sessions, the special setting’s
greater acceptance of family involvement, and the sentiment that they have gained a
better understanding of their own feelings and the feelings of others. Some students
wish they had been referred earlier, and others do not want to leave the special setting.
By contrast the reintegration process is associated with uncertainty and anxieties. They
are looking forward to the new school; however, they worry about how they will be
received by other pupils. A minority also worry about the new teachers. They want a
new start (a new school), and they prefer a part-time approach to settling into the new
school. Assistance from both the special provision teacher and the teacher from the new

44
school are important to them. For example, they want the special teachers to visit the
new school.
Laslett (1982) in England, and Jahnukainen (2000) in Finland, conducted small
retrospective studies of students’ recollection of their experience in alternative settings.
These studies also highlight some constructive features such as feeling positive about
their relationship with the special teacher and their experiences in a small teaching
group. Although rarely studied, students’ stories about their experience in alternative
placements are not overly negative. However, the experience of being excluded and the
experience of excluded students in relation to the dynamics of regular schools, as
reported in the literature, are mostly negative.
X - THE EXPERIENCE OF EXCLUSION
When judged in terms of deterrent or redemptive power on individual students,
suspensions and exclusions are clearly ineffective (Dettman, 1972; Hyde & Robson,
1984; Sugai & Horner, 1999). It is suggested that over-usage of suspensions makes the
problem worse and leads to greater levels of disruption (Wu et al., 1982), hardening of
social sensitivity on the part of the student (Morrison et al., 2001), and anger and feeling
of unfairness rather than remorse about the transgression (Costenbader & Markson,
1994). In relation to excluded students, Hayden & Ward (1996, p. 261) also report (a)
feelings of anger, sadness, and unfairness, (b) bitterness about their neglected needs, (c)
boredom before and during the exclusion, (d) fear of “getting behind,” (e) despondency
for those who have experienced multiple SDAs, and (f) the general ineffectiveness of

45
suspensions and exclusions as “most experience further disruption to their schooling
following other exclusions.” In the Australian state of Victoria, Edwards (1996) finds
that once suspended, students are more likely to be suspended again.
XI - EXCLUSIONARY PRACTICES: THE CRIMINAL CONNECTION
A. Evidence from the UK
The upward trend in educational exclusion is a concern. An additional concern,
bridging education and criminology, is the growing number of reports associating such
practices with concurrent and future involvement in criminal activities. A strong
association between school exclusionary practices and engagement in criminalised
behaviours has been detected in a series of British empirical studies (Berridge et al.,
2001; Devlin, 1995; Farrington, 1995, 1996; Garner, 1994; Gilbertson, 1998; Graham &
Bowling, 1995; Kinder et al., 1999; Powis et al., 1998; Pritchard & Cox, 1998; Social
Exclusion Unit, 1998; Sussman et al., 1995). For example, Pritchard and Cox (1998)
show that, by the time they were, on average, aged 19.5 years, 63% of those
permanently excluded from school had a criminal conviction after leaving the
“Educational Behaviourally Disturbed Unit” (EBDU) where they had been placed; 36%
had convictions for violent offences, and 29% had served time in prison. Vulliamy and
Webb (2001) point to the “strong link between exclusion from school and subsequent
offending” and to the finding that “a relatively high proportion of the prison population
in this country [UK] has experienced school exclusion” (p. 357). In a retrospective
study that examines the trajectory of 343 students excluded from school between 1988
and 1998, Berridge et al. (2001), using official records from schools and the criminal

46
justice system, show that 65% of these young people had been cautioned or convicted of
a criminal offence when they were between 14 and 24 years old.
B. Evidence from the USA
In the USA, an early study by Chobot and Garibaldi (1982) suggests that suspensions
and exclusions increase daytime juvenile delinquency. Perske (1991) associates
removal from mainstream schooling and placement in alternative provisions with a
greater likelihood of incarceration in adulthood. Skiba and Peterson (2000) show that
suspensions accelerate the course of delinquency, and Skiba et al. (2003) claim that,
“consistent removal” from school is “a pipeline to prison” (p. 1).
C. Evidence from Australia
In Australia, Bodna (1987) notes the consistently high correlation between attendance at
a special school and eventual incarceration. Similar findings are reported by the NSW
Legislative Council (NSW LCSCSI, 1992). The Western Australia Legislative
Assembly (WALA, 1992) has received considerable evidence on the correlations
between academic failure, truancy, dropping out of school, and offending. Specifically,
“over 80% of children of compulsory school age who appeared in court on five or more
occasions had not been in school for a year” (WALA, 1992, p. 11). O’Halloran (1999)
observes that a high number of inmates in the NSW Long Bay Correctional Centre have
been excluded from school.10 Children in care are not only more likely to be excluded
from school (Howard, 2004) and to be early school leavers (ABC TV, 2004), but they
are also very likely to end up in the criminal justice system (Lynch, Buckman, &
10 The study did not provide exact figures.

47
Krenske, 2003). Polk and White (1999) point to the possibility that school variables
may play an important role in shaping the relationship between unemployment and
crime in Australia. Chapman et al. (2002) report that high school completion reduces
the risk of engagement in criminal activity, whereas unsuccessful senior high school
participation increases this risk.
XII - ZERO DE CONDUITE:11
ZERO TOLERANCE EXPERIMENTS IN SCHOOL SYSTEMS
Finally, pop criminological parlance has now entered the educational domain. The
concept of “zero tolerance,” sometimes attributed to American criminologist James Q.
Wilson (1982) and sometimes to NYPD Commissioner William Bratton (1998),12 has
been unreservedly adopted in a number of school systems, including Queensland.
For instance, on the 25th of February 2004, following release through FOI legislation of
some SDA data by Education Queensland, the Courier Mail published a front-page
article titled “Schools step up discipline:”
State schools are adopting “zero tolerance” of misconduct, suspending or expelling about 170 students across Queensland each day. The schools are cracking down on violence, vandalism, drug use, misbehaviour and absenteeism, according to figures released under Freedom of Information laws. Education Minister Anna Bligh confirmed that many school communities had set zero-tolerance policies to counter problems. “Bad behaviour will not be tolerated in our schools,” Ms Bligh said yesterday. “I make no apology for schools setting high standards of behaviour for students nor their willingness to enforce those standards.” Queensland Teachers Union president Julie-Ann McCullough said some schools needed more help in handling bad behaviour. “For some time we have been calling for more support in schools,” she said.
11 Zero de conduite (1930) is a movie directed by non-conformist director Jean Vigo. In this movie, presented as a microcosm of larger society, Jean Vigo tells the ordinary story of regimented pupils, their dictatorial teachers, and the development of a liberating spirit of insurrection amongst the overcontrolled student population. 12 Several authors (e.g., Cunneen, 1999; Pollard, 1998; Young, 1999) attribute the concept of zero tolerance policing to James Q. Wilson and George L. Kelling. It is not clear who actually coined the term zero tolerance. In their much-cited paper Broken Windows: The Police And Neighborhood Safety (1982), Wilson and Kelling do not use the term zero tolerance.

48
The president of the Queensland Secondary Principals Association also stated: “most
students do learn from the experience and go on to continue their schooling.” However,
Hemphill, Toumbourou, and Catalano (2005) in a large longitudinal study in the
Australian state of Victoria show that suspensions increase antisocial behaviours
measured a year later and after controlling for the level of antisocial behaviours prior to
the suspensions. Furthermore, in many jurisdictions, the suspension data that I report in
Tables 1.1 and 1.2, and the literature in general, indicate that most students do not learn
from the experience, as many of them are suspended at least twice during the same year.
In fact, Skiba et al. (2003) in the USA show that zero-tolerance school policies are
ineffective, and “a pipeline to prison” (p. 1):
Examination of national databases indicated a strong relationship between state rates of out-of-school suspensions and juvenile incarceration, as well as a correlation between racial disparities in school discipline and juvenile incarceration. In addition, rates of school suspension were found to be negatively associated with academic achievement scores. The correlational results preclude strong statements about direction of causality; nevertheless, like most research on zero tolerance, these findings provide no evidence that disciplinary removal in any way contributes to safer or more productive learning environments (p. 4).
XIII - CONCLUSION AND RESEARCH QUESTIONS
Educational exclusion is associated with a greater likelihood of engagement in
criminalised behaviours. Recent school policies such as zero tolerance may increase
this probability. There is evidence from the UK, the USA, and Australia that
educational exclusions have been steadily growing in the last 20 years. However, the
available data on these trends, on the characteristics of the schools and the students
involved in these practices, and on the processes and dynamics associated with these
practices are scarce, particularly in Australia.

49
Relatively little is known about the contexts and outcomes of educational exclusion.
Apart from a few studies in England and Wales and one in Finland involving small
samples and short-term follow ups (Daniels et al., 2003; Jahnukainen, 1999, 2000,
2001; Laslett, 1982; Parsons et al., 2001; York, Heron, & Wolff, 1972), no research has
been done about the journeys of the excluded. The one exception is the study by
Berridge et al. (2001) in the UK. Their research examines the socio-educational
profiles, contexts, and journeys of 343 excluded students, including the link between
school exclusion and offending. Their method (i.e., archival analysis) is similar to the
method I use in my study. Their findings therefore provide key elements to compare
with the results of my investigation.
Documenting and analysing the life course of excluded students is the main object of
my thesis. My aim is to explain the relatively recent and growing phenomenon of
educational exclusion from one of the most inclusive institutions in the Western world
since compulsory schooling was adopted near the end of the 19th century. I examine if
this new phenomenon is related to other forms of exclusion, particularly crime and
criminalisation, and, if so, in which ways. My study reconstructs the life course of 300
students who were referred to a withdrawal unit (“The Haven”) after being removed
from their primary schools between 1973 and 2003. I ask four questions: Where did
they come from? What happened to them? Who were they? Where did they end up?
The question “where did they come from?” is an enquiry about students’ socio-
economic, familial, and educational situation prior to their removal from mainstream
school and placement at The Haven. It includes the characteristics of the schools that

50
excluded them, the reasons invoked for excluding them, and the contexts and processes
associated with their exclusion. The question “what happened to them?” is an enquiry
about their experience of the familial and school environments, including disciplinary
control, and support in these two institutions. It also investigates what occurred during
their transit through The Haven.
“Who were they?” is an enquiry about their psychosocial, health, cognitive, and
academic profiles when they were removed from mainstream primary schools and
referred to The Haven. “Where did they end up?” is an enquiry about their situation
following their exit from The Haven. It investigates their socio-educational journeys,
including their contact with the police and criminal justice system, and tries to discover
where they are and what they are doing now. In the next chapter I present the
theoretical framework for my study.

CHAPTER 2
SCHOOLING AND SOCIETY
A weakness of much academic research is the product of two forms of occupational blindness – the inability of sociologists to recognise the complexities of the person and the unwillingness of psychologists to recognise the dimension of social power (Connell, 1987, pp. 193-4).
My study investigates a complex phenomenon occurring in a complex society. My aim
is to do justice to this complexity, that is, to avoid reductionist interpretations.
Following Connell (1987), I use an approach that attempts to integrate, rather than
oppose, levels of reality and corresponding academic disciplines. I wish to join macro-
sociological theories of schooling in late modernity and theories of school and social
control with individual level theories of offending.
I - THEORETICAL FRAMEWORK
My theoretical framework is articulated around these overlapping levels of analysis
(Figure 2.1):
I - Schooling in late modernity
II - Disciplinary control in schools
III - Students’ socio-educational trajectories
For level I, I draw from Young’s (1999) thesis on the “exclusive society” and Parsons’
(1999) critical theory of school exclusion. For level II, I consider Cohen’s (1985)
“visions of social control,” Slee’s (1995a) critical perspective on school discipline, and
Foucault’s (1977) analysis of “the micro-physics of power.” Also appropriate for level

52
II is a consideration of Emotional and Behavioural Disorders (EBD), and the politics
and paradoxes of educational inclusion. For level III, I present and critique three sets of
competing theories from developmental and life course criminology: Moffit’s (1993)
taxonomic perspective, Gottfredson and Hirschi’s (1990) static perspective, and Laub
and Sampson’s (2003) dynamic perspective. I discuss level I in this chapter. I will
discuss Level II in Chapter 3 and level III in Chapter 4.
Figure 2.1. Theoretical framework
I - SCHOOLING IN LATE MODERNITYSchooling and Society
“Quasi-Market Education”
A CRITICAL THEORY OF SCHOOL EXCLUSION
II – DISCIPLINARY CONTROL IN SCHOOLS
� “Visions of social control” � School discipline: a critical perspective
- The four dimensions of schooling - EBD controversies - Paradoxes of inclusion
� Discipline: the micro-physics of power
SCHOOLING Sociology of Education Role, aims, functions, and
processes
SOCIETY The Exclusive Society The problem of social
exclusion
III – SOCIO-EDUCATIONAL TRAJECTORIES
LIFE COURSE AND DEVELOPMENTAL CRIMINOLOGY
� Taxonomic theories
� Static theories
� Dynamic theories

53
II - SCHOOLING IN LATE MODERNITY
When the world started there were no schools, and they did okay.13
A. The Exclusive Society
Young (1999) charts the transformation of the social fabric in the last third of the 20th
century from an inclusive phase of capitalist societies characterised by stability,
certitudes, and homogeneity to an exclusive phase marked by change, uncertainty, and
division. This transformation refers to the movement from a social-democratic phase to
a neo-liberal phase of capitalist societies. Young investigates social exclusion in
relation to the labour market, the criminal justice system, and civil society. He argues
that the rise of individualism in conjunction with and riding on the profound
transformations in the labour market heighten the social exclusionary power of relative
deprivation within a market-based and risk-focused society.
According to Young the exclusive society is structurally, culturally, and discursively
informed by the market and new forms of individualism. It is characterised by the
growth of a sizable underclass excluded from the labour market, by rising crime rates,
and by harm management and minimisation policies. These policies essentialise,
demonise, and exclude individuals and groups with supposedly self-chosen deficits. In
this actuarial society concerned with risk-management, problem behaviour is first
evaluated, then “high-risk individuals” are isolated and excluded as part of implicit and
explicit institutional policy. Individuals with “deficits” are (a) observed, assessed, and
categorised by risk status; (b) then isolated, demonised, and excluded; and (c) in the
13 This quote (found in his file) is attributed to a 9-year-old student considered “school phobic,” and placed at The Haven in 1997.

54
process, characterised as choosing a self-excluding pathway. The exclusive society
privatises services and social problems and puts a high value on demands for personal
privacy. My 30-year history of educational exclusion begins in 1973 when Young
suggests the exclusive society began.14
1. Concepts of social exclusion
As it often occurs with broad concepts in the human sciences, “social exclusion” refers
to a number of related but distinct processes, and definitions vary across academic
disciplines (e.g., sociology and psychology). There is confusion on the meaning of the
word “social” in the concept. Should it refer to the sociological level, that is, to a
societal process or to the individual level, that is, to a developmental process, where
social refers to the influence of social groups on the development of individuals and to
the position of individuals vis à vis these social groups? In what follows I discuss and
contrast these two levels of interpretation, which I refer to as the sociological and
developmental perspectives.
2. The sociological perspective
For Young (2002, p. 457) social exclusion is a social, not an individual phenomenon.
It contrasts with earlier post-war notions, which viewed marginality as a problem of isolated dysfunctional individuals.15 Rather it is a collective phenomenon, hence its association with a posited underclass. Indeed, it has more in common with the dangerous classes of Victorian times that the dysfunctional families of the welfare state of the 1950s and 1960s.
14 Young proposes that the exclusive phase of Western capitalist societies started between the end of the 1960s and the mid-1970s. 15 For instance, Lenoir’s (1974) description of les exclus, as “the mentally and physically handicapped, suicidal people, aged invalids, abused children, drug addicts, delinquents, single parents, multi-problem households, marginal, asocial persons, and other ‘social misfits’” (cited in Hilary Silver, 1994, p. 532), is closer to post-World War II notions of individual marginality.

55
In this sociological framework, the concept of social exclusion is a societal
phenomenon, which is squarely placed “within the changing terrain of late modernity”
(Young, 2002, p. 459). He proposes a definition of social exclusion where
… there are core features, which separate it out from previous notions such as poverty or marginalisation. First, it is multi-dimensional: social exclusion can involve not only social but also economic, political, and spatial exclusion, as well as lack of access to specific desiderata such as information, medical provision, housing, policing security, etc. These dimensions are seen to interrelate and reinforce each other; overall they involve exclusion in what are regarded as the “normal” area of participation of full citizenship (p. 457).
Social exclusion and individual agency: three versions
Young (2002, p. 456) emphasises that social exclusion “has global roots rather than
being a restricted local problem,” that it is a function of the rapid changes and profound
transformations of late modernity, “a systemic problem: global in its causes, local in its
impact.” He delineates three radically different versions of social exclusion based on
the interpretation of the relation between agency and structure.
First, a “weak version” (Veit-Wilson, 1998), embraced on the political spectrum by the
New Right, suggests that social exclusion is self-imposed, and that individuals refuse
opportunities and should therefore be blamed for it. However, the sociological cause
for the growth of this lazy, criminally inclined, parasitic, and dysfunctional underclass
of single mothers, unemployed youth, and drug addicts is the welfare state. The latter,
through its irresponsible generosity, is deemed to foster a culture of dependency. Next
is a “middle version,” based on the notion of “social isolation,” where the unintentional
failure of the system to provide full employment leaves a number of individuals
stranded. The subsequent lack of positive role models renders them incapable of
competing for the few remaining job opportunities.

56
The “strong version” (Veit-Wilson, 1998), embraced by Foucauldians and neo-
Marxists, radically reverses the agency-structure relation posited by the “weak version.”
In the “strong version” opportunities are totally blocked for an underclass who is
actively rejected by exclusionary powers in society. In the process of social exclusion,
the agency of the excluded is minimal whilst structural forces are maximal.
Exclusionary powers stigmatise and stereotype those they exclude, cast them as
undeserving villains, as the scapegoats for all the ills of society. As Parsons (1999, p.
167) notes:
The pressures grow stronger for the withdrawal of welfare where groups can be construed as undeserving … The “underclass,” unhelpful as a sociological category, is helpful as political myth and covers the mass of undeserving poor. Thus a malleable situation develops where manipulators of ideology can legitimise the reduction in expenditure on welfare. To label the “mass of undeserving poor” as a class, albeit, an underclass, vests them with a cohesion, organisation, culture, and intentionality sufficient to justify fear and negative sanctions.
Bulimia nervosa
Young (2002) shows clear sympathy for the strong version of social exclusion, but
ultimately is critical of all versions. The most important element of his criticism, which
is also relevant for my thesis, is the notion that the rigid dualism between “the
excluded” and “the included” posited by all the versions “mistakes rhetoric for reality”
(p. 465). In fact late modern society is “bulimic,” that is, not just exclusive but both
inclusive and exclusive, both “anthropophagic” and “anthropoemic” (Young, 1999, p.
56); it both ingests and integrates, and vomits and rejects. Levi-Strauss (1992) coined
the terms anthropophagic and anthropoemic societies in order to distinguish between
two modes of deviancy control, the exclusive and the inclusive modes. Cohen (1985, p.
219) also draws from Levi-Strauss to distinguish between these two modes:
The vomiting-out mode stands for the possibility of separation, segregation, isolation, banishment, confinement. I will call this simply exclusion: temporarily or permanently, deviants are driven beyond social boundaries or separated out into their own designated spaces. The swallowing-up mode stands for the possibility of incorporation, integration or assimilation. This is inclusion:

57
deviants are retained, as long as possible within conventional social boundaries and institutions, there to be absorbed (Cohen, 1985, p. 219, emphasis in the original.).
Cohen illustrates his point with an example drawn from school disciplinary control:
Modes of coping with unruliness in the classroom may serve as a crude illustration of these alternatives. Exclusion leads to measures such as expulsion; separate classes, schools, or units for designated troublemakers; special diagnostic labels such as “hyperactivity” with treatments such as drugs. Inclusion leads to measures such as unobstructive techniques of assuring internal obedience; preventive conditioning by systems of reward and punishment aimed at all; deliberate extension of the boundaries of tolerance (p. 219).
Cohen also points out that “whole cultures cannot easily be divided into inclusionary
and exclusionary types” since “[m]ost societies employ both modes of control,
constantly oscillating between one and the other” (p. 219).
This is the reason why Young is critical of the rigid dualism between inclusion and
exclusion put forward by the various versions of social exclusion. Through his
physiological metaphor about bulimia nervosa, Young (1999) emphasises the greater
simultaneity of these two modes in late modern patterns of social control. For instance,
Young’s metaphor helps to clarify why the increasingly loud rhetoric about inclusive
education sits alongside the growth in educational exclusions. In relation to the jobless
and to various attempts at their integration in the labour force, bulimic processes are
also observable. In the name of redemptive labour, and to combat social isolation and
the culture of dependency, the underclass is coerced into the lowest level of the labour
market. According to Young (2002), this partial inclusion through schemes like “work
for the dole,” or other tedious, often temporary, and low paid jobs in fact moves the
jobless “from a category of exclusion to another,” which is experienced “not as
inclusion but as exclusion” (p. 483).

58
Enhanced Mertonian dynamics
There is another important reason behind Young’s criticism of the three versions of
social exclusion. He proposes that social exclusion in the bulimic society occurs
through enhanced Mertonian dynamics. Society, far from excluding anyone from
mainstream goals, actually narrows cultural difference by bringing people together in
the globalised cultural world of consumption, individualism, and narcissistic self-
realisation. The experience of social exclusion is therefore the result, on one hand, of
cultural inclusion and, on the other hand, of structural exclusion. Young argues that this
strain between cultural inclusion and structural exclusion is a powerful process to
generate discontent and disorder.
Furthermore, the presumed “included” are far from content, secure, and actually feeling
included. We live in the “40:30:30 society” (Hutton, 1995), where 40% are in secure
employment, 30% are in insecure employment, and 30% are unemployed or part of the
working poor. The exact proportions may be debated, but the idea is that society, as
Alinsky (1971) puts it, is not just divided into “the haves” and “the have nots” but also
into the growing and insecure “have a little but want more.”
The large insecure group of “the have a little but want more” looks vindictively up at
the “fat cats” and down at the “parasites.” This resentment of the lower and medium
middle classes toward what they regard as the luxurious existence at the top and the tax
scrounging at the bottom often manifests in nostalgic dreams and the growth of neo-

59
fascist movements,16 something Hall (1988) refers to as “authoritarian populism.” The
fat cats at the top are disliked, but they are untouchable. On the other hand, the
parasites at the bottom are easy targets for the venting of frustration and processes of
demonisation. In this anomic atmosphere, there is a great nostalgia for the embellished
lost golden age of full employment accompanied by strong work ethics, ideological
certainty, cradle to grave security, and unchallenged gender, race, and age power
relations. Nostalgic dreams permeate the expectations and the discourses of many who
fear they might suddenly become the objects of the bulimia nervosa of their society.
For Young (2002, p. 486), this is the reason why the current discourse about social
exclusion is fundamentally flawed, because “its terms of reference are inclusion into a
world that is fast disappearing.”
3. The developmental perspective
The concept of social exclusion also appears in the literature produced by
developmental psychologists such as Bynner (2001) or Jahnukainen (2001). For them,
social exclusion is framed within the individual paradigm of risk and protective factors
and examined through socio-psychological analyses. For instance, the question is
articulated as “which children are most at risk of becoming socially excluded?”
(Bynner, 2001, p. 285). Furthermore, Jahnukainen (2001, p. 1), using the notion of
alienation, introduces a subjective element into the concept of social exclusion,
somewhat relating social exclusion to the Mertonian deviant subgroups constituted by
the “retreatists” and “rebels:”
16 For instance, Pauline Hanson’s One Nation in Australia and Le Pen’s Front National in France. The term “fat cats” was used by Pauline Hanson in the late 1990s to refer to the elites. Those she targeted as “parasites” were essentially Aboriginal Australians, refugees, and the unemployed.

60
Whether people at these various stages feel excluded or not, is a different question …. It is, thus important to consider social exclusion from a more internal point of view. Social exclusion might then approach the concept of alienation, which refers to the inner state of feeling powerless and perhaps unwilling to participate and accept the means and goals of mainstream society (Merton, 1938).
It is important here to recall that Young (1999, 2002) also draws from Merton to
analyse the phenomenon of social exclusion. However, he does so in a very different
and near opposite way to Jahnukainen, by proposing that social exclusion is actually
experienced as participation in the goals (i.e., cultural inclusion), but not in the means
(i.e., structural exclusion) of mainstream society. In relation to the concept of
alienation, the confusion between a structural (e.g., Marxist) and subjective
psychological interpretation of the term was already present in Merton’s original paper
on anomie.17
Developmental psychologists tend to hesitate between sociological and individual
interpretations of social exclusion. The analytical challenge is to clearly distinguish,
rather than ignore, these two levels of reality in order to avoid confusion, and to
examine their relations. This is the challenge I take on in my thesis: I try to avoid
reducing the concept of social exclusion to individual factors; rather, I examine how
social exclusion, as a societal problem, translates into the life of individuals. I do this
because when used by developmental psychologists, the concept of social exclusion is
articulated into the individual risk factor paradigm, and the structural domain is ignored.
In the process, social exclusion becomes a generic term that stands for all the negative
developmental outcomes associated with various individual risk factors.
17 There has always been a tension, an ambiguity, in Merton’s anomie theory between the sense of individual alienation from society and the group-based sources of such alienation.

61
The danger is what Mac an Ghaill calls the “erasure of social class” (1996, p. 163) from
empirical research. Parsons (1999, p. 42) notes how this erasure of social class
proceeds from “atomising and individualising background factors” yet “hardly disguises
their remarkable collective similarity to what constitutes class, economic disadvantage
and social marginalisation.” Connell, White, and Johnston (1991) also observe this
strong inclination towards the erasure of social class when they write: “Poverty, we are
reminded, is a social and economic situation and not an attribute of a person or a
subculture” (p. 30) or “we should not call the issue ‘socio-economic disadvantage’
instead we should speak of inequality, or at least put ‘poverty’ together with
‘advantage’” (p. 71).
Class based inequalities, for instance, are first acknowledged as pivotal, but because
they are “fixed pre-disposing conditions that it is beyond the scope of policy to
influence directly” (Bynner, 2001, p. 286), they are eventually ignored in subsequent
interpretations of outcomes. Similarly the shrinkage of the labour market and the
virtual marketisation of all social processes, including education, are acknowledged but
as “contextual effects” (p. 288). In the end inequalities are interpreted as social
exclusion outcomes rather than as core antecedents of the phenomenon. Eventually as
Parsons (1999, p. 162) stresses in relation to “the language of disadvantage:”
the choice as to where the causes of disadvantage, social exclusion or alienation are located is ideological and political …. Even the linguistic form locates causes and blame in one place rather than another. “I am disadvantaged,” “I am disabled,” “I am excluded,” “I am alienated,” in English – in the UK – conveys an internal state, a personalised experience. The past participle allied to the verb “to be” is strictly descriptive, inert and leaves responsibility with the subject. Yet “to disadvantage,” “to disable,” “to exclude” and “to alienate” are active verbs, which can be used with subject and object: society disadvantages me or disables me; the school excludes me; the world of youth training for jobs that don’t exist alienates me.

62
B. Schooling and Society
From the literature on the sociology of education I distinguish and discuss the role(s),
stated aims, functions, and processes of schooling in society. Then I consider how the
movement from modernity (i.e., from the inclusive phase of Western capitalism) to late
modernity (i.e., to the exclusive phase of Western capitalism) has, in the last 30 years,
transformed schooling and the place of schooling in society. To summarise this
discussion, I present Parsons’ theory of school exclusion.
1. Education and schooling
As many authors suggest (e.g., Bell, 1973; Illich, 1971; Laborit, 1992; Rossanda, Cini,
& Berlinguer, 1970), it is necessary to distinguish education from schooling. The terms
are often used interchangeably, yet their scope or universe is not the same. Education is
the process through which a society transmits information across the generations in the
form of: (a) skills, (b) knowledge, (c) values and the socialisation into norms, and (d)
from this process, produces and constructs knowledge, skills, values, and norms
(Goodlad, 1990; Laborit, 1977). The three levels of transmission (a, b, and c) represent
the elements of enculturation. The “productive and constructive” process (d) is unique
to human beings. It involves neo-cortical/imaginative structures permitting
metacognitive processes, which allow the human animal to indefinitely reconstruct (i.e.,
associate differently and creatively) and enrich the materials transmitted through the
processes of enculturation (Laborit, 1992).

63
Education, in this generic sense, is distinct from schooling as an institution. Schooling
is not the sole institution that participates in the process of education,18 but education is
the specialised function of schooling. From now on, as far as possible, I will endeavour
to use education in the generic sense discussed above, education systems in reference to
the three levels of educational systems (i.e., primary, secondary, and tertiary), and
school systems in reference to primary and secondary levels of educational systems
only. I will use the term school processes in reference to the values and philosophy,
organisation, curriculum, and pedagogies of school systems. The terms schooling,
schooling processes, and schooling systems will refer to a broader concept, including
the roles, aims, and functions of schools. Finally I will use the word pedagogy in
reference to the methods used to teach students.
2. The role(s) of schooling
By using the word “role” - as distinct from say “aims,” “functions,” and “processes” - in
the question what is the role of schooling in society, I mean to question what schooling
is “objectively” doing at the macro level of society. One answer, common to all
sociological perspectives in education, is that schooling participates in reproducing the
structure of society. What distinguishes functionalist and conflict perspectives is not
reproduction per se, but what is it that is or should be passed on or reproduced.
Liberal functionalist perspectives, represented by Talcott Parsons (1959) and Dreeben
(1968), emphasise the transmission of culture through the learning of its particular
norms. It is a process of socialisation, which is seen as contributing to social integration
18 Other cultural institutions, the family, the peer group, and increasingly the media, also participate in the process of education.

64
and the development of consensus. The role of schooling is to maintain an ordered
system, a state of equilibrium in society.
For conflict perspectives, Bowles and Gintis (1976) take a Marxist view. They argue
that the role of schooling is to maintain the subjection of oppressed classes to the
capitalist ideology and reproduce the particular dominance hierarchy and the relations
of production of the workplace. In its most radical Marxist expression (e.g., Rossanda,
Cini, & Berlinguer, 1977) schooling is regarded as a fundamental and unredeemable
instrument of capitalist reproduction. Other conflict theorists from what is called the
“new sociology of education,” such as Bernstein (1977) in England and Bourdieu
(1973) in France, look at the content of education and the internal operations of the
schools, rather than the relationship of schools to other institutions. Their analyses
focus on mechanisms of social control in the process of cultural transmission, through
teacher-student interaction, categories or concepts used by educators, and the
curriculum. They are interested in the relations between cultural reproduction and
social reproduction (Bourdieu, 1973). They examine how schooling contributes to the
transmission of power and privileges and to the reproduction of the class system, by
fulfilling a function of legitimation based on academic achievement, which is presented
as a neutral measure of individual merit.
3. The aims of schooling
By the stated aims of a nation’s schooling system, I refer to the philosophical positions
or the espoused theories of educators and the rhetoric accompanying government
policies. These are “subjective” pronouncements, a kind of discursive superstructure,

65
which is “the result of the purposeful decisions of powerful social groups and players”
(Parsons, 1999, p. 3) rather than of the objective structures of society. These stated
aims are influenced by the contradictory positions put forwards by the media,
educationists, politicians, parents’ associations, and teachers’ unions, and are therefore
multiple, often conflicting, paradoxical, and changing. They reflect a mixed bag of
ideals, plans, resolutions, interests, criticisms, and envisioned purposes. The debates
centre around questions of personal empowerment, nurturance, creativity,
apprenticeship in democracy and social empowerment, versus indoctrination, nation
building, social control, skilling for work, and economic growth.
4. The functions of schooling
Parsons (1999, p. 6) reminds us that schooling has no inherent aims or functions and
that it is people who “shape education and invest it with aims and functions.” Looking
at the history of schooling in England and Wales, he delineates six main functions,
which can be observed in most school systems in the world: (a) custodial, (b)
credentialing, (c) civilising, (d) creating a national identity, (e) skilling, and (f)
selecting, organising and transmitting public knowledge. The emphasis put on any of
these distinct functions will vary with place and time. Parsons contends that variations
in emphasis between the functions, and particularly how each function is going to be
played at any point in time along ideological currents, have great theoretical relevance
in the phenomenon of educational exclusion.

66
The custodial function
The concept of schooling as a “compulsory right” is an apparent paradox, but it
demonstrates the custodial function of schooling par excellence. Across many nations
of the Western world mass compulsory schooling occurred about the same time, during
the late 19th century. Three reasons are generally given for this important historical
movement: (a) the need by the bourgeoisie to control a growing mass of urban poor
(Connell, White, & Johnston, 1991; Parsons, 1999), (b) the need by the capitalists for a
literate, skilled and disciplined work force (Bowles & Gintis, 1976; Rossanda, Cini, &
Berlinguer, 1977), and (c) the action of the labour movement toward mass education
and literacy to better arm the proletariat for the class struggle (Connell, White, &
Johnston, 1991; Rossanda, Cini, & Berlinguer, 1977).
The credentialing function
The credentialing function is about providing a passage into the hierarchy of status.
Credentials in the form of certificates, degrees, and diplomas are cultural goods
intended to legitimise privileged access to the higher levels of the occupational
hierarchies and societal positions (Bourdieu & Passeron, 1977: Eggleton, 1984).
The civilising function
The civilising function refers to the effects of schooling on socialisation or “learning
how to behave.” It is about inducting children into the prevailing culture. Here
schooling offers a second level of enculturation and social control after and in parallel to
the family. It may also provide a buffer against or a correction of the defective

67
socialisation practices in the family. Debates arise here on whether the civilising
function is or should be about enabling individuals or shaping social conformity.
The national identity function
The national identity function is about “learning how to belong.” Parsons (1999, p. 9)
suggests that “the school is the most tangible, interpersonal arrangement for developing
a general sense of common and shared experience of commitment and belonging in the
nation-state.” How much this function is actually directed towards developing a benign
sense of belongingness and solidarity amongst citizens or a malignant nationalistic
feeling is debatable.
The skilling function
The skilling function refers to training the young for work. It is about “learning to
labour” (Willis, 1977). That schooling should serve economic investments and the
needs of industry is a demand made almost unanimously by the diverse sections of
society. Apart from Marxist criticisms of the function itself (e.g., Bowles & Gintis,
1976) as one that is about training and providing “factory fodder” for the interests of the
capitalist class, other critiques blame school systems for failing to fulfil the
requirements of industries (Barnett, 1986; Jamieson, 1996; Weiner, 1981).
The selecting, organising, and transmitting of public knowledge function
This function refers to the curriculum, in particular to what is going to be selected as the
material to be taught. According to Parsons (1999, p. 11) “the selection of knowledge
that goes to make up the curriculum in schools has dubious rational and philosophical

68
bases. Indeed its utility to economic or social life is questionable.” Further, what may
also need to be questioned is the relevance and resonance of what is selected as
knowledge for particular groups in the class structure.
5. The process of labelling
There is nothing like failure to bring about more failure. Once students have been
deemed unmeritorious or less likely to be meritorious, chances are that the tag is going
to follow them. Rothenthal and Jacobson (1968) call this process the self-fulfilling
prophecy. In Pygmalion in the Classroom, they show how teachers’ expectations of
students, for instance “those ones are bright and those ones are slow,” end up being
translated into differential treatment within the classroom, which eventually produces
the very outcome the teachers have assumed. Rist (1977) reports on a myriad of studies
that document how teachers expect less of lower class than middle class students. The
latter tend to be placed in higher tracks independently of their measured ability.
Students believed to be high achievers are given more time to answer questions and are
praised more frequently for their success. They are less criticised for their failure
compared to those deemed low achievers or troublemakers.
Moreover, those with a “shady past,” that is, those who have been removed from a
school community, on their return may have to show their supposedly “true colours” by
“resuming deviant activity” in order to preserve some kind of expected identity
(Erikson, 1964, p. 17). Many (e.g., Noblit & Polk, 1975; Schafer & Olexa, 1971)
regard the creation of undeserving outsiders, through school processes such as the
69
meritocratic fallacy and the self-fulfilling prophecy, as a major mechanism in the
development of juvenile delinquency.
C. Schooling in the New World Order
I now turn to a discussion of the major societal changes that transformed schooling and
played a role in the growing phenomenon of educational exclusion during the last 30
years.
1. The end of the work-based society
Learning to labour
In Learning to Labour, Paul Willis (1977) documents and analyses “how working class
kids used to get working class jobs” (p. 1, emphasis added). His study is of the period
1972 to 1975, the time of the transition from the inclusive society of full employment to
the exclusive society of structural long-term unemployment. From the 1950s to the
mid-1970s, thanks to the huge state-owned sector of banks, insurance companies,
administrations, and stable industries, most young people in Western capitalist
economies found a job at the end of their schooling.
The crisis
In 1974 the crisis begins. It is blamed first on the oil producing countries that now
demand a better remuneration for their resources. Western capitalism restructures its
operations, first within its borders: for instance, the French steel industry is downsized
to be redeveloped in Germany; the printing industry goes to Belgium; the car industry to
Spain where cheaper labour is available, and then outside its borders where labour is

70
even cheaper. Many young people, particularly from the working class, are now
excluded from the labour market when they leave school. Willis (1977) reports an
increase of jobless school leavers in England and Wales from about 8,000 in February
1975 to 40,000 in February 1976 and 82,000 in October 1976.
Social junk
Schooling in the restructured and globalised market society is therefore no longer a
process where there is a simple correspondence between socialisation and work. The
school institution is no longer a place where, according to meritocratic tracks, those who
are going to college and those who are going to replace dad in the factory are sorted out.
Oftentimes dad’s factory has been relocated to South East Asia. Increasingly the school
becomes a highly competitive place to separate those who may have a chance from
those who will become “social junk.”
2. Quasi-market education
In the late modern world, the ruthless and naked hand of the market, which had been
previously restrained and gloved by social democratic Keynesian arrangements, returns
with a vengeance. Late modernity is the triumph of the market ideology. As
formulated by Hayek (1993), one of the most influential advocates of the market
ideology, the market is presented as “independent of ‘conscious choice’” (Slee, 1998a,
p. 257). “Market forces” are depicted as natural forces like winds and waves. They are
laws of nature that we have to obey and sail through guided by competent market
captains. The new captains may not be able to save everyone from being thrown out of
the boat by unpredictable storms, but they will save the boat from wreckage.

71
Schooling also falls under the spell of this ideology. Education systems now belong to
the “knowledge economy” and are therefore to be managed according to the philosophy,
rules, and techniques of the market. “Quasi-market education” (Le Grand & Bartlett,
1993) and “academic capitalism” (Slaughter & Leslie, 1997) are born.19 In
“marketised” schools, failing, struggling or difficult students constitute “unsaleable
goods” (Bennett, 1993) or “damaged goods” (John, 1996). As Parsons (1999, p. 166)
observes: “the market knows no morality and no social justice, a term that Hayek
deemed meaningless.” Moreover, as education becomes a commodity, it is less and less
regarded as a right but is increasingly viewed as a privilege. According to Parsons
(1999), when it is viewed as a commodity, if behaviour is bad, education will tend to be
withdrawn as a punishment. It is a privilege that is no longer deserved. According to
many authors, the marketisation of school systems fuels formal and informal
exclusionary practices (Bagley & Pritchard, 1998; Beckett, 2001; Blyth & Milner, 1994;
Cullingford, 1999; Levitas, 1998; Normington & Kyriacou, 1994; Partffrey, 1994;
Parsons, 1999; Vulliamy & Webb, 2000).
D. A Critical Theory of School Exclusion
Parsons (1999) has attempted what he calls “a middle range theorising” of educational
exclusion in the English context. He proposes a theoretical framework “which builds
on conflict sociology and links cultural, political and economic forms of domination and
19 In Australia it was during the 1980s that a union sacrée between a Labor Government, big business, and the trade union movement, all embracing the economic rationalist ideology, initiated a vast corporatisation of the public sector (Vidovich & Slee, 2001). It started the dismantlement of the universalistic educational arrangements established in the early 1970s by the Whitlam government. The conservative Howard government that came into power in 1996 completed this dismantlement. The same process began some years earlier in the UK and the USA.

72
the legitimisation of discourses on social policy and inequalities” (p. 3). He explains
the growing phenomenon of educational exclusion as the result of the movement from
social democratic to neo-liberal ideals and arrangements. This ideological movement
occurs in parallel with the societal movement from modernity to late modernity. The
shift from democratic/humanistic to controlling/classical ideals brings changes in the six
functions of schooling, which become more exclusionary in their policies and practices.
Furthermore, Parsons delineates 27 “forces promoting educational exclusion” and 27
“forces promoting educational inclusion,” which are situated at the three levels of
analysis (societal, institutional, and individual) considered in my thesis.
1. Two ideological poles and six schooling functions
Parsons defines the two ideological poles as either social democratic/humanistic or
controlling/classical. Although this framework is set as a binary, it is to be interpreted
as a continuum; that is, each of the six schooling functions will exhibit characteristics
along a continuum between the two poles as shown in Table 2.1. Parsons’ argument is
that policies and practices favouring exclusion or inclusion will depend on how each
schooling function is positioned on this ideological continuum:
On each continua, movement to the right [of Table 2.1 and of the ideological spectrum] will favour achievement of some favoured goals, e.g., high standards in basic skills and traditional subjects, a (self-) controlled population, etc. It will run counter to “inclusion,” will be less tolerant of difference and will increase pressure to conform. Equally, movement to the left resonates with many of those “weak” words to do with social work, freedom, kindness. It is accepting and inclusive (Parsons, 1999, p. 13).
Parsons’ idea is that whole school systems, and individual schools, can, at different
times, become more or less benign and nurturing or controlling and limiting in their
custodial function, more or less democratising and humanising or subjugating and
inducting in their civilising function, and so on for the other functions.

73
Table 2.1. Ideological poles and schooling in society
FunctionsSocial democratic/
humanisticControlling/classical
Custodial Benign and nurturing Controlling and limiting
Civilising Democratising and humanising
Subjugating and inducting
National identity Open and questioning Closed and nationalistic
Skilling Generic and flexible Specific and fixed
Credentialing Egalitarian and communitarian
Elitist and competitive
Public knowledge Conjectural and open Received and authoritative
Parsons interprets the growth in educational exclusion in England and Wales as
resulting from a move, near the end of the 1960s, toward the controlling pole of the
continuum for all of the six schooling functions and from an increasing emphasis on the
custodial and credentialing functions at the expense of the other functions. The main
idea about the process is that powerful elites in the political apparatus dominate over the
education agenda and influence schooling processes towards neo-liberal policies that
shift the six functions of schooling to the non-negotiable and subordinating pole of the
continuum. Figure 2.2 presents Parsons’ assessment of the 1966-1996 and 1997-1999
movements in England and Wales (the latter occurring during the “New Labour”
government) between the ideological poles. Parsons proposes that the structural
changes associated with the movement from modernity to late modernity, and the
ideological shift that informs or provides a rationale for these transformations, also
influence the direction of the forces that promote either educational inclusion or
exclusion.

74
Figure 2.2. Functions of schooling and ideological “movement,” 1966-99 in England
and Wales (from Parsons, 1999, p. 14)
2. Three causal levels and 27 factors
These forces, which encompass societal, institutional, and individual levels, may be
likened to the risk and protective factors of the developmental paradigm; yet, they are
specific to schooling and to the phenomenon of educational exclusion. The difference
between Parsons’ framework and the socio-psychological developmental paradigm in
education is his insistence on the notion that “socio-economic and cultural factors
constituting the structural conditions of life exert the greatest forces and only some of
these are amenable to short-term remedial action” (p. 44, emphasis in the original). The
list of these 27 factors and their grouping under three levels, (a) socio-economic and
cultural, (b) institutional, and (c) individual, is presented in Figure 2.3.

75
In this thesis, I do not investigate whether or not the movement between the ideological
poles has shaped the six functions of schooling and influenced educational exclusion in
Queensland. Such an enquiry would entail an examination of shifting school cultures
during the last 30 years. However, my study analyses what Parsons (1999, p. 4) calls
“the forces promoting inclusion or exclusion,” whether there were changes in these
forces during the last 30 years, and whether socio-economic, or institutional, or
individual conditions exert the greatest forces in the phenomenon of educational
exclusion. Although my data might not be able to capture all the factors listed by
Parsons, these factors were used to inform the coding of the socio-educational
circumstances of The Haven’s students.
3. A strong version of social exclusion
Parsons’ theoretical framework embeds the phenomenon of educational exclusion
within a “strong version” of social exclusion. He extends Young’s thesis on the
exclusive society to the school domain:
School exclusions are part of wider social exclusions related to inequality and poverty. Individual choice, determination, responsibility and other attributes of the person inevitably play a role in how individuals function within societal institutions, but this occurs within a structure of access to resources, opportunity, pressures and life chances (Parsons, 1999, p. 37).

76
Figure 2.3. “A framework for understanding school exclusion” (from Parsons, 1999, p. 4)

77
Parsons presents his theorising as “middle range.” His theory “incorporates macro-
social forces which limit access and opportunity for some and shape life experience and
cultural form.” It also “accepts that, at the situational or micro level, individuals and
social groups have some autonomy and scope to control, reinterpret and transform their
actions and contexts.” However, he stresses that overall his “interpretation of the
situation … is structural rather than individual” (Parsons, 1999, p. 36). On the
relationship between structure and agency, as it relates to school exclusion, he contends
that “structure exerts more power than individual agency” (p. 21). For him, when one is
looking at the most dispossessed by society, “theoretical stances which stress the agency
of individuals as reality definers (Schutz, 1970) and reflexive creators of their own
biographies (Giddens, 1984) have limited explanatory strength” (p. 36).
Parsons points out that multiple forms of superimposed inequalities seriously restrict
one’s scope for the exercise of individual freedom: “for those with little left to lose,
freedom is just another word for absence of support, zero tolerance and social
exclusion” (p. 36). He argues that “exclusion … whether from school or from society,
is a purposeful choice made by controlling groups, drawing on contrived or existing
legitimacy.” For him “pupil exclusion from school, like the poor and criminals, are
created and managed, and “a competitive, stratified society needs these failures” (p. 19,
emphasis in the original). At this level it is not a question of individual but of societal
choice. It is how we decide to interpret the social existence of human beings.
Both Young and Parsons frame exclusion as a sociological rather than an individual
problem. They associate the phenomenon with an increasingly exclusive society and

78
exclusive school system under the spell of a neo-liberal market ideology. They suggest
that the phenomenon started about 30 years ago, near the end of the 1960s. They
embrace a strong version of social exclusion in which opportunities are blocked for an
underclass that is actively rejected by exclusionary powers in society.
Given the characteristics of excluded students highlighted in the empirical literature,
particularly socio-economic disadvantage and racial minority, and the convergent
explanatory frameworks about social exclusion and educational exclusion proposed
respectively by Young and Parsons, I expect to see the following in my data on the
journeys of the excluded: support for Parsons’ thesis that “school exclusions are part of
wider social exclusions” and that “structure exerts more power than individual agency.”
The experiences of the excluded will show a strong version of social exclusion in which
opportunities are blocked for an underclass that is actively rejected by exclusionary
powers in society. Finally educational exclusion, like social exclusion, will be strongly
associated with crime and criminalisation.

CHAPTER 3
DISCIPLINARY CONTROL IN SCHOOLS
Whereas level I of my theoretical framework centres on the broad characteristics of
schooling in late modernity, level II is about social control in schools. It is about “the
organised ways in which society” (and one of its microcosms, the school) “responds to
behaviour and people it regards as deviant, problematic, worrying, threatening,
troublesome or undesirable in some way or another” (Cohen, 1985, p. 1). In schools,
this battery of social control is often referred to as “school discipline.” As in wider
society, disciplinary control in schools takes many forms, is defined using many terms,
is shaped by many ideas, and motivated by many emotions. There are many categories
under which troublesome behaviours are classified, many names to label transgressors,
and many people who play the role of controllers.20
Theorisation of school disciplinary control can be examined through two different
lenses. Using an optical analogy, Slee’s (1988, 1992, 1995a, 1999) critical perspective
of school discipline uses binoculars whilst Foucault’s (1977) analysis of the micro-
physics of power utilises the microscope.
20 This is how Cohen (1985, p. 1) introduces the various elements of the social control process: “This response appears under many terms: punishment, deterrence, treatment, prevention, segregation, justice, rehabilitation, reform or social defence. It is accompanied by many ideas and emotions: hatred, revenge, retaliation, disgust, compassion, salvation, benevolence or admiration. The behaviour in question is classified under many headings: crime, delinquency, deviance, immorality, perversity, wickedness, deficiency or sickness. The people to whom the response is directed, are seen variously as monsters, fools, villains, sufferers, rebels or victims. And those who respond (by doing something or just studying the subject – jobs which are too often confused) are known as judges, policemen, social workers, psychiatrists, psychologists, criminologists or sociologists of deviance….”

80
I - SCHOOL DISCIPLINE: A CRITICAL PERSPECTIVE
For at least a decade, Slee (1988, 1992, 1995a, 1999) has been discussing school
discipline and educational reform within a critical theoretical framework that focuses on
the four dimensions of schooling (i.e., school philosophy and values, school
organisation, curriculum, and pedagogies). Research on schooling guided by this
theoretical framework addresses the complexity of schooling and informs effective and
ethical school governance to improve the educational and social outcomes for all
students (Hollins, 1991; Knight, 1985; Pearl, 1988, 1991; Pearl & Knight, 1999;
Valencia, 1997). Slee, along with other critical educationists from the inclusive and
democratic education movement (e.g., Knight, 2000; Pearl & Knight, 1999), claims to
embrace an “educational approach” to school discipline. This approach is said to stand
in opposition to the dominant perspective, which is deemed to inform a “medical” and
punitive approach to problems and to ignore the four dimensions of schooling.
A. The Four Dimensions of Schooling
1. Philosophy and values: what we believe
According to Lingard, Mills, and Hayes (2001), learning communities that produce
meaningful and positive educational processes and outcomes share norms and values
that foster a focus on student learning, reflective dialogue, and “deprivatisation of
practice” (i.e., collaboration between teachers). These productive learning communities
“implicitly and sometimes quite explicitly commit themselves to principles of social
justice and democracy” (p. 149). Competitive and authoritarian school values are
associated with student alienation (Furlong, 1991; Herr & Anderson, 1993, 1997; Smyth

81
& Hattam, 2000; Stokes, 2000; Vick, 1993) and delinquency (Braithwaite, 2000;
Stainback & Stainback, 1994). The need to foster school attachment and connectedness
is recognised as an important element of positive academic and social outcomes
(McNeely, Nonnemaker, & Blum, 2002; National Crime Prevention, 1999).
2. School organisation: how the school operates, what are the norms and how they
are constructed
Slee’s critical perspective suggests that the democratisation of school governance is an
important concept to include in the theorisation of school discipline. As proposed by
Parsons (1999) in his theory of educational exclusion, school structures and
organisational processes can be ranged along a continuum from democratic,
participative, educational, and liberating to authoritarian, hierarchical, control oriented,
and coercive types of school governance. The former is linked with positive
educational and social outcomes and the latter with student alienation, disruption,
aggression, and violence. The same conclusion is reached whether one looks at
governance in terms of: (a) a whole school perspective, as illustrated in the democratic
education literature (e.g., Hollins, 1991; Lingard et al., 2001; Pearl, 1991; Pearl &
Knight, 1999; Valencia, 1997), (b) school discipline and justice (e.g., Cameron &
Thorsborne, 2001; Christie, Petrie, & Christie, 1999; Cislowski, 2002; Dwyer, Osher, &
Hoffman, 2000; Henderson, 2002; McCold, 2002; Millar, 1999; B. Morrison, 2002;
Queensland Department of Education, 1996; Rigby, 1996, 2002; Ritchie & O’Connel,
2001; Shaw & Wierenga, 2002; Slee, 1992), or (c) classroom management (Gathercoal,
1998; Jackson & Panyan, 2002; Johnson & Johnson, 1994; Nimmo, 1998; Sergiovanni,
1994).

82
3. Curriculum: what we teach, the content of what we transmit
Gore (2001) points to a frequently heard yet puzzling observation that “many students
from quite a young age, describe school as ‘boring’ and declare each day that they
learned ‘nothing’” (p. 168). Why, she asks, “do we find so many characterisations of
classrooms as dull if not deadening places to be?” (p. 166). Ball (1994, p. 46) has
coined the term “curriculum of the dead” to refer to the generally unstimulating,
irrelevant, disarticulated and museum-like content of curricular provisions. Kinder et al.
(1995), Mac an Ghaill (1994), Marshall (2003), O’Keeffe (1994), and Reay and Wiliam
(1999) associate such “mummified” provisions with students’ disaffection, truancy,
disruption, and exclusion. The great danger, however, is to lock the debate within a
dichotomy that opposes the overly academic “curriculum of the dead” to a set of “basic
skills” or a purely vocational curriculum for the “disaffected.” These two curricular
approaches seem to be similarly unappealing to disaffected students (Solomon &
Rogers, 2001).
Slee’s critical perspective suggests that combating student disaffection and exclusion
through the curriculum requires a rejection of both the “curriculum of the dead” and the
“thinned out vocational training for the disaffected.” The focus instead should be on a
“generalised education” (Laborit, 1977), a living and lively curriculum supported with
productive and empowering pedagogies (Sanzen, 1994) as proposed by the Queensland
School Reform Longitudinal Study (School of Education-UQ, 2001).

83
4. Pedagogy: how we teach, how we transmit and construct the curriculum
Particular kinds of knowledge and pedagogies alienate students on the basis of race,
class, and gender (Freebody, Ludwig, & Gunn, 1995; Gilbert & Gilbert, 1998; Hill et
al., 1998; Hooks, 1994; Kenway et al., 1997). “Productive pedagogies” involve the use
of complex reasoning skills, such as hypothesising, synthesising, and evaluating, which
encourage students to construct new knowledges (School of Education-UQ, 2001).
These pedagogies are articulated around four facets: “intellectual quality,”
“connectedness,” “supportive classroom environment,” and “recognition of
differences.” The fostering of metacognitive abilities in schooling is stratified along a
class dimension. The Queensland School Reform Longitudinal Study reports that the
overall distribution of productive pedagogies “is socially inequitable, in as much as
students in secondary schools in low socio-economic areas and with higher percentage
of Indigenous students receive lower levels of productive pedagogies” (School of
Education-UQ, p. xxiii).
B. Barriers Against Change
Slee (1988, 1992, 1995a) suggests that school reforms, at different stages of their
development, were hijacked by “eventually marketable” quick-fix thinking, taking over
educational thinking. Quick-fix thinking reduced the scope of educational reform
enquiry, and maintained control-oriented perspectives. Rather than looking at the four
dimensions of schooling to conceptualise school discipline in a changing society, Slee
argues that we replaced an archaic technology of control with a more modern one. We
replaced the cane with Ritalin. Schools banned corporal punishment, but instead they
increasingly used suspensions, exclusions, and educational segregation. They were

84
invaded by behaviour management professionals and witnessed an explosion of new
student pathologies categorised under a myriad of acronyms.
C. From the Cane to Ritalin
Corporal punishment in Australian public schools only officially disappeared in 1995
when the state of Queensland was the last to abolish it. Until 1983, when Victoria was
the first state to ban caning in schools, corporal punishment of school deviants was
regarded as a legitimate form of control in all Australian states. The abolition of
corporal punishment in schools generated much debate, and still does.21 In all states the
abolitionist period was associated with great hopes for a more enlightened
conceptualisation of school discipline that would move away from mere control and
embrace new strategies to foster self-discipline (Maddocks, 1983).
Very quickly, however, the lofty goals of self-discipline were overshadowed by reviews
of suspension and exclusion regulations and the development of segregation units (Slee,
1988). A bulimic process had started and, with it, the ever growing gap between
rhetoric and reality. The abolishment of corporal punishment marked the end of an
anthropophagic phase of social control, when the school deviant was reabsorbed into the
21 In 1996, the UK Secretary of State for Education indicated her preference for the reintroduction of caning in British schools (Slee, 1997). Although caning students has not been reinstated in Australia, the idea of reintroducing it is periodically peddled by some media and politicians. In 1998, in Western Australia, the Sunday Times reopened the debate proposing that corporal punishment was a potential crime prevention strategy. Abolition of corporal punishment was a long and protracted process. For instance, during the Australian abolitionist period that started in 1983 with Victoria and ended in 1995 with Queensland, corporal punishment, which had been abolished in NSW schools in 1987, was reintroduced by a conservative government in 1989, to be abolished again in 1995 following the election of a new Labour government. Until 2000 the NSW ban was resisted by some private schools and remained an issue of contention between the state and federal government (Parker, 2000). Some states like South Australia and Queensland went through a five-year phasing out period, on the rationale that schools needed sufficient time to develop “alternative techniques” (Johnson, 1992, p. 79). Protecting political fortunes in relation to what was regarded as a politically dangerous decision was also suggested as motivating the slow phasing out plan (Johnson, 1992).

85
community through chastisement. Now, heralding the beginning of an anthropoemic
phase, the deviant would be treated apart, banned, and segregated.
Increasingly and beginning in the mid-1980s, a large proportion of disruptive students
were no longer regarded as bad kids, but as sick kids. A sudden epidemic of damaged
nervous systems, such as Attention Deficit and Hyperactivity Disorder (ADHD), which
seemed to be spreading rapidly and required isolation and medication, started to affect a
growing number of children when they entered the school. Schools had not been
democratised. The net of social control had not only widened, but its mesh was also
finer. It constructed and captured more school deviants to be thrown out or given up for
dissection and consumption to a new body of controllers specialised in the assessment
and treatment of deficits.
D. EBD Controversies
Some children, independently of the schooling process, that is, because of constitution,
deleterious family environments, or both, bring their individual problems to school.
These children, generally classified as “Emotionally and Behaviourally Disordered”
(EBD), are the objects of passionate debates and controversies between educational
psychologists and sociologists, each accusing the opposite of reductionism. An
inclusive, rather than a mutually exclusive, way to look at the debate might be to follow
Furlong’s (1991, p. 296) suggestion. Furlong proposes to develop a “sociology of
emotion,” which considers the “hidden injuries” of schooling. He claims that even in
cases where students’ emotionality, disaffection, and subsequent disruption are not
primarily produced by the schooling experience, but, say, by family dysfunction, “there

86
remain important questions to be asked about why school becomes a focus for the
expression of their hostility.”
“EBD children” are the hard cases, those at the top of the school social control pyramid,
who stress teachers out and are the most likely to be excluded from school (Bennathan,
2001; Kuorelahti, 2001; McEwan, Nimmo, & Gathercoal, 1999). Mostly, they are
chronically aggressive, violent, and noncompliant boys (Andrews et al., 1979; Renew,
1992; Szaday, Pickering, & Duerdoth, 1990). Educationally and socially, they are the
most at risk of failure. They drop out of school, end up unemployed, abuse drugs, and
engage in criminalised behaviours (Bradley, Henderson, & Monfore, 2004; Ogden,
2001; Royer, 2001). They come from the so-called dysfunctional families where often
they have suffered all sorts of maltreatments and deprivations and where violence
against women is rife (Bennathan, 2001; Candy & Baker, 1992; Greenhalgh, 2001;
Hatswell, 1989; Renew 1992). Many reports indicate that most of the children labelled
EBD come from the lower class, where they are more likely to live in socially “toxic
environments with multiple known risk factors” (Conroy & Brown, 2004, p. 233; see
also Bennathan, 2001; Candy & Baker, 1992; Farrell, 1990; Flint, 1992; Hatswell, 1989;
Kuorelahti, 2001; Szaday, Pickering, & Duerdoth, 1990).
The Australian, British, and American literature (Bliss, 1992; Cooper, 2001; Kauffman,
1997; Lavery, Holbeck, & Clayton, 1989; Murphy, 1989; Quinn & Sultmann, 1987;
Szaday, Pickering, & Duerdoth, 1990) reports that between 3% and 6% of children
would fit the label of EBD. Statements from a number of authors (Bradley, Henderson,
& Monfore, 2004; Hatswell, 1989; Royer, 2001; Walker et al., 1996) give the

87
impression that the number of students with EBD has steadily increased since the mid-
1980s. However, during the same period no clear definition of what constitutes EBD
has been established. Many contend that “a universal definition for the EBD is
impossible to create” (Kuorelahti, 2001, p. 64; see also Kivirauma, 1995 and Visser,
Daniels, & Cole, 2001).
For the critics (e.g., Goodman & Poillion, 1992; Slee, 1995a; Swan, 1995), the sheer
elasticity of the EBD concept and the endless proliferation of new classifications such
as ADHD, covering “a wide variety of traits” (Murphy, 1989, p. 49) constitute “a
phenomenon of amazing institutional convenience” (Slee, 1995a, p. 62). For instance,
the EBD label, which in most cases is tagged on children who are regarded as defiant,
aggressive, and violent in the school setting, is also essentially a male problem. In the
USA, it is a problem associated with an overrepresentation of African Americans
(Bradley, Henderson, & Monfore, 2004).
E. The Paradoxes of Inclusion
1. Inclusionists versus traditionalists
Whether all children, including those considered EBD, should be educated in regular
schools or some children should be placed in special schools, is the object of fierce
ideological debates between educators from the inclusive education movement (e.g.,
Slee, 1995b) and educators from the special education system (e.g., Kauffman &
Hallahan, 1995). Using Brantlinger’s (1997, p. 428) terminology I refer to educators
from the inclusive education movement as “inclusionists” and educators from the
special education system as “traditionalists.” Inclusionists are harsh critics of what they

88
regard as the segregationist ideology and practices of special education. For instance,
Slee (1996, pp. 111, 118) dubs the traditionalists a “special education fraternity” or
“industry,” and accuses them of upholding the status quo, that is, of maintaining
existing exclusionary school cultures. Traditionalists refer to inclusionists as “zealous
reformers” and “radicals” (Semmel, Gerber, & MacMillan, 1995). For traditionalists,
“the illusion of full inclusion” is no more than “an ideological bandwagon” (Kauffman
& Hallahan, 1995), a folly that disregards the interests of students with special
educational needs.
2. Mainstreaming versus inclusive education
Integration, mainstreaming, inclusion, and inclusive education may sound like
interchangeable words to talk about educating all children in regular schools. It is not
the case. In school systems, “mainstreaming” (Dollar, 1983, p. 7) refers to what Cohen
(1985, p. 77) more generally calls the “ideology of reintegration.” In the late 1960s this
ideology challenged what was seen as antiquated, repressive, and exclusionary forms of
social control, and advocated a movement towards community rather than confinement
in institutional facilities. For inclusionists, however, there are fundamental differences
between the concepts of mainstreaming and inclusive education. On the one hand,
mainstreaming is about making the school deviants fit into the regular school (Udvari-
Solner & Thousand, 1995); it is about assimilation and normalisation, “inclusion of
place” rather than “inclusion of process” (Visser, Daniels, & Cole, 2001). For Slee
(2000, p. 4), mainstreaming is “an unquestioning engineering of children into an
unresponsive school culture.”

89
On the other hand, inclusive education is presented as “cultural politics” (Slee, 2000, p.
4); it is about a paradigm shift, an ideal to guide cultural transformations, a normative
theory of educational inclusion. The aim is not assimilation, but celebration of
diversity. Inclusive education is about designing for democratic education (Knight,
2000); it is “a precondition of a democratic education” (Slee, 2001; p. 176), which
requires “a different school culture” (Carrington, 1999, p. 257).
In their rejection of the inclusionists’ call for “total inclusion,” special education
traditionalists often stress that “one size does not fit all” (Royer, 2001, p. 129; see also
Bradshaw, 2001), and that research evidence contradicts the idea that inclusion is
always beneficial (MacMillan, Gresham, & Forness, 1996; Steinberg & Knitzer, 1992).
Zigler and Hall (1995, p. 295) contend that the effect of inclusion, far from being the
celebration of individual diversity, is often the “nonacceptance of an individual’s
differences.” They claim that “total inclusion” denies some children “their right to be
different,” and that the inclusionists’ concern for celebration of differences is better
served by segregation.
F. The Bulimia Hypothesis
From Parsons’ theory about the current ideological movement that promotes
exclusionary school cultures, and the debates between inclusionists and traditionalists, I
make the following hypothesis: my data on schools’ operations (i.e., the institutional
level of analysis) will show that, in the name of inclusion, in fact many children become
materials to be endlessly ingested and vomited by a school system suffering from
bulimia nervosa. The process will go this way: in an exclusionary school system,

90
which is increasingly intolerant of individual differences, cultural inclusion into
overarching meritocratic goals but structural exclusion characterised by all kinds of
social disablements will mean unachievable expectations for many, and entrapment into
“the dialectics of exclusion” (Young, 1999). Academic and social failure will engender
frustration and aggression, that is, the rejection of the others, then school exclusion, that
is, rejection by the others. This will increase academic failure and lead to segregation.
Then, in the name of inclusion, children will be reintegrated into an unchanged school
system, still as meritocratic and intolerant as before. Further academic and social
failure and further exclusion will follow, and so on in the bulimic system.
II - SCHOOLING AND THE MICRO-PHYSICS OF POWER
I’ve got a file big like this at the education department.22
Jim’s first day – Plan: to use appropriate language. 10.12am: one lot of points for talking in class.
Foucault’s writings cover a broad range of related themes and analyses, such as social
control, knowledge, power, and governmentality. Although contested and criticised by
many, his work has had an enormous presence and effect on the fields of both
criminology and education. It is understandable because Foucault (1977, p. 228) claims
that schools and prisons, indeed most institutions, in their history, their function, and
their processes, have far more in common that we realise.
Critical analysts have noted Foucault’s inaccurate characterisation of history, his
pessimistic, not to say cynical, interpretations, and his somewhat reductionist analyses
22 This quote (found in his file) was attributed to Jim who was placed at The Haven in 1995. The second quote is taken from his teacher’s daily observations.

91
of certain academic disciplines such as criminology (Garland, 1992). Foucault’s
characterisation of criminology as “a disciplinary knowledge which serves to legitimise
and extend modern penal power” (Garland, 1992, p. 403), and his characterisation of
schooling as a “disciplinary technology” are examples of reductionist language. At a
particular level of reality, although both characterisations appear to be valid, neither
criminology nor the school perfectly fit Foucault’s characterisations. The discipline of
criminology, as well as schooling, are more complex than Foucault’s characterisations,
and they have the potential to become something else than just an extension of modern
penal power and a disciplinary technology. However, for my purpose, Foucault’s
analysis of the school as a disciplinary technology is useful. I will use Foucault’s
microscopic lens to analyse my data on the evolution of pedagogical and disciplinary
regimes at The Haven during its 30-year history. In the discussion that follows, I not
only draw from Foucault but also from scholars who have used Foucault to analyse
schooling processes, and from Cohen’s (1985) discussion of Foucault’s vision of social
control.
A. The Power of the Microscope
What exactly does Foucault mean by “discipline?” Probably something close to the
dual etymological meaning of the word, which encompasses both power and
knowledge: power, that is, “discipline,” and knowledge, that is, “the disciplines”
(Hoskin, 1990). Foucault (1977, p. 139) describes discipline as “a political anatomy of
detail:”
The meticulousness of the regulations, the fussiness of the inspections, the supervision of the smallest fragment of life and of the body will soon provide, in the context of the school, the barracks, the hospital or the workshop, a laicised content, an economic or technical rationality for this mystical calculus of the infinitesimal and the infinite (p. 140).

92
It is the special art of the “technicians of behaviour, engineers of conduct, orthopaedists
of individuality” (p. 294):
A sort of anatomo-chronological schema of behaviour is defined. The act is broken down into its elements; the position of the body, limbs, articulations is defined; to each movement are assigned a direction, an aptitude, a duration; their order of succession is prescribed. Time penetrates the body and with it all the meticulous controls of power (p. 152).
As Gore (1998, p. 231) puts it, “Foucault’s concept of disciplinary power shifts analyses
of power from the ‘macro’ realm of structures and ideologies to the ‘micro’ level of
bodies.” His interest is not so much about who has power but about how power is
exercised (Graham, 2006):
In thinking of the mechanisms of power, I am thinking rather of its capillary form of existence, the point where power reaches into the very grain of individuals, touches their bodies and inserts itself into their action and attitudes, their discourses, learning processes and everyday lives (Foucault, 1980, p. 109).
With Foucault’s analysis of power relations at the micro level, it is possible to
investigate school discipline as “a political anatomy of details,” whereby disciplinary
power “reaches into the very grain of individuals,” therefore reaching deeper into the
level of the institution-individual nexus, one of the objects of my thesis.
B. The Disciplinary Method
How to control people better, how to control them efficiently, how to control them
completely? According to Foucault there is the “gentle way,” the ultimate recipe that
was developed during the 19th century, and which since then has been further and
further refined.
First, it is necessary to create the best conditions for control, that is, for the supervision
of every individual, using what Foucault calls “surveillance:” enclosing people in a

93
particular location such as schools, asylums, and prisons (all high surveillance
compulsory settings); dividing the area so as to give every individual their own space;
identifying sites to be used for a particular purpose; and finally, ranking individuals
according to intelligence, abilities, defects, or whatever is useful to singularise them in
relation to something you might want to call “the norm.” Now that you have the
optimum conditions for control, as an “orthopaedist of individuality” versed in “the
political anatomy of details,” through the “correct training” of bodies you are then
capable of achieving complete control over individuals’ activities. Here you must
stipulate what should be done, when it should be done, and how it should be done.
Next, you prescribe treatment, correction, and punishment for individuals in order to
reinforce prescribed behaviour. It is essential to make sure you meticulously organise
use of time and space so they are not wasted. Finally, you need to organise ongoing
exercise, that is, the repeated practice of activity, and test and examine all aspects of
practice.
1. Mechanisms of surveillance
As cornerstones of the disciplinary method, Foucault distinguishes three essential
mechanisms of surveillance: a) “hierarchical observation,” b) “normalising judgement,”
and c) “the examination.” The idea with hierarchical observation is to set up an all-
seeing eye so that pupils, patients, or prisoners can be observed at all times. This is the
“panoptic schema,” which may be used “whenever one is dealing with a multiplicity of
individuals on whom a task or a particular form of behaviour must be imposed”
(Foucault, 1977 p. 205). A hierarchical multi-lens telescopic eye (e.g., district officer,

94
principal, advisory teacher, teacher, teacher aid, etc) should “make it possible for a
single gaze to see everything perfectly” (p. 173).
According to Ball (1990a, p. 2) when Foucault uses the term “normalisation,” he means
“the establishment of measurements, hierarchy, and regulations around the idea of a
distributionary statistical norm within a given population – the idea of judgement based
on what is normal and thus what is abnormal.” Normalisation both totalises and
individualises; everyone is a specific point amongst other points that altogether form the
bell curve.
The third mechanism, the examination, makes individuals visible, therefore assessable,
describable, analysable, quantifiable, comparable, and classifiable. As an
individualising technique of surveillance, it is particularly useful for the purpose of a
meritocratic education. Because a “whole apparatus of writing” accompanies the
examination, it also produces documents, which permits the constitution of files. Whole
archives are constituted where individuals can be “maintained in [their] individual
features, in [their] particular evolution, in [their] own aptitude or abilities, under the
gaze of a permanent corpus of knowledge” (p. 190). The technique of the examination
invents a new category of objects that become an essential material for the disciplines:
“the case” (p. 191).
C. The Disciplines
As the mechanisms of the disciplinary method create a new category, the individual
person, and produce a particular knowledge of personhood, “a new army of technicians

95
(wardens, doctors, chaplains, psychiatrists, educators, social workers, criminologists,
penologists) [is required] to provide theories….” (Cohen, 1985, pp. 25-26). It is the
beginning of a network of social control, which eventually proliferates into a kind of
“carceral archipelago” (Foucault, 1977, p. 297). A scientistic web formed by a
multitude of agencies, services, and programmes, designed, run, or advised by “the
professionals of discipline” (p. 296), the modern directors of the soul, spreads
everywhere:
First the hospital, then the school, then later, the workshop were not simply “reordered” by the disciplines; they became, thanks to them, apparatuses such that any mechanism of objectification could be used in them as an instrument of subjection, and any growth of power could give rise in them to possible branches of knowledge; it was this link, proper to the technological systems, that made possible within the disciplinary element the formation of clinical medicine, psychiatry, child psychology, educational psychology, the rationalisation of labour (p. 224).
According to Foucault, the mechanisms of the disciplinary method and the power-
knowledge of their technicians infiltrate all institutional bodies, blurring their
boundaries, opening spaces of interpenetration, and engaging in more or less visible,
welcomed, or resisted invasions, to the point when
now, as medicine, psychology, education, public assistance, “social work” assume an ever greater share of the powers of supervision and assessment, the penal apparatus will be able, in turn, to become medicalised, psychologised, educationalised” (Foucault, 1977, p. 306).
The school apparatus, through the same processes of disciplinary infiltration and
interpenetration, also becomes increasingly medicalised, psychologised, and
judicialised.
1. The overarching discipline: behaviourism
For Foucault, behaviourism is the common essence of all disciplines. Although
Foucault did not discuss current disciplinary developments in school systems, extant
literature on social control in schools definitively presents behaviourism as the first-
96
choice technology utilised in the management of deviance in this institution. Drawing
from Foucault, in the scholastic art of punishment, the cane would appear as a kind of
“spectacle of the scaffold,” or, at least some remnant of it, “some trace of ‘torture’”
(Foucault, 1977, p. 16) lingering in the modern school apparatus. The deviant body was
the focus of punishment. Then, with the development of the behavioural sciences and
the introduction of behaviour modification in schools, the deviant mind appears to be
the new focus of punishment. Foucault does not distinguish between the diverse
perspectives in the behavioural sciences. For him “the sciences, analyses or practices
employing the root ‘psycho-’” all amount to new “procedures of individualisation”
(Foucault, 1977, p. 193). Although Cohen (1985) does not reject Foucault’s critique of
the individualising effect of the behavioural sciences in general, he makes an important
distinction between Freudianism and behaviourism, which Foucault does not make. For
Cohen, Freudianism is concerned with the mind, but behaviourism is concerned with
the body. This distinction is important and will assist my analysis of the evolution of
the disciplinary regimes at The Haven.
Foucault’s history of punishment, and the “three ways of organising the power to
punish” that he distinguishes, “ceremony, representation, and exercise” (pp. 130-1), and
Cohen’s distinction between Freudianism and behaviourism provide an analytical map
to survey this spiralling, rather than purely cyclical, movement from the body, to the
mind, and then back to the body. On the map one finds “the tortured body” of the pre-
Enlightenment period. Then, there is “the soul with its manipulated representations” of
the classical era, with Beccaria’s (1963) rules of “perfect certainty” and “optimal
specification,” which would make punishment appear to everyone as a natural

97
consequence rather than as an externally imposed sanction. Finally there is “the body
subjected to training” of positivist times. I will use Foucault’s ideas about the three
ways of organising the power to punish, to chart and analyse the many changes in the
ways of punishment during the last 30 years in Australian schools, and at The Haven.
The methods have included corporal punishment, behaviour modification, self-analysis,
chemical restraint, and expulsion. My analysis will help understand how power was/is
exercised, and how it changed in an increasingly exclusive society and school system.
2. Individualisation
Individualisation, or the reduction of social problems to the level of individual choice
and action, is an important theme in Foucault’s work. For him the process of
individualisation is a major effect of the new tactics of disciplinary power. Foucault
(1980a) uses the term “subjectification” to refer to the creation of specific
individualities that are known to others and know themselves as such. To be “a subject”
is at the same time to be dependent and under the control of someone else, and to be
shackled to a particular identity by the exercise of self-knowledge. In this process of
individualisation, the examination is critical. In his analysis of Foucault’s concept of
individualisation, Marshall (1990, p. 16) suggests that the examination also “identifies
to the individual the ‘true’ self, whereby s(he) becomes, classified as an object in
various ways for others and is tied to the ‘true’ self as a subjected or politically
dominated being” (Marshall, 1990, p. 16). This “true” self might be ADHD, EBD, slow
or gifted learner, or any kind of essentialised characteristic. “In normalising
procedures” the truth about oneself is “revealed” to oneself (Marshall, 1990, p. 26) so
oneself is now more easily governed, for instance, as a self-known hyperactive,

98
disruptive, special need, or low IQ student, requiring medication, social skill training, or
any other kinds of “correct training.” Amongst individualisation techniques, “dividing
practices” (Foucault, 1977) are “procedures which, through classification and
categorisation, distribute, contain, manipulate and control people.” According to
Kenway (1990, p. 174), these methods “divide people from each other and within
themselves, giving them an identity which is both social and personal,” making them an
atom of their selves in a specified social molecule.
Not only do social problems become individualised, but also individuals themselves see
and live with this view of themselves; hence the management of behaviour involves
“technologies of the self” (Foucault, 1988), that is, “the active engagement of the
subject in self-formation” (Ball, 1990b, p. 161). These technologies of the self permit
“individuals to effect by their own means or with the help of others a certain number of
operations on their own bodies and souls, thoughts, conduct, and way of being, so as to
transform themselves in order to attain a state of happiness, purity, wisdom, perfection
or immortality” (Foucault, 1988, p. 18). As Cohen (1985, p. 273) notes, social control
discourse, “controltalk,” is replete with euphemisms, micro-mystifications that are used
in certain instances to facilitate these self-corrective operations. For instance, Slee
observes how in schools the word “consequence” has replaced punishment in the
behaviourist controltalk:
Pivotal to the behavioural arsenal is the aversion to punishment as a means of countering deviant behaviour. “Consequences” become the means for ensuring student adherence to the obligations of their station. Whilst educators can grasp the qualitative difference between “time out” as a consequence rather than a punishment, this demarcation is too esoteric a distinction for even the most philosophical of disruptive students (1988, p. 19).

99
In this case, the euphemism might be intended more as a softener of blunt meaning for
re-educated teachers rather than for students. The latter, thanks to this discourse, are
apparently not being punished by an external power (teachers) they might resist, but are
punishing themselves, “freely choosing” a course of action and its “logical
consequences.” Through technologies of the self, behaviour management, that is “the
manipulation of human beings into compliant patterns of behaviour” (Bates, 1985, p.
21) is refined, and the children’s individualisation and subjugation are furthered.
Chapter 2 focussed on the structural contexts of schooling in society. This chapter
moves the focus toward an individualising and individual level of analysis. My analysis
of The Haven’s written school discipline policies, of the comments made by teachers in
the children’s files, and of materials produced by the children themselves, will permit an
examination of the mechanisms of individualisation in schooling. As I now turn to the
individual journeys of the excluded, and explore in the next chapter how these journeys
may be theorised by developmental criminologists, I will revisit mechanisms of
individualisation and again emphasise how these mechanisms serve to reduce social
problems to individual choice and action, and reinforce the processes of exclusion.


CHAPTER 4
THE JOURNEYS OF THE EXCLUDED
I - BLACK SHEEP IN THE FLOCK
In this chapter I focus on ways of theorising the journey of individuals who lived
through a process of social exclusion. I want to obtain a better understanding of the
mechanisms through which, (1) individuals become black sheep or so-called deviants,
in their group, community, and society; (2) a black sheep eventually returns to the flock,
or, on the contrary, (3) moves further away from the flock. I want to understand how, in
the collective eye of the flock, a black sheep sometimes metamorphoses into a wolf.
For theoretical tales about conforming flocks and black sheep, I turn to the shepherds of
developmental criminology.
II - THE SHEPHERDS
I look at the theories of developmental criminologists because in their tales about
conforming flocks and black sheep, the antecedents, causes, and contexts that they
associate with the likelihood of an individual following the flock or turning into a black
sheep are the very antecedents, causes, and contexts that the literature on educational
exclusion associates with the likelihood of an individual conforming or not with school
expectations and being accepted or rejected by the school community. If developmental
criminologists are correct in their predictions, quite a few of the 300 excluded students
would have followed a delinquent path. Yet, some variation within this group of
precocious deviants is to be expected, and despite many similarities, the shepherds are

102
not telling exactly the same tales. In this thesis I am interested to see which tale best fits
my data.
III - THREE TALES
There are probably as many tales about conforming flocks and black sheep as there are
shepherds; yet, most of these tales revolve around, borrow, and/or rearrange some sub-
plots from three distinct tales commonly referred to as taxonomic, static, and dynamic
theories of criminal trajectory (Blokland & Nieuwbeerta, 2005). I discuss here what
could be considered the representative archetypes of the three tales proposed by
developmental and life course criminologists (Table 4.1). For a taxonomic tale, I
examine Moffitt’s (1993) developmental dual taxonomy between Adolescence-Limited
and Life-Course-Persistent offenders. For the static tale I consider Gottfredson and
Hirschi’s (1990) low self-control general theory of crime. For the dynamic tale I turn to
Laub and Sampson’s (2003) general age-graded theory of crime. I could have
considered other examples, from developmentalists and non-developmentalists.
Scholars such as Nagin (1999), Tremblay (2006), Wilson and Herrnstein (1985),
Farrington (2002), Homel (2005), and Rutter (2003), amongst many others, have also
contributed to and expanded the field. However, their tales are similar to one of these
three plots. For instance, Nagin’s and Tremblay’s interpretations are predominantly
taxonomic, and Wilson’s and Herrnstein’s are definitely static. The perspectives
proposed by Farrington, Homel, and Rutter are dynamic.

103
Table 4.1. Commonalities and differences between the three tales: Moffit (1993),
Gottfredson and Hirschi (1990), and Laub and Sampson (2003)
THEMES COMMONALITIES
Disciplinary enterprise
“Lombrosian project:” focuses on an individual’s characteristics to find “the causes of criminal behaviour.”
Subjects Lower class males
Theoretical grounding
Social control “Erasure of social class” Gender blind
Agencies of socialisation
Family and school
Paradigm Risk and protective factors
Aggregate age-crime curve
Agreement about its shape
Offender/offending ratio
A small group of offenders accounts for the majority of crime
DIVERGENCES a
TAXONOMIC b STATIC DYNAMIC Theoretical sources
Social control (-) and biological, psychological, developmental, social learning
Social control (-) reduced to low individual self-control
Social control (+) and routine activity and rational choice
Ontogenic focus Past Past Ever-changing present Continuity vs change
Continuity for some (LCP) and change for many (AL)
Continuity for all Continuity and change within the same person
Age-crime curve composition
Heterogeneous: � Life-Course-
Persisters � Adolescence-Limited � Low-Level-Chronic
Homogeneous: � Life-long low self-
control “homo-criminalis”
Heterogeneous: � Various offending
trajectories/ not labelled
Aetiology Different causalprocesses for each trajectory group:� AL: Imitation � LCP/LLC:
Neuropsychological problems X defective parenting
One causal process: � Low individual self-
control due to defective parenting
Same set of causal processes for all offenders:� Breaking down of
informal social control
� Routine activity � Human agency
Turning points � None for LCP/LLC � Adult roles for AL
None Positive and negative turning points: � Marriage/separation � Employment/ unemployment � Inclusion/exclusion
Desistence � Not for LCP/LLC � In early adulthood
for all AL
� Never: “analogous behaviours”
� General/normative � All offenders desist
at some stage
Notes: a (-) and (+) indicate the importance of this theoretical source in each of the three theories. b AL: Adolescence-Limited; LCP: Life-Course-Persistent; LLC: Low-Level-Chronic.

104
A. Common Ground
1. Gender and class bias
While some of the leading figures in the field present their tales as general theories of
crime (e.g., Gottfredson & Hirschi, 1990; Laub & Sampson, 2003), most developmental
and life course criminologists empirically bracket in and then theoretically bracket out
two important aspects in their stories: social class and gender. All developmental and
life course criminology, indeed most traditional criminology, is about lower class males.
Empirically, its practitioners nearly always look at population of lower class boys, and it
is within this carefully chosen population that researchers examine why some follow the
flock and others become black sheep, or why some return to the flock and others turn
into wolves.
Consider two studies used by Nagin (2005) to illustrate his technique of group-based
trajectory modelling: the “Cambridge Study of Delinquent Development” by
Farrington and West (1990) and the “Montreal Longitudinal-Experimental Study of
Boys” by Tremblay and colleagues (1987). About the first one Nagin (2005, p. 17)
mentions that “the Cambridge Study of Delinquent Development (the London study)
tracked a sample of 411 British males from a working-class area of London” (emphasis
added). About the second one he writes “all teachers of kindergarten classes in 53
schools of the lowest socio-economic areas in Montreal (Canada) were asked to rate the
behaviour of each boy in their classroom” (p. 17) (emphasis added). These two studies
of aggression and crime trajectories, by selecting, like many other criminological
studies, only males from low socio-economic areas must have assumed that gender and
social class were important dimensions of the crime equation. They probably assumed

105
that to obtain a comfortable offending base rate, selecting girls from high socio-
economic areas would be a poor choice. What is remarkable is that the choice they
make is not rendered problematic or justified.
The consequences of not seeing the broader picture of criminalised offending is that
when individual characteristics such as low IQ, poor parenting, and hyperactivity are
posited as major dimensions in the crime equation, the a-priori gender/class selection
(i.e., assumption) of the study is completely forgotten. This becomes more problematic
when gender and class are theoretically discounted as important dimensions of the crime
equation and/or seen as unrelated to the individual characteristics that are deemed
important.
2. The Lombrosian project
The whole enterprise of developmental criminology is to understand variations in
criminal “propensity” and/or involvement, for a particular gender and a particular social
class, and then, on the basis of proximate “causes,” to provide governments with
recommendations for a more effective social control of this selected population of lower
class males. Garland (2002, p. 8) has proposed that modern criminology “grew out the
convergence of two separate enterprises,” which he calls “the Lombrosian project” and
“the governmental project.”23 He suggests that “one pole of the discipline pulls its
practitioners towards an ambitious and deeply flawed theoretical project (the
Lombrosian project) seeking to build a science of causes” (p. 8). The terrain in which
this pole is grounded is a science of individual differences, with all the trappings of
23 The second enterprise (the governmental project) “exerts the pragmatic force of a policy-oriented, administrative project, seeking to use science in the service of management and control” (p. 8).

106
individualisation that were mentioned in the preceding chapter. These individualist
elements of the Lombrosian project lead some developmental and life course
criminologists to say that theories that mention class structure are “antediluvian”
(Sampson & Laub, 2005, p. 183). In other words, the Lombrosian project leads its
followers to select subjects from the lowest strata of the class structure and then,
through an individual level of analysis of “the causes of criminal behaviour,” to dismiss
social class as an important context of criminalised offending.
3. Social control: the family and the school
At the core, the three tales appear as variations or extensions, or at least contain some
elements, of the classical control theory originally proposed by Travis Hirschi (1969).24
In a nutshell, lack of proper socialisation into the conventional norms of society, weak
bonds, and breaking down of informal social controls, which are normally provided by
the family and by schooling, are seen as important causes in the onset of deviancy. The
tales proposed by Gottfredson and Hirschi, and by Laub and Sampson have clear origin
in the control perspective, although Laub and Sampson add routine activity and rational
choice elements in their theory, and Gottfredson and Hirschi eventually reduce theirs to
low individual self-control. While Moffitt (1993, p. 693) is critical of control theories,
particularly in relation to “the philosophical assumption that all humans are inherently
antisocial” and that “crime must emerge spontaneously, by default, whenever social
controls are weakened,” she does include defective upbringing in her theory. However,
it is only one aspect of her theory, which also involves biological, psychological,
developmental, and social learning accounts. In any case, and perhaps highlighting
24 Although today Hirschi says he no longer subscribes to his earlier social control arguments.

107
slightly different processes, they all agree that two institutions – the family and the
school – play a crucial role in the development or inhibition of deviance, including its
criminalised forms, at least during childhood and adolescence. With various degrees of
emphasis they all identify problems at school and disrupted education as a “risk factor”
in criminal involvement.
4. The risk factor paradigm
The concept of risk factors, despite theoretical differences in relation to their types,
salience, and the durability of their effects, is another common ground in developmental
and life course criminology. Whether the important risks are considered to be
biological, psychological, familial, educational, or socio-economic, some individuals
are deemed to have riskier prospects than others, particularly when there is a
combination of several of these risks in their lives. The timing of the risks is also
regarded by some as a crucial aspect in the level of their impact.
5. The age-crime curve
The three sets of theories also agree about the shape of the aggregate age-crime curve,
which is in fact their common starting point. Offending peaks during adolescence and
gradually declines during adulthood (see for instance Farrington, 1996, and Gottfredson
and Hirschi, 1990). There are some slight differences in the peak age depending of the
types of offences, but overall the shapes of offence-specific aggregate age-crime curves
are all very similar. They equally all acknowledge, since Wolfgang, Figlio, and Sellin’s
(1972) study, that a small group of offenders accounts for the majority of crimes.
However, they differ on their interpretation of both the age-crime curve and the

108
phenomenon noted by Wolfgang et al. How they interpret these two well-documented
and uncontested patterns is where their major differences lie.
B. Divergences
1. The taxonomic tale: psychopathic wolves and normally mimicking teenager sheep
For Moffitt (1993) there are two main types of offenders: those who start early and go
on during adulthood – the Life-Course-Persistent (LCP) offenders - and those who start
in adolescence and turn away from crime when they reach early adulthood – the
Adolescence-Limited (AL) offenders. In the flock there is a small group of true black
sheep who, from the start, are seriously disturbed little lambs. Nearly all in this small
group will irremediably turn into psychopathic wolves. Most of the members of the
remaining flock, when they reach puberty, and particularly in our modern times of
institutionally enforced childhood and delayed adulthood, as they are impatient to adopt
an adult persona, will for a while imitate the small group of LCPs. If this normative and
temporary imitation did not occur, the age-crime curve would not be curved at all, but
would be flat and composed essentially of LCPs, the neuropsychologically deficient and
disturbed children who will grow into lifelong persistent criminals. The curvature is
really the effect of a mass of ALs who are quite normal, not affected at all by
neuropsychological defects, but who suddenly have mimicked and joined their LCP
peers; not for long, however, as they will return to the flock when they gain institutional
entrance into adulthood through being allowed to play adult roles. They might not
desist as suddenly as they joined, because a number of them have been “ensnared” for a
while by some of the vagaries of crime, but eventually they will. ALs are also far less

109
likely to get involved in violent crimes, which are more likely to be, in addition to all
the other types of crimes, the province of the LCPs.
So Moffitt suggests two different trajectories and two distinct aetiologies. The LCP is a
product on one hand of early, innate or acquired, behavioural and/or cognitive defects,
such as EBD and ADHD, and on the other hand, of bad parenting; one fuels the other
and involves ongoing dysfunctional parent-child relationships. Neuropsychological
problems, often shared by both child and parents, combined with child induced and/or
inherently (i.e, neuropsychologically based) deviant parenting, snowball to a point of no
return, into a psychopathological trajectory. LCP individuals are irremediably moving
further and further away from the flock, excluding themselves from the opportunities
offered by conventional society, more and more ensnared and incapable of being
included into the normalising institutions where the ALs have found a niche.
So far, in Moffitt’s tale, we have a small group of antisocial characters who are the
product of an interaction between early neuropsychological flaws and defective familial
environments leading them to a psychopathologic path of ongoing criminality and
offending. They are mimicked in adolescence by a large group of perfectly normal
individuals who eventually stop their delinquency in early adulthood. What about those
who never become delinquents? According to Moffitt this group of “abstainers” is
extremely rare. Most teenagers, whether detected or not by the criminal justice system,
engage in some delinquency; that is, most teenagers are ALs. In fact abstainers are in
some ways a bit “abnormal.” Perhaps they were lucky to have been initiated into valued
and positive adult roles in early adolescence, or they lived in environments that limit

110
opportunities to be in contact with and mimic the LCPs. Delayed puberty and personal
characteristics, such as being withdrawn and somewhat weird, which made them
unattractive, may also have excluded them from the normative networks of ALs.
Recently and influenced by the results of studies that employ such techniques as group-
based trajectory modelling, Moffitt (2003) has added a third group – the Low-Level-
Chronic (LLC) offenders – to her taxonomy. These individuals are a kind of low key
LCPs, who in terms of aetiology and trajectory resemble the hard core LCPs, but for
some reasons have not been ensnared as much in the snowballing effect characterising
the hard core LCP group. At the same time Moffitt (2003) now describes the rare
abstainers as “overcontrolled” individuals. In summary, Moffitt’s theory is a tale of
continuity for some and change for many. It is a tale about an interaction between
“kinds of people” and “kinds of contexts,” or in the criminological jargon between
“population heterogeneity” and “state dependence” (Laub & Sampson, 2003, p. 24).
Her explanatory focus is located in the past.
2. The static tale: undisciplined little lambs turn into and remain black sheep
For Gottfredson and Hirschi (1990), criminal trajectories are set up very early and
durably; by the time little lambs reach the age of 8, life-long criminal propensities or, on
the contrary, life-long straight and narrow conformist attitudes have been well
established. These criminal propensities (i.e., “criminality”) develop when the familial
institution has not consistently disciplined children into self-regulation and delayed
gratification. The result is an enduring low self-control, which is the main causal
process in any criminal involvement, whatever the nature and duration of this

111
involvement. It is not that some little lambs have neuropsychological defects, or that
something deleterious has been done to them; it is that something for their own good
has not been done to them. According to this perspective then, we are all born, as Freud
(1952) had suggested, “polymorph perverse,” unruly and selfish pleasure-seeking
creatures, always trying to avoid pain, effort, and discomfort. Unless this natural
penchant is nipped in the bud early enough, through “correct training,” that is, through
firm discipline, we will never learn to control ourselves.
Although Gottfredson and Hirschi do not advocate corporal punishment, their tale is a
variation of the old theme “spare the rod and spoil the child.” “Bad families,” defined
as lacking in self-control, do not inculcate self-control to their children who will
therefore lack self-control and do what is natural and normal when one lacks self-
control: seek instant gratification and turn to the easy option of crime. In the end,
crime is not really a profitable option, and one that actually incurs harm to offenders
themselves, but it is an easy option for un-tempered characters. If this lack of self-
control lasts forever and is the main cause of crime, the age-crime curve should be flat.
Gottfredson and Hirschi totally reject taxonomic tales. For them there is no such thing
as LCP and AL groups, each with different aetiologies and trajectories; the age-crime
curve is strictly invariant. In a way, although they would reject any notion of typology,
they say that every criminal is a LCP. So why is not the age-crime curve flat? The age-
crime curve is not flat because all the criminals, due to a not yet well-understood
maturation process, eventually appear to do fewer crimes in adulthood. However, it is
not that they suddenly have more self-control, that their criminal propensities have

112
diminished; it is only because they now engage in antisocial behaviours that are not
criminalised or are less visible: cheating on their spouse, neglecting their children,
abusing alcohol, being unreliable at work, losing their job, bludging on the system,
creating road accidents, all types of deviant behaviours which are “analogous” to crime.
Their tale is a tale about one cause only and one type of criminal only: the low self-
control general “homo-criminalis:”
In sum, people who lack self-control will tend to be impulsive, insensitive, physical (as opposed to mental), risk taking, short sighted, and nonverbal, and they will tend therefore to engage in criminal and analogous acts. Since these traits can be identified prior to the age of responsibility for crime, since there is considerable tendency for these traits to come together in the same people, and since the traits tend to persist through life, it seems reasonable to consider them as comprising a stable construct useful in the explanation of crime (pp. 90-91).
Once the pattern has been set in childhood, there are no events or turning points that
will change this pattern. The big culprit is the dysfunctional family with its single
mothers and fleckless fathers. Paradoxically, the family is also a sacrosanct institution.
Recall that for Gottfredson and Hirschi the problem is not that something bad has been
done to the child, but that something good (proper discipline) has not been done to the
child. The family is in fact a safe haven where violence is unlikely to occur. For
instance, using old figures (1978 for a book published in 1990), they seem to reverse
what is known (e.g., Mooney, 1996) about violent and sexual offending in the home:
Violent crimes generally take place outside the home …. In both official and victim survey data, most violent crimes (except homicide) are committed by strangers and only rarely by relatives … (p. 16).
The venerated family cannot in their view be a site for violence and crime because
“[f]amily members and close friends apparently rarely jeopardize long term relations by
committing or reporting rape” (p. 36). While Moffitt’s theory was a tale of continuity
for some and change for the many, Gottfredson and Hirschi’s theory is definitely a tale
of continuity for all. It is a tale about “kinds of people;” in the criminological jargon,

113
about “population heterogeneity” (Laub & Sampson, 2003, p. 24). Its focus is clearly
on the past.
3. The dynamic tale: nothing is set in concrete, black sheep return to the flock
Like Gottfredson and Hirschi, Laub and Sampson (2003) reject taxonomic tales. For
them, the same causal processes are at work for all offenders. In their view, however,
there is more than just lack of self-control, and more importantly the trajectories are
never fixed because important events like getting a job, getting married, becoming a
parent, losing a job, or separating are turning points that can transform the course of a
life journey. Unlike Gottfredson and Hirschi, they do not believe that the age-crime
curve is invariant. On the one hand, they agree with “taxonomists” that there are
different trajectory groups in relation to crime in general and specific offences, with
different peak age, levels, and length of offending. On the other hand, they maintain
that desistance is eventually the norm.
For them, there are no such groups as LCP and AL or any other groups, each with their
different aetiologies. Based on the findings of their extension of the Glueck and
Glueck’s (1950) study, they firmly reject Moffitt’s hypothesis and state that “[w]hat is
most striking about the persistent offenders we interviewed is that their childhood traits
are the same as those who desisted from crime” (p. 194). Put another way, they say that
“it is true that most adult offenders have experienced serious childhood risks, but it is
also true that many individuals who have experienced serious childhood risks have not
turned into adult offenders,” and they ask why.

114
Although the pathways and the dynamics might be different, for all offenders, what
explains both onset and desistence are the same causes: informal social controls,
routine activities, and human agency. They are critical of the “childhood determinism”
that they detect in both Gottfredson and Hirschi’s, and Moffitt’s tales. They contend
that if it is true that levels of childhood risks do influence levels of offending, childhood
risks do not predict groups of offenders. They are cautious of the notion of criminal
“propensity,” which they consider as an all too convenient “black box;” therefore, they
are sceptical also about the notion of fixed traits. They argue, for instance, that changes
in the quality or strength of social ties can change traits like self-control. They do agree
with Gottfredson and Hirschi that lack of familial social controls is an important factor
in the onset of antisocial behaviours and criminal involvement during childhood and
adolescence, and they even accept Moffitt’s idea that particular traits such as
neuropsychological problems might play some role; however, they argue that these
predictions only work up to early adulthood, but not after.
Laub and Sampson are wary of traditional developmentalism, of the idea that something
already present is unfolding. For them, this idea is encrusted in taxonomic tales. For
similar reasons they regard the risk factor paradigm with suspicion because the latter
tends to focus deterministically on childhood risks. Unlike Gottfredson and Hirschi
who argue that turning points are spurious and merely a matter of self-selection
associated with levels of criminality, or Moffitt who contends that LCPs are unlikely to
use such events positively, Laub and Sampson believe that events such as marriage can
deflect any male offender from a criminal career. They also attribute a stronger
influence to the school, as an institution providing informal social controls, than Moffitt
115
and Gottfredson and Hirschi who put greater emphasis on the family. They note, for
instance, that “school attachment had large negative associations with delinquency,
independent of family processes” (Sampson & Laub, 2005, p. 164).
Overall Laub and Sampson see possibilities for change at any time across the life
course. Involvement with various institutions, such as the family, the school, the
military, marriage, and work can become, at different stages of life, turning points
facilitating male desistence from crime through processes that help tighten informal
social controls, change the types of routine activities, build social capital, and make
identity change possible. Turning points, however, can also take the form of traumatic
and negative events that reinforce or precipitate involvement in crime if, for instance,
they alienate the individual from these socialising institutions and weaken or sever
social ties. Furthermore, human agency complicates the whole process to the extent that
turning points have to be seen as “simultaneously structural and subjectivist.” Crime,
for instance, can be “a calculated and articulated resistance to authority” (2003, p. 54);
however, human agency is not a free-floating process, it is “path dependent as well as
situationally embedded” (2003, p. 54). In summary, Laub and Sampson’s theory is a
tale of both potential continuity and change within the same persons. Its focus is on an
ever-changing present.

116
IV - HYPOTHESES FROM THE TALES
A. Shared Predictions
With my data on the socio-educational profiles of the children from The Haven and a
complete record of their official contact with the Queensland criminal justice system,
during childhood, adolescence, and adulthood, I can examine the propositions made by
the three tales and formulate hypotheses. The first hypothesis is quite general and is
based on what the three tales have in common: the importance of the early years in
predicting delinquency in childhood and adolescence and the relevance of childhood
risk factors and family social control variables (i.e., weak controls) as strong predictors
of crime up to early adulthood. The literature on educational exclusion, particularly
exclusion from primary school, suggests that similar factors are often present in the life
of children expelled from regular schools. The fact that all the children in my study
were removed from regular primary school is already an indication of a potent risk. The
first hypothesis, therefore, is that a large proportion of them should have records of
antisocial behaviours and a criminal history spanning at least from childhood to late
adolescence.
There is another common aspect between the three tales that my data might be able to
address. This is the question of gender and social class that the three tales have
bracketed out by ignoring gender, and by regarding social class as irrelevant. While the
literature on educational exclusion does point to an overrepresentation of boys, low
socio-economic circumstances, and racial-ethnic minority group members, as
demographic characteristics of excluded students, my research design did not a priori

117
select its population on any other criteria than removal from regular primary school and
subsequent placement in The Haven. Furthermore, my study includes detailed
information not only on the 300 students, but also on their parents and siblings, and
covers a period of 30 years. Thus, there is no reason to presume homogeneity or
heterogeneity in this historical population in relation to either gender or social class. In
my study, whether the results reveal homogeneity or heterogeneity in the gender and
class composition of the population are important empirical and theoretical questions. I
can therefore examine some questions about gender and class in relation to both school
exclusion and crime.
B. Taxonomic Predictions
Given the initial risk shared by all these children, the next question is: what would
explain any variation from an expected pattern of general antisocial behaviour and
criminal involvement? Some hypotheses can be formulated from the distinct elements
in the three tales. The literature on educational exclusion suggests that early
neuropsychological problems and dysfunctional families are important characteristics in
the profile of children who are excluded from primary schools (e.g., Hayden, 1997).
Moffitt’s tale proposes that these two sets of variables are key causal factors in the
development of persistent offending. I therefore expect that most of the 300 individuals
in my study have followed the path of Life-Course-Persisters. According to this tale, it
is unlikely that they have desisted from crime and antisocial behaviours. On the
contrary, they probably have accumulated problems to such an extent that their journeys
will have the hallmark of “psychopathology,” including violent crimes, substance abuse,
mental illness, suicide attempts, and unemployment. In a word, they should have

118
experienced further and further exclusion from the flock, without any sign of positive
turning points in their life course. There should be few Adolescence-Limited offenders
in this population. Another possibility might be that those who have not followed the
hard core LCP path only had one element of the risky cocktail: neuropsychological
problems but effective parenting, or deviant parenting but an absence of
neuropsychological problems.
C. Static Predictions
From Gottfredson and Hirschi, similar hypotheses would be made. Being excluded
from primary school, which is not something that occurs after only one or two odd
infractions to school rules, but is probably the outcome of a relatively long history of
deviant acts, should be, for Gottfredson and Hirschi, a clear sign of lack of self-control.
However, any EBD or ADHD connection, suggested by the literature on educational
exclusion, will more likely be the result of defective child rearing by parents who
themselves lack self-control than caused by neuropsychological defects. The stories
should be replete with accounts of low self-control not only amongst these children but
also amongst their parents and carers. They should have all engaged in antisocial acts,
crime, and/or analogous behaviours of all kinds, violent and non-violent, and no
particular events would have deflected them from this path. However, most of the
violent offending and victimisation should have happened outside the home.
D. Dynamic Predictions
From Laub and Sampson we should expect different patterns of offending, both in terms
of levels and timing. This will depend on the severity of childhood risks, not on the

119
types of risks. Groups of offenders will not be distinguishable on the basis of
fundamentally different causal processes. In any case most individuals will desist at
different stages. Furthermore, deviance will be moderated and deflected when tighter
social controls and structured routine activities enter the picture, or precipitated or
reactivated when such controls and activities weaken or disappear. So it is possible that
the period spent at The Haven, if it did provide such controls and activities, would have
coincided with a decrease in deviant behaviours. What I intend to explore in the data
are structural turning points that either connect the individuals to or disconnect them
from socialising institutions, events that provided social supports and greater scope for
exercising choice, or on the contrary that alienated them and restricted their exercise of
choice.
Exclusion from school should be marked by a greater likelihood of deviant behaviours,
and conversely, successful reintegration should lessen deviant behaviours. Laub and
Sampson suggest that even in the case of severe childhood risks, events, which at any
stage provide a bond (i.e., reconnect the individual) to conventional society, play a
crucial role in desistence from crime. However, nothing will be set forever. From this
dynamic perspective, one would hypothesise that the degree of strength of the informal
social controls (familial, educational, marital, and occupational), and social support and
structured conventional routine activities will be the major factors in shaping their
journeys.


PART II:
METHODS AND SETTING


CHAPTER 5
METHODS
The overarching goal of my research is to document and analyse the educational and
social journeys of 300 individuals who, between 1973 and 2003, were removed from
regular primary schools and placed in a withdrawal unit. My aim is to explain the
relatively recent and growing phenomenon of educational exclusion, and to examine if
this new phenomenon is related to other forms of exclusion, particularly crime and
criminalisation, and, if so, in which ways. To address these theoretical questions I seek
to provide answers to these empirical questions:
1 - Who were these individuals?
2 - Where did they come from?
3 - What happened to them, including during their transit through the withdrawal
unit?
4 - Where did they end up?
Theoretically, my aim is to relate their stories and journeys to the literatures on school
exclusion, social exclusion, and disciplinary control in schools. The method I use is an
archival analysis.
I - RATIONALE FOR AN ARCHIVAL ANALYSIS
A prospective longitudinal study of excluded students was out of reach. A more
suitable and economic design was a retrospective investigation of the journey of
students who had been removed from mainstream schools and placed into a withdrawal

124
unit. The literature has pointed to the existence of withdrawal units and suggested that
placements in such facilities were often preceded and followed by official suspensions
and exclusions. In 2003, to determine whether my research plan was feasible, I
contacted the principal of a withdrawal unit located in the Brisbane region. I learned
that the unit had been in operation since 1973, and from this date had enrolled 300
students. Moreover, the unit kept good records on its student population on a variety of
domains, including familial, social, and educational information. For reasons of privacy
and confidentiality I have named the unit “The Haven.”
I view The Haven as a train station, where former students had all transited, and from
which it was feasible to retrace their journeys. In 2003 the age range of this historical
population of excluded primary school students was between 6 years old and 40 years
old. Not only was it possible to examine the journey of different cohorts, but also to
identify any changes in the characteristics of excluded students during the last three
decades. Another great advantage of this method was that it provided me with the
opportunity to examine a type of intervention for challenging students, which has been
the object of many debates among educationists.
Tracking former students to conduct interviews with them was not only plagued by
ethical and legal issues about privacy, but also extremely precarious. Finding people,
two or three decades after their transit through The Haven, would be difficult.
However, with The Haven’s records on these former students, it was feasible to track
another set of data, namely any official criminal records. To get access to juvenile
criminal histories from Queensland Police Service, it was first necessary to contact the

125
Department of Families, which held some parts of these juvenile offending records, and
obtain their approval for the study. Soon after I received approval, I asked the
Department to do a search of the 300 individuals because I wished to know how many
had been in contact with family services. Eventually it was discovered that about three-
quarters of them had had such contact. When the Department of Families agreed to give
me access to all its records on these individuals, and Queensland Police Service also
agreed to let me examine the entire criminal histories of the cases in my sample, I
abandoned the idea of attempting to track individuals for the purpose of interviewing
them. Matching the three sources of official information greatly expanded the prospect
of documenting and analysing the journeys of the excluded.
II - GETTING ACCESS
For ethical and legal reasons related to questions of privacy, it is extremely difficult to
get access to the files (i.e., identified data) kept by institutions on individuals, and to
match, across institutions, the information contained in these individual records.
Separate institutions may provide researchers with already processed and de-identified
data for the purpose of large aggregate population analyses, but they rarely grant access
to identified information and allow this to be used for accessing other information from
other institutional sources. However, after protracted negotiations, many setbacks and
interruptions, and thanks to the support of influential individuals in the Education
Department, who shared a keen interest in the goals of my research, in June 2003 full
access to the students’ school records was granted. In December 2003, assisted by a
Policy Research Officer very sympathetic to the aims of my study, negotiations were

126
greatly facilitated and my application to the Department of Family Services (DFS) for
social welfare records was also approved. The Queensland Police Service (QPS)
informed me that its approval to access complete criminal histories would not be a
problem once I had approval from DFS. I expected that obtaining access to these
criminal histories would be a simple formality, but it turned out not to be the case.
During 2004, following an independent enquiry by the Crime and Misconduct
Commission (2004) on the systemic abuse of children in care in the state of Queensland,
DFS was involved in a complex process of restructuration. In mid-2004, two distinct
departments formed out of the DFS restructure: the Department of Communities
(DOC) and the Department of Child Safety (DCS). The initial approval I had obtained
from DFS was now considered invalid and annulled. New negotiations had to be
pursued, and data collection stopped. Because the correct process stipulated by QPS
policy needed to be followed and entailed prior approval by DOC, QPS was no longer
able to provide access to the criminal histories. The whole study was put into jeopardy.
It was not until April 2005 that I received formal approval from DOC, DCS, and QPS
and was able to resume data collection from these three departments.25
III - DATA SELECTION, CODING, AND MATCHING
The major aim of my study is to document and analyse the socio-educational
trajectories of the excluded. By social trajectories I refer to the individuals’ entire life-
course, potentially from birth to their current circumstances. Elements of the social
25 Although the Department of Families Services (DFS) no longer exists and had changed its name several times during the period covered by my data, for ease of understanding I use the term DFS throughout the thesis, regardless of which name was in use during the periods I refer to.

127
trajectories that I am interested in comprise the students’ family background and
history, and the state of their health during their development. Depending on their age
today, other elements include whether they found employment or experienced
unemployment after they left school; their current occupational situation; major events
and relationships in their lives, traumatic or positive; whether they married and have
children; and whether they have had contact with the police for involvement in criminal
activities.
Educational trajectories refer to the whole schooling history. The schooling history
comprises elements such as the type and number of schools the children frequented; the
children’s academic achievement; whether they repeated school grades; whether they
had been officially suspended and/or excluded before their referral to The Haven; how
the schools have addressed the children’s problems and responded to their challenging
behaviours; whether the children were suspended and/or excluded again after their
transit through The Haven; what happened to them in The Haven; and whether they
dropped out of school or graduated from Year 12 and went on to tertiary education.
This description of what is meant by socio-educational trajectories is not exhaustive.
Also relevant are the socio-economic and political contexts in which the trajectories
were embedded, and I consider the ever-present individual-institutional nexus and its
impact on the trajectories. Some of these elements can be categorised and quantified,
and subsequently arranged to analyse particular patterns between and within
individuals, with techniques such as Group-Based Trajectory Modelling. Some cannot
be quantified and pertain to processes, relationships, discourses, and contexts that are

128
better examined through thematic analyses using qualitative data. In both cases,
however, the sequencing of these elements was a major structural aspect to take into
consideration during the data gathering and coding.
Most of the raw information from the three Queensland departments was in the form of
text rather than numbers. This text had been produced for the purpose of administrative
and casework activities, not for research and analysis. Piles of documents, many
handwritten and from multiple sources, needed re-ordering before the story they were
telling could be understood. Moreover, it was necessary to read all the documents to
determine if they contained relevant or new information or were just duplication. Faced
with this immense and daunting task, here is how I proceeded. Tables 5.1 and 5.2
present the number of individual files available from the three sources and the
combination of these files across the three decades.
Table 5.1. Number of individual files available from each source across the three
decades
Sources of data a
1st decade 1973-1982
N=57 studentsN (%)
2nd decade 1983-1992
N=98 studentsN (%)
3rd decade 1993-2003
N=145 studentsN (%)
Total 1973-2003
N=300 studentsN (%)
The Haven 0 (0) 48 (49) 145 (100) 193 (64)
DFS 33 (58) 75 (77) 119 (82) 227 (76)
QPS b 37 (65) 78 (80) 67 (46) 182 (61)
Notes: a DFS=Department of Family Services, QPS=Queensland Police Service.b I have complete information on criminal histories; thus, the number of QPS files is an indication of the proportion of individuals who have been in contact with the criminal justice system.

129
Table 5.2. Combination of individual files available from each source across the three
decades
File combination a
1st decade 1973-1982
N=57 students
2nd decade 1983-1992
N=98 students
3rd decade 1993-2003
N=145 students
Total 1973-2003
N=300 studentsNo files 14 9 0 23
The Haven only 0 2 22 24
DFS only 6 6 0 12
QPS only 10 4 0 14
The Haven & DFS 0 3 56 59
The Haven & QPS 0 8 4 12
DFS & QPS 27 31 0 58
3 types of files 0 35 63 98
Note: a DFS=Department of Family Services, QPS=Queensland Police Service.
A. Excavating the Evidence
Excavating the evidence was long and painstaking, but an indispensable
“archaeological” activity. The process of gathering, coding, and matching information
on multiple domains for 300 individuals, across a span of 45 years,26 and four
departments was a huge, daunting, and complex task. It took more than three years of
dedicated efforts, involving me and five research assistants to assemble a complete
dataset and reconstruct the developing journey of these 300 individuals.
At The Haven, this process first necessitated a thorough re-organisation of their
archives. From June to August 2003, I worked in a narrow and stuffy room, to find and
properly store the students’ files, which had been haphazardly placed with other
documents, stationery, and bric-a-brac of school material. In this dusty and sweaty
atmosphere, I moved and re-arranged the shelves and loads of documents that I sorted
out and labelled for further examination.
26 The oldest individual was born in 1960, and I collected data from DFS and QPS up to year 2005.

130
The Haven’s archive room after the re-organisation. The students’ files are visible in the centre picture on the shelves in front of the author. All photos in this chapter were taken in 2006.
During the whole of 2004, helped by a post-graduate student from Griffith University, I
spent every working day in a DFS office, searching, ordering, reading, and coding
individual case files. During the weekends, with two other helpers, I worked on the
school files. It was not until January 2005 that I obtained a research grant from the
Queensland government to be able to pay my research assistants, including two new
people for the collection and coding of the QPS criminal histories. The management of
this extensive research process entailed much movement between settings as well as the
training and supervision of my assistants. It is not surprising that few researchers have
attempted such a wide-ranging investigation.
B. The Haven Stories
I discovered and restored a total of 193 files from The Haven, some very short stories,
other voluminous novels, the volume increasing as time passed. All The Haven files

131
from the 1st decade (1973 to 1984) were missing.27 The first available file had been
written in 1985 and the last one in 2003, spanning a period of 19 years. Although the
individual files of the 1st decade were missing, they were not the only source of
information about students. The Haven had kept the same enrolment book since 1973,
which, for all students, included: (a) first and last names, (b) date of birth, (c) gender,
(d) dates of entry to and exit from The Haven, (e) address, and sometimes occupation,
and religion of parents or carers, (f) sometimes the marital situation of parents, (g) the
school where the student had been reintegrated, and (h) for the first 14 students of the 1st
decade their occupational or marital circumstances in early adulthood.
1. Historical sample
To develop a way to code the information in the files, I randomly selected one from
each school year across the 2nd and 3rd decades, a sample of 18 cases.28 The first task
was restoration, which involved cleaning the file of any duplication, and
chronologically ordering all the dated documents so the file could be read as a
developing story. Documents that were not dated were incorporated in their most likely
chronological place in the file if, after a cursory reading of the whole story, their content
indicated the approximate period during which they had been produced. From this
preliminary analysis, I discovered that most of the 18 files could be organised into two
or three phases: (a) an early phase of information about the child before placement at
The Haven, which sometimes included information pertaining to very early events, just
27 I tried to find these files. The Senior District Guidance Officer told me that they were not at the District Office. She was not aware of what happened to the files of this period, but informed me that guidance files can be destroyed 25 years after the child’s date of birth. 28 The files for the school year 2003 were not finalised so the sample spanned 18 years.

132
after the birth of the individual; (b) the phase when the child was placed at The Haven;
and (c) a third phase (generally very short) after the placement at The Haven had ended.
There were a total of 3,703 pages in the 18 files, an average of 206 pages per file.
Across these 3,703 pages, there were 150 distinct types of documents, although many
documents contained similar information. Eventually these 150 documents could be
classified under 18 categories; five of 18 pertained to the early phase (before placement)
and 13 to the placement period (see Table 5.3 for a description of the 18 categories of
documents). A few documents were dated after the period of placement; however, they
were scarce, often closely followed the exit date, and were usually associated with
reintegration to another school. Some were brief notes or a short correspondence about
the student’s educational and/or familial situation a couple of years after exit from The
Haven.
Table 5.3 describes the content of each of the 18 files in the sample. As can be seen, the
files grew increasingly fatter over the years. Most of the time-sequenced qualitative
data that I collected came from administrators’ notes (i.e., principals and administrative
staff from The Haven and sometimes the referring schools), teachers’ case notes on a
child’s daily and weekly progress, and the homebook of contacts between The Haven’s
teachers and the student’s carers.

133
Tabl
e 5.
3. A
mou
nt o
f rec
ords
in a
sam
ple
of 1
8 fil
es fr
om T
he H
aven
File N
o.
93
107
114
121
130
135
141
155
160
165
168
190
213
224
238
251
267
279
Tota
l
En
try y
ear
1985
1986
1987
1988
1989
1990
1991
1992
1993
1994
1995
1996
1997
1998
1999
2000
2001
2002
Typ
e o
f D
ocu
men
ts
Exit
year
1985
1988
1989
1988
1991
1990
1991
1993
1993
1995
1995
1996
1998
1999
1999
2000
2002
2002
Pre
-Th
e H
aven
(sh
eets
a)
All
refe
rral
info
rmat
ion
33
24
16
25
26
66
18
17
51
26
56
23
31
28
20
27
25
51
Pa
renta
l co
nse
nt
form
s
2
21
22
13
13
32
65
6
Psyc
ho/e
duca
tional
tes
t re
port
s 1
41
12
312
Feed
er s
chool’s
dis
ciplin
e re
port
s 8
16
220
35
Rei
nte
gra
tion a
gre
emen
t at
refe
rral
1
11
11
21
1To
tal
pre
-Th
e H
aven
3
32
52
02
62
86
91
92
75
43
06
52
53
73
24
33
84
39
37
07
Th
e H
aven
peri
od
(sh
eets
a)
Stu
den
t's
photo
1
12
11
11
12
Tax
i ar
rangem
ent
1
2
31
26
511
15
722
29
24
29
21
25
Beh
avio
ur
& a
cadem
ic p
rogre
ss r
eport
s 2
12
64
10
83
22
35
72
4
14
Oth
er b
ehav
iour
pro
gre
ss r
eport
s 5
15
11
5 3
3
19
Beh
avio
ura
l m
anag
emen
t pla
ns
62
12
23
23
415
12
10
4Educa
tional
pla
ns
610
13
21
15
3Sch
ool w
ork
s &
educa
tional
tes
t re
port
s 4
11
434
99
25
70
38
Oth
er a
gen
cies
’ te
st r
eport
s 2
1
213
4
14
21
12
Rei
nte
gra
tion p
lans
42
11
78
29
10
23
7
410
15
Corr
esponden
ce w
ith p
aren
ts
32
13
15
21
13
74
35
47
25
61
33
Rec
ord
of
com
munic
atio
n incl
phone
calls
14
10
41
20
38
815
43
41
1
6 5
15
Beh
avio
ura
l sh
eets
by
studen
t 33
19
529
34
26
933
214
Mic
ro-m
onitori
ng o
f beh
avio
ur
2
5
8
19
911
21
33
32
44
48
36
39
To
tal
Th
e H
aven
peri
od
1
76
39
74
22
11
08
61
05
44
99
83
27
12
02
28
21
75
25
94
11
21
86
To
tal w
ho
le f
ile
s
heets
a5
08
82
93
37
09
02
91
13
15
97
41
64
10
83
08
23
43
25
21
33
02
50
42
89
3To
tal w
ho
le f
ile
p
ag
es
b5
19
13
03
47
29
23
91
25
17
19
51
94
13
84
07
29
46
13
27
83
93
58
63
70
3
Note
s:a
A s
hee
t of
pap
er is
counte
d a
s one,
reg
ardle
ss o
f w
het
her
it
is s
ingle
or
double
sid
ed.
b A
pag
e co
nsi
sts
of
a si
ngle
sid
e of
a sh
eet
(i.e
., a
double
-sid
ed s
hee
t is
counte
d a
s tw
o p
ages
).

134
The second task involved a careful reading of all the documents in the 18 sample files to
delineate general domains of information within each file and to assess if there was any
consistency between these domains across files. I discovered that most files (not all of
them) covered seven distinct domains from which detailed coding of elements was
feasible: (a) the student’s familial, (b) psychosocial, (c) cognitive, and (d) health
profiles; (e) the sending schools’ disciplinary strategies; (f) pre-placement programs and
support history; and (g) academic history and social-educational progresses at exit.
2. Coding
Drawing from the literature on school exclusion, the third task involved asking a series
of questions within each domain and determining if the file provided an answer. A File
Questionnaire was developed, which included a total of about 200 questions/variables
across the seven domains (Appendix 1). In addition, a Codebook listed the nature of the
information used to code each variable.29 The coded variables were in these areas:
1 – Familial profile: student’s racial-ethnic classification; carers’ occupation(s); family
structure (e.g., parents living together or separated, number of siblings); family
dynamics (e.g., history of abuse, domestic violence); relationship quality between carers
and student; parental discipline; health of biological parents and siblings; involvement
of parents, siblings, and student with the criminal justice system; and traumatic life
events such as the death of a parent, sibling, relative, or friend.
2 – Psychosocial profile: student’s temperament, behaviours, and relationship with
peers and teachers.
29 The codebook is a voluminous document of 78 pages, available from the author on request.

135
3 – Cognitive profile: various facets of the student’s cognitive functioning and learning
difficulties.
4 – Health/medical profile: various elements of the student’s health status including the
use of medication.
5 – Pre-placement schools disciplinary strategies: types of disciplinary controls used
with the student including official suspensions and exclusions.
6 – Pre-placement programs and support history: educational supports including who
had provided support, to whom, where, and the nature of the support; and supports
provided by other professionals (e.g., psychologists, psychiatrists, social workers).
7 – Academic history and social-educational progresses at exit: schooling history;
academic performance at referral to and exit from The Haven; and level of academic
and social-behavioural improvement at exit.
Once the prototypes File Questionnaire and Codebook were designed, based on the
sample of 18 files, the remaining school files were read and coded. After cleaning and
chronologically ordering the documents in each file, a first reading was carried out to
highlight, using a colour coding system, the relevant information in the file within the
seven domains to be coded. Then a second reading was necessary to code the
information into the File Questionnaire, following the specifications of the Codebook.
Short notes about new elements discovered in the files and justifications for coding
decisions were also entered into the File Questionnaire. It took about 12 hours per case
to prepare and to code the available data from The Haven.

136
3. Qualitative data
In addition to quantifying and coding data from the files I also copied notes from the
file (i.e., verbatim quotes from the file) about referral and reintegration processes,
problems, particular pedagogies, strategies, relationships and events as they applied to
each student. Such notes were collected from various documents in the files, and each
time they were dated and the source was recorded (e.g., psychologist, psychiatrist,
principal from school X, etc). A great part of these data also came from (a) The Haven
case summary notes (e.g., records of communications between The Haven and carers,
schools, health professionals, etc), (b) The Haven teacher’s daily records of the
student’s academic and behavioural progresses, and (c) the “homebook” of daily
communication between The Haven teacher and the carers.
The files also contained a detailed recording of the effects of the disciplinary regime on
the student’s behaviour, every day and all day long, during their placement. These
documents were analysed, and from them I designed the “behaviourogram” of a typical
student, which is reported in Chapter 6. When students misbehave, they must complete
a “Behaviour Sheet,” in which they write in their own words what they were thinking,
feeling, and doing at the time, as well as how they plan to change their behaviour. The
Behaviour Sheet includes a self-reflective account of the needs the child was trying to
fulfil through his/her misbehaving. Four needs are listed on the sheet provided to the
student: love, power, fun, and freedom. I analysed these Behaviour Sheets and
recorded how many times the students had selected each of the four needs.

137
During the three months that I spent at The Haven excavating the files and re-ordering
the archive room, and my frequent visits afterward, I recorded some of my observations
about the interactions between staff and students, as well as some of the conversations I
had with the principal, and the teaching and administrative staff of The Haven. My aim
was to gather additional information on teachers’ morale, on their interpretation of the
phenomenon of educational exclusion, the problems they encountered when teaching
these children, the relationship between the children’s carers and The Haven, and the
process of reintegrating the children into regular schools. I did not observe interactions
between the children and their teachers during class time, but I did during lunch breaks
and playground activities. Many times I also witnessed children being put into the time-
out room after a violent episode.30 Finally to get a better picture of The Haven’s history
and its pedagogical regimes, in addition to several interviews with the current principal,
Anna, (1999-2006) and with John, a teacher from the Centre for Alternative Programs
(CAP),31 I conducted an informal interview with Steve, a former staff who had taught at
The Haven between 1994 and 1998 and had been the principal from 1998 to 1999.32
C. The DFS Stories
Because The Haven’s files had the students’ names, it was feasible to attempt to match
the files with potential records at DFS, and to explore the unfolding developmental
trajectory of some students. Due to several recording systems developed over the years
by DFS, this search was a complex and long process. I discovered that 227 individuals
in the study (76%) had had contact with DFS. Contact with DFS included events such
30 I describe the time-out room, the reasons for, and the processes accompanying the confinement of the children in this room in Chapter 6. 31 I explain the role of the Centre for Alternative Programs and its relationship with The Haven in Chapter 6. 32 All these names are pseudonyms.

138
as DFS notification of the need for child protection against neglect and emotional,
physical, and sexual harms; placement outside the natural family; and juvenile
offending. DFS can be involved at any stage of a child’s development, from birth to the
time of legal majority when the child reaches 18 years of age. Involvement with DFS
was sometimes short-lived, and sometimes, it started at birth. In the case of children
who became wards of the state, it ended only when they reached 18. Some students of
The Haven have since given birth to children, who themselves have had contact with
DFS.
1. Recording systems
For every DFS client, a paper file is opened when the first contact with the Department
occurs. Since 1988, an electronic file has also been created, which standardises some of
the information contained in the paper file. In terms of quantity and quality of
information, the paper file is a better source, although in terms of ease of data collection
process, the electronic file is better. Because systematic electronic recording only began
in 1988, any contact with DFS that started and ended before 1988 did not have a
corresponding electronic record. If the case continued after 1988, the electronic record
did not include information about events that occurred before 1988. These fragmented
recording systems meant that, for any former student from The Haven born before 1988,
a search for a potential paper file had to be considered. Although DFS had agreed to
give free access to electronic records, access to paper records incurred an administrative
search cost. While paper files contained the best information, in order to reduce the cost
and time involved in data collection, I limited my request for potential paper files to
students born before 1988, a total of 200 students. The search revealed that for 132 of

139
these 200 students a paper file was available. Files sizes ranged from just a few pages
(rarely) to documentation that was a metre high, depending on the complexity of the
case and the duration of departmental involvement.33
2. Selection and coding of DFS data
The coding frame for DFS data included new domains such as child protection,
placements (e.g., in foster care and institutions), proved juvenile offending histories,
and allegations of unofficial offending. The files contained a great variety of
documentation originating from different sources: (a) departmental staff and systems
such as DFS caseworkers’ notes and child protection notifications, (b) other agencies
such as the criminal justice system (CJS), schools, health, and child care institutions,
and (c) the client and client’s family, such as records of their correspondence. Often
these records provided detailed accounts not only of the student’s but also of family
members’ (parents, siblings, and relatives) life-course. DFS records also allowed me to
fill in gaps of missing data from the school files across the seven domains. While
normally data on any case would not extend beyond the legal majority of the client,
when former students from The Haven had children of their own, and these children
were themselves clients of the Department, additional information could be gathered.
The result was that in a number of cases it was possible to reconstruct the life course of
former students from The Haven beyond their legal majority through their children’s
records.
33 Around 30% of the files were a metre high.

140
3. DFS biographies
For all the cases with a DFS contact I completed a biography, which, depending on
available data, included the following: the student’s ethnic background, child protection
notifications and placements information, proved juvenile offending history, alleged
unofficial offending, suicide attempts history, medical history, and student’s, parents’,
and siblings’ life course histories. In Chapter 10, I draw on these biographies to
illustrate and analyse different pathways featuring educational exclusion, social
exclusion, and offending and/or inclusion and desistence from offending.
D. The QPS Stories
The Queensland Police Service had agreed to give access to the entire criminal history
(from age of criminal responsibility, which is 10 years old, to the year 2005) for any
individuals in the study with such a history. Here too the search was complicated by
changing record systems during the last 35 years (the oldest former student from The
Haven was 10 years old in 1970), and by changing surnames and aliases. Of the 300
students, 182 had been officially in contact with the CJS and 178 (59%) had an official
criminal history.34
Criminal histories are a record of all offences35 that are processed through the
Queensland criminal justice system,36 which throughout the thesis I refer to as “official
criminal or official offending histories.” They include offences dealt with through
34 For four individuals their QPS files did not involve criminal matters but warrants (the reasons for these warrants were not provided). 35 In addition to offences, criminal histories also record Care and Control Orders for juveniles and warrants for juveniles and adults. 36 Because many former students from The Haven left the state at some stage of their life course, the Queensland criminal histories are a conservative estimate of offending.

141
police caution, family conference, and court. They provide information about dates of
offences,37 dates of finalisations, types of legal charges (e.g., stealing), counts of legal
charges (e.g., three counts of stealing), adjudications (i.e., proved or not proved), and
penalties. Throughout the thesis I use the term “alleged offences or alleged offending”
in reference to all the offences in the criminal history proved or not proved, and the term
“proved offences or proved offending” in reference to offences proved in court or dealt
with through a police caution or family conference.
In addition to the official criminal histories from QPS, the records from DFS and The
Haven provided some information about offending behaviours, and about CJS contacts
(for instance with the police) not recorded by QPS. The sources included self-reports,
and reports by carers, schools, and social workers. Had they been detected by or
reported to the police, these offending behaviours would have probably lead to criminal
charges. I recorded the number of individuals who, according to DFS or The Haven,
had engaged in such offending behaviours, as well as the types of their offending
behaviours. Through comparing the dates and the types of offending behaviours
mentioned in The Haven and DFS files with the criminal histories provided by QPS, I
was able to ascertain that these offending behaviours had not been officially recorded.
Throughout the thesis I refer to these offending behaviours as “unofficial offending”.
37 A specific date for the offence(s) was sometimes provided, but other times only a date range of a few months was given.

142
E. Matching the Three Sources and Designing the Dataset
When the data collection from each source was completed, the final task was to fill the
gaps in each individual story. This jigsaw puzzle activity also allowed some level of
triangulation of the diverse sources of data. Figure 5.1 presents the data-coding map
across the various institutions. Overall the data trail extended from micro level
situations to macro level political events that affected the life of the children. The coded
data were transferred into a SPSS dataset, for statistical analyses. Ultimately, including
criminal data for those individuals who had an official criminal history, the dataset had
nearly 1,200 variables. I also recoded some parts of the criminal data to be able to
transfer them into a SAS dataset for the purpose of performing group-based trajectory
modelling analyses (Chapter 9). For all the cases in the study38 I computed the number
of official alleged offences per year from age 10 to the age reached in 2005.
These data, in both qualitative and quantitative forms, are used to examine the many
relations between school, family, and offending, and to answer important questions
about educational exclusion, social exclusion, and crime. There are gaps in the data,
especially from The Haven’s records in the 1st decade, but on balance the combination
of the three datasets has reduced data gaps and offered ways to cross check the data.
The result is an unprecedented structured data pool, which allows a comprehensive
investigation of the journeys of the excluded, the children of The Haven. In the next
chapter I examine the history and the current operations of The Haven.
38 Those who had no official criminal history were coded 0 every year from age 10 to their age in 2005. For those who had an official criminal history, every year when alleged offending had occurred indicated the exact number of distinct alleged offences, and all the years between age 10 to age reached in 2005 when no offending had occurred were coded 0. In Chapter 9, I provide a rationale for selecting alleged offending rather than proved offending in the group-based trajectory modelling analyses.

143
Figure 5.1. Data coding map across institutions for The Haven’s cohort: 1973-2003
Education Queensland The Haven students’ files 1985-2003, N=193*
Potential data coverage from birth to exit from The Haven (0 to 13 y/o) Potential historical time span covered 1976-2003**
Familial profile (49 variables) Health/medical profile (16 variables) Psychosocial profile (39 variables) School’s disciplinary strategies (15 variables) Cognitive profile (14 variables) Programs/support history (27 variables) Schooling/Academic history (31 variables)
* 92 files (1973-1984) destroyed and 18 files (1985-2002) missing, but The Haven’s “enrolment book” provided information for all students on a number of key demographic variables.
** First available file in The Haven history is for a student born in 1976.
Department of Family Services (DFS) a
N=227*
Potential data coverage from birth to legal majority (0 to 18 y/o) Potential historical time span covered 1960-2005**
* Number from The Haven historical student population with a file at DFS** Former The Haven student born in 1960 and with a file at DFS
Department Of Communities
Proved juvenile offending history in Queensland
Potential data coverage 10-18 y/o Offending dates
Offence types Penalties/Programs*
* Police cautions and community conferences not included
Department of Child Safety
Potential data coverage 0-18 y/o Child protection notifications Placements Familial data Socio-economic data Psychosocial data Cognitive data Health/medical data Schooling data Support/service data
Queensland Police Service (QPS) N=182
Potential data coverage 1970–2005 Full criminal history All officially recorded contacts with CJS in Queensland (Proved and not proved offences, juvenile & adult contacts) Offending dates Offence types Date & nature of adjudication* Penalties
* Including police cautions and community conferences
a formerly Department of Families (1998–2002)

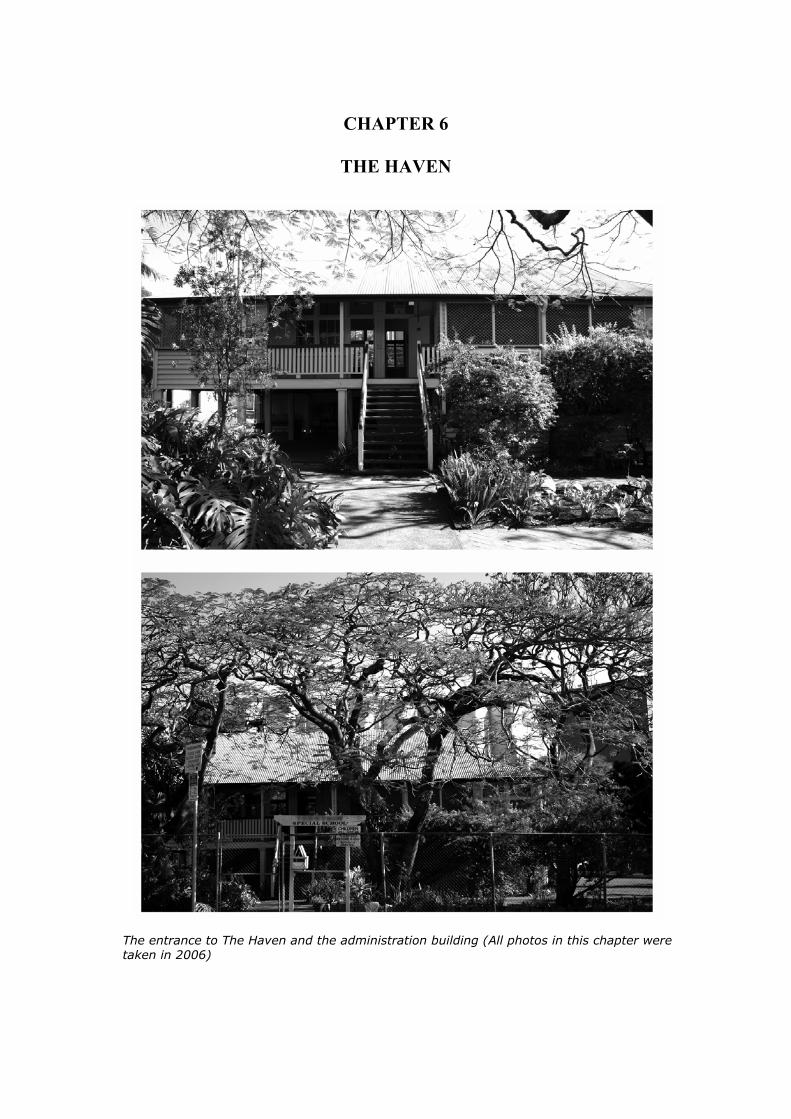
CHAPTER 6
THE HAVEN
The entrance to The Haven and the administration building (All photos in this chapter were taken in 2006)

146
This chapter traces the 30-year history of The Haven, analyses the changes in its
pedagogical and disciplinary regimes, and discusses the politics and practices of
inclusion and exclusion, as they were experienced at The Haven. The Haven tells a
story built upon the excluded themselves, and is the shared experience of their journey.
This history is marked by periods of crisis and renewal, by changes in pedagogical
approaches, and in the characteristics of its student population as well as its referring
and reintegrating schools.
I - THE SCHOOL HISTORY
This small school, situated in a Brisbane suburb about ten kilometres south of the city
centre, has been operating for 72 years. In 1934, it opened as a regular school and
functioned as such until 1973 when it was transformed into a special school. From
1973 to 2003, The Haven enrolled 300 children. Since its opening in 1934, the school
went through many changes, and the threat of closure has been a recurring theme.
Today, there are no more than ten students enrolled at any one time. However, there is
a regular turnover of students in the classroom; as some go back to the mainstream, new
students are accepted. Figure 6.1 presents the historical time-line of The Haven (1973-
2003) in relation to the profiles of its clientele, changes in pedagogical and disciplinary
regimes, length of placements, policy changes at the level of the macro-system
represented by Education Queensland, and the turnover of its principals.

147
The
Hav
en p
rinci
pal
s 1
2
34
5-6
7-8
9
10
1973
1976
1986
1989
1990
1994
1998
1999
1934 ng a
s a
regula
r pri
mar
y sc
hool
Figu
re 6
.1.
His
toric
al ti
me-
line
for T
he H
aven
, its
stud
ents
and
thei
r len
gth
of p
lace
men
t, its
ped
agog
ies,
and
prin
cipa
ls
Open
i
Rura
l zo
ne
Indust
rial
zon
e
19
40
-50
1986
Leve
l 6
Asc
erta
inm
ent
Sch
eme
b
1988-1
990
CLA
D c
20
03
LDf /Ps
ychia
tric
LD f/P
sych
iatr
ic &
EBD
gEBD
gonly
(nonas
cert
ained
stu
den
tsb)
Multip
ersp
ective
s Com
plia
nce
G
lass
er
tr
ainin
g
Max
. st
ay 4
yrs
Max
. st
ay 3
yrs
Max
. st
ay 2
yrs
Max
. st
ay 6
month
s
1995
Corp
ora
l punis
hm
ent
abolis
hed
in Q
uee
nsl
and 1
996
CAP d
The
Hav
en B
MP e
1S
T D
EC
AD
E3
RD D
EC
AD
E2
ND D
EC
AD
E1
97
3
19
83
19
93
20
03
1983
Bar
rett
Adole
scen
t Cen
tre
a
1993
Last
cas
es o
f co
rpora
l punis
hm
ent
Stu
den
ts
Length
of
stay
Pedagogie
s
19
73
O
pen
ing
of
Th
e H
aven
Note
s:aBar
rett
Adole
scen
t Cen
tre
is a
psy
chia
tric
unit,
whic
h a
lso incl
uded
a s
chool se
ctio
n.
b L
evel
6 A
scer
tain
men
t Sch
eme
is a
cat
egori
sation
syst
em o
f dis
abili
ty lev
els
and e
duca
tional
support
with L
evel
6 indic
atin
g t
he
hig
hes
t le
vel of
dis
abili
ty a
nd s
upport
. c
CLA
D (
Cen
tre
for
Lear
nin
g
and A
dju
stm
ent
Difficu
ltie
s) w
as u
sed a
s a
withdra
wal
fac
ility
and s
pec
ialis
ed in t
he
dev
elopm
ent
of
and t
each
ers’
tra
inin
g into
beh
avio
ur
modific
atio
n t
echniq
ues
. d
CAP
(Cen
tres
for
Alter
nat
ive
Progra
ms)
wer
e es
tablis
hed
for
the
pla
cem
ent
of
pri
mar
y an
d s
econdar
y sc
hool st
uden
ts o
n
long s
usp
ensi
ons.
A C
AP
was
open
ed o
n T
he
Hav
en s
ite
in 1
996.
e BM
P (B
ehav
iour
Man
agem
ent
Plan
); t
his
is
the
wri
tten
docu
men
t th
at
expounds
the
dis
ciplin
ary
regim
e of
the
school. Pa
rt I
I of Chap
ter
6 g
ives
the
det
ails
of
The
Hav
en c
urr
ent
BM
P.
f LD
: L
earn
ing D
ifficu
ltie
s.
g
EBD
: E
motion
al a
nd B
ehav
ioura
l D
ifficu
ltie
s.

148
A. Origins as a Regular Primary School: 1934-1973
In 1934, the school was established as a rural school in an area of farms and creeks
along the Brisbane River. It was not unusual for children to come to school in horse
carriages. From the 1940s to the 1960s, the area gradually turned into an industrial
zone. Today, the school sits in the middle of a fully industrialised enclave. There is a
flourmill at the back of its playground, and huge trucks constantly pass in the small
street in the front of the school, as they move in and out of adjacent factories. By 1972,
the children of the few families resident in the area had grown up, and student numbers
declined to a nonviable level. The school was expected to close. However, community
pressure resulted in an active search for an alternative use of the school site.
Top row: The Haven’s playground and the flour mill at the back Middle row: The Haven bordered by factories Bottom row: The street in front of The Haven

149
B. The 1st Decade (1973-1982): The Therapeutic Environment
A range of factors may have contributed to the decision to establish a special school on
the site. Although the area was isolated from an urban setting, access was reasonable,
but absconding would likely be difficult. It was not a busy spot where one could get
lost in the crowd.
In the early 1970s, children with persistent learning difficulties were attracting public
interest and constituted many of the initial student placements. During the same period,
the Health Department recognised that the educational needs of youth with psychiatric
problems were not being met. An interagency health-education initiative resulted in
some adolescent placements at The Haven. For instance, The Haven’s Placement
Committee, established in 1973, included a consultant psychiatrist from the Institute of
Child Guidance. This medical involvement remained a feature of the Placement
Committee until the early 1990s.
During its 1st decade (1973-1982), 57 students (19% of the historical population)
transited through The Haven. A period of 2 school years was an average stay. During
the 1970s and early 1980s, the shortest placement lasted for about a school term; the
longest went for nearly 5 school years. In this “social alternative” school, until 1984
students enjoyed opportunities for farming and recreational activities such as gardening,
photography and go-carting. In 1977, an inspector’s report praised what was regarded
as a rich curriculum, which provided access to programs at several other schools (e.g.,
home economics and manual arts). During this period, the pedagogical regime was
rather flexible, with the aim of providing a caring and therapeutic environment.

150
1. Sending and receiving schools during the 1st decade (1973-1982)
Table 6.1 presents the characteristics of the sending and receiving schools across three
decades (1973-1982, 1983-1992, and 1993-2003). Due to missing data, little is known
about the characteristics of the primary schools that referred children to The Haven
during its 1st decade. However, the records about the schools where the children were
eventually reintegrated, which, in 98% of the cases, were available from The Haven’s
enrolment book, indicated that, in 38% of the total cases, these schools were situated in
either very low (21%) or relatively low SES areas (17%). Most of the children were
reintegrated in regular public schools. Yet 23% of them had moved to another special
school after their placement at The Haven.
2. Students’ demographics during the 1st decade (1973-1982)
Table 6.2 presents general demographic information on the students across the three
decades. Although students’ files are missing for the 1st decade, The Haven’s enrolment
book (1973-2003) provided sufficient information for the construction of this table.
During the 1st decade, three-quarters of the students were boys. Only 14 girls were
placed at The Haven during this period. However, these 14 girls represent close to 54%
of the female students who were placed at The Haven during its entire history. The
mean age at entry was 9.5 years old, with the youngest student being just over 5 years
old and the oldest 13 years old. Girls were about one year younger than boys at entry,
and, compared to the boys, were placed at The Haven for a significantly greater length
of time.

151
Table 6.1. Characteristics of The Haven’s referring and receiving schools 1973-2003,
per decade and for entire period
Schools’ characteristics
1st decade N=57
%
2nd decade N=98
%
3rd decade N=145
%
Total N=300
%Very low (<25th percentile)
11 28 45 33
Low to medium (26-75th percentile)
16 28 32 27
High(> 75th percentile)
5 10 20 14
SES of referring school a
Unknown b 68 34 3 26Small(<185 students)
5 4 4 4
Medium (186-428 students)
19 12 30 22
Large(>429 students)
2 20 47 29
Size of referring school
Unknown b 74 64 19 45Mainstream 68 69 88 78Special 26 20 5 14Correspondence 4 1 1 1
Type of receivingschool
Unknown b 2 10 6 7State 82 77 90 85Private 12 13 2 7Correspondence 4 1 1 1
Sector of receivingschool
Unknown b 2 9 7 7Very low (<25th percentile)
21 28 40 32
Low(25-49th percentile)
17 14 8 12
Medium (50-75th percentile)
32 34 23 28
SES of receivingschool a
High(>75th percentile)
28 12 23 21
Unknown b 2 12 6 7
Notes: a Calculated using the ABS Socio-Economic Indices For Areas (SEIFA). The ABS Index of Disadvantage that I used is based on the 1996 Census, and has, therefore, greater validity for the period 1994-98. I assume here that little change has happened in the relative SES of the Brisbane local areas between 1973 and 2003. Note, however, that, if some change did occur, it would be toward gentrification of former low SES areas. b Includes cases with no file at The Haven or no information on the referring or receiving school in The Haven or DFS files.
The student population of the 1st decade was moderately disadvantaged. Half the
children were living in either very low or relatively low SES areas. However, close to
30% of them resided in high SES areas. Data on parents’ or carers’ occupational status
also indicated moderate disadvantage. Overall, the students’ socio-economic

152
backgrounds were working class. Data on the parents’ marital situation indicated that,
in at least a third of the cases, the parents had separated or were oscillating between
separations and reconciliations, and in at least 14% of the cases one of the parents had
died before the student had reached adulthood.
C. The 2nd Decade (1983-1992): The Rise of “The Behavioural”
During the 1980s, the school was exposed to external influences from systemic changes
in the state education department. In 1983, the establishment of the Barrett Adolescent
Centre (for children suffering from psychiatric problems) may have reduced the number
of adolescent placements at The Haven. In 1986, Education Queensland developed a
new system to assess students with disabilities and allocate resources according to their
level of disability. This new disability-support system was called “Level 6
Ascertainment Scheme” because Level 6 was the highest level of diagnosed impairment
and entitled a student to the highest level of support. Because students with diagnosed
impairments now received support in their regular schools, The Haven reviewed its
selection criteria for entry. After 1986, it was decided to accept into The Haven only
those students who did not fit into this new scheme and did not receive extra support in
their regular school, that is, only students referred for behavioural problems involving
no other major developmental and intellectual disabilities.

153
Table 6.2. Demographics of The Haven historical student population at entry to The
Haven per decade and for entire population
Students’ demographics a
1st decade 1973-1982
N=57%
2nd decade 1983-1992
N=98%
3rd decade 1993-2003
N=145%
Total 1973-2003
N=300%
Male 75 92 97 91Gender Female 25 8 3 9Mean 9.5 9.8 9.6 9.6 Age at entry
(years) Range 5.3-13 6-13.5 6-13.5 5.3-13.5 Mean 79 45 23 41Length of stay
(teaching weeks b)
Range 10-196 4-141 3-92 3-196
Very low (<25th
percentile) 32 39 43 40Low (25-49th
percentile) 19 15 10 13Medium (50-75th percentile) 21 22 29 25
SES student’s home area c
High (>75th
percentile) 28 24 18 22Intact 9 22 25 21Broken 35 58 73 61
Families
Unknown 56 19 2 18Unemployed 14 24 27 24Unskilled labour 30 26 32 29Skilled labour 19 8 7 10Clerical 13 11 5 8Small business 5 2 2 3Professional 7 7 5 6
Parents/carers occupation d
Unknown 12 22 22 20
Notes: a Data for this table were also gathered from The Haven’s enrolment book (1973-2003). b Not including school holiday periods. c Calculated using the ABS Socio-Economic Indices For Areas (SEIFA). The ABS Index of Disadvantage is based on the 1996 Census, and has, therefore, greater validity for the period 1994-98. I assume here that little change has happened in the relative SES of the Brisbane local areas between 1973 and 2003. Note, however, that, if some change did occur, it would be toward gentrification of former low SES areas. d Based on the parent/carer with the highest level of occupation.
In the late 1980s, statewide consistency of practice for students with learning and
behavioural problems became an important topic. In the Brisbane region, the Centre for
Learning and Adjustment Difficulties (CLAD) was created and it popularised the
introduction of behaviour modification as a tool for disciplinary control in schools. In
1990, CLAD introduced a behavioural approach throughout the state. CLAD not only

154
offered a withdrawal program for “difficult” students, but also provided training to
teachers, disseminated “proactive” programs (e.g., social skills training and anger
management for students), and established systems of referral and data recording. For
example, a 6-month course in tracking students’ behaviour instructed some of The
Haven staff on how to collect detailed data on students’ behavioural change. These
transformations amplified the level of recorded observation, monitoring, and
surveillance, as well as the number of assessments prior and during placement at The
Haven. Consequently students’ files grew increasingly fatter.
The effect of these changes heralded transformations in the profile of the targeted
clientele as well as in the philosophy of teachers working with these new clients. In the
mid-1980s, teachers in The Haven were working from various personal and sometimes
conflicting perspectives. Some teachers with a psychological perspective used
behavioural modification. Teachers with a social work emphasis used relaxation. Some
teachers used an “opportunity school” approach. From 1989 to 1993, under the
influence of CLAD and probably in response to the changing student population, more
disciplinarian and controlling methods were introduced into The Haven, notably
“compliance training.” This is also a period when instances of corporal punishment
were recorded. In the archives, I found a book of “rewards and punishments” with
entries from 1989 to 1993, which did not, in fact, record any rewards, only
punishments!
In 1989, the general information provided by The Haven to regular schools indicated
that it was offering both “alternative and highly specialised programs as well as

155
supported generalised programs for students who have or are experiencing
behavioural/adjustment disorders and associated learning disabilities.” The goal for
students enrolled in The Haven’s programs was “full reintegration into a less restrictive
educational environment [which] in most cases … is a regular school.” Compared to
the 1st decade the aim was therefore to hasten reintegration with the support of a wide
range of professionals. The information sheet emphasised the need for developing
programs in consultation with the referring school, special education services, health
and family services, and other government and non-government community service
groups.
The ultimate decision to place a student at The Haven was the total responsibility of the
Supervisor of Special Services from Education Queensland; however, the decision was
made “only after receiving advice from the Placement Committee.” The Haven’s
Placement Committee included a consultant psychiatrist from the Institute of Child
Guidance, the principal of The Haven, the director of the regional Child Guidance, an
officer from the District Special Services, and a Guidance Officer. The information
sheet also pointed out that “[a]s the volume of referrals to The Haven is often greater
than the number of available places, a waiting list may be kept,” indicating a growing
trend in the exclusionary practices of regular schools.
The information sheet concluded by presenting three types of children who had
participated in The Haven programs, and highlighted the increasing number of
behavioural referrals since the opening of the unit in 1973:
a) Children with persistent/serious conduct disorders whose behaviour is so disruptive as to seriously interfere with classroom management, or whose behaviour is a serious overt threat to themselves, peers, and adult alike.

156
b) Children with “severe” phobias. c) Children with “severe” personality and adjustment problems, especially isolated children with
low or aberrant levels of social interaction – they may be too shy or too bossy; or else they lack the conceptual and/or motor skills necessary for successful interactive play.
1. Sending and receiving schools during the 2nd decade (1983-1992)
During this period, 98 students (33% of the historical population) transited through The
Haven. The average length of placements was around one school year. The shortest
stay lasted about a month, and the longest stay close to three school years. There was
no difference between the average length of placements between boys and girls. Figure
6.1 shows that, compared to the 1st decade, the length of placements at The Haven had
been halved, and the schools where students were reintegrated were situated in more
disadvantaged areas.
2. Students’ demographics during the 2nd decade (1983-1992)
The proportion of boys had jumped from 75% during the 1st decade to 92% during this
2nd decade. The mean age at entry was similar (close to 10 years old) to the mean age at
entry during the 1st decade. Compared to the 1st decade, there was no difference
between the age of boys and girls at entry. During this period, at least eight Aboriginal
students, that is, close to a third of the Aboriginal student population placed at The
Haven during its entire history, were referred to the school. Table 6.2 shows that the
student population of the 2nd decade was not only more socio-economically
disadvantaged, but also more likely to come from “broken families,” than the
population of the previous decade. The population of the 2nd decade was essentially
composed of male students.
157
D. The 3rd Decade (1993-2003): Crises and Transformations
In 1993, the last record of corporal punishment was entered into the files. This was also
the year when a meticulous “points system” was introduced into The Haven as a regime
for calculating and meting out “consequences” for “inappropriate behaviour.” In the
period 1988-1990, professional development in most education systems had included
popular workshops with American psychiatrist William Glasser (1965, 1986, 1990,
2000) on “control theory” (i.e., making students responsible for their own actions) and
“reality therapy” (i.e., consequence control). In the early 1990s, The Haven’s principal,
therefore, imported Glasser’s mainstream combination of counselling, environmental
control, and academic focus as a way of establishing some practice cohesion among the
teaching staff at The Haven who, until then, worked from different pedagogical
paradigms.
The quest for a uniting philosophy and method, with which special educators could
work more cohesively, was seen as an important element of the mainstreaming (i.e.,
integration or reintegration) process. The Glasser model was in vogue, but it was
introduced in The Haven not because it was regarded as a particular panacea, but
because it offered a way to unite staff on one approach. Thus, in the early 1990s,
teachers at The Haven were working within a Glasser framework with an overall focus
on the child’s internal control of behaviour. These transformations, particularly the
introduction of the “points system” and Glasser’s “control theory,” reflect some of the
ideas mentioned in Chapter 3 about changing forms of social control in schools. During
the 3rd decade, the practices that were adopted at The Haven to control students’

158
behaviour shift from the control of the body to the control of the mind, and increasingly
involve the use of “technologies of the self” (Foucault, 1988).
1. Crises
The year 1993 was eventful, and a crisis point in the history of The Haven. A student,
“Billy,” became a catalyst for a series of crises. Billy had been referred to The Haven
by a medium size disadvantaged primary school. He was 10 years old at entry in late
1991, from a low socio-economic background, physically abused by his father, and
possibly sexually abused in the past by an older half-brother. In late 1992, he was
reintegrated into another medium size disadvantaged school. Finding a suitable regular
school had been difficult. In mid-1993, he was excluded. According to the principal of
The Haven, media attention about his case and about the lack of resources and facilities
to educate such students may have contributed to the deterioration of his behaviour and
precipitated his exclusion. Despite the opposition of the Placement Committee,
including the principal of The Haven, the Education Department decided that Billy be
allowed a second entry into The Haven. This decision generated a heated discussion
between the principal of The Haven and the Department about the role of The Haven,
criteria for access, level of resourcing by the Department for students like Billy, and
questions of decision-making power in relation to placement criteria.
In July 1993, a new Department policy, regarding time-out and physical restraint
procedures, triggered a second heated debate about the implications for The Haven of
the application of the policy. A breakdown of communication between The Haven and
the Education Department led to a conflict-ridden situation. As for Billy, according to

159
his teacher, he had made good academic and social progress during his second stay at
The Haven, which ended in late 1993. In mid-1994, the records indicated that he had
settled well into another special school.
In a report to the executive director of the Regional School District dated June 16, 1993,
The Haven’s principal cited a trend towards increasing referrals for oppositional and
aggressive behaviour. Following the “July crisis,” the principal and some parents
successfully lobbied the education minister for a time-out room, in order to secure
appropriate facilities for controlling extreme behavioural episodes. The Department
policy stipulated that this room was not to be used for the purpose of compliance
training, but only for the management of dangerous situations. The regime of
compliance training and strict behaviour modification was therefore abandoned. This
time-out room, adjacent to the kitchen-staff room, and still in use today, is a bare space
in which a student can be locked. It is equipped with a camera linked to a CCTV
The Haven’s time-out room, camera in the room ceiling, and the CCTV system in the
system installed in the kitchen where staff can observe and videotape the student.
kitchen

160
2.
Until 1994, the students at The Haven were taught by three teachers in three separate
classrooms. In 1994, it was decided to combine students into two multi-age classes,
with a consequent reduction of teachers from three to two. In 1995, corporal
punishment was officially abolished in all Queensland government schools. During this
period, The Haven also gradually transformed its pedagogical approach towards a
greater focus on strengthening academic skills and fostering a feeling of academic
success amongst the students. Whereas in the early 1990s, staff placed emphasis on
remediation and repair of deficits in behaviour that interfered with an ability to fit into
the regular classroom (i.e., to comply with behavioural instructions to “sit” and
“listen”), they now placed more emphasis on schooling as a means to help children meet
their needs in socially appropriate ways within the school context. Changing beliefs
among the staff also fostered interest in building students’ confidence as learners by
providing regular curricular experiences in literacy and numeracy.
In 2003, I conducted an informal interview with Steve, the principal who, in 1998,
introduced in The Haven this new focus on a learning community (Principal 9 in Figure
6.1). He was convinced that if the regular schools that referred children to The Haven
had focused on providing disruptive students with an experience of academic success
rather than just controlling their behaviour, most of the children who were sent to The
Haven could have remained in their regular schools. Yet, with further refinements in
the “points system” and the increasingly meticulous micro-monitoring of students’
behaviour, The Haven remained a tightly controlled and controlling environment.
Further changes

161
ent introduced many policies on behaviour
ap
ents was
During 1996-98, the state governm
management. In June 3, 1996, Queensland Cabinet approved “enhanced Alternative
Education Programs for students” (Department of Education, 1997, p. 5). Extra support
staff appointments were funded. Simultaneously, principals were able to extend
suspension and exclusion of students, but were required to “coordinate arrangements for
placing the student in an alternative education program that allows the student to
continue with the student’s education” (Education [General Provisions] Amendment
Act 1996). As a result, a Centre for Alternative Programs (CAP) was opened on The
Haven’s ground in 1996 to receive primary and secondary school students on long
suspensions (6 to 20 days) from schools in this district. Figure 6.2 shows a ground m
of The Haven’s facilities today.
3. Sending and receiving schools during the 3rd decade (1993-2003)
During this period, 145 students (48% of the historical population) transited through
The Haven. As shown in Table 6.1, the average length of placem
approximately half a school year. The shortest stay lasted about 3 weeks, and the
longest, a bit over 2 school years. Compared to the 2nd decade, the length of placements
had been halved again, down to 6 months. This further reduction in the length of
placements permitted a greater number of referrals, to the extent that nearly half the
historical population of The Haven comes from the 3rd decade. In contrast to earlier
decades both the sending and receiving schools were now predominately large
disadvantaged primary schools.

162
Figu
re 6
.2.
Gro
mp
of T
he H
aven
un
da
Adm
inoff
ice
Ver
anda
Prin
cipal’s
offic
e
Kitchen
Time-outroom
Archive
Photo
copie
r
ke court
Bas
tball
Toilets
San
dpit
Fort
aO
vl
CAR P
ARK
OU
R
FLM
ILL
FACTORY
FACTORY
C
AP
Cla
ssro
om
CAP
Cla
sro
os m
T H
AN
’S
Cla
ssro
ms
HE
VE o
STR
EE
T
Gat
e

163
4. Students’ demographics during the 3rd decade (1993-2003)
During this decade, all but four students were boys. The mean age at entry was similar
(close to 10 years old) to the mean age at entry during the previous decades. Table 6.2
shows that the number of students who resided in very low SES areas had increased
from 32% during the 1st decade to 43% during the last decade. Data on parents’ or
carers’ occupational status also pointed to further increase in disadvantage compared to
the previous decades. During this period, at least 17 Aboriginal students (65% of the
historical Aboriginal student population) were referred to The Haven. Data on the
parents’ marital situation indicated that, in at least 73% of the families, the parents had
separated, and in at least 8% of the cases, one of the parents had died before the student
had reached adulthood.
E. Summary of Changes during the Last 30 Years
1. Characteristics of students and schools
From the 1st to the 3rd decade, both the socio-economic and familial situations of the
students referred to The Haven worsened. The number of girls, which had been small
from the start, had diminished to the point where the school was in effect a boys-only
school. During the last decade, the referring schools tended to be large disadvantaged
ools. Based on 232 cases where the information was available, I counted at least 129
erent schools in Brisbane metropolitan and surrounding areas that had referred
ents to The Haven during its whole history. Closer examination of the referral
ern of these 129 schools showed that the majority (64%) had only made one referral,
had made two referrals, and another 18% had made three or more referrals. The
mum number of referrals was nine, which were made by a large school in a low
sch
diff
stud
patt
18%
maxi

164
SES area. Overall, low SES schools were significantly more likely to have made
r,
he
itics of mainstream and special education. The introduction of
ccessive departmental policies on behaviour management, the creation of alternative
scretion in matters of student
ng of Centres for Alternative Programs
d
multiple referrals than medium and high SES schools.
2. Macro-system changes
The duration of placements and the number of referred students had evolved togethe
with increasingly shorter placements permitting greater numbers of placements. The
Haven had always been conceived as a place where a child was only in transit, but
during the 1st decade, it was a journey in the Orient Express, the Trans-Siberian or t
Khan; whereas in the last decade, it was a brief ride on a Brisbane City commuter train.
As suggested by Figure 6.1, this change in the length of placements appears as the
product of the macro-pol
su
education programs, and the extension of principals’ di
disciplinary absences, followed by the openi
(CAP) to absorb students in now long suspensions (6-20 days), may have fuelled
exclusionary processes. As suggested by Slee (1999), the school system had maintaine
a focus on behavioural rather than educational perspectives on school discipline,
designed new exclusionary procedures and created facilities where more students could
be sent more often. Within the larger school system, there was a staff perception that
behaviour management exceeded regular school resources, leading to an increasing
demand for withdrawal procedures that exceeded the number of facilities.

165
3. Micro-system changes
In The Haven itself, the individual beliefs of principals and staff fostered changes in
edagogical regimes during the school history (e.g., from therapeutic interventions
sion in the 1st decade, followed by compliance training of
l
lem
002
8),
aven today
ake the trip to and from the school alone, in a taxi.
p
involving artistic self-expres
specific behaviours in the 2nd decade, then quality schooling with a focus on
curriculum-based programming but also the micro-monitoring of conduct in the 3rd
decade). During its whole history, selection for withdrawal to this alternative schoo
involved, at any one time, a small group of students (although the group grew larger
during the 3rd decade) and a very low teacher-to-student ratio. Moreover, selection to
this setting reflected some expectation of “improvement,” either a reduction of prob
learning or problem behaviour, or an improvement in school-related socialisation (e.g.,
social skills, social problem solving, or emotional regulation).
The cost of operating The Haven for one year, including both “implicit and explicit
costs,” was estimated by Manning (2004) to be just under half a million dollars (2
dollars), which is a substantial investment in “behaviour” per se, and confirms the
higher cost incurred by school exclusion, highlighted by Bagley and Prichard (199
Parsons and Castle (1998), and Prichard and Cox (1998). Twenty-one students were
enrolled in 2002, so per-participant cost was estimated at $21,916 (2002 dollars).39 An
important aspect of the cost is transport to and from The Haven. While in 1934 the
students of the then regular school came on horse carts, all students of The H
m
39 I did not find any Australian figures about the cost of educating a child in a regular primary school to compare with The Haven, but the UNESCO (2003) reports that in OECD countries the average annual government spending per primary school student is AU$5,615. Compared to $22,000 per child for six months at The Haven, schooling in the mainstream is nearly eight times cheaper.

166
F. The Current Regime (1998-2006)
1. Punishment and social control
Despite its greater focus on academic success since 1998, The Haven remains a
controlling environment. Today, The Haven maintains that it does not use “e
material rewards for appropriate behaviours [or] punishments for inappropriate
behaviours.” Yet, time-away procedures, which can even lead to confinement for a
period of time in a bare and locked room might be experienced as punishment by the
recipients. The principal (Anna) acknowledges, for example, that the children, at least
when they are informed of their placement, perceive The Haven as a place of
punishment. The current school rules, “Respect Yourself, Respect Others, and Respect
Property,” might be regarded by the staff as “not having a lot of
ither
rules.” However, not
nly are “a hat, sleeved shirt, shoes and socks, and homebook40 required to play,” but
m
at occur in classrooms and
playgrounds, learning independence, and controlling anger and frustration.”
o
also the three main rules (Respect Yourself, Respect Others, and Respect Property)
“apply in the classroom and the playground and cover virtually any behaviour.” The
current disciplinary regime described in Our School’s Behaviour Management Plan
involves “proactive strategies, plans, and reactive strategies.”
Proactive strategies are skills imparted to students during social skills lessons that “will
help them to avoid getting caught up in potentially difficult situations” and “give the
strategies to deal with situations of stress.” The four main areas of application include
“meeting needs appropriately, coping with problems th
40 Forgetting to bring back from home the homebook of communication between teachers and carers incurs a loss of playtime.

167
Responsibility and choice are regarded as important features of the behaviour
cussion, role-play, activity sheets, and personal
eir
e plans
of
d way of being, so as to
ansform themselves …” (emphasis added).
ould be
management approach; to this effect, dis
plans are used as pedagogical tools.
Plans are weekly “good resolutions” where the student must choose “an aspect of th
behaviour that they want to change” (emphasis added). The idea is to write thos
“in a positive way, i.e., what we want students to do rather than what we don’t want
them to do” (emphasis added). The Haven’s Behaviour Management Plan gives three
examples of positively expressed plans “chosen” by students:
“Use appropriate language,” rather than “Don’t swear.” “Keep my hands and feet to myself,” rather than “Don’t kick and hit.” “Do my time-away immediately,” rather than “Don’t waste time.”
These proactive strategies remind us of Foucault’s notions of individualisation and
subjectification as modern mechanisms of control. The Haven’s comments on the
process used to involve students in writing their weekly plans are examples of the
“technologies of the self,” which, according to Foucault (1988, p. 18), permit
“individuals to effect by their own means or with the help of others a certain number
operations on their own bodies and souls, thoughts, conduct, an
tr
Reactive strategies consist of “a carefully organised system of consequences organised
to move from the least to the most intrusive.” In Table 6.3, I provide the verbatim full
text of The Haven’s Behaviour Management Plan on reactive strategies. I do so
because it is in its meticulous prescriptions of what should be done, when it sh
done, and how it should be done, in its “political anatomy of details,” that this text

168
illustrates Foucault’s concepts of “the micro-physics of power” in the school d
as a “disciplinary technology.” On the right-hand side of the table I give a brief analysis
of the elements, which according to Fo
esigned
ucault constitute some of the “mechanisms of
rveillance” and “technologies of the self” of the disciplinary method.
s includes agreement to
partic e aspects of the disciplinary
y have to consent to
and
su
Parents or carers are required to sign a consent form that also specifies a number of
behaviours expected of them. As a condition of their child’s enrolment, they have to
agree to attend meetings to discuss the appropriateness of the behavioural and academic
programs designed for their child. Social control of the familie
ipate in therapeutic treatments and to extend som
regime from The Haven into the home environment. Finally the
their child “being assessed, observed, audio taped, and video taped in the classroom
playground by members of [the school] staff.”

169
Table 6.3. The Haven’s Behaviour Management Plan (BMP): reactive strategies (text
taken verbatim from the plan)
BMP original text (emphases added) Author’sanalysis
Rule restatement,
For low-level behaviours – e.g., calling out in class, leaving seat to gain attention, strategies adopted by staff include
eye contact, ective
attention
rule restatement, eye contact and selective attention. The student has a choice to continue or change the behaviour. Should the behaviour persist the time-away system operates.
and sel
Emphasis on choice
Cool down Students themselves, choose to sit quietly and reflect on a
group whenever they feel ready.
Emphasis on
reflection situation that has happened. They can then re-join the choice and self-
Time-away This system is designed to allow students time-away – an Emphasis on self-system opportunity to reflect on their behaviour and make a plan to
do better next time … reflection and transformation
Stage 1 For minor class misdemeanours, students will complete Stage 1 time-away in their classroom. They are required to sit quietly in the designated corner. If this occurs away from the classroom, students go to the designated area. When
etc, they put their hand up and discuss with an adult what happened in the classroom and what their plan is when they return. The length of time-out is decided by the student.
Emphasis on designated space
they believe that they are ready to return to class, activity,
and on time.
Stage 2 If students choose not to go straight to the room, or if on the way they damage property or annoy others,given three lots of Stage 1 time-away in q
Emphasis on or if they are
uick succession for the same misbehaviour, they are required to go to the veranda to do a Stage 2 time-away. Stage 2 time-away requires the student to sit and reflect on their behaviour.When they feel calm they raise their hand and are given a behaviour sheet to complete.
choice, designated space, and practice of self-reflection
Stage 3 Stage 3 time-away is given if students choose to engage in dangerous behaviours, such as attacking another person, threatening others (with intent), inciting others to be dangerous, throwing rocks, leaving the school grounds, etc. Stage 3 time-away is done either in the “safe room” or in the time-out room. It requires the student to sit for 9 minutesand reflect on their behaviour. At the end of each period of time-away, a debriefing session is held with the student and a staff member. For Stage 2 and 3 time-away, students complete a written debrief/behaviour sheet.
Emphasis on choice, designated space and time, and practice of self-reflection
Confinementand exclusion
Some of the more intrusive strategies that may be used include: confinement in the time-out room, physical restraint, suspension, and exclusion.
2. Cycles of assumptions and disciplinary regimes
Anna, the current principal of The Haven (1999 to 2006), explained to me how staff
over the years have been struggling with a set of assumptions about who The Haven’s

170
children are. The behavioural cocktail that leads to referral may encourage an
assumption about “bad kids” who need to be punished and to learn to comply, with the
staff be g thrown into “ ground of
i
young
peo u
kids” who need king “the facilitator role.” W
logy o e
cal an e
During the 1st d pmental
, and be
associated with
referred for lea f
social disadvan e “sad kids” assumption may have
prevailed. The hen
were largely of
placements wa hem, the assumption may have shifted to
“bad kids,” and e recent period,
r ent,
may indicate a return to the “learning kids” assumption.
in the persecutor role.” The children’s back abuse and
trauma may tr
with the staff b
gger an assumption about “sad kids” who need to be loved
eing thrown into “the rescuer role.” The fact that they are
and healed,
developing ple, capable of change may encourage an assumption abo
quality teaching, with the staff ta
t “learning
e can take
this typo f bad kids, sad kids, and learning kids and relate it to the evolution of th
pedagogi d disciplinary regimes at The Haven during its three decad
ecade, the long placements of students with marked develo
s.
problems the use of multi-perspective pedagogical strategies at The H
the “learning kids” assumption. Gradually, with the mix o
rning, emotional, and behavioural difficulties, and from a background o
tage and family problems, th
aven, may
f children
n, with the population change at the end of the 1980s, w
children with serious behavioural problems, and the length
s shortened to absorb more of t
referrals
of
favoured compliance training as the main strategy. Th
with its greate emphasis on curriculum and an experience of academic achievem

171
II - THE ART OF PUNISHMENT
I turn now to analysing the evolution of The Haven’s pedagogical and disciplinary
regimes using the Foucauldian framework in Chapter 3. My aim is to examine the
institution-individual nexus, where according to Foucault (1980, p. 109) “discipli
power reaches into the very grain of individuals, touches their bodies and inserts itself
into their action and attitudes, their discourses, learning processes and everyday lives.”
I investigate how a disciplinary regime increasingly driven by the micro-monitoring of
conduct, operated hand in hand with the growing power of the disciplines, and
nary
ventually drew the children into “technologies of the self,” which may have resulted in
the
294), the
ild Guidance. The early files
e replete with psychodynamic discourses. The pedagogies were influenced by
psychoanalytic methods, involving therapeutic tools such as art therapy, yoga,
relaxation, writing diaries, and the like.
e
further isolation and exclusion. I use The Haven’s historical time-line presented in
Figure 6.1 to guide my analysis of the particular mechanisms and processes that
Foucault associates with the school as a disciplinary technology.
From 1973 to 2003 there was a shift from the mind to the body and then back to
mind, which developed within educational contexts dominated and justified by the
disciplines of psychiatry and psychology. As suggested by Foucault (1977, p.
“technicians of behaviour, engineers of conduct, orthopaedists of individuality”
psychologised and medicalised the disciplinary regimes of The Haven. When The
Haven first opened, psychiatry was the leading discipline. The Placement Committee
included a consultant psychiatrist from the Institute of Ch
ar

172
etween 1983 and 1986, following the opening of the Barrett Adolescent Centre for
ent
ften in
and
rgence of corporal
unishment, became the main “means of correct training” (Foucault, 1977, p. 170) at
me
uct,
B
students with psychiatric problems and the creation of the new “Level 6” ascertainm
scheme, that is, a normalising procedure which involves a detailed examination of
individuals and divide them into six levels of intellectual disabilities, those judged
“truly sick or mad” were absorbed into the mental health system. At The Haven this
development coincided with “the rise of the behavioural.” The disciplinary focus
shifted to the body. Strict behaviourism then informed The Haven’s pedagogies. The
discipline of psychology took over to some degree, but in the background, and o
competition with psychologists, operating at a distance, psychiatrists governed mind
and body with an arsenal of “chemical restraints.” Increasingly, the children were
diagnosed ADHD and medicated with psychoactive drugs. Compliance training,
even “some traces of torture” (Foucault, 1977, p. 16) with the resu
p
The Haven.
Then, beginning in the 1990s, there was a gradual move away from the body to the
mind. A greater emphasis was put on curriculum and learning, but at the same ti
surveillance intensified, assessments, observations, and examinations multiplied. A
“whole apparatus of writing” (Foucault, 1977, p. 191) transformed the morphology of
the case files, which became more and more voluminous. A points system,41 a veritable
“anatomy of details” (Foucault, 1977, p. 139) monitoring minute changes in cond
This method was called “the points system” becawas considered, incurred one set of 2 or 5 points 41 use each misbehaviour, depending on how serious it
(e.g., 10.13am: chews on his pen: 2 points). The amount of “consequence” (e.g., length of lost playtime) was calculated according to the number of accumulated points. The method was refined with the introduction of the time-away system.

173
pt at “correct training,” was put in place. This system is still in use in
misbehaviour (Teacher’s notes about case #279 on 08 May 2002)
and every attem
2006. Table 6.4 is a typical (that is not at all unusual) example of how the micro-
monitoring of behaviour is practiced at The Haven.
Table 6.4. Typical micro-monitoring of a student’s behaviour during one day at The
Haven
Time Classification of
aTeacher’s comments
9.25 NRS Tape over mouth. 10.12 VNRO Laughing at others; telling teacher to shut up. 11.15 NFI Throw stick up through pipe when instructed not to. 12.10 IL Swore because frisbee was not going his way. 12.20 NRP Hit board when he came off handball court. 13.05 PNRO Trip student over in soccer.
Note: a The acronyms used in the table are those used by The Haven when recording th
NFI: Not Following Instructions; IL: Inappropriate Language; NRP: Not Respecting Property; PNRO: Physically Not Respecting Others.
I reconstructed the micro-monitoring of one student’s behaviour during his 6-month
placement at The Haven, between April a
estudents’ behaviour: NRS: Not Respecting Self; VNRO: Verbally Not Respecting Others;
nd October 2002, and created what I call a
.” Figure 6.3 shows the escalating pattern generated by this action-
ed
“behaviourogram
reaction system during a four-week period. This is a typical case, that is, the pattern
was not only similar during the months preceding and following the four weeks plott
in Figure 6.3, but also representative of other students.

174
Figu
re 6
.3.
Beh
avio
urog
ram
: po
tent
ial l
engt
h of
tim
e is
from
9am
to 3
pm (a
scho
ol d
ay) a,
b
1
st
even
t of
the
day
las
even
t of
the
day
Note
s:a
The
firs
t an
d l
ast
reco
rded
ev
ffer
ent
ch
npm
.rs
t re
cord
een
nev
erth
eles
s plo
tted
at
the
top o
f th
e beh
aro
m.
ien
ts a
rd a
cei
ive
thro
ugh t
ib T
he
acro
nym
s use
d i
n t
he
dia
gra
m a
re
e ed
by
The
Hv
hen
rec
he
ha
IL
: i
nopri
ate
langu
(esw
eari
ng,
spea
king ru
del
y).
NFI:
n
ot
wn
ti (
refu
sin
llow
tas
nst
ruct
ions,
ving cl
assr
oo
thper
mis
sion).
N
RS
: n
ot
resp
ecting s
elf
(eno
ain
sun).
si
tuat
it
rec
ting o
ther
s (e
.g.,
ban
gin
g s
ton f
loor,
mak
ing n
oise
s duri
ng c
lass
).
VN
al
not
res
e o
ther
s a
ggre
ssio
n;
e.g.,
cal
ling s
taff n
ames
, putt
ing d
ow
n a
noth
er
studen
t).
PN
RO
: p
hys
ical
ly n
ot
resp
ectin
hal
ggre
sn;
e.g.,
a s
tude
ver,
thre
aten
in s
taff).
re
spec
ting p
roper
ty (
e.g.,
knock
ing t
hin
gs
mg b
ooks
dan
ger
obeh
avi
r (e
.g.,
lea
vsc
hool gro
und
mup t
rees
).
S1:
Sta
ge
1 t
ime-
away
(i
cth
he
clas
s
S2:
Sta
ge
2 t
ime-
away
(on t
he
vera
nda,
outs
if
clas
sroom
).
S3:
Sta
ge
3 t
ime-
away
(in
th
me-
ooom
:-a
way
in
th t
he
door
shut.
Wee
k 06/0
5 t
o 1
0/0
t
ents
may
hav
e hap
pen
edat
di
viou
gra
The
follo
wng e
vth
os
us
aen
wfo
lloin
g i
stru
cons
e.g.,
.g
.,
t w
eri
ng a
hat
t
he
RO
:ve
rbly
pct
ing
g o
ter
s (p
hys
ic a
sio
ove
r,ki
ckin
g d
oor,
da
agin
n a
des
ignat
ed p
lae
wi
in t
e ti
ut
room
).
LR
: L
ock
ed R
5
tim
es e
ae
plo
tte
ord
ing t
g to
fo
SN
RO
: (
verb
al t
rippin
g).
D
B:
room
).
tim
e
day
cor
stu te
b din
de ac on
etw
g t
nts
’her
’al
ly
nt
ous
ee o t
h b
es n
o
9am
and 3
lat
ur.
The
fiocc
urr
ence
appr
le
a
g a
stu
den
t or
ing
d e
vt
is
me. ag
e .g
.,
m w
iout
om
ehin
g
NR
P:
not
, cl
ibin
g
de
oth
e
r re vio
k i
esp
ou
the
tim
e-out
room
, w
i
Wek
1/0
5 t
o 1
7/0
5
e3
Wee
k20/0
5to
24/0
5
Wee
k 27/0
3
5 t
o1/0
5M
T
W
Th
FM
T
W
Th
FM
T
W
Th
F M
T
W
Th
F P
NR
ON
FI
NR
S
IL
NFI
N
FI
IL
NFI
NFI
IL
NFI
IL
NFI
NFI
FI
N
NR
SIL
N
RP
NFI
NFI
S2
S1
S1
S1
S1
S1
S1
S1
S1
S1
S1
S1
S1
S1
S1
S1
S1
S2
S1
S1
NFI
NFI
VN
RO
N
RP
O
VN
R
NR
P
NFI
NFI
NR
P
NFI
VN
RO
NFI
NF
I I
NF
N
FI
VN
RO
NN
FI
RP
NFI
S1
S1
S1
S1
S1
S1
S1
S1
S1
S1
S2
S1
S1
S1
S1
S1
S1
S1
S1
NR
P
VN
RO
NFI
PN
RO
NFI
S
NR
OS
NR
ON
RP
NR
P
NFI
NR
PN
FI
NFI
NFI
N
RP
NR
PP
NR
OV
NR
ON
RP
S
2S
1S
1S
2S
1S
1S
2S
2S
2S
2S
3S
2S
2S
2S
2S
2S
3S
2S
2
PN
RO
IL
IL
DB
N
FI
N
FI
NR
P
NFI
NFI
N
FI
NFI
NFI
NR
PV
NR
O
VN
RO
NFI
DN
B
RP
SN
RO
S3
S1
S1
S3
S2
S1
S2
S1
S1
S1
S1
S1
S1
S3
S3
S1
LR
S2
S1
N
FI
NR
P
PN
RO
PN
RO
N
FI
PN
RO
VN
RO
N
FI
NFI
PN
RO
VN
RO
P
NR
O
NR
PIL
N
RO
VS
2S
1S
3S
3S
2S
3
S2
S1
S1
S3
S2
S3
S1
S1
S2
N
FI
PN
RO
D
B
DB
IL
N
RP
NFI
PN
RO
PN
RO
N
FI
V
N
RO
VN
RO
S1
S2
LR
LR
S1
S
2S
2LR
S2
S1
S2
S3
N
RP
VN
RO
VN
RO
N
RP
NFI
N
RP
RO
VN
DB
S2
S2
S
2S
3S
1S
2S
1LR
V
NR
O
PN
RO
P
NR
ON
FI
P
N
RO
ILS
1
S3
S
3S
1S
3S
2
P
NR
O
NFI
N
FI
DB
O
VN
RS
3
S1
S
1LR
S2
N
FI
O
PN
R
S1
S3
P
NR
S2

175
One can cce e
interv ctions), IL (Inap not
targeting others) through VNRO (Verbally Not Respecting Ot
targeting others), NRP (Not Respecting Property, aggression towards objects), to PNRO
(Physically Not Respecting Others, aggression towards person
(Dangerous Behaviour) leading to the time-out room, where o
panoptic eye of the CCTV system.
add er’ “C
eal , s
mote r e
thods, re
ica n u ce r e an being punished by an external power. The following
cerp h h I t rom the homebook of communication b
e H n d e ther of a child, illustrates how the teach
a lo al con u c I ows the confusing slippage bet
ich in eing doubly
haviour, st T e H ven and then by his mother.
concer d a ut Rod g s of consequences for thel, we immediately give a con s another punishment at home he
holdin ivileges in cas ever needs to be picked up earleh cal
e nce …. (Teacher m to parents in homeboo 1
Slee n
chers and parents that documented how the euphem
clearly see the frequent escalation triggered by su ssiv
prop
hers,
s), an
ne is
ontr
these
each
child
etwe
er re
ween
puni
same bseque. Perhy. Thaviou
k abou
vers
nseq
corrective
riate Language,
abusive language
d finally DB
observed by the
ol Theory” and
discipline practice
student. With thes
ren “freely choose
en a teacher from
framed punishment
the two concepts,
shed for the same
ehaviour. When he nce and I think that it iaps you could reserve tat way he links the r – that makes it a logit student # 243 on 27
ations between
uence” was a
entions, from NFI (Not Following Instru
In
“R
pro
me
log
ex
Th
as
wh
be
As
tea
iti
ity
on to the points system, in the mid-1990s Glass s
Therapy” are introduced into The Haven. Together
“technologies of the self” (Foucault, 1988, p. 18) fo
flecting Beccaria’s “rule of perfect certainty,” the
l co
t, w
ave
gic
seq en s” ath r th
ic ook f
an th mo
seq en e. t sh
this particular case resulted in the child b
fir by
ne
h a
I amdoenotwithpunconsJuly
bona
s un
geatendin
ttin two sets s hel
ompf
etul
hin to h
g ii
ppd
roperst
ria
atg
sc to
hoo get
g of pr wi
e he hamunication
ishmeque
nt th the idea that ’s co
he s inconvenienced you by his b
999).
(1988) suggested, I found in the homebooks many co
istic “co

176
difficult concept to grasp for many parents and students, and how The Haven w
pain of explaining to parents the difference between consequence and punishment:
Dear [parents], Jimmy was not recorded down as having any time-aways on the 11th. He really
know that time-aways are not punishment – it is a time for reflection. A student may have ten time-aways in a day, but could have a great day even though one would think that he had chosen
13 March 2000).
Ricky says during the course of the day that he only has one time-away. The idea of the time-away for Ricky is punishment. This still has to be clarified and discussed with him (Teacher’scommunication to parents in homebo
as at
had a good day but maybe felt when spoken to by staff that it was time-away???? The students
inappropriately all day (Teacher’s communication to parents in homebook about student # 246 on
ok about student # 269 on 15 November 2001).
It really should be stressed that time-aways are not a punishment and that Peter should not get into trouble at home for having time-aways at school (Teacher’s communication to parents in homebook about student # 288 on 10 November 2002).
When the children misbehave to the point of being sent to Stage 2 or Stage 3, they have
to reflect on their conduct, and based on what they have been told during social skills
lessons (see picture below), complete a “behaviour sheet” (Figure 6.4). A particular
feature of this “behaviour sheet” is a set of questions asking what type of needs they
desired to fulfil through their misbehaviour. The choices are love/belonging, fun,
freedom, and power.42 This is not a multiple choice where the answers are mutually
exclusive, that is, the children can select the four needs if they wish to.
The Glasserian model of human behaviour, which is taught to The Haven’s children during socilessons, posits that four fundamental needs (love, fun, freedom, and power) motivate our behaviou42 al skills
rs (and misbehaviours). The aim of social skills lessons is to teach children how to fulfil these needs “appropriately.”

177
The Haven’s classroom

178
Figure 6.4. Behaviour sheet

179
I analysed the content of all the behaviour sheets (N=3,797) completed by the students
=135), 43 and recorded the frequency of the children’s responses in relation to these
ur needs. Overwhelmingly (i.e., in about 70% of the cases) the children answered that
ey needed power. Compared to power, the answers love, fun, and freedom were rarely
entioned as the needs they primarily attempted to fulfil through their misbehaving. As
document in Chapters 7 and 10, a typical characteristic in the life of these children is a
rong experience of disempowerment and a constant attempt at regaining some form of
ontrol. Many things suggest that real power is denied to them, as in the indignant
omment about a student from the teacher of a referring school: “he does not accept the
ght of others to make decisions for him.” However, as they “choose to misbehave,” a
lse control is attributed to them. Recall, for instance, how The Haven first presents
e weekly behaviour plan as a process where the children must choose “an aspect of
eir behaviour that they want to change” (emphasis added), and then adds that the idea
to write the plan “in a positive way, i.e., what we want students to do rather than what
e don’t want them to do” (emphasis added).
ubsequently, through mechanisms of individualisation, the children have to engage in
lf-blaming introspection, find the true ADHD, CD, or ODD self, and work on it. It is
erhaps the most insidious aspect of this “disciplinary power [that] reaches into the very
rain of individuals, touches their bodies and inserts itself into their action and attitudes,
eir discourses, learning processes and everyday lives” (Foucault, 1980, p. 109). To
y mind, this individualising mechanism completes their social exclusion through the
(N
fo
th
m
I
st
c
c
ri
fa
th
th
is
w
S
se
p
g
th
m
The mean number of behaviour sheets per student was 28 and the median 17 (range: 1-214). Because ildren complete a behaviour sheet after a Stage 2 or a Stage 3 time-away from the classroom, the
umber of behaviour sheets per child also reflects the frequency of time periods they spent out of the classroom.
43
chn

180
very denial of the social self. Yet, as Foucault reminds us, there is always some
resistance. I remember during one of my visits to The Haven, a student in time-out wh
was “role playing” the little soldier in front of a teacher sternly monitoring his conduct.
He was mocking her authority, marching and giving a military salute, as a defiant
gesture.
As Dreyfus and Rabinow (1982, p. 187) explain, Foucault contends that people in
power may know what they do, and often have a rationale to explain what they do, b
they rarely know about the effects of what they are doing. My study confirms this
point. As the following chapters suggest, schools, teachers, social services, and social
workers had little understanding of the effects of school and welfare policies on the
children. Yet, I believe that it is necessary to balance Foucault’s pessimistic outlook
with a more optimistic view, which recognises that the desire to understand is
something that people in power also express. The attitude of the current principal of
The Haven (Anna), her questioning of the relev
o
ut
ance and the effects of what the staff do,
er scepticism and her doubts, but also her openness to and participation in this research h
demonstrate that better informed practices are sought after and are possible.

181
III - THE PARADOXES OF INCLUSION
Max is very happy at The Haven. It is a stable pleasant environment, and this will make reintegration difficult. The program at G. Primary School is struggling because, in Max’s own words, he would rather be at The Haven with Mr W. Possibly, however, we will have to make The Haven less interesting and desirable for him .44
In this part, I examine how the staff, and the students and their carers at The Haven
the actual practices about inclusion and exclusion. I
eeds to be transformed too. They insist that, before contemplating an
alternative placement and after the placement, there should be a focus on the level,
nature, and quality of supports available in mainstream schools. The principal (Steve),
who in 1998 introduced a greater focus on curriculum and academic success at The
Haven, was even convinced that if adequate support had been provided in regular
schools, The Haven would not need to exist.
experienced the rhetoric and
analyse their experiences by drawing from the discussion in Chapter 3 on debates
between “inclusionists and traditionalists” (Brantlinger, 1997, p. 428).
A. We Are Not Magicians
A recurring theme in the interaction between The Haven and their referring and
receiving schools is the notion that the staff at The Haven are not magicians with the
power to transform with their black box of magic tricks “little disconnected devils” into
“little connected angels.” The Haven finds the expectations of regular schools to be
unrealistic. The principals and the teachers from The Haven often feel that focussing on
students’ behaviour is not enough. They express the view that, in order to accomplish
sustainable change in students’ behaviour, the school environment to which students
will return n
44 This quote from his teacher at The Haven was found in Max’s file in November 1988 during his graded reintegration in the mainstream.

182
This tension between the s and at The Haven,
and th he
Have
The Haven explicated its philosophy, policies,
ic process in which students are alternatively pushed out and pulled
echanisms. Mainstream
policies and practices in regular school
e problem with mainstream schools’ expectation for a magical solution at T
n, were expressed in the final report sent to the regular school where a student was
reintegrated in 1995. In this final report,
and practices, emphasising that “The Haven is a school; we have no magic formula.”
As the polarised debates between “inclusionists” and “traditionalists” show, in the
politics of educational exclusion and inclusion, contradictory expectations end up
nourishing a bulim
in, resulting in incessant re-integration and re-exclusion m
schools expect a quick individualised fix, which does not entail changing their own
operations and cultures. They are often as quickly disappointed, and, as the following
chapters will document, freshly reintegrated students are frequently re-excluded. At
The Haven, the aim is to swiftly return students to the mainstream to minimise the
deleterious effect of exclusionary practices, and fulfil the goals and match the rhetoric
of inclusive policies. Pushed by the mainstream to accept a growing number of school
deviants, they have to accelerate their turn over, but they expect receiving schools to
modify their approach and provide a good level of support. For structural and cultural
reasons (e.g., large class size and lack of resources, and authoritarian and medicalised
perspectives) these desired goals are rarely achieved.
The Haven’s current principal (Anna) told me that there are two broad types of student
responses to their return to the mainstream. There are students who do not like being at

183
The Haven (“this school sux”45). They experience The Haven as a place of punishme
they miss their friends, and are eager to go back to their original school. However, th
are also many students who would like to stay at The Haven forever because they enjoy
the small group, the teachers, the caring attention, and the experience of academic
success. These students sometimes, more or less jokingly, talk of being disruptive on
nt;
ere
urpose at The Haven or when reintegrated in order to stay or be able to come back.
ere
rt).
o
ch as Carrington (1999),
night (2000), and Slee (2001) contend that the need to suit the diversity of the student
p
My reading of the students’ files confirmed the frequent existence of such cases wh
students and parents could not understand why a return to an inimical mainstream
system was required, when they were doing so well at The Haven (i.e., both the student
and the parents said they appreciated and benefited from The Haven’s special suppo
Gersch and Nolan (1994) emphasised this paradox in their interviews of students wh
were placed in a special facility, and were reluctant to reintegrate to another school.
Why would those who were successful, supported, and happy at The Haven want to
return to a setting where they had failed and from which they had been ejected?
This finding highlights the problem of a school system, which is supposed to include all
children but excludes those who do not conform to its uniform practices.
Traditionalists such as Bradshaw (2001), Kauffman and Hallahan (1995), and Royer
(2001) insist that alternative educational provisions are more likely to suit the diversity
of the student body than “total inclusion.” Inclusionists su
K
body should be addressed in regular schools through a profound change of their
cultures. Although his theory places him among inclusionists, Parsons (1999) has not
45 A frequent expression found in the behaviour sheets completed by students.

184
participated in debate between inclusionists and traditionalists. However, he suggests
that school cultures have shifted to an increasingly controlling, elitist, competitive, and
privatised mode, which promotes exclusion. This trend is likely to support the
traditionalists’ claim that alternative educational provisions are necessary to provid
some form of schooling to all students.
More general comments about the bulimic politics of educational exclusion and
inclusion were made by John, the teacher of the Centre for Alternative Programs (C
which is located on The Haven site and receives primary and secondary school students
on long suspensions from the corresponding education district. Centres for Alternative
Programs are an integral part in the exclusionary policies and practices of the
Queensland education system. Since the creation of the CAP in 1996, it is not rare to
find students who were first sent to the CAP, then moved to The Haven’s program, o
sent to the CAP following further suspensions after exit from The Haven’s progra
e
AP),
r
m and
integration in the district regular schools.re

185
The Haven’s Centre for Alternative Programs (CAP)
During my conversation with John, he expressed a feeling of discouragement and
resentment about the practices of mainstream schools, and about parental and societal
expectations regarding education overall, especially for children who experienced
problems at school. According to him, there were far more long-term suspensions than
what the CAP section could process, as schools “eased out” many problematic students.
The UK literature on school exclusion points to the frequent use of this informal

186
exclusionary practice. John commented: “They tell parents, keep him at home for a
while to cool things down and to give a break to the teacher or we’ll have to suspend
him ” He told me that parental and community expectations in relation to the formal
education of many students, and particularly the children who were sent to the CAP,
were unrealistic:
They all want the kids to go to university; they create expectations that these kids are not able to fulfil. The parents of one of the secondary school kids at the CAP expect him to go to Uni while he is hardly able to read. The kid is good at and likes mechanical things, he would be OK learning a trade at TAFE [College] to become a mechanic.
I had seen several boxes in the archive room containing the files of former CAP
students. John asked me to visit him at the CAP section when I wanted to. He told me
that they had files too in the CAP section: “It’s easier when they come back a second
tim is last comment illustrates how the politics of
educational exclusion and inclusion are like a perpetual game of musical chairs. Now
you are in, and now you are out. Some are mostly out. Who are they, where do they
come from, and where do they end up? I examine these questions in the next chapter.
.
e, their files are already here.” H

PART III:
Where justice is denied, where poverty is enforced, where ignorance prevails, and where any one class is made to feel that society is an organised conspiracy to oppress, rob, and degrade them, neither persons nor property will be safe.
Frederick Douglass (1886)
RESULTS AND ANALYSES


CHAPTER 7
THE EXCLUDED: THE EARLY YEARS
Self-portrait drawn in 1996 by a 10-year-old male student of The Haven

190
In the last chapter, I documented how, overtime, teachers at The Haven had been
working for shorter periods, with more children, presenting more challenging
behaviours, coming from more disadvantaged family backgrounds, and needing to be
reintegrated in more disadvantaged and larger schools. The conditions for reintegration
(i.e., re-inclusion) were likely to be also more difficult. I now examine individual,
familial, and socio-economic characteristics of the children, as well as the historical and
institutional contexts in which they had developed, and compare my findings with the
literature on educational and social exclusion.
All the analyses in this chapter are based on information gathered exclusively from The
Haven, or exclusively from DFS, or from both sources. However, across decades and
for particular variables, there were fluctuations in data availability. In order to report
valid proportions, the choice of the relevant denominators required careful attention.
For some reports the relevant denominator was The Haven’s population, for others the
number of cases with at least one of two files (The Haven or DFS), for others
exclusively the number of files from The Haven or from DFS, and sometimes only the
number of cases for which a characteristic was reported to be present. Table 7.1 shows
the denominators used in the analyses.
Table 7.1. Denominators used in reporting results in Chapter 7
1st decade 1973-1982
(N)
2nd decade 1983-1992
(N)
3rd decade 1993-2003
(N)
Total 1973-2003
(N)Population 57 98 145 300 The Haven files 0 48 145 193DFS files 33 75 119 227 At least one of the two files
33 85 145 263
% file coverage 58% 87% 100% 88%

191
Having a file did not ensure that the ht was available in the file.
Administrative re from
depression) not the absence of problems. It is often impossible to know if what is not
mentioned in the file should be interpreted as indicative of the absence of a problem or
the lack of knowledge about a problem. For other types of information (e.g., racial-
ethnic classification), what is not mentioned e file can clearly be interpreted as
being unknown. However, when the racial- entioned we may infer
that, in the eyes of the administrative and teaching staff, it is non-Aboriginal and non-
ethnic (i.e., Anglo-Australian). When the proportions are calculated on the population,
unless all the data are available, and if applicable, I present the percents unknown. For
every table I indicate the relevant denominator in the top row.
In general, while the data for the 2nd and 3rd ighly reliable because there is
broad coverage with the school’s enrolment book, school files and DFS files, the data
for the 1st decade rely only on the school’s enrolment book and DFS files. Thus, from
time to time, I may give more attention to the results from the 2nd and 3rd decades for the
sake of accuracy. Recall, however, that The Haven’s enrolment book provided the
following information: (a) first and last names, (b) date of birth, (c) gender, (d) dates of
entry to and exit from The Haven, (e) address, and sometimes occupation, and religion
of parents or carers, (f) sometimes the marit
the student had been reintegrated, and (h) for the first 14 students of the 1st decade their
ccupational or marital circumstances in early adulthood.
information soug
cords mention the presence (e.g., a mother is suffering
in th
ethnic group is not m
decades are h
al situation of parents, (g) the school where
o

192
I - WHERE DID THEY COME FROM?
A. Familial Environment
The first remarkable finding is the proportion of children who had a file with DFS.
Over three-quarters of the population had been in contact with Family Services, from
58% during the 1st decade to 82% during the last decade. Not only did most of these
children come from a perturbed familial environment, but this environment was also
riddled with problems and tragedies.
e
at
tion. In Australia, the few studies that
ave investigated the demographic characteristics of excluded students have also
pointed to the greater likelihood for Aboriginal children to be excluded from schools.
For instance, data from Quee pter 1 led th s
r isciplinary sences (SDA r Aboriginal nts in 1998 ore
than twice the rate for non-Aboriginal stude My findings that this fe of
e school exclusion was also reflected in The Haven statistics.
1. Racial-ethnic classification: over-representation of minority groups
Data on racial-ethnic classification of the children were patchy. Table 7.2 shows that
across the decades at least 9% of the population was Indigenous. During the last
decade, when data on racial-ethnic classification were reported for 83% of the cases, th
proportion of known Aboriginal children reached 12%. Compared with the Aboriginal
population of 1.5% in the Brisbane region (ABS, 2006), these figures reveal th
Indigenous students were over-represented in The Haven’s intake. Over-representation
of students from ethnic minorities was a consistent finding in the UK and US literature
on educational exclusion and educational segrega
h
Education nsland (Cha ) had revea at the State’
ate of Student D Ab ) fo stude was m
nts. show ature
th

193
Table 7.2. Racial-ethnic classification a
1st decade 2nd decade 3rd decade Total 1973-1982 1983-1992 1993-2003 1973-2003
Population N=57 N=98 N=145 N=300 Racial-ethnic classification
% % % %
Anglo 3 21 37 26NES 2 3 5.5 4 a
Islander/Maori 0 0 3 1.5 Aboriginal 2 8 12 8.5 Non-Aboriginal 19 35 25.5 27 c
Not reported 74 33 17 33
Notes: The sources of these data are The Haven and DFS files. The Haven’s enrolment book did not provide information on racial-ethnic classification.
c The sole mention about these students was that they were not Indigenous.
2. Large families and teenage motherhood
As Table 7.3 shows, large families averaging four children had been a con
a
b Non-English Speaking.
stant
teristic across the three decades. Many of these families were reconstructed
s
charac
families. Over the 30-year period at least 52% of the population had a step or foster
parent. During the 3rd decade, the proportion of students with step or foster parents wa
66%. Single mothers headed many families. Over one-third of the children in the last
decade were the third or later child in the birth order. A quarter of the mothers had their
first child before the age of 18. Large families, late birth order, and teenage motherhood
are well-established risk factors in terms of cognitive, academic, and social
development (National Crime Prevention, 1999). When these characteristics occur
within a deprived socio-economic environment, as is the case in this population, the
risks themselves are not only more potent but also more likely to engender other types
of deleterious contexts.

194
Table 7.3. Family structu
1st decade 1973-1982
re
2nd decade1983-1992
3rd decade1993-2003
Total 1973-2003
Population N=57 N=98 N=145 N=300 Family size (mean No. children) a
3.81 4.19 4.06 4.07
% Students with 32 44 66 52
step/foster parents b
% Students with biological parents
NR 23 31 23
% unknown 68 33 3 25 Student’s birth order % Only child 4 3 7 5 % 1st born 21 20 20 20 % 2nd born 9 20 35 25 % 3rd born 7 15 14 13 % 4th born & over 7 16 21 17 % Unknown 52 26 3 20 Teenage Mothers% With 1st child c 18 28 26 25 % With student 11 7 6 7 % Not a teenage 21 39 44 37 mother% Unknown 61 33 30 38
Notes: Includes student and full and half siblings but not stepsiblings. Based on avadata (1st decade=27 cases, 2nd decade=75 cases, 3rd decade=144 cases).
population (per decades and total). c Includes cases where student is 1st child.
3. Unhealthy families
Table 7.4 indicates that, where file information is available, across the decades 76% of
the children had one or more family members who suffered from a chronic health
problem. During the last decade, the figure was 83%, and for this decade, 65% of
mothers and 46% of fathers were affected by health problems. Mental health problem
were very frequent. During the last decade, among family members reported to suffer
from a chronic health problem, nearly three-quarters of mothers, over half of fathers,
and, in 62% of the cases, one or more siblings, were documented with mental health
problems. Alcohol and drug abuse also featured strongly. During the last decade,
among family members reported to suffer from a chronic health problem
a ilable
b Had at least one stepparent or foster parent. Percentages are calculated on entire
s
, half of
mothers, 58% of fathers, and, in a third of the cases, one or more siblings, were affected

195
by alcohol addiction, drug addiction, or both. Although there are limitations in
ree decades (caused by poorer information
during the 1st and 2nd decades), the data show a worseni in th h status
o ven’ nts ove -year
interpreting the health patterns over the th
ng situation e healt
f the families of The Ha s stude r the 30 history.

196
Table 7.4. Family health
1st 3r Total 1973-2003
decade 21973-1982 1
nd decade 983-1992
d decade 1993-2003
At least one le or DFS)
N=3 N N=263 file availab
(The Haven 3 =85 N=145
Families with a motherr from a 13 (39%) 46 (54%) 94 (65%) 153 (58%) reported to suffe
health problem a
% Mental b 46 65 72 68 % Drug/alcohol c 23 39 50 44 % Other chronic d 62 46 39 43 Co-morbidity e (means of
ers) 1.42 1.5 1 1.58 affected moth 0 .63Families with a father
suffer from a lem a
13 (39 40 (4 ) 66 %) 119 (45%) reported toheal h probt
%) 7% (46
% Mental b 23 40 53 45 % Drug/alcohol c 69 70 58 63 % Other chronic d 23 43 24 30 Co-morbidity (meaffected fathers) e
ans of 1.15 1.49 1.39 1.37
Families with a step/fosterreported to s
parentuffer from a
N=3 12 (1 ) 18 %) 33 (13%)
health problem a, f
4% (12
% Mental a n=0 42 17 24% Drug/alcohol b n=2 67 89 79% Other chronic n=1 c 17 6 12 Families with a sibling reported to suffer from a N=5 35 (41%) 61 (42%) 101 (38%) health problem a, f
% Mental b n=2 46 62 55 % Drug/alcohol n=3 34 33 35 c
% Other chronic d n=3 51 43 47 Co-morbidity e 1.60 1.31 1.38 1.37 Families with at least one
from a health problem amember reported to suffer 19 (58%) 61 (72%) 120 (83%) 200 (76%)
Mean N of affected family members g 1.79 2.23 2.04 2.08
Notes: a Percents in bold are calculated on the number of available files. Percents in types of health problems are calculated on the number of families with a mother, father, at least astep/foster parent, or at least a sibling reported to suffer from a health problem.
c Abuse of alcohol and/or illegal drugs. d E.g., diabetes, heart disease, cancer. Maximum co-morbidity index was three. In relation to siblings, co-morbidity could refer
one sibling suffering from several categories of health problems or to several siblings, each
f The figures do not
b E.g., depression, anxiety, schizophrenia, hyperactivity, suicide ideations and attempts.
e to
suffering from a different category of health problems. refer to the actual number of step/foster parents or siblings suffering
from health problems but to at least one step/foster parent or sibling suffering from at least
ostermother, foster father, and at least
one category of health problems. g Maximum possible number was seven (i.e., mother, father, stepfather, stepmother, f
one sibling).

197
4. A history of family violence
Table 7.5 presents a set of figures about the patterns of family violence. Data about th
abuse of students themselves are not included in this table, but are reported in the
second part of this chapter. Most of the documented violence was
e
intrafamilial. Across
the decades, 73% of the students with an available file had one or more family members
who had been abused at some stage in their life. Amongst the families in which abuse
had been discussed in the files, the data revealed a conservative average of two abused
family members.
Across the decades, there were greater levels of reported abuse against mothers both in
childhood or by partners (62%) compared to fathers (22%). This may be attributed to
the fact that better data were available on mothers, who had significantly more
involvement with the children than fathers. More likely, it shows a higher degree of
violence against women than men in families. For instance, among abused mothers,
82% had been abused by their male partners. Although reports of abuse against fathers
were significantly less frequent than reports of abuse against mothers, reports of abuse
in childhood were proportionally greater among abused fathers than abused mothers.
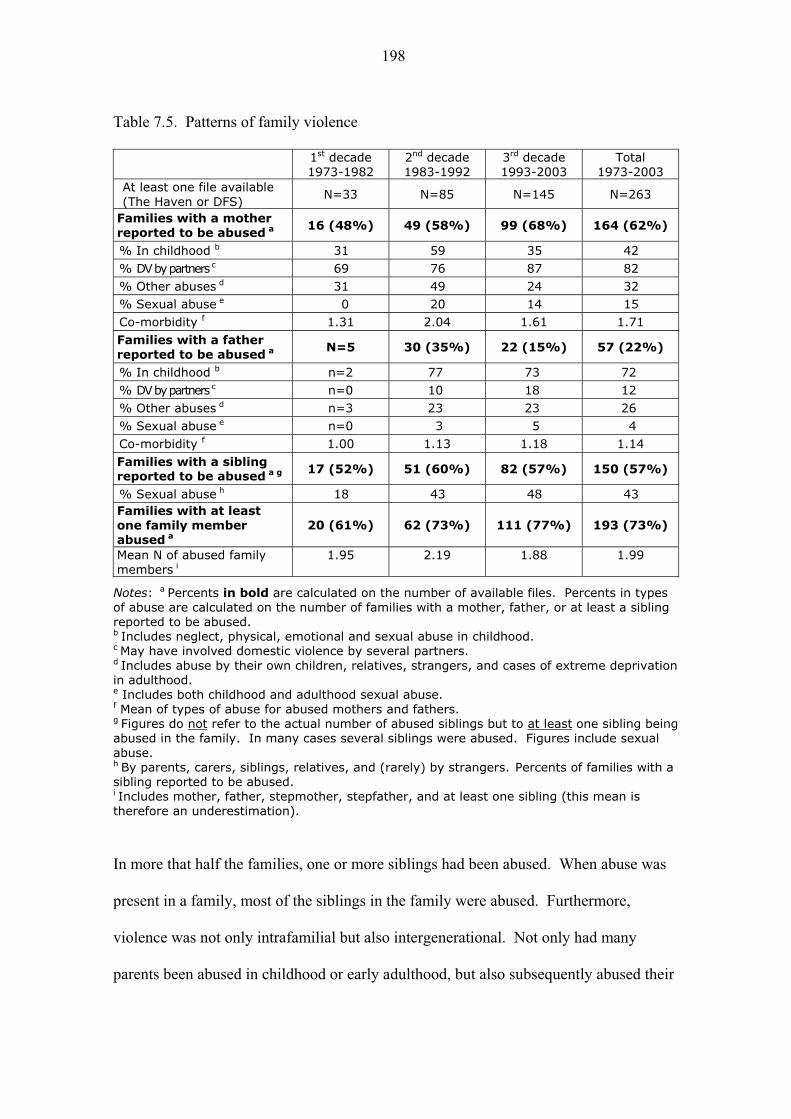
198
Table 7.5. Patterns of family violence
1st
1921
31
decade 73-1982
nd decade 983-1992
rd decade 993-2003
Total 1973-2003
At least one file available (The Haven or DFS)
N=33 N=85 N=145 N=263
Families with a mother reported to be abused a 16 4 9 (48%) 9 (58%) 9 (68%) 164 (62%)
% In childhood b 31 59 35 42 % DV by pa tnr ers c 76 69 87 82% Other abuses d 3 491 24 32% Sexual abuse e 0 20 14 15Co-morbidity f 1. 2 131 .04 .61 1.71 Families with a father reported to be abused a N=5 30 (35%) 22 (15%) 57 (22%)
% In childhood b n=2 77 73 72 % DV by partners c n=0 10 18 12% Other abuses d n= 23 3 23 26% Sexual abuse e n=0 3 5 4Co-morbidity f 1.00 1. 1. 1.13 18 14Families with a sreported to be abuse
iblingd a g 17 (52%) 51 (60%) 82 (57%) 150 (57%)
% Sexual abuse h 18 43 48 43Families with at least
r abused
20 (6 62 (7 ) 111 ) 193 %) one family membe a
1%) 3% (77% (73
Mean N of abused family members i
1. 2. 1 1 95 19 .88 .99
N calcula the n ila rceo numbe milies with a mother, least a sireported to be abused.b lect, physical, emotiona sexual abuse in childhoodc domestic violence by several partners. d their own children tives, stra s, and case extreme de ation ie dulthood sexual abuse.f se dg
otes: a Percents in bold are f abuse are calculated on the
ted onr of fa
umber of ava ble files. Pe father, or at
nts in types bling
Includes neg l and .May have involvedIncludes abuse by , rela nger s of priv
n adulthood. Includes both childhood and a Mean of types of abuse for abuFigures do not
d mothers an fathers. refer to the actual abus u number of ed siblings b t to at least one sibling being
a ny cases several siblings were abused. Figures include sexual ah blings, relatives, and (rarely) by strangers. Percents of families with a
were abused. Furthermore,
al but also intergenerational. Not only had many
ood, but also subsequently abused their
bused in the family. In mabuse.By parents, carers, si
sibling reported to be abused. i Includes mother, father, stepmother, stepfather, and at least one sibling (this mean is therefore an underestimation).
In more that half the families, one or more siblings had been abused. When abuse was
present in a family, most of the siblings in the family
violence was not only intrafamili
parents been abused in childhood or early adulth

199
children, partners, or both. In relation to mothers, abuse was directed against their
he
set of figures about the patterns of family contacts with the criminal
stice system (CJS) and incarceration. Family contacts with the CJS included mentions
n
n
mily members to be involved with the CJS and incarcerated. Yet, during the last
ecade, close to at least a fifth of mothers had been in contact with the CJS, and at least
a third of these mothers had been incarcerated. Amongst families where contact had
been reported, the average number of family members involved with the CJS and
incarcerated indicated that more that one family member had often been criminalised.
In many of these families, being in trouble with the law was more often a pattern than
an isolated incident.
children; however, in relation to fathers it targeted both the children and their female
partners. Notwithstanding the limitations associated with data availability across t
decades, the figures in Table 7.5 suggest that over 30 years, the pattern of family
violence had increased in the home of The Haven’s children.
5. A criminogenic environment
Table 7.6 presents a
ju
in DFS or The Haven files of arrests and criminal convictions. Most of the contacts
mentioned in the files were in relation to criminal convictions. Across the decades, for
48% of the students with an available file, one or more family members had bee
involved at some stage with the CJS. Among the families in which members had bee
in contact with the CJS, half of them had one or more members who had been at some
stage incarcerated.
Male family members (fathers, stepfathers, and brothers) were more likely than female
fa
d

200
Table 7.6. Patterns of family m onta crim syste )
a e
19 982 198 992 199 03 197 03
embers’ c ct with the inal justice m (CJS
t any stage of their lifetim
1st decade 73-1
2nd decade 3-1
3rd decade 3-20
Total 3-20
At least one file a(The Haven or D
vailable S)
3 5 N=145 N=263 F
N=3 N=8
Families with a mother CJS a N=1 14 %) 28 %) 43 )
involved with the (16 (19 (16%
% Incarceration 0 36 32 33Families with a father involved with the CJS a N=4 25 (29%) 36 (25%) 65 (25%)
% Incarceration 0 44 61 51Families with a stepparent involved with 12 16 %) 32 %) the CJS a, b
N=4 (14%) (11 (12
% Incarceration n=3 33 63 53Families with a sibling involved with the CJS a, c 12 (36%) 26 (31%) 28 (19%) 66 (25%)
% Incarceration 33 38 32 35Families with at least omember involved withthe CJS a, d
ne 16 (48%) 45 (53%) 66 (46%) 127 (48%)
% With at least one familmember incarcerated d
y 44 42 56 50
Mean N of CJS family 1.31 1.71 1.64 1.62 members d, e
Mean N of incarcerated family members d, e
1.00 1.58 1.35 1.38
Notes: a Percents in bold are calculated on the number of available files and include cases
y stage during their life. Percents of incarceration are calculated on the sibling reported to have been
not
where the police or the Juvenile Aid Bureau had been involved and any reports of official offending at annumber of families with a mother, father, stepparent, orinvolved with the CJS. b Includes stepmothers and stepfathers (the later form the bulk of the figures. Only three stepmothers had reports of CJS involvement and only one had been incarcerated). c Figures do refer to the actual number of siblings involved with the CJS or incarcerated but to at least one sibling involved with the CJS or incarcerated. In a number of cases several siblings had been involved with the CJS or incarcerated.
re
Means calculated on number of families where CJS involvement or incarceration was ported.
ne or
d Includes mother, father, stepmother, stepfather, or at least one sibling (these figures atherefore underestimations). e
re
For nearly a quarter of the students with an available file, there were reports that o
more of their siblings had been officially criminalised. In addition, for 38% of the
students with an available file, one or more of their siblings had serious problems at

201
school. Many of these school problems resulted in suspensions and exclusions. He
again, notwithstanding the limitations incurred by the fluctuations in data availability,
the pattern over the 30 years points towards an increasing level of criminal involveme
and criminalisation in the families of The Haven’s children.
re
nt
he social ecology in which the 300 children developed was, for most of them, a brutal
io-economic deprivation, social marginalisation,
eu
ppened to the children in their home, schools, and community
nvironments.
S
T
environment, characterised by soc
family dysfunction, mental health problems, alcohol and drug addiction, intrafamilial
violence, and crime and criminalisation. It was a milieu marked by social exclusion
from the labour market, and from the prospect of adequate health and security, a mili
imploding on itself through interpersonal violence and crime.
II - WHAT HAD HAPPENED TO THEM?
I turn now to what ha
e
A. Child Abuse
1. Victims
Official abuse (i.e., abuse recorded by DFS) featured in two-thirds of the population
across the three decades, and three-quarters of the population of the 3rd decade. DF
classifies child maltreatment into four categories (neglect, physical harm, emotional
harm, and sexual harm), and I use these in my analyses.

202
For a great majority of the children, maltreatment took several forms; that is, as Table
ight years. The mean age when abuse was first
documented was between 5 and . T e w as la
d 12 and s old. T er mea en abu
l decade ther t fo 2n
a of abuse ot due on h o
t ny students during the last decad ere still un 12 in 2005.
T ficially abused students from the 1st to the last decade, both as
a proportion of the population (from % to 77%) as a proportion of students with a
D 93% ex ar a
E d maltreatment is more frequent today than one or two decades
ago, I suspect that the increase in the 3rd decade resulted from an actual increase in
incidence. Moreover, The Haven files documented child abuse that was not reported to
aven population reached 74% across the decades and 90% in
7.7 shows, they had often suffered three types of maltreatment. The average span of
documented abuse was over e
6 years old he mean ag hen abuse w st
ocumented was between 14 year he low n age wh se was
ast documented for the 3rd (12 ra han 14 years r the 1st and d decades)
nd the lower mean span was n to a reducti in the lengt f abuse, but
o the fact that ma e w der
he marked increase of of
44 and
FS contact (from 76% to ), cannot be plained by v iation in data vailability.
ven if reporting of chil
DFS. When these school records are added to the DFS records, the proportion of
abused students in The H
the last decade.

203
Table 7.7. Patterns of officially recorded child abuse
1st decade 1973-1982
2nd decade 1983-1992
3rd decade 1993-2003
Total 1973-2003
Students with a DFS file N=33 N=75 N=119 N=227 Total abused students a 25 (76%) 64 (85%) 111 (93%) 200 (88%) % Neglect 60 75 85 b 78% Physical harm c 72 89 86 85% Emotional harm d 96 92 86 89 % Sexual harm e 28 42 34 36
Co-morbidity f 2.6 3.0 2.9 2.9 Span of documented 9.6 9.2 7.3 8.2 abuse (mean years) g
Mean age at 1st report 5.0 5.9 5.6 5.6 Mean age at last report 13.6 14.1 11.9 12.8
Notes: a Percents in bold are calculated on the number of DFS files. Percents in types of
conservative, as reports of abuse by family services from other Australian states are possible. Reasons for any contact with DFS include child abuse, youth crime, or both.
c Includes beatings, but not light corporal punishment as part of parental discipline. d
actual abandonment. e Includes sexual harms from the least severe such as exposure to pornograph
child abuse are calculated on the number of abused children. These figures are
b Includes neglect of physical and/or educational needs.
Includes verbal abuse, “scapegoating,” exposure to domestic violence, and threat of and/or
y to the most severe such as rape.
sed on the types of maltreatments, not on the number of instances of maltreatment.g From the first to the las ot all Child Protection Notifications (CPN) were
2. Maltreaters46
, safe havens were a rare thing. In addition to maltreatment by
amily members, nearly a third of the officially abused children had been maltreated by
approved non-family carers (Table 7.8). Sexual abuse was predominantly intrafamilial:
had been victim of sexual harms had been abused by adult
f Means ba
t report of child abuse. During this period n“substantiated,” but most of them were.
For many of the children
f
over two-thirds of those who
family members and siblings.
46 This is the official term used by DFS.

204
Table 7.8. Maltreaters
1st decade 1973-1982
2nd decade 1983-1992
3rd decade 1993-2003
Total 1973-2003
Number of students reported to DFS for child abuse
N=25%
N=64%
N=111%
N=200%
Alleged maltreater By mothers a 76 84 95 89 By fathers a 72 91 100 93By stepmothers b 12 14 10 11 By stepfathers b 56 36 41 41 By siblings c 32 42 47 43 By relatives d 12 19 18 17 By approved carers e 20 31 36 32 Co-morbidity (mean number of maltreaters)
2.80 2.94 2.98 2.95
Sexually abused students N=7 N
N=27%
N=38%
N=72%
By adult family members f 1 59 68 60 By siblings 1 15 3 8By approved carers e 2 7 16 14 Extrafamilial 3 22 18 22 Unknown 0 0 18 10Multiple abusers 1 26 18 21
Notes: In official records, abandonment by mothers was generally considered as
b
efigures also include fights and rejection/scapegoating of student.
such as teachers, police officers, social workers, and staff from care or justice institutions.
In addition to documented child abuse in school and DFS records, parental/carer
discipline was reported in DFS or The Haven files to be inconsistent for most available
cases, and physical punishment to be frequently used. For instance, discipline had been
described as inconsistent in at least 64% of the population, and physical punishment had
been used in 52% of these cases. During the last decade, these proportions were
respectively 79% and 63%.
a
constituting neglect or emotional abuse, but abandonment by fathers was not. To rectify thisgender bias, I coded all abandonment by fathers as emotional abuse. To these categories I added the cases of three adoptive mothers and four adoptive fathers.
c In addition to unambiguous maltreatment such as severe beatings and sexual abuse, th
d Includes grandparents, uncles, aunts, and cousins. e Includes foster carers, and all those who had a temporary guardianship over the student
f Includes parents, stepparents and relatives.

205
B. Transient Existence, Instability, and Insecurity
1. Official placements47
S file, had be fficially placed by DFS outside their original family
their developm . The aver number of placements during the
s close to ith a max ents. The average span
first to st placem as about n years. T verage
e average
As Table 7.9 shows, over half of The Haven total population, or over two-thirds of the
children with a DF en o
at some stages of ent age
placement history wa 15 w imum of 75 placem
of placements from the the la ent w seve he a
placement history started at age 10 and ended at age 15. Most of those who had been
placed had experienced about three types of placements. Many of the placed
individuals had been institutionalised (close to 70%). Placement in Boystown48
b 5 (often for three years) had occurred for a third of those who had etween age 12 and 1
been placed. Over the three decades, the proportion of placed students and th
number of placements per student had increased.
47 The categories of placements included: (a) home placements (i.e., placed at home but under DFS
care (i.e., longer term placements with “private” apsupervision), (b) respite care (i.e., short-term placements to provide respite to parents/carers), (c) foster
proved carers), (d) placements with relatives, (e) placement in youth shelters (generally during adolescence), and (f) institutions (e.g., institutional care
cilities, hospitals, Boystown, and youth detention centres). 48 Boystown opened in 1961 and closed down in 2002. The institution was run by the Catholic order of the De La Salle Brothers. It was located about 60 kilometres South of Brisbane. The criteria for referral included: boys aged at least 12 years old or over, and in most cases, under the care and control of DFS. All the children were boarders. The boarding arrangement involved a “cottage system” supervised by “house parents.” It was run as a secondary school and offered educational programs equivalent to Grade 8, 9, and 10 curricula (according to some reports from the DFS files, the educational standards were much lower than what was expected in public schools). In 1996 Boystown looked after 84 children aged between 12 and 15 years old. While in 1995 corporal punishment was abolished from Queensland state schools, in 1996 Boystown was still using corporal punishment (“the strap”) as part of its official
fa
discipline policy.

206
Table 7.9. Placements during the length of students’ contact with DFS
1st decade 1973-1982
2nd decade 1983-1992
3rd decade 1993-2003
Total1973-2003
Students with a DFS file N=33 N=75 N=119 N=227
Students22 (6 %) 58 (7 %) 74 (62%) 154 ( 8%)
officially placed by DFS a 7 7 6
Mean N placements in recorded 1 1 6 1 history
9.32 5.38 5.3 14.5
Mean N placements per year b 9 8 1.41 2.22 2.5 2.2Mean age at 1 pst lacement 4 8 9.86 9.72 8.1 8.9Mean age at last placement 1 1 1 9 6 6.32 6.03 3.0 14.6Mean span of placements 6 8 (in years) c
7.45 7.31 5.9 6.6
Types of placements d
% Home placements e 86 76 38 59 % Respite care f 9 47 34 35% Foster care g 36 41 54 47% Placement with relatives h 23 45 31 35% Youth shelters i 32 36 18 27 % Institutions j 100 86 47 69% Unknown 0 2 9 5Mean N types of placements 2 3 5 7 .86 .37 2.4 2.8
N nts in bold are calculated on the number of DFS files. Percents in each category of placements are calculated on the number of students wh ve been p d. b s can vary from a few months to 18 years (i.e., from birth to le
ents in every
otes: a Perceo ha lace
Recorded historie galmajority), so I calculated the individual ratio between the total number of placements and the span of placement history. c Calculated from age at 1st placement to age at last placement. d Not only could placed students experience multiple instances of placemchistory, but they could also experience several categories of placements as indicated by themean number of types of placements.
ategory of placements as indicated by the mean number of placements in the recorded
e This category means that the child is not placed outside the home, but the home is
ith foster parents. Because it was not rare r these placements to break down relatively quickly, they can in fact be rather short. This category includes not only grandparents, uncles, aunts, and cousins but also older
old.
one facility to another.
st rd
portion of placements in respite care, with relatives,
and foster parents had significantly increased.
supervised by DFS. f This category involves short term placements, generally in crisis situations. g This category involves long term placements wfoh
siblings and friends.i This category includes many types of facilities generally for adolescents over 12 yearsBecause expulsion from these facilities (usually for breaking the facility’s rules) was frequent,these placements were particularly transient, and many students bounced endlessly from
j This category includes total institutions for children and adolescents (e.g., Warilda Children’s Home, Boystown), hospitals, and Youth Detention Centres.
From the 1 to the 3 decades, home placements and placements in institutions had
reduced. On the other hand, the pro

207
The reduction in the proportion of home placements may be related to the greater
were considered incapable (even under DFS supervision) to
ies
e
tly used
placed
. Home changes
ssociated with official placements and the transient lifestyle of many families, home
hanges were a frequent experience. For instance, at the time of referral to The Haven,
t least 95 students had experienced a recent house move, frequent changes of home, or
both. For an additional 181 students it was possible to estimate the minimum number of
proportion of parents who
care for their children, and the greater proportion of foster placements a consequence of
this. It is also possible that staff reduction in family services (which was mentioned in a
number of files), an increase in the number of families in trouble, and particular polic
reduced the likelihood of home supervisions. The general societal trend toward de-
institutionalisation was probably a factor in the decreasing proportions of students
placed in institutions across the three decades. For instance, during the 3rd decade, ther
was no report of placement at Warilda Children’s Home,49 which was frequen
during the previous decades. Boystown closed in 2002. More than two-thirds of
students during the 1st decade had been to Boystown, and about 38% during the 2nd
decade, compared to 18% during the last decade.
2
A
c
a
known home changes during their recorded life course. The average number of home
changes during the recorded histories of these 181 individuals was 16 with a maximum
of 100 changes. The average number of changes per year was highest during the last
49 Warilda Children’s Home originally opened in 1865 and was known then as Diamantina. In 1910 it moved to a location about seven kilometres North of Brisbane city where it operated until it was closed in 1989. It had been renamed Warilda in 1964. It was run by the Queensland government and it lookedafter male and female children and adolescents. Warilda and Boystown, as well as many other facilities where students had been placed, were cited in the Crime and Misconduct Commission of inquiry oabuse of children in care in
n the Queensland (2004).

208
decade. These data document the precariousness of the lives of many of these
individuals, lives lacking in stabili rit co K lite ,
which sh hool exclusion statistics.
3
The children who transited through The Haven suffered even mo ersity.
e rom siblings, death of significant
others, and a variety of other traumas (Table 7.10). oss the th ecades, a st
143 students (48% of the total population) had experienced separations from siblings
either through parents’ separation, siblings’ placeme , thei nts, or a
ion)
s
judicial processes, and
ad
nt
. Schooling Before Referral
Before entering The Haven, they had on
verage changed school three times, that is, nearly one school change every year (Table
ty and secu y, and they nfirm the U rature
ows an overrepresentation of children in care in sc
. Additional traumas
re adv They
xperienced traumatic events such as separations f
Acr ree d t lea
nts r own placeme
combination of these circumstances. In at least 113 cases (38% of the total populat
a host of other traumas were reported, such as serious injuries through accidents, losse
t
severe emotional ordeals. For instance, some students had witnessed the suicide or
hrough house fire, child custody battles, other types of traumatic
murder of a parent. Before reaching adulthood, at least a quarter of the students h
experienced the death of a significant other (e.g., parent, sibling, relative, close friend).
In 30% of these cases (in nearly 8% of the total population) the death of the significa
other had occurred through suicide, drug overdose, and even murder.
C
1. Educational instability
Reflecting the patterns of official placements and house moves, there was little
educational stability in the life of the children.
a

209
7.11). Moreover, a third of the 234 students for whom information was available o
schools before their placement at The Haven had experienced more than three school
changes (the maximum was 45!). In addition to school moves associated with changes
in locations incurred by placements and domestic moves, formal school exclusions
compounded the problem of educational instability.
Table 7.10. Additional traumas a
1st decade 2nd decade 3rd decade Total
n
1973-1982 1983-1992 1993-2003 1973-2003 At least one file available
(The Haven or DFS) N=33N (%)
N=85N (%)
N=145N (%)
N=263N (%)
Separation from siblings 19 (58%) 51 (60%) 73 (50%) 143 (54%) b
Other traumatic events c 13 (39%) 37 (44%) 63 (43%) 113 (43%)
Death of significant others d 11 (33%) 34 (40%) 31 (21%) 76 (29%)
Notes: a These figures are conservative as additional traumas could have occurred for other
tion, and/or student’s placement, blings’ placement.
udes traumatic events suffered by students such as injuries caused by accidents, losses through house fire, child custody battles, other types of traumatic judicial processes, and
eals (e.g., witnessing the suicide or murder of a significant other). iblings, relatives, and close friends; in most cases the event occurred
1973-1982 1983-1992 1993-2003 1973-2003
students, but these were not mentioned in the files. b Separations from siblings caused by parents’ separaand/or sic Incl
serious emotional ordd Includes parents, sbefore the student had turned 18.
Table 7.11. Schooling pattern before entry to The Haven
1st decade 2nd decade 3rd decade Total
At least one file available (The Haven or DFS)
N=33 N=85 N=145 N=263
Available data a 21 (64%) 68 (80%) 145 (100%) 234 (89%) Mean N school changes
3.48 3.75 2.90 3.20 before entry% Students who repeated a grade before entry b 38 10 21 20
Notes: a Percents of students with at least one file. b Percents of available data.
2. Discipline and punishment
Data on suspensions and exclusions before entry to The Haven were available for 214
students (81% of the students with at least one file or 71% of the population). Nearly

210
three-quarters of these students had been suspended, and over half of them had
excluded at least once (Table 7.12). Moreover, informal suspensions were documented
in 41% of the cases. Particularly between the 2nd and 3rd decades when more data wer
been
e
vailable, the results suggest that formal and informal suspensions significantly
oportions of formal exclusions remained stable.
(see
s
of
ven
a
increased, but that the pr
These results are consistent with the literature from the UK, the USA, and Australia
Tables 1.1 and 1.2 in Chapter 1), which pointed to a steady increase in the rate of
official suspensions over the years, but a stable pattern in the rate of official exclusion
during the last 10 years. The data from the 3rd decade also highlight the importance
the dark figure alluded to by the literature. At least 52% of the students had been
informally suspended at least once during the last decade.
Table 7.12. Formal and informal suspensions and exclusions before entry to The Ha
1st decade 1973-1982
2nd decade 1983-1992
3rd decade 1993-2003
Total 1973-2003
At least one file available (The Haven or DFS)
N=33 N=85 N=145 N=263
Available data a 13 (39%) 58 (68%) 143 (99%) 214 (81%) % Informal suspensions b NR 22 52 41 % Formal suspensions c 38 43 85 71 % Formal exclusions c 77 52 52 53
Notesab
: a Percents of students with at least one file. Percents of suspensions and exclusions re calculated on available data. Negotiated with parents/carers (i.e., the “dark figure” of school exclusionary practices).
recorded per student. s recorded per student.
haviour,
playtime, and corporal punishment) had been used with a large number of students. As
Often more than one instance wasc Often more than one instance wa
Before entry to The Haven, other “proactive strategies” (e.g., praise for good be
dialogue, rewards, and ignoring misbehaviour) and “reactive strategies” (e.g., behaviour
contracts, warnings, in-class and out-of-class time-out, detention and deprivation of

211
expressed by The Haven’s principal in a final report in 1995, “by the time a student w
offered a placement at The Haven, they had been through a whole range of manageme
strategies: rewards (in the form of stickers, lollies, computer time, privileges, etc.),
contracts, corporal punishment, detention, suspension, counselling, and even
exclusion.”
as
nt
ry
Students’ experience with educational support before entry to The Haven was available
only rd d (Table Judg the last decade’s
f t a gr of al s the
s ts ha age th ently
r
ferral to The Haven, many students had already been withdrawn from regular schools
special units such as
Centres for A ernative Progra es us
Although the figures in Table 7.13 suggest a great amount and variety of support,
qualitative accounts from the files paint a different picture. In many cases the delivery
te. Oftentimes, the files mentioned
at support had been interrupted due to a lack of resources.
3. Educational support before ent
for those in the 2nd and 3 ecades 7.13). ing from
igures, it would seem tha eat amount education support wa provided to
tudents, although the suppor varied. Be viour man ment was e most frequ
mentioned type of support. Although some support had been provided in the regula
classroom, in about half the cases the students had been removed from the regular
classroom or the regular school in order to receive support. Therefore, even before
re
and placed for a period of time in special facilities (many in
lt ms as the r ult of long s pensions).
was haphazard, chaotic, untimely, and inappropria
th

212
Table 7.13. Educational supports before entry to The Haven
2nd decade 1983-1992
3rd decade 1993-2003
The Haven files a N=48%
N=145%
Type of support Social skills b 33 57Behaviour management 71 94 b
Specific academic subjects/skills b 48 66 Counselling/therapy c 46 63 Mean N types of support 2.50 2.96 Site were support was provided On-site in regular classroom 52 94On-site in special classroom 42 55Off-site in special unit/school 46 46 Mean N locations 1.83 2.34
Notes: No data were available for the 1 decade. Data were available for 49% of cases
b Within the regular classroom/school or in a special classroom/school.
cross the three decades, an average of five distinct agencies had been involved with
close to one agency per year ha lve he rd he dep
of th fess ohen, 1 . 178) i ives o
s was wi gi s
a h profession nvolved in r 80% of the cases.
late into treatment. Rather the
ajor task was assessment. For example, during the last decade, 48% of the students
a st
during the 2nd decade, and 100% during the 3rd decade. Percents are calculated on the number of available cases.
c Provided by the school and/or within the school (e.g., by Guidance Officer/school psychologist).
4. Non-educational supports
A
the students and their families during their recorded histories (Table 7.14). On average,
d been invo d. During t 3 decade t loyment
e “people-processing pro ions” (C 985, p nto the l f the
tudents and their families impressive, th psycholo sts, psychiatri ts, and
ssociated mental healt als i ove
This involvement, however, did not automatically trans
m
were referred for assessment of a speech problem, but only a third of the assessed
students received speech therapy. Many school files, in relation to speech-language
difficulties, documented a maddening obsession with assessing and re-assessing
students, rarely followed by delivery of the service, or far too late, only when the

213
problem had seriously worsened. Often behaviour management was preferred because
it was a cheaper option even when speech-language difficulties clearly contributed to
the behaviour problem.
Table 7.14. Non-educational support in recorded histories
1st decade 1973-1982
2nd decade 1983-1992
3rd decade 1993-2003
Total 1973-2003
At least one file available (The Haven or DFS)
N=33 N=85 N=145 N=263
Support by agencies Support provided by at
agency aleast one non-educational 25 (76%) 74 (87%) 139 (96%) 238 (90%)
Mean N agencies in histories 5.76 5.70 4.36 4.92 Mean N agencies per year 0.40 0.52 0.88 0.72
Support by professionals Support provided by at least one professional a 18 (55%) 73 (86%) 145 (100%) 236 (90%)
% Psychologists/counsellors 33 53 81 69 % Psychiatrists/paediatricians 67 75 83 80 b
% Speech therapists 28 26 48 39 % Social workers 56 45 46 46 Mean N categories professional support
1.89 2.32 2.96 2.68
Notes: a Percents in bold are calculated on the number of students with at least one filePercents in categories of professionals are calculated on the number of student who receiprofessional support. b I also included occupational therapists in this professional category.
.ved
III - WHO WERE THEY?
by the schools and
FS.
So far my analyses have been based on counts of events or things that occurred or did
not occur. As I turn to address “who were they,” I introduce a new dimension for the
analysis, that is, how the children were portrayed or constructed
D

214
A. Psychosocial Profile50
1. Unhappy, defiant, angry, and aggre
The aggregate psych s typic presents as the
characteristics of students with Emotional and Behavioural Disorders (EBD), that is,
t excluded from school: depressed moods, attention
p ggression, fficulties with p er relationships, and
delinquent behaviours. The profile of probl was greater he 3rd decade (Table
7.15).
1st decade 1973-1982
2nd decade 1983-1992
3rd decade 1993-2003
Total 1973-2003
ssive
osocial profile i a what the litel of rature
hose who are the m st likely to beo
roblems, non-compliance, anger, a di e
ems for t
Table 7.15. Psychosocial profiles at entry to The Haven a
Available data N=19 N=72 N=145 N=236 Behaviour problems % % % % b
Clumsy/untidy appearance 5 28 58 44 Depression/sadness 37 68 89 78 Impulsivity/mood swings 5 56 78 65 Hyperactivity/attention problems 47 76 92 83 Anger 32 78 98 86 Callousness 11 64 92 77 Defiance/non-compliance 79 89 99 94 Pre-delinquent behaviours 53 79 86 81Aggression 68 93 99 94 Poor social skills/peer-relationship problems
37 78 100 88
Sexualised behaviours 11 33 33 31Attention seeking with adults 16 51 62 55Means on total behaviour
12.26 30.15 45.01 problems scale
37.84
Notes: a The coding used for this table is available in Appendix 2.b At least one item forming the subscales was coded “yes.” Percentages based on available
B. Health Profile
The health profiles present a population of children with seriously damaged health, who
were heavily medicated. Across the decades, at least 87% of the students with an
data.
50 The method used to code the psychosocial profile is available in Appendix 2.

215
available file, or 76% of the population, had been reported to suffer from one or more
types of chronic health problems at the point of entry to The Haven, that is, when they
were on average 10 years old. As Table 7.16 shows, the norm was about four types of
ealth problems per individual.
Five types of problems were mo ly a d order
frequency they were: behaviour disorders, self-h mune deficie
tal problems. The use of medication was extremely
80% o students, the use of psychoactive medication
during the last decade was asto
st a worsenin the health iles over ti Changing terns
consistent with the ch profile
l and associated
roblems (e.g., epilepsy and incontinence) decreased, while the reports concerning
behaviour disorders, self-harm, and immune system problems increased.
h
st common reported. In escending of
arm, im system ncies,
mental illnesses, and pre/neo-na
frequent . Involving close to f the
unding.
The results also sugge g of prof me. pat
of health problems across the decades are anging of
students in The Haven’s intake from the 1st to the 3rd decades (from Chapter 6). From
st rdthe 1 decade to the 3 decade, the reports concerning neurologica
p

216
Table 7.16. Health profiles up to entry to The Haven a
2nd decade 1983-1992
3rd decade 1993-2003
Total 1973-2003
1st decade 1973-1982
At least one file available (The Haven or DFS)
N=33 N=85 N=145 N=263
Students with recorded )
health problems b 18 (55%) 66 (78) 144 (99%) 228 (87%
% Pre/neo-natal & early years 33 35 21 26 % Genetic 0 9 5 6 % Gross motor 11 26 26 25 % Neurological 44 23 10 16 % Epilepsy 17 14 9 11 % Autism 0 8 13 11% Bed-wetting/soiling 39 20 13 17% Vision/eye 0 15 10 11 % Hearing/ear 0 11 11 10% Immune system 17 20 42 34 % Behaviour disorders 61 62 74 70% Mental health 22 21 30 27% Self-harm 22 33 56 45 % Alcohol/drug 6 17 10 11 % Other chronic 0 21 35 2% Medication 89 56 78 73 Co-morbidity 3.00 3.61 4.01 3.81
Notes: a The descript rie lth pro ava Appeb ulated on the number of students with at le one file. Percents i ated on the number of students with reco d h
C. Cognitive Profile
A udents (arou 0% of th with a re ed cogni
profile) were cognitively functioning at an range) or slightly
above average level (Table 7.17). The results are consistent with The Haven’s policy,
adopted early during the 2 decade, th nts w usly d cog
elow average. Non-verbal functioning tended to be stronger than verbal functioning,
ected in a predominantly male population. However, the proportion
ion of the catego s of hea blems is ilable in ndix 3. Percents in bold are calc astn categories of health problems are calcul rdeealth problems.
cross the decades, most st nd 7 ose cord tive
average (IQ in the 85-100
nd at stude ith serio impaire nitive
functioning were not accepted. About a third of the students functioned below or well
b
which would be exp
of students with learning difficulties was significant: over half the entire population and
three-quarters of the population of the 3rd decade experienced such difficulties.

217
Table 7.17. Cognitive profiles at entry to The Haven a
1st decade 1973-1982
2nd decade 1983-1992
3rd decade 1993-2003
Total 1973-2003
At least one file available (The Haven or DFS)
N=33 N=85 N=145 N=263
General cognitive (58%) 63 (74%) 133 (92%) 215 (82%)
functioning b 19
% Above average 21 30 20 23 % Average 47 51 48 49 % Below average 32 17 30 26 % Well below average 0 2 2 2 Verbal functioning b N=7 40 (47%) 116 (80%) 163 (62%) % Above average n=0 17 17 17 % Average n=3 63 49 52% Below average n=4 17 27 26% Well below average n=0 3 7 5 Non-verbal functioning b N=7 40 (47%) 118 (81%) 165 (63%)% Above average n=2 30 27 28% Average n=4 45 50 49% Below average n=1 18 20 19% Well below average n=0 7 3 4Students with learning difficulties b, c 15 (45%) 47 (55%) 110 (76%) 172 (65%)
% Speech language 73 55 58 59% Other problems 0 15 20 17% Not specified 27 30 22 24Other cognitive problems d % Short-term memory difficulties 27 51 54 51 % Processing speed difficulties 40 51 47 48 % Concentration/attention difficulties 27 38 32 33
Notes a Most of the file that reported on the cognitive functioning provided informationgathered from the Wechsler Intelligence Scale For Children [WISC – R or WISC III], sometimes from other instruments such as the Stanford-Binet Intelligence Scale and the
characteristics: a mean of 100, a standard deviation of 15, and verbal and nosubscales. The scores themselves were not always recorded. Often the files o
: s
McCarthy Scales of Children’s Abilities; however, all these instruments share common n-verbal nly provided
nterpretation of the scores (i.e., above average, average, below average). For the terpretation of the scores, I used the following criteria: scores above 100=above average,
scores between 85 and 100=average, scores between 70 and 84=below average, and scores below 70=well below average (the details and rationale about this interpretation are provided in the codebook, which is available from the author on request). b Percents in bold are calculated on the number of students with at least one file. Percents in the rating of general, verbal, and non-verbal functioning, and the types of learning difficulties and other cognitive problems are calculated on the number of students with a corresponding cognitive profile. c There were 210 cases which contained some information on learning difficulties; out of those only 38 mentioned that the student had no
an iin
learning difficulties (2nd decade=8, 3rd
decade=30). d These three types of problems were facets of cognitive functioning instruments such as the WISC. Percentages are calculated on the number of students reported to have learning difficulties. Percents add up to more than 100% because the students could experience several types of problems.

218
Furthermore, amongst learning difficulties, speech-language problems were frequently
reported: they represented near he r icu fected st a
third of the student population. T ion betw fficulties in verbal expression
and aggression, especially amo we nte h
literature (Dionne et al., 2003; Snow & Powell, 2002). Other cognitive problem
generally associated with Emotiona Behaviou isorders (E ) such as
d rm memory, processing speed, and conce /attention were
also reported. During the 3rd decade these specific difficulties affected one-third to one-
half of the students.
D. Academic Profile
entry to The Haven were more complete, the results show that many
roblems with their schoolwork. The figures in Table 7.18
vels
nd rd
ests;
et, academically their performance was below or well below average. In fact 58% of
ly 60% of t eported diff lties, and af at lea
he relat een di
ngst boys, is ll docume d by the psyc ological
s
l and ral D BD
ifficulties with short-te ntration
Focussing only on the 2nd and 3rd decades when data on the academic performance of
he children before t
students experienced p
suggest that during the last decade the levels of literacy were even lower than the le
of numeracy. There is also an indication that the academic profiles had worsened from
the 2 decade to the 3 decade. Yet, some available data on two areas of the
curriculum, science and social studies, and art and craft, suggest strength in subjects
relying on hands-on activities and project design.
An important educational feature is the relatively low association between cognitive and
academic profiles. When I compared these profiles, I discovered that 86 students
functioned at an average or above average cognitive level, as measured with IQ t
y

219
the students with a poor academic performance had an average cognitive functioning.
These results suggest that the poor academic ildren ore
likel milial instability umas rather than with cognitive
d
T profiles at to Th
t one file available n or DFS)
2nd decaN=85
3rd de e N=145
achievements of many ch were m
y to be associated with fa and tra
eficits.
able 7.18. Academic entry e Haven a
At leas(The Have
de cad
General academic performance b 60 (71% 144 (99%) )% Good 17 8% Average 28 21% Low 35 39% Very low 20 32Literacy b, c 41 (48% 14) 2 (98%) % Good 27 15% Average 19 18% Low 27 29% Very low 27 38Numeracy b 31 (36% 136 (94%) )% Good 19 13% Average 29 29% Low 39 34% Very low 13 24
N ents from the 1st decade was too scant to be included. b bold are calculated on the number of students with east one file. rcents in the ra ing of general academic performance, literacy, and numeracy are calculated on the
not ge-
rds of academic progress were patchy, the results give the impression that
ose with a record, well over 80% improved across the general curriculum or in some
otes: a Information on stud Percents in at l Pe
tnumber of students with a corresponding academic profile. c Essentially about reading; however, for 19 students whose reading performance wasassessed but who were rated for their “language-writing” performance, I used the “languawriting” measure.
IV - WHAT HAPPENED DURING THEIR TRANSIT THROUGH THE HAVEN?
. Academic anA d Social-Behavioural Progress
Although reco
many children, if not most of them, made some academic progress at The Haven. Of
th

220
area of it (Table 7.19). However, despite progress, nearly two-thirds of the students still
performed below their grade at exit. Given that over two-thirds of the students entered
The Haven with serious academic delay, especially during the 3rd decade, and given the
decreasing length of placements, it is not surprising that many continued to experien
academic difficulties at exit.
Social-behavioural progress was more consistently recorded, and it was possible to
assess the level of such progress for all the students who transited through The Haven
during the 3rd decade.
ce
During this decade, only 10% of students did not make any
rogress, and over a third made significant progress. The results indicate that a higher
ailed to make any social-behavioural progress in the 2nd decade,
d
p
proportion of students f
when the focus at The Haven was on compliance training. Five students were exclude
from The Haven, four of them during the 2nd decade. However, a fifth of the population
of the 3rd decade was at some stage suspended from The Haven. Suspensions and
exclusions from The Haven were in response to seriously dangerous and/or violent
behaviours, as well as frequent absconding from the school.

221
Table 7.19. Academic and social-behavioural progress during placement at The Haven51
2nd decade 1983-1992
3rd decade 1993-2003
At least one file available (The Haven or DFS)
N=85 N=145
Reports on progress in at least one m area a, b 58 (68%) 127 (88%)
curriculu% Yes, progress were made c 84 96 Reports on global academic progress a, b, d 54 (64%) 96 (66%)
% Yes, global academic progress 80 c 81Reports on progress in literacy a 33 (39%) 106 (73%) % Yes, progress in literacy 88 85 c
Reports on progress in numeracy a ) )31 (36% 96 (66%% Yes, progress in numeracy c 84 82Reports on level of academic
a readiness at exit) ) 34 (40% 114 (79%
% At grade level 14 35% Below grade level 59 65Reports on behavioural progress at
62 (73%) 145 (100%) exit a
% Significant progress 73 37% Some progress 13 53% No progress 23 10
Exclusionary practices a 58 (68%) 145 (100%) % Suspended from The Haven 14 21% Excluded from The Haven 7 1
N ents in bold are calculated on th mber of stu s with at least one file. Percents i culated on the number of students with a corresponding report. b riting, reading, spelling, maths, ce/soc
V - CONCLUSION
The re
xclusion, especially the studies on primary school exclusions in England and Wales
isser, 2003). All the characteristics
n
otes: a Perc e nu dentn other rows are cal
Language/w scien ial studies, and art and craft. c Missing percents correspond to those students who did not progress. d Progress across the curriculum.
sults presented in this chapter are consistent with the literature on school
e
(e.g., Hayden, 1997; Parsons et al., 1994; Pavey & V
highlighted by the literature were present and particularly salient in this population of
excluded primary school children: low socio-economic background, overrepresentatio
reported that eight of 11 students had progressed academically, and 15 of 16 students had progressed behaviourally during their placement at The Haven in the 1st decade.
51 Information on students from the 1st decade was too scant to be included in the table. However, DFS

222
of ethnic minorities, family dysfunction, overrepresentation of boys with emotional and
behavioural problems, and learning difficulties, who were often placed in the care of the
state. These children had been excluded predominantly from large disadvantaged
schools. An important finding was the extent of the dark figure of unofficial
exclusionary practices (i.e., informal suspensions). The number of children officially
spended from school had also increased over the years. The involvement of health
e
he results are also consistent with the literature on social exclusion. The social
environment in which these children were born had all the hallmarks of the underclass:
exclusion from the labour market and from the prospects of adequate health and
personal security, along with the presence of family violence and criminalisation. The
results, therefore, strongly support Parsons’ thesis that “school exclusions are part of
wider social exclusions related to inequality and poverty” (1999, p. 37). My data go
further than this. For example, I documented appalling levels of poor health, child
abuse, and educational instability caused by residential mobility, which were similar to
su
professionals, especially psychologists and psychiatrists, and the medicalisation of th
problem of school disruption and exclusion through ADHD diagnoses and subsequent
medication, were strong and increasingly featured.
The socio-economic, familial, health, and educational experiences of The Haven
students, particularly for the 2nd and 3rd decades, are similar to those reported by
Berridge et al. (2001) for 343 UK students. This suggests that the findings on the
contexts of school exclusions in my study are generalisable to other populations of
excluded students and other jurisdictions.
T

223
those in Berridge et al.’s study. These findings are key empirical discoveries, which
support the theoreti l linkage between the on of l exclusion and a
strong version resul highlight f the dynamics of
educational exclusion, where a “toxic soci ent” (Conroy & Brown, 2004, p.
233) affects cognitive development (e.g., speech problems), emotion and behaviours
( forman ults owballing effect
f b l di ademic failure,
f ms of educational exclusion. In the ine what
happened to the children after they left The Haven and where they ended up.
ca phenomen educationa
of social exclusion. The ts also some o
al environm
e.g., aggression), and academic per ce. The res suggest a sn
rom a nexus of socially induced ver a fficulties, aggression, and ac
uelling the mechanis next chapter I exam


CHAPTER 8
THE EXCLUDED: THE LATER YEARS
This chapter explores the socio-educational situation of the 300 individuals from the
time of exit from The Haven to the time of the last record of them. Five domains are
examined: (a) educational, (b) health and medical, (c) occupational, (d) social and
domestic, and (e) criminal. Most of the data come from the Department of Family
Services (DFS) and the Queensland Police Service (QPS) records, and occasionally
from The Haven.
I – WHERE DID THEY END UP?
A. Educational Situation
Following their transit through The Haven, the students faced seriously poor
educational prospects and outcomes. Across the decades, 6% of the students for whom
a school file or a DFS file was available repeated a grade during the years following
their exit from The Haven (13% during the 2nd decade). Overall a third of the students
experienced further Student Disciplinary Absences (SDAs) during their schooling
(Table 8.1). This finding is consistent with the literature on educational exclusion and
segregation, which points out that (a) initial school exclusions are followed by further
exclusions and (b) that reintegration is rarely successful after removal of students from
regular schools and their placements in withdrawal units. Three-quarters of the students
who had a record of further SDAs after their exit from The Haven were permanently
excluded from school. During the 2nd decade, when all the students on whom data were

226
available had reached adulthood in 2005, the proportion of permanent exclusion reached
89%. The results not only confirm the literature on primary school exclusion, which
emphasises the deleterious repercussions of such exclusions for the secondary school
years, but also support reports of increasing rates of SDAs from primary schools (e.g.,
Hayden, 2002; Pavey & Visser, 2003).52 For instance, the proportion of further SDAs
from primary schools was 40% for the students of the 2nd decade, but was 71% for the
students of the 3rd decade.
Table 8.1. Post-The Haven grade repetition and Student Disciplinary Absences (SDAs)
1st decade1972-1982
2nd decade 1983-1992
3rd decade 1993-2003
Total 1973-2003
At least one file available (The Haven or DFS) a
N=33%
N=85%
N=145%
N=263%
Repeated a grade 12 13 1 6 Went to Boystown b 45 26 9 19 Post-The Haven SDAs c 33 42 28 33
Students with SDAs only d
N=11%
N=35%
N=41%
N=87%
Type of SDAs e Suspensions 45 54 58 55Exclusions 73 89 66 76Time of SDAs f
SDA from primary schools 18 40 71 62SDA from secondary schools 82 80 56 79
Notes: a Information for this table was more likely to come from DFS files; however, some of The Haven files reported further SDAs in their post-exit follow-up. b Information about placements at Boystown was available for all cases, because being under the care and control of DFS was a precondition of such placements. c Student Disciplinary Absences (i.e., suspensions and/or exclusions). d Figures refer to at least one instance of suspension, exclusion, or both; in fact some students were suspended or excluded more than once. e Percents add up to more than 100 because some students were both suspended and excluded. f Percents add up to more than 100 because some students had SDAs from both primary and secondary schools.
52 Although the rates of permanent exclusions presented in Chapter 1 (Tables 1.1 and 1.2) appear to have stabilised in most jurisdictions during the last ten years, these rates include both primary and secondary exclusions. Apart from Indiana for year 2002, and Tasmania for years 2001 and 2004, the separate rates of primary exclusion for Tables 1.1 and 1.2 were not available. Note that in Tasmania, the rates of primary school suspensions up to 2 weeks grew from 17.8 to 39.9 per 1,000 between 2001 and 2004.

227
A complete schooling history was available for half the students who were 17 years or
older in 2005 (Ta 2, and more
than half left school before Grade 10. Among those who completed Grade 10, most
(65%) had done so at Boystown. Many qualitative reports suggest that educational
standards at Boystown were significantly lower than those in regular secondary
schools.
Table 8.2. Academic completion for students aged 17 or over in 2005 for whom a full
schooling history was available (N=112)
Students with full schooling history
ble 8.2). Overall, only 5% of them completed Grade 1
53
1st decade1972-1982
N=19
2nd decade 1983-1992
N=52
3rd decade 1993-2003
N=41
Total 1973-2003
N=112Level of completed education % % %%Left school before Grade 10 68 5432 52Completed Grade 10 63 36 27 38 Completed Grade 11 5 2 2.5 3 Completed Grade 12 0 10 2.5 5
Of students who completed Grade 10 or above
N=13 N=25 N=13 N=51
Grade 10 at Boystown 77 64 54 65
B. Health and Medical Situation
Across the three cohorts, 45% of the 300 individuals were suffering from one or mo
chronic health problems during the years following their exit from The Haven (Table
8.3). Alcohol and drug abuse was the most frequently reported problem.
re
53 DFS files reported that regular schools and employers did not regard Grade 10 at Boystown as a valeducational credential, and many students who had completed Grade 10 at Boystown were described as illiterate. For instance, at the age of 20, a student with a criminal history was referred by the court to a
id
literacy program. He had completed Grade 10 at Boystown.

228
Table 8.3. Post-The Haven health/medical situation
Age group cohorts in 2005 a
N=132 (44%)26 & over 18-25 years
N=73 (24%)9-17 years
)N=95 (32%)
Total 9-45 years
N=300 (100%Students with reported
Haven bmedical conditions post-The N=63 (48%) N=44 (60%) N=28 (29%) N=135 (45%)
Students with at least one reported medical condition c
Types of medical condition N=63
%N=44
%N=28
%N=135
%Behaviour disorders 25 52 39 36Mental illnesses 51 36 25 41Alcohol/drug abuse 68 68 29 60Self-harm/suicide ideations & attempts
44 57 46 49
Other chronic health problems d
37 41 14 33
Systemic medication 46 43 43 44Co-morbidity e 2.48 2.70 1.63 2.38
Notes: a Percent of entire population. b Percent of age group in 2005. c Operationalisatio of categories is th h ile ind Includ tor, n ical, g late m tion),epilepsy, im er chro problems s as heart d ase, diabetes, and ce lth problem catego (maximum=13 [the 9 categories in no usb tal illnesses, al ol/drug ab nd self- /suicide i ons and attempts).
The health situation of the 18-25 year cohort was particularly poor, with over 50%
having had more than two chronic health roblems. Among these problems, the
proportions of alcohol and drug abuse, self-harm, an icide ide and atte
tal illnesses tended to
. Although the records indicated only two deaths, both through accidents,54 it is
possible that a larger proportion of individuals were dead by year 2005. I did not have
n e same as t e health prof s presented Chapter 7. e vision, hearing, gross-mo
mune system, and otheurolog enetic ( anifesta autism, nic uch ise
ancer.Mean number of hea ries te d plehaviours disorders, men coh use, a harm deati
p
d su ation mpts
were especially high. As individuals grew older, reports of men
increase.
The health profile of The Haven students was not unlike that of the family they grew up
in
the resources to examine the level of mortality; however, the health data and the
54 One student died in a house fire at the age of 19, in 1993, and one died in a scooter accident at theof 10, in 2005.
age

229
literature on life course criminology suggest the possibility of high levels of mortality
(Laub & Sampson, 2003).
C. Occupational Situation
Reports providing information on the occupational situation of the students were
available for 164 individuals (55% of the population), and about 60% of these reports
oncerned individuals who were not yet 18 years old at the time of the last report. Most
aining 67 individuals, although they had
reached an age when they could have o % ere ng.
One of the most frequent situat e of the last report, especially for those 18
a ation, with 67% i cerated. ever, thi rcentage
inflated because the most likely repo t wo d come fr As a proportion of the
entire population, 20% were incarcerated at the time last occupational report.
c
of the under 18 years old were still at school; however, 15% were incarcerated in youth
detention centres (Table 8.4). For the rem
been empl yed, only 15 of them w worki
ions at the tim
nd older was incarcer ncar How s pe is
r ul om QPS.
of the

230
Table 8.4. Occupational situation at last available report
Age group cohorts at last report (years) a
26 & oN
18 7 Tover=27 N=
-25 40 N
-17=97 N
tal =164
% Population for whom a report is available
9 14 32 55
% Reports per age group
0017 24 59 1
Occupationals
N=27 N=40 N=97 N=164 ituation
% Studying 0 0 67 40 % Working 7 20 3 8 % Unemployed/ pensioner
15 12.5 10 12
% Hospitalised 4 2.5 3 3 % Incarcerated 74 62.5 15 37% Dead 0 2.5 1 1
N each group c e older i than ind by the ag p at la st report only establ ife course.
students who were 7 years old at the time; the latest dividuals who were 42 years old at the time.
-17 age group cohort, one of the most frequently recorded living arrangements was
e but
ata
for
ving with their biological parents.
ale
otes: Individuast report. The la
a ls in ould bishes the extent of the documented l
n 2005 icated e grou The
earliest report post-The Haven involvedreport post-The Haven involved in
D. Domestic Situation
Data on living arrangement at last report was available for 177 students. Apart from the
7
being in jail (but see above). At last report, homelessness was only mentioned twic
when intermediary reports were considered rather than the last reports only, the d
indicated many instances in which homelessness preceded incarceration. The results
the age group cohort 7-17 showed that about 44% of the individuals in this age group
were not li
Although admittedly incomplete (N=167 records), the results about the relational
situations of the students at the time of the last report appear to mirror the domestic
patterns in their families given in Chapter 7. There were a few cases of documented
teenage parenthood, and a significant proportion of domestic violence against fem
partners. Of the 41 individuals aged between 18 and 42 with a report on relationships,

231
19 males abused their female partners. There were also signs of the emergence of large
families, and of the abuse of children. Out of 55 children born to 23 former students of
he Haven, 44 were maltreated.
istories and the definitions I used in Chapter 5. QPS criminal histories are a record of
all offences that are processed through the Queensland criminal justice system, which I
call “official criminal or official offending histories,” as well as records of Care and
Control Orders and warrants. They include offences dealt with through police caution,
family conference, and court. They provide information about dates of offences, dates
of finalisations, types of legal charges (e.g., stealing), counts of legal charges (e.g., three
counts of stealing), adjudications (i.e., proved or not proved), and penalties. I use the
term “alleged offences or alleged offending” in reference to all the offences in the
criminal history proved or not proved, and the term “proved offences or proved
T
E. Criminal Involvement
For some former students, the data in the previous sections highlighted some features of
their socio-educational situation; yet, in many domains, the information was incomplete
and only provided a rough idea of their circumstances. However, their criminal
histories were complete (at least for offences committed and adjudicated in
Queensland). Data from QPS include both juvenile and adult criminal histories, and
whether the offences were eventually proved or not; that is, it has all official contacts
with the Queensland criminal justice system.
For the sake of clarity, I recall here the types of information provided by QPS criminal
h

232
offending” in reference to offences proved in court or dealt with through a police
caution or family conferen
igures on olume and e of allege fences tha e not
f the alleged es resul onvictio e rate of conviction
for juvenile and 9 for adult. flecting a w known patt in the
2006; Daly et al., 2005) there is a low rate of conviction for alleged
ending. Close to 50% f such alleged offences did not result in conviction
f the
trate on alleged offending.
Total N alleged offences proved and unproved
ce.
Table 8.5 presents f the v typ d of t wer
proved. Most o offenc ted in c ns. Th
reached 94% 0% Re ell- ern
literature (Daly,
sexual off o
(over 60% during the 2nd decade). Because of the overall high rate of conviction, and
my focus on contacts with the CJS for criminal matters rather than the working o
CJS, throughout this chapter I concen
Table 8.5. Volume and type of alleged offences not proved for students with an official
criminal history up to 01/01/2005 (N=178)
1st decade
N=693
2nd decade
N=1,579
3rd decade
N=860
Total
N=3,1321973-1982 1983-1992 1993-2003 1973-2003
% Proved offending a
All offences proved 92 93 92 92Juvenile offences proved 96 95 92 94Adult offences proved 91 90 91 90
% Alleged offences not proved b per category of offences c
Violence against persons (total N=372) 5 9 8 8 Sexual (total N=41) 33 63 31 46 Property (total N=1440) 10 8 11 9 Criminal damage (total N=344) 17 4 4 6Drug (total N=251) 7 4 7 5Good order (total N=393) 0 4 0 2Driving/traffic (total N=46) 9 27 0 13Other (total N=245) 1 5 4 4
Notes: Only two individuals out of the 178 charged for criminal matters were never r l
had also alleged offences that were proved.
See Appendix 4 for the details of the types of offences.
a
convicted. One was charged as an adult for criminal damage and the other as a juvenile foassault. Sixty-four individuals had some alleged offences that were not proved, but they al
b Includes not guilty, charge dismissed, and nolle prosequi.c

233
DFS and The Haven files provided some additional information about CJS contacts (for
instance with the police) and offending behaviours, which were not recorded in QPS
riminal histories. The sources included self-reports, and reports by carers, schools, and
paring the dates and the types of offending behaviours
s have been officially or unofficially55 in
ontact with the CJS, and 59% have an official criminal history.56 The second key
c
social workers. Through com
mentioned in The Haven and DFS files with the criminal histories provided by QPS, I
was able to ascertain that these offending behaviours, which I call “unofficial
offending”, had not been officially recorded by QPS.
1. Contacts with the CJS: caught in the net
A striking feature is the extent of the students’ involvement with the CJS (Table 8.6).
Close to three-quarters of The Haven’s student
c
feature is the increasing share of such contact when one compares the 1st and 2nd
decades. The lower proportion of CJS contact for the last decade is largely attributable
to the younger age of this cohort in 2005. A third important aspect is the duration of
CJS contacts. Across the decades, the average span of CJS involvement was close to
eight years, and, as would be expected, it is longer for the cohorts from the 1st and 2nd
decades.
55 For instance the police and/or the Juvenile Aid Bureau (JAB) were involved when students absco
JAB visiting students’ home to inform parents, and warn and admonish students in relation to de
nded from or were excessively violent or destructive at The Haven. There were also reports of police and/or
linquent acts which were not followed by criminal charges, often because the students had not reached the age of criminal responsibility (10 years). 56 Three individuals had a CJS contact for warrants only, and one individual for an unpaid fine only (i.e., not for criminal matters).

234
The fourth remarkable characteristic is the increasingly younger age at which, on
average, the first contact occurred. For all contacts (i.e., official and unofficial), the
ean age at first contact was 16 for the 1st decade, close to 14 for the 2nd decade, and
st
ey
1/2005
1st decade 1973-1982
2nd decade 1983-1992
3rd decade 1993-2003
Total 1973-2003
m
about 11 for the last decade. For official contacts only, the mean age at first contact
shifted from about 17 for the 1st decade, to 15.5 for the 2nd decade, and 12.5 for the la
decade. Fifth, is the relatively low proportion of official CJS contacts that involved
only juvenile matters. Focusing only on the 1st and 2nd decade students,57 we see that
contacts with the CJS continued in adulthood for many students, although for some th
started in adulthood.
Table 8.6. Contacts with the criminal justice system (CJS) up to 01/0
N=57%
N=98%
N=145 a
%N=300
%All contacts b 68 82 68 73 Mean age at 1st contact c 16.00 13.88 10.82 12.87 Mean age at last contact 26.08 23.50 14.04 19.67 d
Mean span of contact (in years) e 11.08 10.63 4.22 7.80 Official finalisations f 65 80 46 61Mean age at 1st contact c 16.84 15.46 12.51 14.65 Mean age at last contact g 2 26.59 3.63 15.84 21.36 Mean span of contact (in years) h 4. 10.78 9.10 31 7.68
N ls from the 3rd decade with an officia S involvement were nototes: a 36 individua l CJ 18 in 2b ficial and unofficial) the CJS: police and/or JAB involvement reported by Th an unsafe m ontacts with police or JAB reported by DFS, and official fi atter ( minal or noc ars to 39 years. d from 7 years to ears. e last con (range: 1 31 yearsf atters as rded by QP in the crim l histories. I udication of breaches, and offending fi nference, or for cautions. g d from 5 years 2 years.h een first and last finalisation (range: 1 to 28 years).
005. Include all contacts (of with
e Haven when students absconded from and/or were behaving in anner at the school, unofficial cnalisations reported by QPS on any m cri t). Age ranged from 5 yeAge at last contact rangedNumber of years between
42 ytact first and
Refers to official finalisations of m to ).
reco S inanclude: Care & Control meetings, warrants,nalisations through court, c
adjo
Age at last finalisation rangemalto 4
Number of years betw
57 The mean age of the 3rd decade population was only about 16 years and there was little time for contact age variations in 2005 will be with the adult system. The problem of “right-hand censoring” d e tou
addressed in Chapter 9 on individual criminal trajectories.

235
2. Offending
lose to three-quarters of The
aven historical population had engaged in offending behaviours at some stage in their
reased from 65% in the 1st decade to 83%
and
The records from QPS indicate that 178 individuals (59% of the population) had an
official criminal history, but the records from DFS and The Haven permit an
examination of unofficial offending (see Table 8.7). Officially recorded alleged
offending is shown in Tables 8.8 and 8.9.58
General patterns of alleged offending (official and unofficial)
Including officially recorded and unofficial offending, c
H
life course (see Table 8.7). The proportion inc
in the 2nd decade. This growing trend persists in the 3rd decade. Unofficial offending
formed an increasing share of offending over time. For officially recorded offending,
the age of onset decreased over time from about 18 years to 12.5 years. The average
duration of offending was about eight years, although expectedly longer for the 1st
2nd decades because of right-hand censoring.
58 For all the analyses, I use the categories in the Queensland Extension of the Australian Standard Offence Classification (ASOC) (Office of the Government Statistician, 2000). ASOC includes 16 offencecategories. I have reduced the original ASOC classification to eight categories (see Tables 8.7-8.9). From the ASOC scheme I also created 12 categories of seriousness, from 1=least serious (e.g., indecent exposure, possess weapons, traffic offences) to 12=most serious (murder). For a more detailed account of ASOC and my subsequent coding scheme, see Appendix 4.

236
Table 8.7. Patterns of alleged offending (officially and unofficially recorded) up t
01/01/2005
1st decade
o
1973-19822nd decade1983-1992
3rd decade Total 1993-2003 1973-2003
Entire population
% % % %N=57 N=98 N=145 a N=300
All offending (official and unofficial) 65 83 72 74Officially recorded offending 60 79 46 59Unofficially recorded offending 37 52 59 53
Students with officially or unofficially recorded offendingN=37
%N=81
%N=105
%N=223
%Official offenders only 43 37 18 29 Unofficial offenders only 8 5 36 20Both official & unofficial offenders 49 58 46 51Span of offending (means, in years)Age at first offence (all offending) b 15.8 13.2 10.5 12.4 Age at last offence (all offending) c 26.6 23.3 13.9 19.4 Span of offending (all offending) d 11.8 11.0 4.5 8.1 Age at first offence (officially 17.7 16.0 12.4 15.0 recorded offending) e
Age at last offence (officially 27.5 23.6 15.8 recorded offending) f
21.5
Span of officially ecorded offending r g 10.8 8.6 4.4 7.5Students with r eunofficially ecorded off nding h
N=21 %
1%
N=5 N=86%
N=158%
Male 95 90 98 95 Female i 5 10 2 5Type of unofficially recorded offending j
Violence against persons 38 45 50 47Sexual 38 25 14 21 Property 76 75 42 57Criminal damage 48 41 28 35Drug 33 51 16 30Good order 10 25 57 41 Driving/traffic 5 6 1 3 Other 0 2 3 3 Mean N category of unofficially recorded offending
2.48 2.71 2.12 2.35
Notes: a 36 individuals with an official offending record were not 18 in 2005 (all from the 3rd decade).
ence (range: 1 to 25 years).
y, compared ith 55% of the boys.
j I did not record the volume of unofficial offending, only whether or not unofficial offending had been mentioned at least once in each of the categories. Percents add up to more than
b Age range at first offence: 5 to 39 years.c Age range at last offence: 7 to 42 years. d Mean number of years between first and last offence (range: 1 to 31 years).e Age range at first officially recorded offence: 10 to 39 years. f Age range at last officially recorded offence: 10 to 42 years. g Number of years between first and last officially recorded offh Most students with unofficially recorded offending also had official offending.i Of the 26 girls who had been placed in The Haven, 31% had offended unofficiallw
100% because individuals could have engaged in several types of unofficial offending. Appendix 4 provides the details of the categories of unofficially recorded offences listed inthe table.

237
Of 158 individuals who engaged in offending behaviours that did not come to police
attention (i.e., unofficial offending), almost half targeted persons, and close to
targeted property. Around one-third committed criminal damage, were involved
illicit drugs, and engaged in behaviours that w
60%
with
ould officially be classified as offences
against good order.” A fifth engaged in offending behaviours that would officially be
In other words, for the majority the
composition of their alleged offending was adult only or adult and juvenile. When we
focus on those offenders of the 3rd decade who were over 18 in 2005, already 41% had
an adult criminal history.
“
classified as sexual offences.
Patterns of officially recorded alleged offending
Across the three decades, 178 individuals, or nearly 60% of The Haven population, had
an official criminal history (Table 8.8). During the 2nd decade, the proportion was
nearly 80%. Most of the offenders were male; only ten (6%) were female. However,
the share of female offenders, of the 26 girls in The Haven historical population, was
nearly 40%. Patterns of alleged offending59 for the 1st and 2nd decades show that only a
minority did not continue offending as adult.
59 Recall that by alleged offending I mean any offending recorded in the official criminal history whether it was ultimately proved or not. I recorded as an alleged offence any distinct type of offences, even if several offences may have occurred during a single event, such as insult police, resist arrest, wilful damage (damaging the police car) and assault police (coded as four offences). I only recorded the number of alleged offences not the number of charges (e.g., four counts of stealing was recorded as one lleged offence of stealing). a

238
Table 8.8. Patterns of alleged offending for students with an official criminal history
to 01/01/200
up
5 (N=178)
Offending
1st decadeN=34
%
2nd decadeN=77 N
%
3rd d=% %
ecade Total67 a N=178
J venile offending only 15 17 81 41 uAdult offending only 35 21 1 16 Both juvenile & adult offending 50 62 18 43 Gender of offender Male 91 95 96 94 Female b 69 5 4 Types of offences c
Violence against persons 53 58 57 57 Sexual 12 12 7 10Property 85 81 75 79 Criminal damage 41 58 64 57 Drug 50 49 25 40Good order 59 66 57 61 Driving/traffic 2 12 9 149Other 47 49 31 42 Category of offending Offended only against persons d 3 1 3 2 Did not offend against persons e 41 38 40 39 Offended both against and not 56 61 57 59 against personsMean N types of off
lity) f3.61 ences 3.76 3.86 3.25
(versatiMean index of seriousness g 6. 6. 58 6.16 38 57 5.
N individuals from the 3rd decade with an official nding record were nototes: 36a offe 18 in 2b cial records of alleged offending compared wic dd up to more than 100% becaus ividuals c have co tted sevetypes of offences. ee Appendix 8.1 for the d s of the t of offenc d d sexual offences. e olent and sexuf B eight categories of offences under the headi Types of ces.” g ale of seriousness from 1=least serious (offences against justice procedures) to 12=most serious (murder). For each case I recorded the most serious o
in the patterns of alleged offending, with
portion had
inst persons, but with a variety of other offences.
005. e Haven, 39% had offiOf the 26 girls placed in Th
of the boys. th 61%Percents a e ind ould mmi ral
SIncludes violent an
etail ypes es.
All types of offences except viased on the
al. ng “ offen
Based on the sc
ffence proved.
The results show a large degree of versatility
an average of nearly four offence types per offender. Only a negligible pro
been charged solely with crime against persons. About 40% of offenders had not been
charged with crime aga

239
Volume of alleged offending
eir
d
alleged offending for students with an official criminal
istory up to 01/01/2005 (N=178)
lleged offences proved & unproved
Altogether, 178 individuals had allegedly committed 3,132 distinct offences during th
recorded history (Table 8.9). During the 1st decade, over three-quarters of the allege
offences concerned adult offending, but during the 2nd decade the proportions between
adult and juvenile alleged offending were rather similar.
Table 8.9. Volume and type of
h
Total N a1 decade 2nd decade 3rd decade Total st
1973-1982 N=693
1983-1992 N=1,579
1993-2003 N=860 a
1973-2003 N=3,132
Mean N offences proved & unproved 20.4 5 12.8 17.6 per individual b
20.
Mean N offences per youth proved & 8.5 13.6 11.4 11.9 unproved c
Mean N offences per adult proved & 17.7 11.4 6.8 12.4 unproved d
Most serious alleged offence (proved & unproved) e %Violence against persons 12 12 11 12 Sexual 1 1 1 1 Property 4 44 49 46 6Criminal damage 8 11 14 11 Drug 6 10 7 8Good order 14 13 11 13 Driving/traffic 3 1 1 1 Other 10 8 6 8 Total 100 100 100 100
Total alleged offences against persons (proved & unproved) f
Total juvenile offences N=162 N=814 N=752 N=1,728 % Juvenile offences against persons 9 12 13 12Total adult offences N=531 N=765 N=108 N=1,404 % Adult offences against persons 15 15 6 14
Notes: a 36 individuals from the 3rd decade with an official offending record were not 18 in 2005. b Range: 1 to 102 alleged offences (proved and not proved). c Range: 1 to 102 alleged offences (proved and not proved). d Range: 1 to 79 alleged offences (proved and not proved). e See Appendix 4 for the details of the types of offences. f Includes violent and sexual offences.

240
3. Crime and punishment
The Haven versus general population
The results show that a fifth of the e bee nced
to detention at least once in their life, and a quarter of the entire population of The
Haven had actually experienced incarceration at lea ce in th ife. Tha re
individuals had experienced detention than the numb entence detentio as a
p stance, QPS s etimes indicated tha eniles w put
u S Car and Control Order an ntioned “strict custody” for a specific time;
t t these individuals had bee nt to a y detent entre, e though
n al offending had been recorded, f any of ing had n record the
p ment. DFS records were helpfu this regard as they
often reported periods of incarceration that were not the result of a detention sentence.
Carrington (1993, p. 70) has documented, how the “welfare/justice
,
of abused children being placed in juvenile detention centres
uents, mmitted any
Table 8.10 compares the rates of criminal court contacts (alleged offending),
convictions, and jail sentences of The Haven population, with rates provided by a
number of Australian and American general population studies. To make valid
comparisons, I selected the age group cohorts at The Haven and the relevant variables in
order to match The Haven data with the data provided by the general population studies.
ntire population of The Haven had n sente
st on eir l t mo
er s d to n w
uzzling discovery. For in om t juv ere
nder a DF e d me
his meant tha n se outh ion c ven
o offici or i fend bee ed,
enalty did not indicate impris no l in
nexus” in operation
until the early 1990s, and its system of Care and Control Orders and protective custody
resulted in many cases
because it was “the only available placement:”
In any case, homeless youth and “disturbed teenagers” continue to be treated like delinqconfined in secure institutions, surrounded by razor wire even though they have not cocriminal offences (Carrington, 1993, p. 86).

241
The results show that the rates of male juvenile convictions at The Haven were more
e rates provided by two South
ustralian studies (Morgan & Gardner, 1992; Skrzypiec & Wundersitz, 2005).
for alleged offending by age 21 were nearly five
times higher for m les and seven times hi to
a New South Wales population study ( r, , 2 p
N rates of first contact with the criminal court as a juvenile were around
2 ema m The Haven. In addition the rates of
convictions by times higher
a en, the rates of jail sentences b e 21 for m s were 4 es higher, and
the number of females from The Haven sen nced to ja y age 21 w also highe
( to 0.09%). It is important that although these rates are
o the t w the
r uded s ents (Be e et al., ; Pritcha
C
than double those of male juvenile convictions reported by Blumstein et al. (1986) for
the general population in the USA. The rates of male juvenile contacts with the CJS at
The Haven were nearly double the rates of male juvenile contacts with the CJS reported
by Wolfgang, Figlio, and Sellin (1972), and three times th
A
The rates of criminal court contacts
a gher for females from The Haven compared
H eua, Bak & Poynton 006). Com ared to the
SW study, the
0 times higher for both males and f les fro
age 21 for males and for a serious violent offence were 70
t The Hav y ag ale 0 tim
te il b as r
13% compared to keep in mind
utside norm when compared with general populations, they are consisten ith
ates observed in populations of excl tud rridg 2001 rd &
ox, 1998).

242
Table 8.10. Comparisons of rates of criminal court contacts, convictions, and jail
tudies and the population of The Haven
Hua et al. All persons born 1984 All at least 21 in 2005 )
sentences between general population s
(2006) NSW
NSW N=81,784
(21 y.o. in 2005)
The Haven N=172
(Crime data censored at 22Males Females Males Females
N=41,840 N=39,944 N=149 N=23(51.2%) (48.8%) (86.6%) (13.4%)
By 21 appeared in court at least once for alleged offending 15.7% 3.8% 72% 26%
First appeared as juveniles 3.8% 1.1% 81% 22%By 21 convicted once for a serious offence against persons a
0.4% 28% By 21 Sentenced to jail (including care and control order) 0.9% 0.09% 36% 13%By 21 have appeared in court more than once 4.9% 1.5% 58% 17%
Blumstein et al. (1986) USAThe Haven N=181
(Crime data censored at 18) 26-28% males convicted as juvenile 61%
35% males born 1945 with at least one recorded
contact with CJS by age 18
The Haven N=181 Wolfgang et al. (1972) USA:
police contact as juvenile for non-traffic offence
Morgon & Gardner (1992) South Australia:21% of individuals born 1972 and 18% of individuals born 1962 (gender not specified) with at least one
Skrzypiec & Wundersitz (2005) South Australia:20% males born 1984 arrested by age 18
(Crime data censored at 18)
66%
Note: a Includes murder, sexual assault, assault occasioning bodily harm, and robbery (not comm
Patterns of incarceration for The Haven students
time in
Over
er a
incarcerated (42% over the decades). Over three-quarters of the 75 individuals who had
on assault).
One-third of the 178 officially recorded offenders had been sentenced to serve
detention by a court at some stage during their offending history (see Table 8.11).
half of those sentenced to serve time in detention were juvenile offenders, and ov
third were sentenced to serve time in detention again as adult offenders. Contrary to
normal sentencing patterns, an even higher share of The Haven students were

243
been incarcerated had been detained as juveniles. Thirty young people had been sent
youth detention centres (through a Care and control Order, or in remand, or because it
was “the only available placement”) without being sentenced to serve time in detention,
and 43% of them eventually returned to detention as sentenced adults. Reflecting the
patterns reported earlier about the increasingly younger age of criminalisation over the
decades, the mean age at first period of incarceration decreased from 16.3 years
to
in the
st decade to 15 years in the last decade. 1
Table 8.11. Patterns of sentences to serve time in detention and patterns of
incarceration for students with an official criminal history
1st decade 1973-1982
2nd decade 1983-1992
3rd decade 1993-2003
Total 1973-2003
All official offenders N=34
%N=77
%N=67
%N=178
%Sentenced to serve time in 44 43 15 33 detention Has been incarcerated 53 51 27 42
Juvenile and adult patterns
serve time in detention among offenders sentenced to N=15 N=33 N=10 N=58
Only as a juvenile 6 15 50 19 Only as an adult 67 39 30 45Both as juvenile and adult 27 46 20 36
Juvenile and adult patterns
incarceratedamong those who have been N=18 N=39 N=18 N=75
Only as a juvenile a 22 15 72 31 Only as an adult 39 23 6 23Both as juvenile and adult b 39 62 22 47
Span of incarceration Mean age at 1st incarceration c 16.3 15.7 15.0 15.7 Mean age at last incarceration d 24.6 22.6 16.8 21.7
Notes: a Sixteen individuals have never been sentenced to serve time in detention and one did not even have an official criminal record; yet, these 17 young people spent time in youth detention centres, as part of a Care and Control Order, or in remand, or because it was “the only available placement.” b Thirteen individuals have never been sentenced to serve time in detention as juveniles; yet, they spent time in youth detention centres, as part of a Care and Control Order, or in remand, or because it was “the only available placement.” c Range: 10-23 years old. d Based on last recorded incarceration as of 2005; range: 13-42 years old.

244
Table 8.12 presents the key features and
d om the U Pritchar et
al., 2006), which are co ith The
w 25; and
results of other stud age 25. Because the
Farrington et al.’s cohort is nt
g pact of school
exclusion on offending.
W cohort had at least one c ,
th
The Haven. W
t
temporal relation between formal permanent exclusions and criminal convictions, 63%
dge et al.’s study, and 58% at The Haven,
ormal permanent exclusion. The
st
4. The effect of school exclusion on offending
findings of three studies of offending
evelopment fr K (Berridge et al., 2001; d , 1998; Fa & Cox rrington
mpared w Haven. I focus on Farrington et al.’s results
hen their cohort had reached age to make valid comparisons, I show the
ies of school exclusion and crime up to
not a group of excluded stude s, it can be viewed as control
roup, against which to co the findinmpare gs of other studies on the im
hile 34% of Farrington et al.’s riminal conviction by age 25
is compares with 63% for Pritchard and Cox, 65% for Berridge et al., and 57% for
hile 26% of Farrington et al.’s cohort had been incarcerated by age 25,
his compares with 37% for Pritchard and Cox and 44% for The Haven. For the
in Pritchard and Cox’s study, 45% in Berri
had their first criminal conviction after their first f
analysis shows that despite some differences in the datasets and the focus of Pritchard
and Cox’s, Berridge et al.’s, and my study, the proportions of excluded youth who are
convicted and incarcerated are remarkably similar. The percents are substantially
higher than Farrington et al.’s cohort of youth who were not excluded, and they sugge
a strong relationship exists between school exclusion and crime.

245
on o
n of
fend
ing:
com
para
tive
anal
ysis
sn
0d
(19
98
) r
e e
t al.
0
Ta
(5
Stu
die
s’ k
ey f
eatu
reFarr
ig
ton
et
al.
(2
06
) P
ritc
har
& C
ox
Be
rid
g(2
01
) h
e H
ven
20
0)
Loca
tion
UK
UK
UK
Aust
ralia
Sam
ple
siz
e 411
227
343
300
Gen
der
All
mal
e12
e2
al6
sM
aFe
les=
215
mal
es=
Mal
es=
261
Fem
als=
8M
ales
=274
Fem
es=
2
Soci
o-e
conom
ic
D w ci
isa
or
ty
dv
kin area
l “
g
spr
na
South
n
et
rmer
w
he
at“
bl
fre
e sc
m4 R
lc
min
ori
2
dv
gS
as
of
isnta clas
of g
ed (
a d
el fr
omiv
ed i
Londo
a ner
-”)
Not
report
ards
of
td b
u s
t 1
0e
% f
oElig
ie
for
7% acia
-eth
ni
hool
eal”
ties
7%
Dis
aan
taed
(ee
Ch
pte
r6-8
t
hes
)
Age
stu
ran
ge
in’s
res
ulcl
uded
in
tsdy
ye o
l o
ld
inBet
wee
n 1
4 a
nd 2
4 y
ears
ie
0
d 2
005
All
25
ars
d in 1
978
Bet
wee
n 1
6
1998
and 2
3 y
ears
old
Bet
wen
1an
d 2
5 y
ears
ol
inn 2
001
Sch
oio
report
ed b
ut
lw
junio
r sc
hool at
tain
men
t w
as a
si
gnific
ant
risk
fac
tor
in
ndin
g
All
per
man
ently
excl
uded
; pla
ced in a
n
“Educa
tional
Beh
avio
ura
Dis
td U
nit”
(EBD
Uw
e
Ar
ntly
exc
d(
a71,
im
72)
bet
1
-1(p
rim
ar
seco
ndar
y=73%
)
itw
mim
aol
ow
ing o
r not
a a
us
ol ex
clus
nN
ot
o
offe
form
ally
lly
16
urb
eee
n) 1-
bet
the
ags
of
1
ll pe
man
efo
rmlly
=2
nfo
ral
ly=
988
998
school=
27%
,
lude
wee
ny
All
whdra
n f
ro p
rry
sc
ho
fol
lfo
rml per
man
ent
excl
ion
Key f
ind
ing
s
N in
crim
tp
iic
N=
141 (
34%
) N
=143 (
63%
) M
ale
137 (
64%
) m
=6
%
N4
%) 72%
)e
7 (
45%
)
N=
172 (
5%
)al
()
ota
l sa
mnal
conv
bef
ore
age
26
le w
ith
tion(s
) s= al
esFe
(50
)
=22
(65
Mal
es=
187 (
Fem
als=
3
7)
Mal
es=
164 (
60%
Fe
mes
=8
31%
O
f th
ose
convi
nce
shar
offen
ces
bef
ore
age
26
cted
, th
eof
3e
e %
20%
viol
0%
36
58%
Of
those
convi
rce
be
26%
37%
(29%
follo
win
g a
er
ve t
ime
n
Not
report
ed b
ut
N=
8 o
f sa
mple
8 inte
rvie
wee
had
be
carc
erat
ed
cted
, %
ef
ore
ag
inca
26
rate
dse
nte
nce
to s
ntio
e in m
andet
and 8
% in r
ed)
sub-
s 44%
of
2en
in
Tem
bet
per
por
tiw
eem
anh
excl
usi
o
convi
cti
d
N=
227
63%
had
convi
ctio
n(s
) a
leav
ing E
BD
U
N=
263
No c
on
on=
85 (
32%
) 1
st b
efore
ex
clusi
1 (
23%
) 1
st c
onvi
ctio
n a
fter
ex
clusi
on=
117 (
45%
)
4on=
52 (
37%
) b
efore
usi
7)
convi
ousi
al r
ela
n f
orm
ent
scn a
nd
on(s
)
on
al ool
crim
inal
Not
report
eft
er
a vict
i c
onvi
ctio
non=
6
N=
11
b
No c
onvi
cti
1st c
onvi
ctio
nex
clon=
(5%
1st
cti
n a
fter
ex
clon=
82 (
58%
)
Note
s a E
i n
ot
incl
uded
in B
erri
dge
et a
l.’s
anal
is b
ecau
se t
had
bee
n in
form
ally
exc
l(
2)
us
or
convi
ctio
eva
ilable
(N
=8).
bO
nly
141 s
tuden
ts f
rom
The
Hav
en w
ere
know
n t
o h
ave
bee
n form
ally
per
man
ently
excl
uded
at
som
e st
age
duri
thei
r sc
hoolin
g.
yse
studen
ts h
uded
N
=7
or
dat
es o
f ex
clio
n
ng
Tabl
e 8.
12.
The
effe
ct o
f sch
ool e
xclu
si
ghty
cas
es w
ere
re n
ot
an w

246
VI - CONCLUSION
left The
roke
t
nswering these questions is the object of the next two
hapters.
In this chapter I have documented the circumstances of the excluded after they
Haven. The general picture is grim across all domains (i.e., educational, occupational,
relational, medical, and criminal), increasingly so over the decades, and reproduces the
patterns observed in their families of origin. At the aggregate level, there was little
sense of social mobility. Deprivation, poor health, violence, crime, and the last st
in the exclusionary process - incarceration - were major features in their trajectories.
Did some manage to escape from this path? How and why? What can be learned abou
individual trajectories? A
c

CHAPTER 9
R AL TRAJ ES
Chapters 6 and 7 exami ial, an duc
circums a ual characteristics of the child
their cement a h e hen they were on average 10 years old. In
developmental c inology these sets of circums s and a
are conceptualis s n cto ncreas f
likelihood of following a delinquent path. In Chapter 8, I reported on the educational
and soc a
e en and u ye 005. p ial focused on crime c inalisatio d
w that near 0% t ff l criminal history. My analyses we
ua at an agg e e e relati e cial
cu tanc u , and es.
th hapter, I the elations, that is, I examine how risk and protective
to an accou ia the criminal trajectories of individuals. I also
dr a numbe on ere raised in my review of taxonomic, static,
na the s ld pmenta d life course crim logy (Chap
or y i me data in my study I use Group-Based
aje ry Modelling (G M).
C
ned t
s the
IMIN
he socio-econom
individ
ECTORI
faic, mil d e ati
ren
on
a
al
t thetances, as well time of
tics
ent
n an
re
and
ter 4)
pla t T
rim
d a
n of
e H
ris
th
av
k a
e 30
n w
d protective fa
0 individuals during the years following their placem
ta
th
nce
at i
individu
e or buf
l c
er a
hara
gain
cteris
st thee
tio
rs
ial situa t
.
Th
sho
sit
cir
In
fac
ad
dy
In
Tr
Hav
ed
ted
ms
p to
ly 6
regat
divid
ar 2
of
lev
al ch
I es ec
hem had an o
l and did not
aracteristics
ly
icia
xam
and
ons betw
rim
en soin
ou
e
tco
the
mes, in
is c
rs c
ess
mic
der
explore
nt for v
r of que
in the
se the lo
se r
tions in
s that w
of develo
tudinal cri
ar
sti
fie
ng
orie
nal
l an ino
to a
cto BT

248
I - GROUP-BA ODELLING
le
f case membership in these trajectory groups.60
Nagin (2005) claims that the great advantage of this technique over traditional
taxonomic schemes is that the number of di inct trajectory groups is not delineated a
priori along a theoretical framework in which the data are made to fit (e.g., Moffitt’s
taxonomy), but emerges from the data. The specific groups emerging from the data can
then be examined and compared across a set of other variables in order to discover if
these groups are in effect showing distinct profiles. Apart from Laub and Sampson’s
(2003) study, another good example of the use of this technique is Nagin’s (2005)
modelling of Farrington and West’s (1990) study of offending development from age 10
to 32, which was based on a yearly count of criminal convictions in a population of 411
British lower class males.
SED TRAJECTORY M
A. The Technique
Group-based trajectory modelling (GBTM) is a statistical technique developed by
Nagin (2005) to analyse quantitative longitudinal data. Using count of events (e.g.,
number of offences), scaled data (e.g., levels of aggression), or a dichotomous variab
(e.g., employed/unemployed) measured several times across a specific period, this
procedure models the number and the shape of distinct trajectory groups that overall
best fit the data. Results are presented in an easily interpretable graphical format. The
analysis also indicates the proportion of cases in each trajectory group and the
probability o
st
60 GBTM is performed using the SAS package and the “Proc Traj” procedure developed by Nagin and colleagues (described in Jones, Nagin, & Roeler, 2001). My sincere thanks go to Michael Livingston who assisted me with his statistical skills for this complex analysis.

249
B. Application of GBT
ilar to Nagin’s application of the technique on Farrington and
y
ree
it
yet 17 years old in 2005 were excluded from
rd
8%) had offended past the
61
M in my Study
My use of GBTM is sim
West’s data. However, given the great variation in the age of my population in 2005
(the youngest individual was 9 years old and the oldest 45 years old), I had to split m
data into three cohorts and generate a model for each. The chosen age span for the th
cohorts was guided by my data and by theoretical considerations. The first cohort (A)
has 222 individuals aged 17 years or older in 2005; I modelled their trajectories from
age 10 through 16. Ten is the age of criminal responsibility, and 16, the upper age lim
of what is considered juvenile offending in Queensland. The second cohort (B) has 141
individuals who had reached the age of 25 in 2005; I modelled their trajectories from
age 10 to 25. The third cohort (C) has 95 individuals who were 30 years or over in
2005; I modelled their trajectories from age 10 to 30.
By necessity, 78 individuals who were not
the analyses. They represent 26% of The Haven population. All of them are from the
3 decade, and a fifth of them had an officially recorded criminal history. Eighty-four
individuals were over 30 years in 2005. Their offending, if any, after their thirtieth
birthday was excluded from the analyses. Their age range in 2005 was too wide (31-45
years) to be able to model any trajectories after mid-adulthood. While 63% of these
individuals had offended during their life course, only 14 (1
age of 30.
The total volume of offences committed by these 14 individuals past their thirtieth birthday was 46, that is, an average of 3.29 offences per offender; however, two of them had committed over 50% of the volume of offences.
61

250
I modelled offending e socio-educational
rofiles for all three cohorts, but I report the results only for Cohort B for several
ree cohorts produced similar results for the number of trajectory
population 10-17 years 10-25 years 10-30 years
trajectories and analysed their relations with th
p
reasons: First, the th
groups, their shape, and their relations with the socio-educational profiles. This is
partly because of the overlap across the three groups (see Table 9.1).
Table 9.1. Movement between cohorts in the GBTM
Total Cohort A Cohort B Cohort C
Under 17 in 2005, 78 not in models 10-17 years, only in Cohort A
81 81
10-25 years, in Cohorts A + B
46 46 46
10-30 years, in Cohorts A+B+C
95 95 95 95
Total 300 222 141 95
Percent of population
100% 74% 47% 32%
Second, Cohort B includes both juvenile and adult offending, whereas Cohort A does
not. Third, the socio-educational profiles of Cohort B contain more data, especially
when compared to Cohort C. I will report in footnotes any significant deviations fro
the patterns observed in Cohort B for Cohorts A and C.
C - Type of Criminal Data Used in the Models
The data used in the models are a yearly count of alleged offences. My rationale is that
the focus is not on the work
62 m
ings of the criminal justice system, but on the individuals’
contact with it. Furthermore, as I showed in Chapter 8, out of 3,132 alleged offences,
62 Many individuals in Cohort C were students during The Haven’s 1st decade, when the proportion of issing data was the highest. m

251
only 239 (8%) were not proved. This small proportion was evenly spread over the three
ividuals with a criminal history, only two
;
).
s
dy but more conservative than
aub and Sampson’s study.64
he
r
decades and across offenders. Of 178 ind
were never convicted of any offences. Both had only one alleged offence, which did
not lead to a conviction. I recorded as an alleged offence any distinct type of offences
that is, I counted four offences (e.g., insult police, resist arrest, wilful damage
[damaging the police car], and assault police) even if these offences may have occurred
during a single event.63 I recorded only the number of alleged offences not the number
of charges (e.g., four counts of stealing was recorded as one alleged offence of stealing
Compared to Laub and Sampson (2003) who counted the number of recorded arrests by
offence type, and Farrington and West (1990) who recorded the number of conviction
by offence type, my choice of counting alleged offences by offence type is a middle-
way alternative, broader than Farrington and West’s stu
L
II - OFFENDING TRAJECTORY GROUPS
I first present the results of the GBTM of Cohort B in a graphical format, as well as t
corresponding tables that report on the criteria for the final model selection, and on the
summary of groups’ statistics. Next I interpret the results in terms of both the numbe
and the shape of the trajectory groups, as well as the type of offending in each group.
63 The criminal histories did not provide any details about the alleged offending events. Furthermore, a
(2003) and Farrington and West (1990) did not provide details on how they counted ffences that occurred during a single event.
specific date for the alleged offence(s) was sometimes provided, but other times only a date range of a few months was given. 64 Laub and Sampsono

252
The final model was selected on the basis of the Bayes Information Criteria (BIC).65
GBTM indicated four distinct offending trajectory groups.
A - Youth to Early Adulthood Trajectories: Cohort B, 10-25 Years
1. Results
Table 9.2 presents the Bayes Information Criteria for the selection of the final model,
re 9.1 presents a plot showing the
predicted group trajectories. Although ling o ctori on a
count of alleged offences, I also analyse the patterns of the most serious offences proved
a 18 jectory group.
Table 9.2. Model selection: Cohort B, 10-25 years
er of Grou
and Table 9.3, the summary of groups’ statistics. Figu
the model f the traje es is based
s juvenile (under ) and adult (18 or over) in each rat
Numb ps Bayes Information Criteria (BIC) 2 -2075.74 3 -1991.99 4 -1971.08 5 -2002.20 6 -1991.27 7 -2008.33
Note: Figure in bold indicates the highest BIC value
65 The Bayes Information Criteria (BIC) is a statistical index, which indicates the number of trajectory groups in the model that best fits the data. The highest value of the BIC (expressed as a negative figure, and thus the value closest to zero) corresponds to the model that best fits the data. Generally, the BIC increases as groups are added, then reaches a peak indicating the best fit, and subsequently decreases (Nagin, 2005).

253
Figure 9.1. Predicted group trajectories: Cohort B, 10-25 years
1 1 1 1 1 1 1 1 1 1 1 1 1 12 2 2 24
4
4 4
33
Age
unc
1 12 2
22
2 2 2 2 2 22
2
4
4
4
4 4
4
4
4
4
44
4
3
3
3
3
3
33
3 33
3
3
3
3
0
1
2
3
4
5
6
10 11 12 13 14 15 16 17 18 19 20 21 22 23 24 25
Ann
al o
ffees
Group 1: Occasional offenders
N in data % in data alleged
offences a
Group 2: Slow-rising low-level offenders Group 3: Steadily-rising medium-level offenders Group 4: Sharply-rising high-level offenders
Table 9.3. Summary of groups’ statistics: Cohort B, 10-25 years
Groups
Mean N of
0: non-offenders 48 34.0 0 1: occasional 25 17.7 1.7 2: slow-rising low-level 34 24.1 8.8 3: steadily-rising medium-level 23 16.3 31.74: sharply-rising high-level 11 7.8 59.9 Total 141 100.0 12.3
Note: a Mean number of alleged offences per individual during trajectory.
2. Interpretations
Non-offenders
Around a third of the individuals in Cohort B, are non-offenders.

254
Occasional offenders
Group 1 includes 18% of the individuals in Cohort B, who have four or less alleged
ffences. Most of them have only one or two offences, and 8% of them three or four
offences
rly 30% of the occasional offenders committed a violent crime in early
o
offences. Two are female. Table 9.4 shows the pattern of the most serious
proved. Nea
adulthood.
Table 9.4. Occasional offenders (10-25 years): most serious offences proved (juvenile
and adult)
Male N=23 (92%)
Female N=2 (8%)
Most serious offences proved Juvenile Adult Juvenile Adult Murder Rape AOBH/serious assault 4 1 Indecent dealing with children a
Indecent assault Robbery Common assault 2Supplying drugs Break & enter 1 1Stealing/crimi l damage 5 1 naPossessing dr s 1 2 1 ugOthers b 7 7
Note: a Includes touching, feeling, groping, etc. a child, and being touched in an indecent way by a child, exposing children to indecent acts, and procuring children for indecent acts, but does not include sexual penetration of a child. b Least serious (e.g., offences against justice procedures).
Slow-rising low-level offenders
Group 2, which contains 24% of the individuals in Cohort B, has an average of nine
alleged offences per offender. Their offending pattern rises very slowly from age 12 to
age 18-19, then decreases gradually to reach at 25 the very low level of occasional
offenders. Three are female. Table 9.5 shows the pattern of the most serious offences
proved. Most offended in early adulthood and about 40% of them committed crimes

255
against persons, including sexual offences involving children. More than a quarter had
committed violent offences as juvenile, including a case of murder. In adulthood, the
most serious offences of the two female offenders were minor property crimes.
Table 9.5. Slow-rising low-level offenders (10-25 years): most serious offences proved
(juvenile and adult)
Male N=31 (91%)
Female N=3 (9%)
Most serious offences proved Juvenile Adult Juvenile Adult Murder 1 Rape AOBH/serious assault 2 8Indecent dealing with children a 1 2 Indecent assault 1 Robbery 1 1 1Common assault 2 2Supplying drugs 1Break & enter 9 4 1Stealing/criminal damage 7 7 1 2Possessing drugs 2Others b 1 1
Note: a Includes touching, feeling, groping, etc. a child, and hed in an indecent way by a chil ng children to c u n for indecent acts, but does not penetrati ilb , offences against j e procedures).
S nder
Group 3 includes 16% of the individuals in Cohort B, who have an average of 32
lleged offences per offender. Their offending pattern rises steadily from age 11 to age
s gradually. Although, at age 25, their rate of offending has
uced, it is above the offending rate of all the other trajectory groups.
e rate of offending of
e sharply-rising high-level offenders, whose offending rate steeply declined. Table
9.6 shows the pattern of the most serious offences proved. This is a male only
trajectory group. The steadily-rising medium-level offenders also form a rather violent
being toucring childred, exposi indecent a
on of a chts, and procd. include sexual
Least serious (e.g. ustic
teadily-rising medium-level offe s
a
19-20, then decrease
significantly red
From age 20 to 25, their rate of offending is actually higher than th
th

256
trajectory group. More than a third as juveniles and about 70% as adults committed
ces
Male N=23
crimes against persons.
Table 9.6. Steadily-rising medium-level offenders (10-25 years): most serious offen
proved (juvenile and adult)
Most serious offences proved Juvenile Adult MurderRape 1AOBH/serious assault 7 8Indecent dealing with children a Indecent assault 1Robbery 1Common assault 1 5Supplying drugs Break & enter 8 3Stealing/criminal damage 5 2Possessing drugs Others b
N gropi g, etc. a child, and bei ndecent w nde ent acts, and procuring children for indecent acts, but does not penetration of a child. b ., offences against justice procedures).
Sharply-rising high-level offenders
Group 4, includes 8% of those in Cohort B, who have an average of 60 alleged offences
ecreases nearly as steeply as it rose. At age 25, their offending has reached a relatively
slow-rising low-level offenders. This is again a male
d.
ote: Includes touching, feeling,osing children to i
a n ng touched in an iay by a child, exp
include sexualc
Least serious (e.g
per offender. Their offending level rises steadily from age 11 to age 16-17, then
d
low rate just above the rate of the
only trajectory group. Table 9.7 shows the pattern of the most serious offences prove
Most of them as juveniles and close to three-quarters as adults committed at least one
offence against persons.

257
Table 9.7. Sharply-rising high-level offenders (10-25 years): most serious offences
proved (juvenile and adult)
Male N=11
Most serious offences proved Juvenile Adult MurderRapeAOBH/serious assault 7 8Indecent dealing with children a
Indecent assault Robbery 1Common assault 2Supplying drugs Break & enter 1 1Stealing/criminal damage 1Possessing drugs Others b
N gropi etc. a ch , and being touched in ndecent w osing children to inde t acts, and procuring children for indecent acts, but does not include sexual penetration of a child. b ., offences against ju e procedures).
III - INDIVIDUAL PROFILES AND TRAJECTORY GROUPS
now examine the relations between the socio-educational circumstances and the
s in Cohort B, and their offending trajectories.
report
risk and
ote: a Includes touching, feeling, ng, ild an iay by a child, exp cen
Least serious (e.g stic
I
personal characteristics of the individual
For ease of exposition I call the individuals’ socio-educational circumstances and
personal characteristics, the individual profiles. First, I report on my methods for the
construction of these individual profiles. Then, I perform a series of analyses and
on the particular associations between the profiles and the trajectories.
A. Constructing the Profiles: Risk and Protective Factors
Developmental and life course analyses conceive individual profiles in terms of
protective factors. I adopt this approach in constructing the individual profiles.

258
Drawing from the literature on educational exclusion, social exclusion, and
developmental criminology, as well as the analyses reported in Chapters 6-8, I created
3 binary variables (73 risk factors and ten protective factors) in six major domains: (1)
(6) educational (Table 9.8). Because the familial domain
covers a large array of factors, I subdivided this domain into six sets of family factors:
( ’ relationship with student (including child abuse), (ii) family structure, (iii)
f cluding by or against student), (iv) family health (not including
student), (v) fa ent with the CJS (not including student), and (vi) traumatic
events (including placements of student by DFS). This allowed me to create 11 distinct
r h could be added to form ne overall risk factor scale) and
one protective factor scale.
able 9.8. Risk and protective factor scales
No. items in scale
8
gender, racial-ethnic categorisation, and socio-economic; (2) familial; (3) psychosocial;
(4) cognitive; (5) health; and
i) carers
amily violence (not in
mily involvem
isk factor subscales (whic o
T
Risk factor subscales 1 Gender, racial-ethnic
economic
4categorisation, and socio-
2 Carers’ relationship with student 9 3 Family structure 44 Family violence 105 Family health 96 Family involvement with CJS 67 Traumatic events 78 Student’s psychological profile 59 Student’s cognitive profile 110 Student’s health profile 711 Student’s educational profile 11
Total risk factor scale 73Protective factor scale Cultural and socio-economic 2 Carers’ relationship with student 4 Family structure 1 Student’s cognitive profile 1 Student’s educational profile 2
Total protective factor scale 10
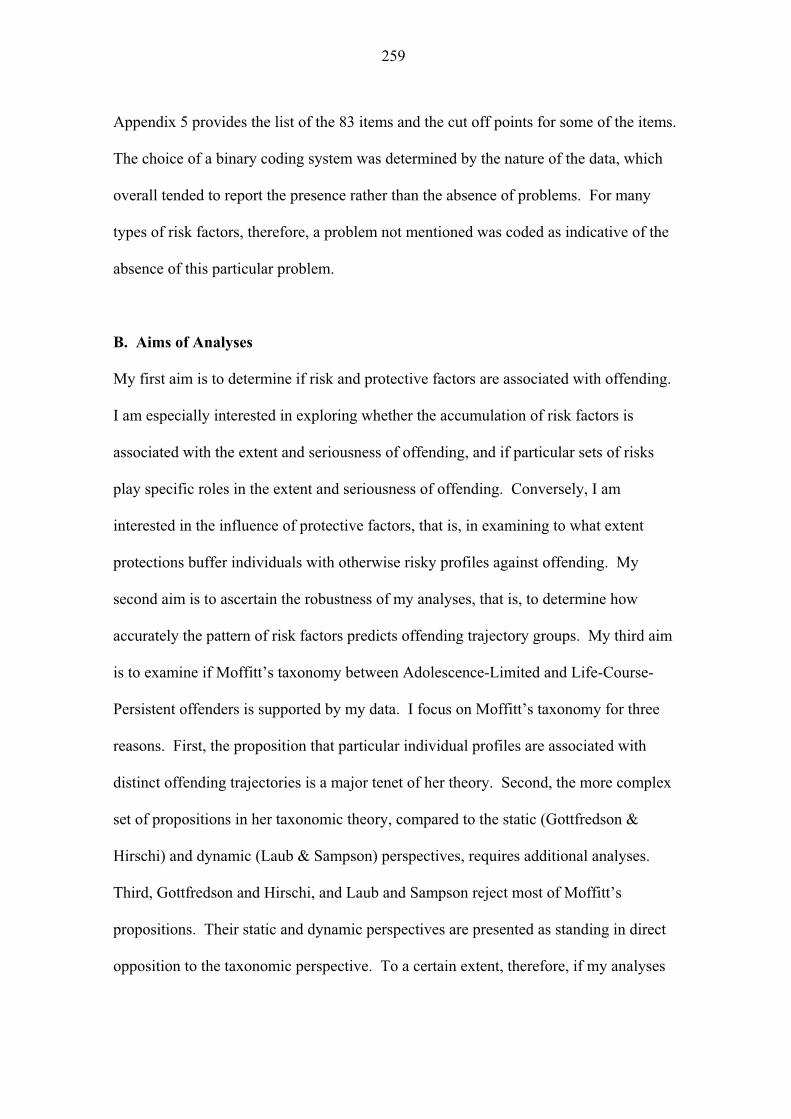
259
Appendix 5 provides the list of the 83 items and the cut off points for some of the item
The choice of a binary codin
s.
g system was determined by the nature of the data, which
overall tended to report the presence rather than the absence of problems. For many
types of risk factors, theref a pro me was coded as indicative of the
absence of this particular problem.
B. Aims of Analyses
M e if risk and otective factors are associated with offending.
I am terested in exploring whether the accumulation of risk factors is
lay specific roles in the extent and seriousness of offending. Conversely, I am
terested in the influence of protective factors, that is, in examining to what extent
protections buff ing. My
cond aim is to ascertain the robustness of my analyses, that is, to determine how
aim
ree
fredson &
irschi) and dynamic (Laub & Sampson) perspectives, requires additional analyses.
ost of Moffitt’s
lyses
ore, blem not nti nedo
y first aim is to determin pr
especially in
associated with the extent and seriousness of offending, and if particular sets of risks
p
in
er individuals with otherwise risky profiles against offend
se
accurately the pattern of risk factors predicts offending trajectory groups. My third
is to examine if Moffitt’s taxonomy between Adolescence-Limited and Life-Course-
Persistent offenders is supported by my data. I focus on Moffitt’s taxonomy for th
reasons. First, the proposition that particular individual profiles are associated with
distinct offending trajectories is a major tenet of her theory. Second, the more complex
set of propositions in her taxonomic theory, compared to the static (Gott
H
Third, Gottfredson and Hirschi, and Laub and Sampson reject m
propositions. Their static and dynamic perspectives are presented as standing in direct
opposition to the taxonomic perspective. To a certain extent, therefore, if my ana

260
support Moffitt’s taxonomy, then they cast doubts on Gottfredson and Hirsc
Laub and Sampson’s perspectives, and vice versa if my analyses do not support
Moffitt’s taxonomy.
C. Types of Statistical Analyses Performed
To accomplish my first aim I perform a series of ANOVAs, in which I compare the
means of the overall risk factor scale and its 11 subscales between the trajectory group
using Chi squares, I also examine the relative strength of the particular risk factors
included in the subscales. Additionally, I perform multivariate regressions of the risk
factor subscales on the volume of violent and non-violent offending. Then, I compare
the means of the protective factor scale between the trajectory groups. To accomplish
my second aim I perform a m
hi’s, and
s;
ultinomial logistic regression.66 This analysis permits me
determine how accurately the set of risk factors predicts trajectory groups. Any
sitives (i.e., cases, which, given their
score on ere statis s belonging to a more serious
offending group than they in fact belonged to) or false negatives (i.e., cases, which,
given their score on the risk factor scale, were statistically classified as belonging to a
less serious offending group than they in fact belonged to).
T s is is statistic, which can point to particular cases
warranting further investigation as they may reveal, for instance, the impact of specific
e e influence of specific characteristics in the profiles.
to
misclassified cases can be seen as either false po
the risk factor scale, w tically classified a
hi an interesting feature of th
vents such as turning points, or th
66 ulti differ from bina gistic regressions in the number of groups i ded inomial logistic regressions can include more than two groups. Logistic ariate regre s, analyse the overall and relative association
a set of predictors pendent variable (e.g., non-offenders, occasional offenders, etc) ther than a continuous dependent variable (e.g., volume of offending).
M nomial logistic regressions only ry lonclu in the dependent variables. Mult
regressions, as distinct from multivwith a categorical de
ssionoraf
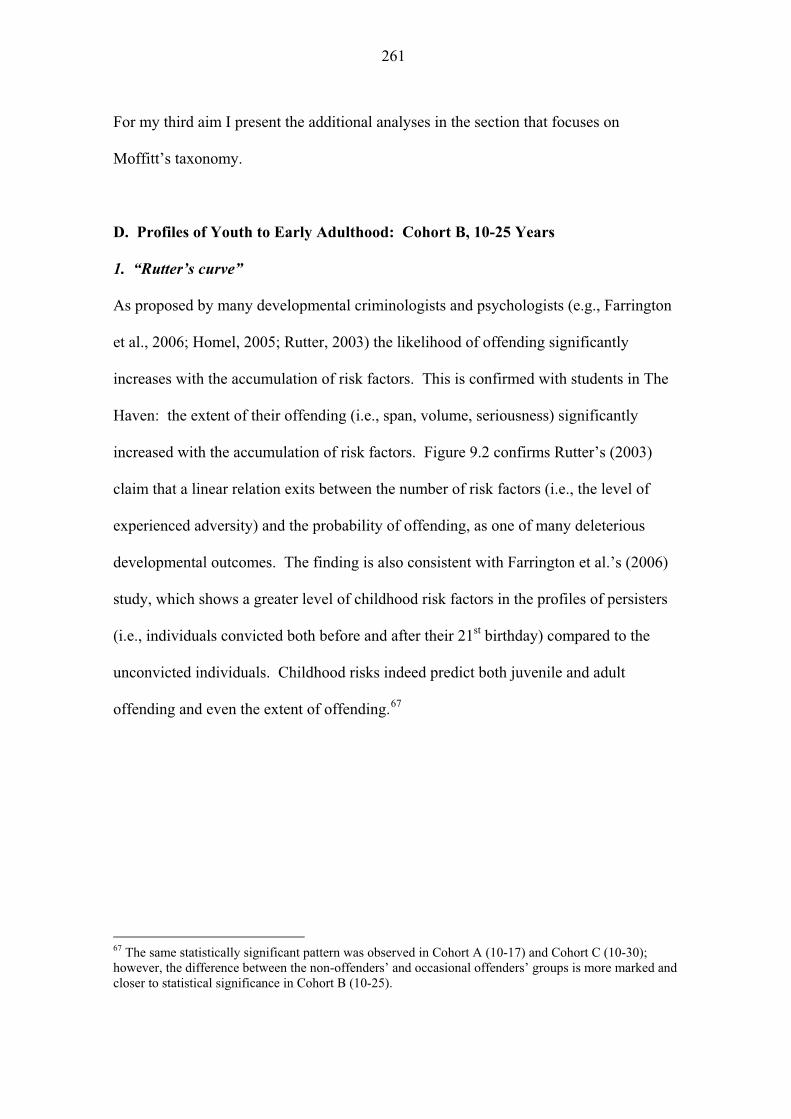
261
For my third aim I present the additional analyses in the section that focuses on
Moffitt’s taxonomy.
D. Profiles of Youth to Early Adulthood: Cohort B, 10-25 Years
1. “Rutter’s curve”
As proposed by many developmental criminologists and psychologists (e.g., Farrington
05; Rutter, 2003) the likelihood of offending significantly
l of
06)
ters
et al., 2006; Homel, 20
increases with the accumulation of risk factors. This is confirmed with students in The
Haven: the extent of their offending (i.e., span, volume, seriousness) significantly
increased with the accumulation of risk factors. Figure 9.2 confirms Rutter’s (2003)
claim that a linear relation exits between the number of risk factors (i.e., the leve
experienced adversity) and the probability of offending, as one of many deleterious
developmental outcomes. The finding is also consistent with Farrington et al.’s (20
study, which shows a greater level of childhood risk factors in the profiles of persis
(i.e., individuals convicted both before and after their 21st birthday) compared to the
unconvicted individuals. Childhood risks indeed predict both juvenile and adult
offending and even the extent of offending.67
The same statistically significant pattern was observed in Cohort A (10-17) and Cohort C (10-30); however, the difference between the non-offenders’ and occasional offenders’ groups is more marked and67
closer to statistical significance in Cohort B (10-25).

262
Figure 9.2. Level of risk factors per trajectory group: Cohort B, 10-25 years
sharply-
35
30
rising high-level
steadily-rising
medium-
offenders
slow-risinglow-leveloffenders
occasionaloffenders
non-offenders
offenderslevel
Assigned trajectory group in 10-25 Cohort
25
20
15
10
5
Mean
No
.sk
fact
ors
ri
68
2. Types of risks
Table 9.9 presents the means of the trajectory groups for the 11 risk factor subscales and
the overall risk factor scale. There is a significant linear relation between each risk
factor subscale (except the socio-economic and cognitive subscales), the total risk factor
scale, and the extent of offending.
Socio-economic domain
Although overall the pattern is not statistically significant, the means in Table 9.9 still
indicate that a more disadvantaged socio-economic profile is associated with a more
extensive offending trajectory. Recall that Cohort B has only 141 cases, and that most
of The Haven’s children come from disadvantaged socio-economic backgrounds
68 In Cohort A (10-17), only one risk factor in the socio-economic subscale (low SES of residence) was
ificance.
not significantly associated with offending. However, being male, from an ethnic minority, particularly Indigenous (coded as risk factors), and from a low occupational status family background, were significantly associated with offending (note that the occupational status of the family is a better measure of socio-economic disadvantage than the SES of the residence area). The number of cases in Cohort A is larger (N=222) than in Cohort B and thus is more likely to show statistical sign

263
(Chapter 6); hence there is little variation between the students’ profiles in this d
The fact that, even with
omain.
little variation between the socio-economic profiles, the relation
pproached statistical significance points to, rather than discounts, the influence of
ir larger sample
lass males, Farrington et al. (2006) found that socio-economic
re
abused in childhood or victim of
omestic violence in adulthood, and siblings being abused, as well as being sexually
abused, are significantly associated with the extent of offending. In the family health
subscale, the mother’s alcohol/drug problems and other chronic health problems (but
not mental health problems), the father’s mental and alcohol/drug problems (but not
chronic health problems), and siblings’ alcohol/drug problems (but not mental and
chronic health problems) are significantly associated with the extent of offending. The
a
socio-economic disadvantage on the development of offending. In the
of 411 British lower c
factors such as poor housing and low family income in childhood were significant
predictors of the extent of offending measured at age 50.
Familial domain
All the risk factors (including child abuse) pertaining to a carer’s relationship with a
student are significantly associated with the extent of offending. In the family structu
subscale, large families, teenage mothers, and parents being separated/divorced are
significantly associated with the extent of offending. Farrington et al. (2006) found that
large family size, a young mother, and a disrupted family were significant predictors of
the extent of offending. In the family violence subscale, all the risk factors associated
with the mother being abused (in childhood, in adulthood as victim of domestic
violence, or sexually), the father being sexually
d

264
group of sharply-rising high-level offenders is particularly high in this domain
compared to all other groups.
Table 9.9. Means of risk factor subscales per trajectory group: Cohort B, 10-25 years
Risk factor subscales a
Group 0 non-
offendersN=48
Group 1 occasional N=25
Group 2 slow-rising N=34
Group 3 steady-rising N=23
Group 4 sharply-rising N=11
Total N=141
Socio-economic 1.54 1.76 1.79 1.96 2.27 1.77 Carers’ relationship with student
1.60 (1,2,3,4) 3.80 (0,4) 4.24 (0,4) 5.09 (0) 7.36 (0,1,2) 3.65
Family structure 0.54 (2,3,4) 1.16 1.59 (0) 1.48 (0) 1.82 (0) 1.16 Family violence 0.71 (2,3,4) 1.20 (4) 2.06 (0) 2.35 (0) 2.91 (0,1) 1.56 Family health 0.60 (2,4) 1.32 (4) 1.68 (0) 1.57 3.00 (0,1) 1.33 Family involvement with CJS
0.29 (4) 0.64 0.91 0.78 1.73 (0) 0.70
Traumatic events 0.79 (2,3,4) 1.40 (4) 2.06 (0) 2.48 (0) 3.27 (0,1) 1.67 Psychosocial 0.48 (2,3,4) 0.60 (3,4) 1.35 (0,4) 1.65 (0,1 2.64 (0,1,2) 1.07 )
Cognitive 0.04 0.16 0.15 0.13 0.27 0.12 Health 0.67 (2,3,4) 1.68 (4) 2.21 (0,4) 2.57 (0) 4.18 (0,1,2) 1.80 Educational 0.56 (3,4) 1.56 (4) 1.65 (4) 3.00 (0) 4.00 (0,1,2) 1.67 Total scale 7.83 (2,3,4) 15.28 (4) 19.68 (0,4) 23.04 (0) 33.45 (0,1,2) 16.49
Note: a All subscales are statistically significant (p<.001), except socio-economic, and cognitive subscales. Numbers in brackets (trajectory groups identification numbers) indiwhich group differences are statistically significant (at least p<.05). Statistical significance is based on mean difference and sample size, hence relatively large mean differences in small
important mean differences.
cate
samples such as the sharply-rising group may not be statistically significant despite
the subscale for the family’s contacts with the CJS, the relations between the
the CJS or her incarceration are not significant,69 but the
gs
In
mother’s involvement with
relations between the father’s and siblings’ involvement with the CJS and their
incarceration are significant or close to statistical significance. The group of sharply-
rising high-level offenders is particularly high in this domain compared to all other
groups. Farrington et al. (2006) found that convicted parents and delinquent siblin
were significant predictors of the extent of offending. In the subscale pertaining to
69 In Cohort A (10-17), the mother’s involvement with the CJS was statistically significant, and her incarceration was close to significance.

265
traumatic events, sexual abuse, other types of traumatic events, official placements
outside the family, and many such placements are significantly associated with the
extent of offending.70
Psychosocial profile, cognitive, and health domains
Sharply-rising high-level offenders have the most problematic psychosocial profile.
Non-offenders and occasional offenders have very similar psychosocial profiles. This is
finding, which may support Moffitt’s taxonomy about the Adolescence-Limited
Life-Course-Persistent offenders. According to Moffitt, Adolescence-
s,
ts
nitive
-
ver
a
offenders and the
Limited offenders are supposed to have unproblematic childhood psychosocial profile
whilst Life-Course-Persistent offenders are supposed to exhibit acute psychosocial
problems in childhood (I examine this question later in this chapter). All the elemen
in this subscale (including a high level of psychosocial problems, of delinquent
behaviours, of sexualised behaviours, of callousness, and aggression), which were
measured in childhood, are significantly associated with sustained offending.
Farrington et al. (2006) found that “high daring,” “low popularity,” and “high
nervousness” significantly predicted the extent of offending. By contrast, the cog
profile is not significantly related to offending, although sharply-rising high-level
offenders tend to present with lower cognitive functioning as measured by IQ tests. In
Farrington et al.’s study, “low non-verbal IQ” significantly distinguished between late
onset offenders (i.e., those not convicted before age 21) and individuals who were ne
convicted. Late-onset offenders had low non-verbal IQ.
70 In Cohort A (10-17), having siblings with school problems (e.g., school exclusion) was also significantly associated with the extent of offending. Note that, in all cohorts, having experienced the death of a parent was not related to offending.

266
The health of the sharply-rising high-level offenders’ group is particularly poor
significantly so in comparison t
and
o all the other groups. Apart from mental health
roblems, which are not statistically significant, all other risk factors, including pre/neo-
harming/suicide attem high level of h bl orbidity, are
s associate tai ndin fact e/neo prob
are significantly associated ight support Moffitt’s notion that
e log m tingui ou iste ers fr
o offen
Educational domain
All the e sions, are significantly
associated with sustained offending.
antly
istinguished “desisters” (not convicted past age 20) from unconvicted individuals.
p
natal problems, family predispositions, behaviour disorders, alcohol/drug abuse, self-
pts, and a ealth pro ems co-m
ignificantly d s with su ned offe g. The that pr -natal lems
with sustained offending m
arly neuropsycho ical proble s dis sh Life-C rse-Pers nt offend om
ther groups of ders.71
lements in this subscale, except post-The Haven suspen
72 Although Farrington et al. (2006) did not
examine the effect of school exclusion on offending and did not report cases of school
exclusion in their sample, they found that “low junior school attainment” signific
d
Unconvicted individuals had better academic records.
Risk factors: summary
The results from the analyses of the relations between the risk factor subscales and
offending, confirm the notion that it is the accumulation of risks in various domains,
to significance. The fact that pre/neo-natal problems become significant in Cohort B (10-25), which 71 In Cohort A (10-17), pre/neo-natal and mental health problems are not statistically significant, but close
includes adult offending, may lend support to Moffitt’s proposition. 72 In Cohort A (10-17), grade repetition is not statistically significant but close to significance. However, post-The Haven suspensions are statistically significant. Note that Nagin (2005) had found a laggedeffect of grade repetition on offending.

267
including the educational domain, which affects the likelihood and the extent of
offending, rather than the specificity of these risks.
3. Individual profiles and type of offending
n the volume of violent and non-
nly,
s of
ealth.
isk
t
ific
Multivariate regressions of the risk factor subscales o
violent offending (juvenile and adult offending included) in Cohort B show that the
educational risk factor is the significant predictor of violent offending. There are no
significant predictors in relation to non-violent offending. For juvenile offending o
the significant predictors of violent offending are child abuse and low cognitive
functioning.73 The significant predictors of juvenile non-violent offending are the
psychosocial and health profiles. For adult offending only, the significant predictor
violent offending are the family health, psychosocial, and educational profiles. The
significant predictors of adult non-violent offending are child abuse and family h
These analyses show that, when both juvenile and adult offending are considered, r
factors tend to have a cumulative rather than a specific influence on non-violen
offending. However, the risks associated with education appear to have a spec
influence on violent offending, particularly on adult violence. Child abuse and poor
cognitive functioning, which may well be causally related, are also prominent risks
associated with violent juvenile offending. This points to a scenario in which
individuals who have been severely harmed become harming individuals (Daly, 1992).
icated 73 In Cohort A (10-17), the multivariate regression on the volume of violent juvenile offending indthat the significant predictors were risks associated with education, family structure, child abuse, and family involvement with the CJS.

268
4. Protective factors
Overall there is no significant relation between the protective factor scale and off
However, having another carer beside a parent who was engaged and caring, and having
made significant behavioural progress at The Haven, were significantly associated wit
a less extensive offending pattern. Several interpretations are possible for these
findings. First, the protective factor scale had only ten items compared to 73 items in
the risk factor scale. In itself this is an indication that most of The Haven’s students, as
far as their records showed, had few protections. Second, this analysis does not
differentiate between accurate
ending.
h
ly classified and misclassified cases (i.e., the false
ositives and the false negatives). For instance, two significant items in the protective
nother carer beside a parent who was engaged and caring, and
t
. False positives and false negatives
n sociology of analysing the anomalous cases. One method of
the
sified 87% of the cases. This result confirms the power of the
of
p
factor scale, having a
having made significant behavioural progress at The Haven, point to Laub and
Sampson’s notion of informal social controls and social support as a buffer agains
extensive offending when multiple risk factors are present. This suggests that an
examination of the relation between the protective factor scale and false positives and
false negatives is warranted.
5
There is a long tradition i
understanding dynamic life course changes is by examining these anomalous cases,
misclassified cases in an analysis. The multinomial logistic regression74 performed to
this effect correctly clas
previous analyses, which strongly associate the pattern of risk factors with the extent
74 This analysis also revealed that compared to non-offenders the strongest predictor of being in the sharply-rising high-level offenders’ trajectory is the set of educational risk factors.

269
offending. There were 5% of false positives, that is, individuals who followed a
serious trajectory, and 8% of false negatives, that is,
less
individuals who followed a more
rious trajectory, than predicted by the level of their risk factors.75
.5 for
nce
l
w turn to a more detailed analysis of how the data relate to Moffitt’s taxonomy.
Overall, Moffitt distinguishes between Adolescence-Limited offenders and Life-Course-
Persistent offenders. However, she also explains the more gradual decline after late
se
The number of false positives in Cohort B is too small to explore the relation between
protective factors and misclassified cases. I therefore select misclassified cases from
both Cohort A and B (25 false positives and 37 false negatives). This analysis shows
that false positives have comparatively the highest, and false negatives the lowest,
levels of protections. The difference between the means is not large (a mean of 2
the false positives compared to a mean of 1 for the false negatives, on a scale from 0 to
10), but the general pattern suggests that protective factors do buffer a number of “at-
risk” individuals against more extensive offending trajectories. Conversely, the abse
of protections may lead some individuals with comparatively fewer risks into a more
serious offending trajectory than their level of risks would predict. This finding may be
related to Laub and Sampson’s concept of turning points, which are supposed to
facilitate desistence from crime through processes that help enhance informal socia
controls, change the types of routine activities, build social capital, and make identity
change possible.
6. Moffitt’s taxonomy
I no
75 In Cohort A (10-17), 80% of the cases were correctly classified. There were 10% of false positives 10% of false negatives.
and

270
adolescence in the aggregate age-crime curve compared to the steep increase from early
dults,
ous behaviour problems to the point of being removed
mainstream primary schools. Moffitt proposes that in a general population
reatly outnumber Low-Level-Chronic and Life-
to mid-adolescence, as the result of some Adolescence-Limited offenders being
“ensnared” for a while during early adulthood. She has also recently distinguished
between the Low-Level-Chronic offenders and the hard-core Life-Course-Persistent
offenders.
Following her taxonomic scheme, I classified the groups this way: Adolescence-
Limited (offended in youth but not in adulthood), Ensnared Adolescence-Limited
(offended only occasionally in early adulthood), Low-Level-Chronic (offended
consistently but at a low level in adulthood), and Life-Course-Persistent76 (offended
significantly as juveniles and adults). Table 9.10 presents the result of this
classification.
The results shown in Table 9.10 do not come from a general population of young a
but from the special population of children who transited through The Haven, that is,
children who experienced seri
from
Adolescence-Limited offenders would g
Course-Persistent offenders. In this cohort of The Haven’s former students, the reverse
is occurring: Low-Level-Chronic and Life-Course-Persistent offenders greatly
outnumber Adolescence-Limited offenders. This is consistent with Moffitt’s theory. In
this population of severely troubled and troublesome children, her theory would predict
that a large proportion of them would become persistent offenders.
76 In my data the term “Life-Course-Persistent” is a misnomer. The results presented in Figure 9.1 shows ed in that by age 25 all the trajectory groups have virtually desisted. This pattern was even more pronounc
Cohort C, which modelled offending trajectories up to age 30.

271
Table 9.10. Moffitt’s taxonomy (based on alleged offending up to age 25)
Abstainers ALs a EALs b LLCs c LCPs d Total Official offending
48 (34%) 12 (9%) 19 (13%) 31 (22%) 31 (22%) 141
Notes: a Adolescence-Limited offenders.
d Life-Course-Persistent offenders.
,
blems
)
)
nting but no neuropsychological problems, and (c) presence of both
roblems.
b Ensnared Adolescence-Limited offenders. c Low-Level-Chronic offenders.
Are the profiles of these individuals consistent with Moffitt’s aetiological propositions
and does the nature of their offending support her developmental hypotheses? To
examine these questions, from a number of variables in the data, I created several
measures. Moffitt contends that Adolescence-Limited offenders are only mimicking
Life-Course-Persistent offenders, but have not experienced early neuropsychological
problems or dysfunctional parenting. To test her propositions about the profiles of the
Adolescence-Limited and Life-Course-Persistent offenders, I created: (a) a
neuropsychological problems scale,77 and (b) a dysfunctional parenting scale.78 To test
her proposition about the effect of the interaction between neuropsychological pro
and dysfunctional parenting I also created a categorical measure coded as follows: (a
absence of both problems, (b) neuropsychological problems but adequate parenting, (c
dysfunctional pare
p
77 This scale includes variables such as neurological problems, pre/neo-natal problems, behaviour disorders, and high level of psychosocial problems.
abusing student, quality of parental discipline, and physical punishment. 78 This scale includes variables such as quality of the mother’s and the father’s relationship with the student, the mother or father

272
Interaction between neuropsychological problems and dysfunctional parenting
I performed a series of 2 X 2 factor ANOVAs (neuropsychological problems yes
dysfunctional parenting yes/no) on the total volume of alleged offending up to age 2
Figure 9.3 indicates no relation between neuropsychological problems and offending,
but a significant r
/no,
5.
elation between dysfunctional parenting and offending. There is,
wever, a positive interaction between neuropsychological problems and dysfunctional
e
“kinds
cts of neuropsychological problems and dysfunctional parenting on the
olume of offending up to age 25
ho
parenting. When both problems are present, the extent of offending increases. Th
relationship holds for both violent and property offending. This result lends some
support to Moffitt’s proposition of an interaction between “kinds of people” and
of contexts.”
Figure 9.3. Effe
v
25
no
parenting
yesno
neuropsychological problems
yesproblems category
no
tal N
o.
off
en
ces
by a
ge 2
5
20
15
10
5
0
Mean
to
yes

273
Profiles of Adolescence-Limited and Life-Course-Persistent offenders
chological
problems nor an experience of dysfunctional parenting. Rather she argues that these
factors are only present for Life-Course-Persistent offenders. Furthermore, she
rs tend to avoid violent crime, which is the
rovince of Persistent offenders. The results presented in Figure 9.4 partially support
According to Moffitt, Adolescence-Limited offenders do not have neuropsy
proposes that Adolescence-Limited offende
p
Moffitt’s claims for dysfunctional parenting: Life-Course-Persistent offenders have
experienced a highest level of dysfunctional parenting, but Adolescence-Limited
offenders are not immune from such problems.
Figure 9.4. Mean level of dysfunctional parenting per Moffitt’s taxonomy
LCPLow LevelChronic
Ensnared ALALAbstainers
Moffitt's taxonomy official offending
4
3
1
2
Mea
n of
dys
func
tiona
l par
entin
g
AL: Adolescence-Limited LCP: Life-Course-Persistent
For neuropsychological problems, there is not a clear difference between Life-Course-
Persistent and Adolescence-Limited offenders (Figure 9.5). However, both groups have
more neuropsychological problems than abstainers. This result does not support
Moffitt’s claim about the profile of Adolescence-Limited offenders.

274
Figure 9.5. Mean level of neuropsychological problems per Moffitt’s taxonomy
LCPLow LevelChronic
Ensnared ALALAbstainers
Moffitt's taxonomy official offending
2
1.5
1
0
0.5
Mean
No
. n
eu
rop
syal p
ob
lech
olo
gic
rm
s
AL: Adolescence-Limited LCP: Life-Course-Persistent
dolescence-Limited offenders compared to
the high volume of such crimes for Life-Course-Persistent offenders.
Figure 9.6. Mean level of violent offences up to age 25 per Moffitt’s taxonomy
For the nature of offending, Moffitt’s proposition is supported (Figure 9.6). There is a
near absence of violent offending amongst A
LCPLow LevelChronic
Ensnared ALALAbstainers
Moffitt's taxonomy official offending
6
5
4
3
2
1
0
Mean
No
. vio
len
t o
ffen
ces
up
to
ag
e 2
5
AL: Adolescence-Limited LCP: Life-Course-Persistent

275
IV - DISCUSSION OF RESULTS
A. The Age-Crime Curve Controversy
The two major findings in relation to the age-crime curve in this population are: (a)
heterogeneity in the composition of the curve (i.e., there are distinct trajectory groups),
and (b) all the trajectory groups seem to desist from crime by age 30.79 With the
proviso that my findings are based on officially recorded alleged offences, Laub a
Sampson’s proposition is supported on both coun
nd
ts. Desistence is the norm, and the
urve is composed of distinct groups (Laub and Sampson do not argue about that);
is only
supported on one count. There are distinct trajectory groups, but there is no sign of
even a small group maintaining a high level of offending without abatement. A few
individuals still offended in their 30s and 40s, but their offending rate and the
seriousness of their offending had significantly decreased.
Gottfredson and Hirschi’s proposition appears not to be supported. The age-crime
curve is not invariant, and desistence is the norm. Admittedly, the findings are based on
official records, that is, records, which by definition do not include unofficial offending
nd especially not “analogous behaviours.” The same remark in relation to desistence
g in
c
however, all the groups eventually desist from crime. Moffitt’s proposition
a
could be made about Moffitt’s proposition. There was indeed a high proportion of
reported unofficial offending in the data (Chapter 8). Most of it, however, occurred in
youth. It was not possible to assess the proportion and level of unofficial offendin
79 Although I only presented the results for Cohort B (10-25), the results for Cohort C (10-30) show an even more pronounced pattern of desistence.

276
adulthood. The concept of behaviours “analogous to crime” strongly advanced by
disputable. For instance, according to Gottfredson and Hirschi, these behaviours
“analogous to crime” caused by low individual self-control include neglecting one’s
children, cheating on a spouse, not being able to hold a job, attempting suicide, and
being involved in road accidents. There were cases of domestic violence against
partners, and abuse or neglect of children perpetrated by some of The Haven’s former
students. Some of these behaviours were criminalised (e.g., as assaults), some were not,
but more importantly and obviously, we do not know what is not reported.
verall, the findings support Gottfredson and Hirschi’s idea that offence versatility
ed persons. Yet,
ven when this kind of unofficial offending is added, out of 223 individuals reported for
ainst
persons. They were not specialists; their offending generally included a variety of
property, drug, and public order crimes, but the distinction between violent and non-
violent offending appears to be a valid distinction that Gottfredson and Hirschi
nevertheless reject.
B. Questions about Causal Processes
Overall, the analyses of the relations between the individ ding
trajectory groups do not clearly suggest distinct aetiologies. This result tends to support
Gottfredson and Hirschi, and by Moffitt, is not only difficult to measure, but also
O
rather than specialisation is generally the norm. However, at least in terms of officially
recorded offending, close to 40% of the offenders were never charged for crimes against
persons. It is true that a good proportion of unofficial offending target
e
official and/or unofficial offending, 77 (35%) were not reported for offending ag
ual profiles and the offen

277
Laub and Sampson rather than Moffitt. It is more a question of degree of risks than of
the nature of the risks. The d the three theories in that
ose who experience serious socialisation problems in childhood, both at home and at
persistent offending. Hence we see a large
s, but
,
f
ilar
or health, poor education,
nemployment, and a high level of crime and criminalisation (Chapter 7). This strongly
e
ata, however, provide support to
th
school, are more likely to follow a path of
proportion of persistent offenders amongst the former students of The Haven.
The effect of both family and school on crime is strongly suggested by the analyse
this effect is occurring predominantly for boys and in a context of socio-economic
disadvantage. Despite little variation between the children’s socio-economic profiles
the effect of socio-economic factors on the extent of juvenile offending, and on the
likelihood of following particularly serious trajectories, featured in the data. Most o
The Haven’s children come from severely disadvantaged families where they
experience deprivation, maltreatment, and little emotional, cognitive, and academic
support. Quite often, their parents, relatives, and siblings have experienced sim
circumstances, associated with similar outcomes, such as po
u
suggests that, contrary to what is assumed by the three developmental and life cours
perspectives, the effect of social class on crime and criminalisation cannot be
dismissed.80
Although the general conclusion about causal processes does not strongly suggest
distinct aetiologies between offending trajectory groups, this finding needs to be
balanced with some of the results produced from my examination of Moffitt’s
80 For instance, even in Cohort C (10-30), the effect of low occupational status of the family on offending approached statistical significance.

278
taxonomy. The result showing a greater effect of poor parenting on offending comp
to the effect of neuropsychopathology is more consistent with Gottfredson and Hir
than Moffitt’s proposition. However, as Moffitt suggests, when both factors were
present, the extent of offending was greater. Although Adolescence-Limited offender
had experienced poor parenting to a greater extent than non-offenders, poor parentin
was significantly more prevalent among Life-Course-Persistent offenders.
The distinction between violent and non-violent offending is important. First, there was
a strong association between educational risk factors, including formal schoo
ared
schi’s
s
g
l
spensions and exclusions, and violent offending.81 This is a key finding. Sampson
e-
ot
nd Hirschi who reject the distinction between serious and petty
rime, and the idea that offenders can be differentiated on this criterion.
su
and Laub (2005) found that disaffection from school was strongly associated with
delinquency, independently of family processes. My findings suggest that this
association is particularly strong for violent offending, and long lasting, as its effects
appear to continue in adulthood.
Second, the difference in the nature of offending between Adolescence-Limited and
Life-Course-Persistent offenders suggested by Moffitt was clearly supported.
Adolescence-Limited offenders committed few violent offences, whereas Life-Cours
Persistent offenders committed most of the violent offences. This finding does n
support Gottfredson a
c
81 In Cohort C (10-30) educational risks were still significantly associated with persistent and violent offending.

279
Finally, borrowing the term from Daly (1992, p. 13) the “leading scenario” in this
cohort of predominantly lower-class maltreated boys, is a story of severely harmed
children who turned into angry harming individuals. It is a story of reproduction:
reproduction of disadvantage, reproduction of harm, and reproduction of exclusion.
Yet, a number of false positives and false negatives, that is, of individuals who did not
llow the predicted patterns suggested by their profiles, points to the possibility of
ies.
fo
divergent scenarios involving positive and negative turning points in their trajectories or
particularities in their profiles. In the next chapter, I explore the leading scenario of
social reproduction and some divergent paths, in greater depth. I put flesh on the
numbers. I move from the realm of abstract statistics to an examination of biograph


CHAPTER 10
SEVENTEEN LIVES
82
My aim in this chapter is to move away from the abstract analysis of the circumstances
and trajectories of The Haven’s students and present a more concrete and descriptive
account of their lives. To this effect I leave the realm of aggregated statistics and
examine the biographies of 17 individuals from Cohort B (N=141). I reconstructed
their social histories from the carers’, teachers’, social workers’, and health
professionals’ narratives that I found in The Haven and the DFS files. With the
biographies I document what it means to be socially excluded. I present 17 short stories
that illustrate the major pathways to offending and also some pathways away from
offending.83 Here I refer to Cohort B as the wide sample, the groups within it as the
wide sub-samples, and the 17 biographies as the deep sample.
I - FOUR MAJOR SCENARIOS
For The Haven’s students, the most frequent pathway to exclusion and offending, or the
“leading scenario” (Daly, 1992), is a story of deprived and abused children, or “harmed
individuals”, who most of the time become “harming individuals.” I call this the broken
kids scenario. It is a story of social reproduction: reproduction of social disadvantage,
82 In Chapter 9 (pp. 250), I presented the rationale for choosing Cohort B as the focus of my analyses. 83 To measure offending I use the official criminal histories from Queensland Police Service (QPS), which include both alleged offences (see definition in Chapters 5, 8 and 9) and proved offences. In the wide sample, out of 141 individuals, 99 had a criminal history. The number of alleged offences was 1914, and 1770 (92%) were proved. Only one individual was never convicted (his alleged offence of criminal damage was not proved). For 56 individuals all their alleged offences were proved and for 42 individuals some of their alleged offences were not proved.
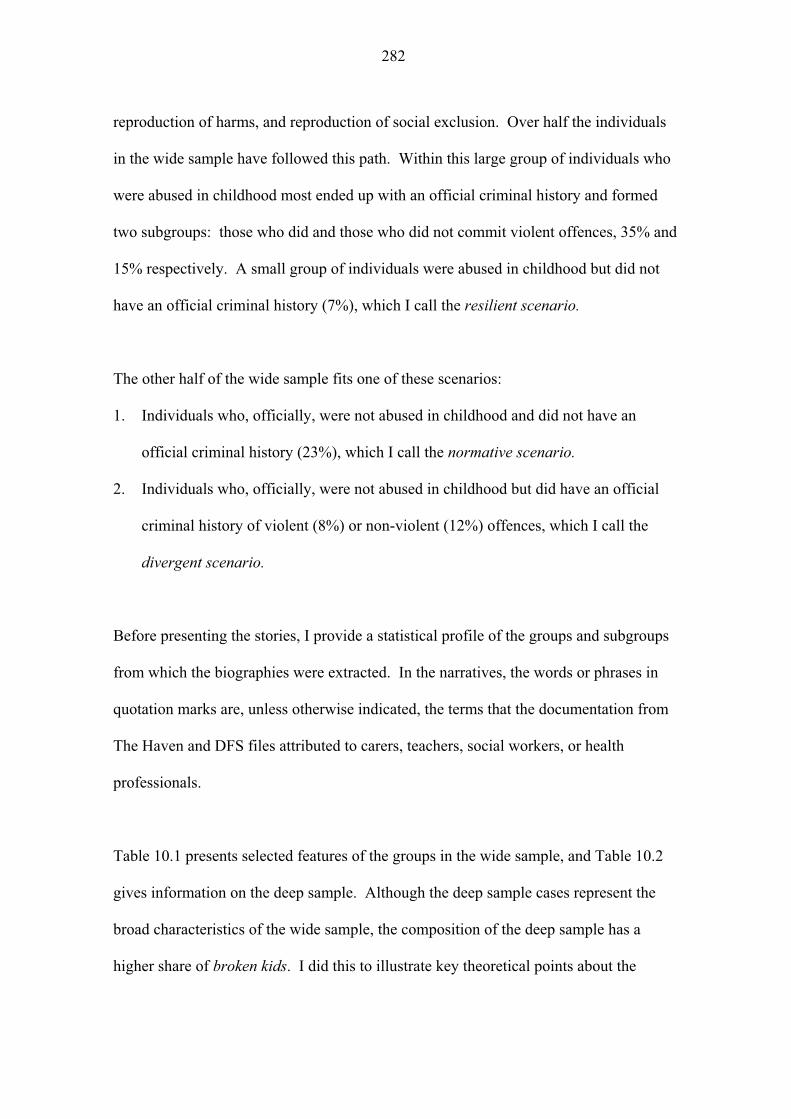
282
reproduction of harms, and reproduction of social exclusion. Over half the individuals
in the wide sample have followed this path. Within this large group of individuals who
were abused in childhood most ended up with an official criminal history and formed
two subgroups: those who did and those who did not commit violent offences, 35% and
15% respectively. A small group of individuals were abused in childhood but did not
have an official criminal history (7%), which I call the resilient scenario.
The other half of the wide sample fits one of these scenarios:
1. Individuals who, officially, were not abused in childhood and did not have an
official criminal history (23%), which I call the normative scenario.
2. Individuals who, officially, were not abused in childhood but did have an official
criminal history of violent (8%) or non-violent (12%) offences, which I call the
divergent scenario.
Before presenting the stories, I provide a statistical profile of the groups and subgroups
from which the biographies were extracted. In the narratives, the words or phrases in
quotation marks are, unless otherwise indicated, the terms that the documentation from
The Haven and DFS files attributed to carers, teachers, social workers, or health
professionals.
Table 10.1 presents selected features of the groups in the wide sample, and Table 10.2
gives information on the deep sample. Although the deep sample cases represent the
broad characteristics of the wide sample, the composition of the deep sample has a
higher share of broken kids. I did this to illustrate key theoretical points about the

283
damaging effects of social and school exclus or turning
points and change. My depiction of the sam e course is current to 2005.
For some, the story ‘ends’ when they are 25, but for others, when they are 44. This
reflects the age range of Cohort B in 2005.
ion, as well as the potential f
ple and their lif

284
Paci
la
0
0
0
2
1
Tabl
e 10
.1.
Wde
sam
ple
i c
cti
OFFI
LO
IY
S
ED
a
n
s)
hara
teris
cs
CIA
LY
NO
T A
BU
SED
aFFIC
ALL
(Bro
ke
AB
UK
idN
cri
his
tory
Norm
ativ
e
N32 (
om
inal
=23%
)
mh
ryC
riin
al
isto
(nn
-vi
len
tn-V
ile
nt
iver
nt
17 (
2%
)
Cri
inal
oo
) N
oo
Dge
N=
1
m h
isto
r y(v
iole
nt)
Vio
nt
Dle
iver
gen
t
N=
11 (
8%
)
No
cri
min
al
ie
N(
m
ryh
isto
ryRes
ilnt
=10
7%
)
Cri
inalh
isto
(o
n-v
Abuse
d N
on-
Vio
l=
21
nio
)
eN
(1
Cri
l o
rle
nt
nt 5%
)
min
ah
ist
y(v
ion
t)
use
dVio
let
leAb
n
N(
)
TO
TA
L
%)
=50
35%
N=
141 (
100
Age
e200
yea
rs
(me
25
(33)
2(
2 (
33)
2 (
22
55
rang
in
5, dia
n)
-44
5-4
4
32)
7-4
16-3
731)
6-3
6 (
30)
5-4
(30)
25-4
(31)
Gen
der
%
%%
%%
%
%
Mal
e
1
0
0
684
62
88
97
99
Fem
9
0
0
4
16
ale
38
12
31
Dd
eca
e b
%
%%
%%
%
%
1st
dca
de
5
0
4
039
e61
44
43
32
2nd
de
5
0
6
561
dec
a
39
56
57
67
Eth
nic
ity
%
%%
%%
%
%
Ang
100
0
0
5
892
lo c
97
10
79
8
N
ES
0
0
0
23
d
3
02
Abo
al
0
0
5
84
rigin
00
1fic
Isnder
00
Pu
m
n
ish
en
t%
%%
%%
%
%
Jail
n
7
0
66
29
sente
ce e
0
18
20
1D
ete
n12
7
0
3
035
7
ntio
f 0
21
4
Note
Tr
icre
fers
to w
hd P
rote
cs
egle
ct o
r em
oal
so
rcTh
ein
eiv
idual
s w
ho w
dd
“An
Aust
ralia
n,”
Eh
isis
ew Z
eala
nder
n
aa
da
hla
atio
n w
as n
oly
iti
I a
ssum
e th
at t
he
l
re A
ngl
-Aust
ralia
n.
bThe
rw
oon o
f in
div
idu
s fr
om
the
1 d
eca
in t
he
wid
e s
e c
e le
r popula
tion o
f st
uden
ts w
ho w
ere
pl
ns
dec
ade
(N=
57 o
r o
e
lation
).
The
lr
ort
vidual
s fr
om
std
thr
vee
hg
oport
ion o
f in
dual
os
de
who d
id n
voffi
l his
tory
.
dng b
ackg
round.
ePe
rs
di
als
sente
nce
d t
o d
en
ue
ts,
or
both
. f T
hi
cat
egory
in
udes
iiv
idual
s w
ho e
xper
ies
juve
nile
s, a
, oth
foll
g a
sen
tence
of
det
e a
nd
ua
hw
ere
not
sente
no
ntion b
ut
wen
t to
det
entio
d,
det
ention c
entr
e fo
llow
ing a
a
O,
bec
ause
it
was
“th
e onl
avai
lable
pla
cem
ent.
tion
, phy
ical
, r
sexu
al h
am
s.
(but
ot
Mori
),
nd in
ivid
uls
aced
at
the
1 d
eca
e in
e
no
mat
i
ntion
nd i
ivid
ls w
o
Car
e nd C
ontr
ol
rder
or
s: a
he
tem
off
ially
is
cat
gory
cl
ud
s in
dw
hose
rac
ial/
etnic
css
ific
ove
all lo
er p
rport
iThe
Hav
en d
uri
g t
hi
gro
up r
efl
cts
te
lar
er p
r N
on-E
nglis
h S
pea
kice
nt
of
invi
du
scl
nd
ced t
det
ey
ether
or
not
DFS
rec
ord
ed C
hil
ere
efin
e a
sglo
-t
spec
ific
alden
fied
. al
stde
19%
f
the
ntire
popu
div
is
frm
thi
dec
a
tentio
as
jve
nil
s, a
dul
nce
d d
eten
tion a
n in r
eman
”
ctio
n N
otifi
nglis
, Brit
atte
ram
pl
refle
arge
pro
pot
ha
e an
dults
or
bor
wer
e se
nt
to a
youthat
ion
for
nh,
Irh,
Nw
eo
ts t
hsm
alio
n o
f in
di
cial
crim
ina
ow
in
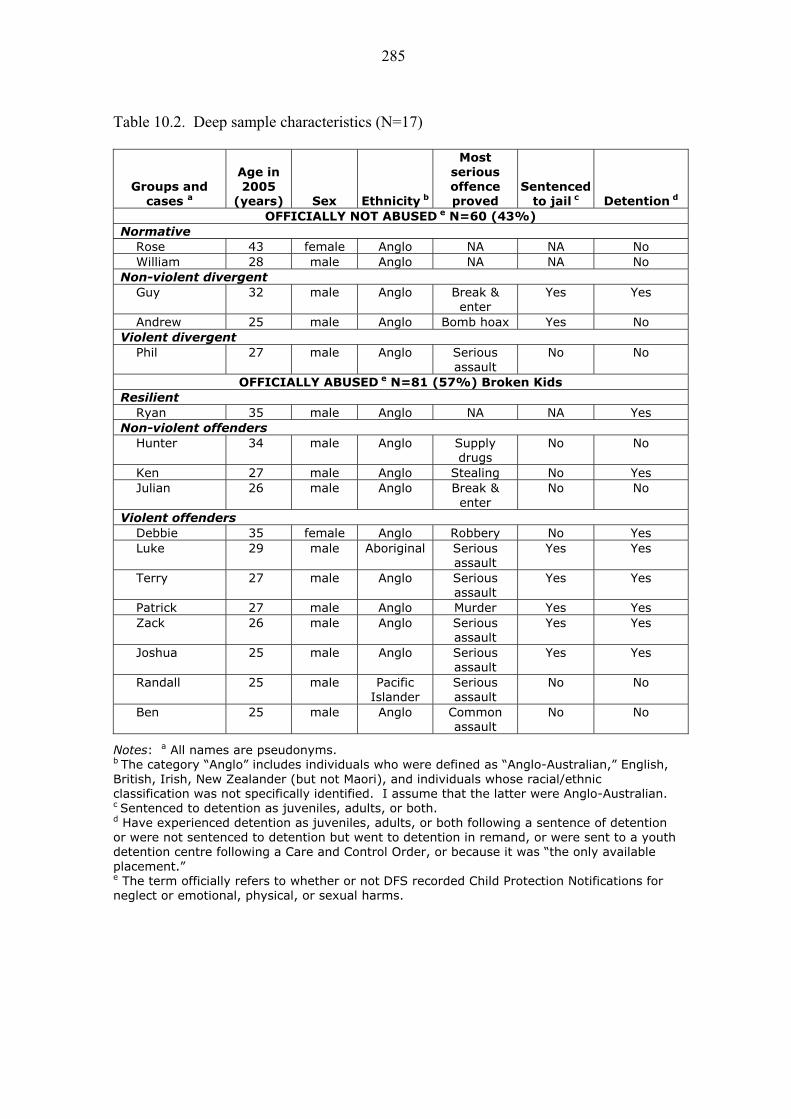
285
Table 10.2. Deep sample characteristics (N=17)
Groups and cases a
Age in 2005
(years) Sex Ethnicity b
Mostseriousoffenceproved
Sentencedto jail c Detention d
OFFICIALLY NOT ABUSED e N=60 (43%)Normative
Rose 43 female Anglo NA NA NoWilliam 28 male Anglo NA NA No
Non-violent divergent Guy 32 male Anglo Break &
enterYes Yes
Andrew 25 male Anglo Bomb hoax Yes NoViolent divergent
Phil 27 male Anglo Serious assault
No No
OFFICIALLY ABUSED e N=81 (57%) Broken KidsResilient
Ryan 35 male Anglo NA NA YesNon-violent offenders
Hunter 34 male Anglo Supply drugs
No No
Ken 27 male Anglo Stealing No YesJulian 26 male Anglo Break &
enterNo No
Violent offenders Debbie 35 female Anglo Robbery No YesLuke 29 male Aboriginal Serious
assault Yes Yes
Terry 27 male Anglo Serious assault
Yes Yes
Patrick 27 male Anglo Murder Yes YesZack 26 male Anglo Serious
assaultYes Yes
Joshua 25 male Anglo Serious assault
Yes Yes
Randall 25 male Pacific Islander
Serious assault
No No
Ben 25 male Anglo Common assault
No No
Notes: a All names are pseudonyms. b The category “Anglo” includes individuals who were defined as “Anglo-Australian,” English, British, Irish, New Zealander (but not Maori), and individuals whose racial/ethnic classification was not specifically identified. I assume that the latter were Anglo-Australian. c Sentenced to detention as juveniles, adults, or both. d Have experienced detention as juveniles, adults, or both following a sentence of detention or were not sentenced to detention but went to detention in remand, or were sent to a youth detention centre following a Care and Control Order, or because it was “the only available placement.” e The term officially refers to whether or not DFS recorded Child Protection Notifications for neglect or emotional, physical, or sexual harms.

286
II – GROUPS’ PROFILES AND CASE STUD
A. N
1. The normative group (not abused-not offending)
Wide sub- p
The median age of the n a a in 10)
fema B u o ile was available for just two individuals, th sou f
inform s from The Haven’s enrolment book or from em
of thi f a tory
They n from the 1st decade, and socio-econo ge w
not pronounced. Over half of the parents were reported to be e y as
persons (e i n, o (e.
nurse and manager). Only 35% lived in very low SES areas at r
The Haven. A significant proportion (30%) had intellectual or severe learning
disabilitie
Deep
Rose. s 5 d
ad S edium SES area. Her placement at te
r y s, until she was over 14, then she was reintegrated into
rt from se e f i
e’s ch w r, because her own children were ab
on Rose’s adult circumstances. At 42, she was m d and
IES
re
DF
ial
mi
mp
r p
the
ge
Th
a
s a
us
ha
(ne
S rec
crim
c dis
loyed
rofe
time
of 10
e Ha
regul
ll we
ed,84
d thr
ot Abused
sam
eca
le
se a
orm
ol f
tive group was 33, and a large sha rly 4
e major
ords. M
inal his
advanta
, mostl
ssionals
of refe
, during
ven las
ar high
know a
there w
ee chil
was
rce o
bers
.
as
trade
g.,
to
1st
early
ool.
t
DFS
. Her
le.
a
s g
ca
sch
tio
ro
me
n com
up ha
pre
e
ve n
dom
o o
ina
fici
tly
l record of child abuse and no offic
.g., TV techn cia electrician, and real estate agent)
ral
the
d n
ch
u
s a
en
s.
sam
Ro
e.
ear
ple
e, 43
he ca
in 2
me f
00
rom
, ha
a m
been placed at The Haven at the a
dec
fou
Apa
Ros
file
s
bo
a
dr
the ab
ildhood.
nc
Ho
of o
eve
ficial records of child abuse, that
arrie
rt rlf
84 RowereHav
se’s story appears to a abused, but she was v
en s missing; she m e se il n
be the stanot herseay have b
thericiaabu
thlly
an abd in
theus ch
reed
proin cdho
duhilod
ctiondh an
ofd.
e
theHo abu
cycwese
le oer,ot
f abusRose’
repo
e. Her s file fro
rted to DF
owm ThS.
n children eoff
en ood thwa

287
husband was reported to be bi-polar and schizophrenic and an intravenous speed user.
He often beat her, and as a result, she was hospitalised several times. He had physically
and se dre at ye ’ d
serious troubles at school and a series of suspensions when he was 8. The second born,
Tania, was p nit when she was 7. Rick, the youngest, was
reported to exhibit sexualised behaviour at school when he was 8. The report also
s ming more and m ania.
Wil illiam, 2 2005, over ars at Haven d g the 2nd decade.
He cam iddle class background. Hi arried, living together,
and had also two younger daughters. Wi ad no rmall pended o
excluded from his previous sc ut c off d bee gotiated
his parents. He had caring parents. His father was concerned about William’s
withdrawn and aggressive tem
social and academic progress at The Haven. His fath es disagreed with The
Haven about the slow graded process of William’s re on in a mainstream school.
Eventually, helped by an effective cooperation betw m’s parents, The Haven,
essionals, William’s reintegration at 11 in a high
with
s
ents with psychiatric problems. Although
his parents wished to have William back at home, they were afraid he could severely
harm his sisters. They asked DFS for help again, hoping that the Department would
s buexually a d the chil n for least seven ars. Rose s oldest chil , Tim, had
laced into a behaviour u
tated that Tim was beco ore violent against his sister T
liam. W 8 in spent two ye The urin
e from a m s parents were m
lliam h t been fo y sus r
hools, b ooling periods ha n ne with
perament. He was also actively engaged in his son’s
er sometim
integrati
een Willia
the receiving school, and health prof
SES regular school was successful. When William was 14, he was diagnosed
Asperger’s Syndrome and his mother contacted DFS asking for help because William
was increasingly violent against his sisters and young children in general. William wa
then placed temporarily in a centre for adolesc

288
take William under it han keeping him in
an institution or sending him back home without assistance. However, DFS could not
help because “placing William in care and protection … would assume he has been
subjected to abuse and/or neglect by his parents which has not occurred.”
2. The divergent group (not abused-offending)
Around a fifth of the wide sample belongs to this group of individuals who officially did
not suffer child abuse, yet had an official criminal history. Two subgroups can be
distinguished: those who committed violent offences and those who did not.
Wide sub-sample: non-violent divergent
The median age of the non-violent divergent group was 32, and there were few females.
A school file was available for four individuals, and four others had a DFS file, but not
for child maltreatment. There were no strong markers of socio-economic disadvantage.
Some 44% of parents were employed in skilled or professional occupations, and only
22% lived in very low SES areas at the time of referral. A small share (about 17%) had
severe learning disabilities, and 12% had been incarcerated.
Deep sample
Guy. Guy, 32 in 2005, entered The Haven at the end of the 1 decade. He came from a
medium-high SES area, stayed six months at The Haven, and was reintegrated when he
was 10 in a special school for children with learning disabilities. He had an extensive
criminal history for property offences with 33 alleged offences of which 21 were proved
s care and find a foster facility for him, rather t
st
and committed when he was 18-28. His most serious offences were break and enter.

289
Between his 23rd and 28th birthdays he was sentenced and went to jail several times.
Because Guy had three children (born when he was between 21 and 30) whom he and
his partner maltreated,85 a DFS file was available. The report indicated that the
children’s mother, from whom Guy had since separated, suffered from schizophrenia.
The maternal grandmother cared for Guy’s children. When he was 30, Guy and a n
female partner were reported to use amphetamines and to be violent towards each o
At this time Guy had lost his job. The report added that they were “on the verge
ew
ther.
of
omelessness.”
olic
and
h
Andrew. Andrew, 25 in 2005, went to The Haven when he was 9, during the 2nd
decade. His placement lasted over a year, after which he was reintegrated in a Cath
school. He came from a medium-high SES area. Andrew and his two siblings were
living with their parents who were both employed in skilled labour occupations
were described as caring. His psychosocial profile defined him as EBD and
hyperactive, but not excessively aggressive. His cognitive functioning was slightly
above average and his academic performance was good. Andrew had not been
suspended or excluded from school before his placement in The Haven. The last report
from The Haven stated that “Andrew had made remarkable progress.” Andrew
committed only two offences. When he was 17, he was sentenced to one year
imprisonment wholly suspended for a period of three years, for a bomb hoax. At 22 he
was convicted again, this time for behaving in a disorderly manner, and received a $100
fine.
Like Rose’s, Guy’s story seems to indicate the start rather than the reproduction of the cycle of abuse. He abused his own children, but he was not himself officially abused in childhood. However, The 85
Haven’s file for Guy was missing; he too may have been abused in childhood and the abuse not reported to DFS.

290
Wide sub-sample: violent divergent
The median age of the violent divergent group was 33, and there was just one female
school file was available for two individuals, and seven others had a DFS file,
. A
but not
r child maltreatment. The only significant distinguishing feature from the non-violent
d. Disadvantage (measured from SES
earning
isabilities, and 27% had been incarcerated.
n his parents, and Phil
as subjected to physical punishment.86 His school file presented Phil as a big, angry,
boy. He suffered early childhood neuropsychological and immune
fo
divergent group is the socio-economic backgroun
of home area and parents’ occupations) was more marked in the violent divergent group.
Only 36% of parents were employed in skilled or professional occupations, and 64%
lived in low SES areas at the time of referral. A small share (18%) had severe l
d
Deep sample
Phil. Phil, 27 in 2005, came to The Haven when he was 11. He was living in a socio-
economically disadvantaged area. Phil had three siblings. His parents were not
separated, but his father was on long sickness benefit and his mother was not working.
There was no official notification of child abuse, but Phil had a poor relationship with
his parents. There were instances of domestic violence betwee
w
and aggressive
system problems, such as temporal lobe dysfunction, asthma, and eczema. His mother
reported that “by age four she was ready to kill him.” He was diagnosed ADD and
medicated with anticonvulsants and antidepressants. He changed schools three times
before his referral to The Haven, but there was no report of formal suspension or
child. Officially Phil was not abused, but his school file suggests otherwise and he had a criminal record. There are other stories like Phil’s in the non-violent and violent divergent groups.
86 The story of Phil, for whom The Haven’s file was available, casts doubt on his status of unharmed

291
exclusion. His cognitive profile was above average and his academic performance
excellent. Phil made some social progress at The Haven, but he was still an angry and
aggressive child when he was eventually reintegrated in a Catholic high school.
example, during the last weeks of his placement at The Haven, his file reported: “Evan
was verbally provoking Phil who retaliated by tackling Evan and hitting him in the
face,” and then a few days later: “Phil walked to the drinking tap where Troy was
standing presumably to get a drink. After he had a drink he kicked Troy who hit bac
and Phil grabbed T
For
k
roy in headlock.” When he turned 17, Phil was convicted for
stealing from the person,” and a couple of months later for “assault occasioning bodily
at 19,
for
by
small
s) and
mall group of 10 individuals, the term resilient only refers to the fact that these
abused children did not have an official criminal history. In reality those in the resilient
n
“
harms” and “aggravated assault on a child under the age of 16.” His last offence,
was for “obstructing police.” Phil was never sentenced to jail.
B. Broken Kids
Nearly 60% of the wide sample are in this category. They all had a DFS file
childhood maltreatment. For many of them child abuse was severe and compounded
other types of traumas, and for most of them, crime was one of the outcomes. A
number did not have an official criminal history, the resilient group. The majority
offended, but some did not commit violent offences (abused non-violent offender
others did (abused violent offenders).
1. The resilient group (abused-not offending)
For this s
group appeared to have suffered from neuropsychological problems more often tha

292
other groups of abused children, and they tended to internalise the harms visited on
l illnesses, self-harm, and suicide attempts.87
.
ural
job.
them through depression, other menta
Wide sub-sample
The median age of the resilient group was 31. Of the ten individuals, three were
female, and one was Aboriginal (female). Socio-economic disadvantage was typical:
70% of parents were unemployed or unskilled workers, and 60% lived in very low SES
areas at the time of referral. Half the group lived in very large families. Criminal
history information was not available for two who left the state in their teens. Ryan’s
story is a typical example of the resilient group
Deep sample
Ryan. Ryan, 35 in 2005, came to The Haven when he was 10, near the end of the 1st
decade. He stayed at The Haven for over a year, made little academic or behavio
progress, and was reintegrated in a special school for children with learning disabilities.
When he turned 12 he was sent to Boystown, a Catholic educational institution where,
until 2002, many wards of the state in the Brisbane region were placed for a maximum
of three years. Ryan, the eldest of four children, was a child of the underclass. His
parents separated before his birth. His father was illiterate and was unable to keep a
His mother had been a patient in a psychiatric hospital. She lived in utter poverty and
died at 28 of cerebral haemorrhage when Ryan was 9.
This is not to be taken as a simple dichotomy in which one group of individuals, who have suffereharms by others, engages in self-harm rather than violently harming others, and another group of
87 d
individuals, who have also been harmed, inflict harm on others rather than on themselves. Amongst the 8 ua,biographies of abused violent offenders presented later in this chapter, at least five (Debbie, Zack, Josh
Randall, and Ben) also internalised the harms.

293
At 5, Ryan was taken away from his father and placed in an institution (Warilda),
because they were living “in a filthy house which was in a shocking state,” and Ryan
suffered “severe deprivation, neglect, and physical abuse.” Ryan had a serious speech
delay. He was diagnosed with “severe personality disorder,” then hyperactivity, and
was heavily medicated with a range of psychoactive drugs for about six years.
Although Warilda was regarded by DFS as “unsuitable for his needs,” another
placement was difficult to find, so Ryan stayed at Warilda, because “for boys like
where else is there?” After his mother’s death, he experienced “extreme school
problems,” was expelled from school and placed at The Haven. At 13, he was expelled
from Boystown for violent behaviours and sexual interference with the
this,
child of his
ouse-parents.88 He was then placed at the Wilson Youth Hospital, which operated as a
ntre, where he stayed for two years. During this placement Ryan
lected
hen
pressants. The report described Ryan as
literate, jobless, and lonely.
h
youth detention ce
attended a special school, which complained that the Wilson Youth Hospital “neg
his educational needs to participate adequately at school.” At 18 he was unemployed.
DFS discharged him to his father who claimed that due to the medication given to Ryan
since he was 5 years old “he had the mind of a 4 years old.” The last DFS report, w
Ryan was 24, mentioned that he was seeing a psychiatrist who diagnosed him with
ADD and depression and prescribed antide
il
ot have an official criminal history, is disputable. Some of the behaviours in his biography, had they been reported to the police, might have led to criminal charges.
88 My classification of Ryan as a resilient individual, because despite the harms visited on him he did n

294
2. Abused non-violent offenders
Wide sub-sample
The median age of the abused non-violent group was 30, there were few females, and
riginal. This group’s profile is similar to the resilient group in having
rkers
high
e placement.”89 Criminal history
formation was difficult to determine for five (all male), who lived in other states
s of 12 to 18. We know that two offended in other states, but the details
c
barbiturates and Hunter
one male was Abo
suffered from neurological problems and having internalised harms, and in the ma
of socio-economic disadvantage: nearly half the parents were unemployed or unskilled
workers, and lived in very low SES areas at the time of referral. However, one third of
this group abused alcohol of drugs. Although only 10% received a jail sentence, a
share (43%) had been incarcerated in youth detention centres as part of a Care and
control Order or because it was “the only availabl
in
during the age
of their offences are not known.
Deep sample
Hunter. Hunter, 34 in 2005, entered The Haven at 10 during the 1st decade and stayed
for one and an half years. According to DFS he made sound academic and social
progress during his placement at The Haven. Hunter came from one of the most
disadvantaged areas in Brisbane. His parents separated when he was 5, and shortly
after, his mother suffered from kidney problems and depression and received psychiatri
treatment. She then committed suicide by overdosing on
ally 89 As I reported in Chapter 8, the system of Care and Control Order in place until 1992 resulted in manyabused children, who had not been officially convicted of any offences or who had not been officisentenced to detention for their offences, being put in protective custody and placed in youth detention centres, to save them “from falling into a life of crime.” For a detailed account of this process and its consequences see Carrington (1993).

295
developed asthma attacks. From age 9 to 16 he was neglected and physically abused by
older
,
ster
d to be
ty
ne
Ken. Ken, 27 in 2005, was referred to The Haven at 7, during the 2nd decade. From a
very early age Ken suffered from a number of debilitating physical and mental health
his father who belted him frequently, for instance, when Hunter tried to protect his
sister from his father’s sexual abuse. When Hunter was 10, his father was unemployed
depressed, and alcoholic and four years later he threatened to commit suicide. Hunter
committed his first offence when he was barely 14, stealing a packet of cigarettes and
two necklaces, for a total value of $13. He was placed at Warilda and then in fo
care. At 16 he was in Grade 10 in a low SES high school, where he was reporte
doing well. At 17 he got a job in a rubber recycling plant, but six months later he was
unemployed. From age 19 to age 24 Hunter was convicted nine times for proper
(break and enter and car thief) and drug offences, including supplying drugs.
When he turned 24, a DFS report indicated that he was married and had two sons,
which he and his partner neglected. Alex, the first-born, had “language, gross and fi
motor, and socialisation delays.” Five years later another report mentioned that Hunter
and his wife had separated and that the children were neglected and physically abused.
The report also mentioned drug use in the house. At the last DFS report, when Hunter
was 30, he and his wife had reconciled then separated again. Sometimes Hunter
“belted” his other son, Brett, who “struggled at school and exhibited behavioural
problems and attention seeking behaviours.” He was “going to repeat Grade 1 due to
irregular attendance.”
problems. Up to age 17, his files mentioned ADD with autistic tendencies, coordination

296
problems affecting his walk mobility, chromosomal abnormality, bed-wetting, spine
ere expressive language impediments. His parents, who had three
ile
ut
d
to help. A social worker reported that Ken’s father
had tried the majority of options available, but was having difficulties because Ken,
isability service, did not fit into a distinct category.” During two years
e of
s for
e
was convicted again for property damage.
deformity, and sev
other children, were farmers in an isolated rural area. The local school refused to keep
Ken, saying it did not have the resources to care for him so Ken was placed at The
Haven. During his placement he boarded in a Brisbane institution for disabled children.
His mother admitted that when under stress she had sometimes hit Ken to the point of
bruising, and later, when Ken was 17, a doctor reported that “at some stage Ken’s father
had tried to beat his son into submission.” When he entered The Haven Ken’s cognitive
functioning and academic performance were average. When Ken was 16, his DFS f
reported that he had turned into a “street kid,” sometimes staying with his parents, b
mostly living in the streets. There were constant reports about his poor hygiene, an
being exploited by other youths. His parents were angry because neither DFS nor any
other agencies seemed to be willing
“
according to d
Ken’s DFS file documented his movement between the streets and numerous youth
shelters from which he was frequently ejected, not for being aggressive, but becaus
his poor hygiene and drunkenness. During this period he was convicted five time
relatively minor offences such as stealing, behaving in a disorderly and indecent
manner, and wilful damage. Although never sentenced to jail, Ken spent three months
in a youth detention centre because it was “the only available placement.” At 25, h

297
Julian. Julian, 26 in 2005, was placed for a year at The Haven during the 2nd decade
when he was just 10. He had attended the same school since Grade 1 and had not been
suspended or excluded before his referral. His psychosocial profile described him as an
unhappy child with low self-esteem, rejected by peers, somewhat angry and bullying
others, but not excessively aggressive. No health problems were reported. His
cognitive functioning was above average, particularly in the non-verbal domain, but
Julian had serious speech-language difficulties for which he received therapy. His
academic performance was poor. Although he was still below grade at exit, he made
significant academic and social progress at The Haven. Julian came from a
disadvantaged background. His father died in a car accident when Julian was 2.
lian’s mother remarried and had a daughter.
eir
ger’s
s
spassing, and a string of drug offences. At 22, Julian fathered
son with a partner described as “intellectually dull.” They were living in a poor
Ju
When Julian entered The Haven, his mother and stepfather were separated. Because
their mother neglected Julian and his half-sister, his stepfather fought for and obtained
custody. At this time Julian’s stepfather and his partner were portrayed as supportive
and caring. However, when Julian was 13, there were reports of physical abuse of the
children by his stepparents. Julian and his half-sister then returned to live with th
mother. At some stage during the next ten years Julian was diagnosed with Asper
Syndrome. He committed his first offence of stalking at 17. Between 18 and 22 he wa
convicted for stealing, tre
a
suburb and were reported to smoke marijuana and neglect their baby boy. Two years
later there were reports of frequent domestic violence and of Julian threatening to kill

298
himself and his son.90 His partner was five months pregnant. During this period he w
charged with a breach of domestic violence order, which was dismissed. At that time
Julian mentioned that his former teacher at The Haven could provide him with some
support. A few months later a new baby boy was born, and according to this last re
“previous problems appeared to have stopped,” but “Julian remained distrustful of all
Government’s services.”
3. Abused violent offenders
Wide sub-sample
Although there were indications that Julian may have been violent towards his partner,
he was never convicted of a violent offence. This is not the case with this last group:
all 50 were convicted of violent offences. Just two were female, four were Aboriginal
(males), and their median age was 30 years. Their DFS file was often voluminous.
Over two-thirds of the parents were unemployed or unskilled workers. This group’s
profile is qualitatively similar to the two other groups of officially abused children in
the nature of the adversity they suffered. However, the level and intensity of adversi
is much greater. The proportion living in large families with teenage mothers, the levels
of family violence (between adults and between adults and children), and the levels of
parental substance abuse and contact with the criminal justice system were greate
Experiences of sexual abuse and placement in institutions, particularly Boystown were
more frequent (50% were placed in Boystown). The levels of drug and alcohol abuse
were high (72%). As adults, 25% had family
as
port,
ty
r.
violence restraining orders or other
90 On the theme of violence versus non-violence, Julian’s classification as an abused non-violent offender is debatable. He was not convicted of violent offences, but his biography suggests that he was perhaps violent towards his partner and children.

299
indications of violence toward female partners. Seventy percent had been incarcerate
Most of the following biographies are sad tales of violent reproduction. The story of
Debbie, whose son, 18 years after her, ended up at The Haven, is a perfect example.
Deep sample
Debbie. A 35-year old woman in 2005, Debbie went to The Haven when she was 12
the beginning of the 2nd decade. She only stayed four months because her referral to
The Haven was judged inappropriate by Warilda, the institution where she had been
placed at 11 for being an “uncontrollable and promiscuous girl.” Coming fro
working poor, she and her three siblings were subjected to severe physical punishm
by their parents who themselves had been beaten
d.
, at
m the
ents
in childhood. At Warilda, Debbie
isclosed that her father had sexually abused her on a daily basis since she was 8. The
tly
any
d
abuse involved full intercourse with threats of violence and actual violence when she
refused, penetration with objects, and the forced participation of her younger brother.
She was at The Haven when her father’s case was being prosecuted. There, a male
teacher accused her of lying about the sexual abuse, so Warilda decided to stop her
placement at The Haven. Her father escaped conviction on a “technicality,” and shor
after, he died by electrocution in an industrial accident. Debbie’s story is a harrowing
tale of repeated sexual abuse not only by her father, but also by one of his friends, as
well as relatives and strangers. She developed psychosomatic diseases. She
experienced multiple home and school changes, including school exclusions, and m
placements in institutions, punctuated by frequent absconding.

300
When she was 13, Debbie was caught for shoplifting and for being an accomplice in the
vandalism of two primary schools and she received a police caution. Between her 14th
and 16th birthdays she hopped from youth shelter to youth shelter, often living in the
streets, drinking, taking drugs, and attempting suicide. At 15 she was pregnant and had
an abortion, and then she was hospitalised for an ovarian cyst and placed several times
in youth detention centres. At 16 she was convicted with a group of adolescent boys
nd girls for break and enter, car theft, and armed robbery of a taxi driver, and placed in
, Debbie was drunk and drugged. Released on bail, she
er 19-year-old boyfriend and at 16 she fell pregnant. He beat her so
th
s
reintegrated in a Catholic school. This is all that is known about his transit through The
a
detention. During the robbery
went to live with h
she left him, lived on the streets, prostituted herself, and received 12 months probation
for soliciting. Then she was hospitalised for depression and gave up her baby for
adoption. At 17, she and another girl were charged with stealing. At 19 she gave birth
to a second child, Jack, whom she maltreated, resulting in facial bruising and three
fractured ribs. Jack was placed with Debbie’s mother. From this time until she turned
34, Debbie had several relationships in which she was frequently beaten. She gave bir
to two daughters, whom she or her partners physically and sexually abused. She was
convicted of a variety of fraud and larceny offences, and a string of minor drug
offences. Her son Jack, aged 11, who was still being cared for by Debbie’s mother, wa
placed at The Haven when she was 30.
Luke. A 29-year old Aboriginal man in 2005, Luke was only 6 when he was placed at
The Haven, at the end of the 1st decade. He stayed there for two years and was
Haven. Luke was the fourth of 16 children, some born to his mother and fathered by

301
various men and some fathered by his dad and born to various women. All his siblings
were half siblings. At 17 months, Luke was admitted to hospital. He had been beaten
by his mother’s partner and presented with “faded bruising” and “one of his teeth had
een knocked out.” From the time of Luke’s birth to age 3, DFS stopped family
ments several times because Luke’s mother was suspected to be living
le.
d
truanting
ulated 77 alleged
ffences out of which 74 were proved. Many of them involved incidents with the
b
assistance pay
with a partner. Both Luke’s parents were alcoholic and he had frequent hospital visits
for the treatment of bruises. Once, his mother hit Luke over the head with a beer bott
At that time, his father felt that Luke’s mother was an “unfit mother” and let another
woman look after Luke. This generous and concerned Aboriginal woman, Tina, had
noticed Luke wandering in a park, looking “sickly and thin” and “lacking parental
interest.” In the DFS file she was called the “unofficial foster mother.” DFS officers
paid a visit to her and remarked how loving she was and how she had become attached
to Luke. They hinted that if his mother signed a form to place Luke under the care and
control of the Department, Luke would be taken away from Tina and placed in foster
care. The best was to keep things unofficial. It was not suggested that Tina could be
“approved”91 as a foster mother for Luke. The difference between an “approved” an
an “unofficial” foster mother is that the latter does not receive any support, financial or
otherwise, from DFS. Between Luke’s 5th and 9th birthdays, DFS issued a number of
child protection orders for physical and emotional abuse, but the records did not
indicate the identity of the maltreater(s). Luke was excluded from school for
in Grade 8. He hated school and went no further than Grade 9. From age 15 to 28,
Luke abused alcohol, even drinking methylated spirit, and accum
o
91 DFS uses the term “approved carer.”

302
police. A quarter of his offences were violent, including one robbery and several
assaults occasioning bodily harm. Some were committed in response to racist taunts
against him. He was sentenced and went to jail many times. At 27 there was a
restraining order against him for family violence. The last time Luke went to jail he
was 28.
Terry. Terry, 27 in 2005, was born in Ireland and his family came to Australia when he
was 9. His parents were both hearing impaired and his father was a carpenter. Terry
had two siblings and his older brother had a history of property offences. At an early
age Terry was described as a “difficult child.” His first suspension occurred in an Irish
school where he threw a chair at a teacher after she humiliated him in front of his p
for wetting his pants. When he was 7, he was involved in gangs, fighting, and
shoplifting. When he was 10, after he came to Australia, Terry was sent to a behavi
unit in Brisbane. At school he was angry and had many fights, not only because he was
teased about his Irish accent, but also because of labelling by other children after his
placement in the behaviour unit. After a fight with other children he once said to the
teachers: “They called us unit spastics. What are you going to do about that?” B
his placement at The Haven, when he was 11, he had attended six schools and had
multiple informal and formal suspensions
eers
our
efore
and exclusions and he had also been caned
any times. Cognitively and academically, Terry was functioning in the high-average m
range, and he was described as “a bright boy who always attempted to manipulate ‘the
letter of the law’.” He had no health problems, but was regarded as a “conduct
disordered” boy. After a year at The Haven he was reintegrated in a Catholic school.
Terry’s father drank excessively and sometimes hit Terry’s mother. Between Terry’s

303
11th and 13th birthdays, there were reports that his father beat him frequently and so
severely that Terry, who was often running away, was removed from home for his
protection.
From the age of 12 to 14 Terry was excluded from so many schools that the Education
Department officially exempted him from schooling. He was even expelled from
Boystown where “he introduced a detention centre mentality to other boys and talked
about rioting.” He abused alcohol, smoked marijuana, and took LSD, and from the ag
of 11 to 26, he offended without interruption and was convicted of 60 offences. A fift
of them were violent offences including robberies and aggravated assaults and he w
sentenced and went to jail many times. When he was 18, a schoolgirl claimed that
Terry had raped her, but it was not recorded in his criminal history. The last
information on the file, when he was 26, was that he was sentenced to serve time in jail.
Patrick. Patrick, 27 in 2005, was sentenced to life imprisonment at 17 for raping and
murdering a 16-year-old boy. It is difficult to imagine a more horrendous existence
than his. Patrick was the sixth of nine children. Many of them had been physically and
sexually abused by relatives and siblings; some went to jail, some turned to prostitutio
some attempted suicide, and some ended up in psychiatric wards. Patrick’s fathe
serious criminal background including property crimes, drug trafficking, and pimping.
When Patrick was 6, his father managed a brothel and violently forced one of his
partners, Julia, a 15 year-old female, into prostitution, after he had her raped by his
friends and even by animals as “bikies initiations.” Although still a violent man, he
e
h
as
n,
r had a
later became a pastor in a Christian cult. Both Patrick’s mother and stepmother (Julia)

304
had criminal convictions for drug offences and experienced periods of imprisonment.
At the age of 8 Patrick was sexually abused by his father’s friends and by relatives, an
when he was 9 he was placed into a Family Group Home, but after 6 months he
returned to his father. When he was 12, after a series of suspensions, Patrick was pla
at The Ha
d
was
ced
ven. Although The Haven knew about Patrick’s terrible family background,
ere was no compassion for him. It was the period when The Haven used compliance
lent
.
le
th
training as its main strategy. There, Patrick was subjected to it so “he would learn to sit
down” and he was also subjected to corporal discipline. When Patrick was 14, his
father handcuffed him to a tree and beat him with a cricket bat. Shortly after he was
excluded from high school. From then until he turned 17, Patrick lived in youth shelters
and in the streets, frequently moving between Queensland and New South Wales.
During this time he worked as a sex worker, was convicted for property and vio
offences, and was also incarcerated. Six months after his 17th birthday Patrick met a 16-
year-old boy, Kevin,92 in a youth shelter. The day after they met, they went out
together and Patrick made sexual advances to Kevin, which Kevin refused. Patrick
forced Kevin into a bushland, raped him, and then strangled him to death with his belt
Following the murder, Patrick handed himself to the police, saying that he killed the
boy because he was afraid the boy would report him for the rape.
Zack. Zack, 26 in 2005, went to The Haven during the 2nd decade, when he was
between 11 and 12. He stayed six months, made no academic or social progress, and
was finally sent to Boystown. Zack’s mother left home at 16, was abused by ma
partners, developed a drug addiction, and had been imprisoned for drug offences. From
92 The file indicates that Kevin was in care, because he himself was victim of physical abuse by his father.

305
the age of 6 to 15, Zack was neglected, and emotionally and physically abused by his
mother and by an older sibling. Zack’s father died of a drug overdose when Zack w
8. Zack had
as
six siblings and one of his sisters had a history of violent offences during
ltercations with the police. According to his mother, Zack’s problems started in Grade
at “it
training
ehaviour unit’s time-out room, which, in a rage, he thrashed. Against the
on
at
r
a
4 when he was 9 and an aggressive teacher violently pushed Zack against the louvers,
and shouted abuses at him. Zack then ran away from school and his mother said th
was the first time he ran away from anywhere.” According to DFS, during this period,
Zack “was getting the cane everyday” at school. His mother also rejected him so, when
he was 11, Zack was placed in foster care and between his 11th and 17th birthdays he
self-harmed and attempted suicide several times. Six months before his placement at
The Haven when he was 11, Zack had been informally and formally suspended and
excluded, and sent into a behaviour unit. The behaviour unit used compliance
to which Zack responded violently. Following such an episode he was locked into the
b
recommendations of DFS, the Juvenile Aid Bureau encouraged the behaviour unit to
press charges for wilful damage. Zack was charged and spent a few days in a detenti
centre where he was sexually abused by older boys. Then Zack was placed at The
Haven where he was reported to have an average score on IQ tests, but to suffer from
speech-language difficulties and to perform poorly on academic tasks. He had also
severe asthma and eczema, was diagnosed with Conduct Disorder and ADD, and
medicated with tranquillisers. After The Haven, when he was 12, Zack was placed
Boystown where he remained for three years. There he abused alcohol and sniffed
petrol, and was reported to have racist and sexist attitudes. When he was 16, “an olde
male slashed Zack’s throat” and Zack was hospitalised. There is no indication that Zack

306
was ever employed. Between his 11th and 25th birthdays Zack was convicted for 74
offences, 16% of them violent crimes, including several robberies, aggravated assaults,
and deprivation of liberty. In total he was sentenced to 11 years imprisonment and he
served most of it. The last time he was sentenced, he was 25 and received three years’
detention to serve.
Joshua. Joshua, 25 in 2005, was referred to The Haven at the end of the 2nd decade,
when he was 12. Before The Haven, Joshua attended seven schools. He was below
average on IQ tests and he performed badly at school. There was no indication that h
had been formally suspended or excluded, but he was a chronic truant. At The Haven
too, his attendance was poor; out of the seven months he was placed at The Haven,
was absent about one-third of the time. He made some academic progress at The
Haven, but did not improve socially. During his placement at The Haven his teacher
commented: “when your life is constantly full of horrific turmoil such as Joshua
experiences on a daily basis, it must be difficult for him to comprehend the significa
of sitting in the classroom and as a result, Joshua spends much of his days looking for
‘time out’ in the playground.” Joshua’s parents were separated. Between his 5th and
12th birthdays, Joshua had child protection notifications for neglect,
e
he
nce
and physical,
motional, and sexual harms. He was placed by DFS in various institutions 26 times.
his
Joshua. Joshua’s father had himself been sexually abused by his own father. Joshua
e
His mother was unemployed and an alcoholic who neglected Joshua’s physical needs.
She was hospitalised for liver failure when Joshua was adult. When Joshua was 12,
father was in jail for the sexual abuse of ten young boys, including anal intercourse with

307
was the third of eight siblings. One of his sisters died in childhood. His four other
sisters had criminal histories involving property, drug, and violent offences. They were
abused by their partners and they neglected their children. One of his brothers had also
been convicted for similar offences. His youngest brother had been excluded from
school. The other children at school complained that Joshua was dirty and smelled
badly, and he was often teased about it. At 12 Joshua was reported to be alcohol and
drug dependent. When he was 14, he attempted suicide. From age 12 to age 24, he was
convicted of 57 offences, 10% of them violent crimes, including arsons, serious
assaults, and armed and violent robberies. Once he also escaped from custody. In tot
he was sentenced to eight years’ imprisonment and served about six years. The last
time he was sentenced (for stealing) he was 24, and received 12 months’ imprisonment
to serve.
4. Against the odds
I now turn to the stories of a few individuals who were on the pathway toward violent
offending but experienced a turning point and were deflected toward more positive
outcomes. The individuals in these rare “success stories” suffered similar traumas:
they were severely abused, they suffered psychological consequences like depression,
self-harm, and drug abuse, and they had an official criminal history, including some
violent offences. However, their criminal offending was moderate, and they were
incarcerated. Ironically, what occurred to them was the positive effect of another type
of rule-breaking. Bureaucratic rules were broken to extend support beyond the
restrictive limits set by the rules; and seemingly against the odds, some individuals
al
not

308
defied the bad omens of statistical prediction. There were few such stories, five at m
I present two.
Randall. Randall was 25 years old in 2005. He was born in Samoa and was the fifth of
11 siblings, three of t
ost;
hem half-siblings. When he was an infant, Randall’s family
oved to New Zealand. His parents separated when he was 3, and his father went to
ir
r
ather
n
e
all
e had been formally suspended a couple of times for aggressive behaviours both in
-
m
Australia. Randall, his younger brother Gary and older brother Denis stayed with the
mother in New Zealand. They often witnessed male partners physically and sexually
abusing her. She developed psychiatric problems and needed frequent hospitalisations.
The boys were placed in institutions where church leaders beat them. When Randall
was 5, he, Gary, and Denis witnessed their mother being beaten to death with a hamme
by her partner. The man then chased them, but they hid under the house.
When he was 9, Randall and his two brothers came to Australia to live with their f
who had re-married. The boys were frequently beaten by their father and stepmother,
and often ran away from home. Their father threatened to send them back to relatives i
Samoa where, he said, they could be even more severely punished without interferenc
by social services. Eventually, they were placed in different foster families. Rand
came to The Haven at the age of 10, near the end of the 2nd decade. Before his referral
h
New Zealand and Australia. On IQ tests he was below average and experienced speech
language difficulties. His academic performance was poor. He suffered from Post
Traumatic Stress Disorder, ADD, and eczema, and was medicated. At age 10, when he
was placed at The Haven, Randall was in foster care and had a committed and loving

309
foster mother. Shortly before his reintegration in a highly disadvantaged state schoo
when he was 11, his teacher commented: “although Randall has made significant
progress at The Haven in the last six months, he continues to display very difficult
behaviours.” His reintegration was not successful, and between his 11th and 12th
birthdays he had many school suspensions and was eventually excluded. After his
exclusion, when Randall turned 12, his foster placement broke down and he was
convicted for wilful damage and aggravated assault so he was placed at Boystown,
where he remained for three years. At Boystown, Randall was a studious pupil a
15 he obtained his Grade 10 certificate with mentions of high achievement in all
subjects. However, a few years later, a Family Service Officer reported that Randall
“had found reluctance by the general community to place high esteem on his Boystown
general certif
l
nd at
icate of education.” After Boystown, Randall drifted between numerous
outh shelters, sniffed aerosols, took speed, and attempted suicide many times. He was
s mental illnesses, frequently hospitalised, and heavily medicated.
d
l
ult and
ater
his social workers obtained an Adult Lifestyle Support Package for him, which included
y
diagnosed with variou
At 15 he was also convicted for car theft. He attempted to enrol in Year 11, but was
excluded.
Between his 16th and 19th birthdays, committed social workers from DFS consistently
supported him and advocated for his social and educational needs. First, they obtaine
$14,000 for an intensive program that included a course in art, an area in which Randal
was talented. They helped him play football and find employment. Randall’s existence
was not without problems; for instance, at 18, he was convicted of common assa
wilful damage, but each time he went through a difficult period he was supported. L

310
financial help for independent accommodation. Like Randall, in late adolescence his
older brother Denis also received significant support and he finished Year 12 and
ecame a chef. When Randall was 19, he and Denis were sharing a unit. Randall was
s
ed
lcoholic, and made numerous suicide attempts. Ben’s parents separated when he was a
s
h.
b
never convicted again for any crime.
Ben. Ben, 25 in 2005, was excluded from school near the end of Grade 7, when he wa
close to 13. From toddlerhood to adolescence he was placed 26 times by DFS in foster
care, institutions, and youth shelters. He had three siblings, all from a different father.
From the moment of their birth, all four children were neglected and physically abused.
Ben’s parents had also been abused in childhood by their parents who had a history of
alcoholism and psychiatric illnesses. Ben’s mother had been raped in adolescence and
diagnosed with paranoid schizophrenia. She became a teenage mother, turn
a
baby. When Ben was only 12 months, he was placed in foster care. At 24 months, he
was medicated for “hyperactivity and symptoms of minimal brain dysfunction.” Then
Ben was returned to his mother, and at 4 was sexually abused by a male neighbour who
was later charged with running a “child pornography racket.” From this time until he
reached 7, he witnessed severe domestic violence, such as his mother being threatened
by her partner with an axe and then with a gun. He was himself beaten by this man
until he “could not see anymore.” Ben became an “extremely difficult child” who wa
“rude and violent with teachers.”
At 7, Ben was back in foster care and for a few years, his placement was successful.
When he was 8 and started Grade 3, he learned that his father had been stabbed to deat

311
After the funeral, Ben “got out of control.” While in Grade 4, when he was 9, his foste
placement broke down. From this time until Ben’s placement at The Haven when h
was nearly 13, he moved between several foster care placements that regularly brok
down. Normally, when children in care move to another placement, they have to
change school to enrol in the school that is closest to the new placement. However,
Ben’s case, DFS, Education Queensland, and the school he had been attending sin
Grade 1, decided to break the rules. They made extra efforts (including financial) to
keep Ben in the same school where, despite increasingly challenging behaviours, Ben
was gradually overcoming a serious academic delay. Although Ben was progress
well in academic tasks, socially and behaviourally he continued to experience serious
difficulties. Between his 9th and 12th birthdays he was suspended several times, but he
was permanently excluded only three months before the end of Grade 7 when he was
close to 13. When Ben entered The Haven, he was at grade level and during his
placement he made significant social progress. During his first year of high school at
14 his results showed very high achievement in a number of subjects.
r
e
e
in
ce
ing
hen he was just 14, Ben was convicted of stealing. Ben’s 15th birthday was marked W
by the breakdown of his foster placement. However, a report indicated that “his
behaviour had stabilised in the years following his admission into The Haven to which
he had responded very well,” and that now “he presented as an articulate young man of
few words who knew what he wanted.” Yet, Ben’s life was not free of problems. After
another placement broke down, he was excluded from high school. During this period
Ben was convicted of a string of offences that included possessing drugs, evading
transport fare, creating a disturbance, refusing to give his name and address to a police

312
officer and assaulting him. Nevertheless Ben, who was now living in a youth
accommodation, was actively seeking enrolment in another high school. Although
punctuated by drug use, and bouts of depression, which necessitated his hospitalisation,
there were happy moments in Ben’s life, like when he renewed contact with his first
ster mother with whom he had a good relationship until the placement broke down
ocial exclusion, where the truly disadvantaged are
ctively excluded from the labour market and civil society, and also both exclude
fo
when he was 9. She encouraged him to complete Grade 12, which he did. He had other
bouts of depression, but he eventually met a girlfriend and was never convicted again of
any crime.
III - SUMMARY AND DISCUSSION
A. History Repeats Itself
The main theme in this thesis, which is illustrated in this chapter with the six major
pathways, and particularly (although not exclusively) the broken kids scenario, is a tale
of reproduction at three levels: (a) through an intergenerational cycle of disadvantage,
or the reproduction of the underclass; (b) through an intergenerational cycle of
interpersonal violence, particularly against children and women; and (c) through an
intergenerational cycle of educational and social exclusion. This theme resonates with
Parsons’ (1999) thesis that school exclusion is part of wider social exclusion and also
reproduces social inequities through educational deprivation. It also resonates with
Young’s (1999) strong version of s
a
themselves and are excluded through crime and criminalisation. All the stories in the
broken kids scenario and some in the normative and divergent groups demonstrate a

313
dominant pattern of reproduction at three levels of disadvantage, harm, and social
exclusion.93 They show that the processes of socio-economic and educational
deprivation, family violence, and marginalisation move from one generation to the nex
B. Neglectful Families and Neglectful Institutions
In most cases families were neglectful, but in many cases other institutions were also
neglectful. The results presented throughout this thesis and the patterns documented i
the wide sample in this chapter show institutional neglect by schools, which exclude
rather than efficiently support vulnerable children, and by social institutions that recor
years of ongoing deprivation and child abuse rather than stop the cycle of deprivation
and abuse. Nine biographies94 illustrate this predominant pattern of neglect by social
services, educational, and criminal justice institutions. In these stories, rather than
buffering against harms, some institutions were themselves harmful. Julian’s “di
of all Government’s services” is indicative of the problem. However, institutions do n
have to be harmful. They have the potential to be helpful, as the stories
t.
n
d
strust
ot
of Randall and
is brother Denis, as well as Ben show.h
C. School Exclusion, Crime, and the Role of Education
As I suggested at the outset of this thesis, rather than a direct causal link, it is likely that
exclusionary practices precipitate or accelerate a number of crime-promoting processes.
For a temporal ordering of causality, in a broad sense it could be said that all the
children at The Haven who turned to crime in early and late adolescence and in
94 William, Ryan, Ken, Luke, Debbie, Terry, Patrick, Zack, and Randall.
93 Ryan, Hunter, Ken, Julian, Debbie, Luke, Terry, Patrick, Zack, Joshua, Randall, Ben, Rose, Guy, and Phil.

314
adulthood, had been excluded before engaging on this path, since most of them
removed from regular primary school when they were 9 or 10. Nine biographies95
show a causal pathway from school exclusion, dropping out of school, or both, to
offending. They also show some of the precipitating and accelerating processes that
link educational exclusion to offending.
The stories in the against the odds subgroup, support Laub and Sampson’s (2003) thesis
that there is n
were
ot a rigid destiny from childhood risks to life course offending. Timely
nd sustained social support in late adolescence can facilitate desistence from crime,
even in the case of individu and committed serious
ffences. These stories also highlight a crucial point: educational re-inclusion is a
Chapman et al.’s (2002) finding that successful completion
it cannot
his,
ld
nt
moil
a
als who have been severely harmed
o
turning point. They confirm
of Year 12 is an important protection against unemployment and crime.
There remains a vexing question. Social support intervention occurs only after serious
harm has been done. Even if it is successful in deflecting a criminal trajectory,
prevent the initial incidence of the abuse and suffering. What should be done about t
especially when we see that the phenomenon is not a question of unlucky and randomly
affected individuals, but the predicament of a specific social class? One biography
(Joshua) points to a preventive educational alternative, at least in the sense that it cou
facilitate the rupture of the cycle of intergenerational reproduction. Recall the comme
of Joshua’s teacher at The Haven: “when your life is constantly full of horrific tur
such as Joshua experiences on a daily basis, it must be difficult for him to comprehend
95 Ken, Luke, Debbie, Terry, Patrick, Zack, Joshua, Randal, and Ben.

315
the significance of sitting in the classroom and as a result, Joshua spends much of h
days looking for ‘time out’ in the playground.” Are traditional curricula and pe
appropriate and relevant for children like Joshua? His teacher was unsure.
is
dagogies
Ball, 1994, p. 46), what would a Inverting the metaphor of a “curriculum of the dead” (
curriculum of the living be for such children? In the next chapter, I will propose an
answer to this question and suggest a broad model of delivery, that is, how, when, and
to whom this educational alternative should be offered. Let’s say for now that a
curriculum of the living for students like the children of The Haven could make the
shared experiences in their lives the object of their study.


SUMMARY AND DISCUSSION
PART IV:


CHAPTER 11
DISCUSSION
Over the last 30 years, school systems in the English-speaking advanced countries of
the Western world have progressively adopted more and more exclusionary practices as
a mode of disciplinary control in schools (Slee, 1995a). Young (1999) has suggested
that, over the same period, West e become increasingly
exclusive. Blyth and Milner (19 lusion from school
any young people the first step in exclusion from civil society.
rsons (199 ould be
understood a g link
between educational exclusion and crime (Berridge et al., 2001).
My study of The Haven confirms this body of work. Over time, in Australia and
Queensland, there is a growing trend in educational exclusion. The excluding schools
and excluded students are composed mainly of large disadvantaged schools and lower
class boys with behaviour and learning problems; they contain an overrepresentation of
racial-ethnic minority members and children in care. The link between school
exclusion, social exclusion, and crime and criminalisation is overwhelmingly supported
by the cohorts of children who transited through The Haven.
In my introduction I proposed that the phenomenon of increasing school exclusion and
its association with further exclusionary processes and mechanisms, including crime
and criminalisation, suggested that educational exclusion could be framed at three levels
ern capitalist societies hav
93) have claimed that exc
represented for m
Pa 9) has proposed that the phenomenon of educational exclusion sh
s part of wider social exclusions. Research has suggested a stron

320
(individual, institutional, and societal). Identifying these levels raised three broad
theoretical questions: Could this phenomenon be explained by (a) increasing individual
misbehaviour and school disruption, (b) changes and problems in school discipline, or
(c) the societal problem of social exclusion?
To answer these questions, I conducted a detailed analysis of the socio-educational
trajectories of 300 individuals who had been excluded from primary school between
1973 and 2003 and placed into a withdrawal unit (The Haven). I asked four empirical
questions:
(a) Who were these individuals?
(b) Where did they come from?
(c) What happened to them?
(d) Where did they end up?
My analyses show that the phenomenon of school exclusion cannot be explained by
looking at one single level alone, whether individual, institutional, or societal. Rather,
as generally suggested by social ecologists (e.g., Bronfrenbrenner, 1979), and
specifically proposed by Parsons (1999) in his “middle range theorising” of school
exclusion, the three levels interact in explaining the phenomenon. At the three levels,
my results support the international literature on school exclusion.
At the societal level, my analyses show that a strong version of social exclusion
provides a satisfactory structural explanation. Most of the children placed at The Haven
came from the truly disadvantaged sector of society and increasingly so over the years.

321
Social exclusion remained a charac tence in terms of poor health,
poor education, unemployment, cri tion.
e
aking extra efforts
EXCLUSIONS
teristic of their exis
me, and criminalisa
At the institutional level, the data reveal that formal suspensions and exclusions before
entry in and after exit from The Haven had increased over the years. Educational
policies during the last decade, such as the extension of school principals’ discretion in
matters of Student Disciplinary Absences (SDAs), the creation of the long-suspension
scheme (6-20 days), and the opening of Centres for Alternative Programs (CAP),
coincided with a growth in formal SDAs among The Haven’s students. Referrals of
students to The Haven were increasingly made by large disadvantaged schools, which
were also more likely to make multiple referrals. The 17 case studies show that som
schools were more willing than others to break with convention by m
to keep disruptive students.
At the individual level, the results show that most of the children at The Haven had been
aggressive, violent, and seriously disruptive at school. They came from dysfunctional
families where aggression and violence were prominent features, and where many had
suffered severe maltreatment.
I - SCHOOL EXCLUSION IS PART OF WIDER SOCIAL
Theoretically, my results are consistent with Parsons’ thesis (1999) that school
exclusion is part of wider social exclusions, and Young’s thesis about a strong, but
modified (i.e., bulimic) version of social exclusion. My statistical analyses in Chapters

322
6-9 and the biographies in Chapter 10 concretely illustrate the many interacting dom
of social exclusion (socio-economic, familial, educational, medical, and judicial). The
high levels of children’s and youth’s health problems, transience, child abuse and other
forms of interpersonal violence, and crime and
ains
criminalisation were even worse than I
xpected. My findings reveal a near absence of social mobility and a trans-generational
larly male violence against women and children, appeared as an endless
cycle o i , it was possible to document the
increas ng, 1999). With growing mechanisms of de-
institut li dividualisation, the children and their families
were increasingly caught up in continuous processes of exclusion, partial reintegration
ed
.” For the children
f The Haven these structural factors constituted determinant contexts, in which
or
quantitative analyses and the biographies suggest a predominant pattern, in which the
e
pattern of social exclusion. Structurally, exclusion from mainstream expectations of
adequate education and health, reasonable employment opportunity, personal safety,
and social justice was reproduced from parents to children. Moreover, family violence,
and particu
f soc al reproduction. Over 30 years
ingly bulimic nature of society (You
iona sation, privatisation, and in
and re-exclusion. This was not only reflected in the patterns of educational exclusion
but also in the practices of social services.
Although individual, institutional, and societal forces promoting exclusion all featur
in the results, my multilevel analysis reveals that structural factors, as proposed by
Parsons (1999, p. 36), “exert[ed] more power than individual agency
o
institutional and individual forces promoting exclusion were operating. The maj
pathway to school exclusion, criminal offending, and social exclusion was a scenario of
deprived and harmed children who became harming and rejected individuals. The

323
children of The Haven come from truly disadvantaged social and familial contexts,
where they suffer harms that they revisit on others within their large, poorly resourced,
nd disadvantaged local schools. These schools were attended by many children living
d
y
cietal and familial neglect compounded by institutional
eglect, where individual agency exerted little power. Yet, the rare against the odds
ANISMS OF INDIVIDUALISATION
My finding a strong
ersion of social exclusion, where opportunities are blocked for an underclass that is
ault,
a
in similar circumstances, and hence they were more likely to use exclusionary practices.
It is possible that a studious and well-behaved student would not be excluded from
school, even if s/he came from a background of social and economic deprivation and
child abuse and attended a large disadvantaged school. Likewise, a traumatised an
aggressive child with the same “toxic” socio-economic and familial background but
attending a small school capable of mustering a good level of resources, would probabl
not be excluded either. In hypothetical scenarios like these, individual and institutional
factors do play a major role, but these two hypothetical scenarios are unlikely. The
most frequent scenario was so
n
stories show that, in the short and middle terms, interventions at the institutional level
may be the best option available.
II - MECH
s clearly support an interpretation of educational exclusion based on
v
actively rejected by exclusionary powers in society. Yet, they also illustrate how
attitudes, discourses, and strategies, through mechanisms of individualisation (Fouc
1977) and processes of demonisation (Parsons, 1999; Young, 1999) dismiss this

324
structural impact. In The Haven’s stories, institutions and dominant groups depicted the
children’s situations through a weak version of social exclusion in which exclusion was
self-imposed and squarely blamed on the victims. A myopic focus on the individual
permitted a reduction of social problems to individual pathology and personal agency.
Individualisation was reinforced through pedagogical and disciplinary regimes, such as
behaviour management and technologies of the self (Foucault, 1988), which furthered
atomisation and processes of exclusion.
In Chapter 7, I documented the great number of interventions and the multitude of
short-term programs to which the children of The Haven and their families ha
subjected to by numerous agencies and professionals. I also documented that the large
volume of interventions was a reflection of their poor quality. The files revealed a
fascination with recording, assessing, and monitoring the development of problems.
Interventions were often untimely, inappropriate, and cut short due to insufficient
resources. Interventions were stopped, resu
d been
med later, and stopped again, in a way
milar to the cycle of “pull-out, pull-in, and pull-out again” processes of exclusion,
rs
nt
si
reintegration, and re-exclusion. The focus was on temporary social control rather than
long-term social support.
The files documented how schools and teachers, social services, and social worke
predominantly interpreted academic and social difficulties as individual deficits, devia
choices, or both. Individually-focussed interpretations of the children’s problems
entailed normative assessment, remediation strategies, medicalisation, withdrawal
programs, and punishment. Schools’ and social services’ over-concern with potential

325
individual pathologies, disabilities, and syndromes occluded the uniqueness of the
learning styles and needs of individuals. In most schools, the “recognition of
differences,” an important facet of the “productive pedagogies” mentioned in the
Queensland School Reform Longitudinal Study (School of Education-UQ, 2001), was
not a pedagogical priority. The individualising and controlling medical approach struck
,
g and choosing an exclusive path. Self-fulfilling
rophecies, reinforced by the internalising processes of the technologies of the self,
insured that ongoing e ime and
riminalisation, would be the most likely outcomes. On all the variables selected from
static
hardest upon children who were already vulnerable and marginalised. For these
children, schools turned into hospitals or prisons, and school regimes focussed on
finding individual pathologies and designing “appropriate” treatments or punishments
rather than providing educational and liberating environments.
III - OUTCOMES OF SCHOOL EXCLUSION
Labelling, victim blaming, and demonisation were mechanisms used by schools and
social services to depict the children’s situations through a weak version of social
exclusion, which produced and justified individualising mechanisms. The children and
their families were deemed undeservin
p
ducational and social exclusion, including cr
c
general population studies, the rates of crime and criminalisation in The Haven’s
population were substantially higher.
My quantitative and qualitative analyses of offending showed that a dynamic
perspective (Laub & Sampson, 2003) better explained offending trajectories than

326
(Gottfredson & Hirschi, 1990) and taxonomic (Moffitt, 1993) perspectives. Consistent
with Laub and Sampson’s (2003) proposition, while the age-crime curve was not
invariant (i.e., there were distinct trajectory groups), all of the offending groups had
desisted from crime by age 30. Moreover, there was no indication of truly distinct
aetiologies between offending trajectory groups. What mattered in the development and
extent of offending was the level of adversity, that is, the cumulative number of risk
factors rather than the specificity of these risks. Furthermore, the biographies illustrated
at when informal social controls actually translated into social support (which was
xt not only in pathways to crime and criminalisation but also
other domains of social exclusion such as education, health, employment, and
en
e and
th
rare), positive changes (i.e., turning points) could occur, even in cases of serious
childhood adversity. Finally, the dynamic perspective was correct in predicting the
impact of educational risks (e.g., official school exclusion) and protections (e.g.,
successful reintegration and effective school support) on the onset, extent, and
seriousness of, or desistence from, offending.
IV - CLASS CANNOT BE DISMISSED
Contrary to the shared assumption of the three developmental crime perspectives, social
class is a determinant conte
in
personal security. Most of the children of The Haven came from the underclass. Ev
though there was little variation between the individual profiles in this domain, the
results indicated a statistically significant relation between the socio-economic scal
offending in the larger Cohort A (individuals who were 17 or older in 2005) and
approached statistical significance in the smaller Cohorts B and C.

327
Eventually, what is important for social policy is the relative usefulness of theo
frameworks. Despite its gender and class bias, major aspects of the dynamic
perspective proposed by Laub and Sampson are supported by my case studies, and poin
to areas where intervention could be effective. The deterministic interpretations of the
static and taxonomic perspectives provide neither an accurate account of my data
offer much prospect for policy intervention. The dynamic theory does better on bo
counts. The case studies demonstrate that institutional support and structurally-
facilitated individual agency open opportunities for change, and that institutions can be
retical
t
nor
th
ther neglectful or helpful. They can increase risks or buffer against them. The
quantitative analyses h n the onset and
ersistence of offending and violence, and in furthering social exclusion. The
d
n education
ei
ighlighted the salience of educational risks o
p
biographies illustrated how school exclusion in many cases preceded offending. As
importantly, they showed that social support that focussed on providing a solid
education not only facilitated desistence from crime but also permitted inclusion in
mainstream society. These findings suggest that a way to structurally facilitate
individual agency would be to deliver a liberating education that provides harmed an
harming individuals with an understanding of these very structures, that is, a
that facilitates the development of their metacognitive abilities, which are the source of
educated choice.

328
V - THE PEDAGOGY OF THE OPPRESSED
The Queensland School Reform Longitudinal Study (School of Education-UQ, 2001
found that “productive pedagogies,” focussing on “intellectual quality,”
“connectedness,” and “recognition of differences” were not delivered in disadvantaged
Queensland schools attended by the children of the underclass. Rather than concentra
on basic skills and blind compliance with norms, even the pro-social ones, through
behaviour management and other forms of “correct training” (Foucault, 1977),
productive pedagogies awaken children to structural and political dimensions. Th
types of pedagogies were not delivered at The Haven, but neither were they present i
its sending and receiving schools. In most instances The Haven offered a “suppor
classroom environment” (School of Education-UQ, 2001), which was often not
in the sending and receiving schools. In providing
)
te
ese
n
tive
the case
intellectual quality, the challenge is
facilitate access to variety and structure in order to boost metacognitive and
imaginative processes, pa rom a deprivation of the
me; in other words finding, devising, and using “metacognitive enablers” (Elliot,
an agency from the
to
rticularly for those who are suffering f
sa
2003).
A. Intellectual Quality
Metacognitive and imaginative processes are more likely to develop when the set of
memorised elements is characterised by both variety and structure. A large pool of
memorised elements at many different levels of experience (i.e., sensory, aesthetic,
emotional, behavioural, cognitive, conceptual) provides a rich palette for the
development of new associations, which are essential to liberate hum

329
shackles of inhibiting social experiences (Laborit, 1992). The lack of experiential
alette can
ctors
r
social
), I
to
(i.e.,
uced ample evidence of the relation between the sociological domain
.e., social disadvantage and class oppression) and the cognitive and metacognitive
domains. For example, the children of The Haven suffered from delays in language
development. Yet, language is action. To speak is to act. The inability to use language
restricts an individual’s scope for gratifying action in the social world. The likely
variety is one of the cultural predicaments of the children of the underclass. However,
without structure (i.e., framework, method, organisation, theory), even a rich p
end up producing a poor picture. Without a sense of structure, that is, without an
understanding of the “levels of organisation” (Laborit, 1977), it becomes impossible to
articulate meaning. This aspect of intellectual quality is unlikely to be delivered
through training the disaffected into a set of reduced basic skills. Such skill training is
more likely to engender boredom and disengagement. We should not forget that
pleasure, fun, gratification, and having some meaningful power, something that The
Haven’s children did not have and continually strived for, are crucial emotional fa
in motivating interest in, rather than avoidance of, school activities (Slee, 1992). Fo
instance, most children enjoyed and performed well in the hands-on science and
study programs offered by The Haven during the last decade. Drawing from the
Queensland School Reform Longitudinal Study (School of Education-UQ, 2001
suggest that it is because these programs provided the children with the opportunity
use complex reasoning skills such as hypothesising, synthesising, and evaluating
“rich tasks” [School of Education-UQ, 2001]) when designing and working on their
chosen research projects.
My thesis has prod
(i
330
outcome is inhibition o lly the use of
hysically aggressive action, rather than imaginary escape, to obtain gratification or
).
ividuals are
trols
it might
is that focussing on the management of human behaviour, as an object for the
udents’ collective study, rather than a means of individual control, might help these
es from their own behaviour. In the process they may acquire
gies
ty.
f action and associated pathologies, and eventua
p
cope with painful situations (Dionne et al., 2003; Laborit, 1986; Snow & Powell, 2002
Unable to use language, which is the key to the symbolic realm, such ind
denied access to this realm and to the distance such a realm provides between self and
object.
My thesis also suggests that to provide even more formal or informal social con
(i.e., to normalise) will likely not help, despite the popularity of such regimes toward
“unruly children” like those at The Haven. It is not that socialisation into particular
norms (e.g., respect others) is unnecessary. However, education about the meaning,
significance, and power relations infused into those norms, that is, insight into the
processes of norm-making, stands at a higher cognitive level. Educating at this level
would be liberating and enlightening. Rather than simply managing behaviour,
be useful to educate troubled and troublesome children about the different ways of
theorising human behaviour and its management. The hypothesis behind such a
proposal
st
children distance themselv
valuable knowledge and understanding of the human sciences, and discover creative
strategies to deal with their own behaviour and the behaviour of others. These strate
might include the struggle to change exploitative and violent behaviours in our socie

331
B. Connectedness
My study has revealed the contradictory policies and practices revolving around the
inclusion versus segregation rhetoric. This polarised polemic leads to bulimic processes
of endless exclusion and reintegration mechanisms. The opening of alternative fac
for disruptive students, and the shortened transit periods in such facilities, as The Haven
30-year data on length of stay revealed, led to increased exclusionary practices in
mainstream schools, particularly in large disadvantaged schools. It prevented school
systems from looking at changes in the core elements of schooling, and at the leve
support and resources necessary to implement such changes. Intervention programs
targeting “at-risk” students focused on behaviour control rather than on enhanced
educational experiences and social understanding. The middle- and long-term effects
such strategies on students’ educational and social pathways were not positive. Yet,
placement in The Haven was not always experienced as a negative event. Many
children enjoyed their time at The Haven and preferred being in The Haven than in t
mainstream school. The aim of quickly reintegrating students, “for their own good,”
into regular schools may have limited the opportunity to develop truly alternative
pedagogies at The Haven. The fact that so many children were often excluded again,
indicates that mainstream v
ilities
l of
of
heir
alues, organisation, curriculum, and pedagogies were not
roviding better connectedness.p
My thesis suggests that instead of pursuing fragmented educational strategies where
disadvantaged children are endlessly absorbed and rejected, and fall through the gaps
created by disconnected services, it would be useful to design the school as a hub of
multiple activities and services. In contemporary society, the school, particularly in

332
urban areas, is probably one of the rare secular and universal remaining settings with th
potential features of authentic communities. In our system where schooling is
compulsory, all children have to spend a great amount of time in school. They naturally
bring “their problems” to the school. These problems, rather than being ignored or
simply controlled and eventually banned from the school, could become objects of
educatio
e
nal interest and dealt with educationally by schools. In the process, schools
ould become genuinely supportive learning communities. One avenue for the
ss
chool
aven’s children, at some stage, and preferably early on, spending a good deal of
w
implementation of a more successful developmental service model is to consider the
school as a hub for all services (Dishion & Kavanagh, 2002). This would entail
broadening the scope of, and our investment in, schooling rather than reducing
schooling further to attaining purely meritocratic goals. Not only the educational
mission of the institution, but also the setting itself could serve as a supportive and
educative context, particularly for those who need it most, the children of the undercla
and their families.
However, the need for a “whole of government approach” that would set up the s
as the hub of many services (including health, family, occupational, legal, and
recreational services) should not be framed within a medical model that pathologises
problems (i.e., only further increases social control). Rather, it should be framed within
an educational model that dispels ignorance, connects individuals and problems, and
facilitates collective action. To provide quality education, far more resources need to be
allocated to disadvantaged schools. Judging from the terrible outcomes for most of The
H

333
resources on those who had been given little to start with, both at the individual and
ted
t
es
d.
tudy.
e,
ve, and sociological structures, and their interactions
the process of social oppression, what Laborit (1992, p. 55) called a “bio-psycho-
societal levels might pay more than it would cost.
C. Recognition of Differences
As Parsons (1999) suggests, the dominant educational philosophy at any time is likely
to reflect the value systems of the dominant groups in society. In the market-orien
exclusive society, the emphasis on the custodial and credentialing functions has given
precedence to the educator as a controller (custodial function) and knowledge merchan
(credentialing function), and this has fuelled educational exclusion. My thesis propos
to embrace and struggle for a radically different role: the educator of the oppresse
The very fact that inequalities exist, that there is no level playing field, should, in
educational terms, be the very reason for making these inequalities as objects of s
This pedagogy of the oppressed, rather than only delivering individualised and
depoliticised intervention programs, engages the oppressed into a study of the
mechanisms of interpersonal and institutionalised violence. It focuses on class, rac
and gender oppression; and dominance hierarchies of wealth, status, and power; and
thus, on power relations, dispossession, deprivation, and social exclusion. It is an
education about biological, cogniti
in
sociological pedagogy.” Unlike technologies of the self, the aim is not to “control thy
individual self” but to “know thy social self.”

334
Although in many ways radical, this proposal is not a utopian project. There is an
important body of contemporary literature on how to change school cultures an
provide liberating education to the truly disadvantaged. These ideas were presented in
Chapter 3, and include not only the Queensland School Reform Longitudinal Study’
notion of “productive pedagogies,” (School of Education-UQ, 2001) but also many
studies by those in the inclusive and democratic education movement (e.g., Hollins,
1991; Knight, 1985, 2000; Lingard et al., 2001; Pearl, 1991; Pearl & Knight, 199
1998b; Valencia, 1997). These studies do not present tales of miraculous quick fixes,
but stories of well-planned and long-term social and cultural transformations that
involve many struggles but also bring success.
A detailed examination of how, when, and to whom this educational alternative sho
be offered, is out of the scope of this thesis. However, I suggest that models of crime
prevention with thei
d
s
9; Slee,
uld
r notion of “primary prevention” (universal and before the problem
appens), “secondary prevention” (targeting those who are at risk but still before the
odel for a
st
ion,
Queensland, 1994, p. 2). Then, at a second level, a more targeted focus is placed on
h
problem happens), and “tertiary prevention” (intensive support for those who have
developed the problem) (Cameron & Laycock, 2002; Pease, 2002), and the “M
Supportive School Environment” (Department of Education, Queensland, 1994, p. 1),
with its three-level pyramid of support, provide a plan for delivering the pedagogy of
the oppressed. These models propose to start at the base of the pyramid of support, fir
with an universal focus, for instance at a system-wide level in which all schools
introduce productive pedagogies to realise their stated aims, which is to provide
“effective learning in a positive, socially just environment” (Department of Educat

335
disadvantaged schools, where problems are more likely to develop and exclusion is
more likely to occur, and where delivering the pedagogy of the oppressed is particularly
levant as a “problem solving” process (Department of Education, Queensland, 1994,
and secondary interventions in an inclusive setting,
d
IV - EDUCATION AND CRIME REVISITED
, I
level of
s
eir
revention, especially for the lower
lass boys on whom criminologists generally focus, is not well understood. Education
and crime prevention form an interdisciplinary domain worth greater attention. Great
re
p. 2). Finally, if despite primary
some students still need to be removed from regular school to receive “intensive
support” (Department of Education, Queensland, 1994, p. 2) in facilities such as The
Haven, then, at this third level of the pyramid of support, the pedagogy of the oppresse
and productive pedagogies should constitute the philosophical framework from which
these intensive support programs are designed and delivered.
My thesis has confirmed and further elucidated the powerful link between education,
social inclusion or exclusion, and crime and criminalisation. In the introduction
contrasted the declining level of societal investment in education with the rising
investment in crime control systems in Australia. Although the complex circumstance
of The Haven’s children preclude adopting a simple equation such as “schools or
prisons,” in which poor schooling is the sole factor in crime and criminalisation, th
stories show that there is some truth in this equation. The link between school and
crime is not new for criminologists (Polk, 1983, 1984, 1997; Polk et al., 1972).
However, the link between quality education (i.e., relevant, appropriate, effective,
stimulating, and inclusive education) and crime p
c

336
caution is also needed because one of the dangers in connecting education and
criminology is the “judicialisation” of schooling, with the import, for instance, of
control-oriented criminological thinking such as zero tolerance into schools. Skiba and
his colleagues (2003), and my own research, show that the valid equation is not contro
in school now or control in prison later; rather, it is quality education now or poor
outcomes such as crime and incarceration later.
l

REFERENCES
Alinsky, S. (1971) Rules for Radicals. New York: Vintage Books.
Andrews, R. J., Elkins, J., Berry, P. B., & Burge, J. A. (1979) A Survey of Special
Research Centre, University of Brisbane.
Artiles, A. J. & Trent, S. C. (1994) “Overrepresentation of minority students in specia
Australian Broadcasting Corporation (ABC) (2004) The 7.30 Report. Broadcasted 16 December. Sydney: ABC Television.
Australian Bureau of Statistics (ABS) (2006) 2001 Census Quic(ATSIC Region (Indigenous Region)) - Indigenous characteristi
Education in Australia. Brisbane: Fred and Eleanor Schonell Special Education
leducation: a continuing debate.” The Journal of Special Education, 27, 410-437.
kStats: Brisbane cs, updated 22 July
006. Available from http://www.abs.gov.au
Australian Institute of C Australian Crime: Facts and Figures 2005.Canberra: Australian I
ttp://www.aic.gov.au/publications/facts/2005/
Australian Parliament: House of Representatives Standing Committee on Employment,
Inquiry into Truancy and Exclusion of Children and Young People from School.
olexclusion in at-risk youth: an experimental study of school social work with cost-
ndEducation: Discipline and Knowledge (pp. 1-8). London: Routledge.
technological change.” Educational Administration Review, 3(1), 17-37.
2
riminology (2006) nstitute of Criminology. Available from
h
Australian Library and Information Association (2002) “Federal budget 2002 analysis summary.” aliaNEWS, 16 May. Available from http://www.alia.org.au/alianews/2002.05b.html
Education and Training (1996) Truancy and Exclusion from School: Report of the
Canberra: Australian Government Publishing Service.
Bagley, C. & Pritchard, C. (1998) “The reduction of problem behaviours and scho
benefit analysis.” Child and Family Social Work, 3, 219-226.
Ball, S. J. (1990a) “Introducing Monsieur Foucault.” In S. J. Ball (Ed.), Foucault a
Ball, S. J. (1990b) “Management as moral technology.” In S. J. Ball (Ed.), Foucaultand Education: Discipline and Knowledge (pp. 153-166). London: Routledge.
Ball, S. J. (1994) Education Reform: A Critical and Post-Structural Approach.Buckingham: Open University Press.
Barnett, C. (1986) The Audit of War. London: Macmillan.
Bates, R. J. (1985) “Changes in educational administration necessary to cope with

338
Beccaria, C. (1767/1963) On Crimes and Punishments, (H Paolucci, Trans.).
presented at the Homophobia - Get over it! Conference, Brisbane, June.
Bell, D. (1973) The Coming of Post-Industrial Society. New York: Basic Books.
Bennathan, M. (2001) “Nurture groups.” In J. Visser, H. Daniels, & T. Cole (Eds.)Emotional and Behavioural Difficulties in Mainstream Schools (pp. 29-45). OxforElsevier Science.
Indianapolis: Bobbs-Merrill Company.
Beckett, L. (2001) “‘Get over it’ and ‘get used to it’: homophobia in schools.” Paper
,d:
Bennett, P. L. (1993) “Stockpiling the unsaleable goods.” Education, 182(7), 126-127.
Bernstein, B. (1977) “Social class, language and socialisation.” In J. Karabel & A. H. Halsey (Eds.), Power and Ideology in Education (pp. 473-486). New York: Oxford University Press.
Berridge, D., Brodie, I., Pitts, J., Porteous, D., & Tarling, R. (2001) The Independent Effects of Permanent Exclusion from School on the Offending Careers of Young People - RDS Occasional Paper, No. 71. London: Research, Development and Statistics Directorate, Home Office.
Bliss, D. (1992) “A collaborative approach to behaviour management in the classroom.” In J. Elkins & J. Izard (Eds.), Student Behaviour Problems: Context, Initiatives, Programs (pp. 216-231). Hawthorn: Australian Council for Educational Research.
Blokland, A. & Nieuwbeerta, P. (2005) “The effects of life circumstances on longitudinal trajectories of offending.” Criminology, 43(4), 1203-1241.
Blumstein, A., Cohen, J., Roth, J, & Visher, C. A. (1986) Criminal Careers and Career Criminals, Vol. 1. Washington: National Academy Press.
Blyth, E. & Milner, J. (1993) “Exclusion from school: a first step in exclusion from society?” Children and Society, 7(3), 255-268.
Blyth, E. & Milner, J. (1994) “Exclusion from school and victim blaming.” OxfordReview of Education, 29, 293-306.
Blyth, E. & Milner, J. (1996) “Exclusions: trends and issues.” In E. Blyth & J. Milner (Eds.), Exclusion from School: Inter-Professional Issues for Policy and Practice (pp. 3-20). London: Routledge.
Bodna, B. (1987) “People with intellectual disability and the criminal justice system.” In D. Challinger (Ed.), Intellectually Disabled Offenders (pp. 11-35). Canberra:Australian Institute of Criminology.
Bourdieu, P. (1973) “Cultural reproduction and social reproduction.” In R. Brown (Ed.), Knowledge, Education, and Cultural Change (pp. 71-112). London: Tavistock.

339
Bourdieu, P. & Passeron, J. C. (19 ducation, Society and Culture.London: Sage.
Bourne, J., Bridges, L., & Searle, C. (1994)
ge.
29(3), 211-223.
elopment: Experiments by
ildren
dge:
y (pp.
learned about working
l
77) Reproduction in E
Outcast England: How schools Exclude Black Children. London: Institute of Race Relations.
Bowles, S. & Gintis, H. (1976) Schooling in Capitalist America. London: Routled
Bradley, R., Henderson, K., & Monfore, D. A. (2004) “A national perspective on children with emotional disorders.” Behavioral Disorders,
Bradshaw, K. (2001) “The integration of children with behaviour disorders: an Australian perspective.” In J. Visser, H. Daniels, & T. Cole (Eds.), Emotional and Behavioural Difficulties in Mainstream Schools (pp. 165-181). Oxford: Elsevier Science.
Braithwaite, J. (2000) Regulation, Crime, Freedom. Aldershot: Dartmouth.
Brantlinger, E. (1993) The Politics of Social Class in Secondary School: Views of Affluent and Impoverished Youth. New York: Teachers College Press.
Brantlinger, E. (1994) “High-income and low-income adolescents’ views of special education.” Journal of Adolescent Research, 9(3), 384-407.
Brantlinger, E. (1997) “Using ideology: cases of non-recognition of the politics of research and practice in special education.” Review of Educational Research, 67(4), 425-459.
Bratton, W. (1998) “Crime is Down in New York City: Blame the Police.” In N. Dennis (Ed.), Zero Tolerance: Policing a Free Society (2nd ed., pp. 29-43). London:IEA Health and Welfare Unit.
Bronfrenbrenner, U. (1979) The Ecology of Human DevNature and Design. London: Harvard University Press.
Bynner, J. (2001) “Childhood risks and protective factors in social exclusion.” Ch& Society, 15, 285-301.
Cameron, M. & Laycock, G. (2002) “Crime prevention in Australia.” In A. Graycar & P. Grabosky (Eds.), The Cambridge Handbook of Criminology. CambriCambridge University Press.
Cameron, L. & Thorsborne, M. (2001) “Restorative justice and school discipline:mutually exclusive?” In J. Braithwaite (Ed.), Restorative Justice and Civil Societ180-194). Cambridge: Cambridge University Press.
Candy, L. & Baker, M. (1992) “What Berengarra school haswith families.” In J. Elkins & J. Izard (Eds.), Student Behaviour Problems: Context, Initiatives, Programs (pp. 276-282). Hawthorn: Australian Council for EducationaResearch.
340
Carrington, K. (1993) “The welfare/justice nexus.” In J. Mason (Ed.), Child WPolicy: Critical Australian Perspectives
elfare (pp. 69-88). Sydney: Hale & Iremonger.
002)“Unemployment duration, schooling and property crime.” Paper presented at the Role
0) Papillon (P. O’Brian, Trans.). London: Hart-Davis.
description of ten school district programs.” The Urban Review, 14, 317-336.
esented at the Children and Crime: Victims and Offenders Conference, Brisbane, 17-19 June.
Cohen, S. (1985) Visions of Social Control. Cambridge: Polity Press.
,
Connell, R. W., White, V. M., & Johnston, K. M. (Eds.) (1991)
ional and behavioral disorders: issues, trends, and call for action.” Behavioral Disorders, 29(3), 224-236.
k or new paradigm for emotional and behavioural difficulties? The case of Attention Deficit/Hyperactivity Disorder (AD/HD).” In J.
Costenbader, V. K. & Markson, S. (1994) “School suspension: A survey of current
CMC) (2004) Protecting Children: An Inquiry into Abuse of Children in Foster Care. Brisbane: Crime and Misconduct Commission.
of Young Criminals. London: Kogan Page.
Carrington, S. (1999) “Inclusion needs a different school culture.” InternationalJournal of Inclusive Education, 3(3), 257-268.
Chapman, B., Kapuscinski, C. A., Roussel, S., Weatherburn, D., & Chilvers, M. (2
of Schools in Crime Prevention Conference, Melbourne, 30 September-1 October.
Charriere, H. (197
Chobot, R. B. & Garibaldi, A. (1982) “In-school alternatives to suspension: a
Christie, G., Petrie, S., & Christie, C. (1999) “Reducing and preventing violence in schools.” Paper pr
Cislowski, H. (2002) “Schools and the community.” Paper presented at the Role of Schools in Crime Prevention Conference, Melbourne, 30 September-1 October.
Colman, R. & Colman, A. (2002) “Student suspensions.” Youth Studies Australia21(3), 6.
Connell, R. W. (1987) Gender and Power. London: Allen & Unwin.
Running Twice as Hard: The Disadvantaged Schools Program in Australia. Geelong: Deakin University.
Conroy, M. A. & Brown, W. H. (2004) “Early identification, prevention, and early intervention with young children at risk for emot
Cooper, P. (2001) “Medical con-tric
Visser, H. Daniels, & T. Cole (Eds.), Emotional and Behavioural Difficulties in Mainstream Schools (pp. 143-164). Oxford: Elsevier Science.
policies and practices.” NASSP Bulletin, 78, 103-107.
Crime and Misconduct Commission (
Cullingford, C. (1999) The Causes of Exclusion: Home, School, and the Development

341
Cunneen, C. (1999) “Zero tolerance policing and the experience of New York City.”Current Issues in Criminal Justice, 10, 299-313.
gomen’s Studies, 2(1), 11-52.
conference cases.” British Journal of Criminology, 46, 334-356.
uthAustralia Juvenile Justice and Criminal Justice (SAJJ-CJ) Technical Report No. 3:
sne:
w.griffith.edu.au/school/ccj/kdaly.html
Study of
Davies, L. (1998) School Councils and Pupil Exclusions: Research Project Report.
Department of Education, Queensland (Ed.) (1994) School and Discipline: Managing
don: Social Services Inspectorate, HMSO.
nlia.
Daly, K. (1992) “Women’s pathways to felony court: feminist theories of lawbreakinand problems of representation.” Review of Law and W
Daly, K. (2006) “Restorative justice and sexual assault: an archival study of court and
Daly, K., Bouhours, B, Curtis-Fawley, S., Weber, L., & Scholl, R. (2005) So
Sexual Assault Archival Study (SASS), An Archival Study of Sexual Offence CaseDisposed of in Youth Court and by Conference and Formal Caution, 2nd ed. BrisbaSchool of Criminology and Criminal Justice, Griffith University. Available at http://ww
Daniels, H., Cole, T., Sellman, E., Sutton, J., Visser, J., & Bedward, J. (2003)Young People Permanently Excluded from School - Research Report RB405.Birmingham: University of Birmingham.
Birmingham: School of Education, University of Birmingham.
Department for Education and Skills (2005) Permanent and Fixed Period Exclusions from Schools and Exclusion Appeals in England, 2003/04. London: Department for Education and Skills.
Behaviour in a Supportive School Environment. Brisbane: The State of Queensland, Department of Education.
Department of Education (1997) “The Alternative Education Program Initiative.” In Alternative Education Programs: Statewide Strategic Planning Workshop (pp. 5).Brisbane: Department of Education.
Department of Health (1997) Better Management, Better Care - Sixth Annual Report of the Chief Inspector. Lon
Dettman, H. W. (1972) Discipline in Secondary Schools in Western Australia: Report of the Government Secondary Schools Discipline Committee. Perth: EducatioDepartment of Western Austra
Devlin, A. (1995) Criminal Classes: Offenders at School. Winchester: Waterside Press.
Dionne, G., Tremblay, R. E., Boivin, M., Laplante, D., & Perusse, D. (2003) “Physical aggression and expressive vocabulary in 19-month-old twins.” Developmental Psychology, 39(2), 261-273.
342
Dishion, T. J. & Kavanagh, K. (2002) “The adolescent transitions program: a family-centered prevention strategy for school.” In J. B. Reid, G. R. Patterson, & J. Synder(Eds.), Antisocial Behaviour in Children and Adolescents (pp. 257-272). Washington,
Dollar, B. (1983) “What is really going on in schools?” Social Policy, Fall, 7-19.
New Policy Institute.
Douglass, F. (1886) Speech on the 24 anniversary of Emancipation in the District of
to schools’ support service.” Support for Learning, 5(1), 13-21.
dHermeneutics. Brighton: Harvester Press.
Dullroy, J. (2004) “Schools step up discipline.” The Courier Mail, 25 February, 1.
. R. (1998) “An alternative to suspension for middle school youths with behavior problems: finding from a ‘school survival’ group.” Research on Social Work
7-366.
Edwards, B. (1996) “Suspension regulations in Victorian government schools.”
s.” In P. Broadfoot (Ed.), Selection, Certification and Control (pp. 17-34). London: The Falmer Press.
tnge,
Special Education,Surfers Paradise, 7 December.
ce.” In H. Becker (Ed.), TheOther Side (pp. 9-21). New York: Free Press.
Izard (Eds.), Practical Approaches to Resolving Behaviour Problems (pp. 231-238).
DC: American Psychological Association.
Donovan, N. & Kenway, P. (1998) “Introduction.” In N. Donovan (Ed.), SecondChances: Exclusion from School and Equality of Opportunity (pp. 3-10). London:
th
Columbia, Washington D. C.. Available from http://en.wikiquote.org/wiki/Frederick_Douglass
Dreeben, R. (1968) What Is Learned in Schooling. Boston: Addison-Wesley.
Drew, D. (1990) “From tutorial unit
Dreyfus, H. L. & Rabinow, P. (1982) Michel Foucault: Beyond Structuralism an
Dupper, D
Practice, 8, 345-366.
Dwyer, K. P., Osher, D., & Hoffman, C. C. (2000) “Creating responsive schools:contextualizing early warning, timely response.” Exceptional Children, 66, 34
Unpublished Masters of Education thesis, La Trobe University, Bundoora, Victoria.
Eggleston, J. (1984) “School examinations: some sociological issue
Elliot, S. (2003) “Academic enablers and the development of academically competenstudents.” Keynote address presented at Reimagining Practice, Researching Cha1st Annual International Conference on Cognition Language and
Erikson, K. T. (1964) “Note on the sociology of devian
Farrell, H. (1990) “Modifying behaviour through withdrawal.” In S. Richardson & J.
Hawthorn: Australian Council for Educational Research.

343
Farrington, D. (1995) “The development of offending and antisocial behaviour from childhood: key findings from the Cambridge Study on Delinquency Behaviour.”Journal of Child Psychology and Psychiatry, 36, 929-964.
Rowntree Foundation.
d prevention.” In M. Maguire, R. Morgan, & R. Reiner (Eds.), The Oxford Handbook of Criminology (3rd ed.,
.
G. havior, and Life History (pp. 115-138).
New York: Springer-Verlag.
chool for adolescents with severe behaviour disorders.” In C. Szaday (Ed.), Addressing Behaviour Problems
). Melbourne: Australian Council for Educational Research.
Foucault, M. (1980) “Prison talk.” In C. Gordon (Ed. & Trans.), Power/Knowledge:.
Foucault, M. (1988) “The political technology of individuals.” In L. H. Martin, H.
s.
y Press.
Fuentes, A. (2003) “Discipline and punish.” The Nation, 277(20), 17-20.
Farrington, D. (1996) Understanding and Preventing Youth Crime. York: Joseph
Farrington, D. (2002) “Developmental criminology and risk-focuse
pp. 657-701). Oxford: Oxford University Press.
Farrington, D., Coid, J., Harnett, L., Jolliffe, D., Soteriou, N., Turner, R., & West, D(2006) Criminal Careers and Life Success: New Findings from the Cambridge Study in Delinquent Development. London: Home Office, Research, Development and Statistics Directorate.
Farrington, D. & West, D. J. (1990) “The Cambridge Study in Delinquent Development: a prospective longitudinal study of 411 males.” In H. Kerner &Kaiser (Eds.), Criminality: Personality, Be
Flint, P. (1989) “St Augustine’s Special School: an alternative s
in Australian Schools: Selected Papers from the 1989 National Conference on Educational Programs for Children and Adolescents with Emotional or Behavioural Problems (pp. 153-159
Foucault, M. (1977) Discipline and Punish (A. Sheridan, Trans.). New York:Pantheon.
Selected Interviews and Other Writings by Michel Foucault, 1972-1977 (pp. 109-133)New York: Pantheon.
Gutman, & P. H. Hutton (Eds.), Technologies of the Self: A Seminar with Michel Foucault (pp. 145-162). Amherst: University of Massachusetts Pres
Freebody, P., Ludwig, C., & Gunn, S. (1995) Everyday Literacy Practices in and out ofSchools in Low Socio-Economic Urban Communities (Vol. 1 & 2). Melbourne:Curriculum Corporation.
Freire, P. (1970) Pedagogy of the Oppressed (M. B. Ramos, Trans.). New York: Seabur
Freud, S. (1952) The Major Works of Sigmund Freud. Chicago: Encyclopedia Britannica.

344
Furlong, V. J. (1991) “Disaffected pupils: reconstructing the sociological perspective.British Journal of Sociology of Education, 12(3), 293-307.
Garland, D. (1992) “Criminology, knowledg
”
e and its relation to power: Foucault’s genealogies and criminology today.” British Journal of Criminology, 32(4), 403-422.
Garland, D. (2002) “Of crimes and criminals: the development of criminology in f
Garner, P. (1994) “Exclusions from school: towards a new agenda.” Pastoral Care,
: case-study evidence from off-site and pupil referral units.” Children and Society, 10, 187-196.
Gathercoal, F. (1998) “Judicious discipline.” In B. McEwan (Ed.), Classroom
). Albany: State University of New York Press.
al
n.Burkingham: Open University Press.
Gilbert, R. & Gilbert, P. (1998) Masculinity Goes to School. London: Routledge.
Exclusion from School and Equality of Opportunity (pp. 24-29). London: New Policy
Gillborn, D. (1999) “Fifty years of failure: “race” and education policy in Britain.” In
apy: A New Approach to Psychiatry. New York:Harper & Row.
oom. New York: Harper & Row.
Glasser, W. (2000) Every Student Can Succeed. Los Angeles: Black Forrest Press.
Britain.” In M. Maguire, R. Morgan, & R. Reiner (Eds.), The Oxford Handbook oCriminology (3rd ed., pp. 7-50). Oxford: Oxford University Press.
12(4), 3-9.
Garner, P. (1996) “A la recherche du temps perdu
Discipline in American Schools: Problems and Possibilities for Democratic Education(pp. 197-216
Gersch, I. S. & Nolan, A. (1994) “Exclusions: what the children think.” EducationPsychology in Practice, 10(1), 35-45.
Gewirtz, S., Ball, S. J., & Bowe, R. (1995) Markets, Choice, and Equity in Educatio
Giddens, A. (1984) The Constitution of Society. Cambridge: Polity Press.
Gilbertson, D. (1998) “Exclusion and Crime.” In C. Donovan (Ed.), Second Chances:
Institute.
A. Hayton (Ed.), Tackling Disaffection and Social Exclusion (pp. 135-155). London:Kogan Page.
Gillborn, D. & Gipps, C. (1996) Recent Research on the Achievements of Ethnic Minority Pupils. London: Office for Standards in Education.
Glasser, W. (1965) Reality Ther
Glasser, W. (1986) Control Theory in the Classr
Glasser, W. (1990) The Quality School: Managing Students without Coercion. New York: Harper Perennial.

345
Glueck, S. & Glueck, E. (1950) Unraveling Juvenile Delinquency. New York:Commonwealth Fund.
Goodlad, J. (1990) “The occupation of teaching in schools.” In J. Goodlad, R. Soder, &
Gore, J. (1998) “Disciplining bodies: on the continuity of power relations in
d our differences: a reassembling of what matters in teacher education.” In School of Education-University of Queensland (Ed.), The Queensland
. Brisbane:
(1990) A General Theory of Crime. Stanford: Stanford University Press.
f Education, Queensland University of Technology.
otionalsser, H. Daniels, & T. Cole (Eds.), Emotional and
.
d Road to Renewal. London: Verso.
n System. New
Recommendations. Alexandria: National Association of
89) “New South Wales Department of Education services to students in
chools: Selected Papers from the 1989 National Conference on Educational Programs for Children and Adolescents with Emotional or Behavioural
search.
K. Sirotnik (Eds.), The Moral Dimension of Teaching (pp. 3-34). San Francisco:Jossey-Blass.
Goodman, G. & Poillion, M. J. (1992) “ADD: acronym for Any Dysfunction or Difficulty.” The Journal of Special Education, 26(1), 37-56.
pedagogy.” In T. S. Popkewitz & M. Brennan (Eds.), Foucault’s Challenge (pp. 231-251). New York: Teachers College Press.
Gore, J. (2001) “Beyon
School Reform Longitudinal Study: Supplementary Material (pp. 162-179)Department of Education, the State of Queensland.
Gottfredson, M. & Hirschi, T.
Graham, J. & Bowling, B. (1995) Young People and Crime. London: Home Office.
Graham, L. (2006) “Schooling and ‘disorderly’ objects: a poetics of pedagogical discourse.” Unpublished paper. Brisbane: Centre for Learning Innovation, Faculty o
Greenhalgh, P. (2001) “Ingredients of effective practice with pupils who have emand behavioural difficulties.” In J. ViBehavioural Difficulties in Mainstream Schools (pp. 13-28). Oxford: Elsevier Science
Hall, S. (1988) The Har
Hallam, S. & Castle, F. (2001) “Exclusion from school: what can help prevent it?” Educational Review, 53(2), 169-179.
Harry, B. (1992) Cultural Diversity, Families, and the Special EducatioYork: Teachers College Press.
Harry, B. (1994) The Disproportionate Representation of Minority Students in Special Education: Theories and State Directors of Special Education.
Hatswell, J. (19with behaviour disorders.” In C. Szaday (Ed.), Addressing Behaviour ProblemsAustralian S
Problems (pp. 29-35). Melbourne: Australian Council for Educational Re

346
Hayden, C. (1997) Children Excluded from Primary School: Debates, Evidence, Responses. Buckingham: Open University Press.
Hayden, C. (2002) “Risks factors and exclusion from school.” In E. Debarbieux & CBlaya (Eds.), Violence in Schools and Public Policies (pp. 85-102). Paris: Elsevier.
.
Hayden, C. & Ward, D. (1996) “Interviews with children excluded from primary
Hayek, F. A. (1993) The Road to Serfdom. London: Routledge.
4(3), 37-41.
ence,
cil.
ttheir resolution.” Paper presented at the Role of
Schools in Crime Prevention Conference, Melbourne, 30 September - 1 October.
history for student empowerment: capturing student’s inner voices.” Qualitative Studies in Education, 6(3), 185-196.
Herr, K. & Anderson, G. (1997) “The cultural politics of identity: student narratives -61.
First Year of School. Canberra: Department of Education, Employment, Training and Youth Affairs.
drisbane: School of Criminology and Criminal Justice, Griffith University.
ess.
Hollins, C. E. (1991) It Was Fun from the Beginning. New York: Carlton Press.
) “Developmental crime prevention.” In N. Tilley (Ed.), Handbook of Crime Prevention and Community Safety (pp. 71-106). Cullompton: Willan
w
.”
Hayden, C., Sheppard, C., & Ward, D. (1996) “Primary exclusions: evidence for action.” Educational Research, 38(2), 213-224.
school.” Children and Society, 10, 255-265.
Hearle, L. (1994) “Exclusion - A rare practice?” Transitions,
Hemphill, S. A., Tombourou, J. W., & Catalano, R. F. (2005) Predictors of ViolAntisocial Behaviour and Relational Aggression in Australian Adolescents: A Longitudinal Study. Canberra: Criminological Research Coun
Henderson, C. (2002) “Bullying, no way! A national initiative to expand thinking aboubullying, harassment and violence and
Herr, K. & Anderson, G. (1993) “Oral
from two Mexican secondary schools.” Qualitative Studies in Education, 10(1), 45
Hill, S., Comber, B., Louden, B., Reid, J., & Rivalland, J. (1998) 100 Children Go to School: Connections and Disconnections in the Literacy Experience prior to School and in the
Hinds, L. (2002) “Law and order: the politics of get tough crime control”. UnpublishePhD thesis. B
Hirschi, T. (1969) Causes of Delinquency. Berkeley: University of California Pr
Homel, R. (2005
Publishing.
Hooks, B. (1994) Teaching to Transgress: Education as the Practice of Freedom. NeYork: Routledge.
Hoskin, K. (1990) “Foucault under examination: the crypto-educationalist unmasked

347
In S. J. Ball (Ed.), Foucault and Education: Discipline and Knowledge (pp. 29-5London: Routlege.
3).
ucational Research: Theory, Methods, and Practices (chapter 19).Flaxton: PostPressed.
Trans.).Harmondsworth: Penguin.
the age of 21.” Crime and Justice Bulletin,96. Sydney: NSW Bureau of Crime Statistics and Research.
from School. Perth: Research Branch, Education Department of Western Australia.
schooling Society. Harmondsworth: Penguin.
Classroom: Principles and Practices. Baltimore: Brookes.
sted in Finland.” Young-NordicJournal of Youth Studies, 7, 36-49.
Education Congress 2000, Manchester, 24-28 July.
Jahnukainen, M. (2001) “Social exclusion and dropping out of education.” In T. Cole,
Sage.
ng Education in the 1990s: Perspectives on Secondary Schooling (pp. 26-39). London: Farmer.
of Eds.), Exclusion form School: Inter-professional
Issues for Policy and Practice (pp. 159-182). London: Routledge.
rnal
y.”In R. Slee (Ed.), Discipline in Australian Public Education: Changing Policy and
Howard, J. (2004) “Naughty, needy, or neither: suspension, expulsion, and the beliefs of primary school educators.” In E. McWilliams, S. Danby, & J. Knight (Eds.), Performing Ed
Hugo, V. (1862 orig, 1982 reprint) Les Misérables (N. Denny,
Hua, J., Baker, J., & Poynton, S. (2006) “Generation Y and crime: a longitudinal studyof contact with NSW criminal courts before
Hutton, W. (1995) The State We're In. London: Jonathan Cape.
Hyde, N. & Robson, N. (1984) Student Suspensions
Illich, I. (1971) De
Jackson, L. & Veeneman Panyan, M. (2002) Positive Behavioral Support in the
Jahnukainen, M. (1999) “Winners or losers? A ten year follow-up of twenty-three former students from special classes for the maladju
Jahnukainen, M. (2000) “What’s special in special education? Former EBD student’s view on schooling.” Paper presented at Including the Excluded: International Special
H. Daniels, & J. Visser (Eds.), Emotional and Behavioural Difficulties in MainstreamSchools (Vol. 1) (pp. 1-12). London:
Jamieson, I. (1996) “Education and business: converging models.” In C. J. Pole & R. Chawla-Duggan (Eds.), Reshapi
John, P. (1996) “Damaged goods? An interpretation of excluded pupils’ perceptionsschooling.” In M. Blyth & J. Milner (
Johnson, D. W. & Johnson, R. T. (1994) “Constructive conflict in the schools.” Jouof Social Issues, 50(1), 117-138.
Johnson, W. (1992) “South Australia: from good school practices to effective polic

348
Practice (pp. 79-104). Hawthorn: Australian Council for Educational Research.
Jones, R., Nagin, D., & Roeler, K. (2001) “A SAS procedure based on mixture models
r: Prentice-Hall, Inc.
Education Bandwagon. Austin: Pro-Ed.
In S. J. Ball (Ed.), Foucault and Education: Discipline and Knowledge
Three to Remember:
In the Shadow of School: Former Special Education Pupils Tell
education and educational theory: inclusive for what?”Melbourne Studies in Education, 41(1), 17-23.
”
1986) L’inhibition de l’Action. Paris: Masson.
for estimating developmental trajectories.” Sociological Research and Methods, 29, 374-393.
Kauffman, J. M. (1997) Characteristics of Emotional and Behavioral Disorders ofChildren and Youth (6th ed.). Upper Saddle Rive
Kauffman, J. M. & Hallahan, D. P. (Eds.) (1995) The Illusion of Full Inclusion: AComprehensive Critique of a Current Special
Kenway, J. (1990) “Education and the right's discursive politics.” (pp. 167-206). London:
Routledge.
Kenway, J., Willis, S., Blackmore, J., & Rennie, L. (1997) Answering Back: Girls, Boys, and Feminism in Schools. Sydney: Allen & Unwin.
Kinder, K., Harland, J., Wilkin, A., & Wakefield, A. (1995) Strategies for Disaffected Pupils. Slough: National Foundation for Educational Research.
Kinder, K., Kendall, S., Halsey, K., & Atkinson, M. (1999) Disaffection Talks. Slough:National Foundation for Educational Research.
Kivirauma, J. (1995) about their School Experiences - Research Report No. 53. Finland: University of Jyväskylä.
Knight, T. (1985) “An apprenticeship in democracy.” The Australian Teacher, 11, 7-11.
Knight, T. (2000) “Inclusive
Kuorelahti, M. (2001) “Meeting the needs of behaviourally challenging pupils:assessing school life as experienced by pupils with emotional/behavioural difficulties.In J. Visser, H. Daniels, & T. Cole (Eds.), Emotional and Behavioural Difficulties in Mainstream Schools (pp. 63-73). Oxford: Elsevier Science.
Laborit, H. (1977) Decoding the Human Message (A. Wilson, Trans.). London: Allison & Busby.
Laborit, H. (
Laborit, H. (1992) L’esprit du grenier. Paris: Grasset.
Laslett, R. (1982) “Leavers from three residential schools for maladjusted children.” Educational Review, 34(2), 125-137.

349
Laub, J. & Sampson, R. (2003) Shared Beginnings, Divergent Lives: Delinquent Boyto Age 70. Cambridg
se: Harvard University Press.
alian
and Adolescents with Emotional or Behavioural Problems (pp. 81-83). Melbourne: Australian Council for Educational Research.
(1993) Quasi-Markets and Social Policy. London:Macmillan.
Levin, B. (1998) “The educational requirement for democracy.” Curriculum Enquiry,
Levitas, R. (1998) The Inclusive Society? Social Exclusion and the New Labour.
justice:niversity of Queensland
(Ed.), The Queensland School Reform Longitudinal Study: Supplementary Material
ne.” The Advertiser, 24 May, p. 37.
Lynch, M., Buckman, J., & Krenske, L. (2003) “Youth justice: criminal trajectories.”
Mac an Ghaill, M. (1994) The Making of Men. Buckingham: Open University Press.
rnal of Sociology of Education, 17(2), 163-176.
, 21(2), 145-159.
Lavery, B., Holbeck, J., & Clayton, P. (1989) “Adjustment program teachers: a teachertraining initiative.” In C. Szaday (Ed.), Addressing Behaviour Problems in AustrSchools: Selected Papers from the 1989 National Conference on Educational Programs for Children
Le Grand, J. & Bartlett, W.
Lenoir, R. (1974) Les Exclus: Un Francais sur Dix. Paris: Editions du Seuil.
28(1), 57-79.
Levi-Strauss, C. (orig 1955, reprint 1992) Tristes Tropiques. New York: Penguin.
London: Macmillan.
Lingard, B., Mills, M., & Hayes, D. (2001) “Teachers, school reform, and social challenging research and practice.” In School of Education, U
(pp. 139-153). Brisbane: Department of Education, the State of Queensland.
Lloyd, N. (2000) “Stepping out of li
Lloyd-Smith, M. (Ed.) (1984) Disrupted Schooling: The Growth of the Special Unit.London: John Murray.
Trends and Issues in Crime and Criminal Justice, 265, 1-6. Canberra: Australian Institute of Criminology.
Mac an Ghaill, M. (1996) “Sociology, state schooling and social class: beyond critiques of the New Right hegemony.” British Jou
Mackie, C. (1994) “The law report: the appeal of school exclusion.” EducationAlternatives, November, 1-6.
MacMillan, D., Gresham, F. M., & Forness, S. R. (1996) “Full inclusion: an empirical perspective.” Behavior Disorders
Maddocks, G. R. (1983) Report of the Working Party on the Abolition of Corporal Punishment. Melbourne: Education Department of Victoria.

350
Manning, M. (2004) “Measuring the costs of community-based developmental prevention programs in Australia.” Unpublished Masters (Hons) in Criminology thesis.
(1995) “Accounting for exclusion: giving a ‘voice’ and producing a ‘subject’.” Children & Society, 9(3), 81-98.
cationalupplement, 4516, 24 January, p. 22.
Foucault and Education: Discipline and Knowledge (pp. 11-28). London: Routledge.
nion.
nt of Education.
been to: empirical evaluations of a
nd Other Restorative Practices,Minneapolis, 8-10 August.
line:anguage for classroom management.” In J. Freiberg (Ed.), Beyond
Behaviorism: Changing the Classroom Management Paradigm (pp. 98-118). Boston:
McIntyre, T. (1996) “Guidelines for providing appropriate services to culturally diverse
Merton, R. (1938) “Social structure and anomie.” American Sociological Review, 3(5),
Metcalf, C. (1997) “Schools ban 2727 students.” The Courier Mail, 14 June, p. 3.
Millar, G. (1999) “Facing the consequences through restorative justice.” Independent
” Psychological Review, 100, 674-701.
Brisbane: School of Criminology and Criminal Justice, Griffith University.
Marks, D.
Marshall, J. (2003) “Alarm over an epidemic of ennui.” The Times EduS
Marshall, J. D. (1990) “Foucault and educational research.” In S. J. Ball (Ed.),
Martin, R. (2000) Schools’ Expenditure and the GDP. Southbank: Australian Education U
Massachusetts Department of Education (Mass DoE) (2000) Student Exclusions:School Year 1999-2000. Boston: Massachusetts Departme
Massachusetts Department of Education (Mass DoE) (2003) Student Exclusions:School Year 2002-03. Boston: Massachusetts Department of Education.
McCold, P. (2002) “The worst school I’ve everrestorative school and treatment milieu.” Paper presented at the Dreaming a Reality, 3rd International Conference on Conferencing a
McEwan, B., Gathercoal, P., & Nimmo, V. (1999) “Application of judicious discipa common l
Allyn & Bacon.
students with emotional and/or behavioral disorders.” Behavioral Disorders, 21, 137-144.
McNeely, C., Nonnemaker, J. M., & Blum, R. (2002) “Promoting school connectedness: Evidence from the National Longitudinal Study of Adolescent Health.”Journal of School Health, 72(4), 138-146.
672-682.
Education, 29(3), 24-25.
Moffitt, T. E. (1993) “Adolescence-limited and life-course-persistent antisocial behavior: a developmental taxonomy.

351
Moffitt, T. E. (2003) “Life-course persistent and adolescence-limited antisocial behavior: a 10-year research review and a research agenda.” In B. Lahey, T. E. Moffitt, & A. Caspi (Eds.), The Causes of Conduct Disorder and Serious Juvenile Delinquency
R. Slee
(Eds.), g Cities (pp. 100-115). London: Routledge.
Statistics.
2002) “Bullying and victimisation in schools: a restorative justice approach.” Trends and Issues in Crime and Criminal Justice, 219, 1-6. Canberra:
nd the individual and educational characteristics of students who
sfornia
School Psychologist, 2, 53-61.
Children and Adolescents with Emotional or Behavioural
, D. S. (2005) Group-Based Modeling of Development. Cambridge: Harvard
99) Pathways to Prevention. Canberra: National Crime
nt.” WHERE, 160, 8-11.
nne in American schools:
(pp. 49-75). New York: Guilford.
Mongon, D. (1988) “Behavior units, ‘maladjustment,’ and student control.” In(Ed.), Discipline and Schools: A Curriculum Perspective (pp. 183-198). Melbourne:Macmillan.
Mooney, J. (1996) “Violence, space and gender.” In N. Jewson & S. MacGregorTransformin
Morgan, F. & Gardner, J. (1992) Juvenile Justice I. Adelaide: Office of Crime
Morrison, B. (
Australian Institute of Criminology.
Morrison, G. M., Anthony, S., & Storino, M. (2001) “An examination of the disciplinary histories aparticipate in an in-school suspension program.” Education and Treatment of Children, 24(3), 276-293.
Morrison, G. M., D’Incau, R., Couto, E., & Loose, S. (1997) “Understanding pathwayto student expulsion: consideration of individual and system indicators.” Cali
Morrison, G. M. & Skiba, R. (2001) “Predicting violence from school misbehavior: promises and perils.” Psychology in the Schools, 38, 173-184.
Murphy, L. (1989) “From alienated, disturbed and disruptive students to supportive school environments.” In C. Szaday (Ed.), Addressing Behaviour Problems in Australian Schools: Selected Papers from the 1989 National Conference on Educational Programs forProblems (pp. 48-61). Melbourne: Australian Council for Educational Research.
Nagin, D. (1999) “Analyzing developmental trajectories: semi-parametric, group-based approach.” Psychological Methods, 4, 39-177.
NaginUniversity Press.
National Crime Prevention (19Prevention, Commonwealth Attorney-General’s Department.
Newell, P. (1980) “Sin bins: the integration argume
Nimmo, V. (1998) “But will it work? The practice of judicious discipline in southerMinnesota schools.” In B. McEwan (Ed.), Classroom Discipli

352
Problems and Possibilities for Democratic Education (pp. 217-236). Albany: SUniversity of New York Press.
tate
Noblit, G. W. & Polk, K. (1975) “Institutional constraints and labeling.” Paper ,
Normington, J. & Kyriacou, C. (1994) “Exclusion from high schools and the work of
NSW Department of Education and Training (NSW DoE) (2006) Long Suspension and ation
//www.det.nsw.edu.au/reports_stats/stats/suspexpul.htm.
ouncil Standing Committee on Social Issues (LCSCSI) (1992) Juvenile Justice in New South Wales. Sydney: NSW Government Printer.
Stand-downs, Suspensions, Exclusions and Expulsions. Wellington: New Zealand Ministry of
NZ Ministry of Education (NZ MoE) (2005) Report on Stand-downs, Suspensions, ion.
Extension). Brisbane: Queensland Government.
“The prevention and management of behaviour difficulties in school research and practice.” In J. Visser, H. Daniels, & T. Cole (Eds.), Emotional and
lloran, M. (1999) “Law and order is a class issue.” Educational Links, 59, 14-15.
partment for
Equality: Research Report.
Parker, M. (2000) “Deregistration fits the crime of punishment.” The Daily Telegraph,
ses.” Children and Society, 10, 177-186.
presented at the Southern Sociological Association Meetings, Washington, D. C.
the outside agencies involved.” Pastoral Care, 12(4), 12-15.
Expulsion: 2005 Annual Summary Report. Sydney: NSW Department of Educand Training. Available at http:
NSW Legislative C
NZ Ministry of Education (NZ MoE) (2000) What’s Happening: A Report on
Education.
Exclusions, and Expulsions for 2004. Wellington: New Zealand Ministry of Educat
Office of the Government Statistician (2000) Australian Standard Offence Classification (Queensland
Office for Standards in Education (OFSTED) (1996) Exclusions from Secondary Schools. London: OFSTED/HMSO.
Ogden, T. (2001)
Behavioural Difficulties in Mainstream Schools (pp. 75-89). Oxford: Elsevier Science.
O’Ha
O’Keeffe, D. (1994) Truancy in English Secondary Schools. London: DeEducation.
Osler, A. (1997) Exclusion from School and RacialLondon: Commission for Racial Equality.
29 November, p. 26.
Parsons, C. (1996) “Permanent exclusions from schools in England in the 1990s: trends, causes, and respon
Parsons, C. (1999) Education, Exclusion and Citizenship. London: Routledge.

353
Parsons, C., Benns, L., Hailes, J., & Howlett, K. (1994) Excluding Primary SchoChildren. London: Family Policies Studies Centre/Joseph Rowntree Foundation.
Parsons, C. & Castle, F. (1998) “The
ol
cost of school exclusion in England.”International Journal of Inclusive Education, 2(4), 277-294.
ducation for Children Excluded from Primary School - Research Report RR271. London: Department for Education.
ome of its function in American society.” Harvard Educational Review, 29(4), 297-318.
. (1994) “Exclusion: failed children or systems failure?” SchoolOrganization, 14(2), 107-120.
ation, 45(3), 323-340.
ournal of
A Curriculum Perspective (pp. 225-243). Melbourne:
e: systemic and institutional factors in Chicano school failure and success.” In R. Valencia (Ed.), Chicano School Failure and Success:
e.
s (2 ed., pp. 44-61). London: IEA
Polk, K. (1984) “The new marginal youth.” Crime and Delinquency, 30(3), 462-480.
Parsons, C., Hayden, C., Godfrey, R., Howlett, K., & Martin, T. (2001) Outcomes in Secondary E
Parsons, T. (1959) “The school class as a social system: s
Partffrey, V
Partington, G. (2001) “Student suspensions: the influence on students and their parents.” Australian Journal of Educ
Pavey, S. & J. Visser (2003) “Primary exclusions: are they rising?” British JSpecial Education, 30(4), 180-186.
Pearl, A. (1988) “The requirement of a democratic education.” In R. Slee (Ed.), Discipline in Schools: Macmillan.
Pearl, A. (1991) “The big pictur
Research and Policy Agendas for the 1990s (pp. 335-363). Basingstoke: The FalmerPress.
Pearl, A. & Knight, T. (1999) The Democratic Classroom: Theory to Inform PracticCresswell: Hampton Press.
Pease, K. (2002) “Crime reduction.” In M. Maguire, R. Morgan, & R. Reiner (Eds.), The Oxford Handbook of Criminology (3rd ed., pp. 947-979). Oxford: Oxford University Press.
Perske, R. (1991) Unequal Justice? Nashville: Abingdon Press.
Pollard, C. (1998) “Zero tolerance: short-term fix, long-term liability?” In N. Denni(Ed.), Zero Tolerance: Policing a Free Society nd
Health and Welfare Unit.
Polk, K. (1983) “Curriculum tracking and delinquency: some observations.” AmericanSociological Review, 48(2), 282-284.
Polk, K. (1997) “A community and youth development approach to youth crime

354
prevention.” In P. O’Malley & A. Sutton (Eds.), Crime Prevention in Australia: Issuin Policy and Research (pp. 185
es -199). Sydney: Federation Press.
entice-
w Zealand Journal of Criminology, 32, 284-302.
g people excluded from school.” Drugs: Education,
ision’ osts and
practical implications.” Journal of Adolescence, 21, 609-620.
. Brisbane: Department of Education.
l Report
rtrnment.
sion.
Rappaport, J. (1987) “Terms of empowerment/exemplars of prevention: toward a ,
117-147.
& Skiba, R. (2004) “Unplanned outcomes: suspensions and expulsions in Indiana.” Education Policy Briefs, 2(2), 1-7.
hing’: structure, agency, and the construction of identity through assessment.” British Educational Research Journal,
Reed, S. (1999) Indiana Department of Education Annual Report 1998. Indianapolis:
Reed, S. (2002) The Road to World Class Education: 2001 Annual Performance
Polk, K. & Schafer, W. (1972) Schools and Delinquency. Englewood Cliffs: PrHall.
Polk, K. & White, R. W. (1999) “Economic adversity and criminal behaviour: rethinking youth unemployment and crime.” Australian & Ne
Powis, B., Griffiths, P., Gossop, M., Lloyd, C., & Strang, J. (1998) “Drug use and offending behaviour among younPrevention and Policy, 5(3), 245-252.
Pritchard, C. & Cox, M. (1998) “The criminality of former ‘special education provpermanently ‘excluded from school’ adolescents as young adults (16-23): c
Queensland Department of Education (1996) Community Accountability Conferencing, Trial Paper
Queensland Department of Education (Qld DoE) (2004) Annual Report 2002-03.Brisbane: Queensland Government.
Queensland Department of Education and the Arts (Qld DoE) (2005) Annua2003-04. Brisbane: Queensland Government.
Queensland Department of Education and the Arts (Qld DoE) (2006) Annual Repo2004-05. Brisbane: Queensland Gove
Quinn, M. G. & Sultmann, W. F. (1987) The Prevalence of Exceptional Students in Queensland Catholic Schools. Brisbane: Queensland Catholic Education Commis
theory of community psychology.” American Journal of Community Psychology, 15(2)
Rausch, K.
Reay, D. & Wiliam, D. (1999) “I’ll be a not
29, 343-354.
Indiana Department of Education.
Report. Indianapolis: Indiana Department of Education.

355
Reed, S. (2004) The Continuing Journey to Excellence: 2003 Annual Performance Report. Indianapolis: Indiana Department of Education.
Reed, S. (2005) Moving Forward and Achieving Excellence through InnovatAnnual Performance Report. Indianapolis: Indiana Departm
ion: 2004 ent of Education.
ational Research.
urne:
aper in Crime Prevention Conference, Melbourne, 30
September - 1 October.
ay Herald Sun, 9 March, p. 17.
e processes of schooling: the contributions of labeling theory.” In J. Karabel & A. H. Halsey (Eds.), Power and Ideology in
O’Connell, T. (2001) “Restorative justice and the need for restorative environments in bureaucracy and corporations.” In J. Braithwaite (Ed.), Restorative
ation rates of culturally and linguistically diverse students in special education:the need for a research and policy agenda.” The Bilingual Special Education
Rossanda, R., Cini, M., & Berlinguer, L. (orig. 1970, reprint 1977) “Theses on
Rothman, S. (1999) “Non-attendance and student background factors.” Paper presented l Conference,
lt,
r, H. Daniels, & T. Cole (Eds.), Emotional and Behavioural Difficulties in Mainstream Schools
t the
Renew, S. (1992) “Violent, aggressive boys and feminist teachers.” In J. Elkins & J. Izard (Eds.), Student Behaviour Problems: Context, Initiatives, Programs (pp. 260-265). Hawthorn: Australian Council for Educ
Rigby, K. (1996) Bullying in Australian Schools and What to Do about It. MelboAustralian Council for Educational Research.
Rigby, K. (2002) “How successful are anti-bullying programs for schools?” Ppresented at the Role of Schools
Rindfleisch, T. (2003) “Schools throw book at rebels.” Sund
Rist, R. (1977) “On understanding th
Education (pp. 292-305). New York: Oxford University Press.
Ritchie, J. &
Justice and Civil Society (pp. 149-164). Cambridge: Cambridge University Press.
Robertson, P., Kushner, M. L., Starks, J., & Drescher, C. (1994) “An update of particip
Perspective, 14(1), 1-9.
education: a Marxist view.” In J. Karabel & A. H. Halsey (Eds.), Power and Ideologyin Education (pp. 647-658). New York: Oxford University Press.
at Association for Active Educational Researchers (AARE) AnnuaMelbourne. Available from http://www.aare.edu.au/99pap/rot99021.htm
Rothenthal, R. & Jacobson, L. (1968) Pygmalion in the Classroom. New York: HoRinehart, and Winston.
Royer, E. (2001) “The education of students with emotional and behavioural difficulties: one size does not fit all.” In J. Visse
(pp. 129-141). Oxford:Elsevier Science.
Rustemier, S. (2004) The Case against Segregation in Special Schools: A Look a

356
Evidence - Occasional Paper 1. Bristol: Centre for Studies on Inclusive Education.
Rutter, M. (2003) “Commentary: causal processes leading to antisocial behavior.”
Sampson, R. & Laub, J. (2005) “A general age-graded theory of crime: lessons learned
5). New Brunswick: Transaction Publishers.
ll.
pedagogy.” Journal of Criminal Justice Education, 5(1), 107-116.
en
School of Education-University of Queensland (UQ) (2001) The Queensland School
isan & D. P. Hallahan (Eds.), The Illusion
of Full Inclusion: A Comprehensive Critique of a Current Special Education
Sergiovanni, T. J. (1994) Building community in schools. San Francisco: Jossey-Bass.
ution: Final Report. Melbourne: Youth Research Centre, University of Melbourne.
solidarity: three paradigms.” International Labour Review, 133, 531-578.
cese.” Exceptional Children, 66, 335-346.
f school discipline to the school-prison pipeline.”Paper presented at the School to Prison Pipeline Conference: Harvard Civil Rights
Skrzypiec, G. & Wundersitz, J. (2005) Young People Born 1984: Extent of Involvement
Developmental Psychology, 39(2), 372-378.
and the future of life-course criminology.” In D. Farrington (Ed.), IntegratedDevelopmental and Life Course Theories of Offending - Advances in Criminological Theory (Vol. 14, pp. 161-18
Sanders, D. & Hendry, L. (1997) New perspectives on disaffection. London: Casse
Sanzen, P. (1994) “Egalitarianism and
Sautner, B. (2001) “Rethinking the effectiveness of suspensions.” Reclaiming Childrand Youth, 9(4), 210-214.
Schafer, W. E. & Olexa, C. (1971) Tracking and Opportunity. Scranton: Chandler.
Reform Longitudinal Study. Brisbane: The State of Queensland (Department of Education).
Schutz, A. (1970) Phenomenology and Social Relations. Chicago: University of Chicago Press.
Semmel, M. I., Gerber, M. M., & MacMillan, D. L. (1995) “A legacy of policy analysresearch in special education.” In J. M. Kauffm
Bandwagon (pp. 39-57). Austin: Pro-Ed.
Shaw, G. & Wierenga, A. (2002) Restorative Practices/Community Conferencing Pilot 2002 Eval
Silver, H. (1994) “Social exclusion and social
Skiba , R. & Peterson, R. (2000) “School discipline at a crossroads: from zero toleranto early respon
Skiba, R., Simmons, A., Staudinger, L., Rausch, M., Dow, G., & Feggins, R. (2003) “Consistent removal: contribution o
Project, Harvard University, 16-17 May.

357
with the Juvenile Justice System. Adelaide: Office of Crime Statistics and Research.
Slaughter, S. & Leslie, L. L. (1997) Academic Capitalism: Politics, Policies and the
Slee, R. (Ed.) (1988) Discipline in Schools: A Curriculum Perspective. Melbourne:
Changing Policy and Practice. Hawthorn: ACER.
ices of Discipline. London: The Falmer Press.
C. illward (Eds.), Towards inclusive education? (pp. 30-45).
London: David Fulton.
, R. (1996) “Clauses of conditionality: the “reasonable” accommodation language.” In L. Barton (Ed.), Sociology and Disability: Some Emerging Issues (pp. 107-122).
ations for schools.”Paper presented at the Annual Meeting of the American Educational Research
diesin Sociology of Education, 8(3), 255-270.
naln Diego, April.
ls.” In
Slee, R. (2001) “‘Inclusion in practice’: does practice make perfect?” Educational
. London: The Children Society.
nference, Sydney. Available from http: //www.aare.edu.au/00pap/smy00013.htm
Entrepreneurial University. Baltimore: Johns Hopkins University Press.
Macmillan.
Slee, R. (Ed.) (1992) Discipline in Australian Public Education:
Slee, R. (1995a) Changing Theories and Pract
Slee, R. (1995b) “Inclusive education: from policy to school implementation.” InClark, A. Dyson, & A. M
Slee
London: Longman.
Slee, R. (1997) “Theorizing discipline: Practical research implic
Association, Chicago, 24-28 March.
Slee, R. (1998a) “Higher education work in the reductionist age.” International Stu
Slee, R. (1998b) “Student action research and school discipline: consulting the experts in the field.” Paper presented at the Annual Meeting of the American EducatioResearch Association, Sa
Slee, R. (1999) “Theorizing discipline: practical research implications for schooJ. Freiberg (Ed.), Beyond Behaviorism: Changing the Classroom Management Paradigm (pp. 21-42). Boston: Allyn & Bacon.
Slee, R. (2000) “Professional partnerships for inclusive education?” Melbourne Studies in Education, 41(1), 1-15.
Review, 53(2), 114-123.
Smith, R. (1998) No Lesson Learnt
Smyth, J. & Hattam, R. (2000) “School culture and student voices in early school leaving.” Paper presented at the Australian Association for Research in Education (AARE) Annual Co

358
Snow, P. & Powell, M. (2002) The Language Processing and Production Skills of Young Offenders: Implications for Enhancing Prevention and Intervention Strategies.
Social Exclusion Unit (1998) Truancy and School Exclusion. London: HMSO.
students:,
Creativity and Collaborative Learning: A Practical Guide to Empowering Students and
Steinberg, Z. & Knitzer, J. (1992) “Classroom for emotionally and behaviorally
Stirling, M. (1992) “How many pupils are being excluded.” British Journal of Special
Stokes, H. (2000) Out of Education: A Report for the Victorian Full Service Schools
Sugai, G. & Horner, R. (1999) “Discipline and behavioral support: practices, pitfalls,
ted substance abuse prevention curricula in traditional and continuation schools.” Drugs and Society, 8, 65-81.
Swan, N. (1995) “Speed for breakfast.” Four Corners. Sydney: Australian
ickering, D., & Duerdoth, P. (1990) “Teacher perception of assistance required by students with behavioural or motivational problems.” In S. Richardson & J.
68).al Research.
chools: Summary Report for
for Educational Review, Department of Education.
Canberra: Criminology Research Council.
Solomon, Y. & Rogers, C. (2001) “Motivational patterns in disaffected schoolinsights from pupil referral unit clients.” British Educational Research Journal, 27(3)331-345.
Stainback, W. C. & Stainback, S. B. (1994) “Introduction.” In A. Nevin (Ed.),
Teachers (pp. xxiii-xxvi). Baltimore: Brookes.
disturbed students: facing the challenge.” Behavioral Disorders, 17, 145-156.
Education, 19(4), 128-130.
Stirling, M. (1993) “Second classes for a second class?” Special Children, 66 (May),15-18.
Program. Melbourne: Department of Education, Employment and Training.
and promises.” Effective School Practices, 17(4), 10-22.
Sussman, S., Dent, C., Simon, T., Stacy, A., Galaif, E., Moss, M., et al. (1995)“Immediate impact of social influence orien
Broadcasting Corporation.
Szaday, C., P
Izard (Eds.), Practical Approaches to Resolving Behaviour Problems (pp. 61-Hawthorn: Australian Council for Education
Tasmania Department of Education (Tas DoE) (1999) Suspensions, Exclusions, Expulsions and Exemptions in Tasmanian Government Sthe 1998 School Year. Hobart: Office for Educational Review, Department of Education.
Tasmania Department of Education (Tas DoE) (2002) Disciplinary Sanctions and Exemptions Report 2001. Hobart: Office

359
Tasmania Department of Education (Tas DoE) (2005) System-Wide Disciplinary Sanctions and Exemption Report 2004. Hobart: Office for Educational Review,
Taylor, J. (1995) School Exclusions: Student Perspectives on the Process - Research
Templeton, P. (1998) “Sex pest schoolboy, aged 5.” The Courier Mail, 18 October, p.
Templeton, P. (1999) “Bully, 10, puts boy in hospital.” The Courier Mail, 14 February,
Townsend, B. (2000) “The disproportionate discipline of African American learners:
Tracking the origins of criminal behaviour: back to the future.” The Criminologist, 31(1), 1-7.
uestionnaire: stability of its factor structure between culture, sexes, ages, and socioeconomic classes.” International Journal of Behavorial Development,
and Cultural Organization (UNESCO) (2003) Education Today Newsletter, 5. Paris: UNESCO. Available from
U.S. Department of Education (2005) NCES Digest of Education Statistics 2005.
“Effective organizational, instructional and curricular practices in inclusive schools and classrooms.” In C. Clark, A. Dyson, & A.
991) “Policy implications of pyschological assessment.” In H. C. Haywood & D. Tzuriel (Eds.), Interactive
Valencia, R. (1997) The Evolution of Deficit Thinking in Educational Thought and
Vassallo, S., Smart, D., Sanson, A., Dussuyer, I., McKendry, W., Tombourou, J. W., et r, the First
wn education.” Youth Studies Australia,summer, 30-34.
Department of Education.
Report 001/95. Sydney: National Children’s and Youth Law Centre.
4.
p. 2.
reducing school suspensions and expulsions.” Exceptional Children, 66(3), 381-391.
Tremblay, R. E. (2006) “
Tremblay, R. E., Desmarais-Gervais, L., Gagnon, C., & Charlebois, P. (1987) “The preschool behavior q
10, 467-484.
United Nations Educational, Scientific
http://portal.unesco.org/education/
Washington: National Center for Education Statistics.
Udvari-Solner, A. & Thousand, J. (1995)
Millward (Eds.), Towards inclusive education? (pp. 147-163). London: David Fulton.
Utley, C. A., Haywood, H. C., & Masters, J. C. (1
Assessment (pp. 445-468). New York: Springer-Verlag.
Practice. New York: The Falmer Press.
al. (2002) Patterns and Precursors of Adolescent Antisocial BehaviouReport. Melbourne: Crime Prevention Victoria.
Veit-Wilson, J. (1998) Setting adequacy standards. Bristol: Policy Press.
Vick, M. (1993) “On the margins of their o

360
Vickers, I. (1993) “Exclusion: procedures and provisions in Australia with special reference to the role of distance education centre in the accommodation of excluded students.” Unpublished Master of Education thesis. Perth: Edith Cowan University.
transitions.” Paper presented at the International Conference on Continuity and
L. & Slee, R. (2001) “Bringing universities to account? Exploring some global and local policy tensions.” Journal of Education Policy, 16(5), 431-453.
Visser, J., Daniels, H., & Cole, T. (2001) “Introduction.” In J. Visser, H. Daniels, & T. vii-xi).
British Journal of Educational Studies, 48(2), 119-133.
tion for evaluation methodology.” Educational Studies, 27(3), 357-370.
Australia.
(2004) Annual Report 2003-2004. Perth: Department of Education and Training, Government of Western
ual Report 2004-2005. Perth: Department of Education and Training, Government of Western
Walker, H. M., Horner, R. H., Sugai, G., Bullis, M., Sprague, J. R., & Bricker, D. ol-
ng the overrepresentation of African American learners in special education.” In L. H. Meyer (Ed.), Behavioral
kes.
-1950. Cambridge University Press.
th
Willis, P. (1977) Learning to Labour: How Working Class Kids Get Working Class
Vickers, M. (2003) “Freedom in a rocking boat: the changing nature of youth
Change: Educational Transitions, Sydney, 27-28 November.
Vidovich,
Vigo, J. (1933) Zéro de Conduite. Written and directed by J. Vigo. Paris: Argui Films.
Cole (Eds.), Emotional and Behavioural Difficulties in Mainstream Schools (pp. Oxford: Elsevier Science.
Vulliamy, G. & Webb, R. (2000) “Stemming the tide of rising school exclusions: problems and possibilities.”
Vulliamy, G. & Webb, R. (2001) “The social construction of school exclusion rates: implica
W.A. Department for Education and Training (WA DoE) (2003) Annual Report 2002-2003. Perth: Department of Education and Training, Government of Western
W.A. Department for Education and Training (WA DoE)
Australia.
W.A. Department for Education and Training (WA DoE) (2005) Ann
Australia.
(1996) “Integrated approaches to preventing antisocial behavior patterns among schoage children and youth.” Journal of Emotional and Behavioral Disorders, 4, 193-256.
Webb-Johnson, G. C. (1999) “Cultural contexts: confronti
Intervention: Principles, Models, and Practices (pp. 449-464). Baltimore: Broo
Weiner, M. (1981) English Culture and the Decline of the Industrial Spirit 1850Cambridge:
Western Australia Legislative Assembly (WALA) (1992) Select Committee on YouAffairs: Final Report. Perth: Western Australia Government Printer.

361
Jobs. Farnborough: Saxon House.
Wilson, J. Q. & Herrnstein, R. (1985) Crime and Human Nature. New York: Simon and Schuster.
eighborhoodsafety.” Atlantic Monthly, 249(March), 29-38.
lfgang, M., Figlio, R., & Sellin, T. (1972) Delinquency in a Birth Cohort. Chicago:Chicago University Press.
t, C., Weekes, D., McGlaughlin, A., & Webb, D. (1998) “Masculinised discourses within education and the construction of black male identities amonst
Wu, S., Pink, W. T., Crain, R. L., & Moles, O. (1982) “Student suspension: a critical
York, R., Heron, J., & Wolff, S. (1972) “Exclusion from school.” Journal of Child
y. London: Sage.
-490). Oxford:
” In f Full Inclusion: A
Comprehensive Critique of a Current Special Education Bandwagon (pp. 293-303).
Wilson, J. Q. & Kelling, G. (1982) “Broken windows: the police and n
Wo
Wrigh
African Caribbean youth.” British Journal of Sociology of Education, 19(1), 75-87.
reappraisal.” The Urban Review, 14, 245-303.
Psychology and Psychiatry, 13, 259-266.
Young, J. (1999) The Exclusive Society: Social Exclusion, Crime, and Difference in Late Modernit
Young, J. (2002) “Crime and social exclusion.” In M. Maguire, R. Morgan, & R. Reiner (Eds.), The Oxford handbook of Criminology (3rd ed., pp. 457Oxford University Press.
Zigler, E. & Hall, N. (1995) “Mainstreaming and the philosophy of normalization.J. M. Kauffman & D. P. Hallahan (Eds.), The Illusion o
Austin: Pro-Ed.
LEGISLATION
Education [General Provisions] Amendment Act 1996, Queensland.
Juvenile Justice Act 1992, Queensland.


PPENDIX 3: DESCRIPTION OF CATEGORIES OF HEALTH PROBLEMS FOR TABLE 7.16
PPENDIX 5: RISK FACTOR AND PROTECTIVE FACTOR SCALES
APPENDICES
APPENDIX 1: FILE QUESTIONNAIRE
APPENDIX 2: METHOD USED TO CODE THE PSYCHOSOCIAL PROFILES
A
APPENDIX 4: CODING OF CRIMINAL HISTORIES
A


APPENDIX 1: FILE RE
Archival Analysis The Haven Files 1985 – 2003
File Questionnaire
FILE No.……………..
General Demographic Details
QUESTIONNAI
Date of birth: ....... /........../ .........
Gender: 1 male 2 female
Home su
The Haven entry date: ........./ ......... / day month year
The H ven exit date: / ........../ ......... day month year
Name of referring school:............................................................................
Name of reintegrating school: .....................................................................
Note for Coding:
day month year
burb: name: ............................................ postcode: .................
a
Please circle the appropriate answer for each variable. For instance, in variable 1.4 if the mother is alive, just circle the answer 1:
1.4 Is the mother alive? ............ s 0 no 99 n/a
If you need to write comments or notes regarding any variables, please do so in the blank space next to the variable in this questionnaire.
1 ye

366
FAMILIAL PROFILE
Parent’s occupation 1.1 Mother’s occupation? ....................................................................... (n/a if not available)
1.2 Father’s occupation? ........................................................................ (n/a if not available)
Ethnic background 1.3 Student’s ethnic background:............................................................ (n/a if not available)
Biological parents 1.4 Is the mother alive? ............ 1 yes 0 no 99 n/a
1.5 Is the father alive? .............. 1 yes 0 no 99 n/a
1.6 Mother’s age when student starts at TH: years (n/a if not available)
1.7 Father’s age when student starts at TH: years (n/a if not available)
1.8 Is the mother suffering from a health/medical problem? ................ 0 no 1 yes 99 n/a
1.9 Is the father suffering from a health/medical problem? .................. 0 no 1 yes 99 n/a
1.10 Has the mother a history of being abused, rejected and/or neglected? ............................................................................. 0 no 1 yes 99 n/a
1.11 Has the father a history of being abused, rejected and/or neglected? .............................................................................. 0 no 1 yes 99 n/a
1.12 Has the mother a history of abusing partners and/or children?........ 0 no 1 yes 99 n/a
1.13 Has the father a history of abusing partners and/or children? ......... 0 no 1 yes 99 n/a
1.14 Does the mother emotionally and/or physically abuse the student? . 0 no 1 yes 99 n/a
1.15 Does the father emotionally and/or physically abuse the student? ... 0 no 1 yes 99 n/a
1.16 Has the mother been involved with the Criminal Justice System? .... 0 no 1 yes 99 n/a
1.17 Has the father been involved with the Criminal Justice System? ...... 0 no 1 yes 99 n/a
1.18 Was the mother pregnant or caring for a child under 5 at referral? .. 0 no 1 yes 99 n/a
1.19 What is the status of the bio-parents relationship?
1 Living together 2 Separated/divorced 3 Oscillating between joint living and separation 4 Widowed
1.20 How best can the mother’s relationship with the student be characterised?
1 Rejection 2 Neglect 3 Stressed and disengaged 4 Stressed but engaged 5 Quite supportive and caring 99 n/a

3671.21 How best can the father’s relationship with the student be characterised?
12 Neglect 3 Stressed and disengaged 4 Stressed but engage5 Quit99 n/a
Carers1.22 Who are the student’s carers at referral? 1 Both bio parents
e 4 Shared custody 5 Mother and stepfather (or defacto) 6 Father and stepmother (or defacto) 7 Relatives
1.23 How best can the stepparent’s (or defacto’s) or other carers’ (apart from bio parents) relationship with the student be characterised?
1 Rejection 2 Neglect 3 Stressed and disengaged 4 Stressed but engage
ive and caring 99 Not available 999 Not applicable
.24 Does th o ) or other carers (apart from bio parents) emotionally and/or physically abuse the student?
0 no 1 yes 99 n/av. 999 n/appl.
................. 99 n/a
.26 Number of siste ters? 99 n/a
............................................... 99 n/a
.27 Student’s st ly d st
5 5th child 6 6th child and over 99 n/a
lings reported to have a health/medical problem?...................................................................... 0 no 1 yes 99 n/a 999 n/appl.
ems and/or exclusion? ......................................................... 0 no 1 yes 99 n/a 999 n/appl.
.30 Have any of the siblings been involved with the Criminal Justice System? ............................................................ 0 no 1 yes 99 n/a 999 n/appl.
. 0 no 1 yes 99 n/a 999 n/appl.
Rejection
de supportive and caring
2 Mother alon 3 Father alone
8 Foster care
d5 Quite support
1 e stepparent ( r defacto
Siblings 1.25 Number of brothers/half-brothers?..........
rs/half-sis ................................1
1.251 Number of siblings?
1 atus among siblings? 0 On chil 1 1 child 2 2nd child 3 3rd child 4 4th child
1.28 Are any of the sib
1.29 Have any of the siblings a history of school probl
1
1.31 Is the student separated from siblings? ...........................

3681.32 Is the student reject
siblings? .......................................................................ed and/or abused by any of the
0 no 1 yes 99 n/a 999 n/appl.
reject and/or abuse any of the .......................................................... 0 no 1 yes 99 n/a 999 n/appl
.34 Is parental discipline reported as being consistent? ...................... 0 no 1 yes 99 n/a
.35 Does parental discipline involve physical punishment? ................... 0 no 1 yes 99 n/a
pu nt?...................... 0 no 1 yes 99 n/a
rawa ilege ...... 0 no 1 yes 99 n/a
no 1 yes 99 n/a
1.39 tal discipline involve verbal praise and/or
1.42 lative/significant other? ......................................................... 0 no 1 yes 99 n/a
.43 Has the student experienced recent/frequent change of
I inal Sy
.....................................................................................................................................
.....................................................................................................................................
.....................................................................................................................................
1.33 Does the student siblings? ............
Parental discipline 1
Types of parental discipline strategy 1
1.36 Does parental discipline involve verbal nishme
1.37 Does parental discipline involve withd l of priv s?.........
1.38 Does parental discipline involve time out/grounding?..................... 0
Does parenpromising rewards for good behaviour? ....................................... 0 no 1 yes 99 n/a
1.40 Does parental discipline involve threats of abandonment? .............. 0 no 1 yes 99 n/a
1.41 Does parental discipline involve dialogue/reasoning? ..................... 0 no 1 yes 99 n/a
sStres ful/traumatic life events Has the student experienced the death of a re
1home ..................................................................................... 0 no 1 yes 99 n/a
1.44 Has the student experienced other types of traumatic events? .................................................................................. 0 no 1 yes 99 n/a
1.45 Does the file mention the possibility that the student has been sexually abused? ............................................................. 0 no 1 yes 99 n/a
1.46 Has the student been involved with the Criminal Justice System? ................................................................................ 0 no 1 yes 99 n/a
f yes at 1.46, then what was the reason for the involvement with the Crim Justice stem?

369
2. PSYCHOSOCIAL PROFILE
Note: in the next set o ” stands for “ambiguous”. When you code “2 = ambiguous” indicate t rea
2.1 Is the student de .......... 0 no 1 yes 2 a/bg 99 n/a
2.2 Is the student described as being untidy/having a scruffy pearance? ................................................................ 0 no 1 yes 2 a/bg 99 n/a
2.3 yes 2 a/bg 99 n/a
2.4
2.5 1 yes 2 a/bg 99 n/a
2.7 Is the student d ntion problems? ..... 0 no 1 yes 2 a/bg 99 n/a
2.8 Is the student de ibed .............. 0 no 1 yes 2 a/bg 99 n/a
2.9 Is the student de ibed ......... 0 no 1 yes 2 a/bg 99 n/a
2.10 Is the student described as being easily frustrated? ........... 0 no 1 yes 2 a/bg 99 n/a
2.11 enerally responding angrily ? ............................... ........... 0 no 2 n/a
....... 1 yes 2 a/bg 99 n/a
lf-harming behaviour/ideas? .............................................. 0 no 1 yes 2 a/bg 99 n/a
ven ......... 0 no 1 yes 2 a/bg 99 n/a
2.15 ........... 0 no 1 yes 2 a/bg 99 n/a
2.16 0 no 1 yes 2 a/bg 99 n/a
2.17 Is the student described as being subject to mood swings? .. 0 no 1 yes 2 a/bg 99 n/a
2.18 hurting others? ............................................................. 0 no 1 yes 2 a/bg 99 n/a
2.19 Is the student described as exhibiting sexualised . 0 no 1 yes 2 a/bg 99 n/a
.20 Is the student reported to be stealing? ............................. 0 no 1 yes 2 a/bg 99 n/a
f questions, “a/bghe son for your decision.
scr as being clumsy?...............ibed
ap
Is the student described as being isolated/withdrawn? ........ 0 no 1
Is the student described as being unhappy/depressed? ...... 0 no 1 yes 2 a/bg 99 n/a
Is the student described as having poor self-esteem? ......... 0 no
2.6 Is the student described as being hyperactive? ................. 0 no 1 yes 2 a/bg 99 n/a
escribed as having atte
scr as being impulsive? ......
scr as being generally anxious?
Is the student described as gto frustration .......... .......... 1 yes a/bg 99
2.12 Is the student described as showing outburst of rage? 0 no
2.13 Is the student described as showing/expressing se
2.14 Is the student described as being re geful? ..........
Is the student described as being manipulative? .....
Is the student described as being generally angry? ............
Is the student described as being remorseless after
behaviours? ................................................................
2

3702.21 Is the student reported to be destroying others’ property? .. 0 no 1 yes 2 a/bg 99 n/a
toward
scribed as being streetwise? ................... 0 no 1 yes 2 a/bg 99 n/a
2.24 Is the student reported to be bullying others/picking on ............................. 0 no 1 yes 2 a/bg 99 n/a
2.25 Is the student described as lacking social skills? ................ 0 no 1 yes 2 a/bg 99 n/a
s
s
s
2.29 Is the student described as being avoided/rejected by s
as being cooperative o 1 yes 2 a/bg 99 n/a
2.31 Is the student described as being cooperative 1 yes 2 a/bg 99 n/a
s
no 1 yes 2 a/bg 99 n/a
no 1 yes 2 a/bg 99 n/a
.35 Is the student reported to physically aggress peers? ........... 0 no 1 yes 2 a/bg 99 n/a
2.36 a
2.37 a
.38 Is the student described as being compliant with adults? ..... 0 no 1 yes 2 a/bg 99 n/a
2.39 Is the student reported to run away from school (including truancy)? ...................................................... 0 no 1 yes 2 a/bg 99 n/a
2.22 Is the student described as expressing aggression objects? ...................................................................... 0 no 1 yes 2 a/bg 99 n/a
2.23 Is the student de
weaker children? .............................
2.26 Is the student reported as having many friends? ............... 0 no 1 ye 2 a/bg 99 n/a
2.27 Is the student reported as making friends easily? .............. 0 no 1 ye 2 a/bg 99 n/a
2.28 Is the student described as having problems maintaining friendships? ................................................................. 0 no 1 ye 2 a/bg 99 n/a
other children? ............................................................. 0 no 1 ye 2 a/bg 99 n/a
2.30 Is the student described (playing/engaging) with peers? ....................................... 0 n
(playing/engaging) with adults? ....................................... 0 no
2.32 Is the student described as being attention seeking with adults?......................................................................... 0 no 1 ye 2 a/bg 99 n/a
2.33 Is the student reported to verbally aggress peers?.............. 0
2.34 Is the student reported to verbally aggress adults?............. 0
2
Is the student reported to physically aggress adults? .......... 0 no 1 yes 2 a/bg 99 n/
Is the student described as engaging in apparently unprovoked aggression? ................................................ 0 no 1 yes 2 a/bg 99 n/
2

371
3. COGNITIVE PROFILE
Cognitive Functioning 3.1 What is the level of the student’s general cognitive functioning?
2 Average
5 Seriously Below Average
.2 What is the level of the student’s verbal functioning?
2 Average
Well Below Average5 Seriously Below Average
tio
1 Slightly Above Average
4 Well Below Average
99 n/a
tioning?
1 Verbal is better
3 99 n/a
.5 What is the level of the student’s short-term memory factor?
3 Below Average
99 n/a
.6 What is the level of the student’s processing speed and fine motor factor?
3 Below Average
5 Seriously Below Average
.7 What is the level of the student’s freedom from distractibility/quantitative reasoning factor?
3 Below Average
99 n/a
1 Slightly Above Average
3 Below Average 4 Well Below Average
99 n/a
3
1 Slightly Above Average
3 Below Average 4
99 n/a
3.3 What is the level of the student’s non-verbal (“performance”) func ning?
2 Average 3 Below Average
5 Seriously Below Average
3.4 What is the verbal/non-verbal ratio of the student’s cognitive func
2 Non-verbal is better Balanced
3
1 Slightly Above Average 2 Average
4 Well Below Average5 Seriously Below Average
3
1 Slightly Above Average Average 2
4 Well Below Average
99 n/a
3
1 Slightly Above Average 2 Average
4 Well Below Average5 Seriously Below Average

372
Learn ng difficulty/disability Assessments i
0 no 1 yes 99 n/a
If yes at 3.
What is the nature of the learning difficulty?
2 Other problems
1 Below/well below age level
99 n/a
.11 What is the level of the student’s expressive language?
3 Not specified
.12 Is the student receiving remedial support? ......................0 no 1 yes 99 n/a
s n/a
If yes at 3.13, then:
3
2 LD2
5 LD5
99 n/a
3.8 Is the student reported to have a learning difficulty? .........
8, then:
3.9
1 Speech/language
3 Not specified 99 n/a
3.10 What is the level of the student’s receptive language?
2 At age/above age level 3 Not specified
3
1 Below/well below age level 2 At age/above age level
99 n/a
3
3.13 Has the student been ascertained? .................................0 no 1 ye 99
.14 What was the ascertainment level?
1 LD1
3 LD3 4 LD4
6 LD6

373
. HEALTH/MEDICAL PROFILE4
blem at re 1 yes 99 n/a
mply suggest, at some stage during the student’s
.2 Vision?.........................................................................0 no 1 yes 99 n/a
.3 Hearing? ......................................................................0 no 1 yes 99 n/a
.4 Gross mo ..............................0 no 1 yes 99 n/a
................0 no 1 yes 99 n/a
.6 Autism? 0 no 1 yes 99 n/a
.7 Genetic problems? .........................................................0 no 1 yes 99 n/a
.8 Epilepsy? .. ..............................0 no 1 yes 99 n/a
................0 no 1 yes 99 n/a
.10 Immune syste ............................0 no 1 yes 99 n/a
.11 Prenatal and birth problems?...........................................0 no 1 yes 99 n/a
................0 no 1 yes 99 n/a
.........................0 no 1 yes 99 n/a
4.14 Alcohol/drug abuse ........................................................0 no 1 yes 99 n/a
.15 Family hi ry s? ..........................0 no 1 yes 99 n/a
..........0 no 1 yes 99 n/a
4.1 Was the student diagnosed with and/or treated for a medical proferral and 0 no /or during stay at TH? .....................................
Does the student medical profile indicate or sidevelopment, problems such as:
4
4
4 tor? ..................................
4.5 Neurological problems? ..................................
4 .......................................................................
4
4 .... ..................................
4.9 ADD or other “behavioural disorders”? ..............
4 m problems? .................
4
4.12 Bed-wetting/soiling........................................
4.13 Mental illness .......................................
4 sto of predisposing problem
4.16 Was the student “systemically” medicated at some stage of his/her development? ......................

374
5. PRE-TH SCHOOLS DISCIPLINARY STRATEGIES
D
5.2 on dialogue/raising awareness? ........... 0 no 1 yes 99 n/a
5.3 Does the f s? ......................... 0 no 1 yes 99 n/a
5.4 Does the f nd/or pro-social/com ice? ............................................ 0 no 1 yes 99 n/a
Dwarnings? 0 no 1 yes 99 n/a
5.6 Does the f ours and/or threats of misb 0 no 1 yes 99 n/a
.7 Does the file mention in-class time out/isolation? ............. 0 no 1 yes 99 n/a
5.8 Does the fi me of playtime, o tprivileges/ ................................... 0 no 1 yes 99 n/a
5.9 oes the file mention out of regular classroom time o
D
5.11 n corporal punishment?..................... 0 no 1 yes 99 n/a
5.12 Does the f -school suspension (including “one-day i out”)? ...................................... 0 no 1 yes 99 n/a
5.13 Does the file mention informal out of school suspension (“ne ted” with parents)? ......................... 0 no 1 yes 99 n/a
5.14 Does the file mention formal suspension or threat of formal sus ................................................... 0 no 1 yes 99 n/a
5.15 Does the file mention formal exclusion or threat of formal exclusion?......................................................... 0 no 1 yes 99 n/a
5.1 oes the file mention praising good behaviours? .............. 0 no 1 yes 99 n/a
Does the file menti
ile mention extrinsic reward
ile mention contracts amunity serv
5.5 oes the file mention speaking to parents and/or ...................................................................
ile mention ignoring m..............................................
isbehaviehaviour?
5
le ntion detention/deprivationf in eractions with friends, of
reinforcers? ...............
Dut/isolation? .............................................................. 0 no 1 yes 99 n/a
5.10 oes the file mention shaming? ..................................... 0 no 1 yes 99 n/a
Does the file mentio
ile mention inn-school time
gotia
pension? ...

375
. PRE-TH PROGRAMS/SUPPORT HISTORY6
ducational settingE
Who w
.1 Does the file suggest that the class teacher was providing a support?..... 0 no 1 yes
a teacher aid/remedial teacher/special te
Ds ......
Ddirect provider? .............................................................................. 0 no 1 yes
Who was directly provided with the support?
D ......
D ......
D ......
D ......
D ......
Dwho was supported?........................................................................ 0 no 1 yes
hat was the nature/target of the support?
Ddevelopment was provided? ............................................................. 0 no 1 yes
.12 Does the file suggest that behaviour management was provided? .......... 0 no 1 yes
6.13 Does the file suggest that support in specific academic s .................................. 0 no 1 yes
.14 Does the file suggest that counselling/therapy was provided?................ 0 no 1 yes
6.15 Does the file suggest a support whose nature you cannot identify? ........ 0 no 1 yes
Where was the support provided?
6.16 Does the file suggest that a support was provided on-site in the regular classroom?.......................................................................... 0 no 1 yes
6.17 Does the file suggest that a support was provided on-site in a special classroom? .......................................................................... 0 no 1 yes
6.18 Does the file suggest that a support was provided off-site in a special unit/school?......................................................................... 0 no 1 yes
6.19 Does the file suggest a support that was provided somewhere else or whose location you cannot identify?............................................... 0 no 1 yes
as directly providing the support?
6
6.2 Does the file suggest that acher was providing a support? ...................................................... 0 no 1 yes
6.3 oes the file suggest that the guidance officer and/or other chool-based professionals were providing a support? .................... 0 no 1 yes
6.4 oes the file suggest a support but you cannot identify the exact
6.5 oes the file suggest that the student alone was supported?........... 0 no 1 yes
6.6 oes the file suggest that a small group was supported? ................ 0 no 1 yes
6.7 oes the file suggest that the whole class was supported? .............. 0 no 1 yes
6.8 oes the file suggest that the class teacher was supported?............ 0 no 1 yes
6.9 oes the file suggest that the student’s family was supported?........ 0 no 1 yes
6.10 oes the file suggest a support but you cannot identify exactly
W
6.11 oes the file suggest that social skill /problem-solving
6
ubjects/skills was provided?..........................
6

376
Non-educational setting (NES)
6.20 Does the file suggest that a NES support was provided by a ......... 1
Psychiatrist/Paediatrician?................................................................ 0 no 1 yes
6.22speech pathologist? ........................................................................ 0 no 1 yes
.23 Does the file suggest that a NES support was provided by a case .......................... 0 no 1 yes
.24 Does the file suggest a NES support where you cannot exactly ......... 1
6.25 was provided to the ......... 1
......... 1
identify who was provided with the support?....................................... 0 no 1 yes
Who was providing the NES support?
counsellor/psychologist? ......................................................... 0 no yes
6.21 Does the file suggest that a NES support was provided by a
Does the file suggest that a NES support was provided by a
6manager? ............................................................
6identify the provider? ............................................................. 0 no yes
Who was provided with the NES support?
Does the file suggest that a NES support student alone? ...................................................................... 0 no yes
6.26 Does the file suggest that a NES support was provided to the student’s family? ................................................................... 0 no yes
6.27 Does the file suggest a NES support where you cannot exactly

377
7. ACADEMIC HISTORY & PROGRESSES AT EXIT
the student since start of schooling?
.1 Number of schools in schooling history: ...........................
t sinc ing chool:
........
.....................................................................................
.
grade 7): .................................
.3 Did the student repeat any grade since start of schooling?................... 0 no 1 yes
cademic profile at referral
Schools frequented by
7
List the name of the schools (in chronological order) frequented by the studen e starts
.....................................................................................
.....................................................................................
.............................................................................
.....................................................................................
....................................................................................
.....................................................................................
7.2 Student’s grade at entry to TH (grade 1 to
7
A
1 Good
3 Low
ge/writing performance at referral?
7.6
4 Very Low
.8 What was the level of the student’s maths performance at referral?
3 Low 4 Very Low 99 n/a
7.4 What was the level of the student’s global academic performance at referral?
2 Average
4 Very Low99 n/a
7.5 What was the level of the student’s langua
1 Good2 Average 3 Low
Very Low 4 99 n/a
What was the level of the student’s spelling performance at referral?
1 GoodAverage 2
3 Low 4 Very Low 99 n/a
7.7 What was the level of the student’s reading performance at referral?
Good 1 2 Average 3 Low
99 n/a
7
1 Good2 Average

3787.9 What was the level of the student’s social studies/science performance at referral?
1 Good
99 n/a
7.10
1 Good
4 Very Low
Academic profile at
2 Average 3 Low
4 Very Low
What was the level of the student’s art & crafts performance at referral?
2 Average 3 Low
99 n/a
exit
Measures of improvement
Does the file suggest that the student’s global academic 7.110 no 1 yes 99 n/a
yes n/a
yes n/a
yes n/a
7.15 Does the file suggest that the student’s maths performance had improved at exit?............................................................. 0 no 1 yes 99 n/a
7.16 Does the file suggest that the student’s social studies/science performance had improved at exit? .................... 0 no 1 yes 99 n/a
7.17 Does the file suggest that the student’s art & craft performance had improved at exit? .......................................... 0 no 1 yes 99 n/a
Measures of academic performance at exit
7.18 What was the level of the student’s global academic performance at exit?
0 Below grade level 1 At grade level
99 n/a
7.19 What was the level of the student’s language/writing performance at exit?
0 Below grade level 1 At grade level
99 n/a
7.20 What was the level of the student’s spelling performance at exit?
0 Below grade level 1 At grade level
99 n/a
7.21 What was the level of the student’s reading performance at exit?
0 Below grade level 1 At grade level 99 n/a
performance had improved at exit? ..........................................
7.12 Does the file suggest that the student’s language/writing performance had improved at exit? .......................................... 0 no 1 99
7.13 Does the file suggest that the student’s spelling performance had improved at exit? .......................................... 0 no 1 99
7.14 Does the file suggest that the student’s reading performance had improved at exit? .......................................... 0 no 1 99

3797.22 What was the level of the student’s maths performance at exit?
0 Below grade level
99
7.24 Wha ?
ehavioural/social progress
1 No progress
3 Significant progress
.26 Was the student at any stage suspended from TH?.....................0 no 1 yes
.....................................0 no 1 yes
student:
..................................................................................
..... .........................
................................................................................
............................................................................
..........................................................................
..................................................................................
..... .....................................
................................................................................
rocess:
..........................................................................
..................
..... ......................................
............................................................................
.................................................................................
..........................................................................
..................
..... ........................................
............................................................................
1 At grade level 99 n/a
7.23 What was the level of the student’s social studies/science performance at exit?
0 Below grade level 1 At grade level
n/a
t was the level of the student’s art & crafts performance at exit
0 Below grade level 1 At grade level 99 n/a
B
7.25 What was the level of the student’s behavioural/social progress at exit?
2 Some progress
99 n/a
7
7.27 Was the student excluded from TH? ....
Additional remarks/observation regarding the
...............................................................
...... .............................................................................................................
.................................................................
.....................................................................
.......................................................................
...............................................................
...... .................................................................................................
.................................................................
Notes and remarks regarding the coding p
.......................................................................
...............................................................................................................................
...... ................................................................................................
.....................................................................
................................................................
.......................................................................
...............................................................................................................................
...... ..............................................................................................
.....................................................................
File coded by ..............................................

380
PENDIX 2
E THE PSYCHOSOCIAL PROFILES
profiles was to find a way of maximising analysable
at rough data reduction.
1)
rofile gathered from reports in The Haven file at the time of
le from the author on request, provides the details and
e rationale for the creation of these 39 variables). Then, I used this coding frame when I collected data
the date when the information corresponding to each
, therefore as long as the information from DFS corresponded to a period
befor o ation and could
the missing or was available but did not
provide
To maxi
resence of problems rather than to their absence.
For inst that as
particular element or sometimes the
decided to recode “not available” as “no” on the
ssumption that, as long as there was information about some elements of the psychosocial profiles in the
the rep
hen there was no information about any of the elements of the psychosocial profile (e.g., no files from The
ot report anything in relation to the psychosocial profile) I
xcluded the corres nd nalysis. I also decided to consider the “ambiguous” level as
termediary between the negative and the positive levels (i.e., indicating the presence of the element but not
s salient as indicated by the positive level). Namely I created ordinal variables with three levels (0=no;
eti
sters or factors. Rather than using factor analysis, which,
ropriate, I formed these clusters
nceptually and thr he pattern of correlations between their respective
tinct “factors” that permitted to include 236 cases (79% of
as subscales of a general scale
f “behaviour prob s variables indicating the presence or the absence of the
ristic meas
AP
METHOD USED TO COD
The challenge in reporting on the psychosocial
inform ion, first through collapsing data from The Haven and DFS files, and then th
Originally, my coding frame included 39 variables (see The Haven File Questionnaire in Appendix
tapping elements of the student’s psychosocial p
referral to The Haven (the codebook, which is availab
th
from DFS. However, for DFS data, I also recorded
variable had been first reported
e r at the time of referral to The Haven, it was comparable with school inform be used
to fill gaps in the school records (e.g., when The Haven file was
any information in relation to some elements of the psychosocial profile).
mise analysable information data reduction was also necessary for the following reasons: the
records from The Haven and DFS generally pointed to the p
ance the files may have indicated that the student was hyperactive but rarely he/she w not
hyperactive, and in many cases the files did not report anything about a
an element were ambiguous (e.g., contradictory reports from different persons, or at slightly reports about
different times, or from different settings). Eventually, I
a
files, then what was not available was probably not salient enough to be pointed out in orts; however,
w
Haven or DFS, or the files were available but did n
e po ing cases from the a
in
a
1=som mes; 2=yes).
Next, I reduced the 39 original variables into clu
given the nature of the data (i.e., not originally scaled data), did not seem app
both co ough an examination of t
elements. Through this process I created 12 dis
The Haven historical population) in the analysis. These factors can be treated
o lem ” or as single binary
characte e factor.ured by th

381
di 15: Psychosocial profiles at entry to The Haven
(12 subscales)
Clumsy/unti ap
Co ng for Table 7.
dy pearance: created from the sum of 2 variables: Is the student described as being ppearance? The range of possible values was 0 to 4.
D
(a) clumsy? (b) untidy/having a scruffy a
epression/sadness: Sum of 4 variables: Is the student described as (a) being unhappy/depressed? (b) having p s generally anxious? (d) showing/expressing self-harming behaviour/id ssible values was 0 to 8.
oor elf-esteem? (c) beingeas? The range of po
Impulsivity/mood swings: Sumfrustrated? (c) subject to mo
of 3 variables: Is the student described as (a) impulsive? (b) easily od swings? The range of possible values was 0 to 6.
Hyperactivity/attention problems: Sum of 2 variables: Is the student described as (a) hyperactive? (b) having a ti range of possible values was 0 to 4. tten on problems? The
Anger: Sum of 4 variables: Is the student described as (a) being generally angry? (b) generally responding aob
Ca
ngrily to frustration? (c) showing outburst of rage? (d) expressing aggression toward jects? The range of possible values was 0 to 8.
llousness: Sum of 5 variables: Is the student described as (a) being reveng (b) beineful? g manipulative? (c) being remorseless? (d) bullying others/picking on weaker children? (e) engaging in apparently unprovoked aggression? The range of possible values was 0 to 10.
Defiance/non-compliance: Sum of 2 variables [reverted]: Is the student described as being (a) cooperative (playing/engaging) with adults? (b) compliant with adults (school setting)? The range of possible values was 0 to 4.
Pre-delinquent behaviour: Sum of 4 variables: Is the student reported to (a) steal? (b) destroy other’s property? (c) be streetwise? (d) run away from school (including truancy)? The range of possible values was 0 to 8.
Aggression: Sum of 4 variables: Is the student reported to (a) verbally aggress peers? (b) verbally aggress adults? (c) physically aggress peers? (d) physically aggress adults? The range of possible values was 0 to 8.
Poor social skills/peer relationship problems: Sum of 7 variables: Is the student described as (a) being isolated/withdrawn? (b) lacking social skills? (c) [reverted] having many friends? (d) [reverted] making friends easily? (e) having problems maintaining friendships? (f) being avoided/rejected by other children? (g) [reverted] being cooperative (playing/engaging) with peers? The range of possible values was 0 to 14.
Sexualised behaviours: Is the student described as exhibiting sexualised behaviours? The range of possible values was 0 to 2.
Attention seeking with adults: Is the student described as being attention seeking with adults? The range of possible values was 0 to 2.
Total behaviour problems scale: Sum of the 12 subscales, the range of possible values was 0 to 78.

382
APPENDIX 3
DESCR E 7.16IPTION OF CATEGORIES OF HEALTH PROBLEMS FOR TABL
Pre/neo-natal & early years: Includes difficult pregnancy and/or delivery, premature birth, physical traumas and or significant diseases between birth and toddlerhood, and problematic babyhood (i.difficult/irritable babies, eating and/or sleep problems).
Genetic
e.,
: Includes chromosomal abnormality, problems such as Spina Bifida, and when the reports suggested that a health problem was genetically inherited.
Neurological: Includes brain damage, temporal lobe problems, abnormal EEG, and any reports that suggested neurological lesions and/or dysfunctions.
Autism: Includes Asperger’s Syndrome (ASD).
Vision/eye: Includes the need to wear glasses but also serious eye problems requiring surgery, and conditions such as cataract and stagmus.
Hearing/ear: Includes congenital or accidental hearing deficits, and ear problems such as chronic ear infections and mastoidectomy.
Immune system: Includes asthma, eczema, and allergies.
Behaviour disorders: Includes Attention Deficit Disorder (ADD), Hyperactivity, Attention Deficit Hyperactivity Disorder (ADHD), Conduct Disorder (CD), and Oppositional Defiant Disorder (ODD).
Mental health: Includes depression, schizophrenia, anxiety disorder, personality disorders, and any reports about neuroses and/or psychoses.
Self-harm: Includes suicide ideations, self-harming (e.g., cutting), and suicide attempts.
Alcohol/drug: Drugs include illegal substances such as marijuana, speed, LSD, heroin, and cocaine, and legal substances such as glue, petrol, and aerosols for the purpose of sniffing.
Other chronic: Includes a host of chronic and/or serious health problems or injuries such as back pamigraines, insomnia, eating disorders, cardio-vascular diseases, diabetes, cancers, etc.
Medication
ins,
: Includes systemic medications (e.g., Ritalin for behaviour problems, Zoloft for mentalillness, Ventolin for immune system problems).
Co-morbidity: Mean number of health problems (medication not included).

383
APPENDIX 4
CODING OF
brella (e.g., violent offences).
ate offence and are not included in the broader “offences against
CRIMINAL HISTORIES
Australian Standard Offence Classification (ASOC) [Queensland extension 2000] categories:
01 Homicide and related offences 02 Acts intended to cause injuries 03 Sexual assault and related offences
4 Dangerous or negligent acts endangering persons 005 Abduction or related offences 06 Robbery, extortion and related offences
7 Unlawful entry with intent/burglary, break and enter 008 Theft and related offences 09 Deception and related offences
0 Illicit drug offences 111 Weapons and explosives offences 12 Property damage and environmental pollution 13 Public order offences
4 Road traffic and motor vehicle regulatory offences 115 Offences against justice procedures, government security and government operations 16 Miscellaneous including threats without physical violence
or my purpose, not all these categories were relevant because: F
1- Not all offences appeared in the criminal histories and some appeared only once or twice. 2- I did not need the level of details provided by the ASOC classification, but only needed to
characterise offences under a broad descriptive um3- Some categories of offences, however, because they appeared numerous times in the
criminal histories have been retained (e.g., offences against justice procedures, such as resist arrest or obstruct police). Sexual offences because of their specific character have been retained as a separthe person” category.
I therefore reduced the ASOC classification to the following 10 categories:
1- Homicide and related offences: such as murders, attempted murders, driving causing death.
2 - Other violent offences: such as acts intended to cause injuries (e.g., assault including aggravated assault, common assault, assault police); dangerous or negligent acts endangerpersons (e.g., driving under the influence of alcohol or drugs, dangerous driving, neglect, dangerous acts, going armed to cause fear);
ing
and abduction or related offences (e.g., kidnapping nd deprivation of liberty). a
3 - Robbery, extortion and related offences: such as property offences involving violence or reats; and blackmail and extortion. th
4 - Sexual assault and related offences: such as rape, attempted rape, indecent assault, as well as non-assaultive sexual offences such as wilful exposure.
5 - Non-violent property offences: such as unlawful entry with intent, burglary, break and enter; theft and related offences (e.g., stealing, motor vehicle theft, receiving/handling stolen

384
property); and deception and related offences (e.g., fraud, deception related to financial gain,
6 - Illicit drug offences
fare evasion, misrepresentation of professional status for unlawful gain).
: such as any offences relating to using, possessing, trafficking, and producing illegal drugs.
7 - Criminal damage offences: such as property damage and environmental pollution (e.g., vandalism, destruction of property, damage to property, graffiti).
8 - Good order offences: such as public order offences (e.g., public drinking, disorderly conduct, espassing, vagrancy, begging, offensive language, liquor offences [e.g., underage drinking],
violence.
trchild pornography, soliciting, prostitution); weapons and explosives offences (e.g., possessing/selling prohibited weapon); and threats without
9 - Traffic offences: such as road traffic and motor vehicle regulatory offences (e.g., driving without licence/registration, driving offences, registration offences, exceeding prescribed ontent of alcohol limit). c
10 - Other offences: such as offences against justice procedures, government security and overnment operations (e.g., escape from custody, aiding escapees, resist arrest, obstruct police,
efore, breaches were counted as a separate category and were g to the breach were counted as new
or the coding of offending seriousness I only considered the most serious offence proved in the
essing drugs, and sexual offences involving children s more serious than those involving adults. I created the following 12 categories of increased
Stealing/shoplifting/false pretence/criminal damage
. Common assault/behave violently/dangerous driving/going armed
. Indecent dealing with children assault/assault
police1. Rape
12. Murder
gnot obeying police, perjury).
Breaches (e.g., breach of bail, breach of probation) were not included in the offence categories because they do not constitute new offences in themselves, but may occur as the result of new
ffences being committed. Theronot included in the count of offences. The offences leadin
ffences.o
Offence seriousness
Fcriminal history. I considered violent offences as more serious than drugs or property offences, supplying drugs as more serious than possaseriousness, from 1, “least serious” (e.g., traffic offences) to 12, “most serious” (murder).
1. Others (e.g., indecent exposure; possess weapons, traffic offences) 2. Possessing drugs/utensils/not taking care in disposing of needle 3.4. Break & Enter 5. Supplying drugs 67. Steal with violence/robbery 8. Indecent assault 910. Assault Occasioning Bodily Harm (AOBH)/Serious assault/aggravated
1

385
Categories of unofficially and offici ending in Tables 8.6 and 8.7
Violence against persons lassification
exual: Category 4 in my reduced ASOC classification
rug: Category 6 in my reduced ASOC classification
reduced ASOC classification
SOC classification
ification
ssification
ally recorded off
: Categories 1, 2, and 3 in my reduced ASOC c
S
Property: Category 5 in my reduced ASOC classification
D
Criminal damage: Category 7 in my
Good order: Category 8 in my reduced A
Driving/traffic: Category 9 in my reduced ASOC class
Other: Category 10 in my reduced ASOC cla

386
APPENDIX 5
RISK FACTOR AND PROTECTIVE FACTOR SCALES
Each item on the scales was coded 0=no and 1=yes. Values on the total risk factor scale ranfrom 0 to 73, and on the protective factor scale from 0 to 10.
ged
on
tudent (9 items) a) Rejecting/neglectful mother
Father abuses student s abuse student
child abuse (8 years [median] and over)
d) Parents separated
Fa
tim of domestic violence by partners ally abused
od of domestic violence by partners
lings abused iblings sexually abused
RISK FACTOR SCALE (73 ITEMS)
1) Race-ethnic and socio-economic (4 items) a) Being male b) Belonging to an ethnic minority (ATSI, Maori, Islander, NES) c) Low SES home area at the time of referral to The Haven (under 25th percentile
ABS index) d) Low family occupational status (unemployed and unskilled labour)
2) Carers’ relationship with s
b) Rejecting/neglectful father c) Rejecting/neglectful other carers d) Parental discipline inconsistent e) Parental discipline involves physical punishment f) Mother abuses student g)h) Other careri) Long-term
3) Family structure (4 items) a) Large family (4 children and over) b) Teenage mother when she had her first child c) Student born from a teenage mother
4) mily violence (10 items) a) Mother abused in childhood b) Mother vicc) Mother sexud) Mother victim of other types of abuse e) Father abused in childhof) Father victimg) Father sexually abused h) Father victim of other types of abuse i) Sibj) S

387
5)a) Mother has mental health problems
c) Father involved with CJS d) Father incarcerated e) Siblings involved with CJS f) Siblings incarcerated
7) Traumatic events (7 items) a) Mother deceased b) Father deceased c) Siblings with school problems d) Student had been sexually abused e) Student had been placed by DFS f) Many placements (10 [median] and over) g) Student had experienced other types of traumatic events
8) Student’s psychosocial profile (5 items) a) High levels of psychosocial problems (above The Haven total mean on the full scale) b) High levels of delinquent behaviours (above The Haven total mean on this subscale) c) High levels of sexualised behaviours (above The Haven total mean on this subscale) d) High levels of callousness (above The Haven total mean on this subscale) e) High levels of aggression (above The Haven total mean on this subscale)
9) Student’s cognitive profile (1 item) a) Below average IQ
10) Student’s health profile (7 items) a) Pre/neo-natal problems b) Family predisposition problems c) Behaviour disorder problems d) Mental health problems e) Alcohol/drug abuse problems f) Self-harming problems g) High co-morbidity (above the mean ratio co-morbidity/age in 2005)
Family health (9 items)
b) Mother has alcohol/drug abuse problems c) Mother has other chronic health problems d) Father has mental health problems e) Father has alcohol/drug abuse problems f) Father has other chronic health problems g) Siblings have mental health problems h) Siblings have alcohol/drug abuse problems i) Siblings have other chronic health problems
6) Family involvement with CJS (6 items) a) Mother involved with CJS b) Mother incarcerated

388
11) Student’s educational profile (11 itea) Many school changes before referral to The Haven (above the mean [adjusted
accb) Grade repetitic) Poor academic performance at referral to The Haven
Haven
Haven
PROT T
eferral to The Haven (above 75th percentile on
mall business and professional)
Carers l
portivearing and supportive
Stude
items) at referral to The Haven
en
ms)
ording to age at referral]) on during schooling history
d) Corporal punishment during schooling history e) Formally suspended before referral to The Haven f) Formally excluded before referral to The Haven g) Formally suspended from Theh) Formally excluded from The Haven i) No behavioural improvement at The
pended post- The Haven j) Formally susk) Formally excluded post- The Haven
EC IVE FACTORS SCALE (10 ITEMS)
Socio-economic (2 items) me of ra) High SES home area at the ti
ABS index) b) High family occupational status (s
’ re ationship with student (4 items) pportive a) Mother is caring and su
pb) Father is caring and suc) At least one other carer is cd) Parental discipline is consistent
Family structure (1 item) a) Being an only child
nt’s cognitive profile (1 item) a) Above average IQ
Student’s educational profile (2 a) Good academic performance b) Significant behavioural improvement at The Hav