Examining the complexity of educational attainment for Black ...

ASSESSMENT AND PROGRESS REPORT ON MILLENNIUM DEVELOPMENT GOALS
(MDGs) 2 AND 3 IN THE SOUTH-EAST STATES OF NIGERIA.
BY
Dr. ONODUGO IFEANYI CHRIS
DEPT. OF VOCATIONAL TEACHER EDUCATION
UNIVERSITY OF NIGERIA NSUKKA
08035513652
Submitted to
Department of International Development (DFID)
10 Bobo Street, Off Gana Street
Maitama, Abuja
21st January, 2011
1 | P a g e
TABLE OF CONTENT.
Title Page.
Table of Contents.
Abbreviations/Acronyms.
EXECUTIVE SUMMARY.
1.0 INTRODUCTION
1.1Background
1.2Nigeria and MDGs
1.3Justification for the MDGs Assessment and Conference in the
South East
1.4Objectives.
2.0BACKGROUND ON THE SOUTH EAST STATES: Abia, Anambra, Ebonyi,
Enugu and Imo.
3.0METHODOLOGY
3.1Sources and Nature of Data Collected.
3.2 Methods of Data Collection
3.3Data Analysis
4.0 RESULTS/FINDINGS
2 | P a g e
4.1Awareness and Knowledge of MDGs in the SE States.
4.2MDGs Programmes/Projects/Activities
4.3MDGs Funding and Disbursements
4.4Initiatives and Interventions for Achieving MDGs Targets
4.5 Status/Progress in the Achievement of the MDGs Targets.:
Remember to show MDGs performance/achievements using traffic
lights representations.
4.5 Challenges and Limitations: factors that promote/hinder
achievement of MDGs targets.
5.0 POTENTIALS/PROSPECTS FOR ACHIEVING MDGs BY 2015
6.0 LESSONS LEARNT
7.0 CONCLUSION AND RECOMMENDATIONS
REFERENCES
APPENDICES/ANNEXURES
Abbreviations/Acronyms.
CBO Community Based Organization
NACA National Agency for the Control of AIDS
FMWASD Federal Ministry of Women Affairs and Social
Development
FBO Faith Based Organization
GoN Government of Nigeria
MCAT Management Capacity Assessment Tool
NGO Non-Government Organization
3 | P a g e
NCPA National Costed Plan of Action
OVC Orphans and Vulnerable Children
PEPFAR U.S. President’s Emergency Plan for AIDS Relief
RFA Request for Application
UNAIDS United Nations Program on HIV & AIDS
USAID United States Agency for International Development
i
4 | P a g e
1.0 INTRODUCTION
1.1Background:
In September, 2000, representatives of 189 nations including
149 heads of state and government gathered at the United
Nations Headquarters in New York for the Millennium Summit to
chart a new course for world leaders. That momentous gathering
gave birth to the Millennium Development Goals (MDGs) aimed at
transforming the lives of world’s people, including reducing
by half the number of people living in extreme poverty. MDGs
embraces global concern for sustainable development and aimed
at promoting a comprehensive approach and a coordinated
strategy’ for tackling development issues which will in the
long run help in bridging the gap between the rich and poor
nations. They are also a commitment by world leaders to give
attention to development concerns.
The Millennium Development Goals (MDGS) are high level
international development goals tied to eighteen (18) socio-
economic indicators aimed at achieving the transformation of
the living conditions of all people at the turn of the third
millennium. The goals are to be pursued by various countries
aided by supportive collaboration from at least twenty-
three(230 international organisations and are meant to be
achieved or realised in 2015.T he eight MDGs include:
Eradicate extreme poverty and hunger ;achieve universal basic
education; promote gender equality and empower women; reduce
child mortality; improve maternal health; combat HIV/AIDS,
malaria and other diseases; ensure environmental
5 | P a g e
sustainability; and develop a global partnership for
development. Linked to these eight goals are 21 targets,
namely: Halve between 1990 and 2015, the proportion of people
whose in income is less than a dollar; halve between 1990 and
2015, the proportion of people who suffer from hunger; ensure
that by 2015,children everywhere, boys and girls alike, will
be able to complete a full course of primary schooling;
eliminate gender disparity in primary and secondary
education ,preferably by 2015 ,and in all levels of education
not later than 2015; reduce by two-thirds between 1990 and
2015, the under five mortality rate; reduce by three quarter
between 1990 and 2015, the maternal mortality ratio. Others
include: Halve by 2015 and begun to reverse the incidence of
HIV/AIDS, malaria and other diseases; integrate the principles
of sustainable development into country policies and
programmes and reverse the loss of environmental resources;
halve by 2015, the proportion of people without sustainable
access to safe drinking water and basic sanitation; by 2020,
to have achieved a significant improvement in the lives of at
least 100 million slum dwellers (Ndace, 2009).
Also, the MDGs has to do with the development of an
open ,predictable, non-discriminatory trading and financial
system and commitment to good governance, development and
poverty reduction nationally and internationally; addressing
the special needs of the least developed countries- tarrif and
quota free access for the least developed countries’
exports ,enhanced programme of debt relief for heavily
indebted poor countries and cancellation of official
6 | P a g e

bilateral debt and more generous ODA for countries committed
to poverty reduction. It is as well concerned with addressing
the special needs of land locked countries and small
developing states. In addition, it is to deal comprehensively
with the debt problems of developing countries through
national and international measures in order to make debt
sustainable in the long run; in cooperation with developed
countries provide and implement strategies for decent and
productive work for youth; in cooperation with pharmaceutical
companies ,provide access to affordable essential drugs in
developing countries and in cooperation with the private
sector, make available the benefits of new
technologies ,especially information and
communication(Ndace,2009).
1.2 Nigeria and the MDGs:
Nigeria is rich in both human and natural resources. It has a
population of 140 million people, it is the 7th largest crude
oil producer in the world, and has the fourth largest economy
in Africa.
Four decades after independence in 1960, Nigeria remains a
poor country with a per capita income of US S 260 in 2000.At
the dawn of the Third Millennium, approximately 70% of the
population still lived on less than US S 1 a day, an
indication of extreme poverty .Real GDP growth has remained
sluggish, averaging 3.5% per annum since 2000(AFRODAD,2005) .
The overall GDP growth rate rose sharply from 3.49% in 2002
to 10.23% in 2003 and then declined sharply to 6.09% in 2004.
7 | P a g e
The sharp increase and fall of the overall GDP growth rate was
attributed to the fluctuating fortune in the oil and gas
sector( NBS,2005).On poverty index, Nigeria is ranked 39th in
Africa and 14th out of 16 countries in West Africa making it
one of the poorest in the continent.( Ndace,2009).Thus, in the
last couple of decades, Nigeria has witnessed a decline in its
economy amid high levels of corruption ,rising unemployment,
debilitating diseases such as HIV/AIDS ,malaria, measles and
tuberculosis ,massive growth in population ,migration of
skilled labour ,weak governance and widespread poverty ,most
especially in the rural areas. The Millennium Development
Goals (MDGs) represent an opportunity for Nigeria to tackle
some of these socio-economic problems that have been deterring
growth (OSSAP-MDG...).
Since Nigeria endorsed the 2000 Millennium Declaration of the
United Nations, the government has taken a wide range of steps
to achieve the Millennium Development Goals (MDGs). To
demonstrate Government’s commitment to this world project,
Nigeria created a Virtual Poverty Fund in 2005 to support the
sectors directly responsible for implementing MDG projects and
programmes. The Fund received a boost in 2006 with additional
funding to Nigeria by the Paris Club as debt relief amounting
to N110 billion for MDG projects and other pro-poor
initiatives of Government. Again, the Federal Government of
Nigeria (FGN) gave visibility and due emphasis to the MDG
programmes through the establishment of an MDG Office and
appointment of a Senior Special Assistant to the President to
take charge of the Office as well as the establishment of a
8 | P a g e
Presidential Committee to assess the implementation of the MDG
programmes in Nigeria. Furthermore, Government has anchored
most of her policies, plans and programmes such as the NEEDS,
7-point Agenda and Vision 20-2020,among others ,on the
Millennium Development Goals( MDGs).
With respect to the achievements of the MDGs so far, reports
have been divergent and uneven. There have been areas of
tremendous success and there have been areas that have not
done so well. The 2004 report which was Nigeria’s first report
on the MDGs states that “based on available information ,it is
unlikely that the country will be able to meet most of the
goals by 2015 especially the goals related to eradicating
extreme poverty and hunger ,reducing child and maternal
mortality and combating HIV/AIDS ,Malaria and other diseases”
all due to wide spread corruption ,conflict over the control
of oil and political instability ,especially in the Niger
Delta Region .With widening inequality and considerable
regional variation in human development as well as abysmally
low Human Development Index, indicators are glaring that
Nigeria may not meet the 2015 deadline( Ugwoke,2009).With an
average annual investment rate of barely 16% of GDP, Nigeria
is far behind the minimum investment rate of about 30% of GDP
required to reach a growth rate of at least 7-8% per annum
required to achieve the Millennium Development Goals(MDGs) by
2015. Most of the Foreign Direct Investment(FDI) into the
country is directed at the oil and extractive sectors .Thus,
the economic structure remains undiversified and oil exports
account for 95% of the total export earnings, while the
9 | P a g e
manufacturing sector accounts for less than one percent(1%)
(UNDP,2004). However, the assessment of progress on the MDGs
to date by The Presidential Committee on Strategy and
Prioritisation of the MDGs concluded that considerable
progress has been made on a number of goals ,such as Universal
Basic Education and halting the spread of HIV/AIDS. It noted
that Nigeria is faced with significant challenges to meet some
of the goals particularly in the health sector, despite
government reforms and increased investment. In all MDGs-
related sectors, a scaling- up of investments is required to
ensure the 2015 target is met (www.mdgs.gov.ng).
1.3 Justification for the MDGs Assessment and Conference in
the South-East:
The South-East is one the six(6) geopolitical zones of Nigeria
comprising of five(5) states of Abia ,Anambra ,Ebonyi, Enugu
and Imo involved in the implementation of the MDGs projects
and programmes in Nigeria. Constitutionally, all the three
tiers of government, namely, federal, states and LGAs are
empowered to make budget provisions and receive debt relief
funds and other special fund allocations for the purpose of
implementing the MDGs projects and programmes at the various
levels. Thus, the five South East states of Nigeria have been
implementing various MDGs programmes since the endorsement of
the MDGs Declaration in 2000 by the Federal Government of
Nigeria (FGN).
The Monitoring and Evaluation (M&E) Initiative of the Office
of the Senior Special Assistant to the President on
10 | P a g e

MDGs( OSSAP) has been involved in the monitoring of the
implementation of the MDGs across the states with the
production of status reports on progress from 2006 to 2009.
This notwithstanding, the emphasis is not on state –based
impact assessment and progress review to give insight into the
achievement of the MDGS and impact on poverty reduction among
the citizens at the state level .Most of the available MDGs
progress/status reports mainly reflect an averaging of the 36
states data or indicators within the Nigerian federal
structure and do not reflect the status of MDG attainment and
impact on the livelihoods and social conditions of the people
on a state by state basis.
With only five (5) years left until the 2015 deadline to
achieve the Millennium Development Goals (MDGs) , the status
of Nigeria with regard to MDGs attainment may be unachievable
by the year 2015 except drastic steps are taken. It would be
helpful in doing so to see where, within the Nigerian states,
there are successes that can be used to catalyse
improvement .On the other hand, it would also be helpful to
identify where efforts are being stalled or are failing with
a view to tackling the identified challenges to enhance the
achievement of the MDGs targets by the year 2015.
It therefore became necessary to carry out an impact
assessment and review of progress made by the South East
States towards achieving the MDGs which will culminate in a
conference of South East States on MDGs .It is envisaged the
output from the assessment survey and conference will
11 | P a g e

significantly boost progress towards the achievement of the
MDGs in the South East and Nigeria as a whole.
1.4 Objectives:
The purpose or general objective of the MDGs assessment and
conference was to locate ,extract ,summarise, analyse and
interprete all relevant data and information required in
determining the current status of the MDGs in the South East
Region as well as present findings to stakeholders during the
conference .In other words, it is to disaggregate and measure
the MDGs attainment levels for each state of the South East
Region of Nigeria with a view to suggesting ways of managing
state resources towards achieving these targets.
Specifically, the objectives were to:
1. Locate important reference sources for relevant documents
and materials to provide alternative conclusions and/ or
opinions on Human Development Indices in the South East.
2. Provide an evidence- based indications on the status of
the MDGs in the South East as at January, 2010 using
traffic light representations.
3. Analyse the situation in each state to determine the
factors which boost or hinder progress( particularly
issues around governance ,budget allocation, etc)
4. Identify initiatives and good practices within or
outside the states in the region, in Nigeria and/or
12 | P a g e
outside Nigeria that may be useful to showcase for
promoting the achievement of MDGs targets in the Region.
5. Make power point presentation of findings as well as
facilitate the break-out sessions and proceedings of the
conference.
6. Produce both Assessment and Progress Report, and Workshop
Report for submission to DFID.
2.0 BACKGROUND ON THE SOUTH EAST STATES
The South East geopolitical zone is made up of five (5)
states, namely, Abia, Anambra, Ebonyi, Enugu and Imo
States with eighty-five (85) Local Government Areas
(LGAs) and a population of over sixteen (16) million
people dwelling in over twenty (20) commercial cities and
large towns .The zone is mainly known for its commerce
and trading activities with a preponderance of indigenous
industries that are into manufacturing, fabrication and
agro-allied produce. The agricultural sector thrives very
well in the area because the zone is endowed with fertile
land.Some states within the zone are blessed with solid
minerals and other natural resources such as coal, tin,
columbite, etc. In addition ,two (2) of the South East
States in the zone( Abia and Imo)are producing states and
thus share from the 13% derivation fund given to the oil
producing states in Nigeria( Okauru,2010).
a) Abia State:
b) A nambra State
13 | P a g e
c) Ebonyi State
d) Enugu State
e) Imo State
3.0 METHODOLOGY
3.1 Sources and Nature of Data Collected:
The following reference sources were consulted for the purpose
of delivering this assignment:
Database and publications of the National Bureau of
Statistics (NBS).
National MDG Office publications and reports.
National Poverty Eradication Programme Publications and
Reports.
State MDG Offices Publications and Reports.
State Ministries of Poverty Reduction Publications and
Reports.
State Ministries of Environment Publications and Reports.
WHO, UNICEF, UNESCO, UNDP, UNIFEM, UNAIDS and other
international sources of data on development and poverty
reduction.
FAO, HABITATs, IMF, World Bank and other international
environmental organisations publications and Reports.
Other bi-lateral and multi-lateral organisations in the
South East States, including but not limited to the EU,
CIDA, USAID, DFID, etc.
14 | P a g e

The nature of data collected was both quantitative and
qualitative. Quantitative data were collected through field
surveys across the five (5) South East States of Nigeria.
These include data relating to MDGs indicators and targets
and Human Development Indices in the respective States of
the South East Region. Qualitative data collected were those
related to awareness of the people about MDGs and their
perceptions about the contributions of MDG to poverty
reduction, employment and their standard of living, among
others.
3.2 Methods of Data Collection:
Different approaches were used in generating data and these
include interviews and desk study. Interviews were
conducted using structured questionnaire to elicit
information from selected respondents in the relevant
Ministries ,Departments and Agencies( MDAs) and other
establishments in the South East States. Questionnaire were
administered essentially for the collection of primary data
during field surveys across the states. On the other hand,
secondary data were generated through desk study involving
the review of published works, technical reports/documents
from various national and state agencies and internal
development and bilateral organisations. These include the
NBS, MDG Offices, UNDP, World Bank, EU and DFID, among
others.
3.3 Data Analysis:
15 | P a g e

Data so collected were analysed using descriptive statistics
such as frequency tables, cross tabulations ,bar charts ,
percentages ,averages,among others .Each state data were
analysed and the results presented independently .They were
meant to explain the current MDGs status and attainment
level of the five( 5) South East States of Nigeria.
RESULTS/F INDINGS:
Awareness and Knowledge of MDGs in the South East
States.
MDGs Programmes/Projects/Activities in the State.
MDGs Funding and Disbursements.
Initiatives and Interventions for Achieving MDGs
Targets.
Status and Progress in the Achievement of MDGs Targets
in the State.
Challenges and Limitations: Factors that Promote/Hinder
Achievement of MDGs Targets in the South States.
Potentials/Prospects for Achieving MDGs by 2015 in the
State
Lessons Learnt.
Conclusion and Recommendations.
16 | P a g e

ABIA STATE
Historical Development
"Abia" is an acronym formed from the initial letters of four
groups of people, namely: Aba, Bende, lsuikwuato and Afikpo.
These constituted the major groups in the state at its
creation. At the country's independence in 1960, Abia was part
of the then Eastern Region. From 27th May, 1967, it became a
part of the East Central State, created by the then Head of
the Federal Military Government, General Yakubu Gowon. On 3rd
February, 1976, East Central State was split into two
17 | P a g e
states(Anambra and Imo) by the Federal Military Government
headed by General Murtala Mohammed.
On 27th August, 1991, the Federal Military Government under
General lbrahim Babangida carved out Abia State from Imo
State, bringing to thirty the number of states in Nigeria.
Furthermore, in October, 1996, the Federal Military Government
under General Sani Abacha created six more states bringing to
thirty-six the number of states in the federation.
During this exercise, four local government areas (LGAs)
namely, Onicha, Ohaozara, Afikpo North and Afikpo South, which
occupy the northeastern corner of the state, were transferred
to the (newly created) Ebonyi State.
Located in the southeastern region of Nigeria, Abia State lies
within approximately latitudes 4� 40' and 6� 14' north, and
longitudes 7� 10' and 8� east. The state shares common
boundaries to the north with Ebonyi State; to the south and
southwest with Rivers State; and to the east and southeast
with Cross River and Akwa lbom States respectively. To the
west is Imo State, and to the northwest is Anambra State.
The state covers an area of about 5,243.7 sq. km which is
approximately 5.8 per cent of the total land area of Nigeria.
With its capital at Umuahia, it has seventeen LGAs, namely:
Aba North, Aba South, Isiala Ngwa North, Isiala Ngwa South,
Ukwa West, Ukwa East, Obingwa, lkwuano, Bende, Arochukwu,
Ohafia, lsuikwuato, Umuahia North, Umuahia South, Ugwunagbo,
Osisioma and Nnochi.
18 | P a g e
Geography
Abia State, which occupies about 5,834 square kilometers, is
bounded on the north and northeast by the states of Anambra,
Enugu, and Ebonyi. To the west of Abia is Imo State, to the
east and southeast are Cross River State and Akwa Ibom State,
and to the south is Rivers State. The southern part of the
State lies within the riverine part of Nigeria. It is low-
lying with a heavy rainfall of about 2400 mm/year especially
intense between the months of April through October. The rest
of the State is moderately high plain. The most important
rivers in Abia State are the Imo and Aba Rivers which flow
into the Atlantic Ocean through the Niger Delta.
Infrastructure and economy
Crude oil and gas production is a prominent activity, as it
contributes to 39% of the GDP. Representing 27% of the GDP,
agriculture, which employs 70% of the state workforce, is the
second economic sector of Abia. With its adequate seasonal
rainfall, Abia has much arable land that produces yams, maize,
potatoes, rice, cashews, plantains, and cassava. Abia also has
large crude oil deposits. The manufacturing sector only
accounts for 2% of the GDP.
University and Colleges
There are two universities in the state: the federally owned
Michael Okpara University of Agriculture at Umudike and the
state-owned Abia State University in Uturu. There are two
19 | P a g e
tertiary hospitals, the Federal Medical Center in Umuahia and
the Abia State University Teaching Hospital in Aba, which
serve as referral hospitals in the state. The Abia State
Polytechnic is also in the city of Aba. Abia is one of the
more peaceful states of Nigeria and has been a "haven" for
foreign investors. The state's population has grown rapidly
since its creation
4.1.1 Awareness and Knowledge of MDGs:
In Abia State, survey results showed that the citizens are
generally aware of the MDGs in the state. Their sources of
information were found to include radio, television, flyers,
newspapers/magazines, fellow staff/relations/individuals and
conferences/seminars/workshops/conferences. Twenty-five
percent (25%) of the respondents sourced their information
mainly from radio and television while 75% of them got to know
about the MDGs in the state through the other aforementioned
sources .However ,most operators in the relevant MDAs are not
aware of the MDGs and their expected level of participation in
the implementation to achieve the targets.
4.1.2 MDGs Programmes/Projects and Interventions:
Abia State Government was able to develop a policy framework
or document called Abia State Economic Empowerment and
Development Strategy (ABSEEDS) and other policies which
present several sectoral strategies that focused on the
achievement of the MDGs.
20 | P a g e
In order to achieve the Millennium Development Goals (MDGs), a
good number of programmes, projects and activities were
embarked upon since 2006 in Abia State .These cut across many
sectors including health ,education, water ,
agriculture ,power and women affairs. Other initiatives and
interventions were the Conditional Grant Scheme( CGS), Quick
Wins, housing and urban development ,capacity building and
youth development projects as well as special interventions
such as the National Poverty Eradication Programme( NAPEP).
The CGS is a mechanism designed by the federal government to
promote active participation of state and local governments in
the realisation of the MDGs .The states are required to make
505 counterpart fund contribution. The Abia State CGS projects
were made up of 127 construction/rehabilitation projects and
the equipping of 87 health centres. Based on M& E
Reports(2010),7.15 of the construction projects have been
started,28% ongoing,61% completed but not in use while 3.9%
only were completed and in use(ie delivering service to the
people. With respect to equipping health
centres/facilities,11.5% of the equipment and supplies have
not been supplied,62.1% have been supplied but not in use
while 26% only have been supplied and put in use. The Quickwin
projects, on the other hand, are designed to achieve the
development of infrastructure in the various sectors of health
,education, water and sanitation,etc. In Abia State, out of
the 116 approved projects under the quickwins, 7% have not
been started,13.7% ongoing, while 79.3% had been completed.
Amidst all the programmes under the health sector in Abia
21 | P a g e

State ,only those under immunisation ,HIV/AIDS and malaria
control were carried out. Projects in the education sector
were executed in the area of universal basic
education ,building the capacity of the teachers ,improving
learning skills ,etc. The universal education projects
implemented were with respect to the establishment of youth
centres for boy drop outs, federal teachers scheme, and skill
acquisition centres in the three senatorial zones as well as
capacity building for school based management committees
(SBMCs). The National Teacher’s Institute projects were
carried out in the area of training of primary school
teachers, quality assurance by key stakeholders ,etc. Mass
literacy programmes were carried out through radio
programmes ,advocacy and sensitization of key stakeholders
towards promoting mass literacy for adult and out of school
youths.
4.1.3 MDGs Funding and Disbursements:
Sources of funding for MDGs in Abia State were identified to
come from the Federal Government of Nigeria( FGN), Abia State
Government, Local Governments and the private sector. A bout
53% of the finances came from the federal government, 35%
state government and 12% private sector .In terms of budget
allocation and public spending on MDGs, Abia State Government
appropriated the sum of N137 Million as counterpart fund for
poverty alleviation projects in the state in year 2007.She
also provided a counterpart fund of N240Million in 2008.With
22 | P a g e
respect to the CGS-MDGs projects, the state government
appropriated the sum of N300Million and N1Billion in 2009
and2010 respectively. By implication, the Federal Government
of Nigeria(FGN) provided the matching fund for the execution
of the targeted MDGs projects in the state. Budget allocation
and public spending for MDGs projects in Abia State from 2007
to 2010 are summarised in Table1 below.
Table 1:
In the light of the above funding disposition, it is
considered inadequate by the respondents for the achievement
of the MDGs targets in the state by 2015.
4.1.4 Status and Progress in the Achievement of MDGs Targets;
23 | P a g e
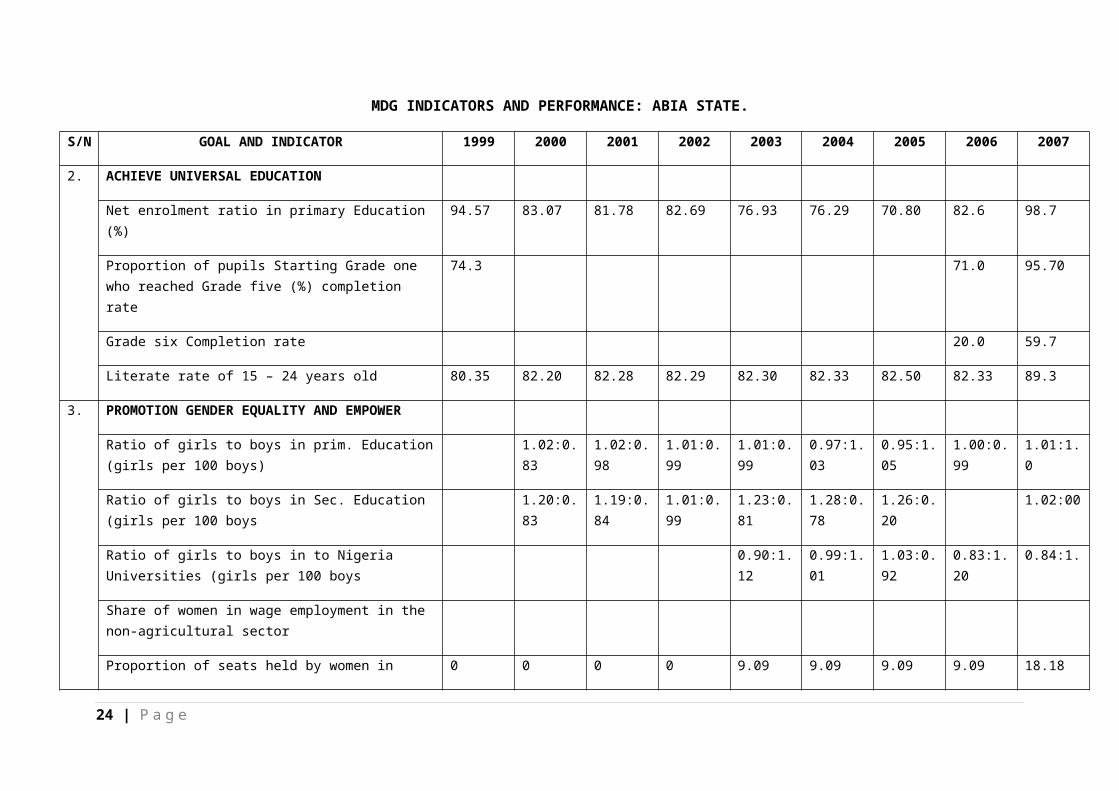
MDG INDICATORS AND PERFORMANCE: ABIA STATE.
S/N GOAL AND INDICATOR 1999 2000 2001 2002 2003 2004 2005 2006 2007
2. ACHIEVE UNIVERSAL EDUCATION
Net enrolment ratio in primary Education (%)
94.57 83.07 81.78 82.69 76.93 76.29 70.80 82.6 98.7
Proportion of pupils Starting Grade one who reached Grade five (%) completion rate
74.3 71.0 95.70
Grade six Completion rate 20.0 59.7
Literate rate of 15 – 24 years old 80.35 82.20 82.28 82.29 82.30 82.33 82.50 82.33 89.3
3. PROMOTION GENDER EQUALITY AND EMPOWER
Ratio of girls to boys in prim. Education(girls per 100 boys)
1.02:0.83
1.02:0.98
1.01:0.99
1.01:0.99
0.97:1.03
0.95:1.05
1.00:0.99
1.01:1.0
Ratio of girls to boys in Sec. Education (girls per 100 boys
1.20:0.83
1.19:0.84
1.01:0.99
1.23:0.81
1.28:0.78
1.26:0.20
1.02:00
Ratio of girls to boys in to Nigeria Universities (girls per 100 boys
0.90:1.12
0.99:1.01
1.03:0.92
0.83:1.20
0.84:1.
Share of women in wage employment in the non-agricultural sector
Proportion of seats held by women in 0 0 0 0 9.09 9.09 9.09 9.09 18.18
24 | P a g e

national parliament (%)
25 | P a g e

Net enrolment ratio in primary Education
(%)
Proportion of pupils Starting Grade one who reached Grade five (%) compl...
Grade six Completion
rateLiterate
rate of 15 – 24 years old
0102030405060708090
100
ABIA STATE JOURNEY TOWARDS ACHIEVING MDG GOAL 2: ACHIEVE UNIVERSAL EDUCATION
199920002001200220032004200520062007
26 | P a g e
0
2
4
6
8
10
12
14
16
18
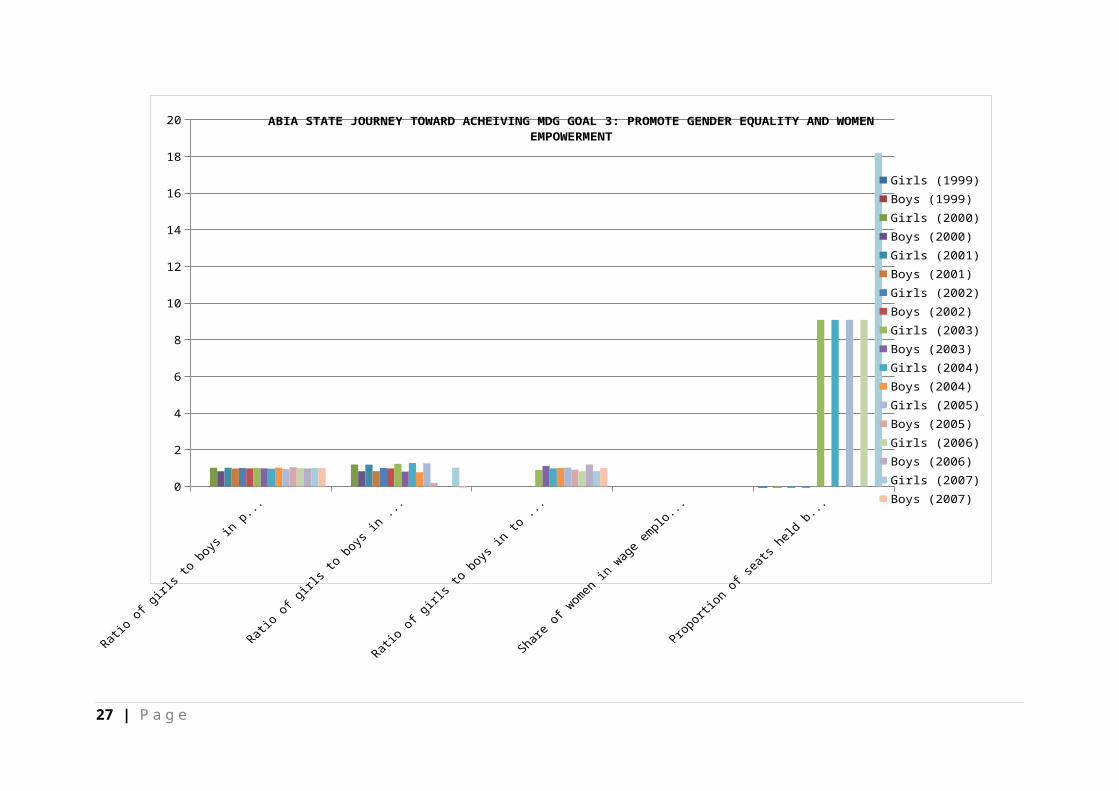
20 ABIA STATE JOURNEY TOWARD ACHEIVING MDG GOAL 3: PROMOTE GENDER EQUALITY AND WOMEN EMPOWERMENT
Girls (1999)Boys (1999)Girls (2000)Boys (2000)Girls (2001)Boys (2001)Girls (2002)Boys (2002)Girls (2003)Boys (2003)Girls (2004)Boys (2004)Girls (2005)Boys (2005)Girls (2006)Boys (2006)Girls (2007)Boys (2007)
27 | P a g e
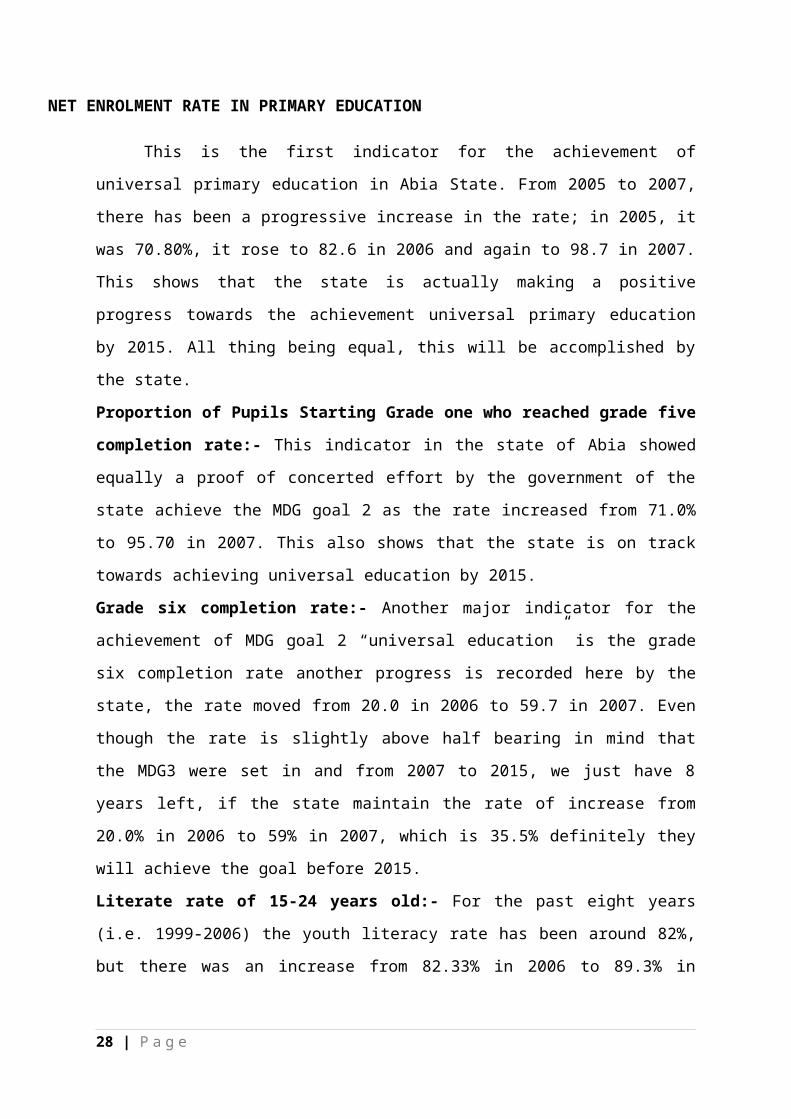
NET ENROLMENT RATE IN PRIMARY EDUCATION
This is the first indicator for the achievement of
universal primary education in Abia State. From 2005 to 2007,
there has been a progressive increase in the rate; in 2005, it
was 70.80%, it rose to 82.6 in 2006 and again to 98.7 in 2007.
This shows that the state is actually making a positive
progress towards the achievement universal primary education
by 2015. All thing being equal, this will be accomplished by
the state.
Proportion of Pupils Starting Grade one who reached grade five
completion rate:- This indicator in the state of Abia showed
equally a proof of concerted effort by the government of the
state achieve the MDG goal 2 as the rate increased from 71.0%
to 95.70 in 2007. This also shows that the state is on track
towards achieving universal education by 2015.
Grade six completion rate:- Another major indicator for the
achievement of MDG goal 2 “universal education” is the grade
six completion rate another progress is recorded here by the
state, the rate moved from 20.0 in 2006 to 59.7 in 2007. Even
though the rate is slightly above half bearing in mind that
the MDG3 were set in and from 2007 to 2015, we just have 8
years left, if the state maintain the rate of increase from
20.0% in 2006 to 59% in 2007, which is 35.5% definitely they
will achieve the goal before 2015.
Literate rate of 15-24 years old:- For the past eight years
(i.e. 1999-2006) the youth literacy rate has been around 82%,
but there was an increase from 82.33% in 2006 to 89.3% in
28 | P a g e
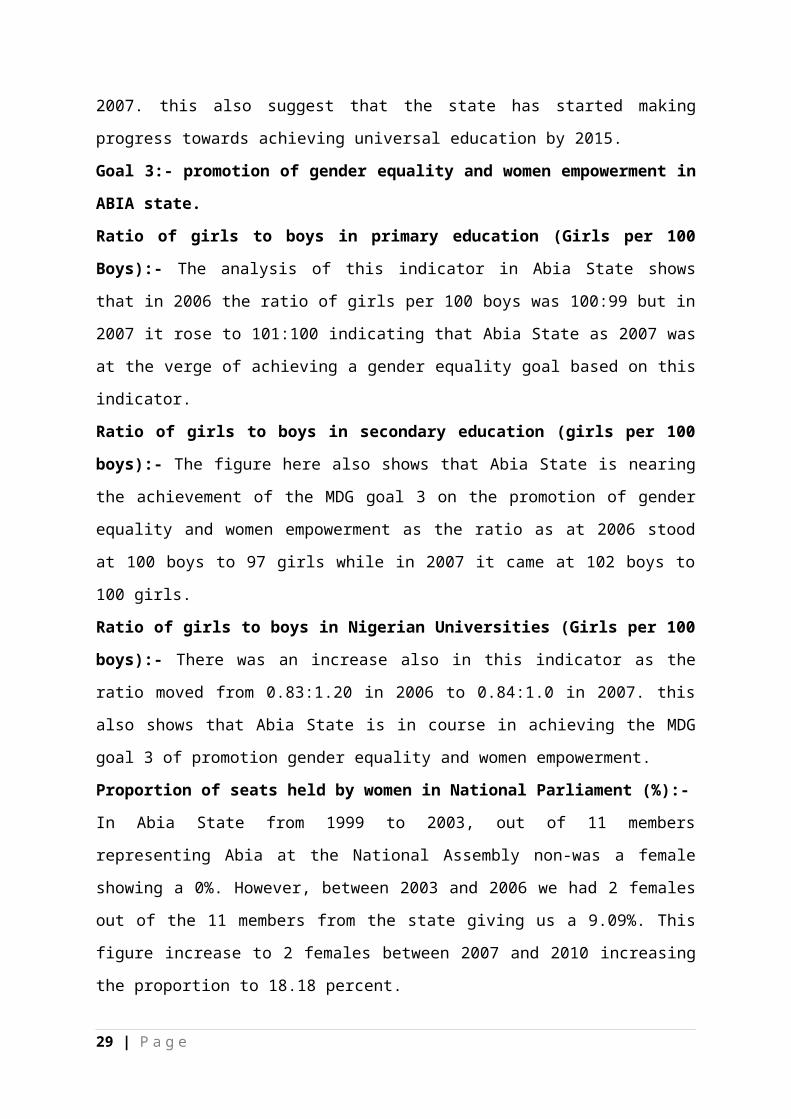
2007. this also suggest that the state has started making
progress towards achieving universal education by 2015.
Goal 3:- promotion of gender equality and women empowerment in
ABIA state.
Ratio of girls to boys in primary education (Girls per 100
Boys):- The analysis of this indicator in Abia State shows
that in 2006 the ratio of girls per 100 boys was 100:99 but in
2007 it rose to 101:100 indicating that Abia State as 2007 was
at the verge of achieving a gender equality goal based on this
indicator.
Ratio of girls to boys in secondary education (girls per 100
boys):- The figure here also shows that Abia State is nearing
the achievement of the MDG goal 3 on the promotion of gender
equality and women empowerment as the ratio as at 2006 stood
at 100 boys to 97 girls while in 2007 it came at 102 boys to
100 girls.
Ratio of girls to boys in Nigerian Universities (Girls per 100
boys):- There was an increase also in this indicator as the
ratio moved from 0.83:1.20 in 2006 to 0.84:1.0 in 2007. this
also shows that Abia State is in course in achieving the MDG
goal 3 of promotion gender equality and women empowerment.
Proportion of seats held by women in National Parliament (%):-
In Abia State from 1999 to 2003, out of 11 members
representing Abia at the National Assembly non-was a female
showing a 0%. However, between 2003 and 2006 we had 2 females
out of the 11 members from the state giving us a 9.09%. This
figure increase to 2 females between 2007 and 2010 increasing
the proportion to 18.18 percent.
29 | P a g e
This shows that based on this indicator, Abia State might
not be able to meet up with the goal by 2015.
4.1.5 Challenges and Limitations to Achievement of MDGs in
Abia State:
Across the sectors and MDGs, survey results showed that a
number of factors if not checked may hinder the achievement of
MDGs in the state. These were identified to include the
following:
i)Slow rate of commissioning completed projects eg health
centres ,boreholes, schools, etc which adversely affect
delivery of services to the people as well make such
facilities inaccessible to the target communities.
ii) Inadequate manpower especially in health centres and
schools .In some cases where these facilities have
equipment ,materials and supplies ,the absence of adequate
well qualified and experienced staff tend to affect the
quality of services in these health centres and schools.
iii) De-motivated workforce with poor attitude to work
including the execution of MDGs programmes/projects in the
state.
iv)Poor and slow construction works by some contractors who
use sub-standard materials in building the facilities.
v) Low political will and inadequate response to counterpart
funding arrangements by government.
30 | P a g e

vi) Cultural factors and stigmatisation that limit gender
equality and women empowerment as well as the combat of
HIV/AIDS ,malaria and other diseases in the state.
vii)Absence of water supply in most of the health centres
which exacerbate health and sanitation conditions among the
citizens.
viii) Gross inadequate logistics back up in the Ministries,
Departments and Agencies( MDAs) responsible for implementing
most of these MDGs programmes ,projects and activities
especially at the grassroots communities.
ix)Weak capacities of the existing staff of the MDAs which
lead to poor management and implementation of the MDGs
programmes in the state.
4.1.6 Potentials/Prospects for Achieving MDGs Targets by 2015:
Based on the results of the survey and from the perspectives
of the respondents, it is likely that significant achievements
will not be made towards achieving most of the MDGs targets by
2015 in Abia State. However, there is good prospect for
achieving substantially MDG 5, Target 6 on reducing by 2/3
between 1990 and2015 the under-five mortality rate which in
2010 stood at ....%. in Abia State .Majority of the
respondents also hold the view that there is good prospect for
achieving significantly towards meeting MDGs 5,Target 6 on
reducing by 3/4 between 1990 and 2015 the maternal mortality
rate. In 2010, the maternal mortality rate in Abia state was
recorded as ......%.
31 | P a g e

Furthermore, there is average potential for the achievement of
Goal 6,Target 7 on having halted by 2015, and begun to reverse
the spread of HIV/AIDS as well as weak prospect for the
achievement of Goal 6 Target 8 on having halted by 2015 and
begun the reverse of the incidence of malaria and other major
diseases.
Overall, the picture appear gloomy unless positive and urgent
steps are taken to fast track the achievement of the MDGs
Targets in Abia State.
5.0 LESSONS LEARNT:
Key lessons learnt in the course of the survey hinge on the
gaps with respect to planning, implementation and monitoring
of MDGs programmes ,projects and activities. Over 80% of the
MDGs projects were designed and implemented without the active
participation of the relevant MDAs and the beneficiary
communities as well as the civil society and private sector
in Abia State.
Although most of the communities identify with some completed
projects in their areas/locations, they hardly can identify
the source because of limited branding of MDGs projects. This
poses the problem of ownership and sustainability.
Absence of a functional monitoring and evaluation mechanism
made data generation, tracking, management and reporting on
the achievement of MDGs targets very difficult across all the
MDAs in the state.
32 | P a g e

Limited and weak collaboration between the three tiers of
government( Federal, State and Local Governments) and between
the MDAs in the planning and execution of MDGs programmes made
the achievement of MDGs targets in the state difficult. A
situation where federal MDAs plan and implement MDGs projects
at the state and Local Government levels without effective
advocacy and consultation with the Abia State Government is
counter-productive and undesirable.
6.0 CONCLUSION AND RECOMMENDATIONS.
6.1 Conclusion: Measurable impact of the MDGs programmes,
projects and activities on livelihood and human development
alongside the various targets are not yet properly recorded
and documented in the state. However, a good number of MDGs
projects have been completed and on-going in the State as
established by the Monitoring and Evaluation( M&E) Team from
the Office of the Senior Special Assistant to the President on
MDGs( OSSAP-MDGs)
6.2 Recommendations: In order to fast track the achievement of
the MDGs targets in Abia State ,the following recommendations
are considered necessary based on the results of the survey:
1) There is the need for improved governance through
transparency, accountability and enhanced political will to
guaranty adequate funding, effective service delivery ,
implementation and achievement of MDGs targets in the state.
2. MDAs and Local Government staff should be equipped with
adequate skills through capacity training to enable them
33 | P a g e
effectively implement the MDGs programmes and projects in the
state.
3) A Monitoring and Evaluation( M&E)framework should be
developed and a functional M&E system should be entrenched
within government for effective tracking ,management and
measurement of progress in the achievement of the MDGs.
4) Effective participation of all key stakeholders, the
federal MDAs, State Agencies, Local Government, Civil Society
Organisations( CSOs) and private sector, in the
design ,implementation, monitoring and evaluation of MDGs
projects will ensure maximum results and faster realisation of
the MDGs in Abia State.
5)A participatory community needs assessment involving MDGs
operators and community representatives should form an
integral part of the MDGs implementation process. This will
guarantee community ownership of the completed projects and
their sustainability. A CDD strategy could be used to ensure
effective community involvement and successful project
performance.
6) Projects in such sectors as education, youths
development ,agriculture, environment ,urban and housing
development and women affairs need to be scaled up to fast
track and achieve significantly the MDGs Targets by 2015.
34 | P a g e
ANAMBRA STATE
Anambra is a state in south-eastern Nigeria. Its name is an
anglicized version of the original 'Oma Mbala', the name of
the river now known as Anambra which the state is named after.
The Capital and the Seat of Government is Awka. Onitsha and
Nnewi are the biggest commercial and industrial cities,
respectively. The state's theme is "Light Of The Nation".
Boundaries are formed by Delta State to the west, Imo State
and Rivers State to the south, Enugu State to the east and
35 | P a g e

Kogi State to the north. The origin of the name is derived
from the Anambra River (Omambala) which is a tributary of the
famous River Niger.
The indigenous ethnic group in Anambra state are the Igbo (98%
of population) and a small population of Igala (2% of the
population) who live in the North western part of the state.[3]
Anambra is the eight most populated states in the Federal
Republic of Nigeria and the second most densely populated
state in Nigeria after Lagos State. The stretch of more than
45 km between Oba and Amorka contains a cluster of numerous
thickly populated villages and small towns giving the area an
estimated density of 1,500–2,000 persons living within every
square kilometer of the area.
Anambra possesses a history that stretches back to the 9th
century AD, as revealed by archaeological excavations at
oraukw and Ezira; Great works of art in iron, bronze, copper,
and pottery works belonging to the ancient Kingdom of Nri,
revealed a sophisticated divine Kingship administrative system
which held sway in the area of Anambra from c. 948 AD to 1911.
During the Nigerian/Biafran war, a relief airstrip, was
constructed by Biafran Engineers in the town of
Uli/Amorka(code named "Annabelle"). Extremely dangerous relief
flights took off from Sao Tome and other sites loaded with
tons of food and medicine for the distressed Biafran
population. Uli/Amorka airstrip was the site were brave
American pilots like Alex Nicoll, and scores of others, made
36 | P a g e

the supreme sacrifice in the service of humanity, delivering
tons of relief supplies to the Biafran population.[4] Disgusted
by the suffering and mounting death toll in Biafra from
starvation as well as the continuous harassment of the relief
planes by the Nigerian Airforce, Carl Gustaf von Rosen
resigned as a Red Cross relief pilot and helped Biafra to form
an Airforce of five Minicoin planes malmo MFI-9 stationed at
the Uga airstrip.He named his tiny but effective airforce
"Babies of Biafra" in honour of the babies who died via
starvation inside Biafra.
Old Anambra State was created in 1976 from part of East
Central State, and its capital was Enugu. A further re-
organisation in 1991 divided Anambra into two states, Anambra
and Enugu. The capital of Anambra is Awka.
Awka, the state capital, is also the center of Nigeria's
metalwork and carving industries. Educationally, Anambra is a
centre of excellence. There are the Nnamdi Azikiwe University
(UNIZIK), Awka a federal university with College of Medicine
situated at Nnewi. The UNIZIK Nnewi runs a modern Teaching
Hospital with facilities also at Umunya and Ukpo.
The Anambra State University, formerly known as Anambra State
University of Science and Technology (ASUTECH), with two
campuses, one in Uli, and another at Igbariam; the Federal
Polytechnic, Oko; Nwafor Orizu University of Education
(formerly known as the Nwafor Orizu College of Education),
Nsugbe. Private Universities include The Tansian University,
Umunya and Madonna University, Okija.
37 | P a g e
Literacy rate in the state is comparatively high. Some of the
more notable secondary schools include Dennis Memorial Grammar
School (D.M.G.S) Onitsha; St Christopher's Junior Seminary 3-3
Onitsha; Girls' Secondary School Onitsha; St Charles' Special
Science School (SCSSS), Onitsha; Christ the King college
(C.K.C) Onitsha; Our Lady's High School, Onitsha;
Comprehensive Secondary School Nawfia; Queen Of the Rosary
College (Q.R.C.) Onitsha, St. Monica's College, Ogbunike,
Nnamdi Azikiwe Secondary School, Abagana; St Mary's High
School, Ifite-Dunu; Igwebuike Grammar School, Awka; Lorretto
Special Science school Adazi; Father Joseph Memorial High
School, Aguleri; Girls High School, Umunya, Ajalli Government
School; Community Secondary School Igbariam and many more.
Primary and secondary school enrollment in the state is one of
the highest in the country. Consequently, Anambra state has
the highest number of JAMB candidates going after the limited
number of spaces in Nigeria's tertiary colleges.
METHODOLOGY
A team of three field assistants visited Anambra state. The
entry point of actual contact was the secretary of the MDG
Committee. The chair of the Committee who is also the Anambra
state Commissioner for Economic Planning Commission provided
the lead account of the state progress in terms of MDGs in the
state. The state has a 15-member ANSG MDG-CGS Implementation
Committee composed of 5 Commissioners, 3 permanent secretaries
and 2 LGA Heads of Administration, 2 representatives of the
civil society as well as the SSA(MDGs).
38 | P a g e
The team had a structured instrument for eliciting information
on state MDG activities. The Questionnaire was administered to
five Commissioners or their Permanent Secretary for
completion; another set of questionnaire was administered to
the directors of these MDAs for completion as a backup.
The team also sought for state specific secondary data. In
particular, data/information were obtained from the Anambra
State publication on Millennium Development Goals (MDGs);
ANIDS Website, National Demographic Health Survey (NDHS) 2003,
2008; Presidential Research and Communication Unit article;
questionnaires.
Data is both quantitative and qualitative.
7. RESULTS/FINDINGS
Sectoral Strategies as stipulated in SEEDS and MDGs are not
robustly outlined. The SEEDS is outdated and not in use at the
MDAs
The state does not know for sure where it stands in terms of
MDG targets though the Universal targets are clearly well
stated in a state pamphlet listing projects executed under the
CGS which have diffuse /more or less direct impact on MDG
targets.
There is no dedicated state funding or state initiatives
directed at MDG targets. MDG related funding trail is limited
39 | P a g e
to the payment of counterpart cash contributions to the CGS
and other development partners in the state
There was a serious lack of baseline information and real data
for monitoring progress against the MDG target or for
planning. All the MDAs had eventual recourse to the NDHS or
some national publication which even then they were slow or
reluctant to release.
Just as stated, the state claimed there was an upward rise of
impact of the MDGs in the region and Anambra State, even then
there is no evidence of any sort to show but if there were the
state has no way of knowing other than the elongating list of
projects and programmes under the CGS
Regarding the documentation of the projects and programmes in
the direction of addressing the MDGs, the state is obviously
underselling itself with projects and programmes undertaken by
the state, the LGAs, the development partners of the state
being undocumented
The team confirms that the EU, GHAIN, SuNMaP, the World Bank,
SFH are few of the international donors/development partners
that are active in the state.
The questionnaire show a general awareness of the creation and
knowledge of the MDGs, but informal discussions show that the
overall awareness and knowledge of the MDGs are patchy and not
well spread.
More awareness is therefore needed; apart from fever may be
the observed impact. In Anambra State, allocations for the
40 | P a g e
MDGs project have been in tandem matching and released on
yearly basis (2006 – 2009). Challenges include poor data base
and monitoring and Evaluation mechanism; No definite policy on
and public-private sector partnership; poor coordination
between the tiers of government; Limited human capacity to
implement the MDGs projects; among others.
Achievements in Anambra State under the MDGs include: -
Construction of 538 VIP toilets; Drilling of 186 solar-powered
boreholes; Supply of Antimalarial drugs to 138 Primary Health
Centres; Training of 250 Medical Doctors, Pharmacists and
Nurses; Improvement of Emergency Obstetric Care; Supply of
Medical Equipment to 105 Primary Health Centres; Supply of ICT
and other skills equipment to 10 Youth Skills Centres;
Construction of 10 Youths/Skills Centres. The implementation
of the MDGs in the State is manifest mostly in health, water
resources and youths development.
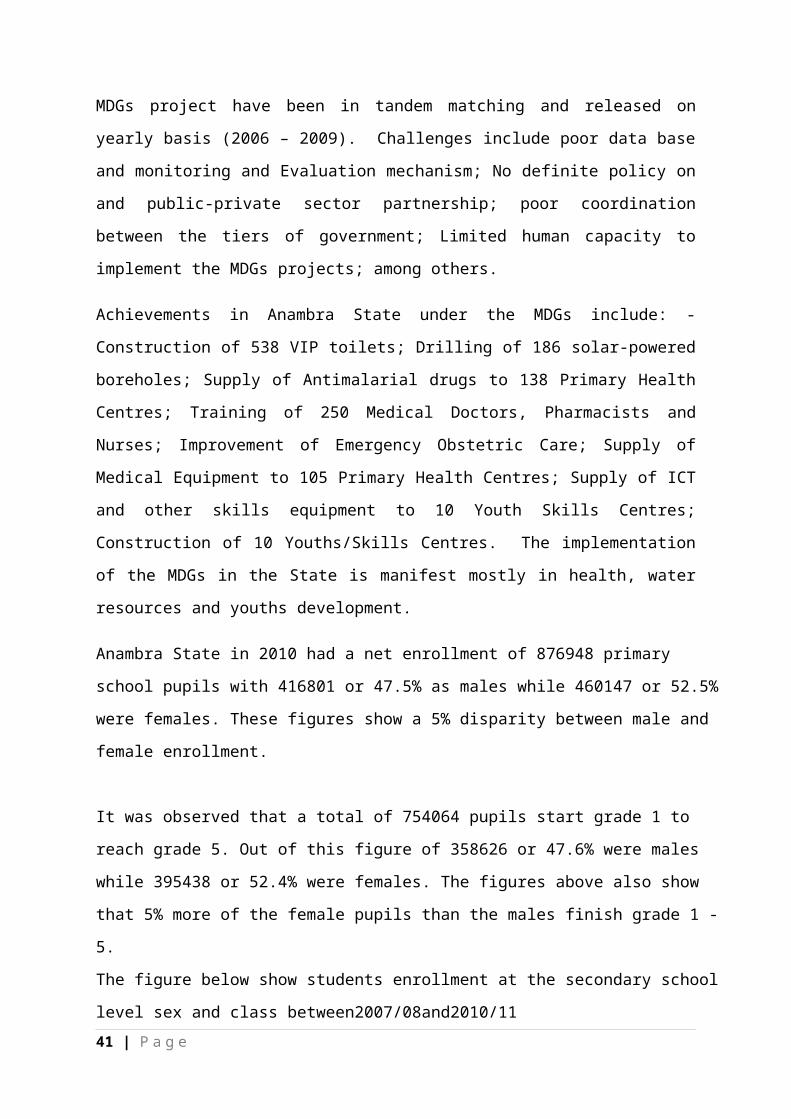
Anambra State in 2010 had a net enrollment of 876948 primary
school pupils with 416801 or 47.5% as males while 460147 or 52.5%
were females. These figures show a 5% disparity between male and
female enrollment.
It was observed that a total of 754064 pupils start grade 1 to
reach grade 5. Out of this figure of 358626 or 47.6% were males
while 395438 or 52.4% were females. The figures above also show
that 5% more of the female pupils than the males finish grade 1 -
5.
The figure below show students enrollment at the secondary school
level sex and class between2007/08and2010/1141 | P a g e
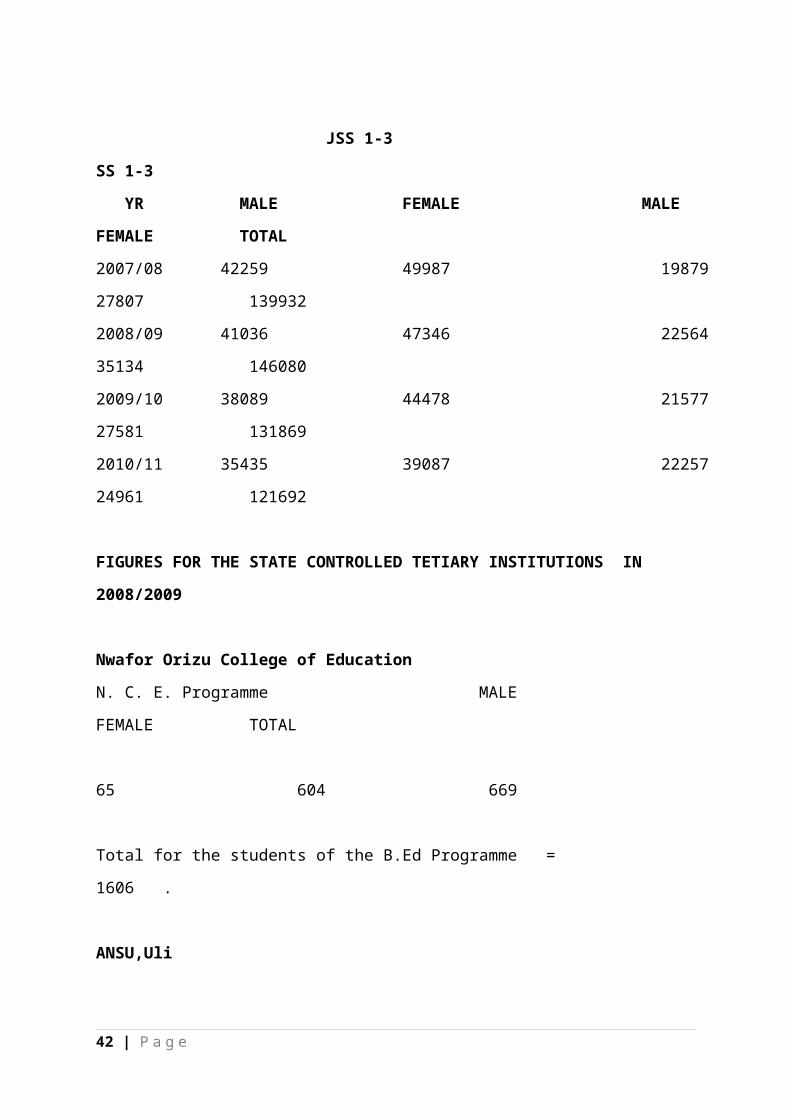
JSS 1-3
SS 1-3
YR MALE FEMALE MALE
FEMALE TOTAL
2007/08 42259 49987 19879
27807 139932
2008/09 41036 47346 22564
35134 146080
2009/10 38089 44478 21577
27581 131869
2010/11 35435 39087 22257
24961 121692
FIGURES FOR THE STATE CONTROLLED TETIARY INSTITUTIONS IN
2008/2009
Nwafor Orizu College of Education
N. C. E. Programme MALE
FEMALE TOTAL
65 604 669
Total for the students of the B.Ed Programme =
1606 .
ANSU,Uli
42 | P a g e

MALE FEMALE TOTAL
8562 7330 15892
LITERACY RATE OF 15 - 24 YRS BY SEX AS AT 2006
MALE (age group)
LITERATE NON
LITERATE TOTAL
15 - 19 248866
5610 254476
20 - 24 203022
5269 208291
FEMALE
15 -19 241469
5835 247304
20 - 24 217379
7375 224754
43 | P a g e
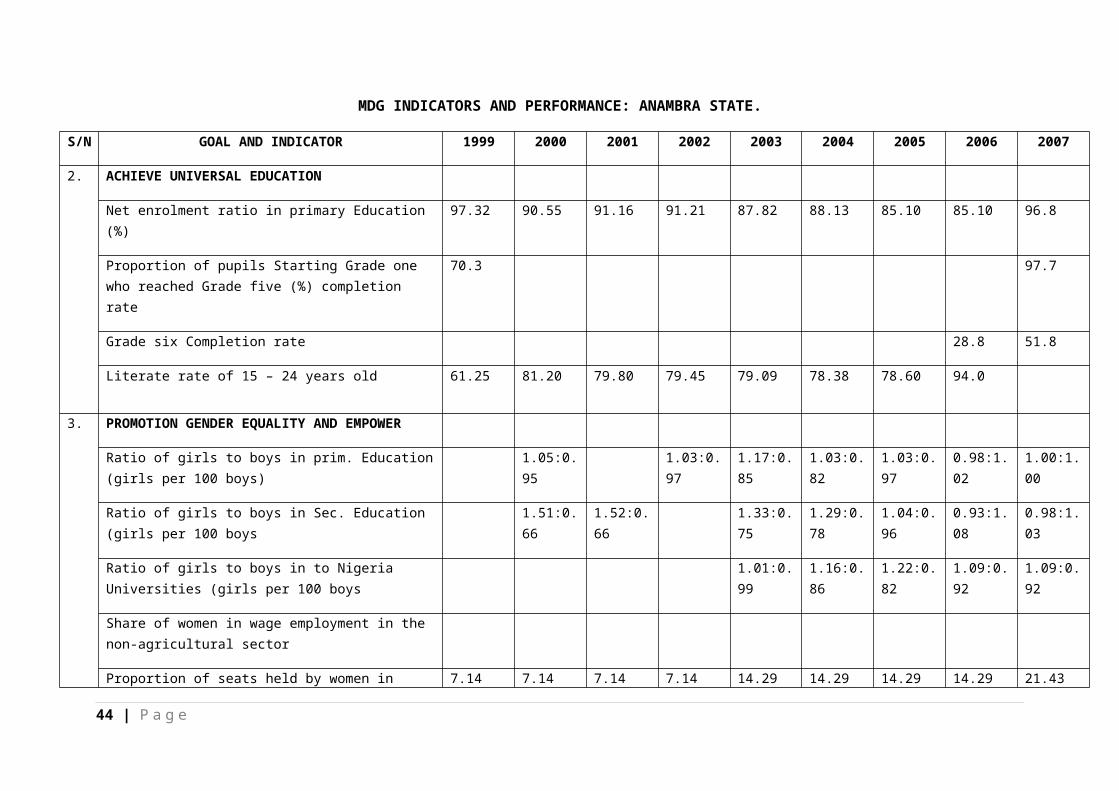
MDG INDICATORS AND PERFORMANCE: ANAMBRA STATE.
S/N GOAL AND INDICATOR 1999 2000 2001 2002 2003 2004 2005 2006 2007
2. ACHIEVE UNIVERSAL EDUCATION
Net enrolment ratio in primary Education (%)
97.32 90.55 91.16 91.21 87.82 88.13 85.10 85.10 96.8
Proportion of pupils Starting Grade one who reached Grade five (%) completion rate
70.3 97.7
Grade six Completion rate 28.8 51.8
Literate rate of 15 – 24 years old 61.25 81.20 79.80 79.45 79.09 78.38 78.60 94.0
3. PROMOTION GENDER EQUALITY AND EMPOWER
Ratio of girls to boys in prim. Education(girls per 100 boys)
1.05:0.95
1.03:0.97
1.17:0.85
1.03:0.82
1.03:0.97
0.98:1.02
1.00:1.00
Ratio of girls to boys in Sec. Education (girls per 100 boys
1.51:0.66
1.52:0.66
1.33:0.75
1.29:0.78
1.04:0.96
0.93:1.08
0.98:1.03
Ratio of girls to boys in to Nigeria Universities (girls per 100 boys
1.01:0.99
1.16:0.86
1.22:0.82
1.09:0.92
1.09:0.92
Share of women in wage employment in the non-agricultural sector
Proportion of seats held by women in 7.14 7.14 7.14 7.14 14.29 14.29 14.29 14.29 21.43
44 | P a g e

national parliament (%)
45 | P a g e
Net enrolment ratio in primary
Education (%)
Proportion of pupils Starting Grade one
who reached Grade five
(%) completion
rate
Grade six Completion
rateLiterate
rate of 15 – 24 years
old
0
20
40
60
80
100
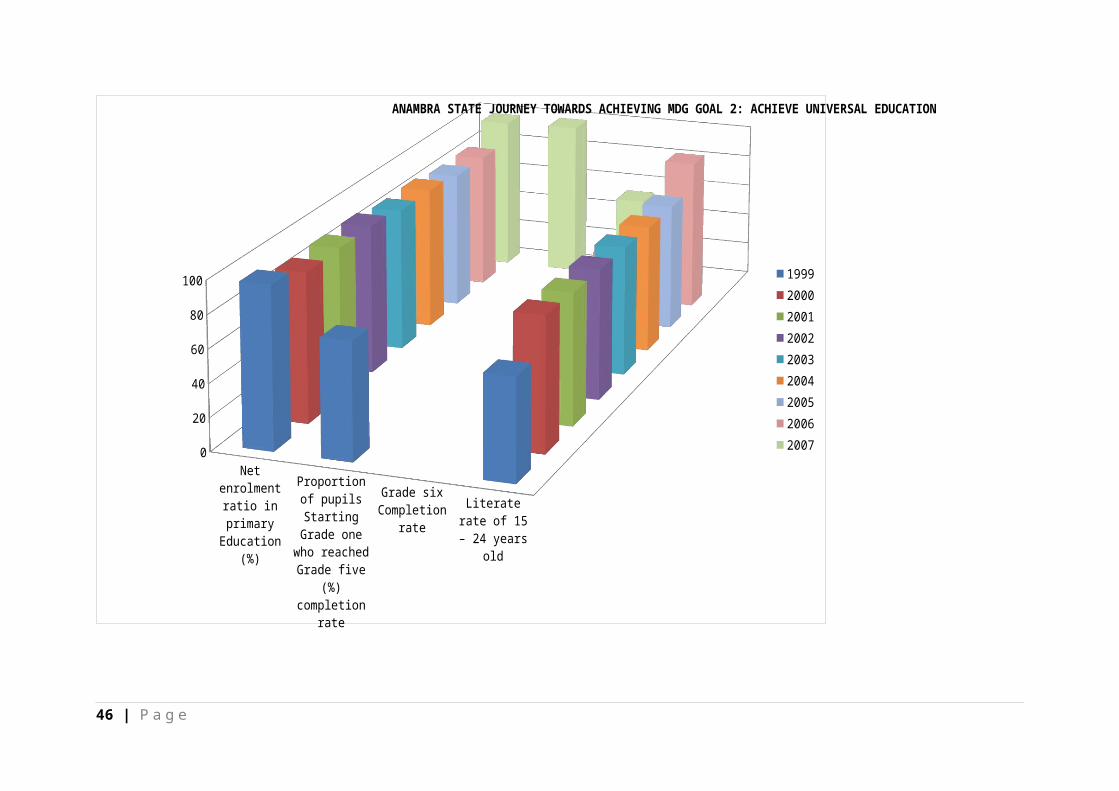
ANAMBRA STATE JOURNEY TOWARDS ACHIEVING MDG GOAL 2: ACHIEVE UNIVERSAL EDUCATION
199920002001200220032004200520062007
46 | P a g e
0
5
10
15
20
25ANAMBRA STATE JOURNEY TOWARDS ACHIEVING MDG GOAL 3: PROMOTE GENDER EQUALITY AND
WOMEN EMPOWERMENT Girls (1999)Boys (1999)Girls (2000)Boys (2000)Girls (2001)Boys (2001)Girls (2002)Boys (2002)Girls (2003)Boys (2003)Girls (2004)Boys (2004)Girls (2005)Boys (2005)Girls (2006)Boys (2006)Girls (2007)Boys (2007)
47 | P a g e

48 | P a g e
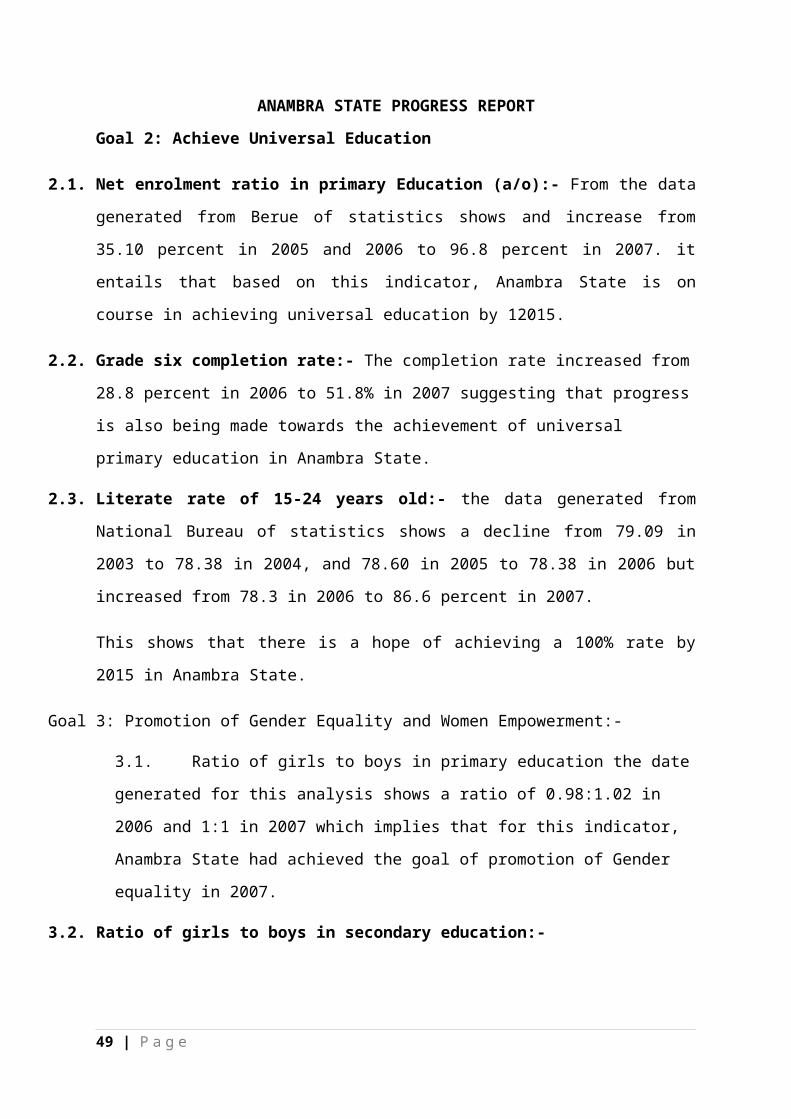
ANAMBRA STATE PROGRESS REPORT
Goal 2: Achieve Universal Education
2.1. Net enrolment ratio in primary Education (a/o):- From the data
generated from Berue of statistics shows and increase from
35.10 percent in 2005 and 2006 to 96.8 percent in 2007. it
entails that based on this indicator, Anambra State is on
course in achieving universal education by 12015.
2.2. Grade six completion rate:- The completion rate increased from
28.8 percent in 2006 to 51.8% in 2007 suggesting that progress
is also being made towards the achievement of universal
primary education in Anambra State.
2.3. Literate rate of 15-24 years old:- the data generated from
National Bureau of statistics shows a decline from 79.09 in
2003 to 78.38 in 2004, and 78.60 in 2005 to 78.38 in 2006 but
increased from 78.3 in 2006 to 86.6 percent in 2007.
This shows that there is a hope of achieving a 100% rate by
2015 in Anambra State.
Goal 3: Promotion of Gender Equality and Women Empowerment:-
3.1. Ratio of girls to boys in primary education the date
generated for this analysis shows a ratio of 0.98:1.02 in
2006 and 1:1 in 2007 which implies that for this indicator,
Anambra State had achieved the goal of promotion of Gender
equality in 2007.
3.2. Ratio of girls to boys in secondary education:-
49 | P a g e

For 2005 the ratio stood at 1.04-0.96, in 2006 the ratio stood
at 0.93-1.08 and genially in 2007, 0.98-103 which show that
the girl to boys is at on increase.
3.3. Ratio of girls to boys in to Nigeria University:- For 2005 the
ratio stood at 1.22-0.82, In 2006, 1.09-0.92 and in 2009, 1.09
– 0.92. The analysis shows that there are more girls than boys
into the Nigeria University.
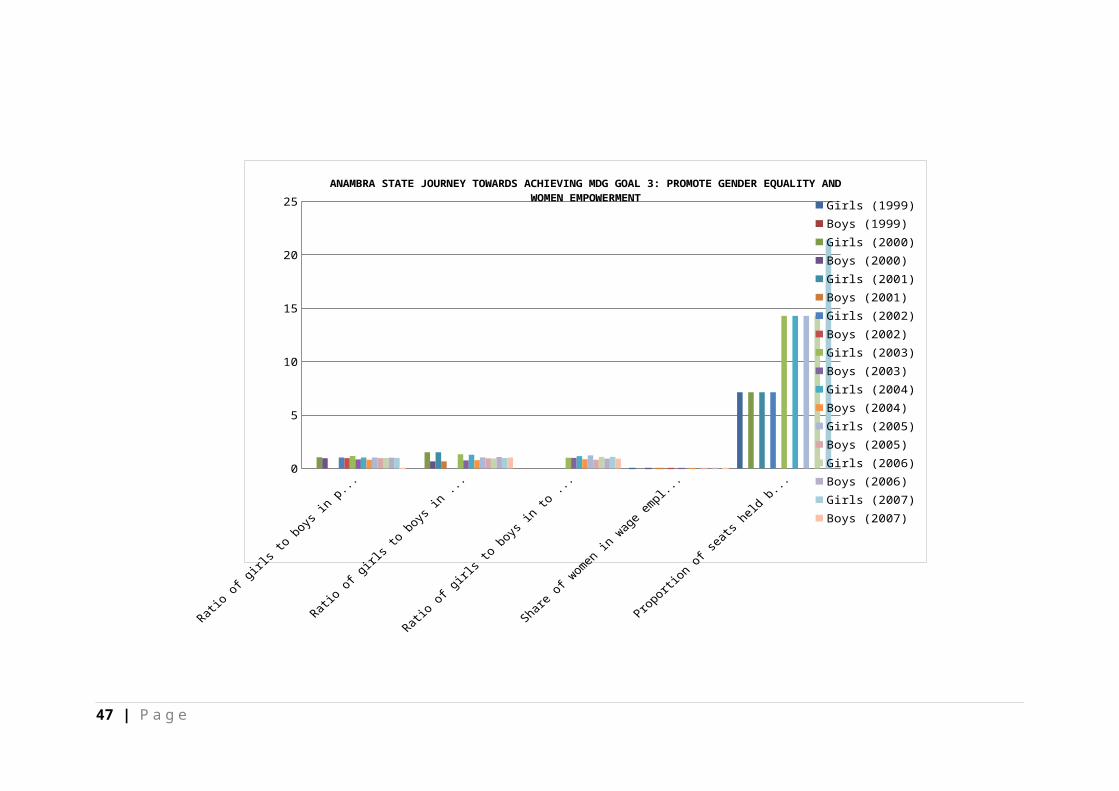
3.4. Proportion of seats held by Women in National parliament:-
In 1999 the ratio of women in national parliament was 7.14%
and it increased to 14.29% in 2003 and again increased to
21.43% in 2007. The continuous increase cannot get a balance
of 50 by 2015.
EBONYI STATE PROCESS REPORT.
Goal 2: Universal Educaiton Achievement.
2.1 Net enrolment ratio in primary Education%:- From the data
generated from the ministry of Education and national buerreu
of statistics shows that there is fluctuation in their
education achievement which stipulates that they have less
programme to embark on.
2.2. Proportion of pupils stontary grade one who reached grade five
%:- The data shows that in 2006, the ratio stood at 68.2 and
in 2007, it increased to 98.5. This shows that the pupil who
started from grade one and reached to grade five are on the
increasing sode.
50 | P a g e
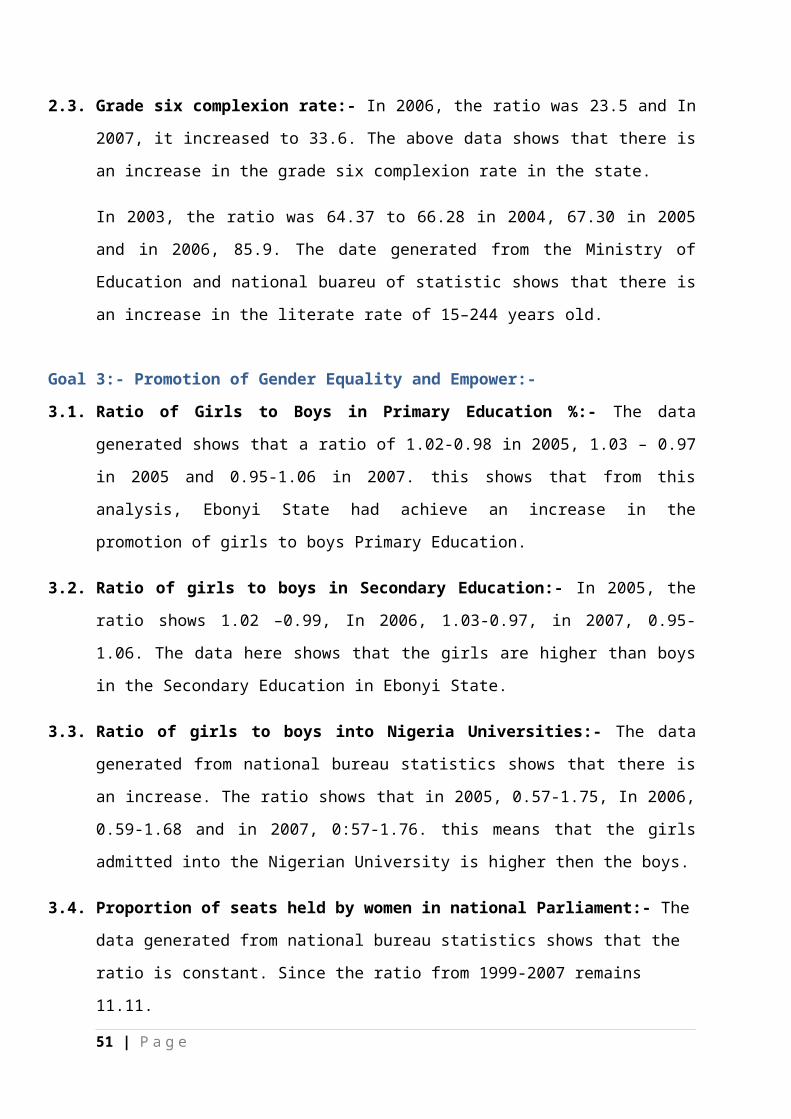
2.3. Grade six complexion rate:- In 2006, the ratio was 23.5 and In
2007, it increased to 33.6. The above data shows that there is
an increase in the grade six complexion rate in the state.
In 2003, the ratio was 64.37 to 66.28 in 2004, 67.30 in 2005
and in 2006, 85.9. The date generated from the Ministry of
Education and national buareu of statistic shows that there is
an increase in the literate rate of 15–244 years old.
Goal 3:- Promotion of Gender Equality and Empower:-
3.1. Ratio of Girls to Boys in Primary Education %:- The data
generated shows that a ratio of 1.02-0.98 in 2005, 1.03 – 0.97
in 2005 and 0.95-1.06 in 2007. this shows that from this
analysis, Ebonyi State had achieve an increase in the
promotion of girls to boys Primary Education.
3.2. Ratio of girls to boys in Secondary Education:- In 2005, the
ratio shows 1.02 –0.99, In 2006, 1.03-0.97, in 2007, 0.95-
1.06. The data here shows that the girls are higher than boys
in the Secondary Education in Ebonyi State.
3.3. Ratio of girls to boys into Nigeria Universities:- The data
generated from national bureau statistics shows that there is
an increase. The ratio shows that in 2005, 0.57-1.75, In 2006,
0.59-1.68 and in 2007, 0:57-1.76. this means that the girls
admitted into the Nigerian University is higher then the boys.
3.4. Proportion of seats held by women in national Parliament:- The
data generated from national bureau statistics shows that the
ratio is constant. Since the ratio from 1999-2007 remains
11.11.
51 | P a g e

MDG INDICATORS AND PERFORMANCE: EBONYI STATE.
S/N GOAL AND INDICATOR 1999 2000 2001 2002 2003 2004 2005 2006 2007
2. ACHIEVE UNIVERSAL EDUCATION
Net enrolment ratio in primary Education (%)
84.20 85.48 84.31 83.35 80.24 75.00 57.7 90.9
Proportion of pupils Starting Grade one who reached Grade five (%) completion rate
68.2 98.5
Grade six Completion rate 23.5 33.6
Literate rate of 15 – 24 years old 58.6 62.46 63.41 64.37 66.28 67.30 85.9
3. PROMOTION GENDER EQUALITY AND EMPOWER
Ratio of girls to boys in prim. Education(girls per 100 boys)
1.01:0.99
1.02:0.98
1.02:0.99
1.02:0.98
1.03:0.97
0.95:1.06
Ratio of girls to boys in Sec. Education (girls per 100 boys
0.98:1.02
1.29:0.77
1.01:0.99
1.07:0.93
1.05:0.95
0.95:1.05
Ratio of girls to boys in to Nigeria Universities (girls per 100 boys
0.55:1.83
0.57:1.76
0.57:1.75
0.59:1.68
0.57:1.76
Share of women in wage employment in the non-agricultural sector
52 | P a g e
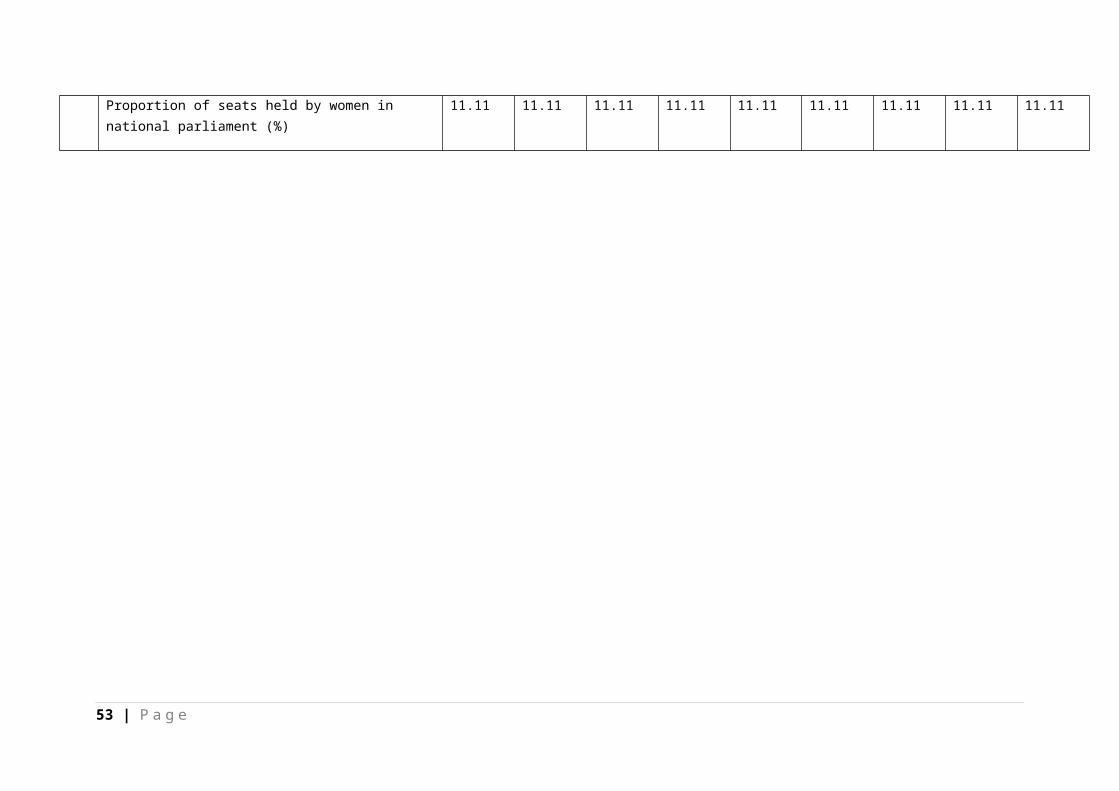
Proportion of seats held by women in national parliament (%)
11.11 11.11 11.11 11.11 11.11 11.11 11.11 11.11 11.11
53 | P a g e

Net enrolment ratio in primary
Education (%)
Proportion of pupils Starting Grade one
who reached Grade five
(%) completion
rate
Grade six Completion
rateLiterate
rate of 15 – 24 years
old
0
20
40
60
80
100
EBONYI STATE JOURNEY TOWARDS ACHIEVING MDG GOAL 2: ACHIEVE UNIVERSAL EDUCATION
199920002001200220032004200520062007
54 | P a g e
0
5
10
15
20
25
EBONYI STATE JOURNEY TOWARDS ACHIEVING MDG GOAL 3: PROMOTE GENDER EQUALITY AND WOMEN EMPOWERMENT
Girls (1999)Boys (1999)Girls (2000)Boys (2000)Girls (2001)Boys (2001)Girls (2002)Boys (2002)Girls (2003)Boys (2003)Girls (2004)Boys (2004)Girls (2005)Boys (2005)Girls (2006)Boys (2006)Girls (2007)Boys (2007)
55 | P a g e
IMO STATE
Imo State is one of the 36 states of Nigeria and lies to the
south of Nigeria with Owerri as its capital and largest city.
Imo State came into existence in 1976 along with other new
states created under the leadership of the late military ruler
of Nigeria, Murtala Muhammad, having been previously part of
East-Central State. The state is named after the Imo River.[3]
Part of it was split off in 1991 as Abia State, and another
part became Ebonyi State. The main cities in Imo State are
Owerri, Orlu and Okigwe. The Orashi River has its source in
this state. The local language is Igbo and Christianity is the
predominant religion. Imo state was created at Ngwoma.
Imo State lies within latitudes 4°45'N and 7°15'N, and
longitude 6°50'E and 7°25'E with an area of around
5,100 sq km.[4] It is bordered by Abia State on the East, by
the River Niger and Delta State on the west, by Anambra State
to the north and Rivers State to the south. Besides Owerri,
Imo State's major towns are Isu, Okigwe, Oguta, Orlu, Mbaise,
Mbano, Mbieri, Orodo and Orsu.
The state is rich in natural resources including crude oil,
natural gas, lead, zinc.[5] Economically exploitable flora like
the iroko, mahogany, obeche, bamboo, rubber tree and oil palm
predominate. However with a high population density and over
farming the soil has been degraded and much of the native
vegetation has disappeared.[4]
56 | P a g e

This deforestation has triggered soil erosion which is
compounded by heavy seasonal rainfall that has led to the
destruction of houses and roads
Location
Imo State derives its name from Imo River, which takes its
course from the Okigwe/Awka upland. It lies within latitudes
4°45'N and 7°15'N, and longitude 6°50'E and 7°25'E. It
occupies the area between the lower River Niger and the upper
and middle Imo River. The state is bounded on the east by Abia
State, on the west by the River Niger and Delta State; and on
the north by Anambra State, while Rivers State lies to the
south. Imo State covers an area of about 5,100sq km.
Religion
There is freedom of worship in Imo State and religion occupies
a central place in the lives of the people. The people are
predominantly Christians of different denominations. Some
people in the state still practice traditional religions.
Relief and Drainage
Imo State is underlain by the Benin Formation of coastal plain
sands. This formation, which is of late Tertiary age, is
rather deep, porous, infertile and highly leached. In some
areas like Okigwe, impermeable layers of clay occur near the
surface, while in other areas, the soil consists of lateritic
material under a superficial layer of fine grained sand.
Rivers are few with vast inter fluves which are characterized
by dry valleys that carry surface drainage in periods of high
rainfall. The phenomenal monotony of the terrain may be
accounted for by the absence of any tectonic disturbances and
57 | P a g e

by the homogeneity of the rock structure.
The main streams draining the state are Imo, Otamiri, Njaba
and Ulasi rivers, all of which have very few tributaries. With
the exception of Imo River, which runs through the area
underlain by the Imo Shales? Other rivers rise within the
coastal plain sands. Generally, river valleys constitute the
major physical features, which are often marshy.
Rainfall
The undulating nature of the interfluves gives rise to
numerous depressions especially in the northeast Rainfall
distribution is bimodal, with peaks in July and September and
a two week break in August. The rainy season begins in March
and lasts till October or early November. From March to May,
there are violent storms which destroy crops and houses.
Rainfall is often at its maximum at night and during the early
morning hours. However, variations occur in rainfall amount
from year to year. Annual rainfall varies from 1,990 mm to
2,200.
Temperatures
Temperatures are similar all over the state. The hottest
months are January to March, with the mean annual temperature
above 20°C. The influence of the harmattan lasts for about
nine weeks (i.e. from late December to late February).Imo
State has an average annual relative humidity of 75 per cent
which is highest during the rainy season, when it rises to
about 90 per cent. The high temperature and humidity
experienced in the state favour luxuriant plant growth, which
produce the Imo State's rich and beautiful vegetation of the
58 | P a g e

tropical rain forest.
Vegetation
Economic trees like the iroko, mahogany, obeche, gmelina,
bamboo, rubber and oil palm pre dominate. But due to high
population density, most of the state has been so farmed and
degraded that the original vegetation has disappeared. Thus
farmers are forced into marginal lands, a situation aggravated
by the rising demand for fuel-wood. Deforestation has
triggered
59 | P a g e
off acute soil erosion especially in the Okigwe Orlu axis.
Population & Land Use
Imo State has a population of about 4.8 million persons. The
population density varies from 230 persons per sq. km. in
Oguta/Egbema area, to about 1,400 persons per sq. km. in
Mbaise, Orlu, Mbano and Mbaitoli areas. This high population
density has led to intensified pressure on land, forests and
other natural resources, leading to increasing rural poverty
which is characteristic of densely populated rural
areas.Fallow period rarely exceeds one year and in some areas
continuous cropping is the rule. Low crop yield and loss of
land to erosion have combined to induce people to migrate in
search of jobs and even farmland in other parts of the
country.
Rural Settlement Patterns
The population of Imo State is predominantly rural. Some of
the most densely settled areas of Nigeria are found in Imo
State, where a direct relationship exists between population
density and the degree of dispersal of rural settlement.
60 | P a g e

61 | P a g e
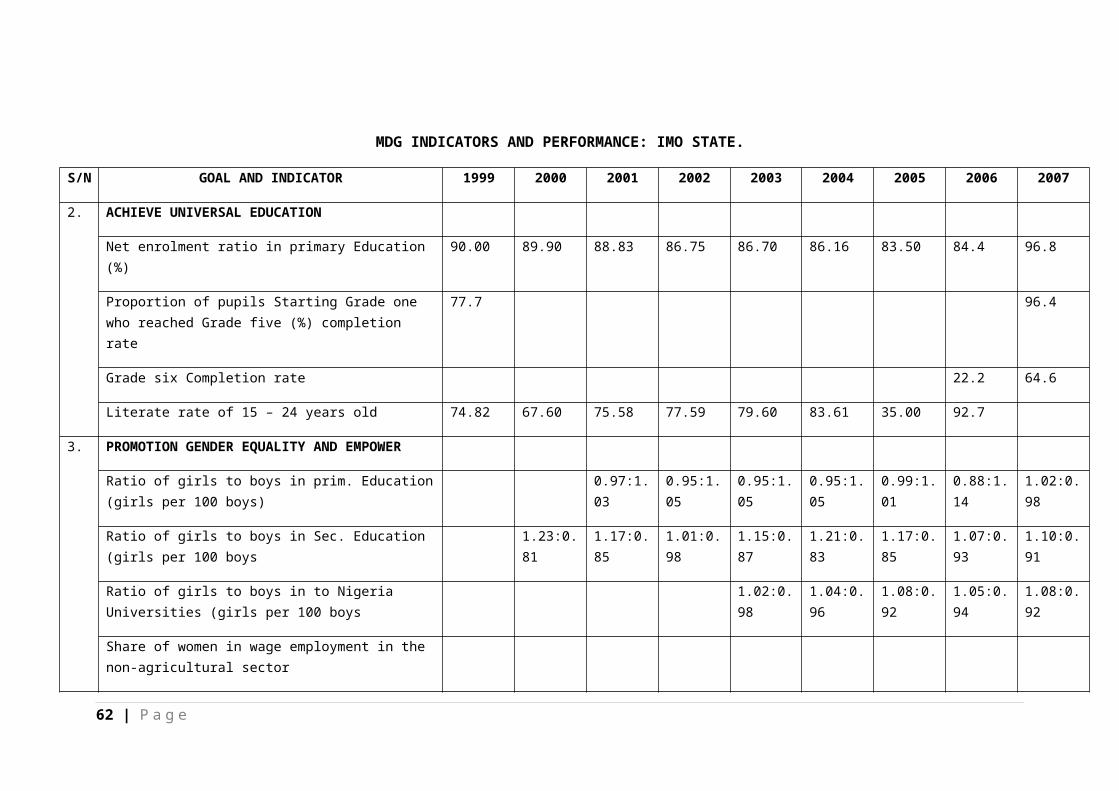
MDG INDICATORS AND PERFORMANCE: IMO STATE.
S/N GOAL AND INDICATOR 1999 2000 2001 2002 2003 2004 2005 2006 2007
2. ACHIEVE UNIVERSAL EDUCATION
Net enrolment ratio in primary Education (%)
90.00 89.90 88.83 86.75 86.70 86.16 83.50 84.4 96.8
Proportion of pupils Starting Grade one who reached Grade five (%) completion rate
77.7 96.4
Grade six Completion rate 22.2 64.6
Literate rate of 15 – 24 years old 74.82 67.60 75.58 77.59 79.60 83.61 35.00 92.7
3. PROMOTION GENDER EQUALITY AND EMPOWER
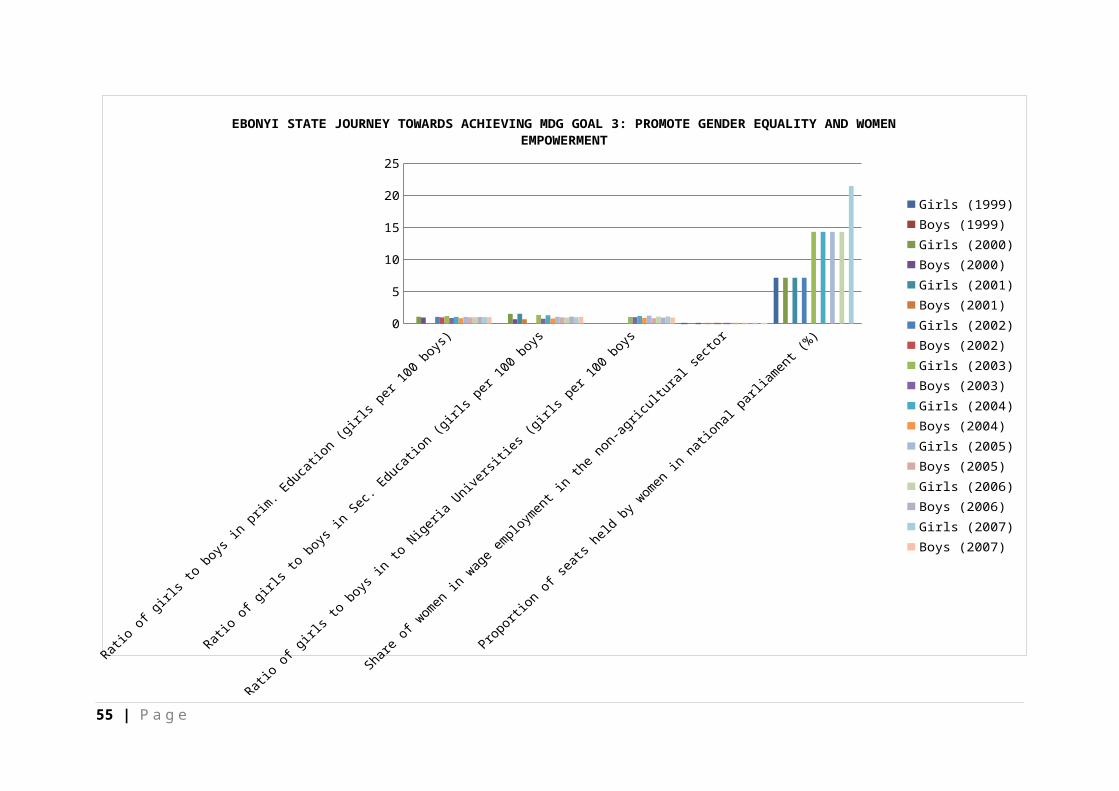
Ratio of girls to boys in prim. Education(girls per 100 boys)
0.97:1.03
0.95:1.05
0.95:1.05
0.95:1.05
0.99:1.01
0.88:1.14
1.02:0.98
Ratio of girls to boys in Sec. Education (girls per 100 boys
1.23:0.81
1.17:0.85
1.01:0.98
1.15:0.87
1.21:0.83
1.17:0.85
1.07:0.93
1.10:0.91
Ratio of girls to boys in to Nigeria Universities (girls per 100 boys
1.02:0.98
1.04:0.96
1.08:0.92
1.05:0.94
1.08:0.92
Share of women in wage employment in the non-agricultural sector
62 | P a g e

Proportion of seats held by women in national parliament (%)
0 0 0 0 8.33 8.33 8.33 8.33 15.38
63 | P a g e
Net enrolment ratio in primary Education (%)
Literate rate of 15 – 24 years old
0102030405060708090
100
IMO STATE JOURNEY TOWARDS ACHIEVING MDG GOAL 2: ACHIEVE UNIVERSAL EDUCATION
199920002001200220032004200520062007
64 | P a g e

Ratio of girls to boys in prim.
Education (girls per 100 ...
Ratio of girls to boys in Sec.
Education (girls per 100 ...
Ratio of girls to boys in to Nigeria
Universities (girls...
Share of women in wage employment in the non-agricu...
Proportion of seats held by
women in national parliament...
0
2
4
6
8
10
12
14
16
18IMOSTATE JOURNEY TOWARDS ACHIEVING MDG GOAL 3: PROMOTE GENDER EQUALITY AND WOMEN
EMPOWERMENT
Girls (1999)Boys (1999)Girls (2000)Boys (2000)Girls (2001)Boys (2001)Girls (2002)Boys (2002)Girls (2003)Boys (2003)Girls (2004)Boys (2004)Girls (2005)Boys (2005)Girls (2006)Boys (2006)Girls (2007)Boys (2007)
65 | P a g e

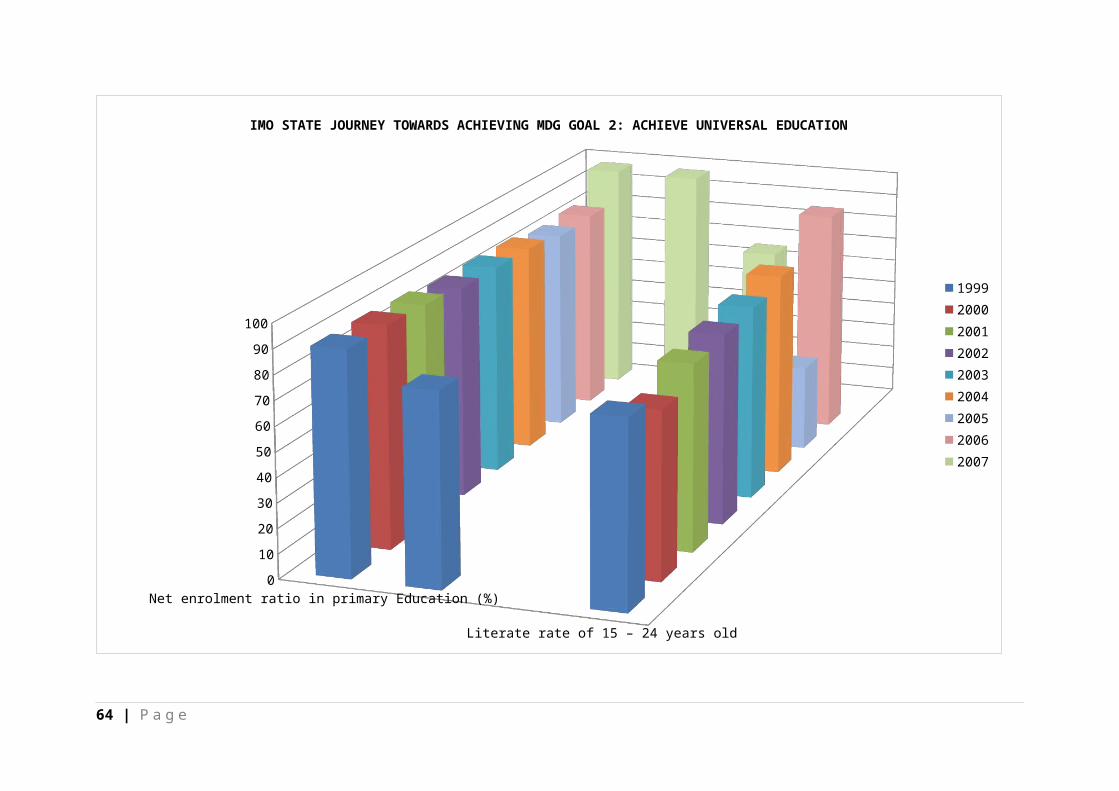
IMO STATE PROGRESS REPORT
Goal 2: achieve universal education.
2.1 net enrolment ration in primary education %:- From the data
generated from the ministry of education and National bureau
and statistics show on increase from 84.4% in 2006 and 96.8%
in 2007. This entails that based on this indicator, Imo State
is on course in achieving Universal Education by 2015.
2.2. Proportion of pupil starting grade one who reached ground five
(%) completion rate:-The completion rate goes 77.7 in 1999
while in 2007, it increased to 96.4. This shows an increase
which implies that Imo State can achieve the goal in 2015.
2.3 Grade six completion rate:- The data only shows that ratio of
roo6 and 2007 with ratio of 22.2 and 64.6 respectively, it
shows an increase which implies that the progress is being
made towards the achievement of Universal Primary Education in
Imo State.
2.4. Literate rate of 15-24 years old:- The date generated from
Nation bureau of statistic shows the ratio of 35.00 in 2005
and 92.7 in 2006. This shows that the increase was more than
100% within year which implies that Imo State had achieved the
Universal Education in 2007.
Goal 3:- Promotion of Gender Equality and Women empowerment:-
3.1. Ratio of girls to boys primary education:- The data from the
analysis indicates the ratio of 0.99-1.01 in 2005, 0.88-1.14
in 2006 and 1.02-0.98 in2007 which implies that Imo State had
achieved that goal of promotion of gender equality in 2007.
3.2. Ratio of girls in secondary education:- In 2005 the ratio was
1.17-0.85, 2006, 1.07-0.93 and in 2007, 1.10-091. This shows
66 | P a g e
that the ratio of girls and boys in secondary education
fluctuate which means it is not gender constant. This implies
that the goal of promotion of gender equality had not be
achieved.
3.3. Ratio of girls to boys in Nigeria University:- The Ratio shows
1.08 –0.92 in 2005, 1,05-0.94 in 2006 and 1.08-0.92 in 2007.
This shows that the data is unstable which implies that Imo
have not achieved the promotion of gender Equality.
3.4. Proportion of seats held by women in National Parliament:- The
data shows that in 2006 it was 8.33 and 15.38 in 2007. This
shows an increase in the women representing Imo State at the
national parliament are on an increase which implies that Imo
State will achieve the promotion on women empowerment goal by
2015.
ENUGU STATE
Enugu State is a mainland state in southeastern Nigeria. Its
capital is Enugu, from which the state - created in 1991 from
the old Anambra State - derives its name. The principal cities
in the state are Enugu, Udi, Oji and Nsukka.
Enugu State is one of the states in the eastern part of
Nigeria. The state shares borders with Abia State and Imo
State to the south, Ebonyi State to the east, Benue State to
the northeast, Kogi State to the northwest and Anambra State
to the west.
67 | P a g e

Enugu, the capital city of Enugu State, is approximately 2½
driving hours away from Port Harcourt, where coal shipments
exited Nigeria. Enugu is also located within an hour's drive
from Onitsha, one of the biggest commercial cities in Africa
and 2 hours drive from Aba, another very large commercial city
, both of which are trading centers in Nigeria. The average
temperature in this city is cooler to mild (60 degrees
Fahrenheit) in its cooler months and gets warmer to hot in its
warmer months (upper 80 degrees Fahrenheit) and very good for
outdoor activities with family and friends or just for
personal leisure.
Enugu has good soil-land and climatic conditions all year
round, sitting at about 223 metres (732 ft) above sea level,
and the soil is well drained during its rainy seasons. The
mean temperature in Enugu State in the hottest month of
February is about 87.16 °F (30.64 °C), while the lowest
temperatures occur in the month of November, reaching 60.54 °F
(15.86 °C). The lowest rainfall of about 0.16 cubic
centimetres (0.0098 cu in) is normal in February, while the
highest is about 35.7 cubic centimetres (2.18 cu in) in July.
The name of State derives from its capital city, Enugu. The
word "Enugu" (from Enu Ugwu) means "the top of the hill". The
first European settlers arrived in the area in 1909, led by a
British mining engineer, Albert Kitson. In his quest for
silver, he discovered coal in the Udi Ridge. Colonial Governor
of Nigeria Frederick Lugard took keen interest in the
discovery, and by 1914 the first shipment of coal was made to
68 | P a g e
Britain. As mining activities increased in the area, a
permanent cosmopolitan settlement emerged, supported by a
railway system. Enugu acquired township status in 1917 and
became strategic to British interests. Foreign businesses
began to move into Enugu, the most notable of which were John
Holt, Kingsway Stores, British Bank of West Africa and United
Africa Company.
From Enugu the British administration was able to spread its
influence over the Southern Province of Nigeria. The colonial
past of Enugu is today evidenced by the Georgian building
types and meandering narrow roads within the residential area
originally reserved for the whites, an area which is today
called the Government Reserved Area (GRA).
From being the capital of the Southern Provinces, Enugu became
the capital of the Eastern Region (now divided into nine
States), the capital of now defunct Federal Republic of
Biafra, thereafter, the capital of East Central State, Anambra
State, (old) Enugu State, and now the capital of the present
Enugu State through a process of state creation and diffusion
of administrative authority.
The State Government and the Local Government are the two
levels of government in Enugu State and in all other states of
Nigeria. Sullivan Chime is the current executive governor for
the whole of Enugu State. He was elected by the people of
Enugu State in April 2007[4] and was sworn into office on May
29, 2007.[5] The governor is above a group of commissioners who
he has placed as heads of ministries that oversee various
69 | P a g e

portfolios such as Health and Housing; both the governor and
the commissioners form the Executive Council of Enugu State.
Government House, Enugu is where the government of the state
is based.
Economically, the state is predominantly rural and agrarian,
with a substantial proportion of its working population
engaged in farming, although trading (18.8%) and services
(12.9%) are also important. In the urban areas trading is the
dominant occupation, followed by services. A small proportion
of the population is also engaged in manufacturing activities,
with the most pronounced among them located in Enugu, Oji,
Ohebedim and Nsukka.
Every community in Enugu State has at least one
Primary/Elementary school and one Secondary school, funded and
run by State Government. There are also large numbers of
private nursery, primary and secondary schools in Enugu State.
Nigeria's First Indigenous University, University of Nigeria,
Nsukka (UNN), is located in Enugu State. The state also hosts
the Enugu State University of Science & Technology (ESUT),
Institute of Management and Technology (IMT), Enugu State
College of Education Technical, Enugu, Caritas University,
Amorji-Nike, Renaissance University, Ugbawka; Federal
Government College Enugu, Federal School of Dental Technology
& Therapy College of Immaculate Conception, Enugu; Queen’s
School Enugu a Preeminent high school for girls in the Eastern
region; Special Science Boys' Secondary School Agbani, Nkanu
West l.g.a; [St. Patrick's Secondary School], Emene;Bigard
70 | P a g e
Memorial Seminary, Enugu; Awgu County College, Nenwe; Corpus
Christi College, Achi; Our Saviour Institute of Science and
Technology, Enugu; and the Federal College of Education, Eha-
Amufu Seat of Wisdom Secondary School Trans Ekulu Enugu. There
are also a host of private computer schools and training
centres concentrated in Enugu and Nsukka.
Enugu State has a population of over 3.3 million people and
counting. It is home to the Igbo of south-eastern Nigeria.
1.0 Awareness and Knowledge of MDGs:
Survey results showed that over 85% of the citizens in EnuguState are aware of the Millennium Development Goals( MDGs).According to the respondents, about 75% of them sourced theirinformation on MDGs from the radio, television,newspapers/magazines as well as conferences ,seminars ,workshopsand meetings. However, 17% of those interviewed got theirinformation from either fellow staff, relations, friends orindividuals that are associated with them in one way or the other.Only 7.4%of them sourced their information from flyers thatcontained information on MDGs. This scenario notwithstanding,majority of the people do not have good understanding of thebackground, objectives and modus operandi of the MDGs.
2.0 MDGs Programmes/Projects and Activities:
In Enugu State, there is evidence of state and somesectoral policies and/or policy frameworks developed over theyears which embody the key elements of the Millennium DevelopmentGoals( MDGs). These include such documents as the Enugu StateEconomic Empowerment and Development Strategy( SEEDS), MediumTerm Sectoral Strategy( MTSS), Medium Term DevelopmentPlan( MTDP) and the 4-Point Agenda of the present governmentadministration .There is evidence of such sectoral policies andstrategies as the Health Strategy Plan and the Education, Waterand Agricultural Development Policies respectively.
71 | P a g e

Most of the MDGs programmes,projects and activitiesimplemented in Enugu State are anchored on the above policyframeworks. Based on the results of the survey, a variety of MDGsprojects have been executed as well as on-going at differentlevels in the state. About 50% of the respondents opined thatsuch projects as the Conditional Grant Scheme( CGS), MaternalCare Health( MCH) and Midwifery Service Scheme(MSS) were beingimplemented in the state. Furthermore, 22.2% of those interviewednoted that the Keke NAPEP and Micro-credit Scheme andAgricultural Loan Revolving Scheme were some of the MDGs projectsimplemented in Enugu state while 27.8% of them identifiedfederally MDGs executed projects. It is possible that suchprojects as the Constituency Quickwins and Conditional Cashtransfer projects, among others are being executed in the statewhich the respondents were not aware of at the time of thissurvey.This could be attributed to the low participation orinvolvement of most of the MDAs and other stakeholders in theplanning and implementation of the MDGs in the state. Majority ofthe respondents perceived the participation of the citizens inthe MDGs programmes,projects and activities as poor.
In terms of strategies for the implementation of MDGs in thestate, majority of the respondents were agreed thatadvocacy,community mobilisation,contracting as well asprocurement and distribution were important strategies employedin delivering MDGs in the state. Monitoring andevaluation,tracking and management and field visits appear to bevery weak or lacking.
3.0 Initiatives and Interventions for Achieving MDGs Targets:
With respect to Goal 5 on improving maternal healthcare, thefollowing initiatives are being implemented in Enugu State:
Free maternal healthcare programme aimed at reducingmaternal and under-five morbidity and mortality rate.
Rennovation of health facilities.
Procurement of ACTS drugs and anti-malarial drugs.
For Goal 6 that focuses on the prevention of mother- to- childtransmission(PMTCT), the following programmes run in the state:
72 | P a g e
IPT- Intermittent preventive Treatment of Malaria inPregnancy.
HCT- HIV counselling and testing.
TBL- Tuberculosis and Leprosy programmes.
With respect to the initiatives and interventions that address Goal1 on eradicating extreme poverty and hunger, the listed programmesbelow are being implemented in Enugu State:
Fadama 111 that encourages small and medium scale irrigatedfarming all the year round in fadama land and flood plains inthe state.
Commercial Agricultural Development Project(CADP) with theprimary goal of enhancing agricultural production, foodprocessing and marketing for increased farm income and povertyreduction through the commercialisation of agriculture.
Agricultural mechanisation projects including tractor hiringservices.
Erosion control and climate change programme.
73 | P a g e

74 | P a g e
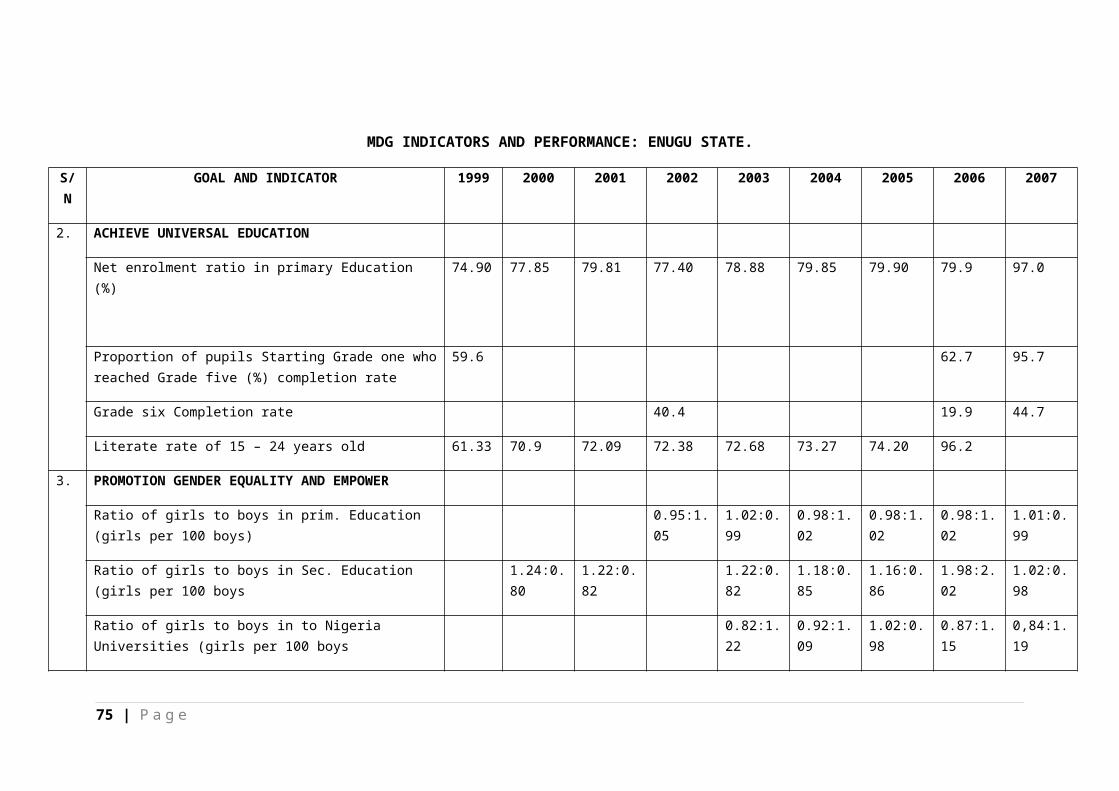
MDG INDICATORS AND PERFORMANCE: ENUGU STATE.
S/N
GOAL AND INDICATOR 1999 2000 2001 2002 2003 2004 2005 2006 2007
2. ACHIEVE UNIVERSAL EDUCATION
Net enrolment ratio in primary Education (%)
74.90 77.85 79.81 77.40 78.88 79.85 79.90 79.9 97.0
Proportion of pupils Starting Grade one whoreached Grade five (%) completion rate
59.6 62.7 95.7
Grade six Completion rate 40.4 19.9 44.7
Literate rate of 15 – 24 years old 61.33 70.9 72.09 72.38 72.68 73.27 74.20 96.2
3. PROMOTION GENDER EQUALITY AND EMPOWER
Ratio of girls to boys in prim. Education (girls per 100 boys)
0.95:1.05
1.02:0.99
0.98:1.02
0.98:1.02
0.98:1.02
1.01:0.99
Ratio of girls to boys in Sec. Education (girls per 100 boys
1.24:0.80
1.22:0.82
1.22:0.82
1.18:0.85
1.16:0.86
1.98:2.02
1.02:0.98
Ratio of girls to boys in to Nigeria Universities (girls per 100 boys
0.82:1.22
0.92:1.09
1.02:0.98
0.87:1.15
0,84:1.19
75 | P a g e

Share of women in wage employment in the non-agricultural sector
Proportion of seats held by women in national parliament (%)
0 0 0 0 0 0 0 0 9.09
76 | P a g e

Net enrolment ratio in primary Education (%)0
102030405060708090
100
1999
2001
2003
2005
2007
ENUGU STATE JOURNEY TOWARDS ACHIEVING MDG GOAL 2: ACHIEVE UNIVERSAL EDUCATION
199920002001200220032004200520062007
77 | P a g e

0
1
2
3
4
5
6
7
8
9
10 ENUGU STATE JOURNEY TOWARDS ACHIEVING MDG GOAL 3: PROMOTE GENDER EQUALITY AND WOMEN EMPOWERMENT Girls (1999)
Boys (1999)Girls (2000)Boys (2000)Girls (2001)Boys (2001)Girls (2002)Boys (2002)Girls (2003)Boys (2003)Girls (2004)Boys (2004)Girls (2005)Boys (2005)Girls (2006)Boys (2006)Girls (2007)Boys (2007)
78 | P a g e

79 | P a g e

Goal 2:- Achieve Universal Education.
2.1. Net Enrolment Ratio in Primary Education%:- From the data
generated from the ministry of education and national bureau
of statistics shows that the ratio in 2005 was 79.90, 2006,
79.9 and in 2007, 97.0. This shows that there is an increase
in the emolument ratio in primary education in Enugu State and
the achievement of universal education by 2015.
2.2. Proportion of pupils starting grade one who reached grade five
(%) completion ratio:- The rate increased from 62.7 in 2006 to
95.7 in 2007. This shows that the pupil completion grade five
are on an increase.
2.3. Grade six completion rate:- Here, the data shows that there is
a speedy increase from 19.9 in 2006 to 44.7 in 2007. The grade
six completion rate are on increase.
2.4. Literate rate of 15-24 years old:- The ratio shows 74.20 in
2005 and in 2006, 96.2. The data shows that there is a hope of
achieving 100% increase by the 2015 in Enugu State.
Goal 3:- Promotion of gender equality and women empowerment.
3.1. Ratio of girls to boys in primary education:- The data
generated for this analysis shows a ratio of 0.98-1.05 in 2006
and 1.1 in 2007 which implies that for this indicator Enugu
State had achieved the goal of promotion of gender equality in
2007.
3.2. Ratio of girls to boys in secondary education:- The ratio
states 1.98-2.02 in 2006 and 1.02 – 0.98 in 2007. This
indicator shows there is decline in the ratio of girls to boys
in secondary education which implies that Enugu State had not
achieve the goal of promotion of gender equality in 2007.
80 | P a g e

3.3. Ratio of girls to boys into Nigeria University %:- The ratio
in 2005 shows 1.02-0.98, 2006, 0.87-1.15 and in 2007, 0.84-
1.19. The data stipulates decline in the boys to girls into
the Nigeria University which implies that Enugu State is
unable to achieve the goal of promotion of gender equality in
2007.
3.4. Proportion of seats held by women in national parliament:- In
Enugu State, from 1999 to 2006 there was no women in national
parliament but in 2007 the ratio came up to 9.09. This implies
that based on this indicator, Enugu State might not be able to
meet up to the goal by 2015.
NET ENROLMENT IN PRIMARY EDUCATION ACROSS SOUTH EASTSTATES
STATE 2004 2005 2006 2007ABIA 76.29 70.80 82.6 98.7ANAMBRA 88.13 85.10 85.10 96.8EBONYI 80.24 75.00 57.7 90.9ENUGU 79.85 79.90 79.9 97.0IMO 86.16 83.50 84.4 96.8
81 | P a g e
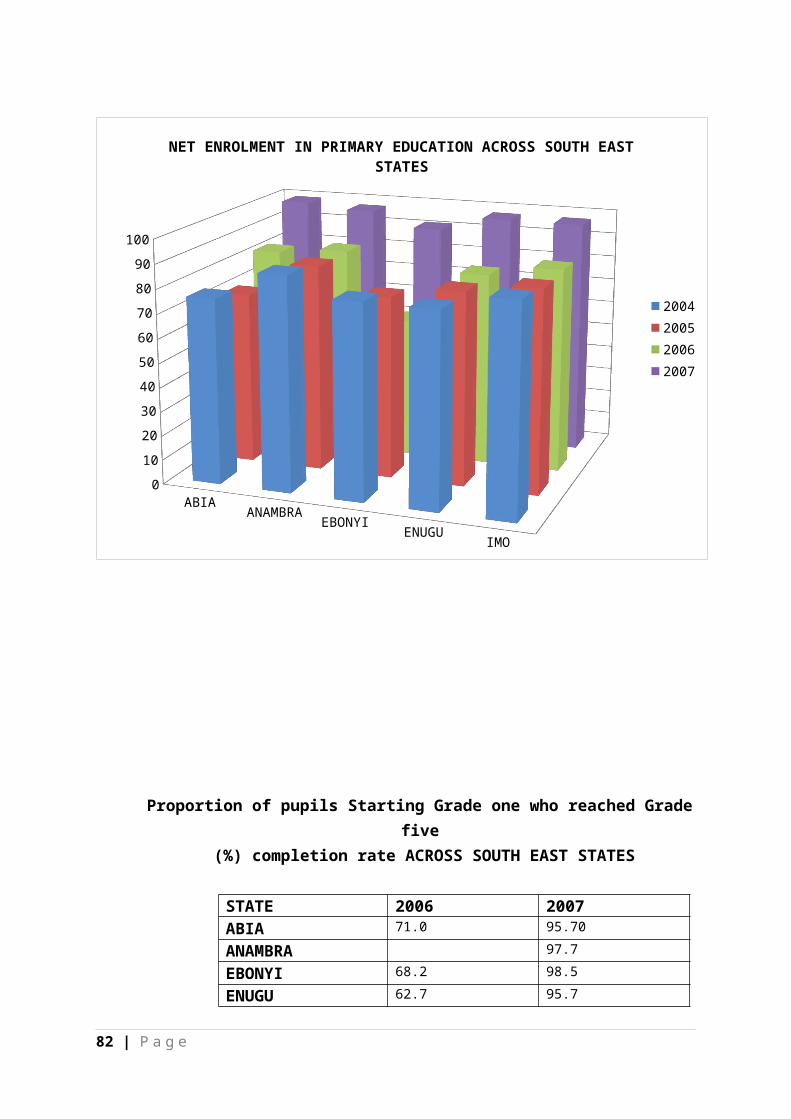
ABIA ANAMBRA EBONYI ENUGU IMO
0102030405060708090
100
NET ENROLMENT IN PRIMARY EDUCATION ACROSS SOUTH EAST STATES
2004200520062007
Proportion of pupils Starting Grade one who reached Gradefive
(%) completion rate ACROSS SOUTH EAST STATES
STATE 2006 2007ABIA 71.0 95.70ANAMBRA 97.7EBONYI 68.2 98.5ENUGU 62.7 95.7
82 | P a g e
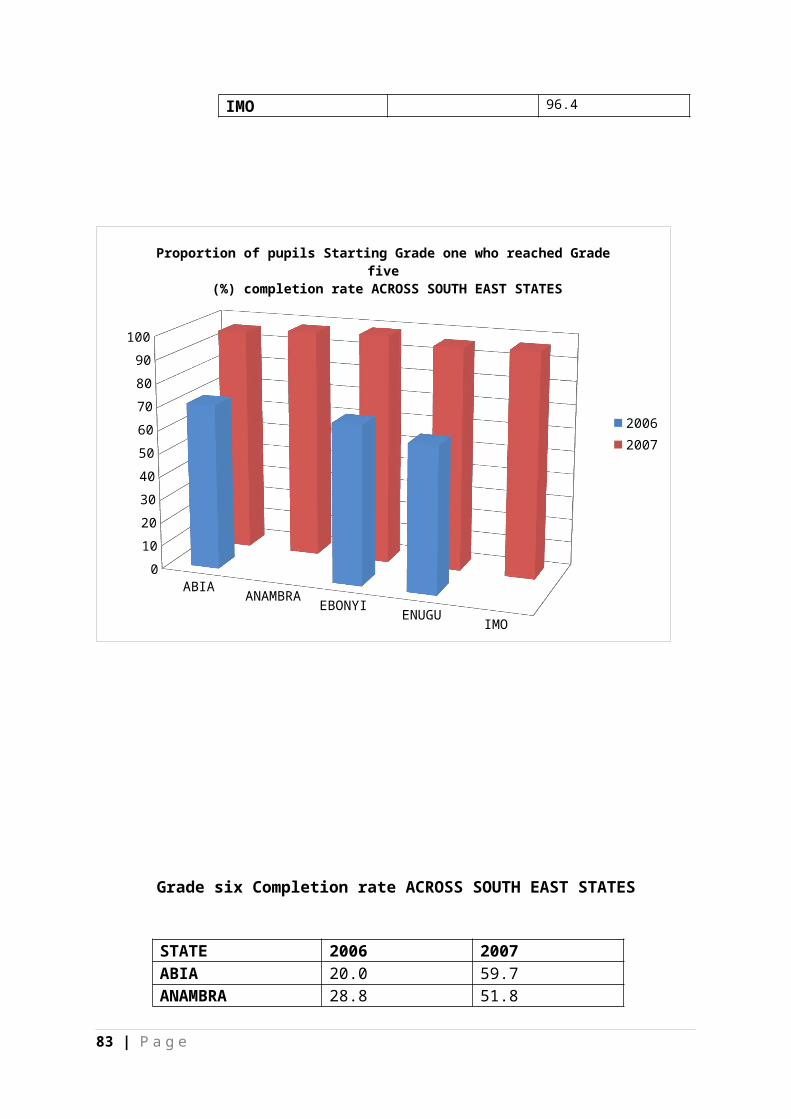
IMO 96.4
ABIA ANAMBRA EBONYI ENUGU IMO
0102030405060708090
100
Proportion of pupils Starting Grade one who reached Grade five
(%) completion rate ACROSS SOUTH EAST STATES
20062007
Grade six Completion rate ACROSS SOUTH EAST STATES
STATE 2006 2007ABIA 20.0 59.7ANAMBRA 28.8 51.8
83 | P a g e
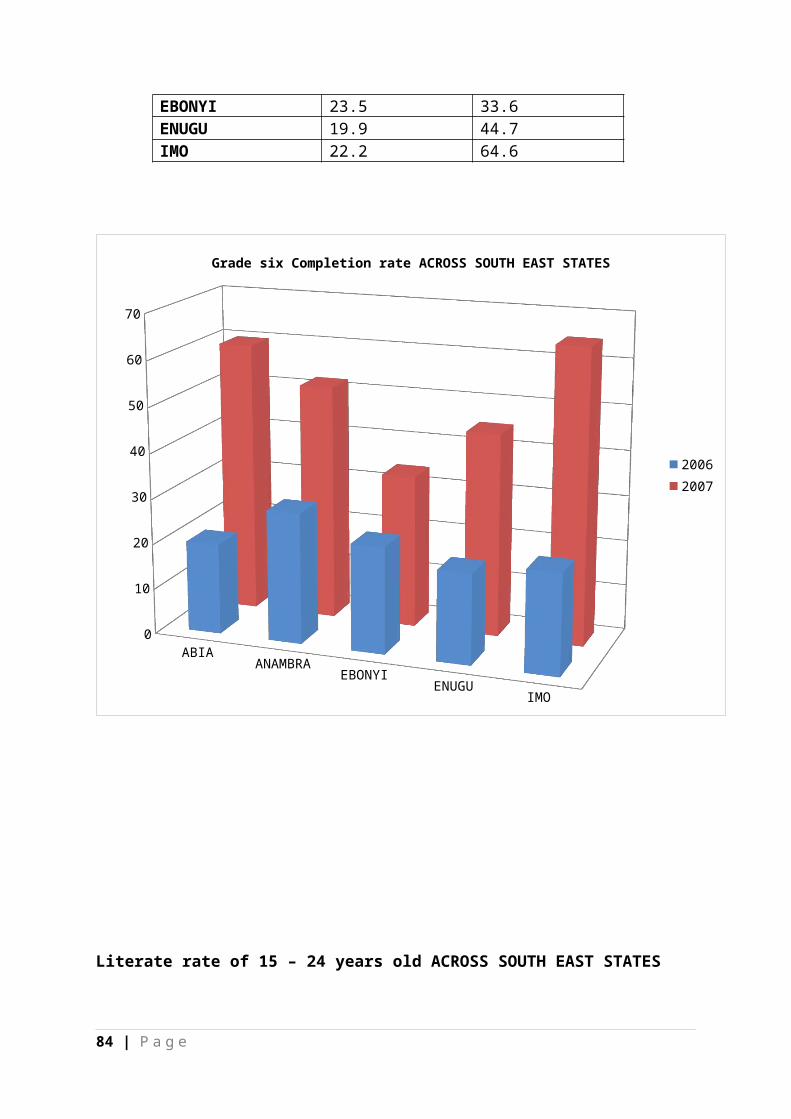
EBONYI 23.5 33.6ENUGU 19.9 44.7IMO 22.2 64.6
ABIAANAMBRA
EBONYI ENUGU
IMO
0
10
20
30
40
50
60
70
Grade six Completion rate ACROSS SOUTH EAST STATES
20062007
Literate rate of 15 – 24 years old ACROSS SOUTH EAST STATES
84 | P a g e

STATE 2004 2005 2006ABIA 82.33 82.50 82.33ANAMBRA 78.38 78.60 94.0EBONYI 66.28 67.30 85.9ENUGU 73.27 74.20 96.2IMO 83.61 35.00 92.7
ABIA ANAMBRA EBONYI ENUGU IMO
0102030405060708090
100
Literate rate of 15 – 24 years old ACROSS SOUTH EAST STATES
200420052006
85 | P a g e

Ratio of girls to boys in prim. Education (girls per 100 boys)ACROSS SOUTH EAST STATES
STATE 2004 2005 2006 2007Girls Boy Girls Boy Girls Boy Girls Boy
ABIA 0.97 1.03 0.95 1.05 1.00 0.99 1.01 1.0ANAMBRA 1.03 0.82 1.03 0.97 0.98 1.02 1.00 1.0
0EBONYI 1.02 0.99 1.02 0.98 1.03 0.97 0.95 1.0
6ENUGU 0.98 1.02 0.98 1.02 0.98 1.02 1.01 .99IMO 0.95 1.05 0.99 1.01 0.88 1.14 1.02 0.9
8
ABIA ANAMBRA EBONYI ENUGU IMO0
0.2
0.4
0.6
0.8
1
1.2
Ratio of girls to boys in prim. Education (girls per 100 boys) ACROSS SOUTH EAST STATE
Girls (2004)Boys (2004)Girls (2005)Boys (2005)Girls (2006)Boys (2006)Girls (2007)Boys (2007)
86 | P a g e
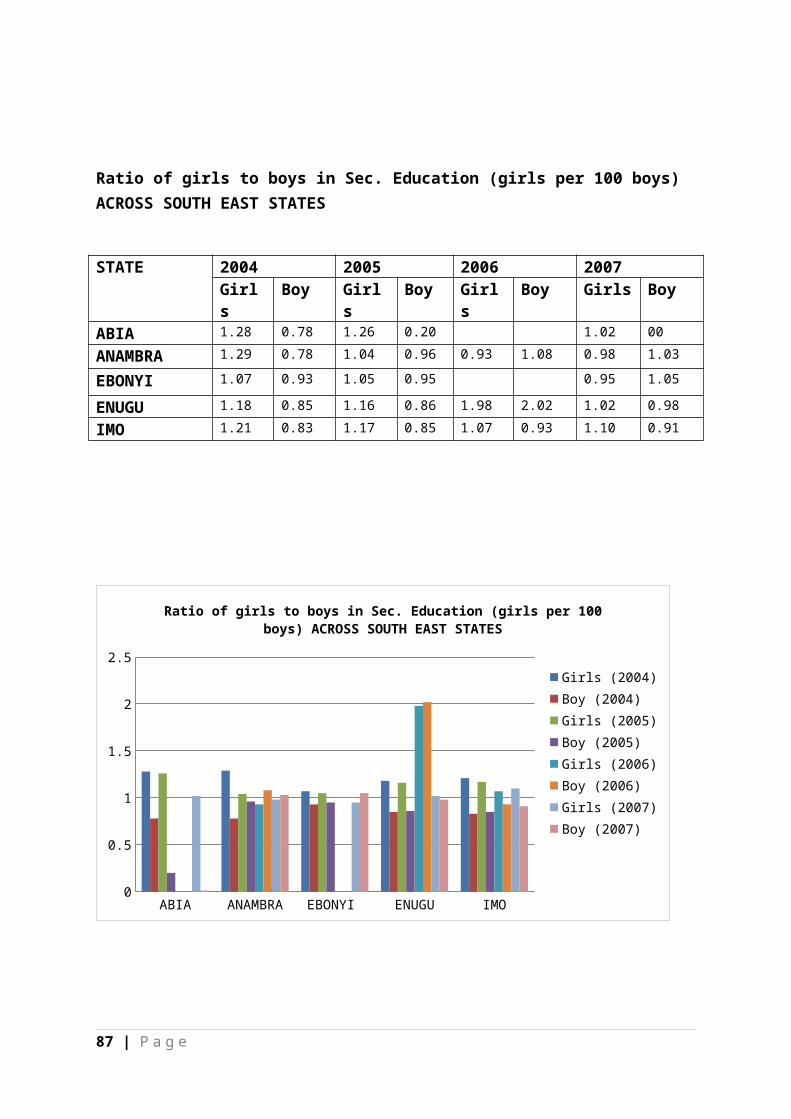
Ratio of girls to boys in Sec. Education (girls per 100 boys) ACROSS SOUTH EAST STATES
STATE 2004 2005 2006 2007Girls
Boy Girls
Boy Girls
Boy Girls Boy
ABIA 1.28 0.78 1.26 0.20 1.02 00ANAMBRA 1.29 0.78 1.04 0.96 0.93 1.08 0.98 1.03
EBONYI 1.07 0.93 1.05 0.95 0.95 1.05
ENUGU 1.18 0.85 1.16 0.86 1.98 2.02 1.02 0.98IMO 1.21 0.83 1.17 0.85 1.07 0.93 1.10 0.91
ABIA ANAMBRA EBONYI ENUGU IMO0
0.5
1
1.5
2
2.5
Ratio of girls to boys in Sec. Education (girls per 100 boys) ACROSS SOUTH EAST STATES
Girls (2004)Boy (2004)Girls (2005)Boy (2005)Girls (2006)Boy (2006)Girls (2007)Boy (2007)
87 | P a g e
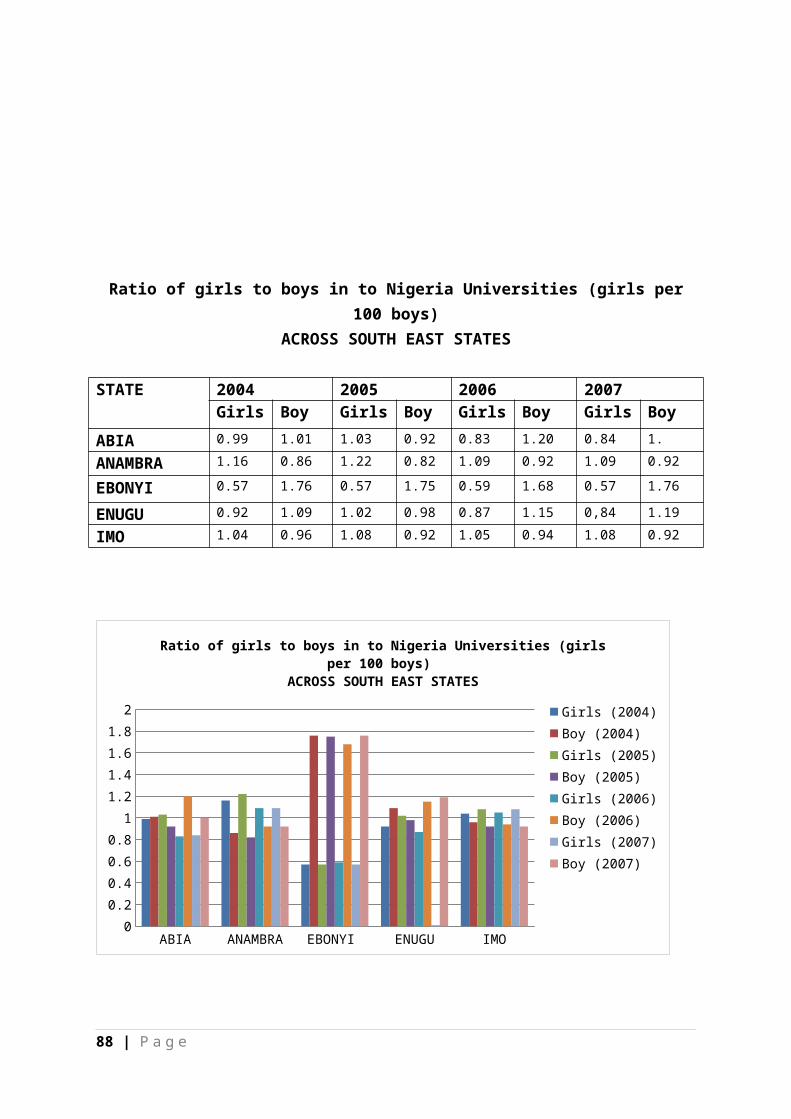
Ratio of girls to boys in to Nigeria Universities (girls per100 boys)
ACROSS SOUTH EAST STATES
STATE 2004 2005 2006 2007Girls Boy Girls Boy Girls Boy Girls Boy
ABIA 0.99 1.01 1.03 0.92 0.83 1.20 0.84 1.ANAMBRA 1.16 0.86 1.22 0.82 1.09 0.92 1.09 0.92
EBONYI 0.57 1.76 0.57 1.75 0.59 1.68 0.57 1.76
ENUGU 0.92 1.09 1.02 0.98 0.87 1.15 0,84 1.19IMO 1.04 0.96 1.08 0.92 1.05 0.94 1.08 0.92
ABIA ANAMBRA EBONYI ENUGU IMO0
0.20.40.60.81
1.21.41.61.82
Ratio of girls to boys in to Nigeria Universities (girls per 100 boys)
ACROSS SOUTH EAST STATES
Girls (2004)Boy (2004)Girls (2005)Boy (2005)Girls (2006)Boy (2006)Girls (2007)Boy (2007)
88 | P a g e
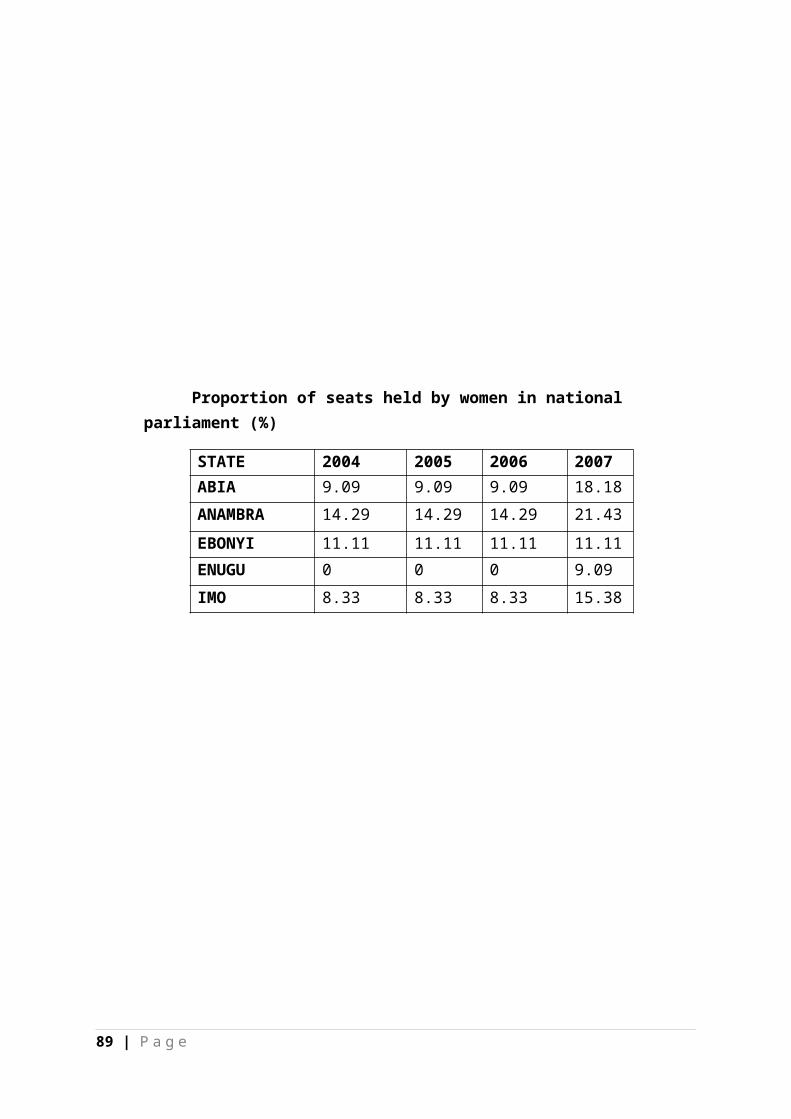
Proportion of seats held by women in national parliament (%)
STATE 2004 2005 2006 2007ABIA 9.09 9.09 9.09 18.18ANAMBRA 14.29 14.29 14.29 21.43EBONYI 11.11 11.11 11.11 11.11ENUGU 0 0 0 9.09IMO 8.33 8.33 8.33 15.38
89 | P a g e
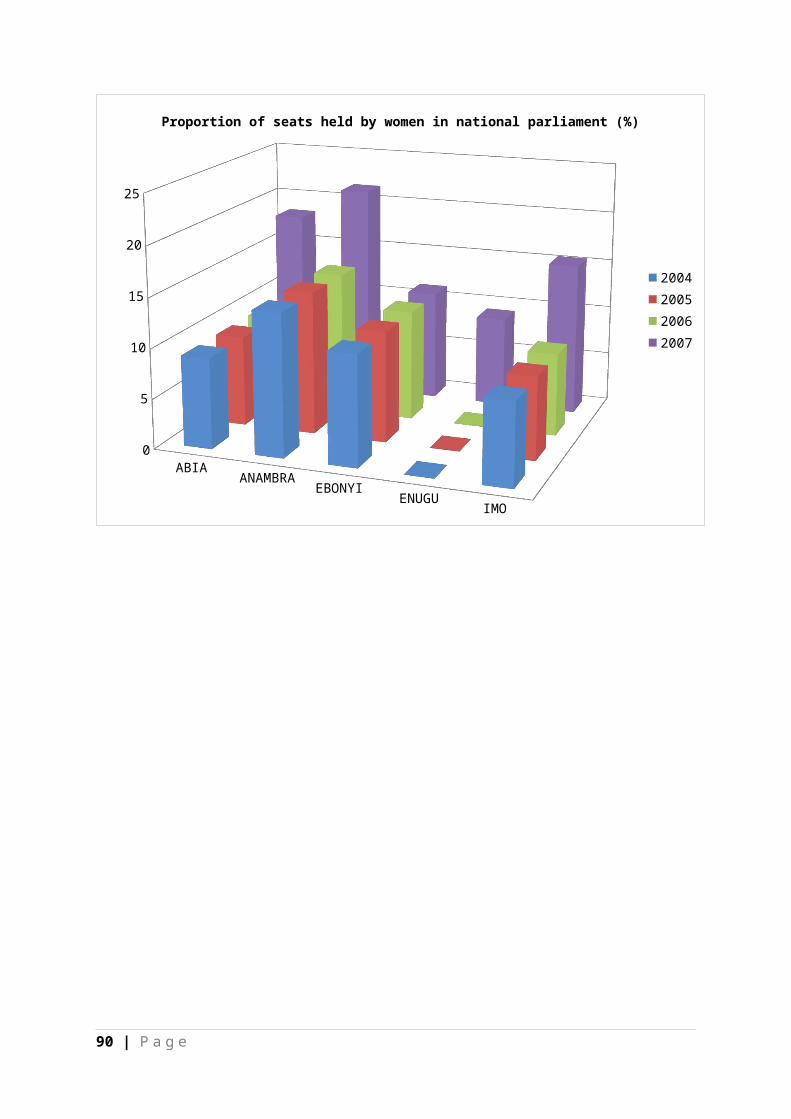
ABIA ANAMBRA EBONYI ENUGU IMO
0
5
10
15
20
25
Proportion of seats held by women in national parliament (%)
2004200520062007
90 | P a g e
Copyright © 2022 FDOKUMEN