College education and the poor in China: documenting the hurdles to educational attainment and...
40
Working Paper 213 January 2011 reapchina.org/reap.stanford.edu College Education and the Poor in China: Documenting the Hurdles to Educational Attainment and College Matriculation Xiaobing Wang, Chengfang Liu, Linxiu Zhang, Renfu Luo and Thomas Glauben, Yaojiang Shi, Scott Rozelle, Brian Sharbono Abstract Although universities have expanded in size, it is unclear if the poor have benefited. If there are high returns to college education, then increasing access of the poor to college has important welfare implications. The objective of this paper is to document the rates of enrollment into college of the poor and to identify the hurdles to doing so. Relying on several sets of data, including a survey of college students from universities in three poor provinces in China, we have found that the college matriculation rate of the poor is substantially lower than students from nonpoor families; the same is true for rural women and minorities. Clearly, there are barriers that are keeping the rural poor out. The paper also demonstrates that the real hurdles are not during the years of secondary schooling or at the time of admissions to college. The real impediments keeping the rural poor from pursuing a college education arise long before high school—as early as preschool and elementary school years—and are present throughout the entire schooling system. JEL: I29; I30; O53 Keywords: higher education, hurdles to educational attainment, China, rural, poverty
Transcript of College education and the poor in China: documenting the hurdles to educational attainment and...

Working Paper 213 January 2011
reapchina.org/reap.stanford.edu
College Education and the Poor in China: Documenting the
Hurdles to Educational Attainment and College Matriculation Xiaobing Wang, Chengfang Liu,Linxiu Zhang,Renfu Luo and Thomas Glauben, Yaojiang Shi, Scott Rozelle, Brian Sharbono Abstract Although universities have expanded in size, it is unclear if the poor have benefited. If there are high returns to college education, then increasing access of the poor to college has important welfare implications. The objective of this paper is to document the rates of enrollment into college of the poor and to identify the hurdles to doing so. Relying on several sets of data, including a survey of college students from universities in three poor provinces in China, we have found that the college matriculation rate of the poor is substantially lower than students from non-‐poor families; the same is true for rural women and minorities. Clearly, there are barriers that are keeping the rural poor out. The paper also demonstrates that the real hurdles are not during the years of secondary schooling or at the time of admissions to college. The real impediments keeping the rural poor from pursuing a college education arise long before high school—as early as preschool and elementary school years—and are present throughout the entire schooling system. JEL: I29; I30; O53 Keywords: higher education, hurdles to educational attainment, China, rural, poverty

1
College Education and the Poor in China: Documenting the Hurdles to Educational Attainment and College Matriculation
Going to college is increasingly an option for students in China. Fiscal allocations
by the government into the university system have risen in the past ten years, increasing
by an annual real growth rate of over 13 percent between 1997 and 2006 (CNBS, 2007a).
The nation’s total spending on tertiary education is ahead of many Asian developing
countries, e.g., India and Indonesia, with similar age structures (UNESCO/OECD, 2002).
More than 800 new comprehensive universities (or colleges—the word we use to mean
both universities and colleges in the rest of the paper) and professional tertiary schools
were established. There are now nearly 2000 colleges in China. Enrollment rates have
also risen. Between 1997 and 2008, the number of college students increased from 3 to 17
million.
The demand for a college education is also high, reinforcing the supply-side shifts.
Graduating from college is increasingly thought to be the most important criterion for
employment in professional, managerial and other technically-oriented jobs. As such, the
return to a college degree is high, about 23.1 percent (Fleisher et al., 2007). Although
there is a perception that getting a job after graduating from college is still difficult, in
fact, almost all college students find a job within a year and their slope of earnings rise is
steep (Cai et al., 2007).
College education is also important because it is so tightly linked to productivity,
creating spillovers into the student’s community in both China and the rest of the world.
Growth rises in countries with higher rates of higher education (Barro, 1991). As nations,
including China become richer, growth will depend on industries and services that are

2
more sophisticated and complex, meaning more and more careers will require tertiary
education. In addition, college education in Southeast Asia/Pacific and South Asia not
only significantly benefits the individuals that pursue advanced degrees through the high
returns to education, it can also have strong and transformative impacts on the
communities from which the graduates have come (Gibson and McKenzie, 2009;
Bhagwati and Rao, 1999). Boucher et al. (2005) also document that there are substantial
“brain gains” in Latin America when poor communities are able to send one of their own
to college. Finally, in the United States it is also becoming increasingly evident that
educated individuals are more likely to be more socially responsible, be sympathetic to
philanthropy and subscribe to personal values—such as tolerance and an appreciation of
differences among citizens of ethnicity and culture—that are crucial for the healthy
function of modern, diverse society (Glaeser et al., 2006; Dee, 2004).
Given these benefits to college education and since China’s leaders have launched
one of the greatest campaigns on rural development in the past five years (State Council,
2006), it is natural to ask if rural students, especially those from poor rural areas, are
benefiting. Specifically, who is getting the opportunity to go to college and earn these
high rates of return, are the rural poor being systematically excluded? If they are, what
are the barriers that are keeping them from having access to higher education? At what
age (or level of schooling) are the barriers the most limiting?
In this paper we seek to address this issue of educational access for the rural
population, and we further seek to identify, if access is not good, why rural students are
deciding not to go to college at such a high rate. We will pursue three specific objectives.
First, we will try to measure enrollment rates in college of students from poor rural areas.

3
Second, we examine if there are any anti-poor biases in the College Preparation and
Admission (CPA) Process that are keeping poor rural high school students from
continuing their studies into college. The CPA Process is defined in the paper as all of the
events that occur between the time a student has already made it into an academic high
school and the time that he/she matriculates into college. Third, we are also interested in
identifying what other factors are impeding the progress of poor, rural students—from the
time before the student enters primary school until the point of time that he/she graduates
from junior high and is able to enter academic high school (or decides to take another
path).
Data
In this paper we use two sets of our own survey data. The first survey covers a
group of randomly selected high school students from the poor parts of Shaanxi province,
one of China’s poorest provinces. In the rest of the paper this survey is called the
Academic High School Survey (or the AHS Survey). In order to identify the poor students,
the initial step of the survey was to conduct a canvas survey in May 2007. At that time
the sample students were still in their second year of senior high school. In the canvas
survey, eight poor counties in Shaanxi were randomly selected: Hengshan, Mizhi,
Yanchang, Yichuan, Zhashui, Danfeng, Ziyang and Ningshan. Altogether we sampled 10
senior high schools in the eight counties, one per county, except for the two counties with
the largest populations (in which two sample schools were selected). The survey team
randomly chose two classes of grade two (gao-er) per school. There were more than 50
students per class. The total sample size was 1,177.

4
The sample students filled out a survey instrument that collected information on
several different aspects of each student’s education experience and family life. We
collected information each respondent’s age and gender and his/her subject of study
focus—either Li-ke (a science and engineering track student); or Wen-ke (a humanities
and social science track student). We also asked each student to report the score that
he/she achieved on the high school admissions exam. Another block of the survey
collected information on the age of the parents, their level of educational attainment,
occupation, migration status, their current location of residence (at home or away from
home) and the value of the household’s assets.
One of the main uses of the survey was to use it as a tool to collect information
that could be used to find a set of students that was truly poor. We identified the truly
poor students by using three pieces of information coming from the three independent
survey efforts we executed in each school. The first piece of information came from a
section of the student survey. Each student was asked to fill out a check list of the durable
assets owned by his/her household. Once a value was attached to each asset (based on the
national Household Income and Expenditure Survey which is organized and published by
the China National Bureau of Statistics—CNBS, 2007b), we had a single metric of the
asset holdings of each student’s household. The second piece of information came from
the survey effort that was directed at the homeroom teacher. In a separate sit-down survey
conducted at that same time that the student surveys were occurring, enumerators asked
the homeroom teacher to provide a list of the 10 poorest students in his/her class. We
obtained the last piece of information from a similar survey conducted with the director
in charge of student affairs at each high school. Enumerators asked this respondent (in the

5
same way that the homeroom teacher was asked) for an independent list of the 10 poorest
students in each of the sample classes. These three pieces of information were then used
to identify 592 students in our sample (out of a total of 1,177 students) that were from
poor rural families. Our discussion hereafter focuses mostly on the poor (n1=592) and
non-poor (n2=585) sample high school students.
In order to collect information on our dependent variables—those associated with
the CPA process, we conducted a second round of surveys of our sample students and
their homeroom teachers in August 2008. By this time, the sample students had already
received their offer letters from colleges and knew if they had been admitted to a tier one
or tier two college. The data came from the homeroom teachers of the students and from
the students themselves. From a survey instrument that included the names of all of their
students (both poor and non-poor students), we asked each homeroom teacher to collect
information on students, including each student’s gaokao score, zhiyuan (the choices of
college on his/her college application form) and the exact college into which they were
able to enroll (if any). We also contacted all of the students themselves by phone and
discovered whether or not each student had received an offer of admission and whether or
not they were able to matriculate. If the students were able to matriculate this meant that
their family was able to pay a set of tuition and fees or, at the very least, make
arrangements for payment at a later date.
Finally, during this time we also collected information about the college and
major to which the students chose to go as their first choice (on the zhiyuan form). We
were most interested in getting the published CPA score cutoffs for the previous year,
2007, for each student’s first choice. The CPA score cutoffs for each university (by major)

6
were attained from a compilation published by College Admission Magazine in 2008
(which is a publication supported and authorized by the Division of Student Affairs,
Ministry of Education). Having this information was useful since it is one of the most
important pieces of information that students use when deciding to what college/major
they should apply.1
The second survey is actually a complete census of all entering freshman in 2008
into four universities—two nationally-supported universities (Xi’an Jiaotong University
and Sichuan University) and two provincially-supported universities (Anhui University
and Northwest University in Xi’an). These four universities are located in three poor
provinces—Shaanxi, Sichuan and Anhui. For clarity, we call this survey the University
Matriculation Survey.
In order to implement the University Matriculation Survey, the division head of
the student affairs office in each university assigned a team to make sure that the survey
form was distributed to each student at some point of time during the first week of the
academic year. In this way, a set of survey forms was distributed to each banzhuren,
which is the equivalent of a homeroom teacher in US high schools. The banzhuren were
given directions on how to fill out the form. Students were told that the survey was
voluntary. Students also were told that the survey was for research purposes only. The
students returned the completed forms to the banzhuren and the forms were returned to
the research team by the end of the second week of September, the second week of the
first term of all of the freshman students. The response rate was higher than 99 percent. In
total, we surveyed 20,253 students.
1 Under the college/major choice system within the CEE in 2008 in Shaanxi province, students must list their preferred college/majors before knowing the year’s cutoffs. Students rely on the previous year’s cutoff information for a best estimate of what the cutoff’s will be for current year.

7
The Rural Poor and College Matriculation
The first step to understanding if students from poor rural areas are being
systematically excluded from college is to assess promotion rates from high school to
college. At the national level, the rate of promotion of senior secondary school students
from high school into tier one, two and three universities is around 35 percent (MOE,
2006). This figure is calculated as the ratio of first year college students (newly
matriculating college students or NMCS) in 2005 and to high school graduates (HSG)
during the same year. The ratio is NMCS/HSG. The number that represents NMCS is
composed of two parts—one part is first year college students that matriculated directly
out of high school (that is they graduated from high school two months before starting
college (NMCS1) and those that graduated from high school at least one year earlier, but
for some reason did not matriculate to college during the year in which they graduated
(NMCS2). The share of the total number of newly matriculating college students (NMCS)
that are of the type NMCS2 is around 10 percent (www.huayu.com). Thus, the rate of
promotion of senior secondary school students from high school into tier one, two and
three universities should be adjusted down by about 3 to 4 percentage points to 31 percent
at the national level.
Although opportunities to go to college are increasing, the opportunities for
different groups in China have unfolded unequally. Most poignantly, nearly 54 percent of
senior high students living in three metropolitan province-level cites (Beijing, Tianjin,
and Shanghai) attend first, second or third tier colleges (CNBS, 2007a). In 2007, of the
268,000 students that graduated from high school in these three municipalities, 144,000

8
were able to attend a first, second or third tier college. This level (54 percent) is 23
percent higher than the national average (31 percent).
If better off urban areas send their students to college at much higher rates, it
stands to reason that poorer rural areas most likely are under-represented. In fact, it is
widely surmised in the literature (although mostly without empirical evidence) that poor
rural areas have been lagging in China’s continuing drive to develop college education
(China View, 2009). Unfortunately, published statistical sources do not provide
information on college enrollment rates by urban and rural (or by rich and poor).
Therefore, we need to rely on our own calculations. As the national average rate
of promotion to college is, in effect, an average of urban and rural rates weighted by their
respective proportion of the national graduating high school class, we can extract a rough
estimate of the rural rate of promotion to college using the national statistic (31 percent)
and our estimate of the urban rate (54 percent) from above. The formula we use is:
National average rate of promotion to college = (urban rate of promotion × % senior high graduates that are urban) + (rural rate of promotion × % of senior high graduates that are rural) or 0.31 = 0.54 × 40% + rural rate × 60%.
From this calculation, we estimate that the rural rate of promotion from high school to
college is 16 percent.
As it turns out, we can also estimate the rural rate directly from the AHS Survey.
According to the survey data, only 20 percent of students from poor rural areas were
promoted from high school to first, second and third tier colleges. Assuming that
promotion rates of rural students are similar in other poor provinces, it is clear to see that
poor rural students are not getting equal access to college. While promotion rates of

9
students in well-off urban areas are more than 20 percent higher than the national average,
promotion rates of students from poor, rural areas are 11 to 15 percentage points lower
than the national average.
However, just as the urban rate of promotion is a composite of the urban (not poor)
and “urban-suburban” (more poor) rates, so must the rural rate of promotion be a
composite of the rural (poor) and “rural-suburban” (less poor) rates. Rural poor areas also
include some students from non-poor households. For this reason, both our indirect
estimate (16 percent) and our direct estimate (20 percent) most likely overstate the rate
that the poor in poor rural areas are being promoted to college.
The bias against poor, rural students can also be seen when looking at the data
from the University Matriculation Survey. Since this survey only has information on
those students that gained promotion into a university (and not on those students that did
not matriculate), the strategy for making an assessment about whether or not there are
biases against poor rural students must be different than when using the AHS Survey. To
do so with this dataset we first calculate a specific group’s share (e.g., rural students) of
enrollment in the sample colleges compared to the group’s share in the population as a
whole. If the share of a group (e.g., students from urban areas) exceeds its population
share, we say this group has an “advantage;” if the share of a group is less than its
population share, we say that there is some sort of bias restricting access of this group to
college.
Most basically, according to our data from the University Matriculation Survey,
we find that there is bias against rural students. The enrollment rates of students from
urban areas and rural areas are almost even: 51 percent are from urban areas and 49

10
percent are from rural areas (Table 1, column 3, rows 2 and 3). However, the share of the
18 to 21 year old age rural cohort in the total (rural + urban) 18 to 21 year old population
(60 percent—CNSB, 2007) is larger than the share of students from rural areas. In other
words, rural students matriculate at a lower rate than urban students. The share of rural
university students is 11 percentage points lower than its population share. In fact, the
gap is greater when using data on urbanization rates from Sichuan, Shaanxi and Anhui
provinces (the home provinces of the 4 universities in our sample). Using data from the
three provinces only, the share of students in the universities is 18 percentage points
smaller than the share of rural people in the overall population (67 percent).2
Following this approach, we see that there is even more of a bias against poor
rural students (even more than rural students in general). According to our data, the share
of sample students from poor rural areas is 9.5 percent (Table 1, column 5, row 2).3
Drawing on data from the 2006 yearbook, we can see the share of population living in
poor counties is 17 percent (CNBS, 2006). Since according to the same data source, 88
percent of those in poor counties live in rural areas, this means that the population share
of those in poor rural areas is 15 percent (0.88×0.17). From this it is clear that there is a
bias against these students; the share of students from poor rural areas is 5.5 percentage
points lower than the population share.
2 It is unclear if we should use population shares from the entire nation or just from the three provinces. If we had information on enrollment rates from the entire country (instead of only from four universities), we would of course use the national population shares. Unfortunately, we do not have a national representative sample. In contrast, if universities only recruited students from their own host provinces, then the right number to use would be those from the three provinces. However, in fact, universities do recruit students from the entire country. In fact, according to our data, 53 percent of the students (47 percent of rural students and 59 percent of urban students) in the four universities are from outside of their universities’ host provinces. Consequently, it is unclear what is the right number to use. Because most of the rural students are recruited from within the province, in the rest of the paper, we use the population shares from the three provinces only—except where otherwise noted. 3 Here, poor rural area refers to the rural areas in Nationally-designated Poor Counties, a designation bestowed on counties by the State Council. http://en.cpad.gov.cn/item/2004-05-24/50008.html.

11
Bias against rural girls and poor rural minorities
Using the University Matriculation Survey data, we can also calculate a specific
group’s share of enrollment in the sample colleges (e.g., rural female students). This
share can also be used to form a ratio of group share in college compared to group share
in the population as a whole. If the ratio is less than 1, it means this group is
underrepresented in the college education system. If the ratio is larger than 1, it means
this group is overrepresented.
According to our analysis, there is some discrimination again women, but, it is
almost fully in the case of rural women. In the case of urban women and urban men, there
is no real statistical difference. In the case of rural women, however, the ratio is
statistically significant and less than one. In other words, while the populatoin share of rural
women is 47.8; the share of rural women in college is only 33.7, 14.1 percentage points less
(Table 2, column 6, row 1-2).
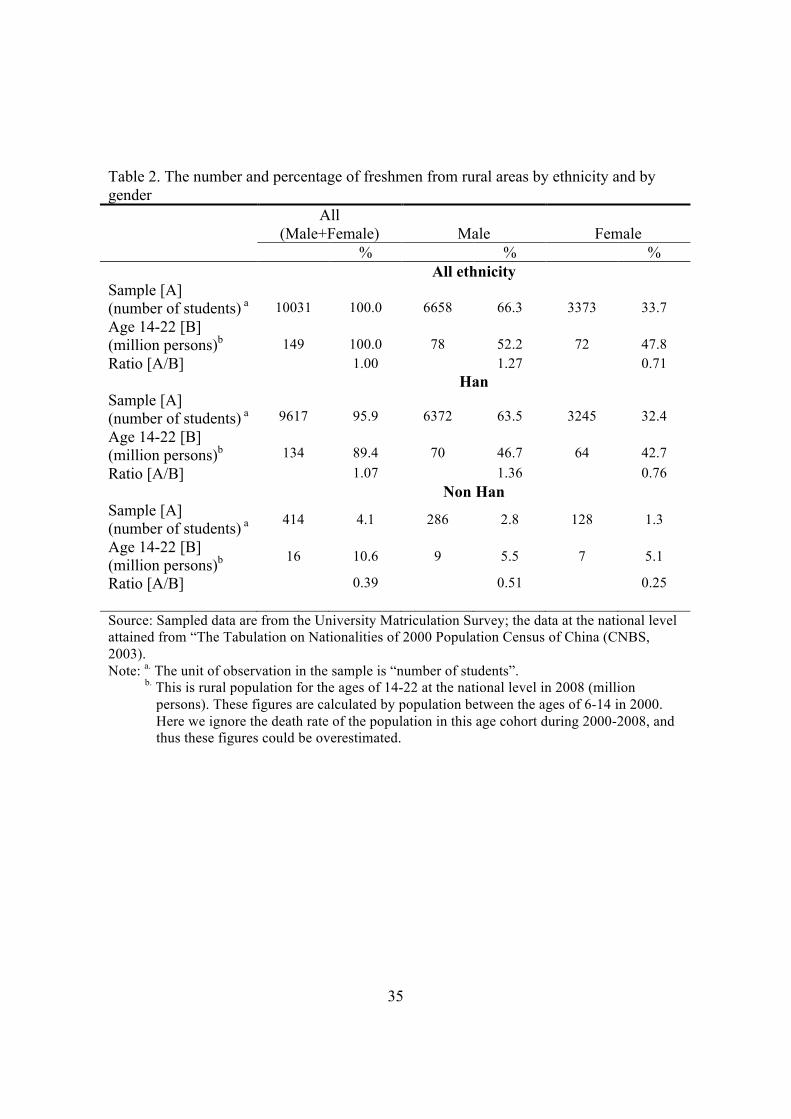
The most underrepresented group, however, are ethnic minorities. When
comparing Han to non-Han, we can see that minorities (non Han) are underrepresented
(Table 2, columns 1-2 and rows 7-9). Rural China’s 14 to 22 year old cohort is 89.4 percent
Han. However, 95.9 percent of the students in the University Matriculation Survey were
Han. This means, of course, that the representative ratios for non-Han are small. The ratio
of minorities as a whole is 0.39.
These ratios are even smaller in the case of rural female minority students (Table 2,
columns 5-6. row 7-9). For example, the representative ratio of rural minority female
students is only 0.25. Clearly the share of rural minority females who are able to attend
one of the four sample colleges is around one quarter of its population share.

12
In short, such findings demonstrate the low level of college matriculation of the
poor in China. To the extent that this demonstrates the inequality in China’s education
system, it shows that China is following a path that was not taken in the past by other
successful countries in the region that today are developed. For example, Vinod et. al.
(2000) shows that the US has always had fairly equitable levels of education. Likewise,
people in Japan and Korea have had relatively equal access to education in their nations.
China, in being different in this dimension, may be facing challenges that these other
countries were able to avoid.
Hurdles during Secondary Schooling
In this section we seek to identify why it is that so few students from poor rural
areas are in China’s colleges. There are two possible sets of barriers. The first set includes
the obstacles to the progress of students after they test into secondary school (or high
school) and before the time that they officially matriculate into college. This section will
focus on this set of obstructions, which we call “hurdles during secondary schooling.”
The second set of barriers, discussed in the next section of the paper, examines barriers
that are regularly encountered by students in poor rural areas before they test into high
school.
Hurdles during the High School Years
Once students from poor rural families get into high school, there are two types of
barriers that they could face—those that occur during the three years of high school and
those that arise during the CPA Process. To examine these hurdles during the three years

13
of high school, we examine two sets of indicators collected as part of the AHS Survey.
First, we examine if the grades of poor students are lower. Second, we exam if the
dropout rate of the non-poor is lower than that of the poor.
According to both measures (grades and dropout rates), it does not appear as if the
barriers exist between the time students matriculate into high school and the time that
students take the college admissions exam or gaokao. For example, the data on the
standardized grades collected for the sample students from their first and second years of
high school clearly show that the average math (65/100) and Chinese language scores
(66/100) of students who are poor are similar to the average math (64/100) and Chinese
language scores (67/100) of students who are non-poor, respectively. The results of test
scores of the poor and non-poor are statistically indistinguishable.
There also is evidence that dropout rates of poor and non-poor high school
students are statistically identical. According to our data, the dropout rate of poorer
students is only slightly higher than for non-poor students. Between the end of the second
year of high school and the end of the third year of high school, we found that 3.7 percent
of poor students dropped out. At the same time 2.1 percent of non-poor students dropped
out. These two dropout rates were statistically the same due to high variance of both.
Barriers during the CPA Process
For our application it is convenient to think of the CPA Process in 2008 in
Shaanxi province as consisting of three steps. First, students take the college admissions
exam. Second, after finishing the examination (but before knowing their exact score),
students then fill out a college application form, called the zhiyuan. Finally, if their CEE

14
scores are high enough, and their choice of college (which was chosen when filling in
their zhiyuan) is strategically chosen (that is, the cutoff of the college for which the
student filled in on their zhiyuan is not too high for their actual exam score), the students
must have the financial resources to pay their tuition and fees, the final step before
matriculating into college.
Using this three-step CPA process, we rely on data from the AHS Survey to
identify the barriers at each step. First, we will examine if there is any evidence that the
college admissions examination is biased against poor rural students. Given that those
who write the exam are almost certainly more urban-focused in their lives, it could be
that rural students are at a disadvantage when it comes to taking the exam. However,
according to our data on CEE performance of poor and non-poor students there is no
evidence that there is any bias against poor students. Specifically, in seven out of the
eight Li-ke classes, there were no statistical differences between the scores of poor
students and the scores of non-poor students. In six out of seven Wen-ke classes, there
were no statistical differences either. In other words, our data show that poor students
appear to be performing as well on the CEE as non-poor students. Overall in Li-ke classes
the standardized score of poor students was 0.02 and the standardized score of non-poor
students was -0.03 (demonstrating that the point estimates of the poor were actually a bit
higher). Overall in Wen-ke classes the standardized score of the poor was 0.03 and the
standardized score of the non-poor was -0.03 (also demonstrating the point estimate of
the poor was higher than the non-poor).
The similarities in scores are also shown by graphing the distribution of the CEE
scores for both poor and rich students. Figure 1, panel A demonstrates that poor Li-ke

15
students have almost the exact distribution as non-poor Li-ke students. Likewise, Figure 1,
panel B demonstrates the same for Wen-ke students. The distributions are almost identical.
Using the same information on the college admissions exam scores of the students
in conjunction with information about the scores from the high school entrance exams
(from three years before—that is, their zhongkao scores), there also is no evidence that
poor students are falling behind during high school. The decomposition of college
admissions exam scores by historical performance (using zhongkao scores as measures of
historical performance) confirms the conclusion that there is no systemic difference
between the poor and non-poor at this stage of the academic process (Table 3a and 3b). We
can more clearly show this by dividing poor and non-poor students into quartiles,
according to their zhongkao scores. Using these breakdowns, we examine if there is any
change in performance. For the group of those in the upper quartile of zhongkao scores
(regardless of whether they were in the Li-ke or Wen-ke tracks of study), the college
admissions scores of the poor, on average, are not statistically different than those of the
non-poor. The same is true in the other three quartile groups. This set of findings implies
that after three years of high school study, the poor are not lagging behind the non-poor in
terms of being competitive in the CPA Process. One interpretation of this finding is that
students from poor families are performing as well on the gaokao as they did on the
zhongkao.
Finally, multivariate analysis supports the descriptive results. Table 4 presents the
results of a regression seeking to explain the college admissions exam scores. The
variable of interest, in this case, is the student’s poverty status. In other words, we want to

16
see if, holding other things constant, the poverty status of a student is a significant
correlate of his or her performance on the CEE.
To show this, in the regression analysis we use two kinds of variables to proxy a
student’s poverty status. In one version of the regression, we use a simple dummy
variable, where the variable is equal to 1 if the student is from a poor family (that is, a
family with assets less than 7600 yuan). We also use an alternative measure, the log of
the family assets in value terms. However, since the college admissions exam score may
also be influenced by other factors, such as the characteristics of the student;
characteristics of the parents; and whether or not they are in the Li-ke or Wen-ke track of
study, control variables also are included to control for these factors. When running these
regressions, we find that neither poverty status nor the value of family’s asset holdings
affects a student’s CEE scores, ceteris paribus (Table 4, row 2 and 3).
Are poor students making mistakes in filling out their zhiyuan forms?
Within several days of completing the college admissions exam in 2008, students
in Shaanxi fill out a college choice form (called the zhiyuan form) and submit their top
choices in each of the different tiers of colleges (tier one, tier two and tier three) to a
provincial education authority. In filling out their zhiyuan form, students are able to
choose several colleges within each of the college tiers. After the CEE scores of the
students are tallied, admission authorities then sort through the zhiyuan forms, matching
students to colleges/majors according to their score ranking. At the end of the sorting,
students are assigned to one and only one college.

17
Mistakes can be made by students in this process. The main source of the problem
is that when students in Shaanxi in 2008 are filling out their zhiyuan form, they do not
know what their actual college admissions score is (the exam does not get graded or
returned to the student until about three weeks after the zhiyuan form is handed in).
Another problem is that even if the student knew the actual score, he/she does not know
in any given year what the minimum score cutoff will be for any given college/major.
The minimum score that allows a student to enter any given college/major is determined
by the demand for the college/major by students, the supply of positions for the
college/major by colleges and the distribution of the college admission exam in any given
year. Therefore, when making a decision about to which college/major one should apply,
students often rely on cutoff scores (by college/major) from previous years that are
published in a Ministry of Education-approved publication. The objective when filling
out the zhiyuan is to put down as one’s first choice the best college/major that one can get
into, given one’s CEE score. A successful strategy for filling in the zhiyuan form depends
on good estimates of one’s own actual score and good estimates of the cutoffs for the
various college/majors that one is interested in.
To examine if the poor make mistakes in estimating the college admission exam
score (and/or the cutoff), we first calculate the differences between the student’s actual
exam score and the past cutoff score of their first choice for either the tier one or tier two
college in each student’s zhiyuan form. We call this measure the gaokao score-cutoff gap.
In the analysis, for clarity, we only report the score-cutoff gaps for the first choice for the
first (second) tier college choice for the students that were admitted into first (second) tier
universities. If the score-cutoff gap is positive, then it means that the student chose a

18
cutoff that was lower than his/her college admission exam score (or, for simplicity,
underestimated the gaokao score). The consequences of underestimating, of course, is
that had the student chosen a college/major with a higher cutoff (that often means the
college/majors was higher quality), the student could have attended a better college or
been admitted to a better major. If the score-cutoff gap is negative, we say that the
student overestimated his/her college admissions score and this means that he/she was not
admitted (on average) into the college/major that was his/her first choice. The student still
ended up getting into a tier one (two) college, but, it would mean that he/she would be
allocated to a major that was second or third or fourth choice. In the analysis that follows
we report and compare the score-cutoff gaps for the poor and non-poor and do so for both
Li-ke and Wen-ke separately.
The results indicate that, on average, both the poor and non-poor in the Li-ke
tracks underestimated their CEE scores (Table 5, rows 1 and 2). The point estimate of the
score-cutoff gap of poor tier one students (30) was higher than that of non-poor tier one
students (25). The higher score-cutoff gap for the poor means that the poor were more
conservative or were not as good at estimating their CEE scores as the non-poor. Tests
comparing these point estimates, however, show that there is no difference statistically. In
the case of tier two students, the poor (10) underestimate less than non-poor students (23)
and the difference is statistically significant. However, in the case of both tier one and tier
two Wen-ke track students, there also is no statistical difference between the score-cutoff
gaps of poor and non-poor students.
Liquidity constraints and college matriculations

19
Although the expansion in college education has opened up more opportunities
for students in China to go to college, it has not been free for students and their families.
Among other things, it has come at the cost of soaring tuition and fees. Tuition costs rose
by four times between 1997 and 2006, increasing from 1,620 yuan to 4,500 yuan per
student per year (Yu, 2008; Cui, 2007). By 2005 the share of college funding from tuition
and fees had increased to 31 percent (MOE, 2006). And, tuition is only about half of the
cost of a college education (often less than half). Most college students spend between
10,000 to 12,000 yuan per year on tuition and fees, books and rooms and board (Cui,
2007). This implies that in addition to overcoming the academic hurdle of getting into
college, poorer families also have to face the fact that they have to pay for the higher
levels of tuition and fees (at least for the first year of their college education). The
expense of around 10,000 yuan equals 9.4 times of per capita income for a rural family
that is living at China’s poverty line—which was 1,067 yuan per capita in 2008 (Poverty
Alleviation Office, 2008). Are the families of poor college students in 2008 able to come
up with the tuition and fees that they need to pay for their first year of tuition and fees? In
other words, is there any evidence that there are liquidity constraints that are literally
turning back poor rural students from the gates of the university after they have passed
their college admissions examination and received an offer of admission.
Although in the late 1990s and early 2000s, there were many stories of students
being admitted to college but not able to afford to attend (e.g., People’s Daily, 2003a),
according to our survey, this is not true in 2008. In fact, 100 percent of the students that
passed the CEE and were admitted to a tier one or tier two college ended up going to the
college.

20
Although we are not making any statement about the impact on the financial
status of the family of the poor student (indeed, there are many stories of the incredible
burden that they bear—e.g., People Daily, 2003b), there is no evidence that the liquidity
constraint is posing an impermeable barrier at this point of the CPA Process. Of course,
in assessing this result it may not be so surprising. When a student, especially one that
had already made it through the third year of high school, was able to test into college,
the parents had already made up their mind and had already prepared some way to pay
the tuition and fees—even if they had to borrow or liquidate their assets. Those families
that had any doubts about being able to afford college most likely had already pulled their
child out of school and had him/her enter the labor market.
Other Barriers: From Preschool to High School
China has made great achievements in rural education over the past decade—
especially in compulsory education, which ends in China with grade 9. In the past five
years fiscal input by the national government has made grades 1 to 9 almost free. This
effort—and other factors—have contributed to making compulsory education universal.
Almost all children between the ages of 7 and 12 are in school. Girls attend elementary
and middle school at rates almost equal to boys (Hannum, Wang and Adams,
forthcoming).
High costs of high school education
While there has been progress in promoting higher education—both high school
and tertiary education—it is not because of reductions in tuition and fees. At the same

21
time that tuition and fees began to be reduced for elementary school and junior high, they
were being raised for high school and college. Although school costs are not trivial for
middle-class urban parents, they are extraordinarily high for families in poor rural areas.
While we know (from the discussion above) how high college tuition and fees are, in this
section we examine how high the tuition and fees are for high school.
According to a recent survey by the authors, the costs of high school tuition, room,
board and other fees in rural areas is also extremely high (Liu et al., 2009b). On average,
students pay around 2200 yuan per year for tuition. High school students who are from
remote villages and townships almost invariably have to live at school, which costs about
1600 yuan. This means that three years of high school can cost a poor family nearly
12,000 yuan. For a family that is living at the poverty line, this means that it takes about
12 times of per capita annual income to pay for high school. When comparing the tuition
of China’s rural public high schools against the levels of tuition for rural public high
schools in more than 40 other countries (Liu et al., 2009b), it is clear that China is an
extreme outlier. Only 20 percent of countries charge for high school at all; China is more
than 60 percent higher than the average of the second, third, fourth and fifth ranked
countries.
Despite these high expenses, many families in China—urban and rural, even
parents of households from the poorest, most remote parts of China—would like to send
their child to high school and college. The decision to pay out this amount of money,
however, depends on an assessment of the benefits. Several factors make the decision to
go to high school a difficult one to make. When a person decides to go to high school, the
cost is significantly higher than the “out-of-pocket” expenses, since he/she is able to enter

22
the work force and earn a wage; the foregone earnings can be substantial. The wage that a
student can earn after attending high school (if not continuing to university or to a
technical training/professional school) is about the same as the wage he/she would earn if
he/she entered the work force after junior high (Li et al., 2006). Finally, the decision also
depends on the probability that the student will pass the entrance exam, which is low.
Hence, although poor parents of bright children very much want their children to
get the education that they never had, sending their child to high school becomes a very
hard decision. As seen, it involves many tradeoffs and a lot of uncertainty. Poor families
(like all families) desire to maximize their household’s lifetime income and want to
improve the livelihood of their children. Even when it comes to educating their child,
they must confront the cold realities of the economic calculus.
When a family does decide to send their child to high school and beyond, they
often have to take extreme measures. Paying high school fees can require poor families to
sell scarce assets (Liu et al., 2009b). The family must often borrow from relatives, friends
and neighbors. Increasingly, families must rely on high interest loans from local money
lenders. All of this sacrifice (plus the foregone wages) is required for taking a course in
which there is only a 1 in 5 (20 percent—see above) chance of success. Because of all of
these factors, it is not surprising that high school enrollment rates in poor rural areas are
so low.4
Other Rural Schooling Shortcomings
4 Compared to its neighbors in East Asia, China’s high school attainment rates can clearly be counted as low. At the same time in their development (e.g., the 1930s or the 1950s), Japan had almost 100 percent of their student-aged population in high school. High school graduation rates were also high—indeed almost 100 percent—in South Korea in the 1970s and 1980s.

23
Beyond the financial burdens of high school, Li et al. (2006) also implicitly show
that one of the main problems underlying the lack of competitiveness of rural students is
that they just cannot compete—especially at the time that they are trying to get into high
school. Of course, as shown above, once in high school, poor rural students successfully
compete head to head with their urban counterparts. However, at the conclusion of junior
high school all students that want to continue on with schooling—both rural and urban—
must take a standardized exam (the zhongkao). To succeed, then, rural students must
compete with the rising number of increasingly well-trained students from urban China.
If they cannot compete, they are unable to continue into the academic high school track
and, hence, are unable to enter the college and university system, which has been shown
to have an extremely high rate of return (Cai et al., 2008).
If this is so, this means that there are other factors that underlie the low enrollment
rates of rural students in high school in addition to high tuition. In fact, an examination of
the entire school system prior to a student’s entrance to high school shows that the there
are huge disadvantages the students face in getting an education that will make them
competitive at the high school level (and beyond).
According to the literature and our own work, the disadvantages to rural students
appear even before elementary school (Luo et al., 2009b). In China preschool is a private
activity and is only recently being regulated by the state. There is almost no investment
by the government into preschools. Since all preschools are private, started by those
entrepreneurial enough to organize the space and teaching material, tuition is charged for
all students. Lunches and transportation are also the responsibility of parents. There are

24
virtually no Head Start-like programs to help the poor in rural areas get a preschool
education. Hence, poor parents may decide they will not send their children to preschool.
Is tuition a barrier to participation in preschool? To test this, we are currently
running a randomized control trial in a county in Henan (Luo et al., 2009b). To carry out
the experiment we randomly selected 100 4-1/2 year olds that lived in villages that did
not attend preschool as a 3 or 4 year old. Before the beginning of the new academic year,
we offered to pay tuition and provide a stipend for board and transportation for half of the
parents of the children (all randomly selected). The other half were offered nothing.
When we returned to the villages for a follow up survey in late September (one month
into the new academic term), 98 percent of the students which received the tuition waiver
(and subsidy) were attending preschool. Only 18 percent of those that were not offered
the tuition waiver were. Clearly, finances matter.
Even if they could afford preschool, rural families may have no access to
preschools. In a recent survey by the Chinese Academy of Sciences, it was found that in
rural areas, less than 20 percent of villages have convenient access to preschools (Luo et
al., 2009b). In poor areas, the share of villages drops to less than 7 percent. From a recent
visit to a set of poor counties in Guizhou province the anecdotal support for this statistic
was striking: we did not find even one village with preschool facilities during the two
weeks that we visited villages across five counties.
Even when preschools are available, the quality of facilities and teaching may be
too low to matter, in terms of giving students the skills in learning and social behavior
that are critical for the formal learning that starts in grade 1 of primary school. Nearly 80
percent of preschool teachers in rural areas have no formal training in teaching preschool

25
children. In contrast, more than 80 percent of teachers in urban areas do. To keep costs
down, the student to teacher ratio in rural preschools are more than 25 to 1, even though
national standards suggest that teachers care for no more than 8 children.
Because of this, it is no wonder that our survey found such low preschool
attendance rates of children in rural villages. According to our survey in 6 counties in 3
poor provinces (Shaanxi, Gansu and Henan), only 20 percent of rural children between
the ages of 3 and 6 were attending preschool. In cities, in contrast, almost all children do.
Measured levels of educational readiness are also low among rural, preschool age
children, almost certainly due, in part, to the fact that so few children in rural areas go to
preschool. Dr. Mujia Ou, an educational specialist centering her attention on measuring
educational readiness of urban children, developed a multidimensional readiness test. The
test is purported to measure cognitive ability, numeracy, literacy, social behavior,
physical skills and other skills which are thought to be important for children to have if
they are to succeed in China’s schools. The range of possible test scores is from 0 to 130.
After administering the test to tens of thousands of urban children, Ou has fine-tuned the
test to a normal distribution centered on 90. If a child obtains a score lower than 70,
he/she is considered to not have the skills or abilities to go to school and succeed. In the
course of Ou’s testing, she found about 7 percent of China’s urban students score lower
than 70. She had never given the test to rural students.
In a prior study we gave Ou’s test to rural students (Luo et al., 2009b). In June
and July 2008, we administered the test to more than 700 4 year old students in 6
provinces. According to the findings, the scores of most rural 4 year olds were very low.
The mean of the distribution was only 64, 6 points below the level that Ou believed

26
signaled being non-ready. Fully 64 percent of the 4 year olds to whom we administered
the test scored less than 70. If, as many educators believe, it is difficult for a child who
enters elementary school unready to catch up, then our finding (that the readiness scores
of poor rural students are distinctly lower than those of urban students) explains a lot of
why educational attainment in rural China is so low. It also does not bode well for an
economy that is going to rely only more, given the demographic trends, on a rural labor
force to carry out the tasks that require relatively high levels of learning and skills.
The problems do not stop in preschool. While tuition is now free in elementary
school, facilities have improved in rural areas and teacher salaries are consistently paid in
full, there are still serious barriers to learning in China’s elementary schools. One
problem (beyond the general poor quality of teaching and weak curriculum—which are
both being addressed to some degree by government programs) that has received scant
attention is the low level of nutrition that still plagues many students in rural schools
across vast regions of China. Although severe iron deficiency is only 5 percent in urban
China, across all rural areas, around 25 percent of students suffer from anemia (Luo et al.,
2009a). In the poorest schools, more than half of elementary children in poor rural areas
are anemic. And, when students suffer from anemia, it is well known that the cognitive
ability of children fall, their attention span wanes and, in general, they are less able to
learn (McGregor and Ani, 2001; Nokes et al., 1998).
Surprisingly, despite these potential problems, little is known about either the
incidence of anemia in different parts of China or of its source. There are two main
sources of anemia—poor diet and parasitic infection. China’s government meal programs
do nothing to address this problem in poor areas (Luo et al., 2009b). According to data
27
from more than 70 rural schools in Shaanxi that provide dining services, there is no meat,
protein or other multivitamin supplements in the regular diets of school children. In fact,
there are no standards. And, while there is a lot of evidence that parasitic worms are still a
problem, we can find almost no schools that recognize there is a problem. Fewer schools
(almost none) take any action to deworm their children—even though the cost of
deworming drugs is less than 30 cents per dose (in US currency). If there is so little
attention to nutrition at home and school, it is no wonder that educational performance of
rural students is so poor. It also means that it will be difficult for these students to catch
up in the future. If a whole part of the work force is unable to learn the skills that are
needed in China’s modernizing economy, this could be one real potential barrier to future
growth and economic transformation.
There are many other problems. There are serious problems that have emerged
associated with China’s new shift towards the use of boarding schools (Luo et al., 2009a).
Migrant schools—enrollment in which is growing much faster than any other segment of
China’s education system—is essentially ignored by government officials (Ma et al.,
2009). China’s curriculum has a series of well-known shortcomings (e.g., many subjects
are taught by rote learning).
Addressing these problems will be a challenge for the government to face if it is
going to try to produce a workforce that can meet the challenge of a higher productivity
economy (Rozelle et al., 2008). If this cannot be done, it is possible that China’s growth
could be affected. If the economy continues to grow without including this segment of the
labor force, China is planting the seeds for long run inequality and poverty. The social
and political problems that could grow out of having a two-tiered society could be serious.

28
The best strategy to propel China forward is almost certainly to attack the new
educational challenges with as much effort, financial resources and innovative programs
as was used in the past to make grades 1-9 education almost universal and to improve the
quality and availability of college and university education.
Conclusion
Opportunities to go to college and earn a degree have risen dramatically in China.
Government investment into the college systems has skyrocketed; the size of universities
has increased. With the rise in the opportunity to go to college, our results indicate that
the participation of the poor in accessing the opportunity for a college education is lower
than the students from non-poor families. According to our analysis, only four percent of
students from poor rural areas are able to enter tier one, two or three universities. In some
large metropolitan areas of China, nearly 50 percent of students matriculate into the
tertiary education system. Clearly, there is something that is keeping the rural poor out.
So why is it that the rural poor are being excluded? We examine two broad
general categories of barriers. According to our data from Shaanxi province, it does not
appear that the any real barriers appear at the period of time between the final year of
high school and the first year of college. There is no empirical evidence that the College
Entrance Examine (CEE) is biased against the poor. Holding all other factors constant,
the exam scores of poor students are virtually the same as the exam scores of non-poor
students. Nor does the level of household liquidity appear to be constraining. Despite the
high costs, virtually every poor student that is admitted to college is able to pay the fees
and tuitions that are demanded upon matriculation and is able to enter college. Although

29
there is some evidence that the nature of the CPA Process (in particular, the timing of the
choice of the college and the timing of when students find out about whether or not they
receive financial aid—any financial aid is awarded during the first year of college, well
after when students must make their college choices) distorts the decisions of poorer
students of what college to attend and what major to pursue (the poor systematically
choose to go to normal universities and defense-related colleges more than the non-poor
since the costs of these institutions are lower), the admissions rates between the poor and
non-poor who take the CEE examination are statistically the same.
Therefore, the paper concludes that if the real barriers are not at the time of
admissions to college, there must be something systematically keeping poor children
from ever making it to the point where they take the CEE. In fact, a close reading of the
literature and some of our own data demonstrate that the rural education system—in
general—is putting rural children at a severe disadvantage at almost every point of the
education process (low rates of enrollment into early childhood education; low quality
elementary schools; poor nutrition and low quality boarding facilities; high costs of high
school tuition; a migrant schooling system that is outside of the public education system).
In conclusion, we believe that the real barriers keeping the poor from college education
are being erected early in the education experience of the rural poor—as early as
preschool and elementary school—and are present throughout the entire schooling system.
30
REFERENCES
Robert J. Barro. “ Economic Growth in a Cross Section of Countries”. Quarterly Journal of Economics, Volume 106, Issue 2 (May, 1991). 407-443.
Bhagwati, Jagdish and Milind Rao. (1999). Foreign Students in Science and Engineering
Ph.D. Programs: An Alien Invasion or Brain Gain? In B. Lindsay Lowell. (Eds.), Foreign Temporary Workers in America: Policies That Benefit the U.S. Economy Quorum Books, 238-258.
Boucher, S., O. Stark and J.E. Taylor. (2005). “A Gain with a Drain? Evidence from
Rural Mexico on the New Economics of the Brain Drain.” Invited paper, 14th World Congress of the International Economic Association, Marrakech, Morocco, August 29 – September 2, 2005.
Cai, Fang, Albert Park and Yaohui Zhao. (2008). The Chinese Labor Market in the
Reform Era. In China’s Economic Transition: Origins, Mechanisms, and Consequences, edited by Loren Brandt and Thomas Rawski, Cambridge Unviersity Press.
China National Bureau of Statistics (2005, 2007a). China Statistical Yearbook, Various
Issues. Beijing: China National Bureau of Statistics. China National Bureau of Statistics. (2007b),Household Income and Expenditure Survey.
Beijing: China National Bureau of Statistics. China National Bureau of Statistics. (2006, 2007c), China County Statistical Yearbook.
Beijing: China National Bureau of Statistics. China National Bureau of Statistics. (2007d). Poverty Monitoring Report of Rural China.
Beijing: China National Bureau of Statistics. China View. (2009). Survey: Gap between China's rural and urban education levels huge.
http://news.xinhuanet.com/english/2009-03/05/content_10951127.htm Cui, Bangyan. (2007). Jiaoyubu: Gaoxiao Xuefei Biaozhun Pingjun 4500 yuan (Ministry
of Education: College Tuition Standard Averaged at 4500 yuan) http://www.moe.edu.cn/edoas/website18/level3.jsp?tablename=2104&infoid=29982, last date accessed, Dec 8, 2008.
Dee, Thomas S. (2004). Are There Civic Returns to Education? Jounal of Public
Economics, Vol. 88, 1697-720.

31
Fleisher, Belton M., Haizheng Li, Shi Li, and Xiaojun Wang. (2005). Sorting, Selection, and Transformation of the Return to College Education in China. IZA Working paper no.1446, Institute For the Study of Labor (IZA), Germany.
Fleisher, Belton M., Haizheng Li, and Shi Li. (2007). Job Choices, Sectoral Attachment,
and Educational Attainment in China’s Transition Economy. Paper presented on Chinese Economists Society (CES) European Conference on “Economic Transition at Midlife: Lessons from the Development of Markets and Institutions.” May 11-14, 2007.
Gibson, John and David Mckenzie. (2009). The Microeconomic Determinants of
Emigration and Return Migration of the Best and Brightest: Evidence from the Pacific. IZA Working paper no. 3926, Institute For the Study of Labor (IZA), Germany.
Glaeser, Edward L., Giacomo ponzetto, and Andrei Shleifer. (2006). Why Does
Democracy need Education? NBER Working Paper Series 12128. Bambridge, Mass.: National Bureau of Economic Research, March.
Grantham-McGregor, Sally and Cornelius Ani. (2001). A Review of Studies on the Effect
of Iron Deficiency on Cognitive Development in Children. Journal of Nutrition, 131(2): 649S-668.
Hannum, Emily, Meiyan Wang and Jennifer Adams. Urban-Rural Disparities in Access
to Primary and Secondary Education Under Market Reform. In One Country, Two Societies? Rural-Urban Inequality in Contemporary China, edited by Martin King Whyte. (Forthcoming, Harvard University Press).
Li H. W. Liu, N. Ma, J. Zhang. (2006). “Does Education Pay in Urban China? Estimating
Returns to Education Using Twins.” Discussion Papers, Chinese University of Hong Kong, Department of Economics.
Liu, Chengfang, Linxiu Zhang, Renfu Luo, Scott Rozelle, Brian Sharbono, Jennifer
Adams, Hongbin Li, Yaojiang Shi, Ai Yue, Xiaobing Wang, and Thomas Glauben. (2009a). Early Commitment on Financial Aid and College Decision Making of Poor Students: Evidence from a Randomized Evaluation in Rural China. Center for Chinese Agricultural Policy, Chinese Academy of Science, Working Paper 2009-01-21.
Liu, Chengfang, Linxiu Zhang, Renfu Luo, Scott Rozelle, Brian Sharbono, Yaojiang, Shi.
(2009b). Development Challenges, Tuition Barriers and High School Education in China. Center for Chinese Agricultural Policy, Chinese Academy of Science, Working Paper 2009-01-23.

32
Liu, Xiaoyu, Renfu Luo, Chengfang Liu, and Linxiu Zhang.(2007). The Cost of Going to Senior High Schools in Rural China. Working paper WP-07-C8, Northwest Socio-economic Development Research Center, Shaanxi, China.
Loyalka, Prashant, Yingquan Song, and Jianguo Wei. (2009). Information, College
Choice and Financial Aid: Evidence from a Randomized Control Trial in China Working Paper No. 9009, China Institute for Educational Finance Research (CIEFR), Peking University, Beijing, China.
Luo, Renfu, Yaojiang, Shi, Linxiu Zhang, Chengfang, Liu, Scott Rozelle, Brian Sharbono. (2009a). Malnutrition and health in China’s rural boarding schools: The case of primary schools in Shaanxi Province. Center for Chinese Agricultural Policy, Chinese Academy of Science, Working Paper 2009-01-24.
Luo, Renfu, Qiran Zhao, Min He, Chengfang Liu, Linxiu Zhang. (2009b). The Empirical
Analysis of Early Childhood Education of Poor Rural China. Studies in Preschool Education, No.1, 2009, 7-10.
Luo, Renfu, Yaojiang Shi, Linxiu Zhang, Chengfang Liu, Scott Rozelle, Brian Sharbono.
(2009). Malnutrition in China’s rural boarding schools: The case of primary schools in Shaanxi Province. Manuscript submitted for publication.
Ma, Xiaochen, Chengfang Liu, Scott Rozelle, Xiaopeng Pang. (2009). Educating China's Migrants: Analysis of Migrant Schools, Students and Their Performance. Working paper, Center for Chinese Agricultural Policy, Chinese Academy of Sciences. Beijing, China.
Ministry of Education. (2005, 2006). Educational Statistics Yearbook of China, People’s
Education Press, Beijing, China.
Nokes, Catherine, Claire van den Bosch and Donald A.P. Bundy. (1998). The Effects of Iron Deficiency and Anemia on Mental and Motor Performance, Educational Achievement, and Behavior in Children: An Annotated Bibliography. Report of the International Nutritional Anemia Consultative Group, Washington, D.C.
People’s Daily. (2003a). China Initiates Financial Aid Program for Needy College Students. http://english.peopledaily.com.cn/200307/15/eng20030715_120306.shtml
People’s Daily. (2003b).Tears of Needy Chinese College Students Arouse Social Concern. http://english.peopledaily.com.cn/200308/27/eng20030827_123134.shtml
Poverty Alleviation Office. (2008). National Poverty Alleviation Congress Dec 27, 2008. Beijing. Poverty Alleviation Office.

33
Rozelle, Scott, Jikun Huang, Linxiu Zhang and Xiaofei, Li. (2008). China’s Labor Transition and Future Educational Challenges. Working papers in Center for Chinese Agricultural Policy, Institute of Geogrphical Sciences and Natural Resources Research, Chinese Academy of Science, Beijing, China.
State Council. (2006). The Eleventh Five-Year Plan for Economic and Social Development of
P. R. of China. March 16, 2006. http://www.cctv.com/news/china/20060316/102285.shtml UNESCO/OECD. (2002). Financing Education – Investment and Returns, Analysis of the
World Education Indicators 2002 Edition, UNESCO/OECD, Paris. Vinod Thomas, Yan Wang, and Xibo Fan, 2000. Measuring Education Inequality: Gini
Coefficients of Education, World Bank. Yu, Ying. (2008). Wei Daxue Xuefei er Bianhu (Defending for College Tuition). Jiaoyu
Pinglun (Educational Review), Vol 1:20-24.

34
Table 1. Enrollment rates of the rural poor into four sample universities, 2008.
All students in the sample (rural +
urban)
Rural students from poor
areas a
Number
of students
Percent
Number of
students
Percent
Freshmen from all four sample universities
20253
100
n.a.
n.a.
Rural 10031 49 1937 9.5 Urban 10222 51 n.a. n.a. Freshman from universities that have designations as:
National universities 12277 61 845 6.9 Provincial universities 7976 39 1092 14
Source: Author’s University Matriculation Survey. Note: a Rural students from poor areas, meaning that statistics in these columns are generated for rural students that live in nationally-designated poor counties.
35
Table 2. The number and percentage of freshmen from rural areas by ethnicity and by gender
All (Male+Female)
Male
Female
% % % All ethnicity
Sample [A] (number of students) a
10031
100.0
6658
66.3
3373
33.7
Age 14-22 [B] (million persons)b
149
100.0
78
52.2
72
47.8
Ratio [A/B] 1.00 1.27 0.71 Han Sample [A] (number of students) a
9617
95.9
6372
63.5
3245
32.4
Age 14-22 [B] (million persons)b
134
89.4
70
46.7
64
42.7
Ratio [A/B] 1.07 1.36 0.76 Non Han
Sample [A] (number of students) a 414 4.1 286 2.8 128 1.3
Age 14-22 [B] (million persons)b 16 10.6 9 5.5 7 5.1
Ratio [A/B] 0.39 0.51 0.25
Source: Sampled data are from the University Matriculation Survey; the data at the national level attained from “The Tabulation on Nationalities of 2000 Population Census of China (CNBS, 2003). Note: a. The unit of observation in the sample is “number of students”.
b. This is rural population for the ages of 14-22 at the national level in 2008 (million persons). These figures are calculated by population between the ages of 6-14 in 2000. Here we ignore the death rate of the population in this age cohort during 2000-2008, and thus these figures could be overestimated.

36
Table 3a. Test of the mean difference of normalized college entrance exam scores for poor and non-poor students in li-ke track classes by the quartile ranking of each student’s high school entrance exam (or zhongkao) scores in Shaanxi Province, 2008.
Poora
Non-poor
Test of mean difference
No. of obs.
Scoreb
No. of obs.
Score
Test stats: p-value
Quartile c1
42 -0.94
37 -1.10 0.24
(0.56) (0.67) Quartile 2 45 -0.60 26 -0.46 0.50 (0.69) (0.95) Quartile 3 53 0.06 43 0.09 0.85 (0.66) (0.89) Quartile 4 100 0.67 52 0.86 0.14 (0.73) (0.74) Total
240
158
Source: Authors’ survey—Shaanxi Senior High School Survey. Note: * means significant at 5%, ** means significant at 1%
a. Statistics in these columns are generated for rural students that live in nationally-designated poverty counties. b. Standard deviations are in parentheses. c. Quartiles are defined by ranking all students by their zhongkao scores and dividing them into four groups. Quartile 1 students have the lowest zhongkao scores; quartile 4 students have the highest zhongkao scores.

37
Table 3b. Test of the mean difference of normalized college entrance exam scores for poor and non-poor students in wen-ke track classes by the quartile ranking of each student’s high school entrance exam (or zhongkao) scores in Shaanxi Province, 2008.
Poora
Non-poor
Test of mean difference
No. of obs.
Scoreb
No. of obs.
Score
Test stats: p-value
Quartile c1
51 -0.49
51 -0.80
0.07
(0.88) (0.80) Quartile 2 53 -0.17 52 -0.25 0.59 (0.83) (0.74) Quartile 3 39 0.56 53 0.43 0.49 (0.71) (0.96) Quartile 4 23 0.75 27 0.95 0.40 (1.08) (0.64) Total
166
183
Source: Authors’ survey—Shaanxi Senior High School Survey. Note: * means significant at 5%, ** means significant at 1%
a. Statistics in these columns are generated for rural students that live in nationally-designated poverty counties. b. Standard deviations are in parentheses. c. Quartiles are defined by ranking all students by their zhongkao scores and dividing them into four groups. Quartile 1 students have the lowest zhongkao scores; quartile 4 students have the highest zhongkao scores.

38
Table 4. Regression results using Ordinary Least Squares estimators of the impact of the poverty of a student on the student’s College Entrance Exam score in Shaanxi Province, 2008 (dependent variable = Normalized College Entrance Exam score)
Model 1
Model 2 Variables Coef. t-ratio Coef. t-ratio Poverty
Poverty indicator (if student is from poor rural area = 1)
0.00
(0.03)
Log(assets) -0.04 (1.16) Student Characteristics Female = 1 0.07 (1.12) 0.07 (1.15) Li-ke track = 1 -0.25** (3.90) -0.26** (3.99) Zhongkao (high school exam) score
7.90** (20.34) 7.87** (20.30)
Father Characteristics
Education 0.01 (0.83) 0.01 (0.95) Living at home, (1=yes, 0 otherwise)
0.17* (2.30) 0.16* (2.22)
Migrant worker, (1=yes, 0 otherwise)
0.05 (0.61) 0.03 (0.38)
Mother Characteristics Education -0.01 (0.87) -0.01 (0.72) Living at home (1=yes, 0 otherwise)
-0.24* (2.51) -0.23* (2.45)
Migrant worker -0.08 (0.81) -0.08 (0.80) (1=yes, 0 otherwise) Constant
-5.47**
(18.32)
-5.15**
(12.72)
No. of observations
708
708
Adj. R2
0.3857 0.3868
Source: Authors’ survey—Shaanxi Senior High School Survey. Note: * significant at 5% **significant at 1% t-ratios in parentheses

39
Panel A. Li-kea
Pane B Wen-kea
Figure 1: Kernel Density Curves of CEE Scores of the Poor and Nonpoor students in Li-ke and Wen-ke track in Shaanxi Province, 2008. Source: Authors’ survey—Shaanxi Senior High School Survey. Note: a Li-ke means that students are pursuing a science and engineering track of classes; Wen-ke means that students are pursuing a social science and humanities track of classes. b Poor means that statistics in these columns are generated for rural students that live in nationally-designated poor counties
Den
sity
of C
EE
S
core
CEE Score
Nonpoor
Poorb
-2.40633
2.18309
.013081
.390161
Den
sity
of C
EE
sc
ore
CEE Score
Nonpoor
Poorb
-3.58299
2.28075
.000133
.372056