Impacts of the universal primary education policy on educational attainment and private costs in...
16
This article was published in an Elsevier journal. The attached copy is furnished to the author for non-commercial research and education use, including for instruction at the author’s institution, sharing with colleagues and providing to institution administration. Other uses, including reproduction and distribution, or selling or licensing copies, or posting to personal, institutional or third party websites are prohibited. In most cases authors are permitted to post their version of the article (e.g. in Word or Tex form) to their personal website or institutional repository. Authors requiring further information regarding Elsevier’s archiving and manuscript policies are encouraged to visit: http://www.elsevier.com/copyright
Transcript of Impacts of the universal primary education policy on educational attainment and private costs in...

This article was published in an Elsevier journal. The attached copyis furnished to the author for non-commercial research and
education use, including for instruction at the author’s institution,sharing with colleagues and providing to institution administration.
Other uses, including reproduction and distribution, or selling orlicensing copies, or posting to personal, institutional or third party
websites are prohibited.
In most cases authors are permitted to post their version of thearticle (e.g. in Word or Tex form) to their personal website orinstitutional repository. Authors requiring further information
regarding Elsevier’s archiving and manuscript policies areencouraged to visit:
http://www.elsevier.com/copyright
Author's personal copy
International Journal of Educational Development 28 (2008) 161–175
Impacts of the universal primary education policy oneducational attainment and private costs in rural Uganda
Mikiko Nishimuraa,�, Takashi Yamanob, Yuichi Sasaokac
aGraduate School of International Cooperation Studies, Kobe University, 2-1 Rokkodai, Nada-ku, Kobe 657-8501, JapanbFoundation for Advanced Studies on International Development, Japan, and National Graduate Institute for Policy Studies, Japan
cJapan International Cooperation Agency, Japan
Abstract
While some governments in Sub-Saharan Africa have abolished tuition to achieve universal primary education (UPE),
few studies have examined the impacts of the UPE policy beyond school enrolment. This study estimates the impact of the
UPE policy in Uganda on overall primary education attainments by using data including 940 rural households. We find
that UPE has decreased delayed enrolments and increased grade completion rates up to the fifth grade and its effects are
especially large among girls in poor households. Yet, schools in Uganda still face further challenges in terms of low internal
efficiency and the unequal quality of education.
r 2006 Elsevier Ltd. All rights reserved.
Keywords: Educational policy; Universal primary education; Uganda
1. Introduction
Sub-Saharan African (SSA) countries have ex-perienced slow progress in achieving universalprimary education (UPE) in the last three decades.Between 1980 and 1995, SSA was the only regionthat experienced a decline in the average grossenrolment rate (GER) for primary education, whileother regions experienced substantial increases(UNESCO, 1998). Public expenditure on primaryeducation also fell by 6 percent in per capita termsbetween 1985 and 1995, while it increased approxi-mately threefold in all other developing regions(UNESCO, 1998). International aid agencies andresearchers share a common concern that SSA will
not achieve UPE by 2015, unless the progress is tobe accelerated rapidly (Carceles et al., 2001; Bennell,2002).
Responding to this concern, many SSA govern-ments have abolished school fees for public primaryeducation, under the name of the UPE or FreePrimary Education policy (Avenstrup et al., 2004).The UPE policy has been well received by variousstakeholders including politicians, aid agencies, andthe beneficiaries as a pro-poor policy.1 Uganda wasone of the first SSA countries to adopt the UPEpolicy in 1997 and experienced a robust increase ofprimary enrolment from 2.8 million in 1997 to 7.6million in 2004 (UNESCO, 2000; MOES, 2005).
ARTICLE IN PRESS
www.elsevier.com/locate/ijedudev
0738-0593/$ - see front matter r 2006 Elsevier Ltd. All rights reserved.
doi:10.1016/j.ijedudev.2006.09.017
�Corresponding author.
E-mail address: [email protected] (M. Nishimura).
1UPE policies have been adopted in many other Sub-Saharan
African countries such as Malawi, Lesotho, Kenya, and
Tanzania.
Author's personal copy
The evidence of its actual effect, however, is mixed.While studies indicate that the UPE policy effec-tively improved access to primary education forchildren of poor families by removing tuition forpublic primary education (e.g., Deininger, 2003),others reveal that various fees are still chargedunder the UPE policy (e.g., Suzuki, 2002). Forinstance, a governmental report shows that 55percent of primary dropouts left school due to thecosts of schooling (MOES, 2003). These existingstudies, however, conducted research a few yearsafter the implementation of UPE, and there havebeen no empirical study in recent years. Since theaim of the UPE policy was primarily to increase theoverall educational attainments of children, it isimportant to examine the impacts of the UPE policybeyond school enrolment.
This article, therefore, estimates the impacts ofthe UPE policy on overall educational attainmentsat the primary education level in rural Uganda.Here, we are using attainments in the sense of yearsof schooling completed rather than achievement intests or examinations. In particular, by takingadvantage of using data collected 6 years after theadoption of UPE, we estimate the impacts of theUPE policy on delayed enrolments and the comple-tion rates of upper grades in primary schools. Thedata include 940 rural households interviewed in2003. The next section reviews the existing literatureon the UPE policy and the private costs ofeducation in Uganda. It also sets the conceptualframework for the following analyses. Section 3outlines the research questions, data, and metho-dology, followed in Section 4 by the estimationresults. Finally, Section 5 draws conclusions.
2. UPE in Uganda and the private cost of education
2.1. UPE in Uganda
The main question to be investigated is how thereduction of the direct private costs of educationcontributes to equality and equity in education. TheUPE policy aims at expanding access, enhancingequity, and increasing efficiency in educationsystems (Inter-Agency for Basic Education for All,1990). The government faces a particular challengein providing quality basic education to marginalisedpopulations such as the poor, ethnic minorities, andsometimes girls. As far as education financing isconcerned, public education in Uganda was under-funded prior to the introduction of the UPE policy
in 1997 (Mehrotra and Delamonica, 1998). Thedirect costs of education were heavily dependent onprivate resources. Students’ families paid more than80 percent of the total direct costs of public primaryschooling, while the government paid the rest. Thelargest part was allocated to the salaries of teachersand administrators. The share of private resourcesin the total direct costs of education in Uganda washigh compared to other low-income countries suchas Burkina Faso (41.3 percent), Bhutan (27.2percent), Myanmar (58.5 percent), and Viet Nam(40.0 percent) (Mehrotra and Delamonica, 1998).
In 1997, the government pledged to meet the costsof schooling for four children per family, which wasamended to benefit all children in 2003, whileparents meet the costs of school uniforms, meals,exercise books, local materials for building class-rooms, and physical labour (Mehrotra and Dela-monica, 1998; Black et al., 1999). The role of thegovernment increased under the UPE policy toprovide more resources and ensure the quality andequity of education, supported by the mobilisedresources through the highly indebted poor coun-tries (HIPCs) initiative as well as other donor funds(Tan et al., 2001). The overall education budgetincreased from 1.6 to 3.8 percent of GDP, with theshare of the primary education sub-sector of thetotal education expenditure increased from 40percent in 1996 to 65 percent in 2004 (Deininger,2003; MOES, 2005). As a consequence, the numberof primary school teachers increased by 41 percentfrom 103,331 in 1997 to 145,703 in 2004 and thenumber of schools also increased by 41 percent from10,490 in 1997 to 14,816 in 2004 (MOES, 2005). Inaddition, the decentralisation of responsibilities andmassive publicity campaigns with a particular focuson girls’ education were undertaken and thecoordination among donors was strengthened intargeting investments in primary education. Sincethen, each school has been receiving the capitationgrant based on the number of pupils in the schooland subsequently spending the grant by following aguideline.
Deininger (2003) found that the introduction ofUPE was associated with a significant expansion ofattendance in primary education by the poor andthat the school fees decreased significantly. He usedthe national household surveys in 1992 and 1999/2000 to compare the enrolments and private costs of1992, 1997, and 1999. He also found that the schoolattendance increased dramatically for girls aged 6–8years and that the household expenditure on
ARTICLE IN PRESSM. Nishimura et al. / International Journal of Educational Development 28 (2008) 161–175162

Author's personal copy
primary schooling decreased by about 60 percentbetween 1992 and 1999. Although his studyindicated a significant increase in enrolments justafter the adoption of UPE, it was too early toevaluate the impacts of the UPE on the overalleducational attainments. Also, Deininger (2003) didnot examine the impacts of UPE on delayedenrolments. In contrast, we use data taken 6 yearsafter the adoption of UPE and are in a betterposition to measure the impacts of UPE on overalleducational attainments in Uganda than Deininger(2003) and other previous studies.
2.2. Private costs, equality, and equity of education
The literature regarding the economics of educa-tion has long explained the incentive for public andprivate investments in education. Psacharopoulos’studies reveal that public and private rates ofreturns to education are generally the highest atthe primary level and that this trend is most evidentin low-income countries (e.g., Psacharopoulos,1994). The equalisation and pro-poor policy per-spectives also support increased public investmentsin primary education. The conventional knowledgesuggests that income inequality leads to educationalinequality, and vice versa (Carnoy and Levin, 1985;Birdsall, et al., 1997). Because acquiring educationrequires substantial individual investments, educa-tional opportunities are limited for the poor due tocredit constraints. In SSA, the limited capacity andlow quality of public schools induced additionalprivate spending on education and led to inequalitybased on the socio-economic capacity of the people(Bray and Lillis, 1988; Colclough and Lewin, 1993;Kitaev, 2001).
Some empirical literature, however, also showsthat even under the UPE policies, the remainingprivate costs of education are still impediments forenrolment and equality in the quality of education(Tsang and Kidchanapanish, 1992; Avenstrup et al.,2004). The UPE policy normally subsidises tuitionfees only, leaving other direct and indirect costs tobe borne by parents and families. Thus, the equalityand equity of education remain as a concern underthe UPE policy. The empirical evidence alsochallenges the adequacy of the cost intervention.Some studies argue that the unit costs of schoolingat a given quality for marginalised populations canbe quite different from those for non-marginalisedgroups (Tsang, 1994; Kitaev, 2001). In Kenya, forinstance, official fee-abolition did not affect the
enrolment of the nomadic population because it wassimply served by spontaneous ‘bush’ schools,largely funded through contributions in kind(Kitaev, 2001). A more recent study also finds thatpublic policies that promote the expansion ofprimary education tend not to benefit the poor(Govinda, 2003). These empirical studies indicatethe importance of considering the adequate costs ofschooling for different groups to maintain verticaland horizontal equity. The case of Uganda providesus with a unique opportunity to examine the effectof UPE.
3. Key research questions, data and methodology
3.1. Key research questions
This study takes advantage of using a recent ruralhousehold survey that covers the enrolment patternsin 2003, 6 years after the implementation of UPE inUganda. Since the data include children who wereaged six and younger when the UPE was imple-mented, we can evaluate the impacts of the UPE onprimary educational attainments by comparing thepre- and post-UPE cohorts. In particular, we askthe following questions:
1. How much did the UPE increase the gradecompletion rates in primary education in ruralUganda?
2. How much did the UPE decrease delayedenrolments in rural Uganda?
3. What factors determine private spending oneducation under UPE in rural Uganda?
By answering these questions, we believe that wecan obtain better assessments of the UPE policiesnot only for Uganda but also for other countriesthat have adopted the UPE policy recently, such asKenya, or those that are planning to adopt it.
3.2. Data
The data used in this article come from 940households in rural Uganda surveyed in 2003 aspart of the Research on Poverty, Environment, andAgricultural Technology (REPEAT) project, whichwas conducted by Makerere University and theFoundation for Advanced Studies on InternationalDevelopment (Yamano et al., 2004). The survey wasconducted in August–October 2003, and the samplefor the REPEAT project largely builds upon and
ARTICLE IN PRESSM. Nishimura et al. / International Journal of Educational Development 28 (2008) 161–175 163
Author's personal copy
complements a completed research project onpolicies for improved land management in Uganda,conducted by the International Food Policy In-stitute (IFPRI) and Makerere University between1999 and 2001 (Pender et al., 2001).
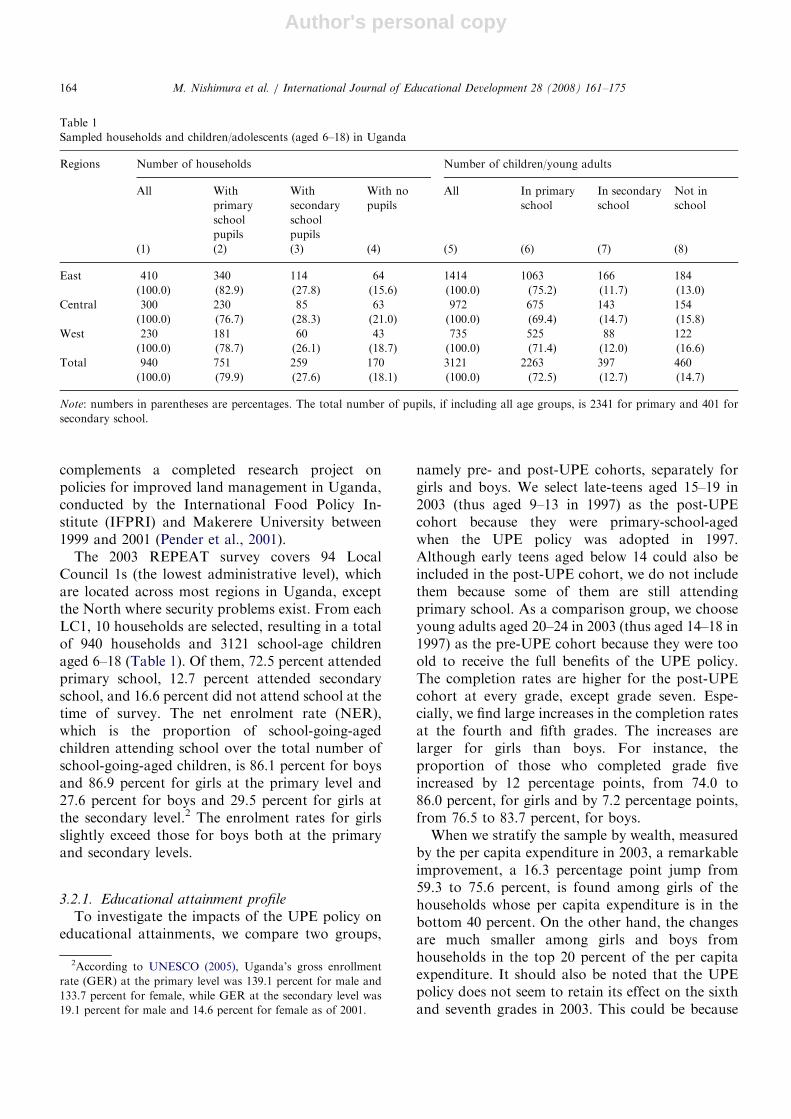
The 2003 REPEAT survey covers 94 LocalCouncil 1s (the lowest administrative level), whichare located across most regions in Uganda, exceptthe North where security problems exist. From eachLC1, 10 households are selected, resulting in a totalof 940 households and 3121 school-age childrenaged 6–18 (Table 1). Of them, 72.5 percent attendedprimary school, 12.7 percent attended secondaryschool, and 16.6 percent did not attend school at thetime of survey. The net enrolment rate (NER),which is the proportion of school-going-agedchildren attending school over the total number ofschool-going-aged children, is 86.1 percent for boysand 86.9 percent for girls at the primary level and27.6 percent for boys and 29.5 percent for girls atthe secondary level.2 The enrolment rates for girlsslightly exceed those for boys both at the primaryand secondary levels.
3.2.1. Educational attainment profile
To investigate the impacts of the UPE policy oneducational attainments, we compare two groups,
namely pre- and post-UPE cohorts, separately forgirls and boys. We select late-teens aged 15–19 in2003 (thus aged 9–13 in 1997) as the post-UPEcohort because they were primary-school-agedwhen the UPE policy was adopted in 1997.Although early teens aged below 14 could also beincluded in the post-UPE cohort, we do not includethem because some of them are still attendingprimary school. As a comparison group, we chooseyoung adults aged 20–24 in 2003 (thus aged 14–18 in1997) as the pre-UPE cohort because they were tooold to receive the full benefits of the UPE policy.The completion rates are higher for the post-UPEcohort at every grade, except grade seven. Espe-cially, we find large increases in the completion ratesat the fourth and fifth grades. The increases arelarger for girls than boys. For instance, theproportion of those who completed grade fiveincreased by 12 percentage points, from 74.0 to86.0 percent, for girls and by 7.2 percentage points,from 76.5 to 83.7 percent, for boys.
When we stratify the sample by wealth, measuredby the per capita expenditure in 2003, a remarkableimprovement, a 16.3 percentage point jump from59.3 to 75.6 percent, is found among girls of thehouseholds whose per capita expenditure is in thebottom 40 percent. On the other hand, the changesare much smaller among girls and boys fromhouseholds in the top 20 percent of the per capitaexpenditure. It should also be noted that the UPEpolicy does not seem to retain its effect on the sixthand seventh grades in 2003. This could be because
ARTICLE IN PRESS
Table 1
Sampled households and children/adolescents (aged 6–18) in Uganda
Regions Number of households Number of children/young adults
All With
primary
school
pupils
With
secondary
school
pupils
With no
pupils
All In primary
school
In secondary
school
Not in
school
(1) (2) (3) (4) (5) (6) (7) (8)
East 410 340 114 64 1414 1063 166 184
(100.0) (82.9) (27.8) (15.6) (100.0) (75.2) (11.7) (13.0)
Central 300 230 85 63 972 675 143 154
(100.0) (76.7) (28.3) (21.0) (100.0) (69.4) (14.7) (15.8)
West 230 181 60 43 735 525 88 122
(100.0) (78.7) (26.1) (18.7) (100.0) (71.4) (12.0) (16.6)
Total 940 751 259 170 3121 2263 397 460
(100.0) (79.9) (27.6) (18.1) (100.0) (72.5) (12.7) (14.7)
Note: numbers in parentheses are percentages. The total number of pupils, if including all age groups, is 2341 for primary and 401 for
secondary school.
2According to UNESCO (2005), Uganda’s gross enrollment
rate (GER) at the primary level was 139.1 percent for male and
133.7 percent for female, while GER at the secondary level was
19.1 percent for male and 14.6 percent for female as of 2001.
M. Nishimura et al. / International Journal of Educational Development 28 (2008) 161–175164
Author's personal copy
the UPE policy does not have impacts on thesegrades or because some of teenagers aged 15–19 arestill attending primary schools and will completethe sixth and seventh grades in the future. Weneed to wait for a few more years to make acomplete evaluation of the impacts of the UPEpolicy on the overall educational attainments inprimary education.
3.2.2. Delayed enrolment
In poor countries like Uganda, delayed enrolmentin school is common and considered to lower theoverall educational attainment. To investigate theimpacts of UPE on delayed enrolments, we plot thedistribution of the age that pupils started primaryschool. Again we created the post- and pre-UPEcohorts. We choose children aged 6–12 in 2003 (0–6in 1997) as the post-UPE cohort because they wereyounger than 6-years-old when the UPE wasadopted. The pre-UPE cohort includes childrenaged 13–18 in 2003 (7–12 in 1997) as a comparisongroup. The results indicate that the entry age intoprimary school has become younger, indicating thatthe delayed-enrolment has decreased, for both girlsand boys. Even when we stratify the sample by thewealth, we still find a sizable shift toward the leftafter the adoption of UPE for children in both poorand non-poor households. For instance, those whoenrolled in primary school after the legally set age 6declined by 22.2 percentage points from 58.0 to 35.8percent for girls and by 25.1 percentage points from60.9 to 35.8 percent for boys.
The significant reductions in delayed enrolmentcould be caused not only by the abolishment ofschool fees but also by the construction ofadditional schools, up to 4000 schools after theadoption of UPE (MOES, 2005). Easy access mayhave been beneficial especially for young childrenwho might have delayed enrolment due to securityissues and physical distance. However, there remainquite a number of early entries in primary schoolprior to age six. Thus, unlike previous predictions,made just after the implementation of UPE, thatuntimely entries were only a transitional phenom-enon (Deininger, 2003), the UPE policy has not yetestablished timely entries into primary school.
3.2.3. Repetition
UPE can have both positive and negative impactson repetition. Although UPE may have reduced thenumber of dropouts, it may also have encouragedlow-score students, who would drop out of school
without UPE, to repeat grades. To investigate theimpacts of UPE on repetition, we also would like toidentify the pre- and post-UPE cohorts. However,we only have repetition information on childrenaged 18 and younger. Some of them are still inprimary school, or others who are not in schoolcurrently may go back to school later. Thus, it is stillpremature to investigate the issues of repetition.3
Nonetheless, our data show that the internalinefficiency, which is partly caused by repetition, ispersistent. When looking at GER and NER bygrade, we note that the proportion of children of thegrade-aged children in each grade gradually reducesand becomes less than 10 percent at the seventhgrade in primary school for both boys and girls.More than half of our sample pupils have repeatedthe same grade at least once in primary education,and about a quarter of the pupils have repeated atleast twice. Thus, it seems that primary education isstill suffering from internal inefficiency under UPE.
3.3. Methodology
Although the above descriptive statistics areinformative, we need to control for various factorsto measure the impacts of UPE on educationalattainment. Thus, in the following section, weestimate the determinants of enrolment, delayedenrolment, and the completion of the fourth andfifth grades. We use the same pre- and post-UPEcohorts as defined earlier. In addition, we estimatethe determinants of education expenditure toinvestigate what factors influence education expen-diture under UPE.
3.3.1. Determinants of enrolment
To examine the determinants of enrolment, weuse a dummy variable, Eij, which takes one if child i
of household j attends school and zero otherwise,and estimate the following model with Probit at thechild level:
ProbðEij ¼ 1Þ ¼ f ðCij ;Hj ;X j ;RjÞ, (1)
ARTICLE IN PRESS
3When comparing the repetition experienced by the age group
of 13–15 with that of 16–18, the proportion of pupils who
experienced repetition at least once reduced from 75.5 percent to
68.8 percent for girls and 73.3 percent to 72.2 percent for boys.
However, since some of the age group of 13–15 may still be in
primary school and will repeat in the future, the definite change
of repetition is not measurable at this stage. A tentative
observation is that repetition has not considerably improved
under the UPE policy.
M. Nishimura et al. / International Journal of Educational Development 28 (2008) 161–175 165
Author's personal copy
where Cij is a set of characteristics of child i ofhousehold j; Hj is a set of household headcharacteristics; Xj is a set of household character-istics; and Rj is a set of two regional dummies wherehousehold j resides. We estimate Eq. (1) for childrenaged 6–12, i.e. primary school age, and for childrenaged 13–18, i.e. secondary school age, as well asboys and girls separately.
3.3.2. Determinants of delayed enrolment
To examine the determinants of delayed enrol-ment, we use a dummy variable, Dij, which takesone if child i of household j delays enrolment toprimary school beyond the age of 6 and zerootherwise, and estimate the following model withProbit at the child level for children aged 6–18:
ProbðDij ¼ 1Þ ¼ f ðUPEij ;Cij ;Hj ;X j ;RjÞ, (2)
where UPEij is a dummy variable for the post-UPEcohort, i.e. children aged 6–12 in 2003, and all theother explanatory variables are the same as in Eq.(1). We estimate Eq. (2) for children aged 6–18 forboys and girls separately.
3.3.3. Determinants of educational attainment up to
grades 4 and 5
Next, to examine the determinants of educationalattainment up to grades 4 and 5, we use dummyvariables, A4ij and A5ij, which take one if child i ofhousehold j completed grade 4 and grade 5,respectively, and zero otherwise. To estimate theoverall impacts of UPE on primary educationalattainment, we need data from the population thathas already completed primary education. Thus, weestimate Eq. (3) for young adults aged 15–24 andregard those who are aged 15–19 in 2003 (thus aged9–13 in 1997) as the post-UPE cohort and thosewho are aged 20–24 in 2003 (thus aged 14–18 in1997) as the pre-UPE cohort. Then, we estimate thefollowing model with Probit at the individual level:
ProbðA4ij or A5ij ¼ 1Þ ¼ f ðUPEij ;Cij ;Hj ;X j ;RjÞ,
(3)
where the UPE cohort dummy variable in thismodel takes one for late-teens aged 15–19 in 2003.The variables on the education of parents and adummy variable for orphans are removed becausesuch information is collected only for children aged18 and younger. Instead of the education of parents,we include the maximum education level of house-hold members. We estimate Eq. (3) for boys andgirls separately.
3.3.4. Determinants of education expenditure
Finally, by using the ordinary least square (OLS)regression model, we estimate the education ex-penditure at the household level:
ln ðEXjÞ ¼ f ðHj ;X j ;Rj ;ZjÞ, (4)
where EXj is the education expenditure in log forhousehold j, while the explanatory variables, Hj, Xj,and Rj are defined as in Eqs. (1)–(3). Theexplanatory variable, Zj includes two variables ofchild characteristics of household j to examine theeffect of households with only girls or householdswith orphans. We estimate Eq. (4) for primary leveland secondary level separately.
Furthermore, the economic burden of education,defined as the proportion of education expenditurein the total household expenditure, Bj, is included asa dependent variable with the same explanatoryvariables as Eq. (4) to examine the determinants ofthe economic burden of education:
ln ðBjÞ ¼ f ðHj ;X j ;Rj ; cjÞ, (5)
where Bj is the proportion of the educationexpenditure out of the total expenditure in house-hold j, while the explanatory variables, Hj, Xj, Rj
and cj are the same as stated in Eq. (4). We estimateEq. (5) for the primary level and secondary levelseparately.
3.3.5. Variables
In the following analyses, we use five dependentvariables (Eij, Dij, Aij, EXj, and Bj), one set of childcharacteristics (Cij), three sets of household char-acteristics (Hj, Xj, Zj), and the regional dummy (Rj).The dependent variables have already been definedearlier. The child characteristics, Cij, include ageand a dummy variable for orphans. There is a highpossibility that orphans are AIDS orphans who aremore prone to be under difficult circumstances (seeYamano et al., 2006).4 We also use a dummyvariable for the UPE cohort (between 6 and 12) fordelayed enrolment and a dummy variable for the
ARTICLE IN PRESS
4A recent report shows that about 14 percent of children aged
0–17 are defined as orphans of any type in Uganda, and about 48
percent of them are estimated to be AIDS orphans (UNAIDS/
UNICEF/USAID, 2004). In Yamano et al. (2006), it was found
that among adolescents aged 15–18, adolescents who are either
double orphans or single orphans not living with the remaining
parent are significantly less likely to attend school than non-
orphans living with both parents and this phenomenon is more
evident among girls than boys.
M. Nishimura et al. / International Journal of Educational Development 28 (2008) 161–175166
Author's personal copy
UPE cohort (between 15 and 19) for educationalattainment.
The household head characteristics, Hj, includeage and dummy variables for the gender and thereligion of the household head. For the householdcharacteristics, Xj, we use the socio-economic statusof the household, including the years of parentaleducation, the number of siblings aged 6–18, percapita household expenditure in US$ in logs, thevalue of asset holdings in logs, and the size of landin acres that is owned or operated by the householdin logs. Another set of household characteristics, Zj,includes one dummy variable for the householdshaving only girls and another variable that is a ratioof orphans to the total number of children in thehousehold.
Because we conduct the education expenditureanalysis at the household level and the analysis oneducational attainment includes information onadults, the maximum schooling years of men andwomen were used instead of parental education forthese analyses. In addition, we create a dummyvariable for children whose parental education isunknown for the analyses on enrolment and delayedenrolment, since they are likely to be children whoare separated from parents and would thus needparticular attention.5 We also include regionaldummies, Rj, to control for regional characteristics.
4. Results
4.1. Determinants of enrolment
The regression results in Table 2 suggest thatdifferent factors affect the school enrolment of boysand girls aged 6–12. Among girls, we find that theage of the child and the mother’s education are theonly factors that have significant impacts onenrolment. Younger girls tend to be out of school,which will result in delayed enrolments, while themother’s education has a positive impact onenrolment. For boys aged 6–12, younger boys alsotend to be out of school but the education levels ofboth father and mother do not have impacts onenrolment. Although we find that the household
expenditure increases boys’ enrolment, but not girls’enrolment, in this age group, we obtain the oppositeresults in the older age group in the last twocolumns in Table 2. Thus, it is not clear if there is agender preference for boys over girls, or vice versa.
In the survey, we have asked the reasons for thenon-enrolment. The most frequently cited reasonfor dropouts or non-enrolment by parents orguardians of children aged 6–12 is ‘not yet schoolingage’ for both boys and girls, which accounts for 69.7percent for boys and 78 percent for girls. ‘‘Can’t payschool fee’’ was the second most frequently citedreason for both boys (8.2 percent) and girls (10.1percent). These results are different from theprevious national household surveys that indicatedschool fees as the most important reason for non-enrolment (MOES, 2001; Deininger, 2003). Regard-ing the starting age, as many as 112 parents orguardians of children aged 6 claimed that it is tooearly to send their children to school. In addition,more than 10 parents or guardians of children overage 10 also responded that their child is not yetschool going age. The distance to school in part mayexplain why younger children of school age do notstill attend school due to security and physicalreasons (MOES, 2001). However, the fact that someparents consider it too early to send their childrenaged over 10 raises some questions on parentalawareness on schooling.
Among children aged 13–18, socio-economicfactors have strong impacts on enrolment. Becausesome of them attend secondary schools, which arenot free, the results are as expected. Genderdifferences in the estimated coefficients appearstrong among this age group. While all demo-graphic and socio-economic factors similarly show astatistical significance for both boys and girls,Catholic religion is a negative factor only for girls.6
Furthermore, a girl is likely to be out of schoolwhen her household head is young (in the 20s),while boys are not affected by the age of householdhead.
Among this age group, the most frequently citedreason for non-enrolment is ‘‘Can’t pay school fee’’for boys, 37.7 percent, and ‘‘Married or pregnant’’
ARTICLE IN PRESS
5In the sample aged 0–17, those whose father’s education is
unknown account for 6.1 percent and those whose mother’s
education is unknown account for 5.8 percent. These do not
highly correlate with the status of orphan. Thus, those whose
parental education is unknown are likely to be children either
whose parent has disappeared for some reason or whose parent
was not present when the child was born.
6This contradicts the conventional knowledge that the Muslim
culture prevents girl’s education (Bennel, 2002). In relation to
pregnancy or marriage, that is the major reason for girls’ dropout
of this age group. Restricted birth control of Catholic religion
may have some impact on female child in terms of increasing the
chance of dropout due to pregnancy, but further investigation
would be necessary for careful interpretation.
M. Nishimura et al. / International Journal of Educational Development 28 (2008) 161–175 167

Author's personal copy
ARTICLE IN PRESS
Table 2
Determinants of enrolment by gender and age group
Enrolment (Eij ¼ 1)
Primary level (Age 6–12) Secondary level (Age 13–18)
Female Male Female Male
Child characteristic
Age .050�� .046�� �.057�� �.054��
(9.10) (9.67) (�7.24) (�7.70)
Orphan ( ¼ 1) .028 .005 �.070y .031
(.87) (.17) (�1.75) (.98)
HH Head characteristics
Head aged 20–29 ( ¼ 1) �.037 .012 �.234� �.019
(�.95) (.37) (�2.37) (�.32)
Head aged 30–39 ( ¼ 1) �.006 .026 .039 �.012
(�.22) (1.30) (1.08) (�.34)
Head aged 50–59 ( ¼ 1) �.030 .020 �.028 .051y
(�.96) (.90) (�.84) (1.81)
Head aged over 60 ( ¼ 1) �.016 .016 .066� �.003
(�.52) (.68) (2.15) (�.11)
Gender of head (female ¼ 1) .046 �.053� �.006 .048
(1.18) (�2.17) (-.15) (1.14)
Catholic ( ¼ 1) �.032 �.003 �.075� �.007
(�1.52) (�.14) (�2.53) (�.31)
Muslim ( ¼ 1) .003 .011 .023 .012
(.12) (.44) (.57) (.36)
Household characteristics
Years of father’s education .004 .004 .009� .007y
(1.20) (1.31) (2.32) (1.84)
Years of mother’s education .006� .003 .005 �.004
(1.98) (1.06) (1.17) (�1.16)
Father’s education unknown ( ¼ 1) .014 �.102y �.054 �.137y
(.35) (�1.71) (�.90) (�1.91)
Mother’s education unknown ( ¼ 1) �.011 .010 .005 �.115
(�.28) (.24) (1.17) (�1.58)
Number of siblings aged between 6 and 18 �.003 �.001 .001 �.002
(�.88) (�.35) (.21) (�.40)
ln (asset-value in UShs.) .011 .009 .003 .029�
(1.10) (.94) (.22) (2.50)
ln (per capita expenditure in US$) �.017 .024y .068�� .019
(�1.11) (1.84) (3.36) (1.05)
ln (land in acres) .003 �.004 .002 .009
(.26) (�.44) (.015) (.67)
Region
West ( ¼ 1) .002 �.027 �.015 �.112��
(.07) (�1.14) (�.45) (�3.05)
Central ( ¼ 1) �.021 �.049� �.009 �.086��
(�.92) (�2.25) (�.30) (�2.69)
Pseudo R-square .208 .233 .242 .241
Observations 842 882 678 678
Note: Numbers in parentheses are z-values.��1 percent level.�5 percent level.y10 percent level.
M. Nishimura et al. / International Journal of Educational Development 28 (2008) 161–175168
Author's personal copy
for girls, 29.4 percent. ‘‘Can’t pay school fee’’ wasthe second most frequently cited reason for girls,23.5 percent. Thus, it is clear that school fees are themost important constraint for boys and that schoolfees and marriage/pregnancy are the two mostimportant constraints for girls in this age group.
4.2. The impacts of UPE on delayed enrolment and
attainment
4.2.1. Delayed enrolment
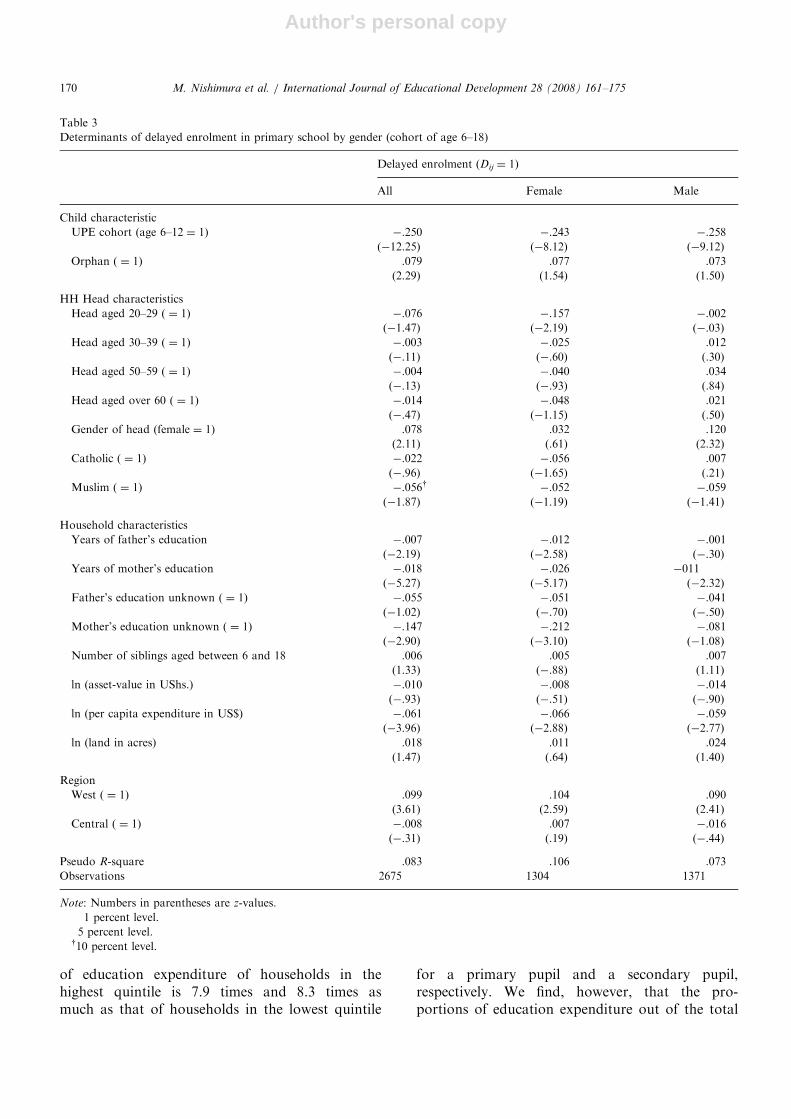
The results in Table 3 indicate that the UPEpolicy has reduced the delayed enrolment by 24.3percentage points for girls and 25.8 percentagepoints for boys. We also find that orphans andchildren in female-headed households are moreprone to delay enrolment. In contrast, children inMuslim households, children with educated parents,and children in high expenditure households are lesslikely to delay enrolment. We note that theeducation level of mothers seems to have a largeimpact on preventing delayed enrolment for bothgirls and boys, and that boys in female-headedhouseholds are more likely to delay enrolment. Inshort, socio-economic factors influence delayedenrolment in primary school, and the UPE policyis not sufficient to eliminate delayed enrolment byitself.
4.2.2. Educational attainment
Finally, the results in Table 4 indicate that theUPE policy has significantly increased educationalattainment in primary school. According to theresults, the completion rates of the fourth and fifthgrades increased more than 11 percentage points foryoung female adults aged 15–19 in the post-UPEcohort. In contrast, the UPE policy has ratherlimited impacts on young male adults: the comple-tion rates of the fourth grade increased by 4.4percentage points but the completion rate of thefifth grade did not increase significantly for maleyoung adults in the post-UPE cohort. We attemptedthe same equations for the sixth grade, but the UPEcohort did not show a statistical significance forboth male and female young adults. Thus, weconclude that the UPE policy has large positiveimpacts on the completion rates of primary educa-tion up to the fifth grade for female students butonly up to fourth grade for male students, and thesizes of the impacts are larger for female studentsthan male students.
We find both in Tables 3 and 4 that many socio-economic factors, such as educational resources andwealth variables, influence delayed enrolment andeducational attainment. Therefore, the results sug-gest that socio-economic factors still have asignificant influence on overall education attainmentin primary education even when the tuition is freeunder the UPE policy. This is why we examine theeducation expenditure next.
4.3. Private cost of education and its determinants
4.3.1. Private cost of education
Because our data do not have information oneducation costs for each child on each item, wecalculate the education cost per pupil by obtainingthe average per pupil spending on education fromhouseholds that have children either in primary orin secondary school. We then calculate the averageper capita spending for the primary and secondarylevels and obtain the ratio of primary to secondaryeducation costs at 1:8.7. Then, we apply this ratio tothe education spending of households that havechildren in both primary and secondary schools.After obtaining the education cost for each child inall households, we find the overall primary tosecondary cost ratio at 1:9.8, which is a little higherthan the previous ratio of 1:9.6 found by Appleton(2001).
As noted in the previous section, householdsbear the direct costs of primary education, e.g.,meals and uniform, even under UPE. In Uganda,the estimated cost per pupil varies tremendouslyby child. We find that the average annual spendingon education is approximately 41,800 shillings(US$21) per pupil in primary education and409,800 shillings (US$206) per pupil in secondaryeducation, while the median spending is at about15,000 shillings (US$7.5) and 205,000 shillings(US$103) for primary and secondary, respectively.In terms of the proportion of education expendi-ture out of the total household expenditure, it is2.7 percent for each primary pupil and 15.5 percentfor each secondary pupil. Compared to othercountries, the proportion is low for primaryeducation but high for secondary education (WorldBank, 2002).
When we look at the education expenditureper pupil in Uganda Shillings (Ushs) by the percapita household expenditure quintile, it is clearthat the absolute expenditure level differs signifi-cantly across the expenditure quintiles. The amount
ARTICLE IN PRESSM. Nishimura et al. / International Journal of Educational Development 28 (2008) 161–175 169
Author's personal copy
of education expenditure of households in thehighest quintile is 7.9 times and 8.3 times asmuch as that of households in the lowest quintile
for a primary pupil and a secondary pupil,respectively. We find, however, that the pro-portions of education expenditure out of the total
ARTICLE IN PRESS
Table 3
Determinants of delayed enrolment in primary school by gender (cohort of age 6–18)
Delayed enrolment (Dij ¼ 1)
All Female Male
Child characteristic
UPE cohort (age 6–12 ¼ 1) �.250�� �.243�� �.258��
(�12.25) (�8.12) (�9.12)
Orphan ( ¼ 1) .079� .077 .073
(2.29) (1.54) (1.50)
HH Head characteristics
Head aged 20–29 ( ¼ 1) �.076 �.157� �.002
(�1.47) (�2.19) (�.03)
Head aged 30–39 ( ¼ 1) �.003 �.025 .012
(�.11) (�.60) (.30)
Head aged 50–59 ( ¼ 1) �.004 �.040 .034
(�.13) (�.93) (.84)
Head aged over 60 ( ¼ 1) �.014 �.048 .021
(�.47) (�1.15) (.50)
Gender of head (female ¼ 1) .078� .032 .120�
(2.11) (.61) (2.32)
Catholic ( ¼ 1) �.022 �.056 .007
(�.96) (�1.65) (.21)
Muslim ( ¼ 1) �.056y �.052 �.059
(�1.87) (�1.19) (�1.41)
Household characteristics
Years of father’s education �.007� �.012� �.001
(�2.19) (�2.58) (�.30)
Years of mother’s education �.018�� �.026�� �011�
(�5.27) (�5.17) (�2.32)
Father’s education unknown ( ¼ 1) �.055 �.051 �.041
(�1.02) (�.70) (�.50)
Mother’s education unknown ( ¼ 1) �.147�� �.212�� �.081
(�2.90) (�3.10) (�1.08)
Number of siblings aged between 6 and 18 .006 .005 .007
(1.33) (�.88) (1.11)
ln (asset-value in UShs.) �.010 �.008 �.014
(�.93) (�.51) (�.90)
ln (per capita expenditure in US$) �.061�� �.066�� �.059��
(�3.96) (�2.88) (�2.77)
ln (land in acres) .018 .011 .024
(1.47) (.64) (1.40)
Region
West ( ¼ 1) .099�� .104� .090�
(3.61) (2.59) (2.41)
Central ( ¼ 1) �.008 .007 �.016
(�.31) (.19) (�.44)
Pseudo R-square .083 .106 .073
Observations 2675 1304 1371
Note: Numbers in parentheses are z-values.��1 percent level.�5 percent level.y10 percent level.
M. Nishimura et al. / International Journal of Educational Development 28 (2008) 161–175170

Author's personal copy
expenditure are remarkably similar across expendi-ture quintiles: the proportion of education expendi-ture per pupil is about 2–3 percent at the primaryeducation level but is 13–16 percent at the secondaryeducation level. The low proportions for theprimary education level may be due to the UPEpolicy as found by earlier studies (MOES, 2001;Deininger, 2003).
4.3.2. Determinants of private expenditure on
education
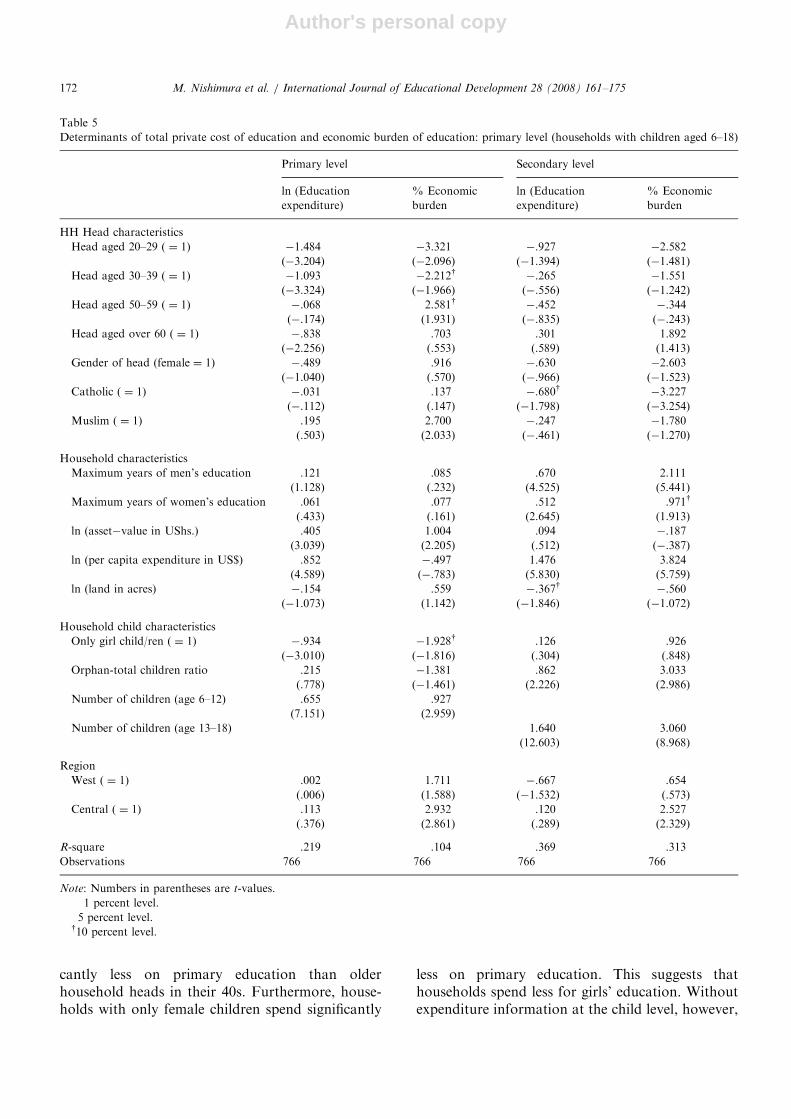
According to the regression results in Table 5, theeducation expenditure at the primary educationlevel is positively associated with asset-value, percapital household expenditure, and the number ofchildren in the household. Households with younghousehold heads in the 20s and 30s spend signifi-
ARTICLE IN PRESS
Table 4
Determinants of attainment up to grade 5 by gender (cohort of age 15–24)
Grade 4 attainment (A4ij ¼ 1) Grade 5 attainment (A5ij ¼ 1)
All Female Male All Female Male
Child characteristic
UPE cohort (age 15–19 ¼ 1) .079�� .111�� .044� .063�� .113�� .013
(5.86) (5.62) (2.52) (3.53) (4.30) (.52)
HH Head characteristics
Head aged 20–29 ( ¼ 1) �.063�� �.089�� �.021 �.080� �.067 �.078
(�2.60) (�2.60) (�.66) (�2.45) (�1.52) (�1.55)
Head aged 30–39 ( ¼ 1) �.030 �.048 �.002 �.036 �.029 �.033
(�1.29) (�1.49) (�.06) (�1.17) (�.71) (�.68)
Head aged 50–59 ( ¼ 1) .005 �.017 .017 .009 .025 �.015
(.31) (�.61) (.76) (.39) (.71) (�.46)
Head aged over 60 ( ¼ 1) �.009 �.013 �.010 .003 .015 �.012
(�.52) (�.46) (�.46) (.12) (.44) (�.36)
Gender of head (female ¼ 1) �.034y .006 �.065� �.008 .008 �.019
(�1.74) (.20) (�2.52) (�.31) (.21) (�.49)
Catholic ( ¼ 1) �.040�� �.027 �.046� �.062�� �.058� �.064�
(�2.75) (�1.37) (�2.32) (�3.09) (�2.06) (�2.30)
Muslim ( ¼ 1) �.043� �.040 �.036 �.058� �.037 �.078y
(�2.10) (�1.43) (�1.27) (�2.09) (�.98) (�1.95)
Household characteristics
Max. years of men’s education .020�� .021� .018� .017� .017 .017y
(3.18) (2.07) (2.48) (2.32) (1.40) (1.84)
Max. years of women’s education .024� .036� .014 .040�� .051�� .031y
(2.38) (2.32) (1.16) (3.26) (2.80) (1.90)
ln (Asset�value in UShs.) .019�� .019y .017� .035�� .034� .038��
(2.74) (1.93) (1.99) (3.71) (2.37) (3.04)
ln (per capita expenditure in US$) .020� .027� .010 .049�� .065�� .030y
(2.26) (2.15) (.90) (3.96) (3.60) (1.80)
ln (land in acres) �.020�� �.028�� �.013 �.036�� �.042�� �.033��
(�3.15) (�2.96) (�1.56) (�4.12) (�3.21) (�2.77)
Region
West ( ¼ 1) �.056�� �.018 �.085�� �.086�� �.033 �.136��
(�3.27) (�.77) (�3.58) (�3.70) (�1.03) (�4.15)
Central ( ¼ 1) .021 .034y .009 .017 .028 .009
(1.40) (1.74) (.40) (.81) (.96) (.29)
Pseudo R-square .123 .153 .121 .097 .115 .096
Observations 1838 939 899 1838 939 899
Note: Numbers in parentheses are z-values.��1 percent level.�5 percent level.y10 percent level.
M. Nishimura et al. / International Journal of Educational Development 28 (2008) 161–175 171
Author's personal copy
cantly less on primary education than olderhousehold heads in their 40s. Furthermore, house-holds with only female children spend significantly
less on primary education. This suggests thathouseholds spend less for girls’ education. Withoutexpenditure information at the child level, however,
ARTICLE IN PRESS
Table 5
Determinants of total private cost of education and economic burden of education: primary level (households with children aged 6–18)
Primary level Secondary level
ln (Education
expenditure)
% Economic
burden
ln (Education
expenditure)
% Economic
burden
HH Head characteristics
Head aged 20–29 ( ¼ 1) �1.484�� �3.321� �.927 �2.582
(�3.204) (�2.096) (�1.394) (�1.481)
Head aged 30–39 ( ¼ 1) �1.093�� �2.212y �.265 �1.551
(�3.324) (�1.966) (�.556) (�1.242)
Head aged 50–59 ( ¼ 1) �.068 2.581y �.452 �.344
(�.174) (1.931) (�.835) (�.243)
Head aged over 60 ( ¼ 1) �.838� .703 .301 1.892
(�2.256) (.553) (.589) (1.413)
Gender of head (female ¼ 1) �.489 .916 �.630 �2.603
(�1.040) (.570) (�.966) (�1.523)
Catholic ( ¼ 1) �.031 .137 �.680y �3.227��
(�.112) (.147) (�1.798) (�3.254)
Muslim ( ¼ 1) .195 2.700� �.247 �1.780
(.503) (2.033) (�.461) (�1.270)
Household characteristics
Maximum years of men’s education .121 .085 .670�� 2.111��
(1.128) (.232) (4.525) (5.441)
Maximum years of women’s education .061 .077 .512�� .971y
(.433) (.161) (2.645) (1.913)
ln (asset�value in UShs.) .405�� 1.004� .094 �.187
(3.039) (2.205) (.512) (�.387)
ln (per capita expenditure in US$) .852�� �.497 1.476�� 3.824��
(4.589) (�.783) (5.830) (5.759)
ln (land in acres) �.154 .559 �.367y �.560
(�1.073) (1.142) (�1.846) (�1.072)
Household child characteristics
Only girl child/ren ( ¼ 1) �.934�� �1.928y .126 .926
(�3.010) (�1.816) (.304) (.848)
Orphan-total children ratio .215 �1.381 .862� 3.033��
(.778) (�1.461) (2.226) (2.986)
Number of children (age 6–12) .655�� .927��
(7.151) (2.959)
Number of children (age 13–18) 1.640�� 3.060��
(12.603) (8.968)
Region
West ( ¼ 1) .002 1.711 �.667 .654
(.006) (1.588) (�1.532) (.573)
Central ( ¼ 1) .113 2.932�� .120 2.527
(.376) (2.861) (.289) (2.329)
R-square .219 .104 .369 .313
Observations 766 766 766 766
Note: Numbers in parentheses are t-values.��1 percent level.�5 percent level.y10 percent level.
M. Nishimura et al. / International Journal of Educational Development 28 (2008) 161–175172
Author's personal copy
we are not able to draw a concrete conclusion onthis issue.
Turning to orphans, we find that the ratio oforphans out of the total number of children doesnot affect the education expenditure at the primaryeducation level but increases it at the secondarylevel. By using the same data as in thispaper, Yamano et al. (2006) found that orphansare likely to stay with relatively wealthy households.This may imply that they may tend to stay inhouseholds who can afford to spend more, in bothabsolute and relative expenditure, at the secondarylevel. We need further investigation, however, onthe causality of the adoption of orphans andeducation spending.
In terms of the economic burden of education, theMuslim religion and the Central region are sig-nificant factors that have positive association withthe economic burden. The household assets alsopositively contribute to the economic burden ofeducation. In contrast, the age of household headand having only female children are negativelyassociated with the economic burden of education.The households with only female children spend lessproportion of household expenditure on education,which suggests a low priority placed on girls’education.
5. Policy implications and conclusions
As shown in the previous section, the UPE policyseems to have decreased delayed enrolment inprimary school and achieved higher educationalattainment at least up to grade 4 for boys and grade5 for girls in primary education. The UPE policy hasalso achieved a low economic burden of educationat the primary level for all households, regardless oftheir household expenditure level. As a result, theUPE policy has positive impacts on the poor,especially girls, in improving their access to school.In this respect, the UPE policy has contributed tothe access and equity of education as a pro-poorpolicy.
However, the study also reveals that there shouldbe more than just the one demand-side policyintervention of reducing the school tuition in publicprimary education to achieve universal primaryeducation. First, internal inefficiency, such asdelayed enrolment and repetition, remains a majorproblem in primary education in Uganda. Thus,further policy interventions would be necessary torespond to the reasons for internal inefficiency. The
proper supply-side-policy interventions, such asproviding enough school facilities in the nearbyneighbourhood, or the demand-side-policy inter-ventions, such as improving parental awareness,should follow the abolition of school tuition.In response to these challenges, the Ministryof Education and Sports is currently makingefforts to pay special attention to schools inthe ‘‘hard-to-reach’’ areas. Special policy inter-ventions in these areas have recently been ac-cepted in the form of top-up salary and pro-vision of housing for teachers. Also, schoolconstruction in the remote areas is to be facilitatedusing school mapping based on the recentGeographic Information Survey (GIS) results.Such targeting strategies are believed to furtherthe benefits of UPE to marginalised children(Malinga, 2005).
Second, although this study does not investigatethe quality of education in detail, quality improve-ments would be essential for retaining pupils atupper grades. A government report indicates thatnumbers of teachers and schools increased by 41percent while the enrolment increased by 171percent between 1997 and 2004 (MOES, 2005). Thisraises concerns of deterioration in the quality ofpublic primary schools.
Finally, low completion rates in upper gradessuggest high indirect costs for older children. Whilethe UPE policy reduces the costs of primaryeducation, more comprehensive rural developmentstrategies should increase the benefits from primaryeducation so that the expected benefits exceed thetotal costs of the direct and indirect costs ofeducation.
From the supply side perspective, the fundingscheme for primary schools could provide betterincentives for them to reduce internal inefficiency.For instance, the Government of Uganda provideseach public primary school the capitation grantbased on the number of pupils in the school. Underthis financing scheme, schools have incentives tokeep as many pupils as possible. This could alsoprovide an incentive for schools to encourage pupilsto repeat grades. The question remains as towhether this potential incentive is strong enoughfor schools to worsen internal inefficiency.Although we do not have empirical evidence toeither support or dismiss this incentive, the fundingscheme should be modified to avoid such apossibility. For instance, some sort of rewardschemes for schools that achieve high internal
ARTICLE IN PRESSM. Nishimura et al. / International Journal of Educational Development 28 (2008) 161–175 173

Author's personal copy
efficiency could be useful as an alternative fundingscheme.7
Public resource allocation is a difficult endeavourin countries like Uganda where resources areextremely limited. Uganda’s UPE has been success-ful in expanding educational opportunities tochildren in poor households. The next step shouldtarget marginalised children who have not receivedbenefits from the current UPE. For the supply-sidepolicy intervention, improvements in the qualityand internal efficiency of public primary educationshould be enhanced, coupled with more compre-hensive rural development strategies.
References
Appleton, S., 2001. Education, Income and Poverty in Uganda in
the 1990s. CREDIT Research Paper 1 (22).
Avenstrup, R., Liang, X., Nellemann, S., 2004. Kenya, Lesotho,
Malawi and Uganda: universal primary education and
poverty reduction. A paper presented at the Scaling up
Poverty Reduction; A Global Learning Process and Con-
ference in Shanghai, May 25–27, 2004.
Bennell, P., 2002. Hitting the target: doubling primary school
enrolments in Sub-Saharan Africa by 2015. World Develop-
ment 30 (7), 1179–1194.
Birsdsall, N., Ross, D., Sabot, R., 1997. Education, growth, and
inequality. In: N. Birdsall, F. Jaspersen (Eds.), Pathways to
Growth: Comparing East Asia and Latin America. Inter-
American Development Bank, Washington, DC, pp. 93–130.
Distributed by the Johns Hopkins University Press.
Black, T.R., Namwadda, R., Mugambe, J., Walugembe, E.,
Esanu, C., 1999. Educational growth in Uganda. Interna-
tional Journal of Educational Development 19, 111–126.
Bray, M., Lillis, K., 1988. Community Financing of Education:
Issues and Policy Implications in Less Developing Countries.
Pergamon Press, Oxford.
Carceles, G., Fredriksen, B., Patrick, W., 2001. Can Sub-Saharan
Africa Reach the International Targets for Human Develop-
ment? An Assessment of Progress towards the Targets of the
1998 Second Tokyo International Conference on African
Development (TICADII). World Bank, Washington, DC.
Carnoy, M., Levin, H.M., 1985. Education and the changing
American workplace. In: Schooling and Work in the
Democratic State. Stanford University Press, Stanford, CA,
pp. 52–75.
Colclough, C., Lewin, K., 1993. Educating All the Children:
Strategies for Primary Schooling in the South. Clarendon
Press, Oxford.
Deininger, K., 2003. Does cost of schooling affect enrolment by
the poor? Universal Primary Education in Uganda. Econom-
ics of Education Review 22, 291–305.
Govinda, R., 2003. Making basic education work for the poor:
experiences from the South. In: Subrahmanian, R., et al.
(Eds.), IDS Bulletin, Special Issues on Education Inclusion
and Exclusion: Indian and South African Perspectives,
vol. 23(1).
Inter-Agency for Basic Education for All, 1990. Meeting the
Basic Human Needs: A Background Report for the World
Conference on Basic Education for All. Inter-Agency
Commission, United Nations, New York.
Kitaev, I., 2001. Private Education in Sub-Saharan Africa: A Re-
Examination of Theories and Concepts Related to its
Development and Finance. IIEP, UNESCO, Paris.
Malinga, F., 2005. Interview notes of authors with Ms. Florence
Malinga, Commissioner Education Planning, Ministry of
Education and Sports, Uganda, August 19, 2005.
Mehrotra, S., Delamonica, E., 1998. Household costs and public
expenditure on primary education in five low income
countries: a comparative analysis. International Journal of
Educational Development 18 (1), 41–61.
Pender, J., Jagger, P., Nkonya, E., Sserunkuuma, D., 2001.
Development Pathways and Land Management in Uganda:
Cases in Uganda: Causes and Implications. EPTD Discussion
Paper 85. International Food Policy Research Institute.
Washington, DC.
Psacharopoulos, G., 1994. Returns to investment in education: a
global update. World Development 22 (9), 1325–1343.
Suzuki, I., 2002. Parental participation and accountability in
primary schools in Uganda. Compare 32 (2), 243–259.
Tan, J., Soucat, A., Mingat, A., 2001. Enhancing Human
Development in the HIPC/PRSP Context: Progress in the
Africa Region during 2000. World Bank, Washington, DC.
Tsang, M.C., 1994. Costs of education in China: issues of
resource mobilisation, equality, equity, and efficiency. Educa-
tion Economics 2 (3), 287–312.
Tsang, M.C., Kidchanapanish, S., 1992. Private resources and the
quality of primary education in Thailand. International
Journal of Educational Research 17 (2), 179–198.
Uganda, the Ministry of Education and Sports, 2001. The
2001 Uganda DHS EdData Survey: Findings. MOES,
Kampala.
Uganda, the Ministry of Education and Sports, 2003. Technical
Note on Primary Repetition, Survival, and Completion Rates
Before and After Universal Primary Education (UPE) in
Uganda. MOES, Kampala.
Uganda, the Ministry of Education and Sports, 2005. The
Education Management Information System (EMIS) Data.
MOES, Kampala.
UNAIDS/UNICEF/USAID, 2004. Children on the Brink 2004:
A Joint Report on New Orphan Estimates and a Framework
for Action. United Nations, New York.
UNESCO, 1998. World Education Report 1998. UNESCO,
Paris.
UNESCO, 2000. The EFA 2000 Assessment: Country Reports:
Uganda. UNESCO, Paris.
UNESCO, 2005. EFA Global Monitoring Report 2005. UN-
ESCO, Paris.
ARTICLE IN PRESS
7Currently, the capitation grant is calculated by multiplying 25
shillings per pupil per day by the number of pupils in school and
270 school days. In the education sector review meeting in 2004,
the Ministry of Finance and Planning proposed a plan to provide
each school with an additional 100,000 shillings per month. This
plan would contribute to assist small schools, but would similarly
result in lowering the performance-based incentive of schools.
Thus, a more preferable incentive scheme would be to reward
teachers whose classes or schools improved repetition or dropout
rates so that the inventive scheme would directly link to the
quality improvement of the school.
M. Nishimura et al. / International Journal of Educational Development 28 (2008) 161–175174

Author's personal copy
World Bank, 2002. Community Support for Basic Edu-
cation in Sub-Saharan Africa. World Bank, Washington,
DC.
Yamano, T., Sserunkuuma, D., Otsuka, K., 2004. The REPEAT
Survey in Uganda: Results. FASID Development Data-
base, 2004-09-01. Foundation for Advanced Studies on
International Development (downloadable from /http://www3.grips.ac.jp/�21coe/j/index.htmlS). Tokyo.
Yamano, T., Shimamura, Y., Sserunkuuma, D., 2006. Living
arrangements and schooling of orphaned children and
adolescents in Uganda. Economic Development and Cultural
Change 54 (4), 833–856.
ARTICLE IN PRESSM. Nishimura et al. / International Journal of Educational Development 28 (2008) 161–175 175