Quality Costs? - DiVA Portal
47
2007:146 CIV MASTER'S THESIS Quality Costs? Using quality costing to promote quality improvement in a Chinese company John-Arne Brekke Henrik Franzén Luleå University of Technology MSc Programmes in Engineering Industrial Business Administration Department of Business Administration and Social Sciences Division of Quality & Environmental Management 2007:146 CIV - ISSN: 1402-1617 - ISRN: LTU-EX--07/146--SE
-
Upload
khangminh22 -
Category
Documents
-
view
1 -
download
0
Transcript of Quality Costs? - DiVA Portal

2007:146 CIV
M A S T E R ' S T H E S I S
Quality Costs?Using quality costing to promote quality
improvement in a Chinese company
John-Arne Brekke Henrik Franzén
Luleå University of Technology
MSc Programmes in Engineering Industrial Business Administration
Department of Business Administration and Social SciencesDivision of Quality & Environmental Management
2007:146 CIV - ISSN: 1402-1617 - ISRN: LTU-EX--07/146--SE
Abstract The fast growing Chinese economy is reaching a point where quality becomes just as important as quantity. The low wages of the workers are rising and one day they will no longer be able to attract foreign direct investments. To be prepared Chinese companies should target quality already today. However, the quality concept is still somewhat vague to many people and to many companies. One way to make it more concrete is to calculate quality costs. Quality costs are a measure of how costly it is for the organization to lack in quality in any way. This way it is easier to understand quality and to see which areas should be prioritized in the quality improvement work. This thesis makes an attempt to map out the quality costs of a Chinese company. Based on the calculated quality costs areas of improvement potential are suggested to the management. This way the company’s improvement efforts can be directed to where they make the best use. Experienced benefits and difficulties when using quality cost calculations to bring about quality improvement work in a Chinese company are then discussed. During the course of the study it became evident that the company’s quality maturity was relatively low. For this reason the improvement suggestions were aimed at stimulating a quality focus and forming a systematic way of working with quality improvement in the organization. The quality cost calculations thereby got the role as an eye opener with the target to give the motivation needed to carry out quality improvement efforts; in this case implement the values of TQM. The specific suggestions are discussed within the framework of Bergman & Klefsjö’s quality cornerstones. By taking on the values of TQM the authors believe that a substantial amount of the company’s quality costs can be reduced. The authors’ experiences from using quality costing in a Chinese company are that it can be a very successful method to influence the management of a company to give quality more attention. To use money to describe which impact quality has on business has been a way for people who never worked with quality matters to understand the benefit of working preventive and not only repairing problems that arise. Implementing the method as a complement and guide for the quality improvement work was however not possible since a structured quality organization that could act on the information from a quality costing system was not in place.

Sammanfattning Den snabbväxande kinesiska ekonomin börjar närma sig en punkt där kvalitet blir lika viktigt som kvantitet. Arbetarnas låga löner stiger och kommer en dag inte längre räcka för att locka till sig utländska investeringar. För att vara beredda bör kinesiska företag satsa på kvalitet redan nu. Kvalitetsbegreppet är dock fortfarande lite otydligt för många människor och för många företag, men ett sätt att konkretisera vad kvalitet innebär är att beräkna kvalitetsbrist-kostnader. Det är ett mått på hur mycket det kostar att organisationen har bristande kvalitet i något avseende. Därmed blir det lättare att förstå kvalitet och att se vilka områden som bör prioriteras i kvalitetsförbättringsarbetet. Detta examensarbete gör ett försök att kartlägga kvalitetsbristkostnader i ett kinesiskt företag för att med det som grund föreslå för ledningen på vilka områden företaget har förbättrings-potential. På detta sätt ska företagets kvalitetsinsatser kunna riktas dit de gör mest nytta. Upplevda fördelar och nackdelar med att använda kvalitetsbristkostnadsberäkningar för att uppmuntra kvalitetsförbättringsarbete i ett kinesiskt företag diskuteras avslutningsvis. Under studien visade det sig att företaget hade en förhållandevis låg kvalitetsmognad vilket riktade förbättringsförslagen mot att stimulera ett kvalitetstänk och strukturera ett systematiskt kvalitetsförbättringsarbete i organisationen. Kvalitetsbristkostnadsberäkningarna fick därmed en roll som lägesbeskrivare och ögonöppnare med målet att ge den motivation som krävs för att bedriva kvalitetsförbättringsarbete, i detta fall implementera TQMs värderingar. De konkreta förbättringsförslagen diskuteras utifrån Bergman & Klefsjös hörnstensmodell. Genom att arbeta utifrån värderingarna i TQM bedömer författarna att en betydande sänkning av de uppmätta kvalitetsbristkostnaderna borde kunna genomföras. Författarnas erfarenheter av att använda kvalitetsbristkostnader i ett kinesiskt företag har varit att det kan vara en mycket framgångsrik metod för att förmå en företagsledning att uppmärksamma kvalitetsområdet. Att använda pengamåttet för att beskriva vad kvalitet innebär för företaget har varit ett sätt för människor som aldrig arbetat med kvalitet att förstå vikten av att arbeta förebyggande och inte enbart brandsläckande. Dock var förutsättningarna för att använda metoden som ett ständigt komplement till och guide för kvalitetsförbättrings-arbetet mindre bra eftersom det saknades en fungerande kvalitetsorganisation som kunde motta och utnyttja informationen ur ett kvalitetsbristkostnadssystem.

Contents
1 Introduction ......................................................................................1 1.1 Problem Area ............................................................................................... 1 1.2 Purpose........................................................................................................ 2 1.3 Focus ........................................................................................................... 2
2 Theoretical Frame of Reference .....................................................3 2.1 Quality Management .................................................................................... 3
2.1.1 Development of Quality Management in China ..................................... 4 2.1.2 TQM – Total Quality Management ........................................................ 4 2.1.3 Successfully Initiating Quality Improvement Work................................. 6 2.1.4 Principles of the Toyota Production System.......................................... 7 2.1.5 5S........................................................................................................ 10 2.1.6 The Quality Management Maturity Grid .............................................. 10
2.2 Quality Costing ........................................................................................... 12 2.2.1 Development and Definition of Quality Costs ...................................... 13 2.2.2 Categorization of Quality Costs........................................................... 14 2.2.3 The Functions of Quality Costing ........................................................ 15 2.2.4 Measure Quality Costs in Practice ...................................................... 16 2.2.5 Success Factors.................................................................................. 17 2.2.6 Analyzing Collected Costs................................................................... 18
3 Methodology...................................................................................19 3.1 Company Description ................................................................................. 19 3.2 Research Strategy...................................................................................... 19 3.3 Research Methods ..................................................................................... 20
3.3.1 Literature Study................................................................................... 20 3.3.2 Interviews............................................................................................ 20 3.3.3 Documentation .................................................................................... 21 3.3.4 Observations ....................................................................................... 21 3.3.5 Data Analysis ...................................................................................... 21
3.4 The Collection of Quality Costs .................................................................. 21 3.4.1 Training, Interviews and Observations ................................................ 22
3.5 Methodology discussion ............................................................................. 23
4 Empirical Studies ...........................................................................24 4.1 Compilation of Interviews and Observations .............................................. 24 4.2 Quality Costs.............................................................................................. 25
4.2.1 Quantified Cost Areas ......................................................................... 25 4.2.2 Cost Figures........................................................................................ 27 4.2.3 Non-Quantified Cost Areas ................................................................. 28 4.2.4 Market Situation .................................................................................. 29

5 Analysis and Conclusions ............................................................31 5.1 Quality Maturity .......................................................................................... 31 5.2 P1: Calculated Quality Costs...................................................................... 32 5.3 P2: Suggested Improvements .................................................................... 34
5.3.1 Management Commitment .................................................................. 34 5.3.2 Focus On Customers .......................................................................... 35 5.3.3 Base Decisions on Fact ...................................................................... 36 5.3.4 Focus On Processes........................................................................... 37 5.3.5 Improve Continuously ......................................................................... 37 5.3.6 Let Everybody Be Committed.............................................................. 38
5.4 P3: Experiences from Using Quality Costing In a Chinese Company ........ 39
6 Discussion ......................................................................................40
7 References......................................................................................41

INTRODUCTION
1 Introduction The authors of this thesis had the opportunity of traveling to eastern China to conduct the research for this thesis. Although China as a topic was initially not intended to be central in the thesis the cultural differences and linguistic difficulties inevitably had a great influence on the work and on the focus of this report. This opening chapter introduces the problem area and the purpose of the thesis that will be examined during the pages ahead.
1.1 Problem Area China is a sleeping giant. Let her lie and sleep, for when she awakens she will astonish the world. -Napoleon Bonaparte ~1803
The fast growing economy of China has been a frequent topic in books, newspapers and research articles throughout the recent decades. The world’s focus on China has been escalating exponentially ever since Deng Xiaoping initiated China’s open door policy in 1978; a door that had been more or less closed since the sixteenth century (Wu, 2005). With its vast population, hence a large potential labor force and low wages China has lately attracted innumerable multinational enterprises to produce goods at a low cost, justly giving the country the nickname “the world’s factory”. In the early 1990s the foreign direct investment (FDI) in China practically exploded and by 2002 China surpassed the US to become the world’s largest user of FDI (Wu, 2005). Since the year 1978 when China started its shift from centrally-planned to market economy the country has had an average GDP growth of 9 percent annually (World Bank, 2006). The giant is now awake. Logically there are low incitements of prioritizing cost cutting when all curves are pointing up and the market is growing fast. In such times you may feel that you profit more from putting your efforts into expanding rather than streamlining. Even though it is believed that China’s growth will continue for still many years, partly due to the seemingly endless reserve of inexpensive and diligent labor, the rate at which the economy grow will most likely decrease (SPECIAL: KINA, 2005). When the reserve of labor eventually is emptied raising productivity is expected become an important source to help sustain a high growth (SPECIAL: KINA, 2005; Clarke, 1999). One effective way of raising productivity is by improving quality. If China gained a reputation for producing high-quality products multinational enterprises would be attracted to invest in China even after the point when China no longer can offer among the world’s cheapest labor. But how can one change a country’s attitude towards quality? Quality is an area that people in general interpret in very different ways (Bergman & Klefsjö, 2003). There is no explicit definition of the word as it can have several different meanings depending on the context in which it is used. Moreover, the quality department in many companies does not have as specific of a role as most other departments. The quality function within companies, and the subject area as a whole, is therefore often difficult to understand and to measure the performance of (Sörqvist, 2001). Consequently the importance of good quality management can be underestimated. A method that makes quality more tangible is quality costing – to measure costs related to poor quality (Campanella, 1999). These are called quality costs. Quality costing means putting a money value on costs that are caused by poor quality and helps everyone to easier
- 1 -

INTRODUCTION
relate to the quality area and its purposes. The method is meant to bring wasted resources, ineffective processes as well as missed opportunities out into the light. By using quality costing as a tool, quality management could be allowed the resources required and attention needed to make quality improvement a priority before cost cutting becomes a necessity for the company’s survival.
1.2 Purpose The authors have not managed to find any previous research that has applied the quality costing method to companies in China. Every country and every culture provides different conditions for working with quality as well as for anything else (Sousa-Poza et al., 2001). The overall purpose of this thesis is therefore to shed some new light on the area of quality costing by applying the findings of previous research in an attempt to measure quality costs in a Chinese company. To specify the purpose it has been divided into three parts – P1 through P3. The first part is to attempt to estimate quality costs at a Chinese company.
P1: Estimate current quality costs. The collected quality cost in itself will not be useful unless it trigger quality improvements in areas where improvement is needed. To make [P1] meaningful the costs identified should be analyzed to find areas of the greatest improvement possibilities and suggest appropriate actions to lower those costs.
P2: Identify areas of improvement potential and suggest appropriate actions.
The entire process of calculating the quality cost is studied continuously while working on the thesis to identify benefits and of the method in the studied environment. These observations constitute a base for discussing whether quality costing is an appropriate method to guide quality improvement in a Chinese company.
P3: Identify benefits and difficulties in using quality costing as a method to guide quality improvement in a Chinese company.
1.3 Focus Because time is scarce the depth of the quality cost estimation will only be as large as is possible under the given circumstances. A number of quality cost areas would not be possible cover in this thesis due to their complexity and the limited time at hand. For this reason the calculation of quality costs will be focused only on the costs that are defined as non-conformance costs, that is, costs that result from quality failures in any way. As many and detailed costs as possible will be calculated in this area prioritizing the costs that are believed to be the largest. Other categories of quality costs will be left out.
- 2 -

THEORETICAL FRAME OF REFERENCE
2 Theoretical Frame of Reference
- 3 -
This chapter contains two focus areas. The first part will give an insight in quality management in general and the following part will focus on quality costing as a method to support and guide quality management. The Swedish and French branch of the specific company that is studied in this thesis have successfully worked with 5S and the Toyota Production System for several years. As the company wishes to harmonize its subsidiaries’ operations these tools are given a large focus in this thesis.
2.1 Quality Management How much profit did you make from your quality improvement work last year? That question would leave many business managers puzzled. Fact is that several researchers claim that quality work should no longer be seen as costs but rather as investments (i.e. Bergman & Klefsjö, 2003; Wessel & Burcher, 2004). Figure 1 shows how Bergman and Klefsjö (2003) illustrated the connection between improved quality and improved profitability.
Figure 1: The connection between improved quality and improved
profitability (from Bergman & Klefsjö, 2003) The two paths to improved profitability are through improved internal and external quality respectively. External quality in this context corresponds to how well a company manages to do the right things, that is, fulfill the customer’s needs. Internal quality on the other hand is related to doing things right, which mean that the company fulfills the customer’s needs in an efficient and responsible way (Bergman & Klefsjö, 2003). Based on this the definition of quality used in this thesis will be that quality is to do the right things and to do things right. Quality management is used as a name for managing to attain quality. The definition that will be used is to increase customer satisfaction while using fewer resources.

THEORETICAL FRAME OF REFERENCE
- 4 -
2.1.1 Development of Quality Management in China China has a long history of quality. According to Liu and Willborn (referred to in Zhang, 2000) China was the first country in the world to adopt a type of quality management. As early as in the eleventh century BC laws were introduced that prohibited substandard products to be sold on the market. The quality management at that time however was dependent on the craftsmen’s own experience and attitudes (Li, Anderson & Harrison, 2003). Since then the Chinese quality management has lost ground. As for the last century Chin, Pun and Hua (2001) have identified three phases in the evolution of Chinese quality management. Firstly, between 1949 and 1956, there was a period of Soviet influence on management as a whole also affecting quality management. The centrally planned economy, providing a non-competitive environment, and a lack of customer focus led to low quality awareness even though many enterprises had made use of quality control techniques. Following the years of Soviet friendship were two decades of Chinese style quality control (1957-1977) characterized by government attempts to boost quality by developing quality standards and introducing policies for work rotation and quality circles for instance. This work was interrupted in 1966 by the outbreak of the Cultural Revolution (1966-1976) causing serious damage to all quality related efforts. A more systematic implementation of quality management was implemented during the third phase that Chin et al. (2001) identified (the transformational phase, 1978-2000). During this period TQM and ISO standards were adopted and awards to stimulate quality efforts were introduced (Zhang, 2000). Studies show that although efforts have been made to promote quality to Chinese enterprises the implementation so far has not progressed as well as hoped (Li et al., 2003; Zhang, 2000). Large variation among studied enterprises have also been revealed showing that the newer forms of ownership, joint ventures and privately owned ventures, have reached further than the state owned enterprises in implementing quality management (Li et al., 2003). The reasons for China’s relatively low quality of products are mostly related to the relatively low ideological and moral quality and the scientific and cultural quality of the whole nation (Zhang, 2000). The people’s attitude towards quality will need to be changed in order to raise the nation to international standards.
2.1.2 TQM – Total Quality Management Total Quality Management (TQM) has been one of the buzzwords among quality experts the recent decades. To Bergman & Klefsjö (2003) TQM implies an integrated and continuously ongoing effort to a raise quality and customer satisfaction throughout the whole organization, whereas management commitment is the crucial basis for a successful outcome. Crosby (1979) takes it even further when he claims that management understanding of and attitude towards quality is not only vital, it is everything. Bergman & Klefsjö (2003) see TQM as based on five fundamental values which they call the cornerstones (Figure 2). These cornerstones are each of great importance separately, but a positive synergy will come into effect when they are unified and regarded as a whole. The foundation of TQM is management commitment (Bergman & Klefsjö, 2003). Without the commitment of management an organization will not succeed in implementing the cornerstones. Each and one of the cornerstones are explained further below.

THEORETICAL FRAME OF REFERENCE
- 5 -
- 5 -
Figure 2: The cornerstones of quality (from Bergman & Klefsjö, 2003) Figure 2: The cornerstones of quality (from Bergman & Klefsjö, 2003)
Focus on processes
Improve
continuously
Base decisions
on fact
Let everybody be
committed
Focus on customers
Management Commitment
Focus on customers Focus on customers The most important part of running a business is the customers and the perspective of the customers should always be the highest priority in improvement efforts and projects (Sörqvist 2004). To focus on customers is to gather information about our customer’s needs and expectations on a regular basis. That information should be used as guidance for business development in order to meet and if possible exceed customer expectations. The focus on customers is also supposed to include the internal ones – the employees – as much as the external ones. It is necessary to give the employees enough room and support in order to encourage the growth of a positive work environment where the employees can perform in a way that they are satisfied and proud of. Satisfied internal customers will have a positive effect on a company’s external customers. (Bergman & Klefsjö, 2003)
The most important part of running a business is the customers and the perspective of the customers should always be the highest priority in improvement efforts and projects (Sörqvist 2004). To focus on customers is to gather information about our customer’s needs and expectations on a regular basis. That information should be used as guidance for business development in order to meet and if possible exceed customer expectations. The focus on customers is also supposed to include the internal ones – the employees – as much as the external ones. It is necessary to give the employees enough room and support in order to encourage the growth of a positive work environment where the employees can perform in a way that they are satisfied and proud of. Satisfied internal customers will have a positive effect on a company’s external customers. (Bergman & Klefsjö, 2003) Base decisions on fact Base decisions on fact One of the fundamental ideas of TQM is to base decisions on fact (Bergman & Klefsjö, 2003). However in order to do this facts needs to be collected and analyzed. Part of the needed information is about the customers and their needs and expectations. This information can be gathered by using customer surveys. Bergman & Klefsjö (2003) also stress the importance of being able to collect, analyze and understand verbal information such as people’s feelings and opinions. Sörqvist (2004) on the other hand claims that attempting to interpret emotional values might lead to non optimal decisions. It is better to concentrate on the hard facts that underlie people’s different apprehensions.
One of the fundamental ideas of TQM is to base decisions on fact (Bergman & Klefsjö, 2003). However in order to do this facts needs to be collected and analyzed. Part of the needed information is about the customers and their needs and expectations. This information can be gathered by using customer surveys. Bergman & Klefsjö (2003) also stress the importance of being able to collect, analyze and understand verbal information such as people’s feelings and opinions. Sörqvist (2004) on the other hand claims that attempting to interpret emotional values might lead to non optimal decisions. It is better to concentrate on the hard facts that underlie people’s different apprehensions. Internal information should also be collected for managers to be able to make the right decisions regarding production for instance (Bergman & Klefsjö, 2003). Variations in production can be monitored using control charts and other tools.
Internal information should also be collected for managers to be able to make the right decisions regarding production for instance (Bergman & Klefsjö, 2003). Variations in production can be monitored using control charts and other tools. Focus on processes Focus on processes A company’s operations can be described as a process where information and raw material are transformed into goods and services in order to create customer value (Bergman & Klefsjö, 2003). This process is a chain of several activities that are linked together and all contribute to the final output. Many companies still have a vertical mindset but processes cut horizontally through the organization. By having a process view attention is focused on how a company creates value to its customers instead of who is in charge of each specific function (Bergman & Klefsjö, 2003). A process view is thereby also a way to create structure in the organization and to systemize the different tasks. Something that is essential in quality
A company’s operations can be described as a process where information and raw material are transformed into goods and services in order to create customer value (Bergman & Klefsjö, 2003). This process is a chain of several activities that are linked together and all contribute to the final output. Many companies still have a vertical mindset but processes cut horizontally through the organization. By having a process view attention is focused on how a company creates value to its customers instead of who is in charge of each specific function (Bergman & Klefsjö, 2003). A process view is thereby also a way to create structure in the organization and to systemize the different tasks. Something that is essential in quality

THEORETICAL FRAME OF REFERENCE
- 6 -
management. If we want to improve it is important to know our current status. “If we don’t know where we are it’s difficult to know which direction we need to go to reach our goal.” While the work within each individual department may seem to be carried out in a well ordered and efficient way it might not be optimized with respect to the whole process. Keep up a reliable and leveled flow from input to output is one of the major objectives for quality improvement and business development. (Sörqvist 2004) To focus on customers implies to study, evaluate and revise main as well as support- and management processes on a continuous basis in order to produce an outcome that will satisfy customers’ needs while using fewer resources. (Bergman & Klefsjö 2003) Improve continuously We live in an ever faster changing world where customers’ needs may vary from day to day and where new sophisticated products and services and new competitors continuously enter a global market. This requires companies to constantly develop to stay competitive. Develop in the sense of improved quality of products, business and its processes. Skilled competitors in a tough business environment are not the only reason why companies should work with continuous improvements. Develop business activities and processes leads to a decrease in quality costs as well. It is not unusual that costs due to poor quality are in the range of 10%-30% of total sales (Bergman & Klefsjö, 2003). To improve continuously contributes to a win-win situation to the company and its customers. In the long run large as well as small improvements lead to an increase in customer satisfaction while using fewer resources (Bergman & Klefsjö 2003). Let everybody be committed The final cornerstone illuminates the importance of individual employee commitment in their work with continuous improvements. People in general put higher trust in something they have been a part of and are more reluctant towards decisions or rules made by others (Sörqvist 2004). To let everybody be committed means making it easier for employees to be part of work and processes with the aim of improving quality. Great attention on communication, delegation and education is seen as crucial in this work. To have committed employees lead to a raise in employee satisfaction and is an important step in a company’s striving towards better quality. (Bergman & Klefsjö 2003)
2.1.3 Successfully Initiating Quality Improvement Work For quality work to be successful it should be initiated by getting the management committed (Sörqvist, 2001). Without the support and commitment from the management it is difficult to inspire the staff and to get the resources needed to achieve much improvement (Bergman & Klefsjö, 2003). When the management is convinced enough to support an initial quality improvement project the attitude of the employees should be focused. Education and discussion is a good way to inspire both management and employees, but even better is to show actual improvement from the initial projects (Bergman & Klefsjö, 2003). When real improvement is presented the commitment throughout the organization will increase further. This is why simple projects should be prioritized to begin with. Systematization is what preserves the improvements that are made through the quality improvement work. This involves documenting work routines and processes and should be

THEORETICAL FRAME OF REFERENCE
- 7 -
- 7 -
kept at a minimum at first (Sörqvist, 2001). By focusing on improvements in the beginning attitudes will be positive and commitment will rise. Documentation could instead decrease commitment initially as it can be considered bureaucratic but should be intensified later. Sörqvist (2001) illustrates this suggested way to start off quality improvement work in Figure 3.
kept at a minimum at first (Sörqvist, 2001). By focusing on improvements in the beginning attitudes will be positive and commitment will rise. Documentation could instead decrease commitment initially as it can be considered bureaucratic but should be intensified later. Sörqvist (2001) illustrates this suggested way to start off quality improvement work in
Figure 3.
Figure 3: Illustration of how to effectively initiate quality
improvement work (from Sörqvist, 2001).
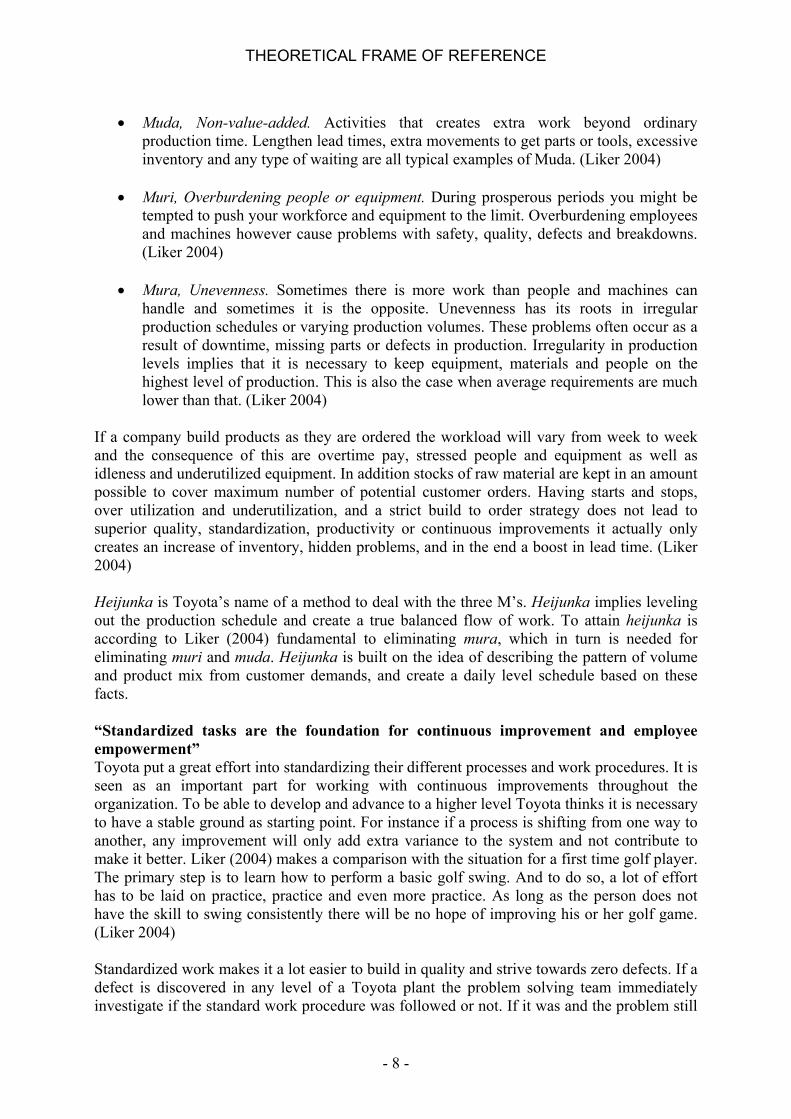
2.1.4 Principles of the Toyota Production System The Japanese car manufacturer Toyota has gained a world wide reputation for its superior quality. Toyota’s success is largely a result of their strong focus on lean manufacturing where well known working methods and concepts like just-in-time, kaizen, one-piece flow, jidoka, heijunka etc are some of the tools These tools are part in a structure called the Toyota Production System (TPS) which also, among other things includes the importance of and understanding for human resources (Ohno, 1988). Jeffrey K. Liker (2004) summarized the basic values of TPS in a list consisting of fourteen management principles. These principles can be seen as Toyota’s DNA and gives an explanation of the different concepts which have taken the company to the world class status they have today. Some of these principles are of interest for this thesis and are described below. “Level out the workload” Many lean manufacturing efforts are focused on eliminating non-value-added activities such as waste (Ohno, 1988). Toyota uses the Japanese term muda for waste and reduce muda is seen as one of the most important cost saving actions done at the company. There are two other M’s, in addition to muda, the muri (overburden) and mura (unevenness) which both also play an important role in reducing wastes and all three of them fits together in a system. (Liker 2004)
Figure 4: Toyota's three M (from Liker, 2004)
Mura Unevenness
Muri Overburden
Muda Waste
THEORETICAL FRAME OF REFERENCE
- 8 -
• Muda, Non-value-added. Activities that creates extra work beyond ordinary
production time. Lengthen lead times, extra movements to get parts or tools, excessive inventory and any type of waiting are all typical examples of Muda. (Liker 2004)
• Muri, Overburdening people or equipment. During prosperous periods you might be
tempted to push your workforce and equipment to the limit. Overburdening employees and machines however cause problems with safety, quality, defects and breakdowns. (Liker 2004)
• Mura, Unevenness. Sometimes there is more work than people and machines can
handle and sometimes it is the opposite. Unevenness has its roots in irregular production schedules or varying production volumes. These problems often occur as a result of downtime, missing parts or defects in production. Irregularity in production levels implies that it is necessary to keep equipment, materials and people on the highest level of production. This is also the case when average requirements are much lower than that. (Liker 2004)
If a company build products as they are ordered the workload will vary from week to week and the consequence of this are overtime pay, stressed people and equipment as well as idleness and underutilized equipment. In addition stocks of raw material are kept in an amount possible to cover maximum number of potential customer orders. Having starts and stops, over utilization and underutilization, and a strict build to order strategy does not lead to superior quality, standardization, productivity or continuous improvements it actually only creates an increase of inventory, hidden problems, and in the end a boost in lead time. (Liker 2004) Heijunka is Toyota’s name of a method to deal with the three M’s. Heijunka implies leveling out the production schedule and create a true balanced flow of work. To attain heijunka is according to Liker (2004) fundamental to eliminating mura, which in turn is needed for eliminating muri and muda. Heijunka is built on the idea of describing the pattern of volume and product mix from customer demands, and create a daily level schedule based on these facts. “Standardized tasks are the foundation for continuous improvement and employee empowerment” Toyota put a great effort into standardizing their different processes and work procedures. It is seen as an important part for working with continuous improvements throughout the organization. To be able to develop and advance to a higher level Toyota thinks it is necessary to have a stable ground as starting point. For instance if a process is shifting from one way to another, any improvement will only add extra variance to the system and not contribute to make it better. Liker (2004) makes a comparison with the situation for a first time golf player. The primary step is to learn how to perform a basic golf swing. And to do so, a lot of effort has to be laid on practice, practice and even more practice. As long as the person does not have the skill to swing consistently there will be no hope of improving his or her golf game. (Liker 2004) Standardized work makes it a lot easier to build in quality and strive towards zero defects. If a defect is discovered in any level of a Toyota plant the problem solving team immediately investigate if the standard work procedure was followed or not. If it was and the problem still

THEORETICAL FRAME OF REFERENCE
- 9 -
occurs in later on the standard has to be modified and updated. If there was a deviation from the standard procedure, the team has to investigate why this deviation occurred and take appropriate action. (Liker 2004) Standards should be balanced between the worker, machines and materials and not forced down from above but rather set by the workers themselves. An unbalanced way of setting standards has a negative impact on work environment and will make operators feel alienated and incapable of producing efficiently (Ohno, 1988). The standards have to be simple and practical enough to be used by the people performing the work. This way Toyota involves its employees in the work with continuous improvements and gives them the opportunity to in an active way have an influence on their own work environment. (Liker 2004) There are some critical tasks that need to be taken into consideration when implementing standardization according to Liker. As mentioned earlier, the standards have to be simple, specific and general enough to allow some flexibility. And further, they have to be updated continuously by the people doing the work. (Liker 2004) “Respect your extended network of partners and suppliers by challenging them and helping them improve” To sustain a high level of quality, precision in delivery time, satisfied customers, technical and innovative progression, it is necessary to look at the whole value chain of suppliers and customers. Toyota is recognized as a tough customer who demands a high standard of excellence in all levels among their suppliers but they give a lot back in terms of education and support. (Liker 2004) Toyota has according to Liker (2004), been awarded several times for their ability to build a strong and reliable network of highly capable suppliers that are incorporated into Toyota’s extended lean enterprise. The recipe is to have respect and humbleness in the relation between supplier and customer. Involve the partner in your business and challenge them in order grow and develop their skills. (Liker 2004) “Become a learning organization through relentless reflection and continuous improvement” Toyota put a high value on having standardized processes and procedures which are continuously updated and improved by problem solving and innovative thinking. The company uses a seven step process they call “practical problem solving” in order to deal with situations deviating from standard. (Liker 2004) The practical problem solving procedure starts by studying the situation with an open mind, try to understand what actually has happened, and compare the new situation with a standard. As a help, Toyota practices a method called “genchi genbutsu” which is the same as; go to the place where the situation has occurred and see for yourself. This first step, grasping the situation, is crucial to be successful with the rest of the problem-solving procedure (Liker 2004). After getting a brief understanding of the problem and when the point of cause has been settled it is time to start working with the root cause analysis (Ohno, 1988) . Finding the root cause is the only way to once and for all get rid of a problem. Unfortunately a lot of companies put a great effort in dealing with the symptom and forget how the situation actually could happen from the very beginning. Toyota has developed a system of getting to the root cause by asking “why” five times (Ohno, 1988). Doing this procedure requires taking

THEORETICAL FRAME OF REFERENCE
- 10 -
the answer to the first why and then asking why that occurs. The answer of the last “why” will be target for countermeasures which are evaluated and if successful implemented and sustained. (Liker 2004) Toyota has by the use of the “practical problem solving procedure” been able to learn from their mistakes and continuously improve their business towards higher quality and less trouble in everything they do and perform. (Liker 2004)
2.1.5 5S Toyota uses a lean tool called the 5S which is a series of different steps meant to reduce wastes from errors, defects, and injuries. The first S is Sort which implies to go through all items and get rid of or put aside things that are never or rarely used in daily work. When unneeded items have been sorted out it is time to find a place for things that are left; Straighten. Tools can preferably be placed on a board where each tool has its own specific position marked with an icon of the tool itself or a label with its name on. Areas for equipment or raw materials that are frequently used should be marked with painted lines or similar. Simply put – “a place for everything and everything in its place”. The next step is Shine. Shine is the same as cleaning off your work environment on regular basis. It facilitates the detection of abnormal and pre-failure conditions that could influence quality. It also contributes to a better work environment, and in the long run an increase in job satisfaction among employees. When the first three steps successfully are covered it is time for the Standardize phase. In order to improve repeatable processes, a company must have viable and enabling standards. The fourth step is to develop systems and procedures to maintain and monitor the first three steps. The last S stands for Sustain and it has a meaning of self-discipline. Its main objective is to create a habit among people to support and maintain all new procedures that have improved business and eliminated waste. (Liker 2004) According to Liker (2004) is the fifth S the most difficult to implement. It is the mechanism behind the four first S’s, an engine that keeps them going. This can be done by emphasizing necessary education, training and rewards to encourage the employees to properly maintain and continuously improve procedures and the workplace environment. Crucial for success is committed leadership, training, and a culture that make improvement a routine behavior from shop floor to management. (Liker 2004)
2.1.6 The Quality Management Maturity Grid Fundamental in every improvement work is a truly committed and encouraged management team that will support and truthfully believes in quality as an important part of business development (Crosby, 1979; Bergman & Klefsjö, 2003; Liker, 2004; Sörqvist, 2004). The Quality Management Maturity Grid is a tool and guide developed by Philip B. Crosby (1979). The grid is divided into five stages of maturity and evaluates an organization in six different categories. It can be used by managers to determine the company’s present situation in terms of quality management and what is needed to advance to the next step. Its logic and straightforward design also facilitates its use by managers who are not trained in quality management. The different maturity levels are described below. Uncertainty The lowest rank of Crosby’s (1979) Quality Management Maturity Grid is called Uncertainty. Uncertainty is best described by total lack of knowledge and understanding of quality management as a constructive tool. The quality function, if it exists, is often placed under one of the main departments such as production, engineering or administration and not as a department of their own. The only quality related work performed likely consists of inspection of finished goods and it usually is the employees themselves that have that

THEORETICAL FRAME OF REFERENCE
- 11 -
responsibility. If an error occurs the question is “who” did it instead of “what” went wrong. Continuous improvements are not a part of company strategy at this level and cost of quality is something unknown to the management team. (Crosby 1979) Awakening The second level in Crosby’s grid can be portrayed as a company where management to some extent realize the contribution of quality management on business development but are unwilling to invest the money and time needed. If that organization takes on a person to be responsible for quality management, the person often has a non-quality background with high knowledge about the product or service instead of the necessary awareness of how quality is managed in a structured way. (Crosby 1979) Further, Crosby considers management teams of companies that are in the Awakening stage, inexperienced and unaware of the broad meaning of quality management. Often quality issues are restricted to only involve the function of products or services produced. The awareness of quality control in terms of inspection of goods produced is seen as something that contributes to a better overall quality and therefore increased throughout the production process. This requires however that the problems actually reach the surface. Different problem solving teams may sometimes be gathered to work with reducing chronic quality problems. The results are more of a temporarily solution and the root causes are seldom discovered. (Crosby 1979) Enlightenment Entering the third level of the grid, Enlightenment, means that management now see quality as a part of future business development and something essential for business growth and survival (Crosby 1979). The companies at this level normally establish a quality management policy and realize the fact that they are themselves the source of their own problems. A well organized and functioning quality department should exist and be in charge of and push improvement projects forward. These projects involve inspection and testing, quality engineering, data reporting among other things and it is crucial that necessary resources are provided from company management. (Crosby 1979) One of the most obvious distinctions from lower levels of quality maturity is according to Crosby (1979) the way different problems and situations are discovered and handled. A quality team should be in charge of improvement projects and work independent and successfully without supervision from the quality manager. The team goes through and carefully analyzes each potential solution or improvement before it is launched and implemented in the organization. Companies at the Enlightenment level still face a lot of problems even though they are not as severe as those described for the lower levels. (Crosby 1979) Wisdom Companies and organizations at this level often find themselves wondering why they had all these problems earlier and why the quality department was seen as something low prioritized and not as an integrated and important part of the business structure. Cost reduction take place continuously and costs of poor quality are brought up to surface much easier than before. If any problem occurs, it will be taken care of in a fast and smooth way and the solution will be implemented and standardized. (Crosby 1979)

THEORETICAL FRAME OF REFERENCE
- 12 -
Crosby considers this stage as heaven to the company management team. Every task and assignment is carried out without interruptions or delays. The author explains this special atmosphere as follows; “The attitude, the systems, and the enthusiasm are all there waiting. As long as these three are not taken for granted, they will continue to produce”. (Crosby 1979) Certainty In the last part of maturity grid, Certainty, quality management is seen as an invaluable and vital part of business growth and development. Problem solving, generally speaking, does not exist in this stage of the grid due to well developed prevention systems and activities. Cost of quality consists mainly of salaries and compensation to the quality management team and also for some necessary controls. (Crosby 1979)
Measurement Categories Stage I: Uncertainty Stage II: Awakening Stage III: Enlightenment Stage IV: Wisdom Stage V:
Certainty
Management understanding and attitude.
No comprehension of quality as a management tool. Tend to blame quality department for "quality problems".
Recognizing that quality management may be of value but not willing to provide money or time to make it all happen.
While going through quality improvement program learn more about quality management; becoming supportive and helpful.
Participating. Understand absolutes of quality management. Recognize their personal role in continuing emphasis.
Consider quality management an essential part of company system.
Quality organization
status.
Quality is hidden in manufacturing or engineering departments. Inspection probably not part of organization. Emphasis on appraisal and sorting.
A stronger quality leader is appointed but main emphasis is still on appraisal and moving the product. Still part of manufacturing or other.
Quality department reports to top management, all appraisal is incorporated and manager has role in management of company.
Quality manager is an officer of company; effective status reporting and preventive action. Involved with consumer affairs and special assignments.
Quality manager on board of directors. Prevention is main concern. Quality is a thought leader.
Problem handling.
Problems are fought as they occur; no resolution; inadequate definition; lots of yelling and accusations.
Teams are set up to attack major problems. Long-range solutions are not solicited.
Corrective action communication established. Problems are faced openly and resolved in an orderly way.
Problems are identified early in their development. All functions are open to suggestion and improvement.
Except in the most unusual cases, problems are prevented.
Cost of quality as % of sales.
Reported: unknown Actual: 20%
Reported: 3% Actual: 18%
Reported: 8% Actual: 12%
Reported: 6.5% Actual: 8%
Reported: 2.5% Actual: 2.5%
Quality improvements
actions.
No organized activities. No understanding of such activities.
Trying obvious "motivational" short-range efforts.
Implementation of the 14-step program with thorough understanding and establishment of each step.
Continuing the 14-step program and starting Make Certain.
Quality improvement is a normal and continued activity.
Summation of company quality
posture.
"We don't know why we have problems with quality".
"Is it absolutely necessary to always have problems with quality?"
"Through management commitment and quality improvement we are identifying and resolving our problems".
"Defect prevention is a routine part of our operation".
"We know why we do not have problems with quality".
Table 1: The Quality Management Maturity Grid (from Crosby, 1979).
2.2 Quality Costing When learning about quality costing there are first of all two expressions that need to be defined. The first one is “quality cost” and the second is “quality costing”. The first is a noun which signifies a cost that is found to be related to poor quality in some way. The exact definition of which costs that should be considered quality costs is up to the user to decide. The second expression is a verb which represents the method of measuring quality costs to simulate quality improvement.

THEORETICAL FRAME OF REFERENCE
- 13 -
- 13 -
2.2.1 Development and Definition of Quality Costs 2.2.1 Development and Definition of Quality Costs The first to discuss, identify and define quality costs were Juran and Feigenbaum in the 1950’s (Williams, van der Wiele & Dale, 1999). Since then the understanding of the subject area has developed. Traditionally the quality costs were seen from a production oriented point of view, taking only costs of deviating from specification into account (Sörqvist, 2001). The area has since become wider as the term quality has developed a wider meaning. Still there is no agreement on a single general definition of quality costs, but it is usually considered to be composed of sum of conformance plus non-conformance costs (Schiffauerova & Thomson, 2006). Juran defined quality costs as “the costs that would disappear if a company’s products and its processes were to be perfect“(Sörqvist, 2001). Some argue that this definition is too wide because it would include non-value adding costs that are traditionally not seen as quality costs. Instead a definition like “the additional costs that occurs as a result of poor quality” could be used (Sörqvist, 2001). This implies that you also need to clearly define the term quality. As these definitions only focus on the costs that poor quality causes Sörqvist (2001) created another definition that uses the word losses instead of costs. In this way, he argues, the reduction in revenue caused by poor quality is also included. His definition is “the total losses that occurs because a company’s products and processes are not perfect”.
The first to discuss, identify and define quality costs were Juran and Feigenbaum in the 1950’s (Williams, van der Wiele & Dale, 1999). Since then the understanding of the subject area has developed. Traditionally the quality costs were seen from a production oriented point of view, taking only costs of deviating from specification into account (Sörqvist, 2001). The area has since become wider as the term quality has developed a wider meaning. Still there is no agreement on a single general definition of quality costs, but it is usually considered to be composed of sum of conformance plus non-conformance costs (Schiffauerova & Thomson, 2006). Juran defined quality costs as “the costs that would disappear if a company’s products and its processes were to be perfect“(Sörqvist, 2001). Some argue that this definition is too wide because it would include non-value adding costs that are traditionally not seen as quality costs. Instead a definition like “the additional costs that occurs as a result of poor quality” could be used (Sörqvist, 2001). This implies that you also need to clearly define the term quality. As these definitions only focus on the costs that poor quality causes Sörqvist (2001) created another definition that uses the word losses instead of costs. In this way, he argues, the reduction in revenue caused by poor quality is also included. His definition is “the total losses that occurs because a company’s products and processes are not perfect”. For this thesis the authors find that Sörqvist’s definition is too wide as it also includes losses to the society. In practice losses to the society will make the concept of quality costs more academic and abstract which might result in a frosty welcome from people in the organization. Our definition will therefore be “a company’s total losses that occurs because its products and processes are not perfect”.
For this thesis the authors find that Sörqvist’s definition is too wide as it also includes losses to the society. In practice losses to the society will make the concept of quality costs more academic and abstract which might result in a frosty welcome from people in the organization. Our definition will therefore be “a company’s total losses that occurs because its products and processes are not perfect”. The rather wide definition of quality costs indicate that the concept comprise a correspondingly wide range of costs, many of which are hidden. At times the quality costs are described as an iceberg (i.e. Campanella, 1999; Sörqvist, 2001). Campanella describe the more obvious quality costs, for example scrap and rework, as the visible part of the iceberg. Below the surface resides the “hidden quality costs”, which are far larger than the ones represented by the tip of the iceberg (Figure 5).
The rather wide definition of quality costs indicate that the concept comprise a correspondingly wide range of costs, many of which are hidden. At times the quality costs are described as an iceberg (i.e. Campanella, 1999; Sörqvist, 2001). Campanella describe the more obvious quality costs, for example scrap and rework, as the visible part of the iceberg. Below the surface resides the “hidden quality costs”, which are far larger than the ones represented by the tip of the iceberg (Figure 5).
Commonly measured
failure costs
Hidden failure costs
Engineering time Management time
Shop and field downtime Increased inventory Decreased capacity Delivery problems
Lost orders
Scrap Rework
Warranty
True failure costs
Figure 5: Hidden costs of quality and the multiplier effect illustrated by an iceberg (from Campanella, 1999)
Figure 5: Hidden costs of quality and the multiplier effect illustrated by an iceberg (from Campanella, 1999)
THEORETICAL FRAME OF REFERENCE
- 14 -
Most business managers in today’s competitive environment realize that quality is of growing importance for winning customers. Not as wide-spread seems the understanding that the quality level directly influences bottom line results. Quality costing – when you use the measuring of quality costs to serve a purpose – can be a guide to accomplish higher profit. Quality costing is generally seen as a way of helping companies to reduce manufacturing costs by identifying excessive cost, waste and non-value adding activities (Dale & Wan, 2002). While our general definition of what are considered quality costs is very broad, in the practical process of working with quality costing the actual measuring often covers a more narrow range of costs. The hidden quality costs are difficult, often impossible, to put a price on. It is however important to be aware of them as companies may experience the visible quality costs to have a “multiplier effect” on the hidden ones (Campanella, 1999).
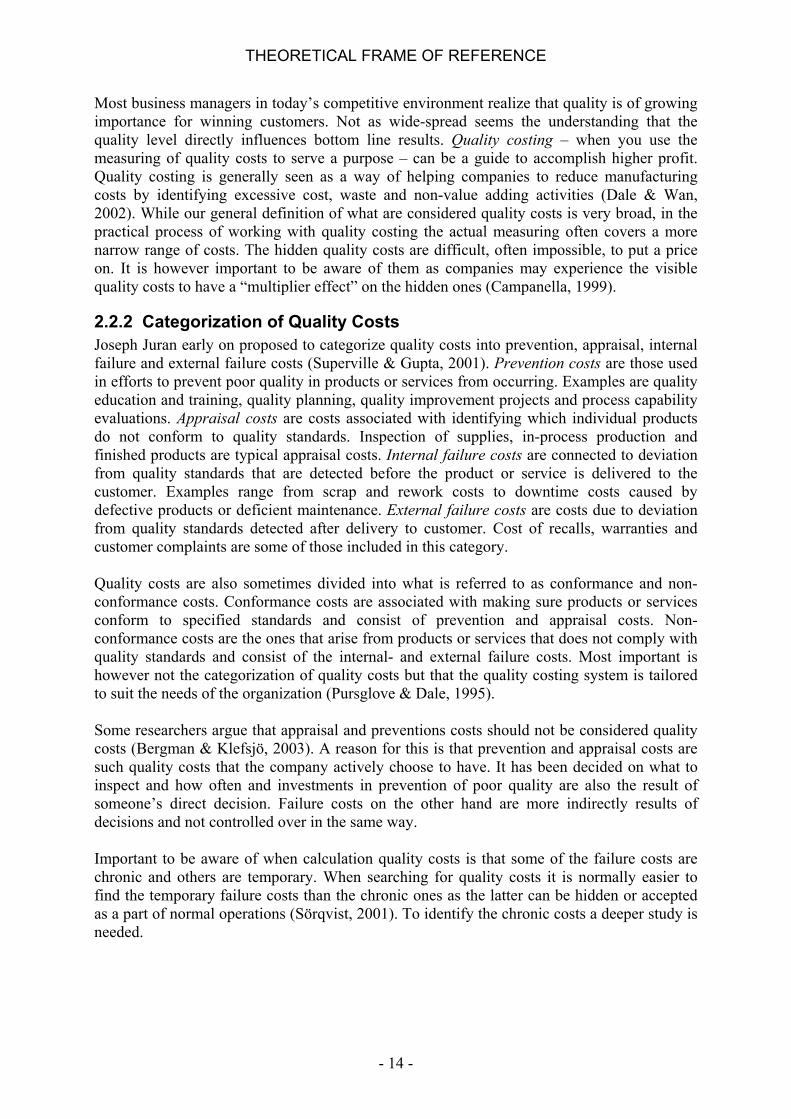
2.2.2 Categorization of Quality Costs Joseph Juran early on proposed to categorize quality costs into prevention, appraisal, internal failure and external failure costs (Superville & Gupta, 2001). Prevention costs are those used in efforts to prevent poor quality in products or services from occurring. Examples are quality education and training, quality planning, quality improvement projects and process capability evaluations. Appraisal costs are costs associated with identifying which individual products do not conform to quality standards. Inspection of supplies, in-process production and finished products are typical appraisal costs. Internal failure costs are connected to deviation from quality standards that are detected before the product or service is delivered to the customer. Examples range from scrap and rework costs to downtime costs caused by defective products or deficient maintenance. External failure costs are costs due to deviation from quality standards detected after delivery to customer. Cost of recalls, warranties and customer complaints are some of those included in this category. Quality costs are also sometimes divided into what is referred to as conformance and non-conformance costs. Conformance costs are associated with making sure products or services conform to specified standards and consist of prevention and appraisal costs. Non-conformance costs are the ones that arise from products or services that does not comply with quality standards and consist of the internal- and external failure costs. Most important is however not the categorization of quality costs but that the quality costing system is tailored to suit the needs of the organization (Pursglove & Dale, 1995). Some researchers argue that appraisal and preventions costs should not be considered quality costs (Bergman & Klefsjö, 2003). A reason for this is that prevention and appraisal costs are such quality costs that the company actively choose to have. It has been decided on what to inspect and how often and investments in prevention of poor quality are also the result of someone’s direct decision. Failure costs on the other hand are more indirectly results of decisions and not controlled over in the same way. Important to be aware of when calculation quality costs is that some of the failure costs are chronic and others are temporary. When searching for quality costs it is normally easier to find the temporary failure costs than the chronic ones as the latter can be hidden or accepted as a part of normal operations (Sörqvist, 2001). To identify the chronic costs a deeper study is needed.

THEORETICAL FRAME OF REFERENCE
- 15 -
2.2.3 The Functions of Quality Costing In the foreword to his book ‘Principles of Quality Costs’ Jack Campanella (1999) brings up a fact that is important to have considered when starting up with quality costing:
Quality cost measurement and publication do not solve quality problems By this Campanella (1999) emphasize that quality costing in itself is not the solution of any quality shortages. The measuring of quality costs must be complemented by methods of quality improvement in order to be useful. Sörqvist (2001) identify three overall areas able to sum up the different functions of quality costing. The first area of use is that it translates the oftentimes confusing field of quality management into a dimension that everyone understands – money. By doing this it makes the quality concept more tangible and helps to change the attitudes towards quality management on all levels in the company. Secondly, with the use of quality costing the company can unveil which areas that have great improvement possibilities and help you prioritize between these. This way the quality management function can allocate resources to where they make the best use. The third area that Sörqvist identified is that quality costing makes it possible to evaluate and follow-up the quality efforts that are being made. This makes the calculation of returns from quality investments rather straightforward. Campanella (1999) argue that the goal of quality cost systems are to facilitate quality improvement efforts that will lead to operating cost reduction opportunities, and present a basic strategy for achieving this:
1. Take direct attack on failure costs in an attempt to drive them to zero 2. Invest in the “right” prevention activities to bring about improvement 3. Reduce appraisal costs according to results achieved 4. Continuously evaluate and redirect prevention efforts to gain further improvement
His strategy is based on the assumptions that
• for each failure there is a root cause, • causes are preventable, and • prevention is always cheaper.
The common standpoint among researchers in the area of quality costing is that dollars spent on prevention are those who give the greatest return (Superville & Gupta, 2001). Even so, companies’ distribution of quality dollars is generally not in favor of prevention costs. Logically the reason for this is that companies’ normally do not have full control over how large the quality costs are and how they are distributed in different areas. According to Superville and Gupta (2001) companies spend between 50 and 90 percent on failure costs, 10 to 50 percent on appraisal costs and only 0.5 to 5 percent on prevention costs. Sörqvist (2001) illustrated the purpose of quality costing by showing a typical distribution of quality costs and compare it to a more desired situation. (Figure 6)

THEORETICAL FRAME OF REFERENCE
- 16 -
- 16 -
Figure 6: An illustration of how investments in prevention is thought to
lower the total quality costs (from Sörqvist, 2001). Figure 6: An illustration of how investments in prevention is thought to
lower the total quality costs (from Sörqvist, 2001).
Current Target
Internal failuresExternal failures
Appraisal costs
Preventive costs
Investing in prevention of failures will primarily lower the failure costs, but when failures are decreasing you can consequently lower the appraisal costs (Campanella, 1999). Increasing inspection can be a way to ensure conformance of shipped goods. When failures are rare, less inspection is needed.
Investing in prevention of failures will primarily lower the failure costs, but when failures are decreasing you can consequently lower the appraisal costs (Campanella, 1999). Increasing inspection can be a way to ensure conformance of shipped goods. When failures are rare, less inspection is needed.
2.2.4 Measure Quality Costs in Practice 2.2.4 Measure Quality Costs in Practice To make the most out of using quality costing the range of costs measured and methods of measuring must be adapted according to the individual company and purpose (i.e. Sörqvist, 2001; Campanella, 1999). When measuring actual quality costs, there are at least two ways to go by. One way is to carry out a one-shot mapping of the current quality costs and another to construct a system to continuously monitor quality costs (Sörqvist, 2001). A mapping of current quality costs is useful when you want to influence attitudes and identify and prioritize improvement areas. A system for continuous monitoring will be necessary if evaluation over time is desired. In either case the depth of the measuring and decision on which cost areas to include should be based on the needs of the specific organization and the purpose of the measuring. A good way to support systematic improvement efforts is to first map out the total quality costs and move on to monitor certain important or particularly large quality costs during the progress (Sörqvist, 2001).
To make the most out of using quality costing the range of costs measured and methods of measuring must be adapted according to the individual company and purpose (i.e. Sörqvist, 2001; Campanella, 1999). When measuring actual quality costs, there are at least two ways to go by. One way is to carry out a one-shot mapping of the current quality costs and another to construct a system to continuously monitor quality costs (Sörqvist, 2001). A mapping of current quality costs is useful when you want to influence attitudes and identify and prioritize improvement areas. A system for continuous monitoring will be necessary if evaluation over time is desired. In either case the depth of the measuring and decision on which cost areas to include should be based on the needs of the specific organization and the purpose of the measuring. A good way to support systematic improvement efforts is to first map out the total quality costs and move on to monitor certain important or particularly large quality costs during the progress (Sörqvist, 2001). All quality costs are not reasonable to measure and not all costs are even possible to measure. Sörqvist (2001) believes that a mapping of quality costs mainly should be based on available data complemented by estimation of the remaining costs in order not to be too difficult and time consuming. The estimations should be made in cooperation with the employees that have the best understanding of the respective areas.
All quality costs are not reasonable to measure and not all costs are even possible to measure. Sörqvist (2001) believes that a mapping of quality costs mainly should be based on available data complemented by estimation of the remaining costs in order not to be too difficult and time consuming. The estimations should be made in cooperation with the employees that have the best understanding of the respective areas. Sörqvist (2001) presents a schematic approach to mapping quality costs consisting of four steps; preparations, planning, implementation and follow-up. (Figure 7) Sörqvist (2001) presents a schematic approach to mapping quality costs consisting of four steps; preparations, planning, implementation and follow-up. (Figure 7)

THEORETICAL FRAME OF REFERENCE
- 17 -
Figure 7: Method for mapping quality costs (from Sörqvist, 2001). The central step of the preparations phase is to gain approval from the top management. This is very important as obtaining sufficient resources and priority to the quality costing project is vital. Depending on the time, resources available and the purpose of the project a suitable scope should be set in the preparations phase as well as gathering and educating a suitable team for running it. The team should be cross-functional so that it collectively has expertise in all areas that will be studied. Important tasks during the planning phase are to set a structure for the project. This should include a time plan, budget and objectives. As a large part of quality costing is about finding non-conformances around the organization the team may be met with some resistance. To avoid this the people that will in any way be affected by the project should be informed of its purpose before any collection of data is made. By company analysis mentioned in the planning phase in Figure 7 Sörqvist (2001) means that the different processes, functions and activities in the company should be identified and analyzed. The third phase in Sörqvist’s (2001) proposed work method is the implementation phase. Two different methods are suggested of which the first one can be called a non-conformance analysis. This is done by first identifying non-conformances, then determine extra resource usage caused and finally calculating the related cost. It’s important to make an effort to uncover also hidden and chronic non-conformances which commonly are overseen in the everyday work. The other way of estimating quality costs is by performing an optimal-case analysis which is mentioned in Figure 7. This is done by first settling an optimal way of working (or as close to it as possible). The difference between resources needed for working in the optimal way and the actual resources currently consumed gives the indication of the total quality cost in that area. The downside is that the cost calculated in this way is pooled and cannot specify in detail where the problems reside. In the final phase, the follow-up, the collected data is analyzed, reported and evaluated. How to analyze quality cost data is described further in chapter 2.2.6.
2.2.5 Success Factors In the research of Dale and Wan (2002) several different methods of collecting quality costs were put to the test. Among their results a number of success factors were listed. They concluded that the collection of quality costs should be:
• based on the concept of process and continuous improvement; • applicable to all departments and functions; • employ a team approach; • require a minimum amount of time and knowledge for its introduction and application; • contain cost elements specific to the industry under consideration; • concentrate, in the first place, only on the time spent by staff on non-value added
activities.

THEORETICAL FRAME OF REFERENCE
- 18 -
2.2.6 Analyzing Collected Costs First and foremost the quality costs should be presented in a way so that it fulfills its purpose just as with the choice of costs to measure (i.e. Sörqvist, 2001; Campanella, 1999). It is important to first make clear what the project is meant to accomplish. It is not possible to make comparisons of the total quality costs between different companies. This is because there are variations in how different organizations interpret and capture quality cost data and in product complexity, process methods, volume and market (Campanella, 1999). A company that have calculated large quality costs may still have lower costs than a company showing only low quality costs since the quality awareness is different. Hence, quality costs can only be compared over time and within the same organization. The organizations' skill in identifying hidden quality costs will increase over time as quality awareness develops resulting in that the total quality costs might not always decrease as the work progresses (Campanella, 1999). When new hidden cost areas are discovered and accounted for the total quality costs could even increase initially. It is important to be aware of this and make sure that it does not cause disappointments in the early stages of the program. The collected costs are typically visualized by pareto and trend charts (Campanella, 1999). The analysis of the collected costs is focused on identifying the largest cost areas and their root causes in order to direct prevention efforts effectively. The pareto analysis is useful for revealing where the largest cost areas are but can also be used to present how the quality costs divide between underlying root causes, company divisions and products for instance (Sörqvist, 2001). Trend charts are commonly used for evaluating the movement of quality costs over time. It is also possible to use statistical process control, e.g. control charts, to monitor the quality costs (Sörqvist, 2001). To successfully use trend charts it is vital to systematically measure the quality costs, and it is recommended that cost figures are measured during a reasonable amount of time before trying to draw any conclusions (Campanella, 1999). To make the calculated quality costs easier to interpret and more rational to evaluate over time it is common practice to relate the cost figure to another known measure. These measures are called quality cost bases when relating to quality costs (Campanella, 1999). To assure that the targeted people can grasp the information from the quality cost collection the cost bases should be measures that they know and can relate to. Two commonly used quality cost bases to quantify TQC is total sales and total costs (ibid). If the objective is to follow the development of quality costs over time it is necessary to choose cost bases that gives a fair description (Campanella, 1999). The level of the quality costs is affected by more than merely the quality in itself. For example the production volume, number of batches produced or number of different products is likely to influence the total quality costs because it will affect the number of failure opportunities. On the whole, different cost bases are suitable for use with different:
• Quality costs • Purposes of measure • Target populations of the information • Time ranges of study

METHODOLOGY
3 Methodology The Methodology chapter explains the choice of study subject, research strategy and the different research methods used in this thesis. A discussion of some of the difficulties experienced during the data collection is finishing off this chapter.
3.1 Company Description The company at which this study has been conducted develops and markets coatings for industrial use. The company is a part of a multinational group with a long history. The group approached the Chinese market in late 1990’s and currently supplies its products from two plants in the country. This study was focused to one of these branches. The opportunity to get access was the main reason why this specific company and branch was chosen for the study.
3.2 Research Strategy To fulfill the first two parts of the purpose a small quality costing project was carried out at the studied company. The authors will therefore conduct a case study of the company to find information on the first two parts of the purpose. The case study is characterized by thoroughly analyzing just one unit and normally attempts to generalize its findings onto a broader range. (Grønmo, 2006) The third part of the purpose is to evaluate how well the first two parts worked out in a Chinese company. Thus after the authors’ hands-on work of calculating quality costs the process would be assessed by the authors themselves. This research strategy contains elements of what is called action research. Denscombe (2000) defines action research with four typical characteristics namely:
• Practical orientation • Change • Cyclic process • Involvement
In brief this means that the researcher is no longer simply passively observing, as for the case studies, but actively taking part in the studied process. Action research as a research method has since its establishment been associated with practical problems (Reason & Bradbury, 2006). Generally the researcher is participating in or even managing a project to bring about a change in some way. The researcher is thereby not studying problems that naturally come up in the daily work but actively taking part of them as well as studying the progress of the project. The researcher’s active influence on the project forms a cyclic process where the people influenced by the project are encouraged to participate in shaping the research rather than just being studied (Denscombe, 2000). This has also made some researchers claim that it is irrational to attempt to fit a traditional discussion of validity within the frame of action research (Reason & Bradbury, 2006). For this thesis there were no precise wishes from the company’s side on a research area besides that it should be about improving quality. The company had its quality competence, e.g. the quality manager, stationed at another facility so whatever topic the thesis would have about any improvement projects had to be carried out by the authors. The authors also wished the thesis to be of an applied character and consequently an action research oriented approach was suitable. The aim of the study was however not primarily to enhance the method used,
- 19 -
METHODOLOGY
which often is the case with action research, but to study whether the method is useful or not in the setting of the small project that this thesis represents.
3.3 Research Methods This thesis has made use of multiple research methods. Initially an extensive literature study was carried out to take part of previous research in the studied area. The empirical data was later collected through interviews, observations and by taking part of written internal documentation. These methods were chosen because they were considered an effective way to get to know the studied organization. To review documentation and making observations as well as interviewing was thought to give a more accurate description of the organization than by using only one or two of these methods. The better the authors could get to know the organization the easier it should be to identify quality costs and appropriate ways of improving these.
3.3.1 Literature Study To expand the knowledge about quality costing and get updated on the previous research in this area articles were searched for in various databases. As students at Luleå University of Technology the authors could get access to the databases through the university library. The databases used were Ebsco, Emerald, PressText and Samsök. The latter searches several databases at once. Keywords used when searching for relevant articles were “quality”, “quality costing”, “quality costs”, “cost of poor quality”, “CoQ”, “China”, “culture”, “TQM”, “method” “improvement” and “implementation” as well as variations and combinations of these. Further information was found by following the references found in the articles. The aim of the literature study was besides to gain knowledge about quality costing to find information in general about quality improvement. Besides the articles found in the mentioned databases various books have been used as references. The books have either been literature used in the authors’ university studies, been found searching in libraries and online book stores using the same keywords as mentioned above or by using other author’s references.
3.3.2 Interviews Personal interviews were the largest source for collecting empirical information. The held interviews were all of unstructured or semi-structured type, which according to Denscombe (2000) mean that the interviews don’t follow a manuscript. Both the unstructured and the semi-structured interview may seem to be more like a conversation rather than an interview. For a semi-structured interview the interviewer has a list of topics that will be covered during the interview but the interviewee is allowed to influence the dialogue as long as the topics are covered. Even more similar to an ordinary conversation is the unstructured interview where the interviewee is allowed full influence over the direction of the dialogue. The authors did not speak Chinese and only a couple of people at the plant knew Swedish so English was the language used for the interviews. The interviews carried out for this thesis were generally very short. The typical interview was spontaneously held somewhere in the office environment. Since access to interviewees was never an issue interviews were held short and often instead of having a smaller number of more extensive ones. Because of the chosen method for interviews writing notes was the most suitable way of keeping record instead of audio recording which is commonly used for longer interviews. While one of the authors took responsibility for the interview the other one could easily take notes.
- 20 -

METHODOLOGY
Longer interviews were held with a total of 7 people and shorter interviews with around 15 more. The longer interviews were held in October and November 2006 with the department managers partly to get to know the organization and partly to search for quality costs in the managers’ individual areas. Every interview would be different because of their different responsibilities and because of this no question guide was used. There were however three common areas that were covered in all of the interviews: questions about the specific department; questions about what kinds of quality costs that could be found in that department; and questions about how to calculate those costs. The department managers were chosen for the interviews because they were believed to have the best knowledge of their specific areas among the English speaking staff. The shorter interviews were held with lower-level workers with help from a translator. Those interviews were held with everyone that were involved with customer complaints with the purpose of learning about the handling of those and estimating how much time each one spends on this.
3.3.3 Documentation The company’s internal documentation held useful information for the project. The type of documentation that was used was mainly different internal reports, information material, the ISO9000 documents and information from the economic accounts. Even though the authors could get access to all the documents that were useful for the project not everything could be used because of the language barrier. As for the ISO documents only the most general descriptions of the company and the processes were translated into English. Most of the more detailed descriptions, like work instructions, were only written in Chinese. To find out which Chinese documentation that could be useful and translate them into English was found to be far too time consuming which is why only the information available in English was used.
3.3.4 Observations The authors spent around 4 months at the studied plant during which observations of all kinds were made on a daily basis. Although most of the time was spent in the office environment observation rounds around the factory was taken a couple of times each week. The observations were made with a purpose of learning about the company’s processes and how different work was carried out. Other reasons for making planned observation rounds was to investigate how well the information from the interviews corresponded to the actual way the employees worked, how well the company’s 5S-program was followed and to discover problems. At least once a week during November and December a stroll around the facilities were made.
3.3.5 Data Analysis The analysis of the collected quality costs, interviews and observations was done based on the theoretical frame of reference. Conclusions were then drawn from the theoretical frame of reference and the empirical material through logic reasoning, e.g. in a deductive manner (Thurén, 1991).
3.4 The Collection of Quality Costs The reviewed research indicates that before attempting to collect quality costs the objectives of the project should be clarified and the methods should be tailored to the company in question (Sörqvist, 2001). The objectives of the project, from the company point of view, were therefore the first issue that had to be settled. Due to the limited time and practical experience of the authors it was clear that a complete system for continuous monitoring of quality costs would not be possible to create. Trying to create a quality costing system given
- 21 -
METHODOLOGY
the circumstances would risk that the project fails making employees more reluctant to quality costing in the future. It was also suggested in the theoretical frame of reference to start off with a mapping of quality costs in order to identify areas to monitor more closely later (Sörqvist, 2001). A mapping of current quality costs was consequently chosen for this project. Researchers have claimed that quality improvement normally must start with the commitment of management (Bergman & Klefsjö, 2003; Sörqvist, 2001). Quality projects need to have support from the management to become successful. For this reason the information from the quality cost collection in this study was primarily aimed at the management. The management was the target group of the information we gathered and the choice of methods and costs measured was based on that. From quality costing literature, research articles, observations and interviews with employees a number of areas were chosen for the calculation of quality costs. The chosen cost areas were believed to be especially large, easy to manually measure or possible to extract from available data. Sörqvist (2001) stated that a mapping of quality costs should be based on available data completed by estimation of others. As the time frame of the project did not leave much room for manual measuring most of the information had to come from available data. Inspired by Dale and Wan’s (2002) identified success factors from chapter 2.2.5 the authors aimed for a company-wide approach requiring a minimum amount of time and knowledge and focusing primarily on non-value added activities. Early on it was decided to focus on costs of non-conformance. The available data for prevention costs were scarce as well as for appraisal costs. Further, as Bergman and Klefsjö (2003) pointed out, these costs are controlled and approved of in a way. Another reason not to include conformance costs was that they were not believed to be very large as they primarily consist of labor costs, which are not particularly large.
3.4.1 Training, Interviews and Observations Literature suggests that a cross functional team is put together to identify and measure the quality costs (Dale & Wan, 2002; Sörqvist, 2001). For a number of reasons the study for this thesis was not convenient to be carried out in a team in the sense that the literature advise. The primary reason was the language barrier. Because of this only the upper and middle management would be possible for us to include in this team. If using other employees the communication would be a hindrance. To form a team consisting of managers seemed likely to lead to difficulties in arranging meetings because of their busy schedule and limited time so another approach was used. The strategy used was to list a number of people that were found to be of importance to the project and interview them individually. Since the aim was to supply quality cost information tailored to the management and based mainly on available data those working in management positions were included. The English speaking fraction of the listed people were then invited to an education in the area of quality costing. This was held at two occasions for two groups of people and included quality costing theory and a presentation of the project and its preliminary goals. After the training was completed individual interviews were held with the people of interest. For interviews with non-English speaking employees an interpreter was used. The interpreter had attended the education and was informed of the purpose of the interviews.
- 22 -

METHODOLOGY
Besides arranged interviews, where meetings were scheduled and questions were prepared, a major part of the information gathered has come from informal interviews around the office and factory. Observations and reviewing documentation further contributed with valuable information. The observations were by just being around the facility everyday and taking notes.
3.5 Methodology discussion The largest part of the information that was collected for this thesis was in spoken or written English. Considering that for most cases neither the authors nor the interviewees had English as a native language, it’s clear that there were gaps between the sender and the receiver of information. Irrespective of whether the type of communication is written or verbal there were gaps in which the information could be distorted along the way. For this thesis when the communication in addition was carried out across different cultures these gaps seemed to increase. This fact made surveys practically impossible to use since it would have been very difficult to control that the questions were understood as intended or to ensure that the survey replies were interpreted in the right way. The possibility to confirm that questions were interpreted correctly was needed and an interview is a method that offers that. Something that was experienced as a problem was that different people often had different answers to questions about how work was carried out and about the performance in specific areas. Questions where there should only be one answer. There can be several explanations to this. Language barriers made way for misunderstandings; managers instinctively gave explanations of how the work was supposed to be carried out whereas other employees’ answers were more true to how work actually was done; managers tended to give optimistic answers about performance measures within their own area while others would give more realistic figures or guess. When this occurred the subject matter was discussed further with additional people until it was clear how things were actually done. Basing much of the study on interviews raises another question; how reliable was the information from the interviews? When asking people to answer questions of how much time is spent doing specific tasks it is obvious that the information will merely be an estimation and not fact. The employees’ estimations of the time spent handling customer complaints was not a major part of the total quality costs and did consequently not affect the overall results anyway. What was important was on the other hand not to get 100 % exact estimations of every cost area but to bring as many different cost areas to the surface as was possible given the time on hand. By using observations and documentation besides the interviews the authors have tried to triangulate a more reliable data. Considering the validity of this study the authors have tried to thoroughly explain the different steps of the study as it is complicated to measure validity and especially regarding action research studies. By explaining and discussing the choices made along the way the authors attempt to give the reader as good possibilities as practical to understand of the whole process and thereby be able to judge the validity themselves.
- 23 -

EMPIRICAL STUDIES
4 Empirical Studies
- 24 -
This chapter presents the empirical material collected for the thesis. It presents a compilation of the essential information from the interviews and observations and explains and presents the collected quality costs. Further there is an attempt to describe company’s situation in the Chinese market.
4.1 Compilation of Interviews and Observations The management team at the studied company consisted of people with different nationalities, background and competences which together formed a competent and well balanced group. However none of them have had any background within quality management or had the experience of supervising quality improvement projects. The interviews showed that the company’s management recognized that a well structured and professionally managed quality program was likely to have a positive impact on business results. The willingness to work with customer complaints, reduce stocks and wastes, further improve production processes and products was present but a lack of the full understanding of these matter’s interrelations with quality and where to start the improvement efforts seemed to be a hindrance. The determination to sincerely focus on quality management was not there. The studied company had a quality manager employed that administers quality for the business in China as a whole. He was situated at the site of the other factory and not where the authors of this thesis worked. Monthly the quality manager reported the status of customer complaints and was responsible for mapping out the company processes. To supervise quality in the plant where this study was conducted, the quality manager had an assistant locally. The assistant’s task was to administer the reporting of customer complaints and to maintain quality documents. As a quality system ISO9000 was used and the company was certified by renowned BSI. A 5S program1 had been launched a couple of months before the research for this study was begun. The implementation strategy was to perform a 5S-blitz to quickly put quality thinking high on the agenda. Education of the staff was held and a two to three week campaign to sort, straighten, shine and standardize the workplaces was conducted. The results of the initial blitz would be sustained by regular follow-ups by an internal audit team. It seemed however the program had not yet reaped any major success. The attitude among the employees was that 5S was to keep the work desk tidy. It seemed that employees rarely took own initiatives to improve the way of carrying out a task or improve a process. They did what their supervisors told them to do and the supervisor was the person to blame if something goes wrong. The company has struggled with large stock in raw material and finished goods. A majority of the company’s sales go to state-owned steel manufacturers who showed to often have focus on other targets than quality and profitability. This in combination with a tough competition among domestic and international coating suppliers caused an unbalanced market situation where the customers were the strong part and the suppliers had to strictly follow customer requests in order to stay competitive and keep market shares. The large steel manufacturers also demanded short delivery times and could quickly decide to change supplier if they were not satisfied.
1 Actually a 6S program where a sixth S for “Safety” had been added.

EMPIRICAL STUDIES
- 25 -
The demand for short delivery time was based on the steel producers quite inferior production planning. The studied company had tried but not succeeded in finding out how and what drives their customer’s production orders. The uneven demand from the customers that this brought had a negative impact on the studied company’s ability to keep a level workload and good flow through the production. The operations manager explained that they did not have information of what kind of products and which quantity would be produced until two or three days in advance. In order to cope with customer demands keeping stock of raw material and finished goods was seen as a must. Frequently the company faced situations where current capacity was not enough to meet the demand peaks and overtime was used as the solution. The studied company’s main, support and management processes were mapped out and part of the ISO9000 documentation. However, existing process charts were practically copies of the ones used at the company’s English plant and then modified to fit the plant in Shanghai the quality manager explains. The documentation was written in Chinese with the most general parts also translated into English. This made the more detailed information difficult for the authors to use. The handling of customer complaints at the studied company consisted of a systematic information flow. The complaints were received by the sales department who created a document with a description of the complaint. This document was then passed on to different people in several steps depending on the type of problem. The outcome of the customer complaints seemed focused on fighting down and finding solutions to the symptoms of problems rather than getting to what caused the problem in the fist place. An often used solution was to take back what had been delivered, adjust it so it would meet specification and then return it to the customer. Investigations into how the occurred problem could be avoided in the future were hardly ever attempted. The result was that the same types of problems could reappear several times.
4.2 Quality Costs In the search for quality costs the priority was to find the largest costs first in order to come as close as possible to a representative picture. Another decision that was made was to first go for the quality costs that would be the easiest to estimate and work on the more difficult ones if there was time for it. The time period that was studied stretched over a full year. Choosing a full year for the study was considered important because it would give a more accurate estimation compared to studying a shorter period. Most of the potentially periodical variances over the year should be leveled out when analyzing the year as a whole. Presenting the calculations for a full year should also let people relate to the size of the figures more easy. The time period however had to be shifted a little from the calendar year, which was also the company’s fiscal year, because there would not be enough time to include all of 2006 in our calculations. The period of study was therefore set to November 2005 to October 2006.
4.2.1 Quantified Cost Areas A number of cost areas were identified based on information from literature, interviews and observations. A compilation of common quality cost areas appended in Sörqvist’s (2001) book about quality costing was reviewed before interviews were made and the areas that could fit in under the interviewee’s specific department were discussed. After all the interviews were made Sörqvist’s (2001) list was studied again after which the areas applicable in this study were decided upon. These are described below.

EMPIRICAL STUDIES
- 26 -
Handling Customer Complaints One identified quality cost area was the handling of customer complaints. Every time a customer had a justified complaint a process started where a customer complaint report was established. The reports passed in due order a number of people carrying out different tasks along the way. Several people were involved and the cost of this was calculated as the percentage time the involved people spend on customer complaint related matters multiplied by the company’s cost of having them employed. This was done for each individual that was involved and then added together to form the total cost. During the period that was studied the company received complaints that were considered justified on about 3.8 % of the batches that were produced. The administration for handling complaints was found to be around 7800 man hours a year which corresponded to about 4 full-time employees working solely with customer complaints. Overtime Having employees working overtime means that they work more than they are initially intended to. This is compensated by paying them more for the hours exceeding their normal work hours. The opportunity to have employees working overtime during unanticipated hectic periods is generally good to have. It means that the labor force can be flexible to some extent to match the current demand. At the studied plant however the use of overtime was found to be quite high and seemed not like something that happened occasionally. For this reason overtime was included in the calculations. The cost of overtime was calculated for January to December 2006 instead of the period that was stated above. The reason for this was that the information was not available for the time before 2006. The amount of hours that were worked as overtime was found to correspond to 14.8 full-time employees. Retip and Rework What mainly causes a cost of extra work derives from two activities. One of them, called retip, occur when goods that does not conform to standard is returned back from customer to be adjusted. The product then goes through the production process again and causes extra costs. The second type of extra work, which is referred to as rework, is caused by finished goods that is not sold or by products that are permanently returned from customers. The batches that are reworked are used as ingredients in new batches, which mean that the labor and over head costs put into making the original batch has lost its value. The total cost of doing these retips and reworks are therefore the cost of extra raw material used, labor, OH, transportation and occasionally new packaging. Transportation When customers are not satisfied with the produced goods and the technical department finds that the goods have to be returned to be adjusted there will be an extra cost for the transportation. In the case of retips the goods are taken back to be fixed and then sent back to the customers again. The extra transportation cost will therefore be the cost of one round trip to the customer and back. Also a large part of the goods labeled as rework causes extra transportation costs. Goods permanently returned from customers also costs one round trip of transportation because the initial trip to the customer eventually became a waste as well.

EMPIRICAL STUDIES
- 27 -
Compensations If customers are justly dissatisfied with the product or service provided by the company they may be granted some form of compensation. Such compensation is normally given as new goods. Since the customers complaints are caused by poor quality it is considered a quality cost. Included in this figure is the total cost of producing and transporting the goods to the customer. Raw Material Loss In production companies there will always be some waste of raw material. The amount that is wasted and the cost thereof can on the other hand vary. In this study the waste of raw material was found to consist of two parts; loss of raw material before and during production respectively. Loss before production is the stock-take difference which means the difference in raw material between what is bought and put into the warehouse, and what can be used. Loss in production is the yield variance, e.g. the difference between what is being put into production and what is found in the finished product. Stock Goods in stock were considered to be a quality cost. Included was the stock of finished goods as well as the stock of raw material. The cost of having stock was found to consist of two parts. Firstly the stock is tying up capital and secondly the goods that are sitting in stock are aging and consequently loosing value. The cost of tied-up capital was calculated by multiplying the average stock value by the company’s cost of capital: [Average stock value] x [Cost of capital] = [Cost of tied-up capital in stock] The cost of capital was after discussion with the company’s controller set to 15 % which was based on the average return on capital employed during the period. The rationale was that if the employed capital as a whole could render revenue of 15 % of its value the capital used for building stock should also be expected to give the same revenue. The cost of aging stock also consists of different parts. For the both the finished goods and the raw material stock the aging cost calculated was in part the increase in stock provision in the company’s accounting during the period. Besides the increased provision, costs were also caused by selling aged finished goods at low price and selling out-dated raw material at a low price. Cost of scrapping raw material or finished goods would also have been included as quality costs, but during the period of study there were no scrapings recorded.
4.2.2 Cost Figures The majority of the costs were extracted from the accounting system with help from the accountants. The calculations were then reviewed by the financial controller to make sure the figures were correct. The costs that were calculated are presented in Table 2 below and the currency is the Chinese Yuan. Most of the information sought was too detailed to be possible to determine which is why the figures had to be presented under broader titles. Retip and rework is an example of a cost area that could not be separated into two categories because there simply wasn’t any specification in the system of whether it should be one or the other.

EMPIRICAL STUDIES
- 28 -
Handling of Customer Complaints 665 856Cost of Overtime 608 474Retip and Rework 4 769 194Transportation 335 984Compensation 505 250Raw Material Tied-up capital 2 280 278 Waste Stocktake difference 3 579 234 Yield variance 4 731 311 Aging stock Increased Provision 1 442 289 Selling loss 249 826Finished Goods Tied-up capital 4 393 389 Aging stock Increased Provision 2 864 833 Selling loss 4 700 840TOTAL: 31 126 756
Table 2: The calculated quality costs in Chinese Yuan With sales of about 240 million year on year for the period examined the calculated quality costs adds up to around 13 % of sales.
4.2.3 Non-Quantified Cost Areas As stated earlier all quality costs are not possible to measure and not all of the ones that are possible to measure are practical to measure. Some areas that were found to be of interest could however not be included in the collection and calculation of quality costs. These areas and the reason why they could not be calculated are presented below. Travel expenses related to customer complaints was found to be an obvious quality costs but could not be included because there were no structured records of these travels. The cost is however believed to be of some influence because technical sales people relatively often visit customers to help resolve issues with the products at the customer’s site. The quality control testing was another area where quality costs were believed to be found. All finished products were tested to specification before shipment. An illustration of the process can be seen in Figure 8.This testing was found to often be repeated quite many times for each produced batch before meeting specification. The procedure was that the batch was produced, tested and then instructions on which adjustments had to be made was returned to the factory. It was unclear how many adjustments that were needed before the specifications were met so during a period of one week it was recorded the exact number of test per batch. The result was that on average each batch went through quality testing 6.19 times before it passed. The average time used from the point that a sample was handed over to the quality control department to the point where the batch passed was 6 hours and 19 minutes. A product should generally not take more than three turns in the test process according to supervisors at the quality control department and the operational manager himself. A more effective quality test procedure would not only save time it would also save a lot of money since costs caused by inefficiencies and wastes can be reduced as well as capacity can be freed up. It was however difficult to put a money value on the extra time and effort that was used on this.

EMPIRICAL STUDIESCAL STUDIES
- 29 -
- 29 -
Figure 8:The quality control procedure at the studied company Figure 8:The quality control procedure at the studied company
Batch sample to Quality Control
Sample tested against
specification.
Adjustment made in factory.
Meets specification? Adjustment
Yes No
Non value adding time spent on administration was also considered to be a quality cost. In administration processes time always gets wasted to some extent on non value adding activities. During this study time was occasionally spent searching for misplaced documents or search through spreadsheets for errors but it would have been difficult to measure just how much time that was lost on these activities. Estimations could be made by using lists where everyone can account for their own lost time. The culturally rooted reluctance to reveal mistakes and the extra administrative burden that it would inflict on the office workers led to the decision not to attempt in calculating this cost.
Non value adding time spent on administration was also considered to be a quality cost. In administration processes time always gets wasted to some extent on non value adding activities. During this study time was occasionally spent searching for misplaced documents or search through spreadsheets for errors but it would have been difficult to measure just how much time that was lost on these activities. Estimations could be made by using lists where everyone can account for their own lost time. The culturally rooted reluctance to reveal mistakes and the extra administrative burden that it would inflict on the office workers led to the decision not to attempt in calculating this cost. Another type of quality cost that was reflected on was the internal opportunity costs. Both machines and employees that were occupied adjusting produced batches or in any other way correcting non conformances cause opportunity costs because these resources could instead be used on value adding activities. It was however considered far too time consuming to attempt to calculate this cost.
Another type of quality cost that was reflected on was the internal opportunity costs. Both machines and employees that were occupied adjusting produced batches or in any other way correcting non conformances cause opportunity costs because these resources could instead be used on value adding activities. It was however considered far too time consuming to attempt to calculate this cost.
4.2.4 Market Situation 4.2.4 Market Situation The market the company operates on has lately become more competitive. The relatively few but large customers have a very strong focus on price and are putting pressure on their suppliers causing decreasing prices on the large volume products.
The market the company operates on has lately become more competitive. The relatively few but large customers have a very strong focus on price and are putting pressure on their suppliers causing decreasing prices on the large volume products. The company’s customers also demand very short delivery times compared to their European and American counterparts. Products usually have to be ready for shipment within three days of receiving the order whereas the companies in Europe normally can deliver two weeks after receiving an order. To handle the customer’s demand for short delivery time large stocks of raw material and finished goods have been built up in the studied company. The raw material stock makes sure that supplies are available when needed. The finished goods stock on the other hand exists for a couple of different reasons. One of the reasons is that some of the largest customers demand that the company holds a security stock of the most commonly used
The company’s customers also demand very short delivery times compared to their European and American counterparts. Products usually have to be ready for shipment within three days of receiving the order whereas the companies in Europe normally can deliver two weeks after receiving an order. To handle the customer’s demand for short delivery time large stocks of raw material and finished goods have been built up in the studied company. The raw material stock makes sure that supplies are available when needed. The finished goods stock on the other hand exists for a couple of different reasons. One of the reasons is that some of the largest customers demand that the company holds a security stock of the most commonly used

EMPIRICAL STUDIES
- 30 -
products. Holding security stock at several different customers means a large finished goods stock. If the customer decides to stop using one of the products in security stock they will simply return the goods. That way the studied company is forced to hold large stocks that aren’t guaranteed to be sold. It also seems common practice that Chinese companies return bought goods that they simply decide not to use. This behavior further fill up the studied company’s finished goods stock. The reason that the customers demand very short delivery time is that they themselves decide on very short notice what to produce. The customers short planning affects the studied company such that they don’t know more than a couple of days in advance what will be produced. This also causes a very fluctuating demand which in turn makes the company often use overtime to be able to deliver on time and other times the production personnel are without work. When a customer place an order it is always difficult to know the exact volume needed for this specific case. For this reason the customers sometimes order a little more than what is thought to be needed just to make sure that it will not be too little. When the sales organization at the studied company receives the order from the customer they may think that it is better to make a little more than what the customer asks for just to be sure that it will be enough and that way be sure that the production department will produce a sufficient volume. Finally, because the studied company produces coatings, which are liquid and normally requires a number of adjustments during the production process, there will always be some leftovers when the drums are filled. So through this occasional chain of events the company will sometimes be left with a lot more finished goods than the customer needs.

ANALYSIS AND CONCLUSIONS
5 Analysis and Conclusions
- 31 -
The analysis of and conclusions drawn from the theoretical frame of reference and the empirical studies are presented in this chapter.
5.1 Quality Maturity According to literature a quality costing project should first and foremost be based on, and adapted to, the needs of the specific organization (Pursglove & Dale, 1995). If the quality maturity of the company is low it can be difficult to aim improvement efforts directly at the calculated quality costs and expect a long term positive outcome. For this reason an analysis of the company’s general quality maturity was made. The evaluation was made using Crosby’s (1979) maturity grid (Table 1). The judgments were based on the interviews and observations made during the study. The management understanding and attitude was considered to be in the Awakening stage. The management recognizes the need to strengthen the quality focus but lack the determination to launch a sufficient quality improvement program. The quality organization’s status was placed in the uncertainty stage because no quality organization really existed at the studied plant. It was difficult for the quality manager to lead quality improvement from his location at the other plant. When it comes to problem handling Crosby’s description of Uncertainty fits just right. Customer complaints were handled in a structured way but any corrective actions were not done. A common denominator for all problems occurring was that a solution was aimed at the symptom and not what caused the problem. This way the same problems could reoccur over and over. Quality costs had never been attempted to measure which places the company in the Uncertainty stage of the Cost of quality category. Some quality improvement actions had however been taken before this study was initiated. The 5S program was a couple of months along but besides that quality was mainly about control. The attempts made qualified for an Awakening placement in that category. In total the company’s quality maturity can be described as relatively low. The ratings indicates that the company is situated somewhere between Uncertainty and Awakening which fits well with the author’s impressions. The ratings are summarized in Table 1 below.
Measurement Categories Stage I: Uncertainty
Stage II: Awakening
Stage III: Enlightenment
Stage IV: Wisdom
Stage V: Certainty
Management understanding and attitude. X
Quality organization status. X
Problem handling. X
Cost of quality as % of sales. X
Quality improvements actions. X
Summation of company quality posture. X X
Table 3: The current quality maturity of the studied company evaluated by using Crosby’s (1979) Quality Management Maturity Grid.

ANALYSIS AND CONCLUSIONSS AND CONCLUSIONS
- 32 -
- 32 -
5.2 P1: Calculated Quality Costs 5.2 P1: Calculated Quality Costs The quality costs that were calculated added up to about 13 % of the annual turnover. This may seem like a low figure considering the previously stated common interval of 10 to 30 % for an average company (Sörqvist, 2001). The reason however that this study presents a low number is partly that many costs (i.e. appraisal and preventive costs) have been deliberately left out of the study and partly that all the present failure costs have naturally not been found or could not be quantified. The reason to leave some costs out was that keeping the quality costing easy to do and to understand was considered a success factor according to the studied literature (Dale & Wan, 2002).
The quality costs that were calculated added up to about 13 % of the annual turnover. This may seem like a low figure considering the previously stated common interval of 10 to 30 % for an average company (Sörqvist, 2001). The reason however that this study presents a low number is partly that many costs (i.e. appraisal and preventive costs) have been deliberately left out of the study and partly that all the present failure costs have naturally not been found or could not be quantified. The reason to leave some costs out was that keeping the quality costing easy to do and to understand was considered a success factor according to the studied literature (Dale & Wan, 2002). The costs areas that have been found and calculated for can be divided into three major groups; costs related to complaints, the market situation or raw material waste. In the group containing costs related to complaints the handling cost, half the retip and rework costs, the extra transportation and the compensation costs have been included. The reason why only half the retip and rework cost is included is that only the retip part is related to customer complaints. The costs for rework belong is considered to be due to the market situation. In that group the costs of overtime, tied-up capital and aging stock are also included. The raw material waste group consists of the stock take difference and yield variance. The relationship between these cost categories can be seen in Figure 9.
The costs areas that have been found and calculated for can be divided into three major groups; costs related to complaints, the market situation or raw material waste. In the group containing costs related to complaints the handling cost, half the retip and rework costs, the extra transportation and the compensation costs have been included. The reason why only half the retip and rework cost is included is that only the retip part is related to customer complaints. The costs for rework belong is considered to be due to the market situation. In that group the costs of overtime, tied-up capital and aging stock are also included. The raw material waste group consists of the stock take difference and yield variance. The relationship between these cost categories can be seen in Figure 9.
13%
60%
27%
Complaints
Market situation
Raw material waste
Figure 9: The quality costs sorted into three categories of
underlying causes. Figure 9: The quality costs sorted into three categories of
underlying causes. A more detailed view of the calculated costs can be seen in Figure 10 where all the cost areas are presented and sorted by the size as well as a line showing the accumulated percentage. The color coding from Figure 9 is transferred to Figure 10 to show which cost belong to which group.
A more detailed view of the calculated costs can be seen in Figure 10 where all the cost areas are presented and sorted by the size as well as a line showing the accumulated percentage. The color coding from Figure 9 is transferred to Figure 10 to show which cost belong to which group.

ANALYSIS AND CONCLUSIONS
- 33 -
0
1 000 000
2 000 000
3 000 000
4 000 000
5 000 000
6 000 000
Rewo
rk &
Ret
ipYi
eld
varia
nce
Sellin
g lo
ss F
G
Tied
-up
capi
tal F
G
Stoc
ktak
e di
ffere
nce
Prov
ision
ed F
G
Tied
-up
capi
tal R
MPr
ovisi
oned
RM
Hand
ling
of C
CCo
st o
f Ove
rtim
eCo
mpe
nsat
ion
Tran
spor
tatio
nSe
lling
loss
RM
CNY
0
10
20
30
40
50
60
70
80
90
100%
Complaints
Market situation
Raw material waste
Figure 10: The calculated quality costs sorted by size. The two figures show that the customer complaints is both the smallest cost group out of the tree and consists of mainly small costs. Raw material waste represents about one quarter of the total calculated costs. The cost group labeled market situation is the largest one and also contains 2.5 of the 4 largest individual cost areas. A large part of the costs included in this group come from the company’s large stock. As stated earlier the goal of quality management is to raise quality using fewer resources. What the studied company has done is to uphold quality by spending more resources. To build stock is a common way around the actual problems that a company may have. By increasing the stock the symptoms of the problem are hidden. What the company needs is to find a way to satisfy the needs of the customers without relying on huge stock. Out of the quality costs that were calculated raw material waste also stood out. A yearly cost of around CNY 8.3 million of raw materials wasted either in warehouse or in production. This corresponds to about 4.3 % of the raw material consumed during the studied period and is comparable to the raw material waste in similar factories in Europe. Even though the wasted raw material is not particularly larger than for its European counterparts reducing raw material waste should have a much larger priority in the Chinese factory than in the European because of the huge difference in cost structure. In the Chinese factory with the still very low labor cost the cost of raw material becomes the largest part of the production cost. For this reason the Chinese factory should be the one leading the development of ways to reduce raw material waste. The evaluation of the company’s quality maturity gave a low scoring in all categories which indicate that the need of the organization studied for this thesis is to get a structured quality improvement program going. This is because a quality costing program does not serve any purpose in itself without a well functioning quality organization that can make use of the
ja
Line

ANALYSIS AND CONCLUSIONS
- 34 -
quality cost information. What the studied company should do is therefore to put an effort into improving the way it works with quality to promote a quality focus within the organization. In doing this however the quality costing calculations can be a good basis for building up the needed commitment from managers. Several researchers referred to in the theoretical frame of reference state that quality improvement must start with and be built on the commitment from management. When the quality awareness within the organization increases much of what drives the quality costs is bound to decrease over time.
5.3 P2: Suggested Improvements The improvements found to be needed in order to be successful in the company’s quality improvement work are presented in the setting of Bergman and Klefsjö’s (2003) quality cornerstone model where each of the six elements are examined from the studied company’s point of view. The conclusions in the form of recommendations to the company are listed at the top of each subchapter.
5.3.1 Management Commitment
• Measure quality parameters • Set goals for those parameters • Delegate responsibility of reaching the goals • Follow up regularly • Make information of the progress of quality goals accessible for all employees
Quality management is according to Crosby (1979) a vital part in business growth and he also stresses the fact that quality is a culture and not only a set of product control methods. This change toward a quality culture with focus on continuous improvements must begin with the management team. Without the understanding of the managements own role and importance in the quality work it is difficult to reach proper improvements. It is necessary for the management team to change their mindset of what quality management is and realize that they are the key for success and have a central role to push the “continuous improvement” way of thinking down through the organization. They need to truly understand and be convinced that this is the correct way to go and give appropriate support needed for a successful implementation. This is where the calculation and presentation of quality costs becomes useful. The management’s work is often evaluated using financial measures which make quality costing a good way to demonstrate the benefits of quality improvement work and get their commitment. When the management is fully committed to quality management they need to show the quality commitment to the organization. A way to do this is to regularly measuring and following up quality parameters. This can be quality costs, non conformance rates or any other quality parameter. To each of these parameters the top management should then set suitable targets and the responsibility to reach the targets should be delegated to appropriate middle managers and supervisors. The targets should be set in cooperation with the ones that will be responsible for reaching them in order to avoid the difficulties with whom that should be debited specific quality costs. To further show the commitment to quality the development of the quality parameters should be made accessible to everyone in the organization. A common way to do this is to post trend charts that regularly are updated with the latest information. This way the interest in the quality parameters will continue. Earlier the quality control department at the studied

ANALYSIS AND CONCLUSIONS
- 35 -
company measured and reported the number of times each batch was tested and readjusted but they stopped because the information was never requested or used. This will also happen to the measured quality parameters if they are not followed up regularly. Management not showing enough interest was also one of the difficulties Sörqvist (2001) identified in his research of quality costing.
5.3.2 Focus On Customers
• Find and target the customer’s needs • Involve customers in an effort to even out demand • Think customer/supplier relations internally as well
That the company builds large stocks and frequently orders overtime to cope with the demanded short delivery times means that the company meets the customer demands by increasing the use of resources. Having an uneven flow of work does not only contribute to large stocks it also put pressure on the company to always have enough people ready to handle peaks in production. This scenario is described as Mura in Toyota’s three M model and to reduce root causes of Mura is the first step towards an elimination of non value added work. A somewhat exaggerated illustration of the company’s situation is found in Figure 11. It shows that the capacity has to be kept in a level far above the average demand in order to deal with constant fluctuations.
Average demand
Capacity not using overtimeCapacity using overtime
Actual demand
}Extra capacity needed to meet the demand
Figure 11: An illustration of how fluctuating demand will consume more resources. The need to keep a high capacity does not only include machine capacity but also labor capacity. In to order to manage the peaks workers are also often working overtime. Labor is a great expense in many western companies and it is often target for different cost saving efforts. The situation in China is somewhat different in terms of having people employed. A shop floor worker in the company’s Chinese plants earn about one tenth of what a shop floor worker in the Swedish plant does. Overtime payment and an excess of labor is probably not a big issue in a short perspective but it will definitely have a negative impact on profitability in the long run as wages steadily increases. Furthermore peaks in production create an overburden to both machines and employees which can put quality or safety at risk according to Liker (2004). To focus on customers does not only involve external customers, it also underlines the importance of having satisfied internal customers. The work atmosphere on the shop floor and all the way up to department management level is characterized by a strict hierarchy

ANALYSIS AND CONCLUSIONS
- 36 -
where the manager often is the final decision maker. The respect of superiors and the fear of making mistakes counteract the ability to cooperate and work in an independent way. Something Bergman & Klefsjö (2003) see as a vital part of getting satisfied internal customers and thus also satisfied and loyal external customers. The goal of quality management is to increase customer satisfaction while using fewer resources. That is a situation where both customer and supplier are winners. Toyota is famous for their committed involvement with suppliers and customers. They involve their partners and challenge them in order to grow and develop together. A developed well working supplier-customer relationship is currently not present at the studied company. There exists a willingness among top managers to initiate a deeper cooperation with important customers but the responses from customers have so far been rather tepid. A better understanding of each others businesses and needs would be start for the company to deal with the fluctuating workload they struggle with today. The sales department at the studied company naturally has continuous contact with the customers but their needs may not always be just what they say (or what the sales people think that the customers say, for that matter). When a customer asks for a product what they need is really a function; when they ask for short delivery time their need may be flexibility; when the customers ask for a low price what their need may is a low cost. The studied company should therefore strive to listen to the needs of the customers and not just fulfill a specification. To get the attention of the customers in this matter the authors’ suggestion is to make a thorough calculation of what the costs of this market situation is. In this thesis some of the costs have been mapped out (around CNY 18.5 million per year) but the cost of extra machine and labor capacity illustrated above is among those that have not been calculated so far. When the studied company has a clear picture of what the fluctuation demand and the way of handling security stock costs each year it could make a good basis for discussion with the customers. The savings that can be made will make it possible to lower prices to the customers but the largest winning would be what the customers themselves could save by planning their production further in advance.
5.3.3 Base Decisions on Fact
• Use quality parameters as an aid in decision making • Measure customer and employee satisfaction
Measuring quality parameters like stock levels and kilograms produced per man-hour is one way of collecting relevant facts. This was done to some extent in the studied company but it is however not clear how the collected material is used. It seems like the only people aware of these measurements was the people closely connected to production like operational manager and his staff. Collected quality parameters would make a useful base for decisions if they are used. One of the measures the authors finds missing is that of customer satisfaction. To have a customer focus as explained in 5.3.2 the company must know the customers’ needs in order to satisfy them. This should be done in a systemized way instead of expecting the sales department to figure them out on their own. Questionnaires are a common way of monitoring customer satisfaction. The survey should be conducted on a regular basis. If the same

ANALYSIS AND CONCLUSIONS
- 37 -
questionnaire is used for all customers the answers will be comparable and can be evaluated over time. Satisfied and thriving internal customers have a positive influence on external customers according to Bergman & Klefsjö (2003). Employee satisfaction is not measured and monitored on regular basis for the moment. By distributing a questionnaire annually or twice a year quality problems could be detected and avoided at an early stage. In such a questionnaire questions about time spent on non value adding work could also be asked in order to collect information for the calculation of quality costs.
5.3.4 Focus On Processes
• Make use of the ISO documentation to standardize work routines and processes • Let the ISO documentation constantly evolve as work is improving.
The company is ISO9000 certified and the ISO-system is a perfect springboard towards structure and systemization within the organization. A quality system provides a foundation which in turn makes it easy to control and improve products and processes. (Bergman & Klefsjö, 2003) The impression however is that the ISO9000 system is not really used as an instrument to improve business. Documented processes and procedures should be possible to review if a problem occurs to check whether routines were followed or not. This way the company would be able to update and have a continuous refinement of the documentation and subsequently a refinement of the ways they are working. Unfortunately, there is no sign of the ISO-system being used as described above and the existing documentation seems to be buried deep somewhere in an archive where its only purpose is to grant the company it’s ISO-certification. Toyota put a lot of effort into standardizing their processes. They believe that a standardized way of working is crucial and makes it easier to incorporate quality and thereby improve business continuously (Liker, 2004). Mapping out main processes as well as support- and management processes and thereby creating a picture of how work should be done is seen as way of settle a first standard. This standard should then be subject to audits and constant change through improvements. Successful improvements should be standardized and maintained as the new way to operate. However, if the documentation in the studied company deviates from reality it is possible that improvement efforts will do more damage than good. If a decision of making a change is based on incorrect information it might cause the process to fluctuate more heavily than before and this will subsequently lead towards a decrease instead of increase in performance according to Liker (2004).
5.3.5 Improve Continuously
• Attack the roots of the problems that occur • Push more for the 5S program • Employ someone to advocate quality matters fulltime in the studied factory
By repairing symptoms of problems as they came up the company left the actual problems still existing. This way the same symptoms of problems will continue to come back over and over again. The company was controlling and repairing instead of preventing and improving. The current situation was described by Crosby (1979) as common among companies in the Uncertainty stage of his Quality Management Maturity Grid. What was happening in the

ANALYSIS AND CONCLUSIONS
- 38 -
studied company was that they push the problems ahead of them which will in the long run will lead to a situation where resolving acute issues will take up most of their available time. A problem will not disappear to occur unless its root cause is discovered and treated. Toyota has a special procedure for dealing with problems. It is a seven step work method where finding the root cause, perform accurate counteractions, and establish the solution as a new standard is seen as core areas. Top managers at the company are aware of the importance of making root cause analyses in order to get rid of recurring problems and improve business in general but they didn’t have any structure for how to do it. This was another example of an opportunity to make use of the ISO documents that was not utilized. An organization should, in their ISO documentation, include a process describing how improvement and problem solving efforts should be managed. (Sörqvist, 2004) Improve continuously is not only about finding and eliminate a root cause to a specific customer complaint or any other non conformance. It is also something that should exist as a part of the everyday work by eliminating obstructions blocking the way towards better products and processes with the use of fewer resources. 5S is something that can assist in this work. But without committed managers that believe in and understand the philosophy behind the 5S concept and besides that are willing to push and encourage their staff to think in the same way, the whole 5S method of improving business will only be something done for a day or two and soon be forgotten. The 5S program at the studied company was thoroughly prepared with a clear agenda on how the different steps were supposed to be implemented and people involved were informed of their tasks and responsibilities. A so called “blitz” implementation was chosen and the three first S were done in two to three days and the rest was to follow later. The results were not as expected by the operational manager who was the initiator of the 5S program. The plant looks and works in the same way as is did before and much of the staff regarded the 5S program as merely a method to keep their work environment clean. It seems that the managers, except for the operational manager, were unaware, or not convinced, of the 5S program’s benefits. Committed middle managers and supervisors are crucial for keeping a 5S program running. They are the connection between top management and shop floor workers. Neither top managers nor middle managers appeared to understand or believe in the concept. Since the support from higher level managers was low the commitment from other employees diminished as well. This makes it clear that if the company shall succeed with its quality improvement efforts it needs someone who can be a constant advocate for these projects in each factory. They need to employ someone to push for quality improvement in the studied plant as well.
5.3.6 Let Everybody Be Committed
• Involve employees when describing processes and work instructions • Break down the main goals into smaller pieces that employees can relate to • Visualize goals and current performance by posting trend charts
To succeed with quality improvement it is vital that management feels a commitment to the task. However while the management commitment is required for success it is how well management can stimulate all employee’s commitment that determines the level of success the company will get. A work environment where everybody has an opportunity to influence

ANALYSIS AND CONCLUSIONS
- 39 -
and contribute to overall business improvements would stimulate this but could not be seen at the company today.
Tell me and I will forget. Show me and I may remember.
Involve me and I will understand. -Confucius (551-479 B.C.) Toyota involves their employees in business development by letting them create procedures themselves for how a specific task should be carried out. It is a way of delegate responsibility and let people have an influence over their own situation and work environment. This could be a step towards a culture characterized by employee commitment. Committed employees are not only reached through an increase in delegation and responsibility. Another step towards a more involved staff could be to monitor company performance through measuring quality and other parameters and present them on trend charts. By measuring and delegating responsibility for quality parameters employees could get a better idea of how their own performance affects the company as a whole. It is a way of make employees aware of their own importance in the big picture and to motivate them in their work by letting them see how their work affects the overall company performance. Unfortunately is quality parameters not monitored in this specific way today and the few parameters that actually is measured are stored in computers and not available for the great majority of employees.
5.4 P3: Experiences from Using Quality Costing In a Chinese Company After attempting to initiate the use of quality costing with all its functions in a Chinese company the impression is that it is difficult to make full use of the method. The studied company had a quite low quality maturity in general which leaves the impression that it is not ready to implement a full scale quality costing program. The company needs to build a quality organization and some quality awareness first before quality costing can reach its full potential in the company. The one shot calculation of quality costs performed during this study was however more successful in other aspects. The method of calculating costs caused by the lack of quality really did get the attention of the management team. The idea to make quality something more tangible by showing the effects that lack of quality have on business was very successful. In this sense quality costing showed to be very useful even for an organization with low quality maturity when used as a one shot measurement intended to raise the management’s quality commitment. Quality costing was hence a useful tool to show that quality is important and did it in a way that was easy to explain and to understand. It seemed that many of the problems that the company had were known to the employees. It was however difficult for people to understand what total impact these problems have on business as each little problem in itself may not have had any significant influence. When compiling all of these problems into a quality cost calculation it was easy to see how much the lack of quality costs.

DISCUSSION
6 Discussion When collecting quality costs one challenge was that the current accounting and documentation was generally not detailed enough to be able to deliver the exact information that was sought for. As a result several cost areas had to be grouped together which in turn also made the analysis less detailed. For the same reason some overlapping of the calculated quality costs may have occurred. For instance the cost of transportation for retip and rework may overlap to some extent with the transportation cost included in the costs of compensations. This because there may be rework batches included in the batches made as compensation. However, the extra costs that this means to the calculations are most likely not very large considering that the transportation cost only adds up to a little more than 1 % of the calculated total quality costs. Furthermore there are certainly several areas where the calculated costs are likely to be underestimated and even more areas were not even included in the calculations. It was however not important in this thesis to show the most precise calculations possible but rather to be an eye-opener for the management by bringing the potential of quality improvement to the surface. The results of this thesis were accepted with great enthusiasm from the management at the studied company. Even though quality costing as a tool to continuously monitor and direct quality improvement work was found not to be possible in this company its function to make quality tangible and generate management commitment was successful. When quality maturity in the company has developed an implementation of the other functions of quality costing could begin. One question that the authors want to raise is whether the positive results experienced in this study would be found in an entirely Chinese company. The studied company has Swedish roots and staff Swedes among the top managers which suggest that it would have a different management style and work atmosphere compared to a fully Chinese company with only Chinese managers. Would the employees have been as helpful and would the results have been accepted if the study was conducted in an entirely Chinese environment? The quality management experts advocate openness and employee empowerment as means to improve quality but are Chinese companies ready to adopt this thinking? A suggestion for future research would be to make a study similar to this one in an entirely Chinese company where the culture of not admitting errors and losing face still exists. Until this has been done the possibility to generalize the experiences from this thesis to Chinese companies as a whole is limited. If the authors were to make this study over again at the same company the focus could instead have been largely on TQM implementation in Chinese companies, in which quality costing could be brought in as a way to start out. In this thesis it the authors chose to do it the other way around because it was not clear at first which state the quality organization at the studied company was in. The results of the thesis in the form of recommendations to the company may not seem revolutionary in any way. If that is the conclusion you have made you are precisely right! To the authors good quality management is in fact not about developing new advanced ways to manage an organization but rather to find ways of helping them to help themselves. What companies often need is just a little help to bring forth what they already know.
- 40 -

REFERENCES
7 References
- 41 -
Bergman, B., & Klefsjö, B. (2003). Quality: from Customer Needs to Customer Satisfaction 2nd edition. Lund: Studentlitteratur. Campanella, J. (1999). Principles of Quality Costs: Principles, Implementation and Use, 3rd edition. Milwaukee: ASQ Quality Press. Chin, K.S., Pun, K.F, & Hua, H.M. (2001). Consolidation of China’s quality transformation: a review. International Journal of Quality & Reliability Management 18(8), 836-853. Clarke, T. (1999). Economic growth, institutional development and personal freedom: the educational need of China. Education + Training 41(6/7), 336-343. Dale, B.G., & Wan, G.M. (2002). Setting up a quality costing system: An evaluation of the key issues. Business Process Management Journal 8(2), 104-116. Denscombe, M. (2000). Forskningshandboken – för småskaliga forskningsprojekt inom samhällsvetenskaperna. Lund: Studentlitteratur. Grønmo, S. (2006). Metoder i samhällsvetenskap. Malmö: Liber. Li, J.H., Anderson, A.R., & Harrison, R.T. (2003). Total quality management principles and practices in China. International Journal of Quality & Reliability Management 20(9), 1026-1050. Liker, J.K. (2004). The Toyota Way: 14 management principles from the world’s greatest manufacturer. New York: McGraw-Hill. Ohno, T. (1988). Toyota Production System: Beyond Large-Scale Production. New York: Productivity Press. Pursglove, A.B., & Dale, B.G. (1995). Developing a Quality Costing System: Key Features and Outcomes. Omega International Journal of Management Science 23(5), 567-575. Reason, P., & Bradbury, H. (2006). Handbook of Action Research: Concise Paperback Edition. London: SAGE Publications. Schiffauerova, A., & Thomson, V. (2006). A review on cost of quality models and best practices. International Journal of Quality & Reliability Management 23(6), 647-669. Sousa-Poza, A., Nystrom, H., & Wiebe, H. (2001). International Journal of Quality & Reliability Management 18(7), 744-761. SPECIAL: KINA – det ekonomiska undret. (2005, September 19th). Veckans Affärer, Online through PressText/Luleå University Library. Retrieved 060920 from: http://80-www.presstext.se.proxy.lib.ltu.se/online/display.php?set=S4&xid=VA2005092076928780

REFERENCES
- 42 -
Superville, C.R., & Gupta, S. (2001). Issues in modeling, monitoring and managing quality costs. The TQM Magazine 13(6), 419-423. Sörqvist, L. (2001). Kvalitetsbristkostnader; Ett hjälpmedel för verksamhetsutveckling. Andra upplagan. Lund: Studentlitteratur. Sörqvist, L. (2004). Ständiga förbättringar; En bok om resultatorienterat förbättringsarbete, verksamhetsutveckling och Sex Sigma. Lund: Studentlitteratur. Wessel, G., & Burcher, P. (2004). Six Sigma for small and medium sized enterprises. The TQM Magazine, 16(4), 264-272. Williams, A.R.T., van der Wiele, A., & Dale, B.G. (1999). Quality costing: a management review. International Journal of Management Reviews 1(4), 441-460. World Bank. (2006). China: Country Partnership Strategy 2006-2010. (Report No. 35435). Retrieved 061001 from: http://siteresources.worldbank.org/INTCHINA/Resources/ 318862-1121421293578/chinacps06.pdf Wu, J. (2005). Understanding and interpreting Chinese Economic Reform. Ohio: Thomson/South-Western Zhang, Z. (2000). Quality management approach in China. The TQM Magazine 12(2), 92-104.