Granitic magma ascent and emplacement: neither diapirism nor neutral buoyancy
Upload
theguardianCategory
view
2download
0
JOURNAL OF PETROLOGY VOLUME 42 NUMBER 9 PAGES 1595–1620 2001
The Distribution of H2O between Cordieriteand Granitic Melt: H2O Incorporation inCordierite and its Application to High-gradeMetamorphism and Crustal Anatexis
S. L. HARLEY∗ AND D. P. CARRINGTONDEPARTMENT OF GEOLOGY AND GEOPHYSICS, UNIVERSITY OF EDINBURGH, WEST MAINS ROAD,
EDINBURGH EH9 3JW, UK
RECEIVED JUNE 19, 2000; REVISED TYPESCRIPT ACCEPTED FEBRUARY 22, 2001
in high-grade terrains in Antarctica and central Australia, whereasExperiments defining the distribution of H2O [Dw = wt %aH2O calculated from the measured H2O contents in cordieritesH2O(melt)/wt % H2O(crd)]) between granitic melt and coexistingfrom several granulite migmatites are lower and in the rangecordierite over a range of melt H2O contents from saturated (i.e.0·1–0·4. Calculated H2O contents of melts that equilibrated withcoexisting cordierite + melt + vapour) to highly undersaturatedlow-H2O (0·6–1·2 wt %) cordierites in several migmatite terrains(cordierite + melt) have been conducted at 3–7 kbar andare in the range 2·8–4·4 wt %, consistent with dehydration-800–1000°C. H2O contents in cordierites and granitic melts weremelting reactions involving biotite (± sillimanite). Calculated meltdetermined using secondary ion mass spectrometry (SIMS). ForH2O contents that in other studied migmatites are unrealisticallyH2O vapour-saturated conditions Dw ranges from 4·3 to 7 andlow for the specified temperature conditions of melting probablyincreases with rising temperature. When the system is volatilereflect post-equilibrium H2O loss from the cordierites.undersaturated Dw decreases to minimum values of 2·6–5·0 at
moderate to low cordierite H2O contents (0·6–1·1 wt %). At verylow aH2O, cordierite contains less than 0·2–0·3 wt % H2O andDw increases sharply. The Dw results are consistent with melt H2Osolubility models in which aH2O is proportional to Xw
2 (where KEY WORDS: cordierite; granite; melting; metamorphism; SIMS
Xw is the mole fraction of H2O in eight-oxygen unit melt) at Xw
Ζ 0·5 and 0·25kw{exp[(6·52 − (2667/T)) × Xw]} at Xw
>0·5, coupled with cordierite hydration models in which aH2O isproportional to n/(1 − n), where n is the number of molecules INTRODUCTIONof H2O per 18-oxygen anhydrous cordierite formula unit (n <1).
Fluids and melts interacting with hot rocks during meta-Combination of our 800–1000°C cordierite H2O saturation resultsmorphism and melting at mid- and deep-crustal levelswith previous cordierite hydration data leads to the followingare intrinsic to the evolution of metamorphic belts andgeohydrometer relation, applicable for temperatures in the rangethe transfer of heat and matter in the crust. As a con-500–1000°C:sequence, it is essential that a thorough understandingof the fluid regime of high-grade metamorphism is de-ln Keq = [4203(± 320)/T] − 11·75 (± 0·33)veloped and constrained using a broad variety of ap-
where Keq = [nsat/(1 − nsat)]/fH2O( P,T), nsat is the saturation proaches and techniques. The timing and extents of anyvalue of n for the P–T condition of interest, and T is in Kelvin. fluid infiltration, whether by carbonic (CO2-rich), hydrousModerate to high aH2O (0·4–0·9) are calculated for H2O-rich or saline fluids (e.g. Newton et al., 1980; Santosh et al.,
1990; Shmulovich & Graham, 1996; Buick et al., 1998),cordierites in several pegmatites and zones of hydrous fluid infiltration
∗Corresponding author. Telephone: 0044-131-6508547. Fax: 0044-131-6683184. E-mail: [email protected] Oxford University Press 2001
JOURNAL OF PETROLOGY VOLUME 42 NUMBER 9 SEPTEMBER 2001
and prevalence of melt-present but fluid-absent con- and metasomatic fluid infiltration. Cordierite-bearing S-type granitoids and upper amphibolite to granulite faciesditions during the course of high-grade metamorphism
(e.g. Waters & Whales, 1984; Waters, 1988; Barbey et migmatites furthermore indicate that cordierite can occurin equilibrium with peraluminous felsic melts, producedal., 1990; Stevens & Clemens, 1993) are important factors
influencing the behaviour of the deep crust during major either as a peritectic phase during melting or as a pheno-crystic phase during the course of melt crystallizationtectonic events.
The high temperatures (>800°C) attained in many (e.g. Vry et al., 1990; Fitzsimons, 1994, 1996; Harley,1994; Stevens et al., 1995; Carrington & Harley, 1996).granulite terrains (Harley, 1989) ensure that some melt
has had to be present in equilibrium with solid phases In fluid-present situations, the absolute abundance ofchannel volatiles and XCO2
[CO2/(CO2 + H2O)] inin most metapelitic rocks initially containing biotite,which has been shown experimentally to undergo ex- cordierite is a function of pressure, temperature and
XCO2in the coexisting fluid ( Johannes & Schreyer, 1981;tensive dehydration melting in the 800–900°C interval
for a range of bulk-rock compositions (e.g. Le Breton & Kurepin, 1984). Hence knowledge of the volatile com-position in cordierite provides constraints on the meta-Thompson, 1988; Vielzeuf & Holloway, 1988; Puziewicz
& Johannes, 1990; Patino Douce & Johnston, 1991). This morphic fluid composition (e.g. Armbruster & Bloss,1982; Armbruster et al., 1982; Schreyer, 1985; Vry et al.,general perception is supported by studies of several
high-grade terrains in which biotite dehydration-melting 1990). However, in cases where a free volatile phase isnot present but temperatures are high (>750–800°C: Lereactions have been deduced on the basis of textural (e.g.
Vernon & Collins, 1988), petrological (e.g. Waters & Breton & Thompson, 1988; Vielzeuf & Holloway, 1988;Patino Douce & Johnston, 1991), the absolute abundanceWhales, 1984; Bhattacharya & Sen, 1986; Young et al.,
1989) and geochemical (e.g. Waters, 1988; Barbey et of these channel volatiles depends instead upon par-titioning of H2O and CO2 between the cordierite and aal., 1990; Holtz & Barbey, 1991) observations from
discordant leucosomes and segregations in pelitic gneisses. coexisting melt phase of broadly granitic composition(Harley, 1994; Stevens et al., 1995; Carrington & Harley,To understand and quantify the role and influence of
melting in granulite generation and probe further into 1996). Measurements of the total volatile contents andcompositions of cordierite formed at known P–T thereforethe links between anatexis as manifested in migmatites
and felsic magmatism in orogenic belts (Clemens & have the potential to discriminate between fluid-presentconditions and situations in which melt is present but aVielzeuf, 1987; White & Chappell, 1988; Stevens &
Clemens, 1993), it is important to monitor any variations free H2O–CO2 fluid phase absent and provide quan-titative fluid activity estimates to support textural andin volatile composition and abundance and deduce ac-
curately the fluid contents of the melts that have migrated phase equilibrium approaches. The key prerequisites forthis are the availability of (1) reliable and internallywithin or moved out of the region of high-temperature
metamorphism. The melts themselves have crystallized, consistent experimental data defining the H2O, and H2O–CO2, saturation surfaces for cordierite and (2) relatedescaped, fractionated or been affected by post-crys-
tallization metamorphism and so a proxy monitor phase experimental data on the volatile contents of cordieritecoexisting with fluid-undersaturated melt (Fig. 1; seeof fluid content is required. This proxy would complement
the indirect approaches, such as stable isotopic signatures Carrington & Harley, 1996) that define the partitioningin the undersaturated system and how this varies withand mineral equilibria calculations, that are commonly
employed to evaluate the extents of fluid interaction and P–T. Of course, application to metamorphic belts alsorequires spatial data on volatile distribution or zoning inactivities of fluid species.
The mineral cordierite, (Mg,Fe)2Al4Si5O18.(nH2O, natural cordierite so that the significance of any H2O orCO2 leakage from or uptake into the channels in cor-mCO2), potentially provides such a direct mineralogical
monitor. Cordierite is able to incorporate both the major dierite during post-formation re-equilibration can be as-sessed (Lepezin & Melenevsky, 1977; Zimmermann,volatile species in crustal metamorphism, CO2 and H2O,
within the channels in its structure and hence can yield 1981; Jochum et al., 1983; Schreyer, 1985; Mirwald etal., 1986).information on the relative proportions and contents of
those species in any coexisting fluid or melt (Goldman et This paper presents the results of a poly-baric–polythermal experimental study of the partitioningal., 1977; Armbruster & Bloss, 1980, 1982; Johannes &
Schreyer, 1981; Kurepin, 1984; Schreyer, 1985; Le of H2O between cordierite and coexisting melt thatranges from vapour-saturated to highly undersaturatedBreton, 1989; Vry et al., 1990). Furthermore, cordierite
is a common phase in a variety of metapelitic assemblages conditions (Fig. 1), and hence contributes to objectives(1) and (2) in the specific case of the CO2-free system.and may be produced over a wide pressure
(P )–temperature (T ) range (3–11 kbar and 600–950°C) Thermodynamic modelling of the experimentally de-termined H2O contents of cordierite and melt allowsthrough a variety of processes involving rather different
fluid regimes, including subsolidus reactions, melting, calculation of water activities from cordierite-bearing
1596

HARLEY AND CARRINGTON H2O INCORPORATION IN CORDIERITE
At specified P–T conditions greater than the wet solidushydrous melts can in principle have H2O contents any-where between a maximum that is attained when anyadditional H2O forms a free fluid phase (L + V equi-librium: aH2O = 1), and a minimum H2O content atwhich the granitic melt crystallizes quartz and alkali-feldspar (L + Crystals equilibrium; Holtz & Johannes,1994; Johannes & Holtz, 1996); only on the wet and drysolidi are the maximum and minimum H2O contentsidentical. This is a key feature of the melt system relevantto the H2O-undersaturated experiments carried out inthis study, which spans both the H2O-saturated and-undersaturated portions of compositional space definedin the melt–cordierite–H2O system (Fig. 1). Melt H2Ocontents at the minimum boundary are difficult to meas-ure experimentally as melt–crystal mixtures are produced,but are instead calculated using models for the re-lationships between P, T, aH2O and weight percent H2Oin melts (e.g. Burnham & Nekvasil, 1986; Burnham,1994; Moore et al., 1995, 1998; Papale, 1997). The H2OFig. 1. Schematic composition–assemblage diagram for the system
cordierite (Crd)–melt (L)–H2O at a specific P–T condition, showing the contents of melts formed in dehydration-melting reactionsvapour-saturated three-phase field and the bounding Crd–L two-phase will also lie at a minimum value for the P–T conditionsfield (marked by Crd–L tielines). Four Crd–L experiments are depicted
of melting, but hitherto have only been experimentallythat have similar Crd:L ratios but differ in their bulk H2O contentsconstrained using modal mass-balance calculations onand so lie on the schematic line radial to the H2O apex (dashed line).
The experiments access the undersaturated region (e.g. compositions run products (Vielzeuf & Holloway, 1988; Patino Douceof the lower three filled circles) and also define the saturation condition & Johnston, 1991; Carrington & Harley, 1995). As a(compositions at or above the open circle). Tie-lines join Crd and L
consequence, the Burnham & Nekvasil (1986) approachthat coexist for specific aH2O at the given P–T condition.has been widely used in predicting weight percent H2Oin melts formed through dehydration-melting reactions
assemblages and is used to improve present calibrations and for estimation of the fertility of metapelitic rocks asof the P–T dependence of saturation H2O contents sources of granitoid magmas (Clemens & Vielzeuf, 1987;(isohydrons) in Fe–Mg cordierites. The experimental White & Chappell, 1988; Vielzeuf & Clemens, 1992). Thecalibrations are then used to constrain the water activities mass-balance relations used to predict melt percentages atrelevant to high-grade melting and metamorphism both a given temperature will be affected by the significantfor examples of key mineral reactions constrained from and variable H2O content of cordierite in those casesindependent experimental data and grids, and for selected where it is produced as a peritectic phase coexisting withgranulite and migmatite terrains for which cordierite melt (Stevens et al., 1995; Carrington & Harley, 1996).volatile content data are available.
H2O incorporation in cordieriteThe maximum volatile contents of cordierite coexistingBACKGROUND AND EXPERIMENTALwith H2O have been experimentally determined for pure
RATIONALE Mg-cordierite (Mirwald & Schreyer, 1977; Mirwald etH2O solubility in felsic and peraluminous al., 1979; Johannes & Schreyer, 1981), an Mg-rich naturalmelts cordierite (Armbruster & Bloss, 1982), and more recently
for Fe-cordierite (Boberski & Schreyer, 1990; Mukho-The maximum solubilities of H2O in eutectic meltspadhyay & Holdaway, 1994). Maximum H2O oc-within the Qz–Ab, Qz–Or, haplogranitic and simplifiedcupancies of the channels in cordierite are constrainedperaluminous granite systems are now well defined fromby structure and have been variously modelled (Newtonseveral studies (e.g. Johannes & Holtz, 1990; Holtz et al.,& Wood, 1979; Lonker, 1981; Martignole & Sisi, 1981;1992a, 1992b; Pichavant et al., 1992). Maximum H2OBhattacharya & Sen, 1985; Carey, 1995) to yieldcontents increase strongly with pressure but are onlyisohydrons of weight percent H2O (or of molecules ofweakly dependent on temperature, and indicate thatH2O per 18-oxygen anhydrous formula unit) in cordieritesolubility is also to some extent affected by melt Ab–Or
ratio and Al2O3 content. as a function of P–T. Although the models differ in
1597

JOURNAL OF PETROLOGY VOLUME 42 NUMBER 9 SEPTEMBER 2001
the calculated positions, slopes and curvatures of the The granitic melt has been added in the form of anisohydrons it is evident that the maximum H2O content anhydrous gel (XMg = 0·25) synthesized in the K2O–of cordierite increases strongly with pressure and de- Na2O–FeO–MgO–Al2O3–SiO2 system. The com-creases with temperature. Indeed, the recent models of positions of the starting gel and cordierite are given inCarey (1995), Skippen & Gunter (1996) and Holland & Tables 1 and 2, respectively. Pre-determined quantitiesPowell (1998) each reproduce most of the available H2O- of H2O have been added to each of the cordierite–gelsystem data to within ±0·15 wt % H2O. These models charges using a microsyringe so that Dw could be meas-also demonstrate that the saturation H2O contents in the ured for a wide range of H2O contents in the experimentalT range 500–800°C do not vary with parameters such phases. Reversal experiments have been conducted in aas XMg of the cordierite. However, until now, no cordierite similar way, but with the natural BB3 cordierite, whichH2O data for T >800°C have been incorporated into had first been evacuated, re-saturated with pure H2O atthe saturation models and, in addition, not all of the 900°C and 5·0 kbar. This procedure produces a startingavailable lower-T data have been included in the different cordierite H2O content of 1·7 wt %, as measured foranalyses. Therefore, in this study we have modelled the sampled grain fragments using SIMS. Additional ex-saturation H2O contents of Fe–Mg cordierites over the periments have been carried out using a geometry inT range 500–1000°C, using previous literature data and which a gel layer is sandwiched between a layer ofour new experiments, to derive an improved calibration evacuated-BB3 cordierite and a layer of pre-saturatedapplicable to all metamorphic and igneous cordierites. BB3 cordierite. A series of such ‘sandwich’ experiments
run for durations between 2 h and 2 weeks (Fig. 2b)have been used as part of a time-study to assess theapproach to equilibrium in our experiments as a whole.EXPERIMENTAL AND ANALYTICAL
Following the experiments the charges were puncturedMETHODS and then impregnated with epoxy under vacuum toExperimental design and procedures ensure that the run products retained their spatial andExperiments aimed at defining the distribution of water textural integrity. Each charge was then mounted so thatbetween cordierite and melt, Dw [= wt % H2O(melt)/ the length of the capsule, and hence both cordierite andwt % H2O(crd)], have been performed at 800, 900 and melt layers, could be exposed by grinding. Most charges1000°C and 3, 5 and 7 kbar in an internally heated gas contain well-defined cordierite-rich and melt-rich layers,apparatus at the University of Edinburgh. The ex- retaining their original geometry (Fig. 2a). A few chargesperiments have been conducted using the same methods show relative movement of the Crd–L boundary, prob-as employed by Carrington & Harley (1996). The pressure ably through crystal slumping and convective motion inand temperature uncertainties associated with the ap- the melt. Each experiment has been examined usingparatus are ±0·2 kbar and ±5°C, respectively (Car- reflected light microscopy and scanning electron micro-rington & Harley, 1995). Up to seven charges could be scopy [SEM; secondary electron imagery (SEI) and back-run in one operation at a particular P–T condition and scattered electron imagery (BEI)] to monitor the texturalfor run times varying between 250 and 400 h. relations and features.
In most experiments natural Antarctic cordierite (BB3:Brattstrand Bluffs migmatite leucosome; XMg = 0·64;sieve fraction 125–250 mm) has been used (Fig. 2a; seeTable 2, below), evacuated of all volatiles before the
Analysis of run productsexperiment. A more magnesian cordierite (AMNH:The H2O contents of the experimental cordierite andAmerican Museum of Natural History specimen, gemmelt have been analysed using SIMS (Tables 3 and 4),fields, Zimbabwe; XMg= 0·85), also evacuated, has beenand oxides other than H2O by energy-dispersive SEMused in 7 kbar runs and at equivalent conditions to BB3and by wavelength-dispersive electron microprobe (EMP)to evaluate any effects of cordierite XMg on H2O contents.(Tables 1 and 2). An Oxford Instruments scanning elec-Evacuation of volatiles is accomplished by prolongedtron microscope at the University of Manchester wasstepped heating under high vacuum at temperatures ofused, with beam conditions of 1·5 nA and 15 kV, anup to 1200°C, with the sample held for 1 h at eachenergy-dispersive spectrometry (EDS)/ZAF-4 analytical100°C temperature step below 1200°C, for 2 h at 1200°C,correction procedure, and supercooling to−190°C dur-and heated for a minimum of 10 h in total. Secondarying analysis to minimize loss of alkali counts on theion mass spectrometry (SIMS) analysis of cordierite grainexperimental glasses. Analyses obtained using this tech-fragments treated using this stepped-heating procedurenique are comparable in terms of the ratios of non-alkalishows that they are evacuated (i.e. volatile-free) withcomponents (i.e. FMAS) with those obtained using EMPapparent H2O and CO2 contents at or below the SIMS
background levels. on the same samples. The analytical procedure and
1598
HARLEY AND CARRINGTON H2O INCORPORATION IN CORDIERITE
Table 1: Mean analyses of selected experimental glasses
Initial gel MP13B MP7 MP5 C4-A C6-1 C16-1 C11-1 C8-4 C14-2
73·30 SiO2 71·92 72·26 73·80 73·67 74·54 74·35 74·74 72·88 72·66
15·00 Al2O3 16·98 16·14 14·98 15·03 14·95 15·89 14·51 15·57 16·53
1·76 FeO 2·05 2·23 1·73 1·84 1·95 1·16 1·72 1·93 2·08
0·34 MgO 1·21 0·93 0·11 0·50 0·67 1·23 0·30 0·53 1·32
4·70 K2O 3·91 4·19 4·69 4·42 3·91 3·70 4·34 4·51 3·67
4·89 Na2O 3·93 4·24 4·69 4·55 3·98 3·66 4·38 4·59 3·75
100·00 Total 100·00 100·00 100·00 100·00 100·00 100·00 100·00 100·00 100·00
H2O 10·02 7·82 3·38 5·74 9·36 10·40 7·74 5·94 9·18
Totals excluding H2O are normalized to 100·00 wt % for ease of comparison. Means are averages of 7–10 analyses in eachcase. Analyses apart from H2O obtained using the Oxford Instruments scanning electron microscope with EDS (Universityof Manchester: beam conditions 1·5 nA, 15 kV, −190°C; EDS/ZAF-4 correction) and the Cameca CAMEBAX Microbeammicroprobe (University of Edinburgh: beam conditions 20 kV and 10 nA; on-line PAP correction). H2O contents are averagesof 8–10 SIMS analyses of glasses in each experiment (see Table 4).
Table 2: Mean analyses of selected cordierite from the experiments
BB3 MP13B MP7 MP5 C4-A C6-1 C6-3 C5-3 C11-3 C14-2
Cores
48·12 SiO2 48·24 47·50 47·98 47·32 47·62 47·00 47·96 48·38 47·49
33·02 Al2O3 33·05 32·47 32·87 32·07 33·07 31·99 32·62 32·68 32·14
8·61 FeO 8·39 8·76 8·57 8·71 8·47 8·66 8·42 8·48 8·49
8·57 MgO 8·34 8·24 8·19 8·45 8·23 8·11 8·27 8·20 8·03
0·03 K2O 0·04 0·07 0·12 0·07 0·02 0·06 0·13 0·07 0·09
0·05 Na2O 0·12 0·13 0·12 0·12 0·12 0·14 0·09 0·10 0·09
98·42 Total 98·20 97·17 97·87 96·74 97·53 95·97 97·49 97·93 96·23
0·64 XMg 0·64 0·63 0·63 0·63 0·63 0·63 0·64 0·63 0·63
Rims
SiO2 48·85 48·64 48·00 48·02 48·71 46·86 47·97 47·99 49·08
Al2O3 33·50 32·86 32·88 32·04 32·59 32·12 32·45 31·67 32·73
FeO 5·89 5·54 8·49 7·40 5·15 8·59 5·74 11·38 4·10
MgO 10·07 10·24 8·18 9·26 10·32 7·98 9·93 6·28 10·74
K2O 0·10 0·14 0·11 0·12 0·17 0·07 0·19 0·13 0·06
Na2O 0·23 0·23 0·12 0·20 0·34 0·14 0·12 0·22 0·27
Total 98·64 97·67 97·81 97·04 97·29 95·78 96·40 97·68 96·98
XMg 0·75 0·77 0·63 0·69 0·78 0·62 0·76 0·50 0·82
H2O 1·70 1·54 0·77 1·29 1·79 1·11 0·88 0·87 1·91
Data are given for the core and rims (within 10 mm of edge) of the crystals. Analyses apart from H2O obtained using theCameca CAMEBAX Microbeam microprobe (University of Edinburgh: beam conditions 20 kV and 10 nA; on-line PAPcorrection). H2O contents are averages of 8–10 SIMS analyses of cordierites in each experiment (see Table 4).
conditions for the SIMS and EMP analysis are as detailed appropriate granitic composition and differing butwell-known H2O contents (2·1, 3·9 and 5·6 wt %) andby Carrington & Harley (1996).
SIMS calibration curves have been obtained in each natural cordierite standards with 1·56± 0·08 wt % and0·80 ± 0·06 wt % H2O. An O− primary beam at 8 nAanalytical session using H2O-bearing glasses of
1599

JOURNAL OF PETROLOGY VOLUME 42 NUMBER 9 SEPTEMBER 2001
Table 3: H2O contents (wt %) of experimental cordierites and glasses, 5·0 kbar, 900°C time-study
Experiment Run time A-cordierite Glass H-cordierite DwA–Crd Dw
H–Crd
(h) wt % H2O wt % H2O wt % H2O (calculated (calculated
(error) (error) (error) using A- using H-
cordierite) cordierite)
C12-1 2·5 0·44 (0·05) 1·43 (0·22) 0·79 (0·03) 3·22 (0·60) 1·80 (0·28)
C12-2 7·3 0·74 (0·03) 2·69 (0·20) 0·85 (0·04) 3·65 (0·31) 3·15 (0·28)
C12-3 24·0 0·97 (0·06) 3·73 (0·14) 0·97 (0·04) 3·85 (0·28) 3·84 (0·22)
C12-4 72·2 1·04 (0·04) 4·33 (0·17) 1·04 (0·03) 4·17 (0·22) 4·17 (0·22)
C4-1 240·0 1·11 (0·03) 4·89 (0·07) 4·39 (0·14)
C4-C 240·0 3·92 (0·09) 0·85 (0·05) 4·60 (0·28)
A-cordierite (A-Crd) contained no volatiles before the experiment (pre-evacuated). H-cordierite (H-Crd) was pre-saturatedbefore the run (1·7 wt % H2O). Errors as for Table 4.
current was used in all SIMS sessions. Positive secondary closely the saturation water contents reported by Holtz& Johannes (1994) and Johannes & Holtz (1996) for meltsions were measured (H+, 30Si) with the ion counts de-in closely comparable chemical systems.termined at an energy offset of 75 V. Each analysis
involved 30 cycles of H and Si counts following 5 minburn-in. The mean of the isotope ratios of the last 10cycles is taken as the final analysis value, and has a
EXPERIMENTAL RESULTSstatistical counting precision of better than 1% relative.Analyses are expressed as isotopic ratios of 1H/30Si and Approach to equilibrium: time-studyconverted to weight percent H2O by comparison with A time-study was conducted to assess the convergencestandard cordierites or melts. A similar routine has been towards equilibrium in the experiments. Two separateused in H2O–CO2 analysis of natural cordierites and of experimental charges, one with evacuated BB3 cordieriteexperimental run products except that SIMS is set up to and the other containing pre-saturated BB3 cordierite,measure negative secondary ions (H−, 12C, 28Si). In this were run for 10 days to provide an experimental reversalcase the analyses, expressed as isotopic ratios of 1H/28Si bracket at an intermediate melt H2O content of 4–5 wt %and 12C/28Si, are converted to weight percent H2O and (experiments C4-1 and C4-C). These were complementedCO2 respectively by comparison with standard cordierites by four sandwich-style experiments (C12-1 to C12-4) inor melts. The standard errors on analytical populations which evacuated cordierite and re-saturated cordieritefor individual standard melt and cordierite grains are layers were separated by a melt layer (Fig. 2b). Thetypically ±0·2 and ±0·08 wt % respectively for each sandwich experiment charges each had H2O added toanalytical session, which yield calibration curves with 2� them individually by microsyringe and so did not haveuncertainties of 0·15 wt % and 0·06 wt % for melt and identical initial total H2O contents. These four ex-cordierite H2O contents of 3 wt % and 1 wt % re- perimental charges were then run for different timespectively. Following SIMS analysis charges were intervals (Table 3).routinely examined under BEI to confirm the positions The results of the time-study are plotted in Fig. 3. Toand textural contexts of each analytical spot (e.g. Fig. evaluate the experiments, we have first calculated the2b–e) and hence establish, for example, whether the melt value of Dw [= H2O(melt)/H2O(cordierite)] using the(glass) analyses had incorporated any fine crystals and analysed H2O contents of the melt and the initiallycordierite analyses any melt or spinel. evacuated cordierite at one end of the capsule. This is
Each experiment has been assessed to determine then compared with the Dw calculated using the analysedwhether it was conducted at water-saturated or water- H2O contents of the melt and the initially saturatedundersaturated conditions. The release of fluid on punc- cordierite at the other end of the capsule. Assessing theturing the capsule and the extensive presence of vesicles experiments in this way largely removes spurious effectsin the experimental glasses are interpreted as a sign that of variations in analysed phase H2O contents, which arethe capsule had been water saturated. As described below, due to variations in the amounts of starting materials
(including H2O fluid) added to each experimental charge.the melt water contents in most of these charges matched
1600
HARLEY AND CARRINGTON H2O INCORPORATION IN CORDIERITE
The two calculated values of Dw converge to within errorTable 4: H2O contents of experimentalafter only 24 h and continue to be comparable for up
cordierite–glass pairs to 240 h run duration, the shortest run duration usedfor the principal equilibrium experiments of this study.
Experiment Cordierite Glass Dw∗ The increase in the Dw calculated using the pre-evacuatedwt % H2O wt % H2O (error) cordierite with increasing run duration is opposite to that(error) (error)
which would be expected for identical experimentalcharges with identical total H2O contents. This trend,5 kbar, 900°C
MP13B (saturation) 1·70 (0·05) 10·02 (0·42) 5·91 (0·30) and that of overall increase in the converged Dw obtainedMP11B 1·69 (0·06) 9·55 (0·14) 5·65 (0·22) from 24 h to 240 h, results from the differing total H2OMP7 1·54 (0·05) 7·82 (0·35) 5·09 (0·28) content of each experiment. As is demonstrated by theMP8 1·49 (0·08) 8·09 (0·37) 5·43 (0·37)
full experimental dataset, Dw at a selected P–T conditionC4-B (reversal) 1·38 (0·06) 6·58 (0·24) 4·77 (0·26)MP6 1·30 (0·05) 5·62 (0·19) 4·34 (0·21) is generally observed to increase with increasing H2OC4-A (reversal) 1·29 (0·03) 5·74 (0·17) 4·47 (0·17) contents in the phases (see below). The convergent time-DG4 1·28 (0·07) 5·14 (0·28) 4·02 (0·30) study results are consistent with this, and it is coincidentalC4-1 1·11 (0·03) 4·89 (0·07) 4·39 (0·14)
that the time-study experiments with the lowest totalC4-C (reversal) 0·85 (0·05) 3·92 (0·09) 4·60 (0·28)H2O contents (i.e. bulk weight percent H2O in theMP5 0·77 (0·05) 3·38 (0·10) 4·38 (0·31)
MP3 0·56 (0·05) 2·03 (0·10) 3·62 (0·38) experimental charge) happen to be those with the shorterMP2 0·45 (0·02) 2·23 (0·13) 4·97 (0·38) run durations. We are confident that the value of Dw
5 kbar, 800°C reached at 240 h is close to equilibrium, as six previousC6-1 (saturation) 1·79 (0·07) 9·36 (0·19) 5·23 (0·24) and comparable experiments (Carrington & Harley,C7-2 1·63 (0·09) 8·17 (0·30) 5·02 (0·34) 1996) with run durations from 280 to 340 h show anC6-5 (reversal) 1·54 (0·05) 6·51 (0·18) 4·23 (0·18)
average Dw of 4·4 (± 0·6), indistinguishable from theC6-2 1·45 (0·02) 6·92 (0·18) 4·76 (0·14)results of this time-study.C7-3 (reversal) 1·45 (0·07) 5·20 (0·30) 3·59 (0·27)
C7-4 1·41 (0·11) 6·11 (0·07) 4·32 (0·33)C6-6 (reversal) 1·21 (0·05) 4·41 (0·07) 3·63 (0·17)C6-3 1·11 (0·03) 4·39 (0·38) 3·94 (0·36)
Phase chemistry5 kbar, 1000°CC16-1 (saturation) 1·68 (0·07) 10·40 (0·20)† 6·20 (0·28) Glasses (melts)C16-2 (low melt?) 1·45 (0·08) 5·43 (0·27) 3·76 (0·28)
The melt gel composition (Table 1) has been selected toC5-3 0·88 (0·04) 4·17 (0·20) 4·73 (0·30)be close to the eutectic composition and in Fe–MgC5-4 0·36 (0·01) 2·15 (0·10) 5·93 (0·29)
equilibrium with BB3 cordierite (Table 2) at the central3 kbar, 800°CP–T conditions of the study, 900°C and 5·0 kbar (Car-C11-1 (saturation) 1·44 (0·03) 7·74 (0·24) 5·34 (0·21)
C11-4 (reversal) 1·15 (0·03) 5·78 (0·24) 5·04 (0·25) rington & Harley, 1996). The experimental glasses haveC11-2 0·98 (0·03) 4·02 (0·17) 4·12 (0·21) been analysed to detect any significant deviations fromC11-3 0·87 (0·04) 3·25 (0·19) 3·74 (0·28) eutectic compositions, which would result in reduced3 kbar, 900°C melt water contents at a given P–T condition (Table 2).C8-4 (reversal) 1·17 (0·05) 5·94 (0·18) 5·08 (0·28) Analyses have been obtained by analytical SEM using aC8-1 1·11 (0·06) 5·46 (0·22) 4·92 (0·33)
liquid-nitrogen cold stage to minimize the alkali countingC8-2 0·85 (0·05) 3·68 (0·04) 4·34 (0·24)losses that are common in water- and alkali-rich glassesC8-5 (reversal) 0·71 (0·04) 3·66 (0·03) 5·13 (0·30)
C8-3 0·51 (0·01) 2·57 (0·12) 5·07 (0·26) (SEM, Fig. 4), and with a Cameca CAMEBAX electronmicroprobe (EMP, Fig. 4) to cross-check the accuracy of7 kbar, 900°C
C18-1 (saturation) 2·17 (0·16) 13·25 (0·20)† 6·11 (0·44) SiO2, Al2O3, FeO and MgO as measured on the cold-C14-2 1·91 (0·14) 9·18 (0·35) 4·82 (0·41) stage scanning electron microscope. EMP analyses show
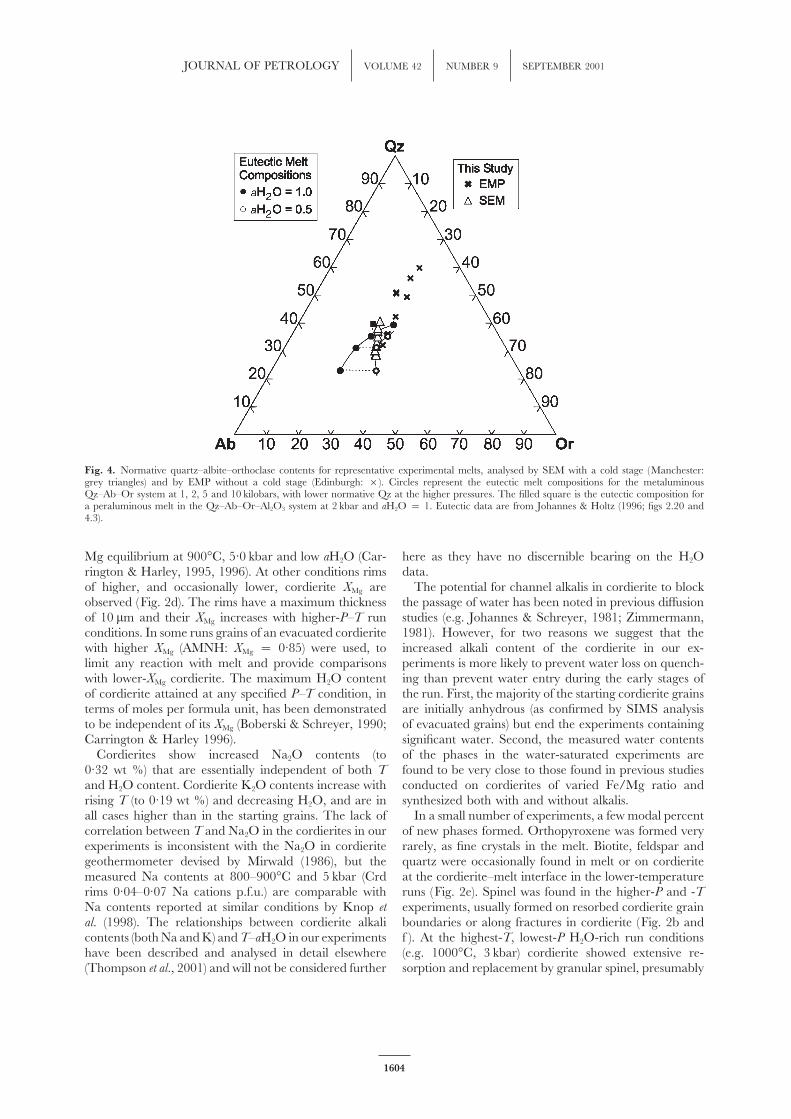
variable to extensive alkali losses, leading to high norm-∗Partition coefficient. Dw = (H2O)glass/(H2O)cordierite. Error prop- ative quartz (Fig. 4), but project back into the cluster ofagated from errors in phases. analyses obtained by SEM. Hence the reported glass†The extreme volatility of these very high water content
analyses, which show only minor variation in SiO2, Al2O3glasses made SIMS analysis unreliable and the values shownare estimates from data of Holtz & Johannes (1994), with and FeO centred around the starting composition, arewhich our other data agree very closely. Saturation ex- reliable. The analysed glasses have consistently higherperiments are those containing a pure H2O phase, reversal
MgO and lower Na2O and K2O contents than the initialexperiments are those in which the cordierite was pre-sat-gel, but their compositional range overlaps that of eutecticurated with pure H2O (i.e. experiments using H-Crd).
Errors are 1� standard deviations propagated from variations compositions measured in independent experimentalin the analysis populations (n>8–10) for each phase in each studies over a range of P–aH2O conditions ( Johannes &experiment.
Holtz, 1996, fig. 2.20). As the melts produced in our
1601
JOURNAL OF PETROLOGY VOLUME 42 NUMBER 9 SEPTEMBER 2001
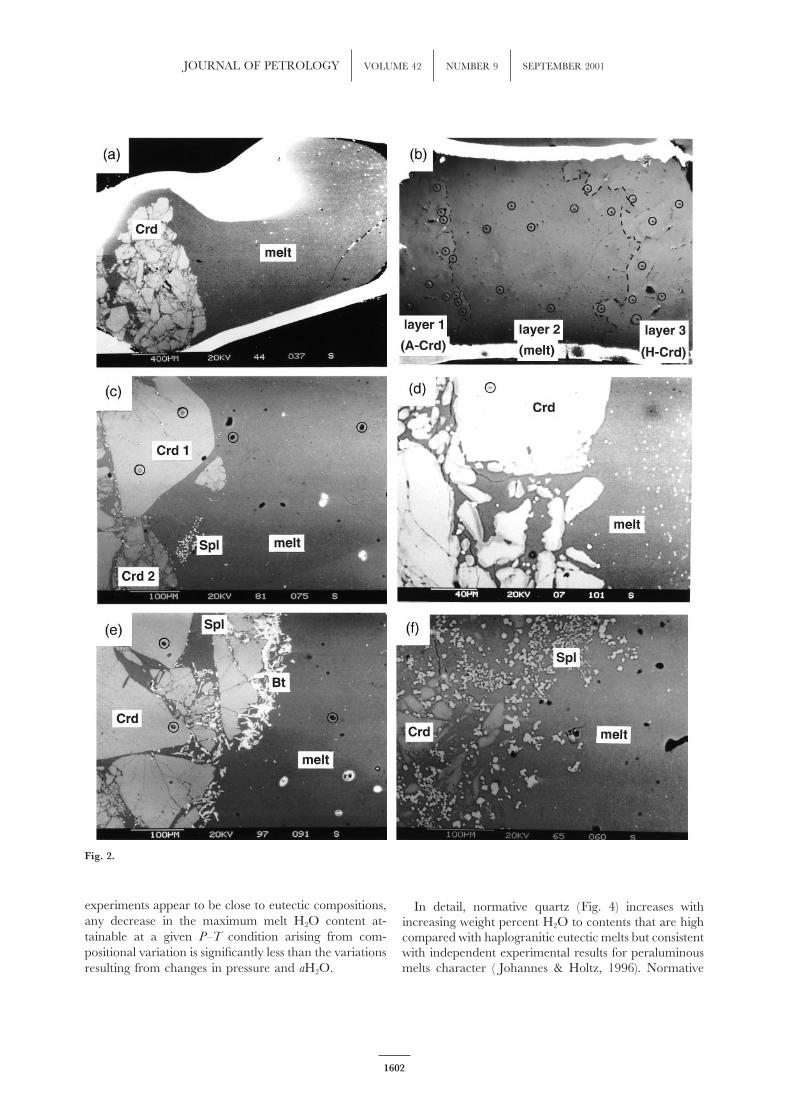
Fig. 2.
experiments appear to be close to eutectic compositions, In detail, normative quartz (Fig. 4) increases withany decrease in the maximum melt H2O content at- increasing weight percent H2O to contents that are hightainable at a given P–T condition arising from com- compared with haplogranitic eutectic melts but consistentpositional variation is significantly less than the variations with independent experimental results for peraluminous
melts character ( Johannes & Holtz, 1996). Normativeresulting from changes in pressure and aH2O.
1602

HARLEY AND CARRINGTON H2O INCORPORATION IN CORDIERITE
Fig. 3. Dw plotted against experimental run duration for the time-study experiments conducted at 5·0 kbar and 900°C. After 24 h the Dw
calculated using the initially H2O-saturated cordierite (H-Crd) converges with that calculated using the initially evacuated cordierite (A-Crd)data. The trend of increasing Dw with time is an artefact of the differing bulk H2O contents of the different sandwich experiments, as monitoredby the average melt H2O contents (numbers under each experimental pair, in wt %). (See text for further explanation.)
corundum in the experimental glasses increases from 2·2 eutectic compositions, but this deviation is unlikely toaffect the maximum melt H2O contents greatly as theto 6·2% in parallel with the increase in normative quartz.
The higher levels of normative corundum are greater Or/Ab ratio has only a small effect on H2O solubilityfor the limited range of compositions (Or/Ab= 0·7–0·82)than that attained in haplogranite experiments ( Johannes
& Holtz, 1996), although comparable with those of produced in this study (Holtz et al., 1992a, 1992b).natural leucogranites and rhyolites. The maximum melt
CordieriteH2O content at fluid saturation is not significantly de-pendent on normative corundum content, and for the The cordierite crystals generally retain their originaltotal variation in normative corundum seen in our ex- composition with respect to major oxides other thanperimental study there is a variation of only 0·5 wt % in H2O. There are changes in the Fe/Mg ratio of the crystalthe maximum melt H2O content attainable at a specified rims and increases in the minor alkali content of theP–T condition ( Johannes & Holtz, 1996, fig. 4.8). The cordierites (Table 3).more quartz-normative of our experimental glasses are The melt (XMg = 0·25) and cordierite (BB3: XMg =
0·64) compositions were originally chosen to be in Fe/less orthoclase-normative than the previously determined
Fig. 2. (opposite) SEM and reflected light images of experimental configurations and run products. It should be noted that in each case ‘melt’refers to quenched melt that now is present as a glass. (a) Back-scattered electron (BSE) image of a typical two-layer experiment showing a layerof pre-crushed cordierite fragments (pre-evacuated BB3) and adjacent homogeneous glass formed from melt. Run C6-1, H2O-saturated, 800°C,5 kbar. (b) Reflected light image of a three-layer (sandwich) time-study experiment. A layer of pre-crushed and pre-evacuated BB3 cordierite atone end of the capsule (layer 1: A-Crd denotes initially anhydrous cordierite) is separated from pre-crushed but pre-hydrated BB3 cordierite(layer 3: H-Crd denotes pre-hydrated cordierite) at the other end of the capsule by a layer of homogeneous glass formed from quenched melt(layer 2). Run C12-2, H2O-undersaturated, 900°C, 5 kbar. Elliptical spots (circled) are SIMS analysis pits in each phase; averaged H2O contentsare given in Table 3. (c) BSE image of a cordierite–melt interface region. Circled spots are SIMS analysis pits. [Note clean Crd–L contacts onthe large grain (Crd1) and the break-up of another cordierite grain (Crd2) that has a darker BSE appearance because of increased XMg.] Finegranules of spinel are located along cleavage in Crd1, on grain boundaries and form a cluster in the melt. Run C6-5, H2O-undersaturated,800°C, 5 kbar. (d) BSE image of a cordierite–melt interface region. BB3 cordierite fragments show thin rims (2–8 �m in width) with higher XMg
(darker in BSE) than the initial composition. Fine bright grains are spinel, which preferentially occurs in melt in this case. Run C6-1, H2O-saturated, 800°C, 5 kbar. (e) BSE image of a cordierite–melt interface region. Elliptical spots are SIMS analysis pits (some circled). The cordieriteadjacent to melt that is partially replaced by spinel (fine granules) and biotite (elongate grains) has not been used for H2O content and Dw
measurement. Run C6-2, H2O-undersaturated, 800°C, 5 kbar. (f ) BSE image of a cordierite–melt interface region in which initial BB3 cordieritehas been extensively resorbed and replaced by spinel (bright equant grains), a feature common in high-H2O experiments at 3–5 kbar and1000°C. Run C5-3, H2O-undersaturated, 1000°C, 5 kbar.
1603
JOURNAL OF PETROLOGY VOLUME 42 NUMBER 9 SEPTEMBER 2001
Fig. 4. Normative quartz–albite–orthoclase contents for representative experimental melts, analysed by SEM with a cold stage (Manchester:grey triangles) and by EMP without a cold stage (Edinburgh: ×). Circles represent the eutectic melt compositions for the metaluminousQz–Ab–Or system at 1, 2, 5 and 10 kilobars, with lower normative Qz at the higher pressures. The filled square is the eutectic composition fora peraluminous melt in the Qz–Ab–Or–Al2O3 system at 2 kbar and aH2O = 1. Eutectic data are from Johannes & Holtz (1996; figs 2.20 and4.3).
Mg equilibrium at 900°C, 5·0 kbar and low aH2O (Car- here as they have no discernible bearing on the H2Odata.rington & Harley, 1995, 1996). At other conditions rims
of higher, and occasionally lower, cordierite XMg are The potential for channel alkalis in cordierite to blockthe passage of water has been noted in previous diffusionobserved (Fig. 2d). The rims have a maximum thickness
of 10 �m and their XMg increases with higher-P–T run studies (e.g. Johannes & Schreyer, 1981; Zimmermann,1981). However, for two reasons we suggest that theconditions. In some runs grains of an evacuated cordierite
with higher XMg (AMNH: XMg = 0·85) were used, to increased alkali content of the cordierite in our ex-periments is more likely to prevent water loss on quench-limit any reaction with melt and provide comparisons
with lower-XMg cordierite. The maximum H2O content ing than prevent water entry during the early stages ofthe run. First, the majority of the starting cordierite grainsof cordierite attained at any specified P–T condition, in
terms of moles per formula unit, has been demonstrated are initially anhydrous (as confirmed by SIMS analysisof evacuated grains) but end the experiments containingto be independent of its XMg (Boberski & Schreyer, 1990;
Carrington & Harley 1996). significant water. Second, the measured water contentsof the phases in the water-saturated experiments areCordierites show increased Na2O contents (to
0·32 wt %) that are essentially independent of both T found to be very close to those found in previous studiesconducted on cordierites of varied Fe/Mg ratio andand H2O content. Cordierite K2O contents increase with
rising T (to 0·19 wt %) and decreasing H2O, and are in synthesized both with and without alkalis.In a small number of experiments, a few modal percentall cases higher than in the starting grains. The lack of
correlation between T and Na2O in the cordierites in our of new phases formed. Orthopyroxene was formed veryrarely, as fine crystals in the melt. Biotite, feldspar andexperiments is inconsistent with the Na2O in cordierite
geothermometer devised by Mirwald (1986), but the quartz were occasionally found in melt or on cordieriteat the cordierite–melt interface in the lower-temperaturemeasured Na contents at 800–900°C and 5 kbar (Crd
rims 0·04–0·07 Na cations p.f.u.) are comparable with runs (Fig. 2e). Spinel was found in the higher-P and -Texperiments, usually formed on resorbed cordierite grainNa contents reported at similar conditions by Knop et
al. (1998). The relationships between cordierite alkali boundaries or along fractures in cordierite (Fig. 2b andf ). At the highest-T, lowest-P H2O-rich run conditionscontents (both Na and K) and T–aH2O in our experiments
have been described and analysed in detail elsewhere (e.g. 1000°C, 3 kbar) cordierite showed extensive re-sorption and replacement by granular spinel, presumably(Thompson et al., 2001) and will not be considered further
1604
HARLEY AND CARRINGTON H2O INCORPORATION IN CORDIERITE
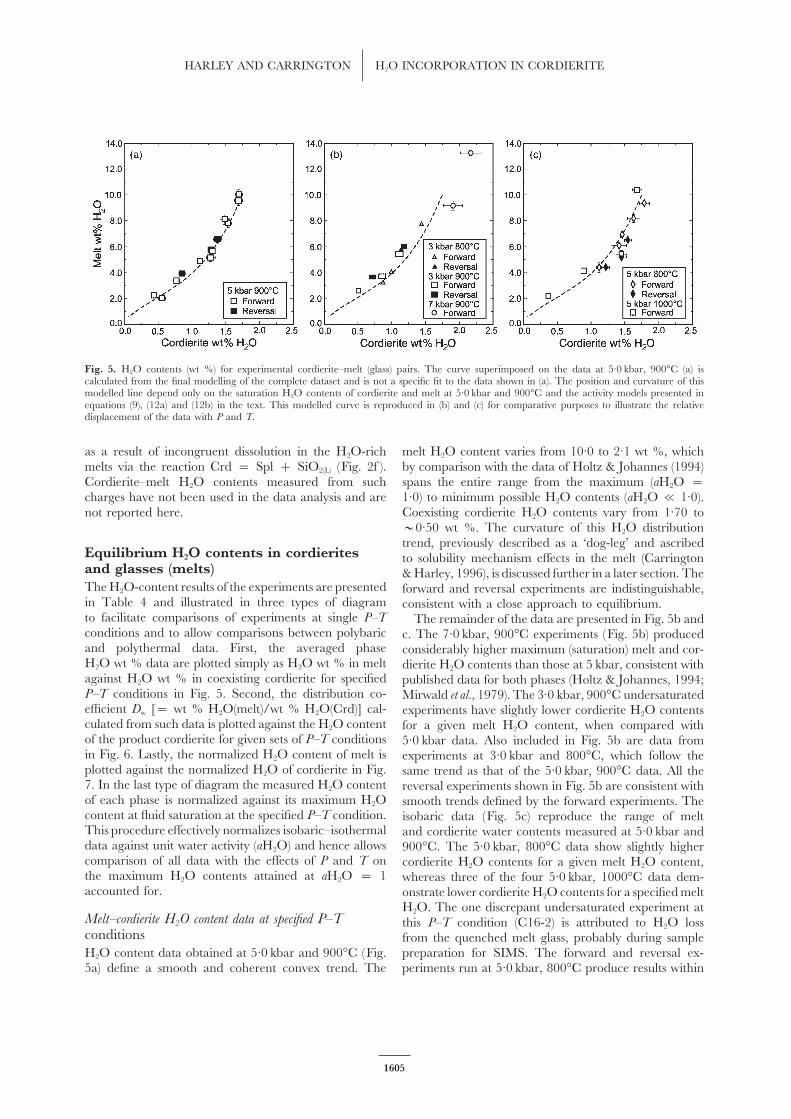
Fig. 5. H2O contents (wt %) for experimental cordierite–melt (glass) pairs. The curve superimposed on the data at 5·0 kbar, 900°C (a) iscalculated from the final modelling of the complete dataset and is not a specific fit to the data shown in (a). The position and curvature of thismodelled line depend only on the saturation H2O contents of cordierite and melt at 5·0 kbar and 900°C and the activity models presented inequations (9), (12a) and (12b) in the text. This modelled curve is reproduced in (b) and (c) for comparative purposes to illustrate the relativedisplacement of the data with P and T.
as a result of incongruent dissolution in the H2O-rich melt H2O content varies from 10·0 to 2·1 wt %, whichby comparison with the data of Holtz & Johannes (1994)melts via the reaction Crd = Spl + SiO2(L) (Fig. 2f ).
Cordierite–melt H2O contents measured from such spans the entire range from the maximum (aH2O =1·0) to minimum possible H2O contents (aH2O p 1·0).charges have not been used in the data analysis and are
not reported here. Coexisting cordierite H2O contents vary from 1·70 to>0·50 wt %. The curvature of this H2O distributiontrend, previously described as a ‘dog-leg’ and ascribed
Equilibrium H2O contents in cordierites to solubility mechanism effects in the melt (Carringtonand glasses (melts) & Harley, 1996), is discussed further in a later section. TheThe H2O-content results of the experiments are presented forward and reversal experiments are indistinguishable,in Table 4 and illustrated in three types of diagram consistent with a close approach to equilibrium.to facilitate comparisons of experiments at single P–T The remainder of the data are presented in Fig. 5b andconditions and to allow comparisons between polybaric c. The 7·0 kbar, 900°C experiments (Fig. 5b) producedand polythermal data. First, the averaged phase considerably higher maximum (saturation) melt and cor-H2O wt % data are plotted simply as H2O wt % in melt dierite H2O contents than those at 5 kbar, consistent withagainst H2O wt % in coexisting cordierite for specified published data for both phases (Holtz & Johannes, 1994;P–T conditions in Fig. 5. Second, the distribution co- Mirwald et al., 1979). The 3·0 kbar, 900°C undersaturatedefficient Dw [= wt % H2O(melt)/wt % H2O(Crd)] cal- experiments have slightly lower cordierite H2O contentsculated from such data is plotted against the H2O content for a given melt H2O content, when compared withof the product cordierite for given sets of P–T conditions 5·0 kbar data. Also included in Fig. 5b are data fromin Fig. 6. Lastly, the normalized H2O content of melt is experiments at 3·0 kbar and 800°C, which follow theplotted against the normalized H2O of cordierite in Fig. same trend as that of the 5·0 kbar, 900°C data. All the7. In the last type of diagram the measured H2O content reversal experiments shown in Fig. 5b are consistent withof each phase is normalized against its maximum H2O smooth trends defined by the forward experiments. Thecontent at fluid saturation at the specified P–T condition. isobaric data (Fig. 5c) reproduce the range of meltThis procedure effectively normalizes isobaric–isothermal and cordierite water contents measured at 5·0 kbar anddata against unit water activity (aH2O) and hence allows 900°C. The 5·0 kbar, 800°C data show slightly highercomparison of all data with the effects of P and T on cordierite H2O contents for a given melt H2O content,the maximum H2O contents attained at aH2O = 1 whereas three of the four 5·0 kbar, 1000°C data dem-accounted for. onstrate lower cordierite H2O contents for a specified melt
H2O. The one discrepant undersaturated experiment atMelt–cordierite H2O content data at specified P–T this P–T condition (C16-2) is attributed to H2O lossconditions from the quenched melt glass, probably during sample
preparation for SIMS. The forward and reversal ex-H2O content data obtained at 5·0 kbar and 900°C (Fig.5a) define a smooth and coherent convex trend. The periments run at 5·0 kbar, 800°C produce results within
1605

JOURNAL OF PETROLOGY VOLUME 42 NUMBER 9 SEPTEMBER 2001
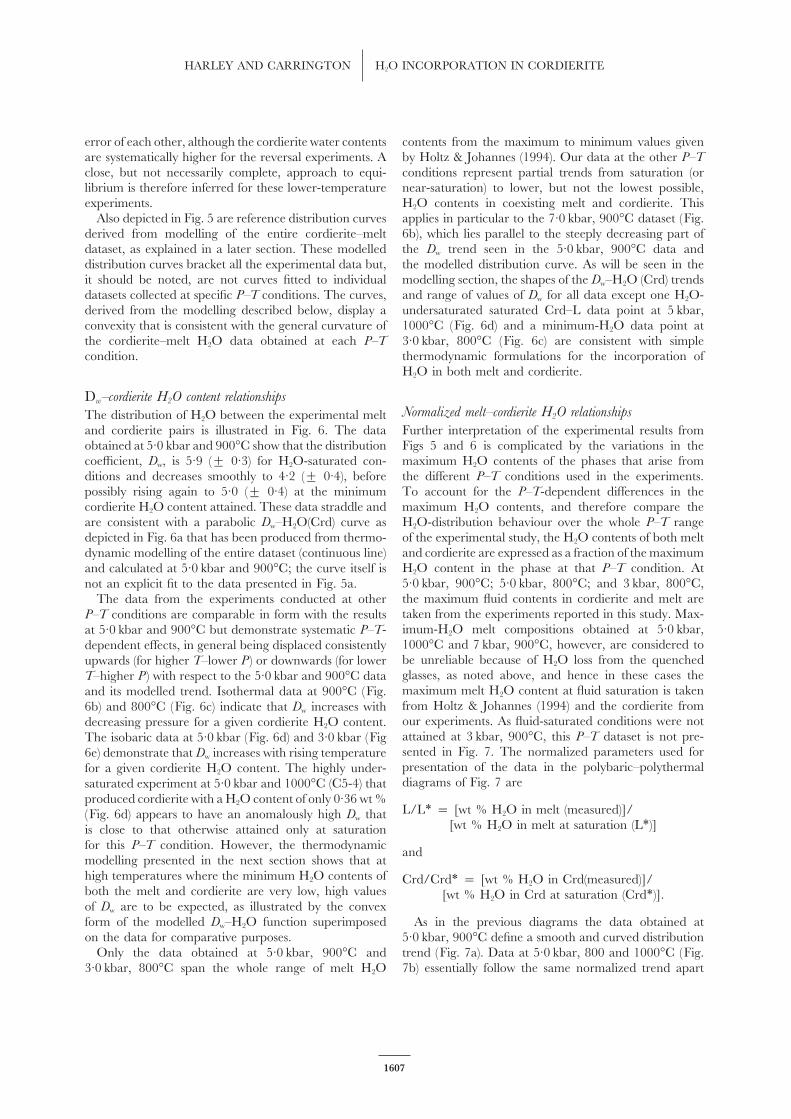
Fig. 6. Variation of the distribution coefficient Dw [= H2O wt %(melt)/H2O wt %(Crd)] with H2O contents of cordierite at specified P–Tconditions. (a) Data for 5·0 kbar, 900°C. The expected model Dw trend derived from the saturation H2O contents of cordierite and melt at thisP–T condition (see Fig. 8), reproduced in (b)–(d) for comparisons, is depicted as a dashed curve. At most other P–T conditions the experimentaldata do not extend to the minimum possible cordierite and melt H2O contents (from Holtz & Johannes, 1994) attainable. (b) and (c) presentisothermal data at 900 and 800°C, respectively; (d) depicts isobaric data at 5 kbar.
Fig. 7. Normalized diagrams for experimental cordierite–glass (melt) pairs. L/L∗ is the measured H2O content of an experimental melt as aproportion of the maximum H2O content for the melt at the P–T of the experiment. At saturation L/L∗ = 1·0. Crd/Crd∗ is the same ratioexpressed for cordierite. The dashed curve in (a)–(c) is the predicted normalized H2O distribution, calculated from the saturation H2O contentsof cordierite and melt at 5·0 kbar and 900°C and the activity models presented in equations (9), (12a) and (12b).
1606
HARLEY AND CARRINGTON H2O INCORPORATION IN CORDIERITE
error of each other, although the cordierite water contents contents from the maximum to minimum values givenby Holtz & Johannes (1994). Our data at the other P–Tare systematically higher for the reversal experiments. A
close, but not necessarily complete, approach to equi- conditions represent partial trends from saturation (ornear-saturation) to lower, but not the lowest possible,librium is therefore inferred for these lower-temperature
experiments. H2O contents in coexisting melt and cordierite. Thisapplies in particular to the 7·0 kbar, 900°C dataset (Fig.Also depicted in Fig. 5 are reference distribution curves
derived from modelling of the entire cordierite–melt 6b), which lies parallel to the steeply decreasing part ofthe Dw trend seen in the 5·0 kbar, 900°C data anddataset, as explained in a later section. These modelled
distribution curves bracket all the experimental data but, the modelled distribution curve. As will be seen in themodelling section, the shapes of the Dw–H2O (Crd) trendsit should be noted, are not curves fitted to individual
datasets collected at specific P–T conditions. The curves, and range of values of Dw for all data except one H2O-undersaturated saturated Crd–L data point at 5 kbar,derived from the modelling described below, display a
convexity that is consistent with the general curvature of 1000°C (Fig. 6d) and a minimum-H2O data point at3·0 kbar, 800°C (Fig. 6c) are consistent with simplethe cordierite–melt H2O data obtained at each P–T
condition. thermodynamic formulations for the incorporation ofH2O in both melt and cordierite.
Dw–cordierite H2O content relationshipsNormalized melt–cordierite H2O relationshipsThe distribution of H2O between the experimental melt
and cordierite pairs is illustrated in Fig. 6. The data Further interpretation of the experimental results fromFigs 5 and 6 is complicated by the variations in theobtained at 5·0 kbar and 900°C show that the distribution
coefficient, Dw, is 5·9 (± 0·3) for H2O-saturated con- maximum H2O contents of the phases that arise fromthe different P–T conditions used in the experiments.ditions and decreases smoothly to 4·2 (± 0·4), before
possibly rising again to 5·0 (± 0·4) at the minimum To account for the P–T-dependent differences in themaximum H2O contents, and therefore compare thecordierite H2O content attained. These data straddle and
are consistent with a parabolic Dw–H2O(Crd) curve as H2O-distribution behaviour over the whole P–T rangeof the experimental study, the H2O contents of both meltdepicted in Fig. 6a that has been produced from thermo-and cordierite are expressed as a fraction of the maximumdynamic modelling of the entire dataset (continuous line)H2O content in the phase at that P–T condition. Atand calculated at 5·0 kbar and 900°C; the curve itself is5·0 kbar, 900°C; 5·0 kbar, 800°C; and 3 kbar, 800°C,not an explicit fit to the data presented in Fig. 5a.the maximum fluid contents in cordierite and melt areThe data from the experiments conducted at othertaken from the experiments reported in this study. Max-P–T conditions are comparable in form with the resultsimum-H2O melt compositions obtained at 5·0 kbar,at 5·0 kbar and 900°C but demonstrate systematic P–T-1000°C and 7 kbar, 900°C, however, are considered todependent effects, in general being displaced consistentlybe unreliable because of H2O loss from the quenchedupwards (for higher T–lower P ) or downwards (for lowerglasses, as noted above, and hence in these cases theT–higher P ) with respect to the 5·0 kbar and 900°C datamaximum melt H2O content at fluid saturation is takenand its modelled trend. Isothermal data at 900°C (Fig.from Holtz & Johannes (1994) and the cordierite from6b) and 800°C (Fig. 6c) indicate that Dw increases withour experiments. As fluid-saturated conditions were notdecreasing pressure for a given cordierite H2O content.attained at 3 kbar, 900°C, this P–T dataset is not pre-The isobaric data at 5·0 kbar (Fig. 6d) and 3·0 kbar (Figsented in Fig. 7. The normalized parameters used for6e) demonstrate that Dw increases with rising temperaturepresentation of the data in the polybaric–polythermalfor a given cordierite H2O content. The highly under-diagrams of Fig. 7 aresaturated experiment at 5·0 kbar and 1000°C (C5-4) that
produced cordierite with a H2O content of only 0·36 wt %L/L∗ = [wt % H2O in melt (measured)]/(Fig. 6d) appears to have an anomalously high Dw that
[wt % H2O in melt at saturation (L∗)]is close to that otherwise attained only at saturationfor this P–T condition. However, the thermodynamic andmodelling presented in the next section shows that athigh temperatures where the minimum H2O contents of Crd/Crd∗ = [wt % H2O in Crd(measured)]/both the melt and cordierite are very low, high values [wt % H2O in Crd at saturation (Crd∗)].of Dw are to be expected, as illustrated by the convexform of the modelled Dw–H2O function superimposed As in the previous diagrams the data obtained at
5·0 kbar, 900°C define a smooth and curved distributionon the data for comparative purposes.Only the data obtained at 5·0 kbar, 900°C and trend (Fig. 7a). Data at 5·0 kbar, 800 and 1000°C (Fig.
7b) essentially follow the same normalized trend apart3·0 kbar, 800°C span the whole range of melt H2O
1607

JOURNAL OF PETROLOGY VOLUME 42 NUMBER 9 SEPTEMBER 2001
The data obtained at 3·0 kbar, 900°C have not beennormalized as fluid saturation was not achieved in ex-periment C8-1. This is borne out by comparison of ourmaximum melt H2O contents with those of Holtz &Johannes (1994), which are in complete agreement (withinerror) at 5·0 kbar, 900°C; 5·0 kbar, 800°C; and 3·0 kbar,800°C. In contrast, the melt H2O content measured at3·0 kbar, 900°C is 5·94 wt % (C8-1) compared withHoltz & Johannes’ saturation value of >7·4 wt %.Moreover, the measured Dw for this experiment (5·08) isconsistent with our other undersaturated Crd–L dataobtained at 900°C (Fig. 6b) and 3 kbar (Fig. 6e).
Figure 7 demonstrates that within the range800–1000°C, 3·0–7·0 kbar the distribution of water be-tween cordierite and granitic melts conforms fairly closelyto a single normalized function. This function is rep-resented by the dashed reference curve calculated fromthe modelling described below and added to each diagramin Fig. 7. The principal determinant of the relativemagnitude of the distribution of water between melt andcordierite (Dw) is the system’s degree of undersaturation(aH2O) at the defined P–T condition.
In summary, the data presented in Fig. 5 consistentlydisplay the features observed and reported in detail forthe 5 kbar, 900°C dataset (Carrington & Harley, 1996).Figure 6 shows that the general form of the Dw–H2O(Crd)curve at all P–T conditions is one of increasing Dw
for cordierite H2O contents that are <0·75 wt % and>1·0 wt %. Dw values are in the range 5–6 near saturationbut are lower in undersaturated conditions, with minimain the range 3·5–4·8 for cordierite with 0·8–1·0 wt %H2O. Figure 7 demonstrates that the entire Crd–L datasetobtained under polybaric–polythermal conditions followsa consistent pattern that can be described by a singlenormalized H2O distribution curve. This is accountedfor by the thermodynamic formulations of the in-corporation of H2O into cordierite and melt, as elucidatedin the sections below.
Fig. 8. Water activity parameters for cordierite [n/(1 – n)] and meltf(Xw
Melt) plotted for data obtained at (a) 5·0 kbar, 900°C; (b) 5·0 kbar,800 and 1000°C; (c) 900°C, 3 and 7 kbar, plus 3·0 kbar, 800°C. f(Xw
Melt)is based on Burnham (1994) and is equivalent to Xw
2 (melt) at Xw Ζ THERMODYNAMIC MODELLING OF0·5, and to 0·25{exp[(6·52 – (2667/T )).Xw]} at Xw >0·5. The regressedline through the 5·0 kbar, 900°C data is reproduced in (b) and (c) THE H2O SYSTEM(dashed line) to facilitate comparisons. Other fitted lines at specific P–T
The cordierite–melt experimental data can be treatedconditions are as labelled.using appropriate thermodynamic models to define therelationships between water activity (aH2O), Dw and theH2O contents of cordierite and melt. The thermodynamicmodels used are described first and then applied to the
from the discrepant experiment C16-2, and hence in- data to model the relationship between Dw and the H2Odicate that temperature does not affect the shape and content of cordierite or melt illustrated in Fig. 5. Theposition of the normalized distribution curve. Similarly, present results are then integrated with previous ex-isothermal data obtained at 800°C, 3·0 and 5·0 kbar perimental data at lower T to develop a revised saturationshow no effect of pressure on the shape of the normalized isohydron set for cordierite in equilibrium with pure H2O
in the P–T range 2–9 kbar and 500–1000°C.distribution curve.
1608

HARLEY AND CARRINGTON H2O INCORPORATION IN CORDIERITE
�Hr− T�Sr− RT ln f H2O=Cordierite–hydrous cordieriteRT ln(aH2O)− RT ln[n/(1− n)]. (6)The energetics of hydration of cordierite have been
considered by several workers (e.g. Newton & Wood, Before any polybaric–polythermal analysis, it is useful1979; Lonker, 1981; Martignole & Sisi, 1981; Kurepin, to note that at fixed P and T (and therefore also fixed1984; Bhattyacharya & Sen, 1985). Largely influenced f H2O at saturation with pure H2O) the left-hand side ofby the hydration experiments of Mirwald et al. (1979), equation (6) is a constant. Rearranging,some early models suggested incorporation of up to
[�Hr− T�Sr]− RT ln(aH2O)=1·2 moles of H2O per formula unit (p.f.u.) of cordierite,− RT ln{[n/(1− n)]/ f H2O}. (7)achieved under higher-P, lower-T conditions. However,
more recent models (e.g. Mukhopadhyay & Holdaway, Dividing by RT and taking exponents we obtain1994; Carey, 1995; Skippen & Gunter, 1996) have gen-
aH2O= {exp[(�Hr/RT )− (�Sr/R)]}.erally agreed on a one-site, 1 mole mixing model for[n/(1− n)]/ f H2O. (8)H2O incorporation, consistent with both calorimetric
measurements (Carey & Navrotsky, 1992) and ab initio Hence, for isobaric–isothermal data aH2O is proportionalenergy calculations (Winkler et al., 1994). Hence, the to n/(1– n) in cordierite (e.g. Carey, 1995; Skippen &analysis of the thermodynamics of hydrous cordierite Gunter, 1996). The proportionality constant at a givenpresented here follows the approach adopted by recent P–T condition is denoted hereafter as zw, where w is forworkers (Carey, 1995; Skippen & Gunter, 1996), such ‘water’. As is apparent from the derivation above, zwthat the following relation governs H2O incorporation includes enthalpy and entropy terms that are obtainableinto cordierite: from regression of our data and those of Mirwald et al.
(1979), Boberski & Schreyer (1990), Carey (1995), Skip-Crd(anhydrous)+ H2O= Crd(hydrous). (1)pen & Gunter (1996) and others. Finally,
Hereafter, anhydrous cordierite will be denoted by A-aH2O= zw.[n/(1− n)] (9)Crd and hydrous by H-Crd.
The reaction above then has the following equilibrium withexpression:
zw= {exp[(�Hr/RT )− (�Sr/R)]}/ f H2O. (10)Keq= (aH-Crd)/(aA-Crd.aH2O) (2) At a given P–T condition and unit water activity (aH2O=
1) it follows that zw is equivalent toand with the 1 molar model, assuming ideality, aH-Crd =n, where n is the number of moles of H2O per formula (1− nsat)/nsat (11)unit of cordierite, and aA-Crd = 1 – n.
where nsat is the saturation moles of water in cordieriteHenceat that specified P–T condition.
Keq= [n/(1− n)]Crd.(1/aH2O) (3) We will first examine how well the isobaric–isothermalexperimental data for cordierite can be fitted to theand formulation described by (9) and (10), the first instancein which this has been possible by direct measurement.− RT ln[n/(1− n)]+ RT ln(aH2O)=The variation of zw with pressure and temperature is�Hr− T�Sr+ P�Vr. (4)then evaluated to derive a refined expression for the
The volume change of reaction can be partitioned into saturation value of n (nsat) over P–T space and a generalthe solids volume change, �Vs, and the volume of the relation for n as a function of aH2O at varied P–Tvapour phase at the P and T of interest: conditions.
P�Vr= P�Vs− � VH2OdP. (5)
Incorporation of H2O into granitic orThe volume change reduces to that of the volatile phaseperaluminous meltsif �Vs = 0, a situation considered and modelled by
Carey (1995) and Skippen & Gunter (1996). In this paper H2O can be incorporated into melts through the breakingof Si–O linkages producing –(OH) and (H)O– pairs andwe will re-examine whether �Vs = 0 in the light of the
full dataset compiled from our own and previous data, as molecular water [see review by Holloway & Blank(1994)]. The latter solubility mechanism, which becomesbut for analysis of isobaric data this term will be implicit
in the retrieved �Hr and so will not be considered in the important at high H2O contents (e.g. >5 wt % H2O;McMillan, 1994), may be responsible for H2O in-initial modelling. Noting that the integral term in equation
(5) is related to the fugacity of H2O at the P–T of interest, creasingly preferring the melt over cordierite as a res-idence site, as seen in the Dw data of Fig. 6.f H2O, equating with RT ln f H2O, hence
1609
JOURNAL OF PETROLOGY VOLUME 42 NUMBER 9 SEPTEMBER 2001
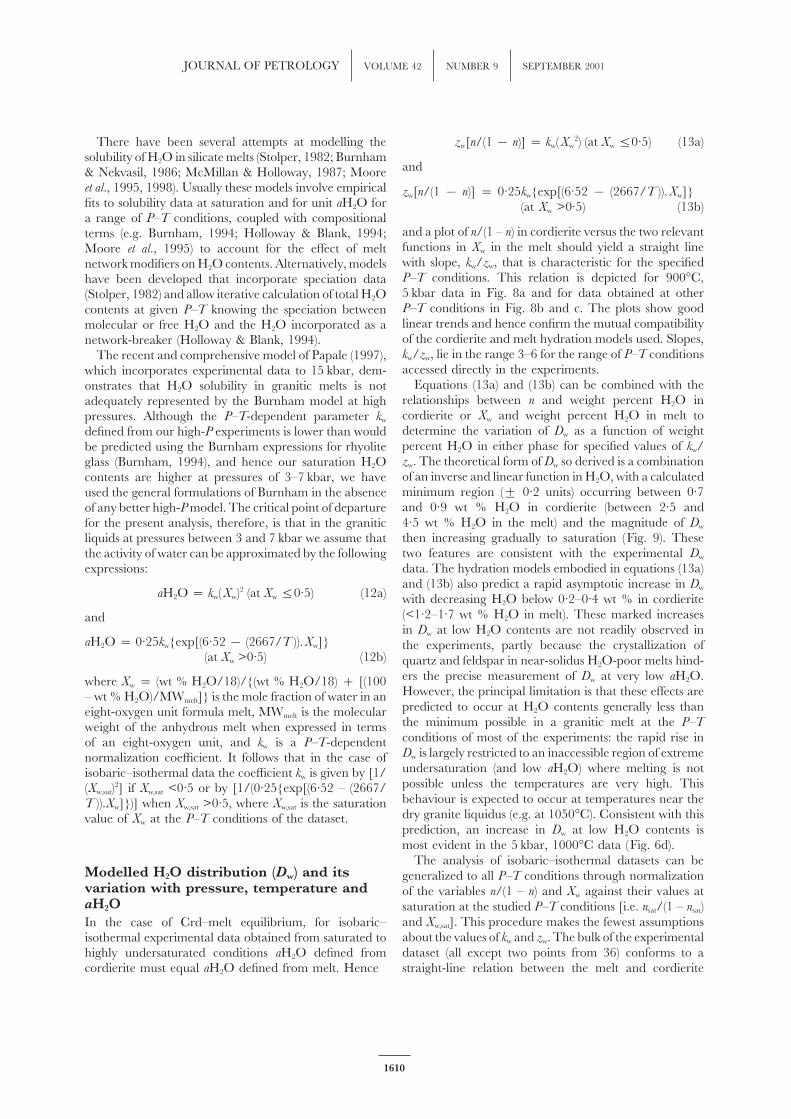
There have been several attempts at modelling the zw[n/(1− n)]= kw(Xw2) (at XwΖ0·5) (13a)
solubility of H2O in silicate melts (Stolper, 1982; Burnhamand& Nekvasil, 1986; McMillan & Holloway, 1987; Moore
et al., 1995, 1998). Usually these models involve empirical zw[n/(1 − n)] = 0·25kw{exp[(6·52 − (2667/T )).Xw]}fits to solubility data at saturation and for unit aH2O for (at Xw >0·5) (13b)a range of P–T conditions, coupled with compositional
and a plot of n/(1 – n) in cordierite versus the two relevantterms (e.g. Burnham, 1994; Holloway & Blank, 1994;functions in Xw in the melt should yield a straight lineMoore et al., 1995) to account for the effect of meltwith slope, kw/zw, that is characteristic for the specifiednetwork modifiers on H2O contents. Alternatively, modelsP–T conditions. This relation is depicted for 900°C,have been developed that incorporate speciation data5 kbar data in Fig. 8a and for data obtained at other(Stolper, 1982) and allow iterative calculation of total H2OP–T conditions in Fig. 8b and c. The plots show goodcontents at given P–T knowing the speciation betweenlinear trends and hence confirm the mutual compatibilitymolecular or free H2O and the H2O incorporated as aof the cordierite and melt hydration models used. Slopes,network-breaker (Holloway & Blank, 1994).kw/zw, lie in the range 3–6 for the range of P–T conditionsThe recent and comprehensive model of Papale (1997),accessed directly in the experiments.which incorporates experimental data to 15 kbar, dem-
Equations (13a) and (13b) can be combined with theonstrates that H2O solubility in granitic melts is notrelationships between n and weight percent H2O inadequately represented by the Burnham model at highcordierite or Xw and weight percent H2O in melt topressures. Although the P–T-dependent parameter kw
determine the variation of Dw as a function of weightdefined from our high-P experiments is lower than wouldpercent H2O in either phase for specified values of kw/be predicted using the Burnham expressions for rhyolitezw. The theoretical form of Dw so derived is a combinationglass (Burnham, 1994), and hence our saturation H2Oof an inverse and linear function in H2O, with a calculatedcontents are higher at pressures of 3–7 kbar, we haveminimum region (± 0·2 units) occurring between 0·7used the general formulations of Burnham in the absenceand 0·9 wt % H2O in cordierite (between 2·5 andof any better high-P model. The critical point of departure4·5 wt % H2O in the melt) and the magnitude of Dwfor the present analysis, therefore, is that in the graniticthen increasing gradually to saturation (Fig. 9). Theseliquids at pressures between 3 and 7 kbar we assume thattwo features are consistent with the experimental Dwthe activity of water can be approximated by the followingdata. The hydration models embodied in equations (13a)expressions:and (13b) also predict a rapid asymptotic increase in Dw
aH2O= kw(Xw)2 (at XwΖ0·5) (12a) with decreasing H2O below 0·2–0·4 wt % in cordierite(<1·2–1·7 wt % H2O in melt). These marked increasesandin Dw at low H2O contents are not readily observed in
aH2O= 0·25kw{exp[(6·52− (2667/T )).Xw]} the experiments, partly because the crystallization of(at Xw >0·5) (12b) quartz and feldspar in near-solidus H2O-poor melts hind-
ers the precise measurement of Dw at very low aH2O.where Xw = (wt % H2O/18)/{(wt % H2O/18)+ [(100However, the principal limitation is that these effects are– wt % H2O)/MWmelt]} is the mole fraction of water in anpredicted to occur at H2O contents generally less thaneight-oxygen unit formula melt, MWmelt is the molecularthe minimum possible in a granitic melt at the P–Tweight of the anhydrous melt when expressed in termsconditions of most of the experiments: the rapid rise inof an eight-oxygen unit, and kw is a P–T-dependentDw is largely restricted to an inaccessible region of extremenormalization coefficient. It follows that in the case ofundersaturation (and low aH2O) where melting is notisobaric–isothermal data the coefficient kw is given by [1/possible unless the temperatures are very high. This(Xw,sat)2] if Xw,sat <0·5 or by [1/(0·25{exp[(6·52 – (2667/behaviour is expected to occur at temperatures near theT )).Xw]})] when Xw,sat >0·5, where Xw,sat is the saturationdry granite liquidus (e.g. at 1050°C). Consistent with thisvalue of Xw at the P–T conditions of the dataset.prediction, an increase in Dw at low H2O contents ismost evident in the 5 kbar, 1000°C data (Fig. 6d).
The analysis of isobaric–isothermal datasets can beModelled H2O distribution (Dw) and its generalized to all P–T conditions through normalizationvariation with pressure, temperature and of the variables n/(1 – n) and Xw against their values ataH2O saturation at the studied P–T conditions [i.e. nsat/(1 – nsat)
and Xw,sat]. This procedure makes the fewest assumptionsIn the case of Crd–melt equilibrium, for isobaric–about the values of kw and zw. The bulk of the experimentalisothermal experimental data obtained from saturated todataset (all except two points from 36) conforms to ahighly undersaturated conditions aH2O defined from
cordierite must equal aH2O defined from melt. Hence straight-line relation between the melt and cordierite
1610

HARLEY AND CARRINGTON H2O INCORPORATION IN CORDIERITE
CORDIERITE H2O SATURATION ANDISOHYDRONS TO 1000°CThe experiments reported here provide six new, directlymeasured, data points on the saturation H2O contentsof cordierite at 800–1000°C. Furthermore, these aresupported by and consistent with several other data pointsobtained at the same P–T conditions. For example, thesaturation H2O content of cordierite at 5 kbar and 900°C(1·69 ± 0·05 wt % for XMg = 0·67) is based on twosaturation experiments but is also constrained to bein this range by the linear fit to all the other, H2O-undersaturated, data obtained at this P–T condition.
The new saturation data also access a higher T fieldthan hitherto available for modelling the incorporationof H2O into cordierite, resulting in a significantly wider1/T interval for fitting experimental hydration data.Accordingly, we have taken the hydration data from
Fig. 9. Modelled variation of Dw with weight percent H2O in cordierite previous studies of Mg, Fe and Mg–Fe cordieritecoexisting with melt, contoured for values of the slope parameter kw/ (Schreyer & Yoder, 1964; Mirwald et al., 1979; Boberskizw (see text for definition) that span the P–T conditions of the ex-
& Schreyer, 1990; Mukhopadhyay & Holdaway, 1994;periments. The asymmetry in the Dw curves should be noted, withminima in Dw (3·0–4·5 for kw/zw = 3–6) occurring at intermediate Carey, 1995; Skippen & Gunter, 1996), added our ownH2O contents. The pronounced increases in Dw predicted at very low higher-T data, and fitted the entire dataset via a ln KeqH2O contents are not observed in general because the melt is metastable vs 1/T plot, where ln Keq is evaluated fromwith respect to solid phases (i.e. it would be below its minimum H2Ocontent for the P–T condition), but this trend is observed in the
Keq= [nsat/(1− nsat)]/ f H2O(P,T). (14)experiments conducted at 5 kbar, 1000°C (Fig. 6).
The ln Keq vs 1/T plot for all cordierite hydrationaH2O indicators and supports their applicability to the data is presented in Fig. 10. This does not discriminatemodelling of Dw relationships over a wide P–T range. subjectively between data or classify data on the basis ofBecause the modelled Dw curves form a family with the measurement technique or run pressure. Although thereposition of any one curve characterized simply by kw/zw, is significant scatter in ln Keq at temperatures of 800 andthey depend only on the relation between nsat/(1 – nsat) 600°C, this is not consistently related to pressure or otherin cordierite and the functions in Xw,sat for the melt at a intrinsic variables, and linear regression of all the dataspecified P–T condition and so can be derived from yieldssaturation isopleths (isohydrons) for melt and cordierite.
ln Keq = [4385 (± 500)/T ] − 11·92 (± 0·55)On the basis of existing saturation H2O isopleths for( r 2 = 0·56) (15)melts (Holtz & Johannes, 1994; Johannes & Holtz, 1996)
and those modelled here for cordierite (see below), kw/where T is in Kelvin (K).
zw varies between 3·0 and 7·0 across the P–T rangeOur preferred fit to the data, however, utilizes 98 points3–7 kbar and 700–1000°C, decreasing with rising T at
from the 155 available at 40 distinct P–T conditions. Theconstant P, and increasing with increasing P at fixed T.data excluded from this fit are outliers obtained at P–TFor kw/zw values between 3·0 and 7·0, modelled Dw liesconditions where two or more other results are mutuallyin the range 2·5–4·5 for those highly undersaturatedcompatible and cases in which the relative errors on H2Oconditions where cordierite is in equilibrium with a meltmeasurement are large (>20% relative). This fit, whichthat has the minimum possible H2O content for theincludes all our data along with all those of Boberski &specified P–T (Fig. 9). Maximum Dw values, which gen-Schreyer (1990), Mukhopadhyay & Holdaway (1994) anderally occur at H2O saturation, are in the range 4·5–6·5Carey (1995), is as follows:for this degree of variation in kw/zw (Fig. 9). The Dw
curves generated from the modelling can be used to ln Keq = [4203 (± 320)/T ] − 11·75 (± 0·33)estimate the H2O contents of melts coexisting with cor- (r 2 = 0·87) (16)dierites of known composition. For example, cordierites
where T is in Kelvin (K). This fit yields an averagecontaining 1 wt % H2O could have equilibrated withenthalpy change of reaction of �Hr = −34·95 kJ/molmelts containing 2·5–5 wt % H2O, depending on P andand entropy change �Sr = −97·69 J/mol/K for the TT, with the higher H2O content being in melts formed
at high T and low P (i.e. low kw/zw). range 500–1000°C.
1611
JOURNAL OF PETROLOGY VOLUME 42 NUMBER 9 SEPTEMBER 2001
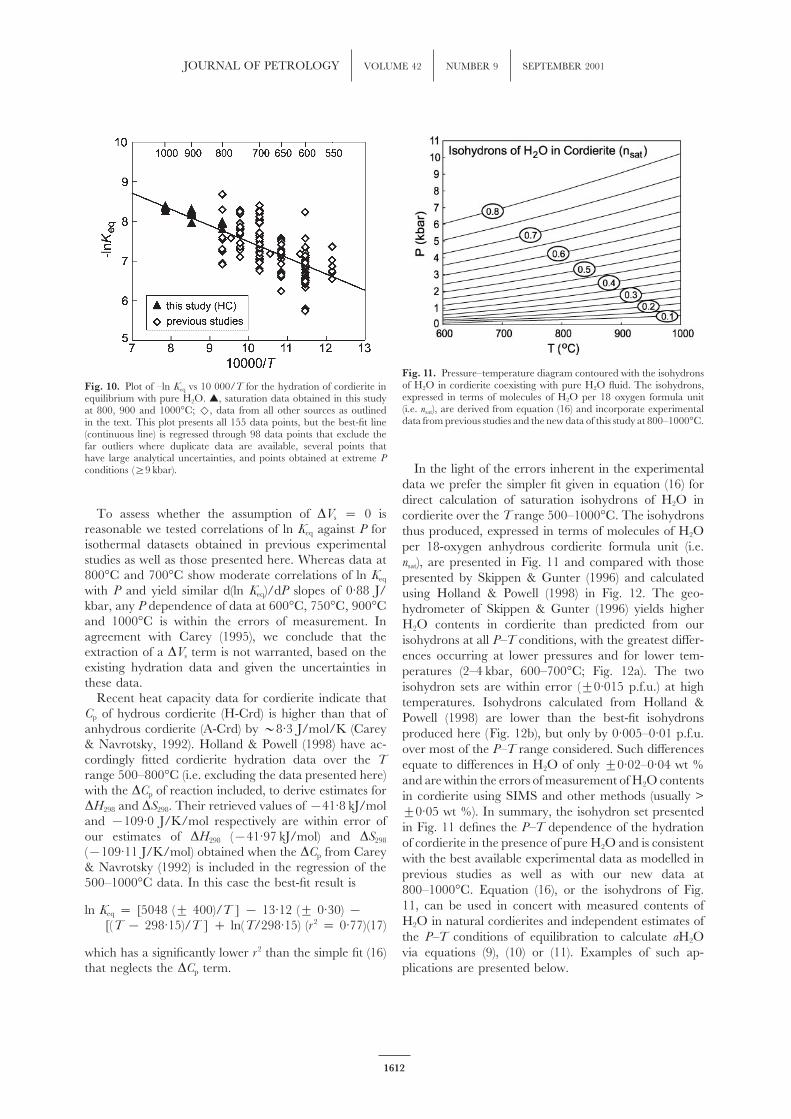
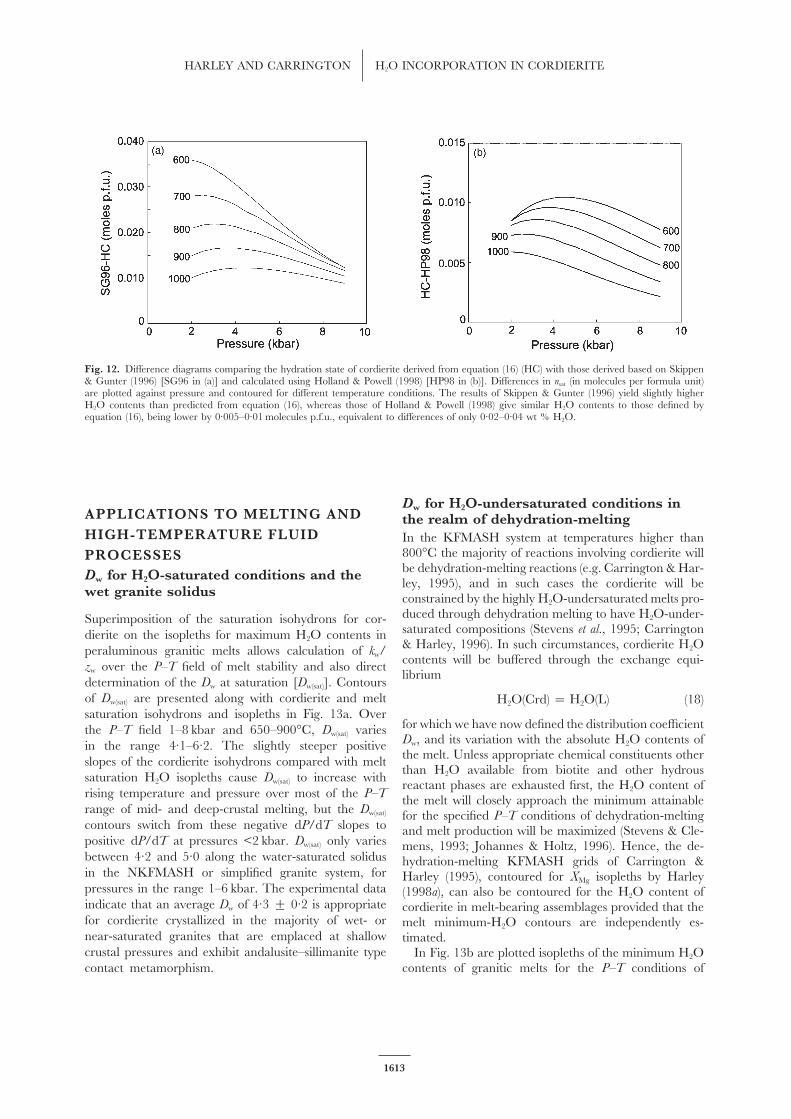
Fig. 11. Pressure–temperature diagram contoured with the isohydronsof H2O in cordierite coexisting with pure H2O fluid. The isohydrons,Fig. 10. Plot of –ln Keq vs 10 000/T for the hydration of cordierite inexpressed in terms of molecules of H2O per 18 oxygen formula unitequilibrium with pure H2O. Μ, saturation data obtained in this study(i.e. nsat), are derived from equation (16) and incorporate experimentalat 800, 900 and 1000°C; Η, data from all other sources as outlineddata from previous studies and the new data of this study at 800–1000°C.in the text. This plot presents all 155 data points, but the best-fit line
(continuous line) is regressed through 98 data points that exclude thefar outliers where duplicate data are available, several points thathave large analytical uncertainties, and points obtained at extreme P
In the light of the errors inherent in the experimentalconditions ([9 kbar).data we prefer the simpler fit given in equation (16) fordirect calculation of saturation isohydrons of H2O in
To assess whether the assumption of �Vs = 0 is cordierite over the T range 500–1000°C. The isohydronsreasonable we tested correlations of ln Keq against P for thus produced, expressed in terms of molecules of H2Oisothermal datasets obtained in previous experimental per 18-oxygen anhydrous cordierite formula unit (i.e.studies as well as those presented here. Whereas data at nsat), are presented in Fig. 11 and compared with those800°C and 700°C show moderate correlations of ln Keq presented by Skippen & Gunter (1996) and calculatedwith P and yield similar d(ln Keq)/dP slopes of 0·88 J/ using Holland & Powell (1998) in Fig. 12. The geo-kbar, any P dependence of data at 600°C, 750°C, 900°C hydrometer of Skippen & Gunter (1996) yields higherand 1000°C is within the errors of measurement. In H2O contents in cordierite than predicted from ouragreement with Carey (1995), we conclude that the isohydrons at all P–T conditions, with the greatest differ-extraction of a �Vs term is not warranted, based on the ences occurring at lower pressures and for lower tem-existing hydration data and given the uncertainties in peratures (2–4 kbar, 600–700°C; Fig. 12a). The twothese data. isohydron sets are within error (±0·015 p.f.u.) at high
Recent heat capacity data for cordierite indicate that temperatures. Isohydrons calculated from Holland &Cp of hydrous cordierite (H-Crd) is higher than that of Powell (1998) are lower than the best-fit isohydronsanhydrous cordierite (A-Crd) by >8·3 J/mol/K (Carey produced here (Fig. 12b), but only by 0·005–0·01 p.f.u.& Navrotsky, 1992). Holland & Powell (1998) have ac- over most of the P–T range considered. Such differencescordingly fitted cordierite hydration data over the T equate to differences in H2O of only ±0·02–0·04 wt %range 500–800°C (i.e. excluding the data presented here) and are within the errors of measurement of H2O contentswith the �Cp of reaction included, to derive estimates for in cordierite using SIMS and other methods (usually >�H298 and �S298. Their retrieved values of−41·8 kJ/mol ±0·05 wt %). In summary, the isohydron set presentedand −109·0 J/K/mol respectively are within error of in Fig. 11 defines the P–T dependence of the hydrationour estimates of �H298 (−41·97 kJ/mol) and �S298 of cordierite in the presence of pure H2O and is consistent(−109·11 J/K/mol) obtained when the �Cp from Carey with the best available experimental data as modelled in& Navrotsky (1992) is included in the regression of the previous studies as well as with our new data at500–1000°C data. In this case the best-fit result is 800–1000°C. Equation (16), or the isohydrons of Fig.
11, can be used in concert with measured contents ofln Keq = [5048 (± 400)/T ] − 13·12 (± 0·30) −H2O in natural cordierites and independent estimates of[(T − 298·15)/T ] + ln(T/298·15) (r 2 = 0·77)(17)the P–T conditions of equilibration to calculate aH2Ovia equations (9), (10) or (11). Examples of such ap-which has a significantly lower r 2 than the simple fit (16)
that neglects the �Cp term. plications are presented below.
1612
HARLEY AND CARRINGTON H2O INCORPORATION IN CORDIERITE
Fig. 12. Difference diagrams comparing the hydration state of cordierite derived from equation (16) (HC) with those derived based on Skippen& Gunter (1996) [SG96 in (a)] and calculated using Holland & Powell (1998) [HP98 in (b)]. Differences in nsat (in molecules per formula unit)are plotted against pressure and contoured for different temperature conditions. The results of Skippen & Gunter (1996) yield slightly higherH2O contents than predicted from equation (16), whereas those of Holland & Powell (1998) give similar H2O contents to those defined byequation (16), being lower by 0·005–0·01 molecules p.f.u., equivalent to differences of only 0·02–0·04 wt % H2O.
Dw for H2O-undersaturated conditions inAPPLICATIONS TO MELTING AND the realm of dehydration-meltingHIGH-TEMPERATURE FLUID In the KFMASH system at temperatures higher than
800°C the majority of reactions involving cordierite willPROCESSESbe dehydration-melting reactions (e.g. Carrington & Har-Dw for H2O-saturated conditions and theley, 1995), and in such cases the cordierite will be
wet granite solidus constrained by the highly H2O-undersaturated melts pro-duced through dehydration melting to have H2O-under-Superimposition of the saturation isohydrons for cor-saturated compositions (Stevens et al., 1995; Carringtondierite on the isopleths for maximum H2O contents in& Harley, 1996). In such circumstances, cordierite H2Operaluminous granitic melts allows calculation of kw/contents will be buffered through the exchange equi-
zw over the P–T field of melt stability and also directlibriumdetermination of the Dw at saturation [Dw(sat)]. Contours
of Dw(sat) are presented along with cordierite and melt H2O(Crd)= H2O(L) (18)saturation isohydrons and isopleths in Fig. 13a. Over
for which we have now defined the distribution coefficientthe P–T field 1–8 kbar and 650–900°C, Dw(sat) variesDw, and its variation with the absolute H2O contents ofin the range 4·1–6·2. The slightly steeper positivethe melt. Unless appropriate chemical constituents otherslopes of the cordierite isohydrons compared with meltthan H2O available from biotite and other hydroussaturation H2O isopleths cause Dw(sat) to increase withreactant phases are exhausted first, the H2O content of
rising temperature and pressure over most of the P–T the melt will closely approach the minimum attainablerange of mid- and deep-crustal melting, but the Dw(sat) for the specified P–T conditions of dehydration-meltingcontours switch from these negative dP/dT slopes to and melt production will be maximized (Stevens & Cle-positive dP/dT at pressures <2 kbar. Dw(sat) only varies mens, 1993; Johannes & Holtz, 1996). Hence, the de-between 4·2 and 5·0 along the water-saturated solidus hydration-melting KFMASH grids of Carrington &in the NKFMASH or simplified granite system, for Harley (1995), contoured for XMg isopleths by Harleypressures in the range 1–6 kbar. The experimental data (1998a), can also be contoured for the H2O content ofindicate that an average Dw of 4·3 ± 0·2 is appropriate cordierite in melt-bearing assemblages provided that thefor cordierite crystallized in the majority of wet- or melt minimum-H2O contours are independently es-near-saturated granites that are emplaced at shallow timated.crustal pressures and exhibit andalusite–sillimanite type In Fig. 13b are plotted isopleths of the minimum H2O
contents of granitic melts for the P–T conditions ofcontact metamorphism.
1613

JOURNAL OF PETROLOGY VOLUME 42 NUMBER 9 SEPTEMBER 2001
Fig. 13. (a) Contoured P–T diagram depicting cordierite–melt H2O relationships at aH2O = 1. The weight percent contours are of melt H2Ocontents (dotted, after Holtz & Johannes, 1994) and cordierite H2O contents (dashed, this study) in equilibrium with free H2O; Dw(sat) contoursare continuous lines. Wet granite solidus represents the minimum temperature conditions under which cordierite and H2O-saturated melt cancoexist. (Note the change in slope of the Dw(sat) contours at >2 kbar and the near-constant value of 4·3 for Dw(sat) along the wet solidus curve.)(b) Contoured P–T diagram depicting cordierite–melt H2O relationships for conditions where the melt has its minimum possible H2O contentat P and T (i.e. variable aH2O). Contours of minimum melt H2O content (in wt %) are after Holtz & Johannes (1994) and this study. Contoursof cordierite H2O contents (wt %) are based on the Dw–aH2O relationships defined in this study. Other lines in this figure are the approximatepositions of KFMASH (heavy dash) and MASH (fine dash) reactions that limit cordierite+ garnet stability in KFMASH and cordierite stabilityin MASH, after Carrington & Harley (1995), with KFMASH invariant points labelled for aH2O (italics). (c) P–T diagram similar to (b) butcontoured for Dw(dm), where this parameter is the Dw relevant to dehydration melting equilibria. (Note that Dw(dm) always has a positive dP/dTand increases towards high-T, low-P conditions.) Dashed curve labelled BSQ GCL is the reaction Bt + Sill +Qz = Grt + Crd + Kfs + Las defined in the KFMASH system by the experiments of Carrington & Harley (1995), annotated with aH2O (decimals in rectangles); cordieriteH2O contents along and near this reaction are in the range 1·1–0·9 wt %. Other lines as in (b). (d) P–T diagram illustrating the stability fieldover which a cordierite of specified H2O content, in this case 1·75 wt % H2O (n = 0·60), can coexist with melt or melt + fluid (shaded field).Contours are of aH2O (decimals in ellipses). The stability field is bounded by the aH2O = 1 line (Crd + L + H2O equilibrium) at lower Pand by a line at higher P that reflects the minimum T at which melt can coexist with the cordierite. Other lines as in (b);Χ, KFMASH invariantpoints after Carrington & Harley (1995).
dehydration-melting in KFMASH. These melt (L) H2O KFMASH and are consistent with minimum H2O con-tent data reported by Carrington & Harley (1996) andisopleths are modified from Holtz & Johannes (1994) and
Johannes & Holtz (1996) for peraluminous melts in presented in this work. The diagram is also contoured
1614
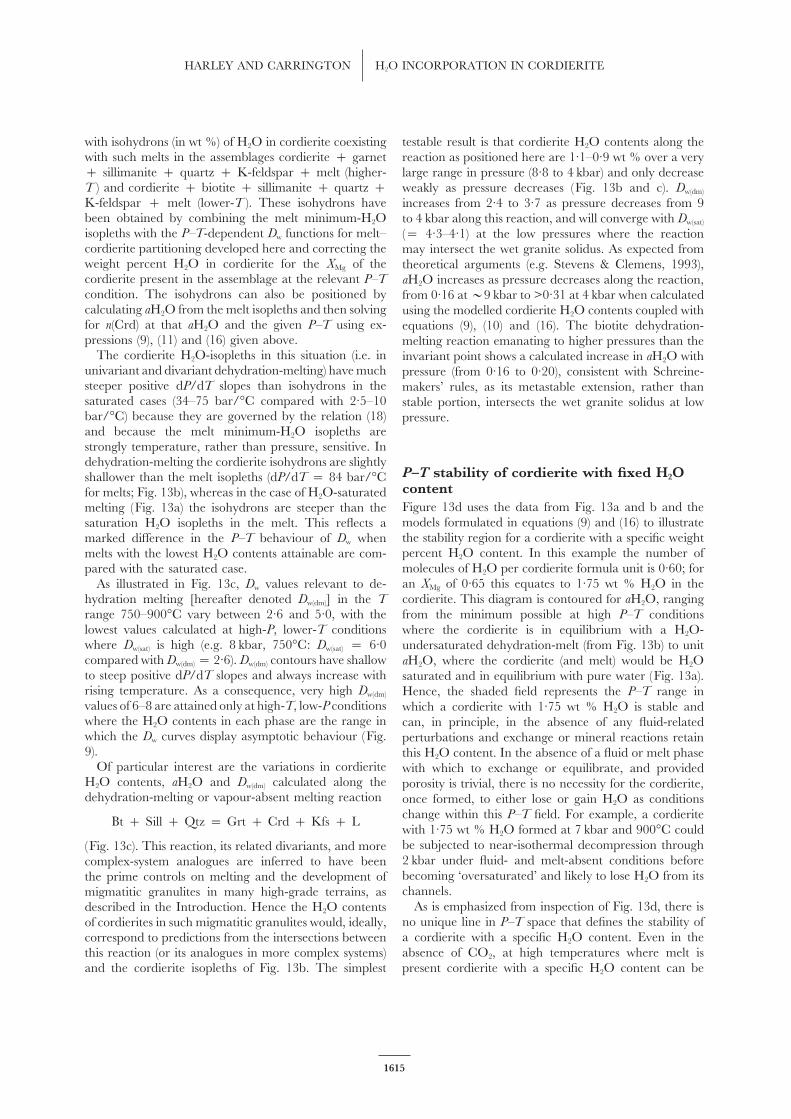
HARLEY AND CARRINGTON H2O INCORPORATION IN CORDIERITE
with isohydrons (in wt %) of H2O in cordierite coexisting testable result is that cordierite H2O contents along thewith such melts in the assemblages cordierite + garnet reaction as positioned here are 1·1–0·9 wt % over a very+ sillimanite + quartz + K-feldspar + melt (higher- large range in pressure (8·8 to 4 kbar) and only decreaseT ) and cordierite + biotite + sillimanite + quartz + weakly as pressure decreases (Fig. 13b and c). Dw(dm)
K-feldspar + melt (lower-T ). These isohydrons have increases from 2·4 to 3·7 as pressure decreases from 9been obtained by combining the melt minimum-H2O to 4 kbar along this reaction, and will converge with Dw(sat)
isopleths with the P–T-dependent Dw functions for melt– (= 4·3–4·1) at the low pressures where the reactioncordierite partitioning developed here and correcting the may intersect the wet granite solidus. As expected fromweight percent H2O in cordierite for the XMg of the theoretical arguments (e.g. Stevens & Clemens, 1993),cordierite present in the assemblage at the relevant P–T aH2O increases as pressure decreases along the reaction,condition. The isohydrons can also be positioned by from 0·16 at>9 kbar to >0·31 at 4 kbar when calculatedcalculating aH2O from the melt isopleths and then solving using the modelled cordierite H2O contents coupled withfor n(Crd) at that aH2O and the given P–T using ex- equations (9), (10) and (16). The biotite dehydration-pressions (9), (11) and (16) given above. melting reaction emanating to higher pressures than the
The cordierite H2O-isopleths in this situation (i.e. in invariant point shows a calculated increase in aH2O withunivariant and divariant dehydration-melting) have much pressure (from 0·16 to 0·20), consistent with Schreine-steeper positive dP/dT slopes than isohydrons in the makers’ rules, as its metastable extension, rather thansaturated cases (34–75 bar/°C compared with 2·5–10 stable portion, intersects the wet granite solidus at lowbar/°C) because they are governed by the relation (18) pressure.and because the melt minimum-H2O isopleths arestrongly temperature, rather than pressure, sensitive. Indehydration-melting the cordierite isohydrons are slightly
P–T stability of cordierite with fixed H2Oshallower than the melt isopleths (dP/dT = 84 bar/°Ccontentfor melts; Fig. 13b), whereas in the case of H2O-saturatedFigure 13d uses the data from Fig. 13a and b and themelting (Fig. 13a) the isohydrons are steeper than themodels formulated in equations (9) and (16) to illustratesaturation H2O isopleths in the melt. This reflects athe stability region for a cordierite with a specific weightmarked difference in the P–T behaviour of Dw whenpercent H2O content. In this example the number ofmelts with the lowest H2O contents attainable are com-molecules of H2O per cordierite formula unit is 0·60; forpared with the saturated case.an XMg of 0·65 this equates to 1·75 wt % H2O in theAs illustrated in Fig. 13c, Dw values relevant to de-cordierite. This diagram is contoured for aH2O, ranginghydration melting [hereafter denoted Dw(dm)] in the T
range 750–900°C vary between 2·6 and 5·0, with the from the minimum possible at high P–T conditionslowest values calculated at high-P, lower-T conditions where the cordierite is in equilibrium with a H2O-where Dw(sat) is high (e.g. 8 kbar, 750°C: Dw(sat) = 6·0 undersaturated dehydration-melt (from Fig. 13b) to unitcompared with Dw(dm)= 2·6). Dw(dm) contours have shallow aH2O, where the cordierite (and melt) would be H2Oto steep positive dP/dT slopes and always increase with saturated and in equilibrium with pure water (Fig. 13a).rising temperature. As a consequence, very high Dw(dm) Hence, the shaded field represents the P–T range invalues of 6–8 are attained only at high-T, low-P conditions which a cordierite with 1·75 wt % H2O is stable andwhere the H2O contents in each phase are the range in can, in principle, in the absence of any fluid-relatedwhich the Dw curves display asymptotic behaviour (Fig. perturbations and exchange or mineral reactions retain9). this H2O content. In the absence of a fluid or melt phase
Of particular interest are the variations in cordierite with which to exchange or equilibrate, and providedH2O contents, aH2O and Dw(dm) calculated along the porosity is trivial, there is no necessity for the cordierite,dehydration-melting or vapour-absent melting reaction once formed, to either lose or gain H2O as conditions
change within this P–T field. For example, a cordieriteBt + Sill + Qtz = Grt + Crd + Kfs + Lwith 1·75 wt % H2O formed at 7 kbar and 900°C couldbe subjected to near-isothermal decompression through(Fig. 13c). This reaction, its related divariants, and more2 kbar under fluid- and melt-absent conditions beforecomplex-system analogues are inferred to have beenbecoming ‘oversaturated’ and likely to lose H2O from itsthe prime controls on melting and the development ofchannels.migmatitic granulites in many high-grade terrains, as
As is emphasized from inspection of Fig. 13d, there isdescribed in the Introduction. Hence the H2O contentsno unique line in P–T space that defines the stability ofof cordierites in such migmatitic granulites would, ideally,a cordierite with a specific H2O content. Even in thecorrespond to predictions from the intersections betweenabsence of CO2, at high temperatures where melt isthis reaction (or its analogues in more complex systems)
and the cordierite isopleths of Fig. 13b. The simplest present cordierite with a specific H2O content can be
1615

JOURNAL OF PETROLOGY VOLUME 42 NUMBER 9 SEPTEMBER 2001
formed over a rather large P–T field depending on the above. Cordierites from several lower-P migmatitic gran-ulite areas (<5 kbar, Table 5) yield aH2O estimates ofimposed aH2O. In the example shown (Fig. 13d) there
is a 5 kbar difference, at 850°C, between the pressure at between 0·2 and 0·6 and melt H2O contents between2·5 and 4 wt % at temperatures of 675–800°C. Thewhich the cordierite with 1·75 wt % H2O would form
coexisting with aqueous fluid and the pressure at which higher aH2O conditions tend to be calculated in caseswhere extensive segregated leucosomes and graniticit would form in equilibrium with a melt containing
3·5 wt % H2O. sheets occur (e.g. Mt Stafford, Argentina, Kimberly re-gion of West Australia), comparable with aH2O estimatesfrom cordierites in many leucogranites and well-se-gregated pegmatites (Table 5). For example, cordieriteleucogranite from Beatenally quarry, in the ProterozoicMigmatites and metamorphism: aH2ONorthampton Block of Western Australia, containsestimates and melt H2O contents1·3 wt % H2O and implies >4·6 ± 0·4% H2O in theThe cordierite hydration calibration developed here, andcoexisting granite liquid at an aH2O of 0·44 ± 0·04,the Dw relationships defined from our experiments andwhereas a restitic cordierite–spinel–sillimanite gneissmodelling, can, in principle, be used to calculate thexenolith in granite from the same locality suggests a
aH2O of melting and metamorphism in high-grade meta-much lower aH2O (0·12± 0·03) and potential melt H2Omorphic terrains characterized by cordierite migmatitescontent (1·9 ± 0·4 wt %) if it equilibrated at the sameand applied to infer the H2O contents of the meltsP–T conditions. In this example, and in other cases whereformerly present during the metamorphism. Conversely,cordierite remains in contact with segregated melt, it iswhere the P–T–aH2O conditions of melting and meta-considered likely that the higher H2O contents and aH2Omorphism are well known from independent equilibria,attained in the granites and pegmatites reflect the additioncordierite H2O contents predicted from our modellingor uptake of H2O into cordierite as the melt increases in itscan be compared with measured contents to evaluateH2O content during crystallization following segregationthe role of H2O addition into or leakage from cordieriteand ponding.subsequent to melting and metamorphism. Table 5 pres-
The well-developed migmatites and leucogranites de-ents a summary of cordierite data from selected migmatitescribed by Smith (1996) from the Cretaceous Fosdickterrains and cordierite-bearing granites and pegmatites.Complex of Antarctica contain cordierites whose H2OThe cordierite volatile content data in most of the citedcontents indicate aH2O (0·36 ± 0·05) and melt H2Ocases have been obtained using SIMS analysis withcontents (3·9 ± 0·5 wt %) that are consistent withnegative secondary ions, as described in a previous sectionbiotite dehydration-melting at the inferred temperatureand by Carrington & Harley (1996).conditions of the metamorphic event and hence argueCordierite occurs as a euhedral to subhedral phase inagainst significant H2O leakage or addition into themany low- and medium-pressure migmatites found incordierites subsequent to the melting event. The sameboth regional and contact metamorphism (e.g. Waters &conclusions can be drawn from various other examplesWhales, 1984; Stevens & Clemens, 1993; Carrington &distinguished in Table 5. For example, at Mount StaffordHarley, 1995). The common occurrence of cordierite asin the Arunta Complex (Vernon et al., 1990; Greenfieldsingle grains and grain clusters in leucosome veins andet al., 1998) cordierite in granitic leucosomes containspatches, as inclusion-free grains along mesosome–>1 wt % H2O (Table 5). Using our hydration model,leucosome contacts (e.g. Harley, 1994; Fitzsimons, 1996),at 2·5 kbar and 650°C we obtain aH2O of 0·4 from theseand as inclusion-free rinds overgrowing sillimanite- orcordierites, and calculate 4·2 wt % H2O in the coexistingbiotite-bearing cordierite cores (e.g. Buick et al., 1998)melts, reasonably consistent with phase equilibria con-is consistent with its generation through dehydration-straints (Greenfield et al., 1998).melting reactions of the form
Cordierite is often considered to be susceptible to post-formation leakage from the relatively ‘open’ channelsBt + Sil + Qz ± Plag = Crd ± Kfs + L(e.g. Aines & Rossman, 1984; Mirwald et al., 1986) andit is possible that in many cases the peak volatile contentsand related reactions that may progress during melt
crystallization and wall-rock reaction. are not retained. In accord with this, some of themigmatite examples in Table 5 may be interpreted toThe H2O contents of cordierites from several examples
of such migmatite occurrences, some of which will be have experienced H2O loss as their preserved H2Ocontents yield ‘melt’ H2O contents that are too low to bedescribed in more detail elsewhere, are presented in
Table 5. The data are coupled with independent P–T consistent with dehydration-melting at the independentlyinferred P–T conditions. Sample 9017, a cordierite–estimates to allow calculation of apparent aH2O, Dw, and
hence the nominal H2O content (in wt %) of coexisting quartz–feldspar patch leucosome from the ReynoldsRange, Arunta Complex, central Australia (Buick et al.,granitic melt, using equations (9), (10) and (16) as given
1616

HARLEY AND CARRINGTON H2O INCORPORATION IN CORDIERITE
Table 5: Cordierite water activity calculations and melt H2O contents
Area P T H2O(Crd) Dw H2O(m) aH2O CO2(Crd) Reference and assemblage
(kbar) (°C) (wt %) (wt %) (wt %)
Migmatites
Mt Stafford 2·5 800 0·85 4·4 3·6 0·51 0·03 Greenfield et al. (1998)
(nebulites) Crd–And–Sil–Spl–Qz
Kimberly region 3·5 775 0·62 3·8 2·4 0·22 0·13 (Warren)∗
(contact melts) Crd–Sil–Mt–Crn
Kimberly region 3·5 775 1·10 3·8 4·1 0·47 0·46 (Watt)∗
(granite/migmatites) Crd–Kfs–Qz + Bt
Reynolds Range 5·0 775 0·69 3·2 2·2 0·16 0·23 (Harley)∗
(cordierite Ck) Crd–Sil–Qz
Fosdick 5·0 750 1·25 3·1 3·9 0·36 0·26 Smith (1996)
(migmatites) Crd–Grt–Kfs–Bt–Qz
Madagascar 5·0 850 0·29 4·4 1·3 0·06 0·53 (Nicollet)∗
(migmatite) Crd–Qz
Northampton 5·0 800 0·53 3·5 1·9 0·12 0·65 (Harley)∗
(restite) Crd–Sil–Spl–Qz
Prydz Bay 5·5 825 0·50 3·5 1·8 0·10 0·71 (Harley)∗
(migmatites) Crd–Sil–Grt–Spl–Qz
Strangways 6·0 800 0·69 2·9 2·0 0·12 0·02 (Harley)∗
(Phlogopite Mine) Crd–Opx–Kfs–Qz
Strangways 6·0 800 1·15 2·9 3·4 0·26 0·42 (Harley)∗
(Edwards Ck) Crd
Rauer Islands 8·0 920 0·70 2·9 2·0 0·10 0·06 Harley (1998b)
(Mather) Crd–Grt–Opx–Sil–Kfs
Granites and pegmatites
Reynolds Range 3·3 675 0·93 3·2 3·0 0·33 0·73 (Buick)∗
(pegmatite) Crd–Qz
Argentina 3·5 700 1·18 3·4 4·0 0·47 0·31 (Rapela)∗
(cordieritite) Crd–Bt–Kfs–Musc
Northampton 5·0 800 1·30 3·5 4·6 0·44 0·63 (Harley)∗
(granite) Crd–Kfs–Qz
All volatile analyses carried out in SIMS negative mode using procedures outlined in the text and by Carrington & Harley(1996) and Harley (1994). Weight percent data are averages of 6–12 cordierite analyses on either one or several samplesfrom the given locality. Details to be presented elsewhere.∗Unpublished cordierite volatile data by Harley, collected from 1992–1998, material provided by researcher whose name isgiven in parentheses. P–T data based on original references or estimates provided by co-workers.And, andalusite; Bt, biotite; Crd, cordierite; Crn, corundum; Grt, garnet; Kfs, K-feldspar; Mt, magnetite; Musc, muscovite;Opx, orthopyroxene; Qz, quartz; Sil, sillimanite; Spl, spinel; melt is denoted by the subscript m.
1998), yields an aH2O of only 0·16 and melt H2O contents Madagascar, supplied by C. Nicollet, displays the sametype of H2O deficiency in comparison with melt H2O(2·2 wt %) that are too low for the specified peak
temperatures of 775°C. Likewise, several cordierites from requirements and again indicates that volatile loss fromcordierite in leucosomes has to be considered whengarnet-bearing migmatites from Prydz Bay, East Ant-
arctica, imply apparent melt H2O contents of only 1·6– evaluating the measured H2O data. In all these citedexamples the alternative explanation of the low phase2·0 wt %. These are substantially less than the 3–3·5 wt %
minima required for granitic melts at 5·5–6·5 kbar and H2O contents and aH2O would be that the peak tem-perature estimates used for the rock suites are lower than825–850°C, the inferred conditions of melting in this
case (Fitzsimons, 1996). Cordierite in a leucosome from those at which cordierite and melt equilibrated at or near
1617
JOURNAL OF PETROLOGY VOLUME 42 NUMBER 9 SEPTEMBER 2001
the metamorphic peak, a possibility that requires further The Dw–P–T–aH2O relations derived in this studyallow calculation of the equilibrium H2O contents ofevaluation using independent thermometry and as-
semblage constraints in each case. cordierite coexisting with melts with given H2O at spe-cified P and T, and vice versa, estimation of aH2OTwo orthopyroxene-bearing migmatitic samples pro-
vide good evidence for low aH2O conditions related to and cordierite–melt H2O contents along selected meltingequilibria, calculation of H2O isohydrons for cordieritehigh-T melting. Sample 9052, a cordierite–ortho-
pyroxene segregation in a garnet-bearing semipelitic produced with melts formed through di- and multivariantdehydration-melting processes, and independent es-gneiss from the Strangway Range of the Arunta Complex,
suggests melting at aH2O of 0·12 to yield a melt with timation of aH2O in cordierite-bearing migmatites, gran-ites and granulite terrains. Such calculations provide a2 wt % H2O, at>900°C. Ultrahigh-temperature melting
and migmatization at Mather Peninsula in the Rauer framework for examining the effect of H2O in cordieriteupon melt production in high-grade metamorphism.Islands (Harley, 1998b) produced orthopyroxene + sil-
limanite+ garnet and locally cordierite at P–T conditions They also demonstrate that whereas some cordieritemigmatites formed under aH2O conditions consistentof 8–9 kbar and 920–950°C. The aH2O (0·1) and melt
H2O content (2 wt %) estimated from cordierite H2O with biotite dehydration-melting, the H2O contents ofother high-grade cordierites may reflect post-meltingdata in this example are consistent with values expected
from independent experimental data at these P–T con- processes including H2O uptake during melt crys-tallization and H2O leakage following melt removal.ditions (Carrington & Watt, 1995).
In many of the cases listed in Table 5 and consideredabove CO2 is an additional important volatile in cor-dierite, ranging from >0·7 wt % (e.g. Prydz Bay, ReynoldsRange) to more typical contents in the range 0·1– ACKNOWLEDGEMENTS0·4 wt %. It is beyond the scope of this contribution
Our thanks go to the following people: John Craven andto analyse and review the impact of CO2 on the Dw Richard Hinton for assistance with SIMS analysis; Simonrelationships developed from the H2O-only study. How-Burgess and Peter Hill for assistance with EMP analysis;ever, on the basis of experiments in the H2O–CO2 systemTim Hopkins and David Plant for assistance with SEM(Thompson et al., 2001) the effect of CO2 on Dw at aanalysis; Volker Schenk, Dave Mattey, and Tony Fallickgiven cordierite H2O content can be demonstrated to befor analysis of cordierite standards; Francois Holtz fornegligible.the provision of SIMS melt standards; Dave Mattey andIan Fitzsimons for cordierite evacuation; and PaulineThompson for discussions. Our thanks are due also toDave Pattison, Gary Stevens and an anonymous reviewerfor perceptive and detailed reviews that, it is hoped, haveCONCLUSIONSimproved the clarity of this paper. This research wasExperimental study of the distribution of H2O betweenfunded by the UK Natural Environment Research Coun-cordierite and coexisting granitic melt demonstrates thatcil through grant GR3/09099 to S.L.H.this distribution, Dw, is a predictable function of P, T and
aH2O. Dw generally lies in the range 2·5–6·0 and at anyselected P–T condition will vary depending on cordieriteH2O content, with a minimum region corresponding
REFERENCESto low to moderate aH2O. The H2O-undersaturatedAines, R. D. & Rossman, G. R. (1984). The high-temperature behaviorexperiments prove that cordierite can have a range of
of water and carbon dioxide in cordierite and beryl. American Min-equilibrium H2O contents at any specified P–T conditioneralogist 69, 319–327.in the regime of melting, up to maxima defined by the
Armbruster, Th. & Bloss, F. D. (1980). Channel CO2 in cordierites.H2O-saturated, fluid-present, system.Nature 286, 140–141.
The isothermal–isobaric H2O content data for melt Armbruster, Th. & Bloss, F. D. (1982). Orientation and effects ofand cordierite are mutually consistent with simple solution channel H2O and CO2 in cordierite. American Mineralogist 67, 284–291.models and, when coupled with the measured H2O data Armbruster, Th., Schreyer, W. & Hoefs, J. (1982). Very high CO2
cordierite from Norwegian Lapland: mineralogy, petrology, andfor cordierite in the saturated system, allow refinementcarbon isotopes. Contributions to Mineralogy and Petrology 81, 262–267.of estimates for the thermodynamic parameters for cor-
Barbey, P., Macaudiere, J. & Nzenti, J. P. (1990). High-pressuredierite hydration to 1000°C. The isohydron set so deriveddehydration melting of metapelites: evidence from the migmatitesis similar to those recently produced by Skippen & Gunter of Yaounde (Cameroon). Journal of Petrology 31, 401–427.
(1996) over a smaller temperature range and within error Bhattacharya, A. & Sen, S. K. (1985). Energetics of hydration ofof that which would be produced using the internally cordierite and water barometry in cordierite-granulites. Contributions
to Mineralogy and Petrology 89, 370–378.consistent dataset of Holland & Powell (1998).
1618

HARLEY AND CARRINGTON H2O INCORPORATION IN CORDIERITE
Bhattacharya, A. & Sen, S. K. (1986). Granulite metamorphism, fluid Holtz, F. & Barbey, P. (1991). Genesis of peraluminous granites II.Mineralogy and chemistry of the Tourem Complex (North Portugal).buffering, and dehydration melting in the Madras charnockites andSequential melting vs restite unmixing. Journal of Petrology 32, 959–978.metapelites. Journal of Petrology 27, 1119–1141.
Holtz, F. & Johannes, W. (1994). Maximum and minimum waterBoberski, C. & Schreyer, W. (1990). Synthesis and water contents ofcontents of granitic melts: implications for chemical and physicalFe2+-cordierites. European Journal of Mineralogy 2, 565–584.properties of ascending magmas. Lithos 32, 149–159.Buick, I. S., Cartwright, I. & Harley, S. L. (1998). The retrograde
Holtz, F., Behrens, H., Dingwell, D. B. & Taylor, R. B. (1992a). WaterP–T–t path for low-pressure granulites from the Reynolds Range,solubility in aluminosilicate melts of haplogranite composition atcentral Australia: petrological constraints and implications for low-2 kbar. Chemical Geology 96, 289–302.P/high-T metamorphism. Journal of Metamorphic Geology 16, 511–529.
Holtz, F., Johannes, W. & Pichavant, M. (1992b). Peraluminous granites:Burnham, C. W. (1994). Development of the Burnham model forthe effect of alumina on melt composition and coexisting mineral.prediction of H2O solubility in magmas. In: Carroll, M. R. &Philosophical Transactions of the Royal Society of Edinburgh 83, 409–416.Holloway, J. R. (eds) Volatiles in Magmas. Mineralogical Society of America,
Jochum, C., Mirwald, P. W., Maresch, W. V. & Schreyer, W. (1983).Reviews in Mineralogy 30, 123–129.The kinetics of H2O exchange between cordierite and fluid duringBurnham, C. W. & Nekvasil, H. (1986). Equilibrium properties ofretrogression. Fortschritte der Mineralogie 61, 103–105.granitic pegmatite magmas. American Mineralogist 71, 239–263.
Johannes, W. & Holtz, F. (1990). Formation and composition of H2O-Carey, J. W. (1995). A thermodynamic formulation for hydrous cor-undersaturated granitic melts. In: Ashworth, J. R. & Brown, M.dierite. Contributions to Mineralogy and Petrology 119, 155–165.(eds) High Temperature Metamorphism and Crustal Anatexis. London: UnwinCarey, J. W. & Navrotsky, A. (1992). The molar enthalpy of dehydrationHyman, pp. 87–104.of cordierite. American Mineralogist 77, 930–936.
Johannes, W. & Holtz, F. (1996). Petrogenesis and Experimental Petrology ofCarrington, D. P. & Harley, S. L. (1995). Partial melting and phaseGranitic Rocks. Berlin: Springer.relations in high-grade metapelites: an experimental petrogenetic
Johannes, W. & Schreyer, W. (1981). Experimental introduction ofgrid in the KFMASH system. Contributions to Mineralogy and PetrologyCO2 and H2O into Mg-cordierite. American Journal of Science 281,120, 270–291.299–317.Carrington, D. P. & Harley, S. L. (1996). Cordierite as a monitor of
Knop, E., Scheilk, M. & Mirwald, P. W. (1998). Incorporation offluid and melt water contents in the lower crust: an experimentalsodium into magnesium cordierite below and above the solidus.calibration. Geology 24, 647–650.Abstract Supplement 1, Terra Nova 10, 30–31.
Carrington, D. P. & Watt, G. R. (1995). A geochemical and ex-Kurepin, V. A. (1984). H2O and CO2 contents of cordierite as an
perimental study of the role of K-feldspar during water-under-indicator of thermodynamical conditions of formation. Geokhimiya 8,
saturated melting of metapelites. Chemical Geology 122, 59–76.1125–1134.
Clemens, J. D. & Vielzeuf, D. (1987). Constraints on melting andLe Breton, N. (1989). Infrared investigations of CO2-bearing cordierites:
magma production in the crust. Earth and Planetary Science Letters 86,some implications for the study of metapelitic granulites. Contributions
287–306.to Mineralogy and Petrology 103, 387–396.
Fitzsimons, I. C. W. (1994). Cordierite migmatites from East Antarctica: Le Breton, N. & Thompson, A. B. (1988). Fluid-absent (dehydration)geochemical constraints on volatile distribution during crustal melting of biotite in metapelites in the early stages of crustal anatexis.anatexis. Mineralogical Magazine 58a, 274–275.
Contributions to Mineralogy and Petrology 99, 226–237.Fitzsimons, I. C. W. (1996). Metapelitic migmatites from Brattstrand Lepezin, G. G. & Melenevsky, V. N. (1977). On the problem of water
Bluffs, east Antarctica—metamorphism, melting and exhumation of diffusion in the cordierites. Lithos 10, 49–57.the mid-crust. Journal of Petrology 37, 395–414. Lonker, S. W. (1981). The P–T–X relations of the cordierite–
Goldman, D. S., Rossman, G. R. & Dollase, W. A. (1977). Channel garnet–sillimanite–quartz equilibrium. American Journal of Science 281,constituents in cordierite. American Mineralogist 62, 1144–1157. 1056–1090.
Greenfield, J. E., Clarke, G. L. & White, R. W. (1998). A sequence of Martignole, J. & Sisi, J.-C. (1981). Cordierite–garnet–H2O equilibrium:partial melting reactions at Mt Stafford, central Australia. Journal of a geological thermometer, barometer and water fugacity indicator.Metamorphic Geology 16, 363–378. Contributions to Mineralogy and Petrology 77, 38–46.
Harley, S. L. (1989). The origins of granulites: a metamorphic per- McMillan, P. F. (1994). Water solubility and speciation models. In:spective. Geological Magazine 126, 215–247. Carroll, M. R. & Holloway, J. R. (eds) Volatiles in Magmas. Mineralogical
Harley, S. L. (1994). Cordierite as a sensor of fluid and melt distribution Society of America, Reviews in Mineralogy 30, 131–156.in crustal metamorphism. Mineralogical Magazine 58a, 374–375. McMillan, P. F. & Holloway, J. R. (1987). Water solubility in alumino-
Harley, S. L. (1998a). On the occurrence and characterization of silicate melts. Contributions to Mineralogy and Petrology 97, 320–332.ultrahigh-temperature (UHT) crustal metamorphism. In: Treloar, Mirwald, P. W. (1986). Ist Cordierite ein Geothermometer? FortschritteP. J. & O’Brien, P. (eds) What Controls Metamorphism and Metamorphic der Mineralogie 64, 119.Reactions? Geological Society, London, Special Publications 138, 75–101. Mirwald, P. W. & Schreyer, W. (1977). Die stabile und metastabile
Harley, S. L. (1998b). Ultrahigh temperature granulite metamorphism Abbaureaktion von Mg-cordierit in Talk, Disthen und Quartz und(1050°C, 12 kbar) and decompression in garnet (Mg70)–ortho- ihre Abhangigkeit vom Gleichgewichts-wassergehalt des Cordierits.pyroxene–sillimanite gneisses from the Rauer Group, East Fortschritte der Mineralogie 55, 95–97.Antarctica. Journal of Metamorphic Geology 16, 541–562. Mirwald, P. W., Maresch, W. V. & Schreyer, W. (1979). Der Was-
Holland, T. J. B. & Powell, R. (1998). An internally consistent thermo- sergehalt von Mg-cordierit zwischen 500° und 800°C sowie 0·5 unddynamic data set for phases of petrological interest. Journal of Meta- 11 kbar. Fortschritte der Mineralogie 57, 101–102.morphic Geology 16, 309–343. Mirwald, P. W., Jochum, C. & Maresch, W. V. (1986). Rate studies
Holloway, J. R. & Blank, J. G. (1994). Application of experimental on hydration and dehydration of synthetic Mg-cordierite. Materials
results to C–O–H species in natural melts. In: Carroll, M. R. & Science Forum 7, 113–122.Holloway, J. R. (eds) Volatiles in Magmas. Mineralogical Society of America, Moore, G., Vennemann, T. & Carmichael, I. S. E. (1995). Solubility
of water in magmas to 2 kbar. Geology 23, 1099–1102.Reviews in Mineralogy 30, 187–230.
1619
JOURNAL OF PETROLOGY VOLUME 42 NUMBER 9 SEPTEMBER 2001
Moore, G., Vennemann, T. & Carmichael, I. S. E. (1998). An empirical Stevens, G. & Clemens, J. D. (1993). Fluid-absent melting and theroles of fluids in the lithosphere: a slanted summary? Chemical Geologymodel for the solubility of H2O in magmas to 3 kilobars. American108, 1–17.Mineralogist 83, 36–42.
Stevens, G., Clemens, J. D. & Droop, G. T. R. (1995). HydrousMukhopadhyay, B. & Holdaway, M. J. (1994). Cordierite–cordierite in granulites and crustal magma production. Geology 23,garnet–sillimanite–quartz equilibrium I. New experimental cal-925–928.ibration in the system FeO–Al2O3–SiO2–H2O and certain P–T–
Stolper, E. M. (1982). The speciation of water in silicate melts. GeochimicaXH2O relations. Contributions to Mineralogy and Petrology 116, 462–472.et Cosmochimica Acta 46, 2609–2620.Newton, R. C. & Wood, B. J. (1979). Thermodynamics of water in
Thompson, P., Harley, S. L. & Carrington, D. P. (2001) Sodium andcordierite and some petrologic consequences of cordierite as apotassium in cordierite—a potential thermometer for melts? Europeanhydrous phase. Contributions to Mineralogy and Petrology 68, 391–405.Journal of Mineralogy, in press.Newton, R. C., Smith, J. V. & Windley, B. F. (1980). Carbonic
Vernon, R. H. & Collins, W. J. (1988). Igneous microstructures inmetamorphism, granulites, and crustal growth. Nature 288, 45–49.migmatites. Geology 16, 1126–1129.
Papale, P. (1997). Thermodynamic modelling of the solubility of H2O Vernon, R. H., Clarke, G. L. & Collins, W. J. (1990). Local, mid-and CO2 in silicate liquids. Contributions to Mineralogy and Petrology 126,
crustal granulite-facies metamorphism and melting: an example in237–251. the Mount Stafford area, Central Australia. In: Ashworth, J. R. &
Patino Douce, A. E. & Johnston, A. D. (1991). Phase equilibria and Brown, M. (eds) High-temperature Metamorphism and Crustal Anatexis.melt productivity in the pelitic system: implications for the origin of London: Unwin Hyman, pp. 272–319.peraluminous granitoids and aluminous granulites. Contributions to Vielzeuf, D. & Clemens, J. D. (1992). The fluid-absent melting ofMineralogy and Petrology 107, 202–218. phlogopite + quartz: experiments and models. American Mineralogist
Pichavant, M., Holtz, F. & McMillan, P. F. (1992). Phase relations and 77, 1206–1222.compositional dependence of H2O solubility in quartz–feldspar melts. Vielzeuf, D. & Holloway, J. R. (1988). Experimental determination ofChemical Geology 96, 303–319. the fluid-absent melting relations in the pelitic system. Consequences
Puziewicz, J. & Johannes, W. (1990). Experimental study of a biotite- for crustal differentiation. Contributions to Mineralogy and Petrology 98,bearing granitic system under water-saturated and water-under- 257–276.
Vry, J. K., Brown, P. E. & Valley, J. W. (1990). Cordierite volatilesaturated conditions. Contributions to Mineralogy and Petrology 104,content and the role of CO2 in high-grade metamorphism. American397–406.Mineralogist 75, 71–88.Santosh, M., Harris, N. B. W., Jackson, D. H. & Mattey, D. P. (1990).
Waters, D. J. (1988). Partial melting and the formation of granuliteDehydration and incipient charnockite formation: a phase equilibriafacies assemblages in Namaqualand, South Africa. Journal of Meta-and fluid inclusion study from south India. Journal of Geology 98,morphic Geology 6, 387–404.915–926.
Waters, D. J. & Whales, D. (1984). Dehydration melting and theSchreyer, W. (1985). Experimental studies on cation substitutionsgranulite transition in metapelites from southern Namaqualand, S.and fluid incorporation in cordierite. Bulletin de Mineralogie 108,Africa. Contributions to Mineralogy and Petrology 88, 269–275.273–291.
White, A. J. R. & Chappell, B. W. (1988). Some supracrustal (S-type)Schreyer, W. & Yoder, H. S. (1964). The system Mg-cordierite–H2O granites of the Lachlan fold belt. Philosophical Transactions of the Royaland related rocks. Neues Jahrbuch fur Mineralogie, Abhandlungen 101,Society of Edinburgh 79, 169–181.
271–342.Winkler, B., Milman, V. & Payne, M. C. (1994). Orientation, location,
Shmulovich, K. I. & Graham, C. M. (1996). Melting of albite and and total energy of hydration of channel H2O in cordierite in-dehydration of brucite in H2O–NaCl fluids to 9 kbars and vestigated by ab-initio total energy calculations. American Mineralogist700–900°C: implications for partial melting and water activities 79, 200–204.during high pressure metamorphism. Contributions to Mineralogy and Young, E. D., Anderson, J. L., Clarke, H. S. & Thomas, W. M. (1989).Petrology 124, 370–382. Petrology of biotite–cordierite–garnet gneiss of the McCullough
Skippen, G. B. & Gunter, A. E. (1996). The thermodynamic properties Range, Nevada I. Evidence for Proterozoic low-pressure fluid-absentof H2O in magnesian and iron cordierite. Contributions to Mineralogy granulite-grade metamorphism in the southern Cordillera. Journal ofand Petrology 124, 82–89. Petrology 30, 39–60.
Smith, C. H. (1996). H2O–CO2 contents of cordierite in migmatites Zimmermann, J.-L. (1981). The liberation of H2O, CO2 and hydro-of the Fosdick Mountains, Marie Byrd Land. Terra Antarctica 3, carbons from cordierites: kinetics, structural sites and petrogenetic
implications. Bulletin de Mineralogie 104, 325–338.11–22.
1620
Copyright © 2022 FDOKUMEN


![Theoretical studies on the interaction of some endohedral fullerenes {[X@C60]− (X=F−, Cl−, Br−) or [M@C60] (M=Li, Na, K)} with [Al(H2O)6]3+ and [Mg(H2O)6]2+ cations](https://static.fdokumen.com/doc/165x107/63245aa148d448ffa0071bdb/theoretical-studies-on-the-interaction-of-some-endohedral-fullerenes-xc60.jpg)

![Voltammetric Determination of Cocaine in Confiscated Samples Using a Carbon Paste Electrode Modified with Different [UO2(X-MeOsalen)(H2O)].H2O complexes](https://static.fdokumen.com/doc/165x107/63258de1545c645c7f09c2d3/voltammetric-determination-of-cocaine-in-confiscated-samples-using-a-carbon-paste.jpg)