Fluid-absent (dehydration) melting of biotite in metapelites in the early stages of crustal anatexis
12
Contrib Mineral Petrol (1988) 99:226-237 Contributions to Mineralogy and Petrology Springer-Verlag1988 Fluid-absent (dehydration) melting of biotite in metapelites in the early stages of crustal anatexis Nicole Le Breton* and Alan Bruce Thompson Departement fiir Erdwissenschaften, ETH-Zentrum, CH-8092 Zfirich, Switzerland Abstract. Experimental investigation of the fluid absent melting reaction biotite+plagioclase+A12SiOs+quartz~ garnet + K-feldspar + melt at 10 kbar, indicated that melt- ing began between 760 and 800~ and was extensive at 850 ~ C. This reaction apparently has a positive dP/dT at least up to 10 kbar, compared to a calculated backbending in a simplified system. Natural biotites are stabilised to higher dehydration melting temperatures probably by Ti. Consequently, metapelites undergo two-stages of fluid-ab- sent melting even in thickened, continental crust. The two stages firstly as muscovite, and secondly as biotite react, appear to persist to at least 17 kbar, depending upon biotite composition. This lies well within the stability field of kya- nite migmatites. Thus, complex petrogenetic grids can be computed from the little available data over a wide range of P-T-Xroek-XH20 conditions. Microprobe analyses indicate good correlations with the Fe/Mg garnet + biotite exchange thermometer and the garnet +plagioclase +A12SiO5 + quartz barometer at 850 ~ C, 10 kbar. Furthermore, micro- probe analyses show that vGar'" Liq .~.yBio in fluid-absent ~x Fe f Fe t- .l Fe as well as in HzO-saturated pelite anatexis. Thus intermedi- ate Fe/Mg compositions, containing Bio, Gar, Als, Plg, Ksp, Qtz will eutectically melt before Fe-richer or Mg-richer metapelites. If the partition VG,r/vLiq reverses with increas- " Fe /~x Fe ing temperature, then biotite will change from being in eu- tectic to peritectic relation with the anatectic melt. This could result in distinct textural changes during progressive metapelite melting, such as the formation of biotite sel- vedges. Such melt compositions effect the relative densities of initial melts and crystals - and would influence melt extraction, especially with limited H20 available. Because the succession of fluid-absent melting reactions occurs with- in a relatively narrow temperature interval for most metape- lite compositions, the endothermic reactions themselves and slow HzO-diffusion rates in H20-undersaturated melts, mean that the initial stages of melting will be preserved in many migmatites at most crustal depths. Some migma- tites should therefore be viewed as failed granites in the sense that they could not segregate and separate. The pro- portion of melt produced is directly related to the amount of muscovite and biotite in the metapelite source material, the temperature reached and the amount of H20 that can * Present address: Ruhr-Universit/it Bochum, Institut ftir Minera- logie, Postfach 102148, D-4630 Bochum 1, Federal Republic of Germany Offprint requests to: A.B. Thompson enter the melt. Influx of external H20, higher heat input and melting at lower pressure leads to proportionally greater degrees of melt segregation and less likelihood of being able to correlate the mineralogy and geochemistry of injected melts and host rocks. Introduction The melting temperatures of quartz and feldspar-bearing rocks are drastically lowered at high PH20 (Tuttle and Bowen 1958). However, the limited amounts of free H20 expected in the lower continental crust will produce only a few percent melt at the H20-saturated solidus (about 610 ~ C at 10 kbar, Huang and Wyllie 1975; Thompson and Algor 1977). Dehydration reactions involving muscovite and biotite in pelites, and of biotite in less aluminous com- positions, in the lower continental crust, can induce partial melting (e.g. Lambert et al. 1969; Brown and Fyfe 1970). As the amount of H20 available from mica dehydration is insufficient to saturate such anatectic melts (Lundgren 1966), the quantities of melt first produced are small and proportional to the amount of mica involved in a particular dehydration-melting (fluid-absent) reaction (Burnham 1967, p. 68; 1979a, p. 98). Early melting reactions are of particular petrological interest because they can be observed directly in some migmatites where the melt has not migrated far (e.g. see papers in Ashworth 1985). Despite the paucity of direct experimental investigation of dehydration-melting reactions involving mica, petrogen- etic grids constructed from a variety of constraints (e.g. Thompson 1982; Grant 1985) indicate that the melting se- quences should be characterised by distinctive mineralogies at different pressures. At intermediate pressures average metapelites undergo two stages of dehydration-melting: first, as muscovite, and second, as biotite, reacts over a temperature interval of about 100 ~ C. In metapelites, these successive fluid-absent melting reactions may be considered as (abbreviations in Table 1): Mus + Pig + Qtz-,Ksp + Als + melt(L 1) (1) and Bio +Plg + Als + Qtz--* Ksp + Gar + melt(Lz) (2) With increasing pressure these two reactions converge and intersect (Thompson 1982, Fig. 6). At pressures higher than
-
Upload
independent -
Category
Documents
-
view
3 -
download
0
Transcript of Fluid-absent (dehydration) melting of biotite in metapelites in the early stages of crustal anatexis

Contrib Mineral Petrol (1988) 99:226-237 Contributions to Mineralogy and Petrology �9 Springer-Verlag 1988
Fluid-absent (dehydration) melting of biotite in metapelites in the early stages of crustal anatexis Nicole Le Breton* and Alan Bruce Thompson Departement fiir Erdwissenschaften, ETH-Zentrum, CH-8092 Zfirich, Switzerland
Abstract. Experimental investigation of the fluid absent melting reaction bioti te+plagioclase+A12SiOs+quartz~ garnet + K-feldspar + melt at 10 kbar, indicated that melt- ing began between 760 and 800~ and was extensive at 850 ~ C. This reaction apparently has a positive dP/dT at least up to 10 kbar, compared to a calculated backbending in a simplified system. Natural biotites are stabilised to higher dehydration melting temperatures probably by Ti. Consequently, metapelites undergo two-stages of fluid-ab- sent melting even in thickened, continental crust. The two stages firstly as muscovite, and secondly as biotite react, appear to persist to at least 17 kbar, depending upon biotite composition. This lies well within the stability field of kya- nite migmatites. Thus, complex petrogenetic grids can be computed from the little available data over a wide range of P-T-Xroek-XH20 conditions. Microprobe analyses indicate good correlations with the Fe/Mg garnet + biotite exchange thermometer and the garnet +plagioclase +A12SiO5 + quartz barometer at 850 ~ C, 10 kbar. Furthermore, micro- probe analyses show that vGar'" L i q . ~ . y B i o in fluid-absent ~x F e f F e t - . l F e
as well as in HzO-saturated pelite anatexis. Thus intermedi- ate Fe/Mg compositions, containing Bio, Gar, Als, Plg, Ksp, Qtz will eutectically melt before Fe-richer or Mg-richer metapelites. If the partition VG,r/vLiq reverses with increas- " F e / ~ x F e
ing temperature, then biotite will change from being in eu- tectic to peritectic relation with the anatectic melt. This could result in distinct textural changes during progressive metapelite melting, such as the formation of biotite sel- vedges. Such melt compositions effect the relative densities of initial melts and crystals - and would influence melt extraction, especially with limited H20 available. Because the succession of fluid-absent melting reactions occurs with- in a relatively narrow temperature interval for most metape- lite compositions, the endothermic reactions themselves and slow HzO-diffusion rates in H20-undersaturated melts, mean that the initial stages of melting will be preserved in many migmatites at most crustal depths. Some migma- tites should therefore be viewed as failed granites in the sense that they could not segregate and separate. The pro- portion of melt produced is directly related to the amount of muscovite and biotite in the metapelite source material, the temperature reached and the amount of H20 that can
* Present address: Ruhr-Universit/it Bochum, Institut ftir Minera- logie, Postfach 102148, D-4630 Bochum 1, Federal Republic of Germany
Offprint requests to: A.B. Thompson
enter the melt. Influx of external H20, higher heat input and melting at lower pressure leads to proportionally greater degrees of melt segregation and less likelihood of being able to correlate the mineralogy and geochemistry of injected melts and host rocks.
Introduction
The melting temperatures of quartz and feldspar-bearing rocks are drastically lowered at high PH20 (Tuttle and Bowen 1958). However, the limited amounts of free H20 expected in the lower continental crust will produce only a few percent melt at the H20-saturated solidus (about 610 ~ C at 10 kbar, Huang and Wyllie 1975; Thompson and Algor 1977). Dehydration reactions involving muscovite and biotite in pelites, and of biotite in less aluminous com- positions, in the lower continental crust, can induce partial melting (e.g. Lambert et al. 1969; Brown and Fyfe 1970). As the amount of H20 available from mica dehydration is insufficient to saturate such anatectic melts (Lundgren 1966), the quantities of melt first produced are small and proportional to the amount of mica involved in a particular dehydration-melting (fluid-absent) reaction (Burnham 1967, p. 68; 1979a, p. 98). Early melting reactions are of particular petrological interest because they can be observed directly in some migmatites where the melt has not migrated far (e.g. see papers in Ashworth 1985).
Despite the paucity of direct experimental investigation of dehydration-melting reactions involving mica, petrogen- etic grids constructed from a variety of constraints (e.g. Thompson 1982; Grant 1985) indicate that the melting se- quences should be characterised by distinctive mineralogies at different pressures. At intermediate pressures average metapelites undergo two stages of dehydration-melting: first, as muscovite, and second, as biotite, reacts over a temperature interval of about 100 ~ C. In metapelites, these successive fluid-absent melting reactions may be considered as (abbreviations in Table 1):
Mus + Pig + Qtz- ,Ksp + Als + melt(L 1) (1)
and
Bio +Plg + Als + Qtz--* Ksp + Gar + melt(Lz) (2)
With increasing pressure these two reactions converge and intersect (Thompson 1982, Fig. 6). At pressures higher than

Table 1. Composition of the starting mixtures (weight percent)
Mixture number 1 2 3
227
a) Biotite (Sd 1031 e in Schmid & Wood 1976) (Bio) b) Garnet (Sd 1031 e in Schmid & Wood 1976) (Gar) c) Plagioclase (Plg)
Kyanite (Kya) Quartz (Qtz) K-feldspar (Ksp)
Atomic ratios: Fe/(Fe + Mg) 0.56
A' [Al2Oa + Na20 + KzO ] 46.36 C' [CaO + 2(Na20 + K20)] 27.81 F' [FeO + MgO + MnO] 25.83
30.70 55.30 28.03 -- - 4.80 25.30 16.30 23.12 11.50 7.40 10.51 32.50 21,00 29.63 - -- 3.90
0.56 0.61
39.02 45.20 24.21 27.36 36.78 27.44
wt% SiOa TiO2 A120 3 FezOa FeO MnO MgO CaO Na20 K20 HzO
a) Bio 34.3 3.5 21.2 0.1 18.8 0.1 8.4 0.0 0.6 9.4 3.5 b) Gar 37.3 0.02 21.8 - 32.8 2.37 3.15 2.00 - - - c) Pig An 23 (optical determination by R. Schmid)
Other abbreviations:
Als -A12SiOs(Sil, Kya or And) Sil-Sillimanite Liq(L)-" granitic" melt And-Andalusite Crd -cordierite Jad-Jadeite V -HzO vapour Alb-Albite
this intersection initial dehydration melting reactions in- volve both muscovite and biotite (with garnet), At low pres- sures (below about 4 kbar) such reactions involve only bio- tite (but with cordierite): all with q u a r t z + f e l d s p a r + AlaSiO5.
Clemens and Wall (1981, Fig. 8) and Clemens (1984, Fig. 2) calculated equilibrium temperatures of about 690 ~ C at 10 kbar, for the biotite dehydration-melting reaction (2), with XMg between 0.4 and 0.6. These calculations suggest that the intersection of muscovite and biotite dehydration melting reactions (1) and (2) would occur between 7 and 8 kbar. This means that changes in the initial dehydration melting reactions in metapelites should be commonly ob- served in exhumed continental crust of normal thickness (35 kin), subject to temperature increases.
The experiments in this study, conducted at 10 kbar on the fluid-absent melting reaction (2), showed that initial melting occurred between 760 and 800 ~ C. Extrapolat ion of this result to higher pressures, indicates that two-stage dehydration-melting in metapelites seems to persist to much higher pressures (11 to 17 kbar, depending upon biotite composition). Thus fluid-absent pelite anatexis will occur in two distinct steps even in thickened continental crust. A second result is that initial melts have XVeaar > ~tfF eLiq > jt,'~ie o, such that eutectic melting of intermediate F e - - M g pelite compositions will occur before more extreme (Fe- or Mg- rich) compositions start to melt. The implications of these results will be discussed in detail following a brief presenta- tion of experimental procedures and observations.
E x p e r i m e n t a l i n v e s t i g a t i o n
The experimental results (Le Breton 1986) were obtained at 10 kbar using a NaC1 piston-cylinder assembly (Johannes 1973). Pres- sure was controlled to + / - 1 0 0 bars and temperature to + / - 1 0 percent of the quoted values. Mixtures of natural minerals from
the high-grade metapelites in the Ivrea Zone (Schmid 1971) were used, the compositions of which are given in Table 1. The individ- ual minerals were crushed, hand picked, powdered then ground together under acetone to a grain size of 10-25 gm (with some biotites up to 50 gin). Three sealed gold capsules were run simulta- neously, each containing 20-30 rag of different proportions of starting minerals (Table 1). In the first mixture biotite (Bio), kya- nite (Kya), plagioclase (Plg), and quartz (Qtz) were combined to give an "average" pelite composition. The second mixture con- tained additional biotite to provide more H20 at dehydration melt- ing. The third mixture was seeded with garnet and potash feldspar (Table 1). Because the experiments were conducted without addi- tion of excess HzO, conventional oxygen buffers could not be used. Runs were conducted at 10 kbar for 21 days at 760, 800 and 850 ~ C. Products were examined by optical microscopy, by x-ray diffraction and by scanning electron microscopy. Microprobe anal- yses were performed on the samples run at 850 ~ C, I0 kbar (Ta- bles 2, 3, 4 and 7).
In all of the run products all of the starting phases remained but in different proportions. Rutile was observed in the runs at 760 ~ C, indicating that titanium was released from the biotite, evi- dently without the formation of melt. At 800~ some melting had occurred and at 850 ~ C it was extensive, with the formation of garnet and K-feldspar in both cases.
The lack of melting at 760 ~ C, 10 kbar could indicate that melting without excess water is so sluggish as not to occur in 500 h (see below), or that the reactan~ natural assemblage was stabilised to higher temperatures than the calculated dehydration-melting curve for a simpler chemistry. The high Ti-content of the reactant biotite could be responsible for this shift as could the presence of fluorine (although less than 0.1 wt% HF, according to Schmid and Wood 1976) and oxy-biotite components. On the other hand, Luth and Boettcher (1986) found that the increase of fH~ in a coexisting H20-H2 fluid displaced the HaO-saturated solidii of al- bite, quartz and diopside to higher temperatures. Because the fH2 could not be defined in the present experiments it is not known to what extent the temperature of the solidus of interest could be affected. However, if the futile in the runs at 760 ~ C appeared through an hydrogenation reaction (e.g. see Dymek 1983), this could suggest that the NaC1 high-pressure assembly could be re- sponsible for a rather highfr h in the sample.
228
Table 2. Microprobe analyses of biotites (wt%) from the experiment at 850 ~ C - 10 kbar and calculated atomic ratios
Mixture number 1 2
Analysis number 15 87 90 96 46 70
SiOz 37.22 36.95 36.66 38.29 35.61 36.51 TiO2 4.47 4.26 4.63 4.79 4.82 5.70 A12Oa 19.52 19.36 19.56 18.59 19.11 17.94 FeO 16.82 18.23 17.37 16.6/ 16.29 16.13 MnO . . . . . . MgO 8.47 9.00 8.57 8.25 9.07 8.53 CaO . . . . . . Na20 0.73 0.67 - 0.67 - 0.73 K20 8.85 9.14 9.20 8.50 9.61 8.74 H20 a 3.91 2.39 4.01 4.29 5.49 5.72
Atomic ratios : Fe/(Fe + Mg) 0.527 0.532 0.532 0.530 0.502 0.515 A1 vl + Ti/(A1 vl + Ti + Fe + Mg) 0.25 0.22 0.25 0.26 0.24 0.24
a The given water contents are simply the difference from 100%
Despite the fact that no HzO was added to the experimental charges, fine powders easily adsorb H20 from the atmosphere or H20 and CO2 from the acetone during preparation. D. Vielzeuf and J.D. Clemens (pers. comm. December 1987) suggest that even 0.03 wt% adsorbed water could produce up to 5 vol% melt at the H20-saturated metapelite solidus. Though not observed it is therefore possible that some melting occurred through the fluid- present reaction:
Bio + Sil + Qtz +Plg + HzO--* Gar + L(melt)
(D. Vielzeuf, pers. comm., December 1987).
Microprobe analysis of crystalline phases and degree of equilibrium
Microprobe analyses obta ined for biotite, garnet, and pla- gioclase for the runs at 850 ~ C, 10 kba r were used to exam- ine the degree o f equi l ibrat ion after 21 days, with the help o f the garnet + bioti te F e - M g exchange thermometer and the garnet + plagioclase + AlzSiOs + quar tz barometer . As- pects o f the mineral analyses presented in Tables 2-4 can be summarized as follows: - Biotite is enriched in Mg, Si and Ti compared to the start ing biotite, especially in the sample seeded with K- feldspar and garnet (Table 2). - Newly grown garnet in each capsule has about the same composi t ion, and the rat io M g / F e is higher in the new gar- net than in the seeds of the third capsule (Table 3).
- Plagioclase is more albit ic ( ~ A n t s ) than the star t ing pla- gioclase (An/3) (Table 4).
F e - Mg exchange between garnet and biotite. A cross corre- lat ion can be made between the results of Kv F e - M g (gar- net-bioti te) obta ined from experiments at 850 ~ C, 10 kba r and various published cal ibrat ions o f this exchange ther- mometer . The equil ibr ium constants obta ined from the mi- c roprobe da ta corresponding to the three mixtures are shown in Table 5 together with the temperatures calculated f rom the indicated sources. The given values are averages for n pairs of garnet and biot i te (column a). The s tandard deviat ions given in columns (b) and (c) show that the vari- abi l i ty o f Ko is essentially due to var ia t ions of the garnet composi t ion and to a lesser extent of the biot i te composi-
Table 3. Microprobe analyses of garnets (wt%) from the experi- ment at 850~ - 10 kbar and calculated atomic ratios, activities and molar volumes
Mixture number 1 2 3
Analysis number 16 81 34 51
SiOz 38.63 37.87 38.93 36.82 TiO: 9.62 9.58 0.63 -- AlzO~ 21.56 21.30 21.67 21.14 FeO 31.90 32.41 31.57 33.08 MnO - - t.62 2.62 MgO 6.11 5.33 4.78 3.13 CaO 1.03 1.93 1.60 1.44
Atomic ratios:
Fe /Fe+Mg 0.745 0.773 0.787 0.856 Mn/Fe + Mg + Ca + Mn 0.000 0.000 0.037 0.062 Ca/Fe + Mg + Ca + Mn 0.030 0.056 0.044 0.043 Fe/Fe + Mg + Ca + Mn 0.723 0.730 0.721 0.766
acG, " at 850 ~ C after Newton & Haselton (1981) 0.036 0.064 0.050 0.046 Ganguly & Saxena (1984) 0.026 0.048 0.035 0.029
Partial molar volume 2.928 2.956 2.939 2.935 17 grossular (cal/bar) after Newton & Haselton (1981)
tion. The cal ibrat ions of Fer ry and Spear (1978) and of Thompson (1976, modif ied 1984) lead to better agreement with the present experimental results. I t can be seen from Table 5 that the temperatures computed with those calibra- tions that a t tempt to account for addi t ional composi t ional parameters (e.g. Ca, Mn, Ti, etc.) are all too low. Generally, the KD values are still too large when compared to those p roposed by Fer ry and Spear (1978) and Thompson (1984). This fact could be explained by Fe-loss to the gold capsules, the difference in behaviour being due to the faster Fe-diffu- sion in bioti te than in garnet, the lat ter being rate-control- ling for the a t ta inment o f F e - - Mg exchange equilibrium.
The ext rapola t ion to 850 ~ C of the diffusion coefficient,

Table 4. Microprobe analyses of plagioclase (wt%) from the experi- ment at 850 ~ C - 10 kbar and calculated X ~ , and a ~ after Newton and Haselton (1981)
Mixture number 1 2 3
Analysis number 4 29 80 88 31 45
SiO2 65.25 65.53 64.26 64.74 65.50 64.90 TiO2 . . . . . . AI2Oa 22.01 22.20 22.05 21.80 21.55 22.38 FeO - 0.54 0.64 0.61 - - MnO . . . . . . MgO . . . . . . CaO 2.88 2.73 3.64 3.28 2.48 2.99 Na20 8.35 8.59 8.31 7.37 6.38 8.52 KzO 1.68 1.66 1.49 2.08 2.86 1.01
X~, 0.16 0.15 0.20 0.20 0.18 0.17
(ae~) 850 ~ C 0.17 0.15 0.22 0.22 0.19 0.18
DtFr X 10 -12 exp [ - 1 3 2 _ 4 5 k J / R T ] mZ.s -~, p roposed by Freer (1979), and the use of the equat ion for characterist ic diffusion length (x z =4Dr) , show that after 21 days the Fe -Mg exchange equil ibrium, control led by the in t ragranular diffusion in the garnet would be only achieved by a garnet with a diameter less than 11.8 gin. However, Cygan and Lasaga (1985) have also determined self-diffu- sion coefficients for M g in na tura l pyrope garnet at 750 ~ C
229
to 900 ~ C and 2 kbar pressure, a l though the pressure correc- t ion is negligible. They note excellent agreement between the Mg-self-diffusion da ta from their study and F e - M g binary diffusion values derived from natura l zoning studies. Using their diffusion coefficient, D = 9 . 8 x 1 0 -9 exp ( - 2 3 9 kJ /RT) m2 . s -1 , it is found that only garnets with a diameter less than 1.4 gm could equil ibrate at 850 ~ C dur- ing 21 days. The garnet seeds of the start ing mixture 3 had diameters of about 10-15 gm - thus they could not have reequil ibrated in 21 days (see analysis number 51 in Table 3). The grain size of the garnets p roduced by the dehydra t ion melting react ion experiments is rather hetero- geneous (5-25 gm). The grains are also poikiloblast ic , and thus the variabi l i ty of their composi t ion obta ined by micro- probe is not surprising.
Equilibrium among garnet, plagioclase, AIESi05 and quartz. P - T displacements due to crystall ine solut ion in garnet and plagioclase from the equil ibrium:
3CaAI2Si2Os = Ca3AlzSiaO 12 + 2A12SIO5 + SiO2
have been examined by several workers. The microprobe analyses of garnet and plagioclase (Tables 3 and 4) coex- isting with A12SiOs, quartz and melt at 850 ~ C, 10 kbar can be used to test the a t ta inment of exchange equil ibrium in complex systems. I t should be noted that a l though the runs contained kyanite, the stable po lymorph at 850 ~ C, 10 kbar should be sillimanite. I t was not possible to posi- tively identify sill imanite in the charges. Vielzeuf and Hol- loway (1986, 1988) repor ted the t ransi t ion temperature of
Table 5. Temperatures (o C) calculated with various distribution coefficients of Fe and Mg between garnet and biotite for the experiment at 850 ~ C, 10 kbar
Mixture number 1 2 3
a(a) 17 = 1 (a) n = 15 (b) m = 3 (c) p = 5 (a) n = 20 (b) m = 5 (c) p = 4
~a~-Bio _XF~ a' X ~ ~ 2.627 3.043 (0.326) 3.008 (0.011) 3.037 (0.351) 3.288 (0.269) 2.994 (0.150) 3.227 (0.245) KDFo-Mg x~r X~;o
Goldman & Albee (1977) 710 665 (35) 665 (5) 665 (35) 645 (20) 670 (15) 650 (20) (KD)ssooc= 1.846
Goldman & Albee (1977) 725 675 (50) 675 (5) 670 (50) 655 (35) 695 (25) 685 (35) lnKo = f(T, XMn, Xca, XTi, XAI) Holdaway & Lee (1977) 820 770 (40) 770 (5) 770 (40) 745 (25) 775 (15) 750 (25) (KD)85ooc, lOkb~r =2.425
Ferry & Spear (1978) 935 845 (70) 845 (5) 850 (75) 800 (45) 850 (30) 810 (45) (KD)85ooc = 2.992
Thompson (1984) 905 845 (50) 845 (5) 865 (55) 810 (30) 845 (20) 815 (30) (KD)ss0~ 1 0 k b a r = 2.967
Indares & Martignole (1985) 725 675 (55) 670 (15) 690 (60) 605 (35) 645 (25) 595 (30) lnKD = f(T,P, XM.,Xc,,XTi, XA1) (19)
Indares & Martignole (1985) 785 715 (60) 715 (10) 725 (65) 640 (35) 685 (20) 640 (35) lnKD = f(T,P, Xc,,Xxi, AVA1) (18)
a Values given in the column (a) are averages of n pairs garnet-biotite (many more than given in Tables 2 and 3). An example of a mean value obtained with a single garnet and m different biotites is shown in the column (b) and an example of a mean value calculated with a single biotite combined with p different garnets is given in the column (c). Numbers in parentheses represent the estimated standard deviations

230
Table 6. Pressures (kbar) calculated with the plagioclase+garnet+AlzSiOs+quartz barometer for the experiments at 850 ~ C, 10 kbar
Mixture number 1 2 3
am= p=6 m=5 p=2 m=4 p=2
aPAt~ 0.164 (0.011) 0.226 (0.000) 0.189 (0.009) VSillimanite (cal/bar) - 1.370 1.349 (0.009) - 1.355 (0.005) VKy.nite (cal/bar - 1.647 - 1.627 (0.009) - t .633 (0.005)
Gar (a~ro)85ooc (a) 0.036 0.058 (0.007) 0.054 (0.005) Psmir~,~tte (kbar) (a) 10.7 (0.3) 11.7 (0.7) 12.1 (0.5) PKyanite (kbar) (a) 10.7 (0.3) 11.5 (0.5) 11.9 (0.4)
Ga (aar~85ooc (b) 0.026 0.043 (0.005) 0.039 (0.004) Psillimanite (kbar) (b) 9.2 (60.4) 10.1 (0.7) 10.6 (60.6) Psiulmanite (kbar) (b) 9.5 (60.3) 10.3 (0.6) 10.6 (0.5)
a Values given for each charge (1, 2 and 3) are averages, and values in parentheses represent the estimated standard deviations, m analyses of garnet were combined with p analyses of plagio- clase in each charge using more analyses than presented in Tables 3 and 4. Calculations were made for sillimanite (stable phase) and kyanite (present in the runs) using the activity models of Newton and Haselton (1981) (a) and Ganguly and Saxena (1984) (b). a ~ and A Vwere computed using the equations of Newton and Haselton (1981)
832 to 850 ~ C at 10 kbar, for kyanite to sillimanite in analo- gous experiments with a metapelitic rock. Using the micro- probe analyses and the activity models for garnet and pla- gioclase (Tables 3 and 4) from Newton and Haselton (1981) and from Ganguly and Saxena (1984), the equilibrium pres- sures were calculated from their fitted equations at 850 ~ C. The calculated equilibrium pressures given in Table 6 are averages of several values obtained for each charge. The pressures computed from Newton and Haselton's equation are higher than 10 kbar ( + 2.1 kbar to + 0.7 kbar) whereas the model of Ganguly and Saxena leads to values which lie within + 0.6 kbar to - 0 . 8 kbar of 10 kbar.
It seems from the above that the experiments at 850 ~ C 10 kbar at least, had achieved Ca-exchange equilibrium be- tween garnet and plagioclase, or were close to it, in the absence of excess HzO over a period of 21 days. The fact that this Ca-exchange equilibrium was attained whereas F e - M g exchange equilibrium between garnet and biotite was only approached, may suggest that a third phase con- taining Fe and Mg (the melt and/or the gold capsule) had influenced the distribution of these two elements.
Melt compositions produced in the bio rite dehydration-melting experiments
The microprobe analyses of the glasses produced by the dehydration melting of biotite + plagioclase+ kyanite + quartz at 850 ~ C, 10 kbar can be used to examine the miner- al-melt reactions at dehydration melting. They indicate that x - G a r .~. y L i q ,~ y B i o
Fe / ~ x Fe f ~x Fe a n d t h a t t h e liquids a r e m o r e a l u m i n o u s
than either biotite or garnet (Figures 1 and 2). These obser- vations are consistent with those obtained by Green (1976) for experimental runs on a synthetic pelite compositions with 2 or 5 wt% added H20 (see Figure 1) and by Clemens and Wall (1981, p. 119) on S-type volcanics and plutonics. Green (1977) observed that the F e - M g partition between garnet and melt underwent reversal with increasing temper- ature. This effect has been documented in a wider range of compositions by Ellis (1986, Figure 3), whose experi-
ments indicated that lnKnFeMg goes through zero at about 900 ~ C. The relation between KD and temperature deduced from the experiments of Green (1977) and Ellis (1986), can be used together with the microprobe analyses of glass and garnet from the present run at 850 ~ C-10 kbar, to calculate apparent temperatures. The averages for each charge are given in Table 8 together with the estimated standard devia- tions. The Ko values are high compared to the values given by Green and Ellis at 850 ~ C, or conversely, apparent tem- peratures are too low by as much as 115 ~ C. The standard deviations from columns (b) and (c) in Table 8 show that the variability of Ko is due more to variations of the glass compositions than to variations of the garnet compositions. These observations could be explained by a greater Fe-loss to the gold capsules for the glass than for the garnet because of the difference in the Fe-diffusion rates for each of these phases.
Although the microprobe analyses obtained on the glasses (Table 7, Figs. I and 2) from the runs at 850 ~ C, 10 kbar show considerable scatter (due mainly to overlap- ping biotite with glass in the probe mount), the glasses are clearly peraluminous and plot in the vicinity of the feldspar + cordierite tie-line in Figs. 1 and 2. In order for these figures to be thermodynamically valid it must be as- sumed that the quantities of initial melt are very small and are close to HzO-saturation.
It is important to consider whether these initial melt compositions (and consequent physical properties) vary much with pressure, or with aH20 along the region of the dehydration-melting solidii, and how they will evolve with increasing temperature at any particular pressure.
Pelite dehydration melting sequences at various pressures
As noted above, the fluid-absent melting history of metape- lites is controlled by the melting rections involving musco- vite and biotite (Burnham 1967). It is therefore important to determine under which conditions the micas undergo dehydration-melting together or sequentially.

Table 7. Microprobe analyses of the glass (wt%) from the experiment at 850 ~ C - t0 kbar
231
Mixture number 1 2
Analysis number 11 30 85 89 92 95 33 44 54
SiO2 76.79 72.07 66.97 56.40 61.21 62.54 60.41 80.82 62.96 TiO2 0.68 1.34 0.49 1,31 0.81 1.50 0.91 0.47 0.96 A1203 9.94 11.32 14.29 22.27 16.94 15.17 22.19 9.36 19.77 FeO 3.24 4.34 1.86 5.01 3.32 5.14 5.06 3.26 3.10 MnO . . . . . . . . . MgO 1.27 2.34 0.68 1.87 1.42 2.14 1.48 1.36 1.18 CaO 0.58 - 0.50 0.36 0.78 0.43 0.92 - 1.91 NazO 1.83 1.02 1.33 1.47 2.28 0,86 3.20 1.21 4.32 K20 2.65 3.58 4.11 4.71 4.64 4.39 3.63 2.22 2.92 Sum 96.99 96.02 90.23 93.40 91.40 92.16 97.80 98.71 97.12
Fe/(Fe + Mg) 0.60 0.52 0.67 0.60 0.58 0.58 0.68 0.57 0.61
A' [AlzO3 + Na20 + KzO ] 43.40 42.11 53.00 51.97 48.53 45.24 50.33 44.93 48.90 C' [CaO + 2(Na20 + K20)] 35,20 27.73 35.95 27.39 35.80 27.77 32.16 28.69 39.09 F' [FeO +MgO + MnO] 21.40 30.16 11.05 20.64 15.67 26.99 17.50 26.38 12.01
Table 8. Temperatures (o C) calculated with the coefficient of distribution of Fe and Mg between garnet and glass for the experiment at 850 ~ C, 10 kbar
Mixture number 1 2 3
a(a) n=2 (a) n=20 (b) m=4 (c) p = 5 (a) n=12 (b) m=3 (c) p = 4
Gar Liq
k'~,r-L~q X F e .Xv, 2.322 (0.516) 2.235 (0.391) 1.859 (0.289) 1.725 (0.200) 1.601 (0.309) 1.621 (0.362) 1.605 (0.061) l X D F e - M g - - ~ G a r v L i q ~ t M g ~XF e
Green (1977) 750 (50) 760 (40) 800 (40) 815 (30) 840 (50) 835 (55) 830 (10) (KD)85o~ lOkb,r = 1.761
Ellis (1986) 735 (45) 745 (40) 780 (35) 795 (25) 815 (45) 815 (55) 810 (10) (KD)sso~ lOkb,r = 1.360
a Values given in the column (a) are averages of n pairs garnet-glass. An example of a mean value obtained with a single garnet and m different glass analyses is shown in the column (b) and an example of a mean value calculated with a single glass analysis combined with p different garnets is given in the column (c). Numbers in parentheses represent the estimated standard deviations
Muscovite dehydration-melting reactions
Shown in Figs. 3 and 4 are the experimental results for dehydration melting in the system KzO + N a 2 0 + AIEO~ + SiOa + H 2 0 (Pet6 and Thompson 1974; Pet6 1976) for the reaction (1), with albite. A reaction interval for (1) is shown in Fig. 3 to allow for phengite substitution in muscovite with eventual biotite saturation (Thompson 1982), and pla- gioclase substitution. Although the width of the reaction interval is not known for all ranges of A12Fm-IS i_I , FeMg 1 and NaSiCa_ ~ AI_ a substitutions, the P - T region for these complex reactions is somewhat constrained, with distinctly positive dP/dT to at least 20 kbar. The " d r y soli- dus" o f a muscovite-granite reported by Huang and Wyllie (1973, 1981) lies within the indicated reaction interval.
Biotite dehydration-melting reactions
The present results on dehydration melting of biotite ac- cording to the reaction 2 (or reaction 48 without plagioclase in Thompson 1982) apply to the P - Tregion where musco- vite has already undergone dehydration melting.
Calculated P-Tlocat ions (Fig. 3) for reaction (2) by Cle- mens and Wall (1982, Fig. 8) and by Clemens (1984, Fig. 2)
showed a change in dP/dT, with A V going from positive to negative, in the range 3 to 4 kbar depending upon XFo. The method of calculation follows Burnham (1967, p. 62, 1979, p. 98) and Kerrick (1972), where the P - T displace- ments of the appropriate H20-saturated solidus and of the subsolidus dehydration curve due to lowered a H 2 0 are computed, and the dehydration-melting curves is then given by the locus of equal aHaO for both reactions.
As noted above, the calculated backbending of the dehy- dration-melting curve (Clemens 1984, Fig. 2) with J(ve in garnet and biotite and J(An in plagioclase close to those o f the present experiments, results in an equilibrium temper- ature of about 690 ~ C at 10 kbar compared to the inference from the present experiments that melting occurred only between 760 ~ and 800 ~ C. Relative to the calculated inter- section of the metastable dehydration curve (involving Bio, Sil, Qtz, Plg, Gar, Ksp, HzO) and the appropriate HzO- saturated solidus near 1.2 kbar and 720~ by Clemens (1984, Fig. 2), the present results (Fig. 3) imply a positive Clapeyron slope to at least 10 kbar for the dehydration melting reaction (2), ignoring the cordierite reactions which become significant in the lower pressure range.
One possible way in which the subsolidus assemblage

232
AI203+Na20+K20 20 Sill KyQ
0.*
Mus, 16
PIg(Ab / C-~ q ,~Or , .___ I ~ . . . . . . . Crd
Ksp An ~-- --- y o ~.1 12 [ ~/ "" ..,.'~.~..~ o 2,.3 kk / ~ -,- ~ ~l \
x "-. ( ~ x " --. 10
CoO / ~" "" ~" "" " -.. \ FeO 8 + 2Na20 ~ " ' - . . ~ +MoO + 2 K 2 0 / " \ . ~+MnO 6
�9 upx
Fig, l. An ACF-deluxe projection showing the starting composi- tions and microprobe data for the phases at 850 ~ C, 10 kbar. Note that biotite and glass are "illegally" plotted in this projection from quartz and H20, and that the glass compositions show a range due to overlap with biotite in the experimental charge. The phase compositions obtained are shown by different symbols correspond- ing to starting mixtures (D-Mix 1; o-Mix2; A-Mix 3). Mixture compositions are shown by numbered stars
AI203 - (K20+Na20)
Fe ldspar Quartz, H20
FeO 50 MoO
Fig. 2. AFM diagram showing the relative compositions of the phases, although projected illegally. They are compared to the aver- aged results of Green (1976) at 820 ~ C and 860 ~ C for the melting of a synthetic pelite (bulk composition at G*) with 5 wt% added H20 at 10 kbar. Both sets of experiments show that Xve >
Liq Bio X~ > X~o and that the melts are strongly peraluminous
(Bio + Als + P l g + Qtz) may be stabilised to higher tempera- tures, is by Ti- and F-substitution in biotite. As noted above and in Table 2 the Ti-content is higher in the analysed bio- tites from the runs at 850 ~ C, 10 kbar compared to the starting natural biotite, indicating that continuous reactions have concentrated Ti-components in the biotite with in- creasing temperature. Forbes and Flower (1974) have shown experimentally that the thermal stability of Ti-bear- ing phlogopite is increased markedly over Ti-free phlogo-
0 600 700 800 T oC 900
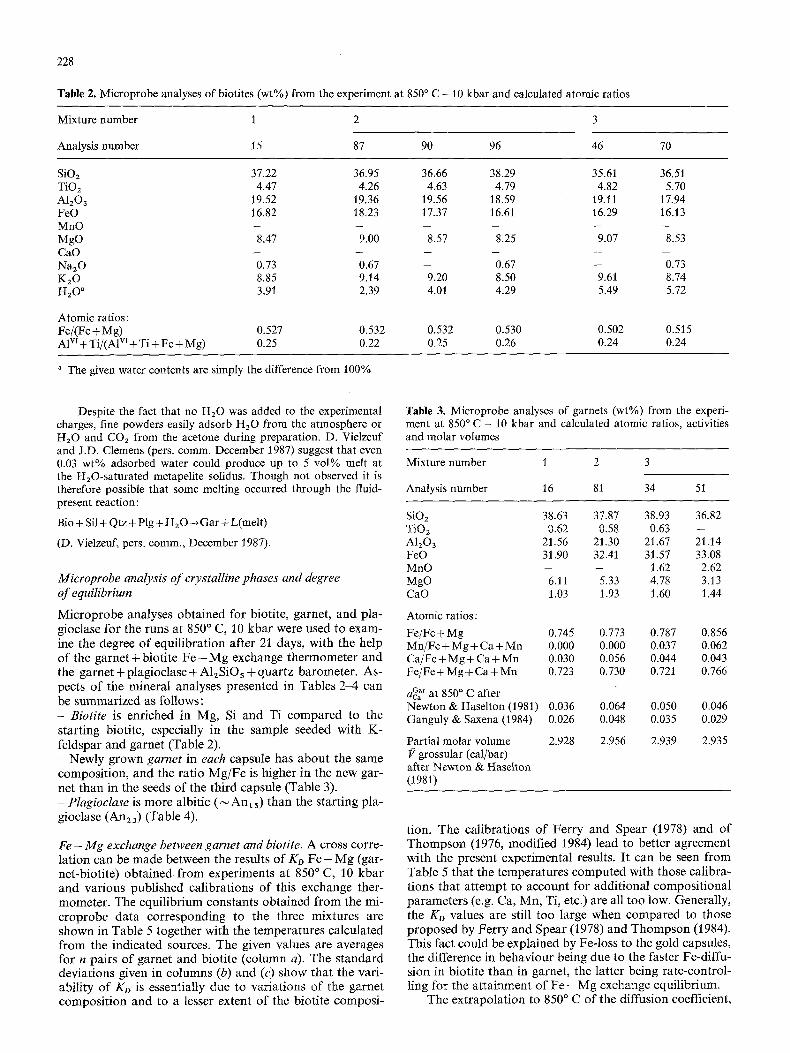
Fig. 3. Pressure-temperature diagram showing the results of dehy- dration melting of biotite in metapelites compared to muscovite dehydration melting (Pet6 1976); the H20-saturated metapelite so- lidus (Thompson 1982) and A12SiO5 phase relations (Richardson et al. 1969). The present results of biotite melting at 10 kbar be- tween 760 ~ C and 800 ~ C indicate intersection with muscovite melt- ing within box A - in the field of kyanite migmatites. The calculated backbending of biotite melting (Clemens 1984) intersects muscovite melting (box B) at pressures in the vicinity of the kyanite-sillimanite transition. The lower pressure stability of Fe-garnet +AlzSiOs + quartz relative to Fe-cordierite is shown (Richardson 1968; Weis- brod 1973) as are the biotite sides (XM~ =0.4, 0.6) of the continuous reaction with muscovite, garnet, A12SiOh, quartz (Thompson 1982, Fig. 6)
pite. A similar effect has been proposed by Manning and Pichavant (1983) when residual biotite becomes progres- sively enriched in F as melting proceeds, thus stabilising the biotite to higher temperatures.
The increased thermal stability o f natural biotites con- taining Ti and F compared to those in simplified systems has some important consequences for petrogenetic grids, especially those parts of such grids involving H20-undersa- turated melts. As implied by the partial grids of Clemens and Wall (1981), Clemens (1984) and the more extensive grids o f Thompson (1982), Vielzeuf and Boivin (1984) and Grant (1985a, b), very few of the early dehydration melting reactions appear to have negative dP/dT. The presence of Ti and F in natural mica will tend to displace any potential backbending to much higher pressures (Fig. 3) than implied by the Clemens and Wall (1981) calculations. This means that we can reexamine the early dehydration melting reac- tions in distinct pressure ranges to investigate the implica- tions for melt composition and restite mineralogy.
Consequences for petrogenetic grids
The P-- T region for the dehydration melting reaction (2) inferred from the present results intersects the muscovite
233
reaction interval somewhere within box A in Figure 3, whereas the calculated result by Clemens (1984, Fig. 2) in- tersects somewhere within box B in Fig. 3. Thus the present interpretation involves sequential dehydration melting of first muscovite followed by biotite from about 4 to 11-17 kbar depending upon biotite composition. Clemens' calcu- lation implies a range from about 4 to 6.5-9 kbar. The effect should be observable in field studies of appropriate migmatites as box A lies clearly in the kyanite field and box B lies across the kyanite-sillimanite equilibrium (data from Richardson et al. 1969). In any case, reactions (1) and (2) will refract to lower values of dP/dT at the kyanite- sillimanite reaction.
It should be noted in any case that the garnet is metasta- ble relative to cordierite in the presence of A12SiO5 and quartz at pressures below 3 to 4 kbar. Also, shown in Fig. 3 is Thompson's (1976b, Figs. 2 and 3) interpretation of the experimental results of Richardson (1968) and Weisbrod (1973) for the Fe-end member reaction. At such low pres- sures however, muscovite cannot be involved in dehydra- tion-melting because the muscovite dehydrates by multi- component reactions that occur at even lower temperatures than the inferred H20-saturated solidus for metapelites.
At pressures higher than the intersection regions of mus- covite and biotite dehydration-melting reactions in Fig. 3 (boxes A or B, as discussed above), both micas will undergo simultaneous dehydration-melting together through
Bio + Mus +Plg + Q tz~ Gar + Ksp + L (3).
This complex continuous reaction is similar to the plagio- clase-free version sketched by Thompson (1982, Fig. 6b, reaction 49). It is also compatible with the experimental results of Huang and Wyllie (1973, p. 6) on melting of muscovite-granite, but without biotite, from 10 to 35 kbar pressures. In rocks with more muscovite than biotite, reac- tion (3) is followed by the dehydration-melting of muscovite to garnet assemblages, though apparently in the P-T field of kyanite-migmatites. This intersection region in box A is also consistent with the beginning of the reaction interval for:
Bio(xM~ = 0.6) + Als + Qtz = Gar + Mus + (HzO)
obtained with reference to the location of the Fe and Mg end-member reactions presented by Thompson (1982, Figs. 6A and B). This F e - M g continuous reaction is H20- conserving only when the micas are stoichiometric, or where both have equal K/OH ratios.
Although involving extrapolation to higher pressures, the present results and those of Vielzeuf and Holloway (1988) indicate that metapelites will undergo a two-stage dehydration melting sequence in thickened as well as un- thickened continental crust. In Central Massachusetts, USA, distinct migmatite styles are described at slightly dif- ferent metamorphic grades. Tracy and Robinson (1983) and Tracy (1985) have ascribed stromatic migmatites at slightly lower grade to fluid absent melting of muscovite, and nebu- litic migmatites at slightly higher grade to biotite dehydra- tion melting. They relate this to different PT paths of melt- ing (paths B and C in Fig. 4, respectively) rather than to attainment of different temperatures during isobaric melt- ing (eg. path A in Fig. 4).
The two-stage dehydration-melting sequence should thus be observable in kyanite-migrnatites as well as kyanite- sillimanite transitional migmatites. However, at higher pres-
t ~
o_"
15
10
500 700 900 1100 T, *C
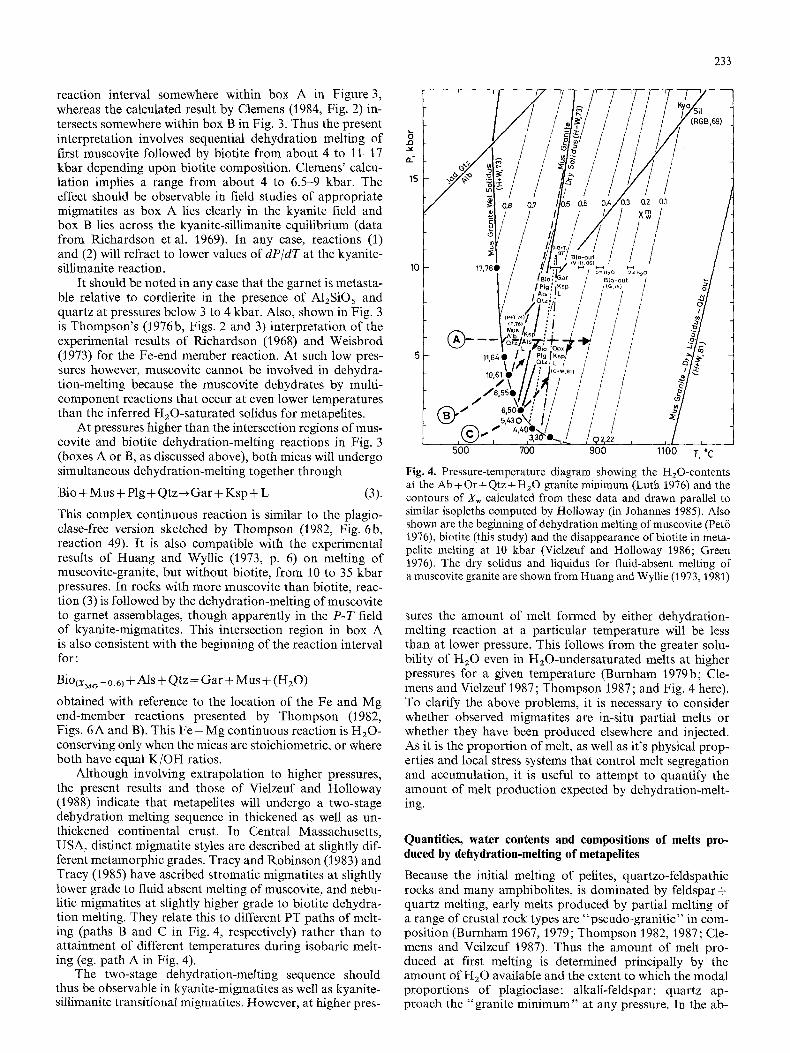
Fig. 4. Pressure-temperature diagram showing the H20-contents at the Ab + Or + Qtz + H20 granite minimum (Luth 1976) and the contours of Xw calculated from these data and drawn parallel to similar isopleths computed by Holloway (in Johannes ~985). Also shown are the beginning of dehydration melting of muscovite (Pet6 1976), biotite (this study) and the disappearance of biotite in meta- pelite melting at 10 kbar (Vielzeuf and Holloway 1986; Green 1976). The dry solidus and liquidus for fluid-absent melting of a muscovite granite are shown from Huang and Wyllie (1973, 1981)
sures the amount of melt formed by either dehydration- melting reaction at a particular temperature will be less than at lower pressure. This follows from the greater solu- bility of H20 even in H20-undersaturated melts at higher pressures for a given temperature (Burnham 1979b; Cle- mens and Vielzeuf 1987; Thompson 1987; and Fig. 4 here). To clarify the above problems, it is necessary to consider whether observed migmatites are in-situ partial melts or whether they have been produced elsewhere and injected. As it is the proportion of melt, as well as it's physical prop- erties and local stress systems that control melt segregation and accumulation, it is useful to attempt to quantify the amount of melt production expected by dehydration-melt- ing.
Quantities, water contents and compositions of melts pro- duced by dehydration-melting of metapelites
Because the initial melting of pelites, quartzo-feldspathic rocks and many amphibolites, is dominated by feldspar + quartz melting, early melts produced by partial melting of a range of crustal rock types are "pseudo-granitic" in com- position (Burnham 1967, 1979; Thompson 1982, 1987; Cle- mens and Veilzeuf 1987). Thus the amount of melt pro- duced at first melting is determined principally by the amount of H20 available and the extent to which the modal proportions of plagioclase: alkali-feldspar: quartz ap- proach the "granite minimum" at any pressure. In the ab-

234
sence of a free fluid phase the degree of melting is directly proportional to the amount of hydrous minerals and the temperatures at which, or over which, the dehydration- melting reactions occur, at any particular pressure. It is useful to investigate first, how the amount of a hydrous mineral influences the proportion of "pseudo-granitic" melt generated; and second, how additional melt compo- nents become dissolved in the melt, and influence its physi- cal properties, as functions of source rock composition, temperature, pressure and aHzO.
Melt quantities determined by available 1410
It is possible, following the methods of Burnham (:1967, p. 68; 1979, p. 98 - see also Clemens 1984; Clemens and Vielzeuf 1987) to estimate the HzO contents of "pseudo- granitic" melts at any pressure and temperature. Values of X~ (mol. fraction of H20 in the melt) at H20 saturation at the A b + Q r + Q t z minimum have been calculated (Thompson 1987), from the weight% data summarised by Luth (1976, Table 1), on the molar basis NaA1SiaOs :KA1- Si3Os: c~SiSi3Os:H20. The numbers at the HzO-saturated solidus in Fig. 4 represent first weight%, then tool% H20 (calculated for molar weight of melt = 260 gin; Burnham :1982). They have been extended into the HzO-undersatur- ated region simply by drawing them parallel to similar con- tours calculated by J.R. Holloway (personal communica- tion to Johannes 1985, p. 41). The slopes are close to those calculated for 2"~ for albite-melt (H20-undersaturated) by Burnham (:1979b, p. 460). Although the array will be dis- placed due to departures of the melt-compositions from Ab + Or + Qtz in natural pelitic migmatites, the information in Fig. 4 is sufficient to examine the H20 contents of the initial H20-undersaturated melts produced by dehydration- melting of mica.
In the present experiments, biotite dehydration-melting according to reaction (2) began between 760 ~ C and 800 ~ C (say 780 ~ C) at :10 kbar. This corresponds to X ~ 0 . 5 5 or about 7.8 wt%. The water contents of phlogopite (:18.0:15/4:17.262) and annite (:18.0:15/51:1.89:1) correspond to about 4.3 and 3.5 wt%, respectively. Thus a value of about 4 wt% HzO is appropriate for an intermediate F e - M g biotite. Hence, if all of the biotite in each of the experimen- tal starting mixtures underwent complete dehydration melt- ing at 780~ the following maximum amounts of melt would be produced:
Mixture I 3:1 wt% biotite :1.24 wt% H20
15.9 wt% melt 21 vol% melt
55.3 wt% biotite 2.21 wt% H20
28.3 wt% melt 35 vol% melt
28.03 wt% biotite :1.12 wt% H20
14.35 wt% melt :19 vol% melt
The last column shows appropriate vol% melt calculated for melt density=2200 Kgm -3 and restite density=3000 Kgm-3 (Clemens and Vielzeuf :1987) and can be directly compared with their :10 kbar graph for metapelite melt pro- duction (their Fig. 4). The amount of biotite in each starting mixture released more than enough KA1Si3Os to achieve granite minimum proportions and appeared as excess K- feldspar.
Because of continuous reactions between the minerals
and the melt, the melting interval is quite large for biotite dehydration melting. For example, Vielzeuf and Holloway (/986, :1988) report biotite disappearance between 850~ and 862 ~ C (say 860 ~ C) for fluid-absent melting of a pelite at :10 kbar, whereas Green (:1976) reports mica to 980~ and 900 ~ C for pelite melting at :10 kbar with 2 wt% and 5 wt% H20 respectively. Thus, were the biotite dehydra- tion-melting reaction to take place at 860 ~ C in accordance with the observations of Vielzeuf and Holloway (1986, :1988), then, for the mixtures of the present study, the fol- lowing amounts of melt would be produced at 860 ~ C, :10 kbar (X~=0.44 and for gfw melt---260, the weight% dis- solved in melt is 5.:1%)
Mixture :1 :1.24 wt% HzO 24.3 wt% melt 30 vol% melt 2 2.2:1 wt% HzO 43.3 wt% melt 51 vol% melt 3 1.:12 wt% H20 2:1.9 wt% melt 28 vol% melt
These calculated examples show the maximum propor- tions of melt to be expected for dehydration-melting reac- tions spread out over a temperature interval through crys- talline solution. They show further the amount of hydrous mineral in the protolith needed to generate more melt than the rheological critical melt percentage (RCMP) for segre- gation. At melt fractions higher than about 25% by volume, segregation and migration of even these high-viscosity water-undersaturated felsic melts are considered likely (Arzi :1978; Van der Molen and Paterson :1979; Wickham :1987). If melt migration has occurred then mineralogical and geo- chemical correlations between leucosomes and melano- somes in migmatites become more uncertain.
The above calculations indicate that complete dehydra- tion-melting of biotite-bearing metapelites at 780 ~ C, would only generate more than 25 vol% melt if at least 40 wt% biotite reacted. If complete melting occurred at 860 ~ C then 25 wt% biotite would produce 25 vol% melt. These simple considerations show how small variations in the amount of mica and the temperature of melting influence the melt proportion (see also Wickham 1987, Fig. 10).
As muscovite dehydration-melting reactions occur at lower temperatures than biotite melting (Fig. 3), the amount of melt produced would be proportionately less because of the higher water contents of H20-undersatur- ated melts buffered by dehydration-melting at lower tem- peratures (Fig. 4).
Melt quantity in the run products
To determine the melt proportions in the run products, several methods were combined to minimize the uncertain- ties inherent in each of them. First a mass balance was attempted, using FeO, MgO and TiO2, as these elements occur only in biotite, garnet and glass. However, because of the poor quality of the glass analyses (overlapping with biotite) and because of other analytical uncertainties, this method cannot be used alone. It has been combined with a partial modal analysis using scanning electron microscope (SEM) photographs. This modal analysis involves garnet and biotite, the only two phases which could be definitely identified. To refine the results, a rough estimation of the water content of the melt (5.1% at 860 ~ C, 10 kbar, see above) was used. The result of these combined calculations leads to the following proportions (wt%) in the products of the dehydration-melting reaction at 860 ~ C, 10 kbar (the initial proportions are shown in parentheses):

235
weight% Bio Gar L Mix 1 22.8 (30.7) 5.5 6.3
2 34.4 (53.3) 12.1 16.5 3 20.3 (28.0) 12.0 (4.8) 6.1
Plg Ksp Als Q 23.8 (25.3) 1.8 12.5 (11.5) 26.4 (32.5) 12.2 (16.3) 4.9 6.2 (7.4) 12.6 (21.0) 21.5 (23.1) 4.4 (3.1) 10.3 (10.5) 24.9 (29.6)
The amounts of melt apparent in these mass-balance calcu- lations are clearly less than those deduced from available H20 from total decomposition of biotite. This is to be ex- pected as Ti in biotite would extend the dehydration-melt- ing temperature intervals of biotite reactions.
Once biotite has completely reacted (the temperature of which varies in different studies, Fig. 4), the amount of melt will only slowly increase with further temperature increase until the liquidus appropriate to the rock composi- tion and it's initial water content, is reached (e.g. Huang and Wyllie 1981, Fig. 6). Thus to achieve a RCMP of 25 vol%, rocks with less than about 25 wt% mica, will need to reach temperatures in excess of those required for com- plete dehydration-melting, to enable segregation to form migmatites, or separation to form granites.
Fluid-absent melting in the generation of migmatites and the chemical and physical evolution of anatectic granitic liquids
Any free water present in rocks containing feldspar and quartz will cause some H20-saturated melting at the appro- priate solidi. As illustrated for the Ab + Or + Qz + H20 soli- dus in Fig. 4, more H20 is needed to saturate melts at higher pressure. Thus, for a given amount of free H20, melt production is greater at lower pressure. This means that unless amounts of free water in the lower crust are unusually large, the proportions of H:O-saturated melts will always be small (especially at deeper crustal levels) and will probably freeze in-situ. As discussed above for HzO held only in hydrous minerals, the amount of initial melt is controlled by the amount of muscovite and biotite, and by the width of the temperature interval over which dehy- dration-melting occurs (which influences the buffered value of aH20 in the melt in equilibrium with the hydrous-anhy- drous mineral buffer assemblage (Figs. 3 and 4)).
The significance of the rheological critical melt percent- age (RCMP) in determining at which volume percent of melt segregation can occur, is not well understood (see Jur- ewicz and Watson 1985). This is still especially problemati- cal in extrapolating laboratory data obtained under hydro- static conditions in short term experiments to deformed migmatite terrains. Once a melt produced by a major dehy- dration-melting event has been extracted, the source rocks become relatively "infertile" to further melt extraction (Clemens and Vielzeuf 1987). Further melt production can only occur by influx of external H20 or by the attainment of very high temperatures. Thompson (1987) has pointed out that a "p i t " on the liquidus exists in temperature-com- position space close to the pseudo-granitic composition of anatectic liquids, such that the melt proportion is invariably small up to about 1000 ~ C. These melts do not have viscosit- ies or densities as low as those of H20-saturated granitic melts and also contain other dissolved components. The amounts of dissolved CaO and AlaOa (in excess of feldspar) and of FeO and MgO, will increase at higher temperature and also cause systematic changes of these physical proper- ties. Extensive studies are needed to uncover these systemat-
ic relationships between these physical properties and melt chemistry at elevated temperature and pressure.
The present study points to several sets of field observa- tions that can be made in migmatite terrains, principally to decide whether certain features reflect different pressure- temperature-time histories across a high-grade metamor- phic terrain or local features inherent to the fluid-absent melting reactions. If both muscovite and biotite dehydra- tion-melting curves have positive dP/dT, even in thickened continental crust, then decompression melting (in the sense of Thompson and Tracy 1979) should be common in ex- humed migmatite terrains. A negative dP/dT for the biotite dehydration-melting, as proposed by Clemens and Wall (1981), would cause the melts to freeze at depth.
Further examination of distinct migmatite types in one metamorphic terrain (such as the stromatic migmatites at slightly lower grade than the nebulitic migmatites, described by Tracy (1985)) from Central Massachusetts could indicate the importance of melt proportion on the theology of partly-molten rock. With a knowledge of the likely H20- contents of such partial melts at a given pressure and tem- perature, it might be possible by new observations in mig- matite terrains, to distinguish among the relative impor- tance of melt fraction, melt density and viscosity, and role of deformation in the extraction o f " granite" liquids. One current view (Thompson 1987; Clemens and Vielzeuf 1987) is that some migmatites are unsuccessful granites. Studies of the chemistry and textures within leucosomes, and the relation and proportion of leucosome to restite, may yield information on the criteria that need to be met to permit massive melt extraction to form intrusives.
Detailed mineralogical and textural studies on migma- tites at different metamorphic grades and pressures, are needed to understand the significance of the experimental observation that vGa~-., vLiq-~ VBio AS noted above, the ~ " F e f d ~ F e f ~x F e "
present results obtained in fluid-absent melting experi- ments, support the experiments made with excess H20 by Green (1976, 1977), Clemens and Wall (1981) and Ellis (1986). It remains to be further demonstrated, from obser- vations on migmatites, that this result rv~,r-.vL~q~ does \ ~ x F e / " ~ " F e t
not reflect sluggish reaction kinetics or restricted diffusion at the lower temperatures of some experiments (Ellis 1986). The way in which this observation could influence pelite melting reactions, after the disappearance of muscovite, has been discussed by Grant (1985, Figs. 3.21 and 3.22) and by Ellis (1986, Figs. 6, 7, and 8). From the topology shown in the AFM projection in Figure 2 here, or in the HaO-FeO- MgO projection presented by Thompson (1982, Fig. 7), ini- tial melting would occur eutectically by a reaction among Bio, Gar, Als, Qtz, Ksp, Plg and H20 to form melt. The petrogenetic grids of Abbott and Clarke (1979) and Thomp- son (1982), assumed that vL~q...vo,r, in which case the
x x F e / - x x F e
equivalent melting reaction would have been peritectic:
Gar + Als + Ksp + Pig + Qtz + H:O ~ Bio + L.
With ~.VO"rFe ~'~ ~.vL~qve ~" ~.VB~~ intermediate Fe-Mg compositions would melt before Fe-richer or Mg-richer rocks; whereas

236
with "v-Liq'~" y G a r initial melting would begin in Fe-r ich " t Fe f ~x Fe ,
composit ions. A change in the relative Xw of garnet and melt, which occurs near to 900 ~ C according to Ellis (1986, Fig. 3), could induce bioti te to change from peritectic to eutectic react ion with the melt during cooling. I t would therefore be o f interest, to determine the relative tempera- ture o f format ion of pelit ic migmati tes with and wi thout biot i te selvedges, and to consider further the apparen t re- f ractory nature o f biot i te in some restites.
This s tudy has focused on the dehydra t ion-mel t ing reac- t ions that have occurred early in the format ion of some migmatites. Detai led studies in higher-grade migmat i te ter- rains are clearly desirable to unders tand the advanced melt- ing reactions involving cordierite, hypersthene, or more ex- otic minerals such as sapphir ine and osumilite. Also careful mineralogical , chemical and textural observat ions in mig- mat i te terrains that preserve the biot i te dehydra t ion melting reactions are needed, to reveal any detai led correla t ion be- tween melt chemistry and physical propert ies. In par t icular ,
l , ~ G a r -~. "fr-Liq v B i o could be as to whether early melts with ~v~ / . , w > ~ F~ more easily extracted than later melts. Such a composi t ional effect on the density o f "g r an i t i c " anatectic liquids could be considered analogous to the F e - M g composi t ional "win- dow of erupt ib i l i ty" of basat ts (Sparks et ai. 1980; Stolper and Walke r 1980).
Acknowledgements. We wish to thank Rolf Schmid for help in the experiments. The manuscript has benefitted considerably from reviews and comments of David J. Ellis, Trevor H. Green and especially Daniel Vielzeuf and John D. Clemens. We thank the ETH and the Schweizerische Nationalfonds for support and Bar- bara Ritter and Ursula Stidwill for typing and Brigitt Bfihlmann for drafting.
References
Abbott RN Jr, Clarke DB (1979) Hypothetical liquidus relation- ships in the subsystem A 1 2 0 3 - F e O - M g O projected from quartz, alkali-feldspar and plagioclase for a (H20)< l . Can Mineral 17: 549-560
Arzi AA (1978) Critical phenomena in the rheology of partially melted rocks. Tectonophysics 44:173-184
Ashworth JR (ed) (1985) Migrnatites, Blackie, Glasgow Bohlen SR, Boettcher AL, Wall VJ, Clemens JD (1983) Stability
of phlogopite-quartz and sanidine-quartz: a model for melting in the lower crust. Contrib Mineral Petrol 83 : 270-277
Brown GC, Fyfe WS (1970) The production of granitic melts dur- ing ultrametamorphism. Contrib Mineral Petrol 28 : 310-318
Burnham CW (1967) Hydrothermal fluids at the magmatic stage. In: Barnes HL (ed) Geochemistry of hydrothermal ore deposits. Holt, Reinhart and Winston, New York, pp 38-76
Burnham CW (1979a) Magmas and hydrothermal fluids. In: Barnes HL (ed) Geochemistry of hydrothermal ore deposits. 2nd ed Wiley Interscience, New York, pp 71-136
Burnham CW (1979b) The importance of volatile constituents. In: Yoder HS (ed) The evolution of the igneous rocks. Fiftieth Anniversary Perspectives. Princeton University Press, Prince- ton, pp 439482
Burnham CW (1982) The nature of multicomponent aluminosili- cate melts. In: Rickard D, Wickman FE (eds), Chemistry and geochemistry of solutions at high temperatures and pressures. Pergamon Press, Oxford, pp 197-229
Clemens JD (1984) Water contents of silicic to intermediate mag- mas. Lithos 17: 273-287
Clemens JD, Vielzeuf D (1987) Constraints on melting and magma production in the crust. Earth Planet Sci Letts 86:287-306
Clemens JD, Wall VJ (1981) Origin and crystallization of some
peraluminous (S-type) granitic magmas. Can Mineral 19:111-131
Cygan RT, Lasaga AC (1985) Self diffusion of magnesium in gar- net at 750 ~ to 900 ~ C. Am J Sei 285:328-350
Dymek RF (1983) Titanium, aluminium and interlayer cation sub- stitutions in biotite from high-grade gneisses, West Greenland. Am Miner 68: 880-899
Ellis DJ (1986) Garnet-liquid Fe 2 + - M g equilibria and implica- tions for the beginning of melting in the crust and subduction zones. Am J Sci 286:765-791
Ferry JM, Spear FS (1978) experimental calibration of the parti- tioning of Fe and Mg between biotite and garnet. Contrib Min- eral Petrol 66:113-117
Forbes WC, Flower MFJ (1974) Phase relations of titan-phlogo- pite, KzMg4TiA12Si6Ozo(OH)4 : a refractory phase in the upper mantle? Earth Planet Sci Letts 22:60-66
Freer R (1979) An experimental measurement of cation diffusion in almandine garnet. Nature 280:220-222
Ganguly J, Saxena SK (1984) Mixing properties of alumino-silicate garnets: constraints from natural and experimental data, and applications to geothermo-barometry. Am Mineral 69:88-97
Goldman DS, Albee AL (1977) Correlation of Mg/Fe partitioning between garnet and biotite with 1so/~60 partitioning between quartz and magnetite. Am J Sci 227: 750-767
Grant JA (1985a) Phase equilibria in low-pressure partial melting of pelitic rocks. Amer J Sci 285:409435
Grant JA (1985b) Phase equilibria in partial melting of pelitic rocks. In : Ashworth JR (ed) Migmatites. Glasgow, Blackie and Son, Glasgow, pp 86-144
Green TH (1976) Experimental generation of cordierite- or garnet- bearing granitic liquids from a pelitic composition. Geology 4:85-88
Green TH (1977) Garnet in silicic liquids and its possible use as a P-T indicator. Contrib Mineral Petrol 65:59-67
Holdaway M J, Lee SM (1977) Fe-Mg cordierite stability in high- grade pelitic rocks based on experimental, theoretical, and natu- ral observations. Contrib Mineral Petrol 63:175-198
Huang WL, Wyllie PJ (1973) Melting relations of muscovite-gran- ite to 35 kbar as a model for fusion of metamorphosed sub- ducted oceanic sediments. Contrib Mineral Petrol 42:1-14
Huang WL, Wyllie PJ (1975) Melting reactions in the system NaA1- Si3Os-KA1Si3Os-SiO2 to 35 kbars, dry and with excess water. J Geol 83:737-748
Huang WL, Wyllie PJ (1981) Phase relationship of S-type granite with H20 to 35 kbar: Muscovite granite from Harney Peak, South Dakota. J Geophys Res 86:1015-1029
Indares A, Martignole J (1985) Biotite-garnet geothermometry in the granulite facies: the influence of Ti and AI in biotite. Am Miner 70 : 272-278
Johannes W (1973) Eine vereinfachte Piston-Zylinder-Apparatur hoher Genauigkeit. Neues Jahrb Mineral Monatsh, pp 33% 351
Johannes W (1985) The significance of experimental studies for the formation of migrnatites. In: Ashworth JR (ed) Migrnatites. Blackie, Glasgow, pp 36-85
Jurewicz SR, Watson EB (1985) The distribution of partial melt in a granitic system: the application of liquid phase sintering theory. Geochimica Cosmochimica Acta 49:1109-1121
Kerrick DM (1972) Experimental determination of muscovite+ quartz stability with PH20 < Ptotav Am J Sci 272:946-958
Lambert IB, Robertson JK, Wyllie PJ (1969) Melting reactions in the system KAISiaOs-S iOz-HzO to 18.5 kilobars. Am J Sci 267 : 60%626
Le Breton N (1986) Anat~xie de roches p~litiques en l'absence d'une phase flnide libre, l l6me R.S.T., Clermont-Ferrand, Rb- sumO
Lundgren LW (1966) Muscovite reactions and partial melting in southeastern Connecticut. J Petrology 7:421-453
Luth WC (1976) Granitic rocks. In: D.K. Bailey & R. MacDonald (eds) The evolution of the crystalline rocks. Academic Press, London

237
Luth RW, Boettcher AL (1986) Hydrogen and the melting of sili- cates. Am Miner 71:264-276
Manning DAC, Pichavant M (1983) The role of fluorine and boron in the generation of granitic melts. In: Atherton MP, Gribble CD (eds) Migmatites, melting and metamorphism. Shiva (Nan- twich, UK), pp 94-109
Newton RC, Haselton HT (1981) Thermodynamics of the garnet- plagioclase-A12SiOs-qnartz geobarometer. In: Newton RC, Navrotsky A, Wood BJ (eds) Thermodynamics of minerals and melts. Springer Berlin Heidelberg New York, pp 129 145
Pet6 P (1976) An experimental investigation of melting relations involving muscovite and paragonite in the silica-saturated por- tion of the system K ~ O - N a 2 0 - A l z O 3 - S i O 2 - H 2 0 to 15 kbar total pressure. Prog in Exper Petrol NERC London, 3rd Report, pp 41-45
Pet6 P, Thompson AB (1974) Wet and dry melting of white mica- alkali feldspar assemblages (Abstract). Trans Am Geophys Un- ion 55 : 479
Richardson SW (1968) Staurolite stability in a part of the system F e - AI -- Si - O - H. J Petrology 467:488
Richardson SW, Gilbert MC, Bell PM (1969) Experimental deter- mination of kyanite-andalusite and andalusite-sillimanite equi- libria; the aluminum silicate triple point. Am J Sci 267:259-272
Schmid R (1971) Substitution yon Biotit durch Granat and "Re- granitisation" in granulitischen Paragneissen der Ivreazone (N- Italien). Habilitationsschrift ETH Zfirich
Schmid R, Wood BJ (1976) Phase relationships in granulitic meta- pelites from the Ivrea-Verbano zone (Northern Italy). Contrib Mineral Petrol 54:255-279
Sparks RSJ, Meyer P, Sigurdsson H (1980) Density variation amongst mid-ocean ridge basalts. Implications for magma mix- ing and the scarcity of primitive lavas. Earth Planet Sci Letts 46:419-430
Stolper E, Walker D (1980) Melt density and the average composi- tion of basalt. Contr Mineral Petrol 74:7-12
Thompson AB (1976 a) Mineral reactions in pelitic rocks: I. Predic- tion of P - T - X (Fe-Mg) phase relations. Am J Sci 276:401-424
Thompson AB (1976b) Mineral reactions in pelitic rocks: II. Cal- culation of some P - T - J ( ( F e - M g ) phase relations. Am J Sci 276:425-454
Thompson AB (1982) Dehydration melting of pelitic rocks and the generation of H20-undersaturated granitic liquids. Am J Sci 282:1567-1595
Thompson AB (1984) Mineral reactions and mineral equilibria and their use in geothermometry, geobarometry and geohygro-
metry. In: Thermometrie et barometrie geologiques, Lagache M (ed) Soc Fran~ Mineral Cristall 1 : 17%199
Thompson AB (1987) Dehydration melting of crustal rocks. Rendi- conti Soc Min Pet Italia (in press)
Thompson AB, Algor JR (1977) Model systems for anatexis of pelitic rocks. I. Theory of melting reactions in the system KA1Oz - NaA102 - AI~O3 - SiO2 - H20. Contrib Mineral Pet- rol 63 : 247-269
Thompson AB, Tracy RJ (1979) Model systems for anatexis of pelitic rocks. II. Facies series melting and reactions in the sys- tem C a O - KA102 - NaA102 - A1203 - SiO2 - H20. Contrib Mineral Petrol 70:429-438
Tracy RJ (1978) High grade metamorphic reactions and partial melting in pelitic schist, West-Central Massachusetts. Am J Sci 278:150-178
Tracy RJ (1985) Migmatite occurences in New England. In: Ash- worth JR (ed) Migmatites, Blackie, Glasgow, pp 204-224
Tracy RJ, Robinson PR (1983) Acadian migmatite types in Central Massachusetts. In: Migmatites, melting and metamorphism, Atherton MP, Gribble CD (eds) Shiva, Nantwich, UK, pp 163-17
Tuttle OF, Bowen NL (1958) Origin of granite in the light of experimental studies in the system NaAlSi3Os-KA1Si3Os- SiO2 - H 2 0 . Geol Soc Am Mem 74, pp 153
Van der Molen I, Paterson MS (1979) Experimental deformation of partially melted granite. Contrib Mineral Petrol 70:218-229
Vielzeuf D, Boivin P (1984) An algorithm for the construction of petrogenetic grids: application to some equilibria in granu- litic paragneisses. Am J Sci 284:760-791
Vielzeuf D, Holloway JR (1986) Experimental determination of the fluid-absent melting relations of pelitic rocks at 10 kbar. Sympos Expt Min Geochem, Nancy (abstract)
Vielzeuf D, Holloway JR (1988) Experimental determination of the fluid-absent melting relations in the pelitic system. Conse- quences for crustal differentiation. Contrib Mineral Petrol 98 : 257-276
Weisbrod A (1973) Refinements of the equilibrium conditions of the reaction Fe cordierite = almandine + quartz + sillimanite (+H20). Carnegie Inst Washington, Yearb 72:518-521
Wickham SM (1987) The segregation and emplacement of granitic magmas. J Geol Soc London 144:281-297
Received September 7, 1987 / Accepted March 24, 1988 Editorial responsibility: V. Trommsdorff