Compositional and pressure effects on the solubility of H2O and CO2 in mafic melts
18
Compositional and pressure effects on the solubility of H 2 O and CO 2 in mafic melts Tatiana A. Shishkina a, ⁎, Roman E. Botcharnikov a , Francois Holtz a , Renat R. Almeev a , Aleksandra M. Jazwa b , Artur A. Jakubiak b a Institute for Mineralogy, Leibniz University of Hannover, Callinstr, 3, Hannover 30167, Germany b Institute of Geological Sciences, University of Wroclaw, pl. M. Borna 9, Wroclaw 50205, Poland abstract article info Article history: Received 24 January 2014 Received in revised form 19 August 2014 Accepted 1 September 2014 Available online 16 September 2014 Editor: D.B. Dingwell Keywords: H 2 O CO 2 Solubility Melt Alkali basalt MORB The effect of the anhydrous composition on the solubilities of H 2 O and CO 2 in mafic melts varying from MORB to nephelinite was investigated experimentally between 50 and 500 MPa at 1200 to 1250 °C. In all compositions, CO 2 is only present as carbonate species in the quenched glasses. The concentrations of dissolved H 2 O and CO 2 have been analyzed by KFT (Karl–Fischer titration) and FTIR (Fourier-transform infrared spectroscopy). The Mid-Infrared (MIR) absorption coefficients for the H 2 O band at 3500 cm −1 are identical within error for all inves- tigated melt compositions and equal to 59.2 ± 4 L/(mol∗ cm). The absorption coefficients for the carbonate bands vary in the range 306 ± 32 to 360 ± 24 L/(mol ∗ cm) for the 1430 cm −1 band and in the range 349 ± 25 to 394 ± 27 L/(mol ∗ cm) for the 1520 cm −1 band. However, a simple correlation with the melt composition could not be determined. Water solubility in mafic to intermediate melts increases slightly with the total alkali content and the effect of composition is more pronounced at higher pressures. At 500 MPa, the solubility of H 2 O in melts coexisting with nearly pure H 2 O fluids varies from 8.8 to 9.5 wt.% H 2 O. A strong effect of melt composition on the solubility of CO 2 is observed at all investigated pressures. For instance, at 500 MPa, mafic melts coexisting with nearly pure CO 2 fluids can dissolve from around 0.32 to more than 1.30 wt.% CO 2 as melt composition changes from tholeiite to nephelinite. The compositional effect on the solubility of CO 2 in melts coexisting with pure CO 2 fluid is best described by non-linear (exponential) correlations with compositional parameters such as the parameter Π pro- posed by Dixon (1997; American Mineralogist, 82: 368–378) or structural parameters (e.g., nonbridging oxygen per tetrahedrally coordinated cation). The obtained relationships are used to propose empirically derived equations of the form ln(CO 2 ) = 1.150 · lnP + 6.71 · Π* − 1.345, where CO 2 is the solubility of CO 2 in silicate melts in wt.% (at 1200 to 1250 °C), P is pressure in MPa and Π* is a compositional parameter (Π* = Ca 2+ + 0.8K + + 0.7Na + + 0.4Mg 2+ + 0.4Fe 2+ ) / (Si 4+ + Al 3+ ) with cations expressed as cation fractions in melt. © 2014 Elsevier B.V. All rights reserved. 1. Introduction The efficiency of volatile transport from depths of magma generation to shallow crustal levels is controlled by several factors and in particular by the composition of silicate melts and their ability to incorporate vol- atile components. Early experimental studies showed that melt compo- sition can significantly affect solubility of CO 2 in mafic melts, in contrast to a weak effect on H 2 O solubility (e.g., Mysen, 1988; Blank and Brooker, 1994; Holloway and Blank, 1994). It was found that the solubility of CO 2 is positively correlated with the degree of melt depolymerization (e.g. Mysen et al., 1975; Mysen, 1976) and Brooker et al. (2001a,b) proposed that CO 2 solubility can be described by a non-linear function of NBO/T (nonbridging oxygen per tetrahedrally coordinated cation). The most commonly accepted dissolution mechanism in mafic melts is based on the reaction of CO 2 with non-bridging oxygens (or reaction oxygens) to form carbonate ion in the melt structure (e.g. Spera and Bergman, 1980; Fine and Stolper, 1985; Stolper and Holloway, 1988; Blank and Brooker, 1994; Kubicki and Stolper, 1995). However, a parameter such as NBO/T only cannot explain the solubility behavior of CO 2 and other compositional effects need to be taken into account. For example, Holloway et al. (1976) showed that in melts with the same degree of polymerization CO 2 solubility decreases along the CaO–MgO joint. Brooker et al. (2001a,b) report- ed that melt compositions with high MgO contents dissolve much less CO 2 than other melts with lower MgO contents but the same NBO/T value. Brooker et al. (2001a) supposed that some proportion of Mg 2+ cations can play the role of network-formers, leading to the decrease in the amount of non-bridging oxygens in the melt Chemical Geology 388 (2014) 112–129 ⁎ Corresponding author at: V.I. Vernadsky Institute of Geochemistry and Analytical Chemistry, Kosygin str. 19, 119991 Moscow, Russia. Tel.: +7 925 053 49 71. E-mail address: [email protected] (T.A. Shishkina). http://dx.doi.org/10.1016/j.chemgeo.2014.09.001 0009-2541/© 2014 Elsevier B.V. All rights reserved. Contents lists available at ScienceDirect Chemical Geology journal homepage: www.elsevier.com/locate/chemgeo
-
Upload
independent -
Category
Documents
-
view
1 -
download
0
Transcript of Compositional and pressure effects on the solubility of H2O and CO2 in mafic melts

Chemical Geology 388 (2014) 112–129
Contents lists available at ScienceDirect
Chemical Geology
j ourna l homepage: www.e lsev ie r .com/ locate /chemgeo
Compositional and pressure effects on the solubility of H2O and CO2 inmafic melts
Tatiana A. Shishkina a,⁎, Roman E. Botcharnikov a, Francois Holtz a, Renat R. Almeev a,Aleksandra M. Jazwa b, Artur A. Jakubiak b
a Institute for Mineralogy, Leibniz University of Hannover, Callinstr, 3, Hannover 30167, Germanyb Institute of Geological Sciences, University of Wroclaw, pl. M. Borna 9, Wroclaw 50205, Poland
⁎ Corresponding author at: V.I. Vernadsky Institute oChemistry, Kosygin str. 19, 119991 Moscow, Russia. Tel.: +
E-mail address: [email protected] (T.A. Shishkina)
http://dx.doi.org/10.1016/j.chemgeo.2014.09.0010009-2541/© 2014 Elsevier B.V. All rights reserved.
a b s t r a c t
a r t i c l e i n f oArticle history:Received 24 January 2014Received in revised form 19 August 2014Accepted 1 September 2014Available online 16 September 2014
Editor: D.B. Dingwell
Keywords:H2OCO2
SolubilityMeltAlkali basaltMORB
The effect of the anhydrous composition on the solubilities of H2O and CO2 inmafic melts varying fromMORB tonephelinite was investigated experimentally between 50 and 500 MPa at 1200 to 1250 °C. In all compositions,CO2 is only present as carbonate species in the quenched glasses. The concentrations of dissolved H2O and CO2
have been analyzed by KFT (Karl–Fischer titration) and FTIR (Fourier-transform infrared spectroscopy). TheMid-Infrared (MIR) absorption coefficients for theH2O band at 3500 cm−1 are identicalwithin error for all inves-tigatedmelt compositions and equal to 59.2±4 L/(mol∗cm). The absorption coefficients for the carbonate bandsvary in the range 306±32 to 360±24 L/(mol∗cm) for the 1430 cm−1 band and in the range 349±25 to 394±27 L/(mol∗cm) for the 1520 cm−1 band. However, a simple correlation with the melt composition could not bedetermined.Water solubility in mafic to intermediate melts increases slightly with the total alkali content and the effect ofcomposition is more pronounced at higher pressures. At 500 MPa, the solubility of H2O in melts coexistingwith nearly pure H2O fluids varies from 8.8 to 9.5 wt.% H2O. A strong effect of melt composition on the solubilityof CO2 is observed at all investigated pressures. For instance, at 500MPa, mafic melts coexisting with nearly pureCO2 fluids can dissolve from around 0.32 tomore than 1.30 wt.% CO2 asmelt composition changes from tholeiiteto nephelinite. The compositional effect on the solubility of CO2 in melts coexisting with pure CO2 fluid is bestdescribed by non-linear (exponential) correlationswith compositional parameters such as the parameterΠ pro-posed by Dixon (1997; AmericanMineralogist, 82: 368–378) or structural parameters (e.g., nonbridging oxygenper tetrahedrally coordinated cation). The obtained relationships are used to propose empirically derivedequations of the form ln(CO2) = 1.150 · lnP + 6.71 · Π* − 1.345, where CO2 is the solubility of CO2 in silicatemelts in wt.% (at 1200 to 1250 °C), P is pressure in MPa and Π* is a compositional parameter (Π* = Ca2+ +0.8K+ + 0.7Na+ + 0.4Mg2+ + 0.4Fe2+) / (Si4+ + Al3+) with cations expressed as cation fractions in melt.
© 2014 Elsevier B.V. All rights reserved.
1. Introduction
The efficiency of volatile transport fromdepths ofmagmagenerationto shallow crustal levels is controlled by several factors and in particularby the composition of silicate melts and their ability to incorporate vol-atile components. Early experimental studies showed that melt compo-sition can significantly affect solubility of CO2 in mafic melts, in contrastto aweak effect onH2O solubility (e.g., Mysen, 1988; Blank and Brooker,1994; Holloway and Blank, 1994). It was found that the solubility of CO2
is positively correlated with the degree of melt depolymerization (e.g.Mysen et al., 1975; Mysen, 1976) and Brooker et al. (2001a,b) proposed
f Geochemistry and Analytical7 925 053 49 71.
.
that CO2 solubility can be described by a non-linear function of NBO/T(nonbridging oxygen per tetrahedrally coordinated cation).
The most commonly accepted dissolution mechanism in maficmelts is based on the reaction of CO2 with non-bridging oxygens(or reaction oxygens) to form carbonate ion in the melt structure(e.g. Spera and Bergman, 1980; Fine and Stolper, 1985; Stolper andHolloway, 1988; Blank and Brooker, 1994; Kubicki and Stolper,1995). However, a parameter such as NBO/T only cannot explainthe solubility behavior of CO2 and other compositional effects needto be taken into account. For example, Holloway et al. (1976) showedthat in melts with the same degree of polymerization CO2 solubilitydecreases along the CaO–MgO joint. Brooker et al. (2001a,b) report-ed that melt compositions with high MgO contents dissolve muchless CO2 than other melts with lower MgO contents but the sameNBO/T value. Brooker et al. (2001a) supposed that some proportionof Mg2+ cations can play the role of network-formers, leading tothe decrease in the amount of non-bridging oxygens in the melt
113T.A. Shishkina et al. / Chemical Geology 388 (2014) 112–129
and therefore reducing CO2 solubility. Moore (2008) reported a strongpositive correlation of CO2 solubility with CaO content in basalticmelts. Behrens et al. (2009) found that K2O-rich phonotephritic meltsdissolve significantly more CO2 than K2O-poor tholeiitic basalts andsuggested that K can stabilize carbonate-bearing species in the silicatemelt. Recently, Lesne et al. (2011b) and Vetere et al. (2014) also report-ed positive but complex effects of alkalis on the concentrations of CO2
dissolved in mafic melts.Compared to CO2 (on a wt.% basis), there is no strong effect of melt
composition on H2O solubility in mafic systems and in particular thereis no large difference between H2O solubilities in mafic, intermediateand silicic melts at given pressure and temperature conditions. Howev-er, despite the large experimental database on H2O and CO2 solubilitiesproduced up to now (see reviews of Moore, 2008; Ni and Keppler,2013), a successful systematic analysis of the compositional effect ofmafic melts on H2O and CO2 solubilities coexisting with mixed H2O–CO2 volatiles is still missing. Existing numerical models use differentcompositional parameters for calculation of CO2-solubilities in silicatemelts. VolatileCalc (Newman and Lowenstern, 2002) employs a linearcorrelation of CO2 with SiO2 and it is assumed that there is no effect ofone dissolved component on the solubility of the other. The models ofPapale et al. (2006) and Duan (2014) account for wide compositionalvariations from basalts to rhyolites and for more specific compositionsto calculate H2O–CO2 solubility. However, the prediction ability ofboth models is limited by the available experimental data used for cali-bration. Iacono-Marziano et al. (2012) proposed a new semi-empiricalmodel of H2O–CO2 solubility specifically focused on mafic melts as itwas calibrated on a selected database consisting of 44 different maficcompositions. The model predicts a positive correlation of CO2 andH2O solubilities with NBO/O (non-bridging oxygen per oxygen in themelt) and the authors mentioned that there are some limitations be-cause of the lack of data to calibrate for example the role of alkalis orFe3+/Fe2+ ratio.
To better understand the importance of melt composition, we pres-ent new experimental data on the solubility of mixed H2O–CO2 fluids ineight mafic melts with a wide compositional range including silica-undersaturated high-MgO nephelinite and basanite, alkali basalts,ferrobasalt as well as MORB and Al-rich K2O-poor island-arc basalt.The new data are used to test the limitations of the models proposedso far and, togetherwith the results fromprevious experimental studies,to work out the effect of melt composition on the solubility of H2O andparticularly of CO2 at pressures up to 500 MPa.
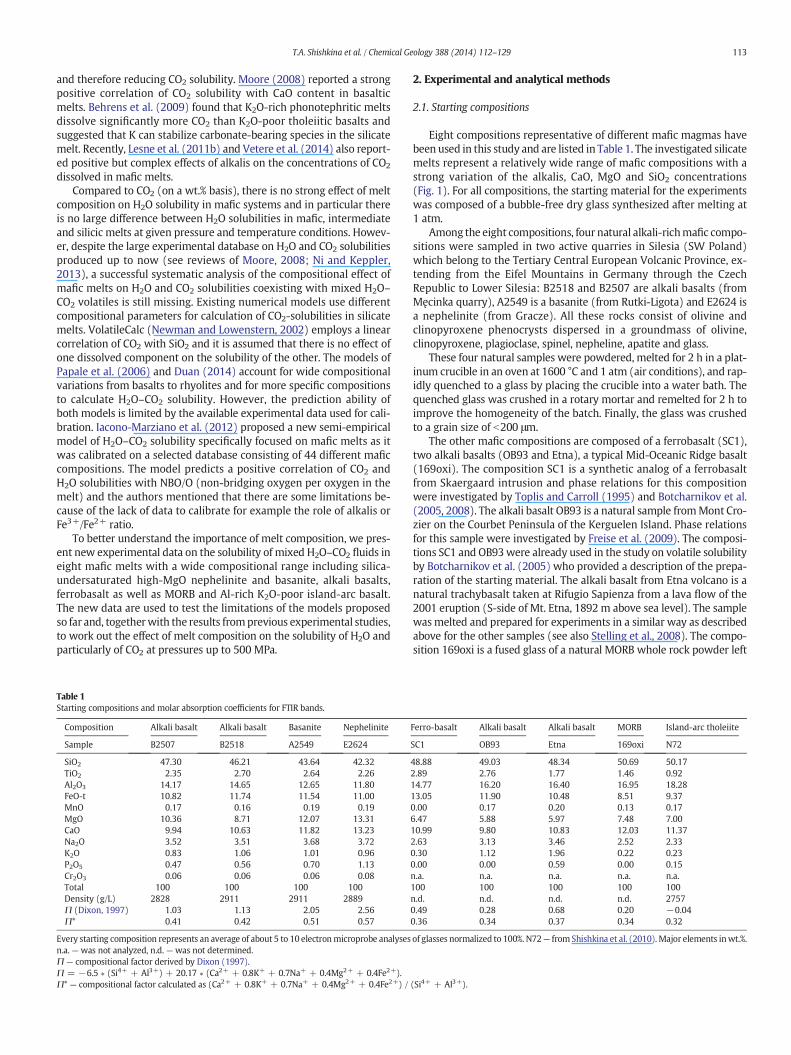
Table 1Starting compositions and molar absorption coefficients for FTIR bands.
Composition Alkali basalt Alkali basalt Basanite Nephelinite
Sample B2507 B2518 A2549 E2624
SiO2 47.30 46.21 43.64 42.32TiO2 2.35 2.70 2.64 2.26Al2O3 14.17 14.65 12.65 11.80FeO-t 10.82 11.74 11.54 11.00MnO 0.17 0.16 0.19 0.19MgO 10.36 8.71 12.07 13.31CaO 9.94 10.63 11.82 13.23Na2O 3.52 3.51 3.68 3.72K2O 0.83 1.06 1.01 0.96P2O5 0.47 0.56 0.70 1.13Cr2O3 0.06 0.06 0.06 0.08Total 100 100 100 100Density (g/L) 2828 2911 2911 2889Π (Dixon, 1997) 1.03 1.13 2.05 2.56Π* 0.41 0.42 0.51 0.57
Every starting composition represents an average of about 5 to 10 electronmicroprobe analysesn.a.— was not analyzed, n.d. — was not determined.Π — compositional factor derived by Dixon (1997).Π = −6.5 ∗ (Si4+ + Al3+) + 20.17 ∗ (Ca2+ + 0.8K+ + 0.7Na+ + 0.4Mg2+ + 0.4Fe2+).Π* — compositional factor calculated as (Ca2+ + 0.8K+ + 0.7Na+ + 0.4Mg2+ + 0.4Fe2+) /
2. Experimental and analytical methods
2.1. Starting compositions
Eight compositions representative of different mafic magmas havebeen used in this study and are listed in Table 1. The investigated silicatemelts represent a relatively wide range of mafic compositions with astrong variation of the alkalis, CaO, MgO and SiO2 concentrations(Fig. 1). For all compositions, the starting material for the experimentswas composed of a bubble-free dry glass synthesized after melting at1 atm.
Among the eight compositions, four natural alkali-richmafic compo-sitions were sampled in two active quarries in Silesia (SW Poland)which belong to the Tertiary Central European Volcanic Province, ex-tending from the Eifel Mountains in Germany through the CzechRepublic to Lower Silesia: B2518 and B2507 are alkali basalts (fromMęcinka quarry), A2549 is a basanite (from Rutki-Ligota) and E2624 isa nephelinite (from Gracze). All these rocks consist of olivine andclinopyroxene phenocrysts dispersed in a groundmass of olivine,clinopyroxene, plagioclase, spinel, nepheline, apatite and glass.
These four natural samples were powdered, melted for 2 h in a plat-inum crucible in an oven at 1600 °C and 1 atm (air conditions), and rap-idly quenched to a glass by placing the crucible into a water bath. Thequenched glass was crushed in a rotary mortar and remelted for 2 h toimprove the homogeneity of the batch. Finally, the glass was crushedto a grain size of b200 μm.
The other mafic compositions are composed of a ferrobasalt (SC1),two alkali basalts (OB93 and Etna), a typical Mid-Oceanic Ridge basalt(169oxi). The composition SC1 is a synthetic analog of a ferrobasaltfrom Skaergaard intrusion and phase relations for this compositionwere investigated by Toplis and Carroll (1995) and Botcharnikov et al.(2005, 2008). The alkali basalt OB93 is a natural sample fromMont Cro-zier on the Courbet Peninsula of the Kerguelen Island. Phase relationsfor this sample were investigated by Freise et al. (2009). The composi-tions SC1 and OB93were already used in the study on volatile solubilityby Botcharnikov et al. (2005) who provided a description of the prepa-ration of the starting material. The alkali basalt from Etna volcano is anatural trachybasalt taken at Rifugio Sapienza from a lava flow of the2001 eruption (S-side of Mt. Etna, 1892 m above sea level). The samplewasmelted and prepared for experiments in a similar way as describedabove for the other samples (see also Stelling et al., 2008). The compo-sition 169oxi is a fused glass of a natural MORB whole rock powder left
Ferro-basalt Alkali basalt Alkali basalt MORB Island-arc tholeiite
SC1 OB93 Etna 169oxi N72
48.88 49.03 48.34 50.69 50.172.89 2.76 1.77 1.46 0.9214.77 16.20 16.40 16.95 18.2813.05 11.90 10.48 8.51 9.370.00 0.17 0.20 0.13 0.176.47 5.88 5.97 7.48 7.0010.99 9.80 10.83 12.03 11.372.63 3.13 3.46 2.52 2.330.30 1.12 1.96 0.22 0.230.00 0.00 0.59 0.00 0.15n.a. n.a. n.a. n.a. n.a.100 100 100 100 100n.d. n.d. n.d. n.d. 27570.49 0.28 0.68 0.20 −0.040.36 0.34 0.37 0.34 0.32
of glasses normalized to 100%. N72— from Shishkina et al. (2010). Major elements inwt.%.
(Si4+ + Al3+).

0
2
4
6
8
10
12
14
16
36 40 44 48 52 56 60 64 68 72 76 80
Na 2
O +
K2O
(w
t %
)
SiO2 (wt %)
H2O
CO2+mixed
This study
0.0
2.0
4.0
6.0
8.0
10.0
12.0
14.0
40 42 44 46 48 50 52 54 56 58 60 62 64 66 68 70
Mg
O (
wt
%)
SiO2 (wt %)
0.4
0.6
0.8
1.0
1.2
1.4
1.6
1.8
40 42 44 46 48 50 52 54 56 58 60 62 64 66 68 70 72
Al 2
O3/
(CaO
+Na 2
O+K
2O)
SiO2 (wt %)
a
b
c
Fig. 1. Compositions of experimental glasses used in this study to investigate anddiscuss the solubility of C–O–H-bearing fluids in silicate melts. (a) TAS diagram orNa2O + K2O vs. SiO2 (wt.%); (b) MgO vs. SiO2 (wt.%); (c) aluminum saturation indexA/CNK: Al2O3/(CaO + Na2O + K2O) vs. SiO2 (wt.%). White diamonds represent pureH2O-bearing experiments (Paillat et al., 1992; Moore et al., 1995, 1998; Pineau et al.,1998; Berndt et al., 2002; Benne and Behrens, 2003; Di Matteo et al., 2006; Botcharnikovet al., 2006; Stelling et al., 2008; Schmidt and Behrens, 2008; Lesne et al., 2011a) and graytriangles are pure CO2- or mixed H2O–CO2-bearing experiments (Stolper and Holloway,1988; Pan et al., 1991; Mattey, 1991; Pawley et al., 1992; Holloway and Blank, 1994;Thibault and Holloway, 1994; Dixon et al., 1995; Jendrzejewski et al., 1997; Botcharnikovet al., 2005a, 2005b; Behrens et al., 2009; Lesne et al., 2011b; Vetere et al., 2011; Iacono-Marziano et al., 2012; Iacovino et al., 2013; Vetere et al., 2014). Compositions investigatedin this study are shownwith black squares (for compositions see Table 1). Compositions ofglasses from other studies are presented in Appendix 3a.
114 T.A. Shishkina et al. / Chemical Geology 388 (2014) 112–129
after separation of olivine phenocrysts (sample 169DS2 collected fromthe Mid-Atlantic ridge 7–11°S near Ascension Island as described byAlmeev et al., 2008).
2.2. Experimental conditions and capsule preparation
The solubility of mixed H2O–CO2-bearing fluids was determined atpressures between 50 and 500 MPa and 1250 °C for the alkali basaltsB2518 and B2507, basanite A2549 and nephelinite E2624 and 1200 °Cfor ferrobasalt SC1, alkali basalts OB93 and Etna, Mid-Oceanic Ridge ba-salt (MORB) 169oxi (Table 2).
The solubility experimentswere prepared by loading about 50mg ofglass powder in Au80Pd20 capsules (15–20mm long and 2.6–3.4 mm indiameter). Distilled water and silver oxalate (Ag2C2O4) were used assources of H2O and CO2, respectively. Different proportions of waterand silver oxalate were loaded into the capsules to establish differentmole fractions of water in the added fluid phase (XH2Oin) as reportedin Table 2. Capsules were weighted after loading each component,closed with pliers and welded shut.
In this study, the concentrations of water- and especially of carbon-bearing species in the quenched glasses were determined by infraredspectroscopy (IR). Since the absorbance of the bands assigned towater and carbonate species depends on the glass composition, refer-ence materials were synthesized for each composition to calibrate IRmolar absorption coefficients (Appendix 1). The H2O and CO2 analysesin reference samples were done using independent analytical tech-niques as described below. For the synthesis of reference glasses for car-bon, 500mgof glass powder, distilledwater and CaCO3 or Ag2C2O4wereloaded in large Au80Pd20 capsules (35 mm long and 5 mm diameter).Calcium carbonate powder was mixed with basalt glass powder beforeloading. The amounts of added CaCO3 were low and the resulting varia-tion of the CaO concentration of the glass is less than 5 rel.%, which is as-sumed to be negligible for the determination of absorption coefficients.The amounts of added volatile components were kept lower than theexpected solubility values to ensure complete dissolution of the vola-tiles in themelt. The capsuleswere filledwith powder andwater in sev-eral steps to force homogenous distribution of the components. In total,eight standards for bulk carbon determinations were synthesized. Twoof them were prepared from basanite A2549 (St-1 and St-2) and twofrom alkali basalt B2507 (St-3 and St-4). Individual single standardswere also prepared for the ferrobasalt SC1, the two alkali basalts OB93and Etna, and the MORB 169oxi compositions.
2.3. Experimental technique
The experiments at 50, 100, 200, 300 and 500 MPa were performedin a vertically oriented internally heated pressure vessel (IHPV) at theInstitute for Mineralogy, Leibniz University of Hannover (see alsoShishkina et al., 2010). Usually, five capsules containing the samestarting composition and different H2O–CO2 proportions (XH2Oinfrom 0 to 1, Table 2) were run simultaneously at 1200 or 1250 °C. Fora better understanding of the effect ofmelt composition on CO2-solubil-ity, experiments at nominally H2O-free conditions (XH2Oin= 0) wereperformedwith all samples (pressures of 50, 200 and 300MPawere in-vestigated for B2507, A2549, E2624, OB93, Etna and 169oxi; Table 2).Reference glasses for carbon determination were prepared at 300 or500 MPa and 1250 °C (Appendix 1). For these experiments, only onelarge capsule was placed in the pressure vessel. The experimental dura-tion varied from 24 to 72 h.
Four Pt–Pt90Rh10 (S-type) thermocouples were used to record thetemperature in the IHPV. Typically, the temperature gradient alongthe samplewas±3 °C. The variations of the temperature during the ex-periments were ±2 °C at 100 MPa and ±10 °C at 500 MPa. Total pres-sure was recorded continuously with a calibrated Burster Type 8221digital pressure transducer (pressure uncertainty ±1 MPa). The varia-tion of pressure during the experiments was less than 5 MPa. The

Table 2Experimental conditions, results of Karl–Fischer titration and infrared spectroscopy.
Rock type Sample Run P (MPa) T (°C) XH2Oin XH2Ofluid KFT H2O(wt.%)
KFT H2OError (wt.%)
MIR CO2
(ppm)MIR CO2
error (ppm)MIR H2O(wt.%)
MIR H2Oerror (wt.%)
Commentsfor run products
Alkali basalt B2518 2 100 1250 1.00 0.99 3.38 0.13 0 2.39 0.23Alkali basalt B2518 1 100 1250 0.95 0.85 3.10 0.12 0 2.34 0.33Alkali basalt B2518 3 100 1250 0.76 0.56 2.29 0.12 284 33 2.09 0.20Alkali basalt B2518 4 100 1250 0.41 0.20a n.a. 0.12 648 76 1.31 0.13Alkali basalt B2518 54 100 1250 0.00 0.11 0.88 0.11 706 82 0.91 0.10Alkali basalt B2518 50 100 1250 0.00 0.11 0.85 0.11 518 69 0.93 0.10Alkali basalt B2518 9 500 1250 0.64 0.24 3.34 0.12 4517 526 2.70 0.26Alkali basalt B2507 B-17 50 1250 0.00 n.d. n.a. 192 22 0.90 0.12Alkali basalt B2507 21 100 1250 1.00 0.92 3.31 0.13 0 2.46 0.24Alkali basalt B2507 22 100 1250 0.94 0.84 3.15 0.12 0 2.61 0.25Alkali basalt B2507 23 100 1250 0.79 0.65 2.45 0.13 219 26 2.30 0.23Alkali basalt B2507 24 100 1250 0.38 0.20 1.24 0.11 638 77 1.25 0.13Alkali basalt B2507 25 100 1250 0.00 0.19 0.85 0.12 750 88 0.88 0.11Alkali basalt B2507 B-5 200 1250 0.00 n.d. n.a. 1210 148 1.19 0.17Alkali basalt B2507 29 500 1250 0.64 0.31 3.44 0.12 5440 748 2.86 0.28Alkali basalt B2507 30 500 1250 0.00 0.00 0.65 0.12 5413 809 0.69 0.10Alkali basalt B2507 52 500 1250 0.00 0.27 0.26 0.12 4852 567 0.29 0.08Basanite A2549 B-13 50 1250 0.00 n.d. n.a. 614 71 0.87 0.12Basanite A2549 12 100 1250 0.94 0.91a 3.17 0.12 127 15 n.a.Basanite A2549 11 100 1250 1.00 1.00 3.13 0.14 0 n.a.Basanite A2549 14 100 1250 0.37 0.07a n.a. 0.12 1771 209 0.97 0.10Basanite A2549 13 100 1250 0.77 n.d. n.a. 0.12 1411 168 0.50 0.06Basanite A2549 51 100 1250 0.00 0.03 0.86 0.12 1500 178 0.85 0.10Basanite A2549 B-4 200 1250 0.00 n.d. n.a. 3130 366 0.88 0.12Basanite A2549 B-12 300 1250 0.00 n.d. n.a. 5509 642 1.06 0.15Basanite A2549 18 500 1250 0.87 0.64 5.82 0.12 6716 795 n.a. Rare QCBasanite A2549 48 500 1250 0.64 0.27 3.48 0.13 7368 885 n.a.Basanite A2549 19 500 1250 0.62 n.d. 0.50 0.12 7654 895 0.49 0.08Basanite A2549 47 500 1250 0.00 n.d. 0.27 0.12 7159 844 0.40 0.10 Ol (b1%)Nephelinite E2624 B-15 50 1250 0.00 n.d. n.a. 956 111 0.86 0.12Nephelinite E2624 31 100 1250 1.00 0.99 3.19 0.13 0 n.a.Nephelinite E2624 33 100 1250 0.77 0.60 2.69 0.12 1090 133 2.32 0.23Nephelinite E2624 35 100 1250 0.00 n.d. 0.54 0.11 2868 364 0.57 0.07 Ol (b3%)Nephelinite E2624 B-3 200 1250 0.00 n.d. n.a. 3407 416 1.13 0.16Nephelinite E2624 B-11 300 1250 0.00 n.d. n.a. 7658 899 1.02 0.14Nephelinite E2624 38 500 1250 0.87 0.55 5.86 0.14 8549 992 n.a.Nephelinite E2624 40 500 1250 0.00 n.d. 1.12 0.12 13905 1629 0.96 0.10 Ol (b3%)Ferrobasalt SC1 B156 500 1200 1.00 0.94 9.02 0.11 0 0 n.a.Ferrobasalt SC1 B157 500 1200 0.97 0.76 8.18 0.11 1258 117 n.a.Ferrobasalt SC1 B158 500 1200 0.85 0.55 5.54 0.14 2746 206 n.a.Ferrobasalt SC1 B159 500 1200 0.56 0.21 2.82 0.10 4155 308 n.a.Ferrobasalt SC1 B160 500 1200 0.00 0.04 1.18 0.10 4384 228 n.a.Alkali basalt OB93 B-9 300 1250 0.00 n.d. n.a. 1742 204 0.87 0.12Alkali basalt OB93 M148b 500 1150 1.00 1 9.54 0.48 0 n.a.Alkali basalt OB93 OB93-5 500 1200 0.99 0.86 7.96 0.10 729 36 n.a.Alkali basalt OB93 OB93-4 500 1200 0.97 0.51 7.45 0.10 1336 124 n.a.Alkali basalt OB93 OB93-3 500 1200 0.85 0.57 5.44 0.10 2491 101 n.a.Alkali basalt OB93 OB93-2 500 1200 0.59 0.21 3.15 0.10 3239 205 n.a.Alkali basalt OB93 OB93-1 500 1200 0.00 0.02 1.07 0.10 3136 200 n.a.Alkali basalt Etna B-16 50 1250 0.00 n.d. n.a. 155 26 0.83 0.11Alkali basalt Etna B-1 200 1250 0.00 n.d. n.a. 1492 174 1.12 0.16Alkali basalt Etna Etna-11 500 1200 1.00 1.00 8.78 0.12 0 n.a.Alkali basalt Etna Etna-15 500 1200 0.96 0.82 7.19 0.08 2156 90 n.a.Alkali basalt Etna Etna-14 500 1200 0.84 0.50 4.61 0.11 3666 174 n.a.Alkali basalt Etna Etna-13 500 1200 0.63 0.27 2.22 0.12 4609 193 n.a.Alkali basalt Etna Etna-12 500 1200 0.00 0.06 0.81 0.08 4785 212 n.a.MORB 169oxi B-14 50 1250 0.00 n.d. n.a. 211 26 0.72 0.10MORB 169oxi 169oxi-20 500 1200 1.00 1.00 8.85 0.10 0 0 n.a.MORB 169oxi 169oxi-19 500 1200 0.97 0.55 7.36 0.07 1190 75 n.a.MORB 169oxi 169oxi-18 500 1200 0.84 0.46 5.99 0.09 2895 183 n.a.MORB 169oxi 169oxi-17 500 1200 0.57 0.18 2.57 0.10 4382 247 n.a.
Analytical errors and uncertainties, if not specified in the text, were calculated as described in Shishkina et al. (2010).QC— quench crystalls, Ol— olivine. n.a. — not analyzed, n.d. — not determined.
a Mole fraction of H2O in the fluid determined by mass-balance, in all other runs— by gravimetry.b Sample from Botcharnikov et al. (2005a,b).
115T.A. Shishkina et al. / Chemical Geology 388 (2014) 112–129
capsules were quenched isobarically using a rapid-quench techniquedescribed by Berndt et al. (2002). The quench rate was about 150 °C/s.
The intrinsic redox conditions in the IHPV (log fO2intrinsic) are close
to NNO+2.6 (i.e., fO2 is 2.6 log units higher than that buffered by theNi–NiO solid oxygen buffer) in runs with water activity (aH2O) closeto 1 (Schuessler et al., 2008). The oxygen fugacity for every single run
(log fO2capsule) was calculated as log fO2
capsule = log fO2intrinsic + 2log
(aH2O) (Scaillet and Evans, 1999). Water activities (aH2O) forevery run were calculated using the concentration of H2O in theglass according to the model of Burnham (1975, 1979) (Appendix2). We propose that the oxygen fugacity calculated using aH2Omight be slightly overestimated, because the model of Burnham
116 T.A. Shishkina et al. / Chemical Geology 388 (2014) 112–129
underestimates H2O solubilities, especially at the high pressures ofthis study (e.g., Holtz et al., 1995).
2.4. Analytical methods
2.4.1. Major element glass compositionThemajor element compositions of the startingmaterials and exper-
imental products were analyzed by electron microprobe (CamecaSX100) using glass andmineral standards for calibration. Samples of ex-perimental glasses were analyzed in 5 to 10 different points using15 keV accelerating voltage, 4 nA beam current and 20 μm diameter ofelectron beam. Sodium and potassium were analyzed first to minimizealkali-loss.
The Fe2+/Fetotal ratio was determined in several glass samples usingthe wet-chemical colorimetric analytical technique of Wilson (1960)modified by Schuessler et al. (2008). Four to ten milligrams of glasschips from run products were taken for analyses and results are report-ed in Appendix 2.
2.4.2. Fluid composition after the experimentsThe weight-loss procedure was used for the determination of the
fluid composition (mole fractions of H2O (XflH2O) and CO2 (XflCO2) inthe fluid phase). The capsules wereweighed after the run andweighingwas repeated after freezing the capsule in liquid nitrogen with subse-quent piercing of the capsule (determination of the CO2 mass in thefluid) and after holding the capsule in anoven at 110 °C for 2–3min (de-termination of the mass of evaporated H2O). However, because of thelow amounts of fluid phase present in the capsule, which was deliber-ately chosen to avoid incongruent dissolution of silicate melt in thefluid, themass of H2O and CO2 could only be determinedwith sufficientaccuracy for some experiments.When theweight-loss procedure failed,we calculated the mole fractions of H2O and CO2 in the fluid by mass-balance, based on themass of starting fluid and glass and on the volatileconcentrations in run-product glasses. However, the uncertainty onXflH2O using this method is also high because a small loss of H2O orCO2 during capsule preparationmayhave a strong effect on the calculat-ed XflH2O. In some experiments neither the gravimetric technique northe mass balance method was satisfying and the fluid compositioncould not be determined.
2.4.3. Determination of bulk concentrations of volatiles in glassesThe concentration of H2O dissolved in the glasses was measured by
Karl–Fischer titration (KFT, Behrens et al., 1996). Ten to twenty mg ofthe sample was heated from room temperature to 1300 °C using ahigh-frequency generator (Linn electronic HTG 1000/1.3). The extract-ed water was transported by an Ar-stream to the titration cell with anelectrolytic solution and the amount of extracted H2O was detected bya moisture meter (Mitsubishi CA-100).
The total carbon content in the reference glass standards was deter-mined by combustion and subsequent IR spectroscopy using an ELTRACS 800 analyzer. For a single measurement, about 100 mg of glass wasloaded into a corundum crucible together with 1.5 ± 0.05 g of tungsten(W) and 0.3 ± 0.03 g of iron (Fe) chips. The mixture was burn in anoxygen stream at temperature up to 2200 °C. The released CO2 wasmeasured in an IR cell. Accuracy and reproducibility of the mea-surements were checked by analyses of metallic and glass standardswith known carbon concentrations (from 0.0018 to 0.75 wt.% C). Foreach reference glass, three different portions of the samples were col-lected from the top, the central part and the bottomof the glass cylinder(U— top, M— central and D— bottom) and were analyzed by KFT, MIRand bulk carbon determination.
2.4.4. Determination of H2O and CO2 concentrations in glasses by Fourier-transform infrared spectroscopy (FTIR)
The IR spectra were taken from doubly polished glass chips with athickness of ~80 to 110 μm. The thickness was measured with a digital
micrometer Mitutoyo (precision ±2 μm; Behrens et al., 2009) in 5points for every polished glass chip. Absorption spectra in the mid-infrared (MIR) rangewere collectedwith a Bruker IFS88 FTIR spectrom-eter combined with an IR-ScopeII microscope (Institute for Mineralogy,Hannover) and were used for the determination of the concentrationsof hydrogen- and carbon-bearing species dissolved in the glasses. Theoperating conditions for MIR were: globar light source and KBrbeamsplitter, spectral resolution of 2 cm−1. AMCT narrow range detec-tor was used. For each spectrum 50 to 100 scans were collected fromspots with sizes of about 50 × 50 μm. The homogeneity of volatile distri-bution was checked collecting the spectra in 3 to 5 spots in differentparts of the glass chips.
Water and carbonate concentrations in basaltic glasses were calcu-lated using IR absorption spectra on the basis of the Beer–Lambert law:
Ci ¼ 100 �Mi � Aj= d � ρ � ε j
� �ð5Þ
where Ci is the concentration of species in wt.%, Mi is the molecularweight of the species, Aj is the absorbance (peak height) of band j, d isthe thickness of the section, ρ is the density in g/L and εj is the absorp-tion coefficient of band j in L/(mol∗cm). Absorbances of the carbonateband at 1430 cm−1 and water band at 3550 cm−1 were measuredfromMIR spectra as scaled peak heights after subtraction ofMIR spectraof the volatile-free glass with the same composition scaled to the samethickness. Linear tangential baselines below the carbonate and thewater bands were used for the peak height determination (same proce-dure as in Behrens et al., 2009; Shishkina et al., 2010). For some compo-sitions, the absorption coefficients ε1430 and ε3550 were determined inthis study and the results are described below. The MIR spectra wereused for the calculation of CO2 concentrations in all glasses. The quanti-tative determination of H2O with MIR spectra was only applied forglasses with less than 2.5 wt.% H2O since the saturation of the detectorwas observed at higher H2O contents (very noisy and “flattened” peakof water band at 3550 cm−1) at chosen sample thickness.
The densities of the water-free glasses from samples B2518, B2507,A2549, and E2624 were determined using the Archimedean methodby weighing large pieces of glass (200 to 1700 mg) in water and in air(Table 1). Densities of volatile-bearing glasses (ρ in g/L) in every runwere calculated using the densities of the water-free starting glassesand assuming a partial molar volume of H2O in the glass of 12.0 ±0.5 cm3/mol (Dixon et al., 1995; Holtz et al., 1995; Richet et al., 2000):
B2518 : ρ ¼ 2910:4−26:1 �H2Ot ð1Þ
B2507 : ρ ¼ 2826:7−23:9 �H2Ot ð2Þ
A2549 : ρ ¼ 2910:1−26:1 �H2Ot ð3Þ
E2624 : ρ ¼ 2887:5−25:4 �H2Ot ð4Þ
where H2Ot is the water content in wt.%.The determination of densities for the glasses SC1, OB93, Etna, and
169oxi were not performed in this study. Glass densities were calculat-ed using the equation of Yamashita et al. (1997) proposed for basalticcompositions:
ρ ¼ 2819−20:8 � CH2Ot ð5Þ
In Eqs. (1) to (5), the possible effect of dissolved CO2 is not taken intoaccount. However, since the concentrations are low (less than 1 wt.%CO2), the effect on the determined volatile concentrations is negligibleand within the error of the H2O and CO2 determinations.

117T.A. Shishkina et al. / Chemical Geology 388 (2014) 112–129
3. Results
3.1. Experimental products and major element composition of glasses fromsolubility experiments
The experimental conditions and the description of the run productsof solubility experiments as well as the resulting fluid compositions,H2O and CO2 contents in glasses are presented in Table 2. Small amountsof olivine crystals (Fo 88.5–92) were found in three run products withbasanite A2549 (run 47 at 500 MPa) and nephelinite E2624 (run 35 at100 MPa and run 40 at 500 MPa). These runs have low XH2Oin(Table 2), resulting in high liquidus temperatures (higher than1250 °C). However, since the proportion of olivine is low (b3 vol.%),its presence is not expected to affect significantly the glass compositionand the volatile solubility data. On the other hand, in experiments withhigh XH2Oin (XH2Oin 0.87–1) at 500 MPa, the run products of thestarting compositions B2518, A2549, B2507 and E2624 were mainlycomposed of aggregates of chaotically oriented needle-like crystals,which sometimes form spherulitic textures with small amounts of in-terstitial residual glass. Such textures indicate that the quench ratewas too slow for these H2O-rich melts, leading to the formation ofquench phases. The formation of quench crystals in experiments usingthe same quench rate as in this study is often observed in mafic meltscontaining ~10 wt.% H2O (e.g., Berndt et al., 2002; Botcharnikov R.et al., 2005; Shishkina et al., 2010). The quenched water-saturatedMORB glasses of Berndt et al. (2002) at 500 MPa and 1200 °C werebubble- and crystal-free, whereas Shishkina et al. (2010) reported rareelongated needle-like crystals within the quenched glass of a tholeiiticbasalt at 1250 °C and 500 MPa (XH2Oin= 1). Behrens et al. (2009) re-ported that quenched glasses from alkali-rich phonotephritic meltswith more than 6 wt.% H2O contained homogeneously distributed fi-brous crystals (micas), though Vetere et al. (2014) do not observequench crystals in phonotephritic glasses prepared at the same condi-tions. The samples containing high amounts of quench crystals werenot used for the determination of volatile concentrations. The H2O con-centration analyzed by KFT in one sample with small proportions ofquench crystals (experiments 18, Table 2)was used to draw the solubil-ity curves, assuming that quench products represent the bulk composi-tion of the water-rich silicate melt at the experimental conditions (theconcentration of H2O has to be considered as a minimum value). TheCO2 concentration from sample 18, analyzed by FTIR in crystal-free do-mains of the glass, was also used for further discussions.
Themajor element compositions of the quenched glasses withmorethan 1 wt.% H2O do not differ significantly from the composition ofstarting materials. The differences in the concentrations of SiO2, TiO2,Al2O3, MgO, CaO, K2O and Na2O are within ±5 rel.% (see Appendix 2).In most experiments, the analyses indicate a possible Fe-loss. A clearFe-loss of 10 to 20 rel.% is mainly observed in experiments withXH2Oin=0 and some experiments with XH2Oin b 0.1 (22 experiments,Appendix 2). The Fe-loss is higher than 20 rel.% in 5 experiments withXH2Oin = 0. However, in 34 experiments with higher XH2Oin, the Fe-loss in the glasses is lower than 7 rel.%. The Fe-loss effect is usually ex-plained by a reduction of part of the ferric iron to ferrous iron duringthe experiments which are performed at conditions more reducedthan those of the synthesis of starting glass (at oxidizing atmosphericconditions). The most reduced conditions are obtained at low XH2Oin(see above) which explains the strong Fe-loss observed at theseconditions.
Fluid in equilibrium with experimental glasses consists of H2O andCO2 in most of the runs (Table 2, Appendix 2). Only in a few most re-duced samples (runs 47 and 52 with estimated fO2 on the level ofΔNNO = −1.62 and −1.73 at 500 MPa) a presence of a more reducedC–O-bearing species is possible. According to the diagram Pawley et al.(Fig. 1 in Pawley et al., 1992) the ratio of CO:CO2 in these runs might beabout 0.1:0.9 (the diagram was constructed for pressure of 100 MPa).The possible presence of a small fraction of CO in the fluid of the most
reduced runs could result in a slight decrease of CO2 solubility in theseglasses, although such deviation is expected to be within analytical un-certainty (see Fig. 5).
3.2. Distribution of H2O and CO2 in glasses
3.2.1. Reference glassesThe major element compositions of glasses that were used as stan-
dards for calibration of absorbance coefficients for IR carbonate bandsare given in Appendix 1 and the data confirm that changes in CaO con-centrations as a result of addition of CaCO3 to the starting glass (seeabove, capsule preparation) are less than 5 rel.%. The homogeneity ofthe reference glass samples (made to perform the calibration of FTIRspectra) with respect to fluid distributionwas checked by analyzing dif-ferent parts from the top (U), central (M) and bottom (D) parts of sam-ples. Glass pieces from these three zones were analyzed by bulktechniques and FTIR. Data obtained for samples A2549 and B2507show that the variations are within the uncertainty of the analyticaltechnique of the bulk analytical methods and are less than 0.2 wt.%H2O and 200 ppm CO2 from the top to the bottom of the glass cylinders(see Appendix 1). Three bulk carbon measurements in glass fragmentscollected from different parts of the samples were also performed foreach of the other reference glasses SC1, OB93, Etna and 169oxi andvary also within the same range.
3.2.2. Solubility experimentsThe CO2 and H2OMIR spectra collected in the glasses can be used to
evaluate towhich extent the run duration of solubility experiments wassufficient to reach a homogeneous distribution of volatiles in the glasses,which would indicate that equilibrium between coexisting melt andfluid was reached. The analytical errors given in Table 3 for CO2 andH2O (MIR values) are approximately ±10% relative and are calculatedby error propagation taking into account the standard deviation of sev-eral infrared spectra collected at various locations of the glasses as wellas errors resulting from the uncertainty on the thickness of the sample,on the density, on the absorption coefficient. However, by comparingspectra at different positions of one single sample, the reproducibilityof spectra is better than 3% relative formost of the experiments, indicat-ing that there are no equilibrium problems for the volatile distribution.
3.3. Determination of IR absorption coefficients
From the MIR spectra, it is evident that in the studied mafic meltsCO2 dissolves as carbonate species (CO3
2−) only, which appears as adouble-peak at 1430 and 1520 cm−1 (Fig. 2). The characteristic peakof molecular CO2 at 2350 cm−1 was not detected in the samples. Thisobservation is in agreement with previous IR studies of basaltic andmafic glasses (see review in Ni and Keppler, 2013).
The calibration of themolar absorption coefficients for the carbonateband at 1430 cm−1 (ε1430) and 1520 cm−1 (ε1520) was made for sixcompositions using the data of bulk carbon analyses of the referenceglasses (Table 3; Appendix 1). However, in this paper CO2-concentrationswere calculated using the 1430 cm−1 band only becausethe band at 1520 cm−1 can be affected by the H2O-band at 1630 cm−1,as discussed in previous studies (e.g., Botcharnikov et al., 2006; Behrenset al., 2009). For compositions SC1, OB93, Etna and 169oxi, only one ref-erence glass was available and the ε1430 and ε1520 values were deter-mined using the average value of three CO2 bulk determinations forevery composition. For the compositions B2507 and A2549, two glasseswith different H2O and CO2 contents were available for each composi-tion. The ε1430 and ε1520 values given in Table 3 are average data foreach composition and are similar within error (see ε1430 av and ε1520 av
in Table 3). For these 2 compositions, ε1430 and ε1520 were also deter-mined using the slope of the linear regression of normalized absorbanceat 1430 cm−1 (or 1520 cm−1) vs. bulk CO2 concentration (CO2-tot) andforced to pass through the origin (Fig. 3a). This method yielded similar

118 T.A. Shishkina et al. / Chemical Geology 388 (2014) 112–129
values of ε1430 lin of 310 ± 43 L/(mol∗cm) for the composition A2549and 322 ± 50 L/(mol∗cm) for B2507 (Table 3).
Reference glasses were not available for compositions B2518and E2624 and the absorption coefficients were estimated by usingthe data obtained for glasses B2507 and A2549. These four glasseshave the lowest SiO2 content and the highest MgO contents and arecompositionally close to B2507 and A2549. The four reference glasseswere used to calculate a common ε1430lin by a regression line (Fig. 3a,normalized absorbance at 1430 cm−1 vs. CO2-tot) and a value of314 ± 44 L/(mol∗cm) can be derived which is identical within errorto the individual values for B2507 and A2549 (common ε1520lin =362 ± 38 L/(mol∗cm)). Averaging of all ε1430av values for B2507 andA2549 reference glass pieces gives a result of 308 ± 35 L/(mol∗cm).The CO2 concentrations calculated from MIR spectra using ε1430 av andε1430lin differ from each other by less than 2 rel.%. Finally, the averagevalue of 308 ± 35 L/(mol∗cm) for ε1430av was used for the calculationof CO2 content in the four samples B2518, B2507, A2549 and E2624.The values of ε1430 used for the other compositions SC1, OB93, Etnaand 169oxi are given in Table 3. The values of ε1430 and ε1520 from thisstudy are identicalwithin errorwithmost of thepreviously reported de-terminations for mafic melts (Table 3, Fig. 4).
Dixon and Pan (1995) proposed that the value of the molar absorp-tion coefficient for carbonate species is a function of the glass composi-tion. Using several values of ε1520 (basanite; tholeiite, leucitite, diopside,albite and jadeite) they derived an equation:
ε1520 ¼ 451−342 � Na= Naþ Cað Þð Þ: ð6Þ
The dataset for ε1520 obtained in this work shows that a linear corre-lation of ε1520 with Na/(Na + Ca) mainly derived from diopside, albiteand jadeite compositions cannot be confirmed for most natural maficcompositions. The same conclusion can be done for ε1430 values
Table 3Molar absorption coefficients for determination of carbonate and water species by MIR-spectro
ε1430av, (CO32−),
L/(mol∗cm)ε1430lin, (CO3
2−),L/(mol∗cm)
ε1520av, (CO32−),
L/(mol∗cm)ε1520L/(mo
Alkali basalt, B2507 311 ± 41 322 ± 50 380 ± 30 380 ±Alkali basalt, B2518 n.d. n.d. n.d. n.d.Basanite, A2549 306 ± 32 310 ± 43 349 ± 25 351 ±Nephelinite, E2624 n.d. n.d. n.d. n.d.MORB, 169oxi 306 ± 11 n.d. 359 ± 25 n.d.Alkali basalt, Etna 360 ± 24 n.d. 394 ± 27 n.d.Alkali basalt, OB93 341 ± 19 n.d. 385 ± 18 n.d.Ferro-basalt, SC1 329 ± 15 n.d. 372 ± 14 n.d.
Melt composition Reference ε14
CO32
Basalt Stolper (1982)MORB Fine and Stolper (1986) 375Basalts (different) Pandya et al. (1992)Leucitite Thibault and Holloway (1994)MORB Dixon et al. (1995)Basanite Dixon and Pan (1995) 281MORB Jendrzejewski et al. (1997)Tholeiite, high-Al basalt Yamashita et al. (1997)Shoshonite, latite Di Matteo et al. (2006)Phonotephrite Behrens et al. (2009) 308Tholeiite, N72 Shishkina et al. (2010) 317Shoshonite Vetere et al. (2011) 356Phonotephrite AH1 Vetere et al. (2014) 294Phonotephrite AH2 Vetere et al. (2011) 244Phonotephrite AH3 Vetere et al. (2014) 264Latite Vetere et al. (2014) 215
Description of the calculation procedures can be found in the text.ε1430, ε1520 or ε3550lin — molar absorption coefficients that were determined by linear fittiε1430, ε1520 or ε3550av — molar absorption coefficients that were calculated by averaging ofε1430* (CO32-), ε3550* (H2O)— values of molar absorption coefficients that were used for ca± values for the coefficients determined in this study represent ±3 sigma standard deviations
(Fig. 4), though recent determinations of ε1430 performed by Vetereet al. (2014) represent a general negative correlation between ε1430and Na/(Na + Ca).
The molar absorption coefficient for the water band at 3550 cm−1
was calculated for the four compositions B2518, B2507, A2549 andE2624. Similar to the approach applied for ε1430, a regression betweenthe normalized IR absorbance and the H2O content in all glasses mea-sured by KFT (for glasses with less than 2.5 wt.% H2O) was calculated.Using a linear regression for all four studied compositions a valueε3550lin of 57.3 ± 3.4 L/(mol∗cm) is determined (ε3550lin in Table 3,Fig. 3b). Averaging the individual ε3550 determinations gives similar re-sults with a value ε3550av of 59.2 ± 4.0 L/(mol∗cm) which was finallyused for the calculation of H2O in this study (Table 2). Both valuesε3550lin and ε3550av are identical within error to those determined for ba-salts in previous works (Table 3).
3.4. H2O and CO2 concentrations in mafic melts
The determination of fluid compositionswas not the primary goal ofthis study which is focusing on the determination of the compositionaleffect of silicate melts on CO2 and H2O concentrations inmelts, and par-ticularly on themaximumCO2 concentrationswhich can be incorporat-ed in silicate melts. Thus, a large number of experiments wereperformed at very low water activities and only few solubility datawere obtained for each investigated composition and pressure. In sever-al run products conducted at very low water activities, the water con-centration was analyzed with KFT and MIR and the results areidentical within error (Table 2) for glasses containing less than2.5 wt.% H2O, indicating the good reliability of our measurements. TheMIR analyses yielded generally lower valueswhen thewater concentra-tions was higher than 2.5 wt.%, which may be related to the saturation
scopy in this study and previous works.
lin, (CO32−),
l∗cm)ε3550av, (H2O)L/(mol∗cm)
ε3550lin, (H2O)L/(mol∗cm)
ε1430* (CO32−),
L/(mol∗cm)ε3550* (H2O),L/(mol∗cm)
36 60.5 ± 3.3 58.3 ± 3.1 308 ± 35 59.2 ± 4.060.3 ± 3.7 56.3 ± 6.0 308 ± 35 59.2 ± 4.0
33 57.3 ± 1.8 56.8 ± 3.0 308 ± 35 59.2 ± 4.056.7 ± 8.3 53.1 ± 10.5 308 ± 35 59.2 ± 4.0n.d. n.d. 306 ± 11 59.2 ± 4.0n.d. n.d. 360 ± 24 59.2 ± 4.0n.d. n.d. 341 ± 19 59.2 ± 4.0n.d. n.d. 329 ± 15
30 L/(mol∗cm) ε1520 L/(mol∗cm) ε3550 L/(mol∗cm)
− CO32− H2O
67.1 ± 6± 20 375 ± 20
61 ± 1340 ± 20
63 ± 3± 6 284 ± 5
398 ± 1064 ± 160 ± 2
± 110 63.9 ± 5.4± 23 361 ± 43 68 ± 10± 18± 16± 15± 15± 8
ng of the data, see Fig. 3.the individual ε values for each standard glass piece.lculations of CO2 or H2O concentrations in glasses in this study..
0
1
2
3
4
5
6
1200 1700 2200 2700 3200 3700
Ab
sorb
ance
un
its
Wavenumber (cm-1)
E2624_40A2549_47
B2507_30
B2518_09
Etna-12
169oxi-17
OB93-1
H2O+OHCarbonate
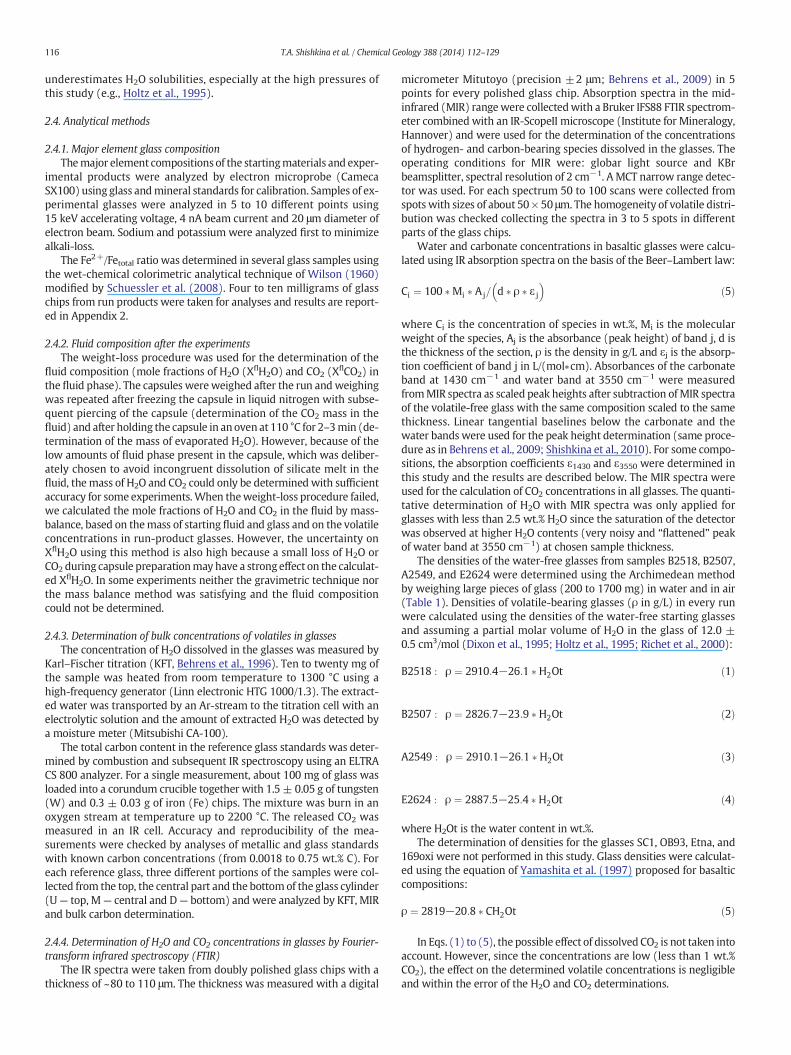
Fig. 2.Representativemid-infrared spectra for the studied compositions. Each spectrum represents a runwith the highest CO2 (lowest H2O) content at 500MPa. Spectraweremodified bya subtraction of a spectra of volatile-free glass from the original sample spectra and were scaled to the thickness of 100 μm. Dotted lines represent peak positions for bands of carbonatedoublet (approximately at 1430 and 1520 cm−1, note the shift of peak positions for different compositions) and dashed-dotted line shows the position of water band (approximately3550 cm−1). Dashed lines represent baselines for these bands that were constructed for determination of absorbance values (peak height).
119T.A. Shishkina et al. / Chemical Geology 388 (2014) 112–129
of the IR band at 3550 cm−1 (see above). Thus, when possible, KFT datawere used to construct the figures and for further calculations. MIR dataused for further calculations in this study were always lower than1.3 wt.% H2O. The datasets are not sufficient to determine accuratelythe evolution of CO2 and H2O over the whole range of XflH2O from 0to 1 for each composition. In addition, XflH2O could not be determinedsystematically and there is a large uncertainty on most values derivedeither from gravimetry or from mass balance because small amountsof glass and fluid were used (the size of the capsule was small becauseup to 6 capsules were placed simultaneously in the pressure vessels).
As expected, the solubility of volatiles increases significantly with anincrease in total pressure for all investigated compositions (Table 2,Fig 5). At 100 and 500MPa, the melt composition has a pronounced ef-fect on the CO2 solubility whereas it has an almost negligible effect onthe solubility of H2O (Table 2). At 100 MPa, about 3.1–3.4 wt.% H2Ocan be dissolved in the samples B2518, B2507, A2549 and E2426 inruns with XH2Oin = 1 (Table 2). This is consistent with the availabledata on H2O solubility in a variety of basaltic compositions at 100 MPawith values ranging between 3.0 and 3.5 wt.% H2O (Dixon et al., 1995;Pineau et al., 1998; Berndt et al., 2002; Shishkina et al., 2010; Lesneet al., 2011a; Vetere et al., 2011; see also Table 3b in Appendix). At500 MPa, the H2O content in glasses saturated with pure H2O(XH2Oin = 1) was determined only in samples SC1, OB93, Etna and169oxi because of quench problems for the other compositions. TheH2O solubility at 500 MPa is within a narrow range from 8.8 to9.5 wt.% H2O (Table 2) which is consistent with previous determina-tions reported H2O concentrations in the range 8.8 to 10.3 wt.% H2O(Appendix 3b).
Isobaric solubility curves at 100 and 500 MPa for mixed H2O–CO2
fluid in alkali basalts (B2507, B2518), basanite (A2549) and nephelinite(E2624) are shown in Fig. 5. This plot demonstrates a large variation inthe concentrations of dissolved CO2 in melts of different compositionsand only a weak or no compositional dependence for H2O at 100 MPa.The 500MPa isobaric solubility curves obtained for the othermelt com-positions are illustrated in Fig. 6. The SC1, Etna and 169oxi compositionsshow similar trends, whereas OB93 composition has slightly lower CO2
concentrations and is similar to the island-arc tholeiite (compositionN72 in Table 1) investigated by Shishkina et al. (2010). It must benoted that these five compositions have similar maximum CO2 concen-trations as was reported for latite and shoshonite (Vetere et al., 2014)though significantly lower relative to other alkali-rich melts (basanite
and nephelinite from this study and phonotephrites from Behrenset al., 2009; Vetere et al., 2014).
The solubility of CO2 in melts coexisting with absolutely H2O-freefluids (XflH2O = 0) could not be determined in this study. As noted byseveral authors, at relatively oxidizing conditions, it is extremely diffi-cult to reach such conditions inmost high pressure apparatus (especial-ly IHPV and cold seal pressure vessels) because hydrogen, which isalways present in small amounts, diffuses through noblemetal capsulesat high pressure. As a result of redox reactions, leading to the reductionof ferric iron, hydrogen reacts with oxygen to form OH-bearing speciesin melt and fluid (e.g., Gaillard et al., 2003; Botcharnikov R.E. et al.,2005). In this study, the amount of H2O detected in glasses from exper-iments with nominal XH2Oin=0 is in the range 0.3 to 1.2 wt.% H2O formost samples (Table 2, Appendix 2). Therefore, the CO2 concentrationsin melts coexisting with a pure CO2-fluid were evaluated by extrapolat-ing the isobaric solubility curves through experimental data points to aH2O concentration of 0 wt.%, as shown in Figs. 5 and 6. The similar pro-cedure was used for previously published data discussed in this study(Table 3c in Appendix). The resulting CO2 solubility values vary signifi-cantly as a function of melt composition at all investigated pressures. At100 MPa, the solubility values of CO2 extrapolated to XflH2O = 0 is~400 ppm in OB93 and in typical island-arc tholeiitic basalts andreaches approximately 850 ppm for alkali basalts B2507 and B2518.The basanite A2549 can dissolve more than 4 times more (around1800 ppm) and the nephelinite E2624 almost 6 times more (around3000 ppm) CO2 at the same pressure (Figs. 5). At 500 MPa, the solubil-ities of CO2 extrapolated to XflH2O = 0 vary between about 3300 ppmfor tholeiites and 14,000 ppm for nephelinite E2624 (Fig. 6).
4. Discussion
4.1. Compositional effect on the solubility of H2O in basaltic melts
The effect of anhydrous melt composition on H2O solubility(XflH2O= 1) for a wide range of silicate melt compositions is relativelyweak although H2O solubility increases slightly with increasing silicacontent (see review of Baker and Alletti, 2012). However, in silicic sys-tems where most of the studies have been performed (e.g., Holtzet al., 1992, 1995, 2000; Dingwell et al., 1997; Behrens et al., 2001;Behrens and Jantos, 2001; Di Matteo et al. 2006), it has been observedthat increasing Na/K ratio and peralkalinity (as measured by ratios

0
10
20
30
40
50
60
0.00 0.05 0.10 0.15 0.20
4401
*A14
30/(
d*r
), [L
/(m
ol*
cm)]
CO2 (wt.%) Bulk carbon analysis
A2549
B2507
All compositions: ε1430lin=314±15, R2 = 0.81
B2507 ε1430lin= 322±17, R2 = 0.85A2549 ε1430lin= 310±14, R2 = 0.71
St-2 (U,M,D)
St-4 (M,D)
St-3 (U)
St-3 (M,D)
St-1 (U,M,D)
0
20
40
60
80
100
120
140
0.0 0.5 1.0 1.5 2.0 2.5 3.0
1802
*A 3
550
/ (d
*r)
, [L
/(m
ol*
cm)]
H2O (wt.%) KFT
B2507
A2549
E2624
B2518
All compositions: 3550=57.3±3.4, R² = 0.98
B2518: 3550=56.3±6.0, R² = 0.97B2507: 3550=58.3±3.1, R² = 0.99A2549: 3550=56.8±3.0, R² = 0.99E2624: 3550=53.1±10.5, R² = 0.88
b
a
Fig. 3. (a) Calibration plot for determination of the absorption coefficient for carbonateband at 1430 cm−1 for compositions A2549 and B2507: normalized absorbance of the1430 cm−1 band versus total carbon content measured by bulk carbon analyses in stan-dard glasses. The fit was forced through the origin. (b) Calibration plot for determinationof the absorption coefficient for water band at 3550 cm−1: normalized absorbance of the3550 cm−1 band vs. water concentration in glasses determined by KFT for experimentaland standard glasses of four compositions (B2507, B2518, A2549 and E2624). The fitwas forced through the origin. Errors represent ±3sigma. See text for the description ofcalculation and Table 3 for values.
170
195
220
245
270
295
320
345
370
395
420
0.0 0.1 0.2 0.3 0.4 0.5 0.6 0.7 0.8 0.9 1.0
ε152
0 M
easu
red
Na/(Na+Ca) Dixon and Pan, 1995
Di
ε1520calc =451 - 342*(Na/(Na+Ca)) (Dixon and Pan, 1995) Ab,
Jd
170
195
220
245
270
295
320
345
370
395
0.0 0.1 0.2 0.3 0.4 0.5 0.6 0.7 0.8 0.9 1.0
ε143
0 M
easu
red
Na/(Na+Ca) Dixon and Pan, 1995
Other studiesThis studyDixon and Pan, 1995Vetere et al., 2014Synthetic mineral glasses
Di
ε1430calc =473 - 393*(Na/(Na+Ca)) (Dixon and Pan, 1995)
Ab, Jd
a
b
Fig. 4.Molar absorption coefficients for carbonate bands at 1520 cm−1 and 1430 cm−1 formafic glass compositions from this study and from previous works plotted against themolar ratio Na/(Na + Ca) (Fine and Stolper, 1986; Thibault and Holloway, 1994; Dixonand Pan, 1995; Jendrzejewski et al., 1997; Jakobsson, 1997; Behrens et al., 2009; Shishkinaet al., 2010; Vetere et al., 2011, 2014) and for mineral glasses of albitic and jadeitic (Fineand Stolper, 1985), and diopsidic (Fine and Stolper, 1986) compositions (for values seeTable 3). The solid line would be the absorption coefficient predicted using the equationof Dixon and Pan (1995) (Eq. (6) in the text).
120 T.A. Shishkina et al. / Chemical Geology 388 (2014) 112–129
such as (Na+ K)/Al or (MCLNK–Al)/O [(MCLNK–A)/O=100 · (2Mg+2Ca + Li + Na + K–Al)/O]), usually at the expense of SiO2 content,tends to increase H2O solubility. In contrast, systematic studies formafic melts are scarce. Benne and Behrens (2003) studied thehaplobasaltic system Ab–An–Di at 50, 200 and 500 MPa and foundthat the compositional effect is not pronounced at low pressures(below 200 MPa), but increases at higher pressure of 500MPa. Accord-ing to their observations, a decrease in H2O solubility is observed withan increase in the proportion of Di component and An/Ab ratio. Dixon(1997) proposed a simple linear positive correlation between H2O solu-bility and SiO2 content of the melt for mafic systems (empirically cali-brated for a SiO2 range of 40–49 wt.%). Moore et al. (1995, 1998) havedeveloped an empirical expression for H2O-solubility in silicate meltsas a function of pressure, temperature, H2O-fugacity in the fluid and
partial molar volume of H2O which is a function of composition (SiO2,Al2O3, FeO, CaO, Na2O). This equation can be used for pressures up to300 MPa. Recently, Lesne et al. (2011a) investigated three alkali-richbasalts and found a positive correlation between H2O solubility andNa2O + K2O (wt.%). This correlation, which takes into account also thepositive effect of oxygen fugacity noted by Berndt et al. (2002), wasexpressed in the form:
H2O wt:%ð Þ ¼ H2OMORB wt:%ð Þ þ α � P barð Þ þ βð Þ� Na2Oþ K2Oð Þ wt:%ð Þ þ γ � ΔNNOþ δ ð7Þ
where H2OMORB is the solubility of water in the MORB determined bythe model of Dixon et al. (1995), ΔNNO is the oxygen fugacity relativeto NNO buffer and α=5.84 ∗ 10−5, β=−2.04 ∗ 10−2, γ=4.67 ∗ 10−2,

0.3
X H Ofl2
0.6
0
1000
2000
3000
4000
5000
6000
7000
8000
9000
10000
0.0 1.0 2.0 3.0 4.0 5.0 6.0 7.0 8.0 9.0 10.0
H O (wt.%) KFT, MIR2
B2518B2507A2549E2624
B2518B2507A2549E2624
500 MPa100 MPa
)m
pp(
OC
2
11000
12000
13000
14000
Fig. 5. Solubility of H2O and CO2 coexisting with H2O–CO2mixed fluids in alkali-richmaficmelts at 100 (light symbols) and 500 MPa (dark symbols): alkali basalts (B2518 andB2507), basanite (A2549) and nephelinite (E2624). The solid lines represent isobars fittedto experimental data. Dashed lines show extrapolated solubility curves at 500 MPa tohigher water contents in the melts (see text). Alkali basalts B2518 and B2507 show iden-tical solubility isobars for both pressures. Only two isopleths for the composition ofcoexisting fluid could be constrained from our data (XH2Ofluid of 0.3 and 0.6).
0
1000
2000
3000
4000
5000
6000
7000
8000
9000
10000
0 1 2 3 4 5 6 7 8 9 10 11 12H O (wt.%)2
)m
pp(
OC
2
Tholeiite
Phonotephrite
Nephelinite
Basanite
500 MPa
Ferrobasalt, SC1
MORB, 169oxiAlkali basalt, AtnaAlkali basalt, OB93
Alkali basalt
11000
12000
13000
14000
Fig. 6. Solubility of H2O and CO2 coexisting with H2O–CO2-bearing fluids inmafic melts at500 MPa. Experimental data for ferrobasalt SC1, alkali basalt OB93, alkali basalt Etna andMORB 169oxi are shown with different symbols (see legend) and error bars. Solid linesrepresent 500 MPa isobars for nephelinite E2624, basanite A2549 and alkali basaltsB2518 and B2507 (see Fig. 5). Dashed-dotted line shows the solubility isobar forphonotephrite at 500MPa and 1250 °CbyBehrens et al. (2009). Dotted line represents sol-ubility isobar for tholeiite at 500MPa and1250 °Cof Shishkina et al. (2010). Note: The con-centrations of CO2 in alkali basalt OB93 equilibrated with CO2-rich fluids are about 2–2.5times lower than those reported by Botcharnikov et al. (2005b). This discrepancy is attrib-uted to an erroneous subtraction procedure for IR spectra applied for OB93 samples (con-ducted by Freise, 2004 and reported in thework of Botcharnikov et al., 2005b). The spectrawere normalized to a wrong thickness of the volatile-free reference material used for thecalculations. Hence, the results for OB93 composition at 500 MPa published previouslyshould not be used in the future and should be replaced with the data reported in thisstudy.
121T.A. Shishkina et al. / Chemical Geology 388 (2014) 112–129
and δ=−2.29 ∗ 10−1 are empirical parameters derived from fitting ofthe experimental data (Lesne et al., 2011b).
Fig. 7 illustrates the compilation of the experimental data onH2O sol-ubility in melts with mafic to intermediate compositions at pressuresfrom 50 to 500MPa from this study aswell as from previous determina-tions (Appendix 3b). Following the parameterizations proposed byDixon (1997) and Lesne et al. (2011a), the effects of SiO2 content andof Na + K (atomic proportions) are shown in Fig. 7. The positive effectsof Na+ K and SiO2 becomemore pronounced with increasing pressure.It is emphasized that the experimental conditions in the different stud-ies may vary in terms of temperature and redox conditions, which mayaccount for additional variations at a given pressure. At all pressures re-ported in Fig. 7, the dependence of H2O-solubility is better correlatedwith Na+ K than with the SiO2 content (wt.%). Assuming a linear func-tion between H2O solubility and Na + K
H2O ¼ a � Kþ Nað Þ þ b ð8Þ
and considering that the parameters a and b can be fitted by polynomialfunctions of pressure, following empirical equation can be formulated tocalculate H2O solubility up to 500 MPa:
H2O ¼ 3:36 � 10−7 � P3−2:33 � 10−4 � P2 þ 0:0711 � P−1:1309� �
� Naþ Kð Þ þ −1:20 � 10−5 � P2 þ 0:0196 � P þ 1:1297� �
; ð9Þ
where P is pressure in MPa and (Na+ K) are atomic fractions of cationsin melt.
For the calibration of the coefficients of the polynomial Eq. (9) wehave used our and previously published experimental data on H2O sol-ubility in mafic to intermediate melts determined at 50, 100, 200, 300and 500 MPa, at temperatures of 1200 to 1250 °C, and at relatively
oxidizing conditions (NNO + 1 to NNO + 4; 99 datapoints, see refer-ences in Appendix 3b). About 98% of calculated H2O-solubilities arewithin the ±10 rel.% deviation interval from experimental values(Fig. 8). For testing the equation we have used additionally 86 datapoints at other pressures (23 to 500 MPa) and temperatures between1050 and 1400 °C (Appendix 3b). Calculated H2O-values for 78% ofthese data are within the ±10 rel.% deviation interval (Fig. 8). Eq. (9)can be used for calculation of H2O-solubility in mafic to intermediate(up to 65 wt.% SiO2) at relatively oxidized conditions (NNO + 1 toNNO + 4) within a wide range of temperatures between 1050 and1400 °C, but preferably 1150–1250 °C.
It should be emphasized that the empirical parameterization pro-posed above as well as those proposed by Dixon (1997), Moore et al.(1998) and Lesne et al. (2011a) and in earlier studies for specific compo-sitions (e.g., Stolper, 1982; Holloway and Blank, 1994) all indicate a lowcompositional effect on H2O solubility. Therefore, the predicted valuesare mostly within the uncertainty of determinations for many experi-ments, especially at pressures below 200 MPa.
4.2. Compositional effect on CO2 solubility in basaltic melts
The dataset presented in this study confirms the strong effect of thesilicate melt composition on CO2 solubility which was already noted in

1.0
2.0
3.0
4.0
5.0
6.0
7.0
8.0
9.0
10.0
11.0
12.0
13.0
0.00 0.05 0.10 0.15 0.20 0.25
H2O
(w
t.%
)
Na+K (atomic proportion)
50 MPa
100 MPa
200 MPa
300 MPa
500 MPa
This paper
H2O=21.12(Na+K)+7.93R2=0.83
H2O=8.43(Na+K)+6.00R2=0.95
H2O=6.21(Na+K)+4.52R2=0.72
H2O=4.28(Na+K)+2.94R2=0.79
H2O=1.75(Na+K)+2.12R2=0.46
1.0
2.0
3.0
4.0
5.0
6.0
7.0
8.0
9.0
10.0
11.0
12.0
13.0
40 42 44 46 48 50 52 54 56 58 60 62 64 66 68 70
H2O
(w
t.%
)
SiO2 (wt.%)
H2O=0.14(SiO2)+2.18R2=0.59
H2O=0.19(SiO2)+2.91R2=0.65
H2O=0.06(SiO2)+2.16R2=0.41
H2O=0.04(SiO2)+1.21R2=0.50
H2O=0.02(SiO2)+1.16R2=0.48
a
b
Fig. 7. H2O solubility inmafic and intermediate melts versus (a) Na+K (atomic fraction)and (b) SiO2 (wt.%) at pressures from 50 to 500 MPa and temperatures of 1200–1250 °C.Data from this and previous studies given in Appendix 3b (Dixon et al., 1995; Moore et al.,1995, 1998; Pineau et al., 1998; Webster et al., 1999; Berndt et al., 2002; Benne andBehrens, 2003; Botcharnikov et al., 2005b; Di Matteo et al., 2006; Iacono-Marziano et al.,2007; Stelling et al., 2008; Schmidt and Behrens 2008; Behrens et al., 2009; Shishkinaet al., 2010;Vetere et al., 2011, 2014; Lesne et al., 2011a). Linear equations showing the de-pendence of H2O solubility on composition are shown for every pressure.
0
2
4
6
8
10
12
14
0 2 4 6 8 10 12 14
H2O
(w
t.%
) ca
lcu
late
d w
ith
Na+
K
H2O (wt.%) Experiments
Data NOT used for calibrationData used for calibrationThis paper
-10rel.%
+10rel.%
Fig. 8. H2O solubility inmafic and intermediatemelts calculated as a function of K+Na inthemelt using empirical Eq. (9) vs. experimentally determined values from this study andotherworks (see references in caption of Fig. 7 andAppendix 3b). Calibration of the Eq. (9)was performed using dataset of experimentally determined H2O solubility at pressures of50, 100, 200, 300 and 500 MPa and temperatures of 1200–1250 °C. For testing of theEq. (9) the experiments performed at 25–500 MPa and 1000–1420 °C were employed(see Appendix 3b).
122 T.A. Shishkina et al. / Chemical Geology 388 (2014) 112–129
many previous studies. At the investigated conditions, the different con-centrations observed in Fig. 6 aremainly due to structural changes in thesilicate melts influencing the amount of carbonate-bearing specieswhich can be incorporated in the melt structure (e.g., Brey, 1976;Holloway and Blank, 1994; Dixon et al., 1995; Dixon, 1997; Brookeret al., 2001a, 2001b). Detailed reviews on the incorporation mecha-nisms of C-bearing species are given in Blank and Brooker (1994) andNi and Keppler (2013) and are not detailed in this study. This studywas mainly performed to extend the database on CO2 solubility for awide variety of melt compositions and to improve existing models.
Our results on CO2 solubility using eight new compositions are com-binedwith previous data to parameterize the compositional effect of sil-icate melts on CO2 solubility. The dataset which has been used is givenin Appendix 3c and there is a general negative trend between CO2 solu-bility and SiO2 and Al2O3, whereas general positive trends are observed
for MgO and CaO and total alkalis (Fig. A-1 in Appendix). However, ithas been shown in the past that more complex compositional or/andstructural parameters are required for a reliable prediction and under-standing of mechanisms of CO2 solubility. For example, there is a clearnegative correlation between CO2-solubility and the widely usedindexAl2O3/(CaO+Na2O+K2O) (mol%) (Fig. 9a). Early studies also in-dicated that depolymerized melts have higher CO2 solubilities than po-lymerized melts, at least at high pressures (1–2 GPa; e.g. Mysen, 1976).The degree of melt polymerization is commonly expressed by the pa-rameter NBO/T (non-bridging oxygen per tetrahedrally coordinatedcation) and Brooker et al. (2001a,b) have shown a clear positive corre-lation of CO2-solubility with NBO/T for silicate melts at 2 GPa. Iacono-Marziano et al. (2012) have proposed another parameter, NBO/O,which is the amount of non-bridging oxygens divided by the total oxy-gen and which should be a measure of the oxygen which is available toform carbonate-bearing species in the melt.
Fig. 9 shows the relationship between CO2-solubility and alumi-num saturation index A/CNK (Al/(Ca + Na + K) (mol%)), agpaiticindex ((Na + K)/Al (mol%)), NBO/O (following the procedure used inIacono-Marziano et al., 2012) and NBO/T. There are several approachesto calculate NBO/T depending on which cations are ascribed asnetwork-modifiers or network-formers. Here we use an approach pro-posed by Brooker et al. (2001a,b). In this calculation Si, Ti, Al3+ and allFe (expressed as Fe3+) are considered as tetrahedral cations (T) and allMg2+, Ca2+, Na+ and K+ in excess are network modifiers (Fig. 9c). Ingeneral there is a negative correlation of CO2 solubility with A/CNK andpositive correlation with agpaitic index, NBO/O and NBO/T. However, itcan be noted that parameters such as NBO/T are probably not the bestchoice formodeling the ability ofmelt to dissolve CO2. A poor correlationbetween NBO/T and CO2 solubility was also reported by Brooker et al.(2001b) for melts with different MgO concentrations at 2 GPa.
In addition to parameters reflecting melt polymerization, the abilityof different network modifiers to form complexes with carbonate ionshould also control the amount of CO2 dissolved as carbonate speciesin themelt. Taking this parameter into account, and based on the valuesof Gibbs free energies for carbonation reactions for Ca, K, Na, Mg and Fegiven by Spera and Bergman (1980), Dixon (1997) proposed a compo-sitional parameterΠwhich reflects both the degree ofmelt depolymer-ization and the ability of different network modifiers to form carbonate

CO2 = 556.4*ASI-2.65
R² = 0.77
0
500
1000
1500
2000
2500
3000
3500
0.5 0.6 0.7 0.8 0.9 1.0 1.1 1.2 1.3
CO
2(p
pm
)
Aluminum saturation index (ASI): Al/(Ca+Na+K) (mol.%)
100 MPa This study
Other studies
CO2 = 236.8exp2.7*Agp
R² = 0.54
0
500
1000
1500
2000
2500
3000
3500
0.2 0.3 0.4 0.5 0.6 0.7 0.8
CO
2(p
pm
)
Agpaitic index (Agp): (Na+K)/Al mol.%)
CO2 = 124.1exp2.0*NBO/T
R² = 0.58
0
500
1000
1500
2000
2500
3000
3500
0.5 0.6 0.7 0.8 0.9 1.0 1.1 1.2 1.3 1.4 1.5
CO
2(p
pm
)
NBO/T (all Fe as T)
CO2 = 86.0exp6.3*NBO/O
R² = 0.59
0
500
1000
1500
2000
2500
3000
3500
0.20 0.25 0.30 0.35 0.40 0.45 0.50 0.55
CO
2(p
pm
)
NBO/O
b
dc
a
Fig. 9. Dependence of CO2 solubility inmafic melts on (a) aluminum saturation index A/CNK: Al/(Ca+ Na+ K) (mol%), (b) agpaitic index: (Na+ K)/Al (mol%), (c) NBO/T, (d) NBO/O inexperiments at 100MPa. The data are from this study and Shishkina et al. (2010) (black squares) and from other sources (white diamonds) (Stolper and Holloway, 1988; Pan et al., 1991;Mattey, 1991; Pawley et al., 1992; Holloway and Blank, 1994; Thibault and Holloway, 1994; Dixon et al., 1995; Jendrzejewski et al., 1997; Lesne et al., 2011b; Vetere et al., 2011; Iacono-Marziano et al., 2012). NBO/T is calculated following the procedure used by the Brooker et al. (2001a,b)who assigned all Si, Ti, Al3+, Fe3+ and Fe2+ as tetrahedral cations (T) and all Mg2+,Ca2+, Na+ and K+ in excess as network modifiers.
123T.A. Shishkina et al. / Chemical Geology 388 (2014) 112–129
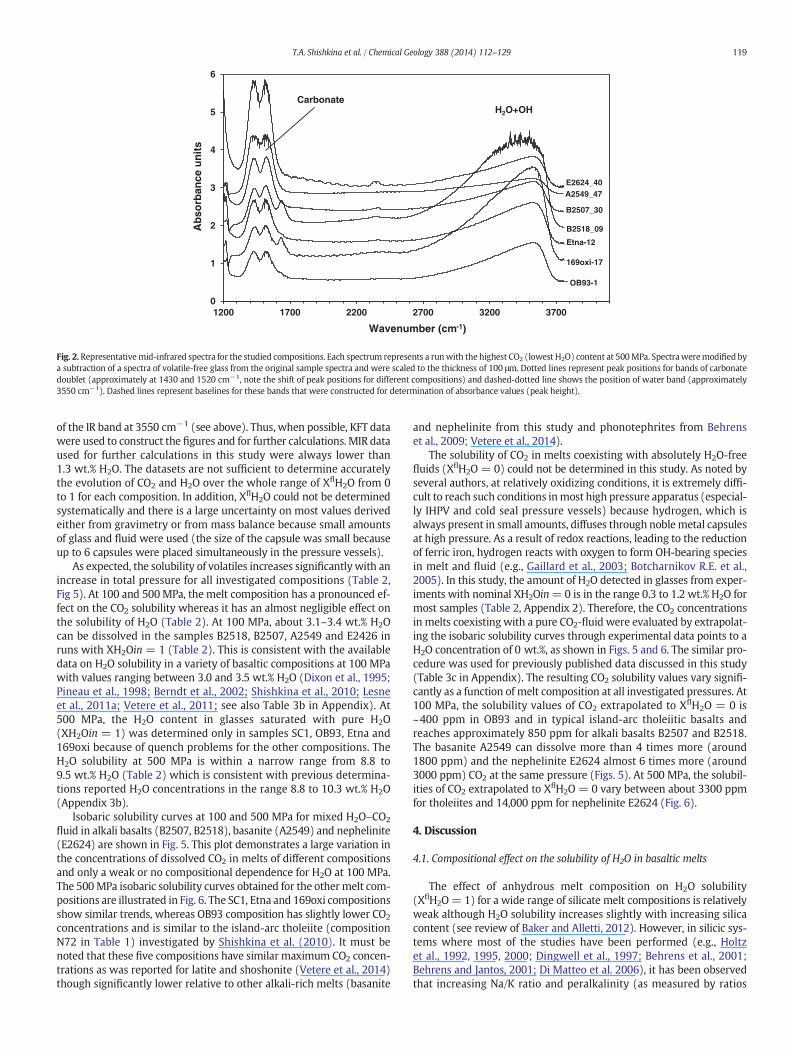
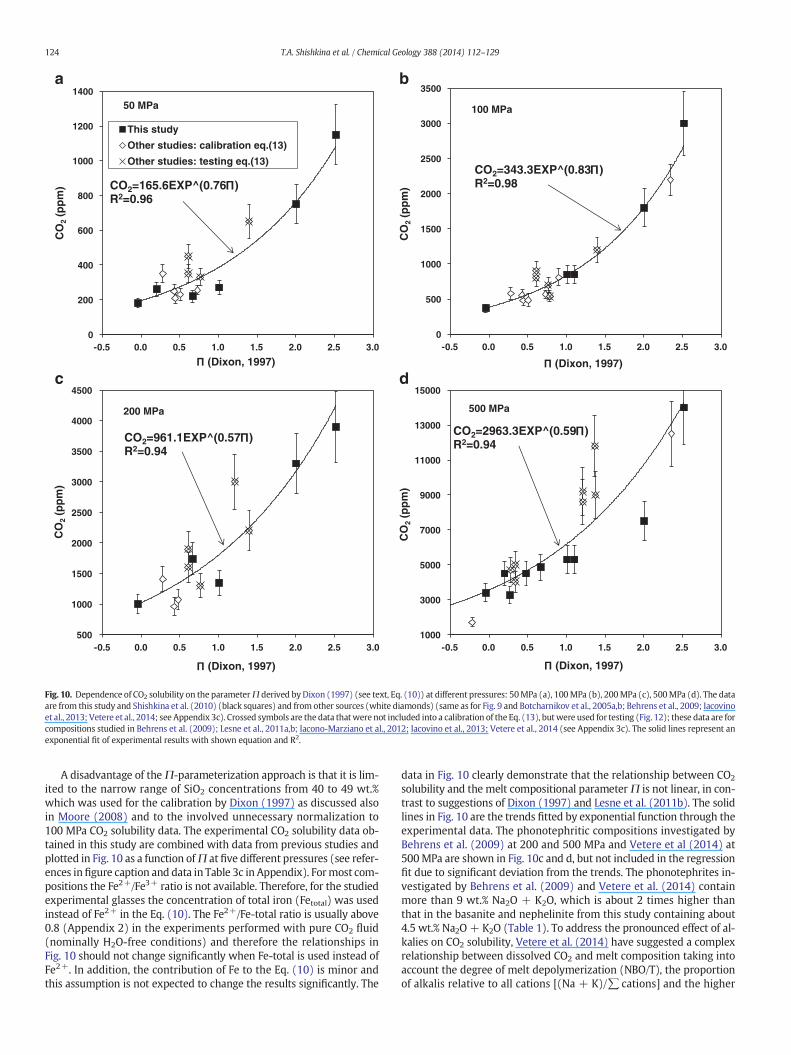
species in the melt. The parameter Π was determined from a linearfitting of the relationship between the CO2 content (solubility atXflH2O= 0) and the compositions of four mafic melts (MORB, tholeiite,basanite and leucitite). The parameterΠwas normalized to the solubil-ity of carbonate in the melt at 100 MPa, resulting in a linear regressionwith corresponding regression coefficients from such a normalization(see Dixon, 1997 for details):
Π ¼ −6:50 � Si4þ þ Al3þ� �
þ 20:17
� Ca2þ þ 0:8Kþ þ 0:7Naþ þ 0:4Mg2þ þ 0:4Fe2þ� �
ð10Þ
where the (Si4+ + Al3+) term accounts for the melt polymerization,whereas the (Ca2+ + 0.8K+ + 0.7Na+ + 0.4Mg2+ + 0.4Fe2+) termreflects the different affinity of cations to form carbonate in the silicatemelt. In the last term, the coefficient attributed to each cation
corresponds to their contribution to the Gibbs free energy of carbon-ation reactions relative to that of Ca (as proposed by Dixon, 1997).Using a dataset on a suite of natural alkali glasses from Hawaii,Dixon (1997) found a linear correlation betweenΠ and SiO2 contentof the glasses and proposed that a simplified compositional parame-terization (only considering the SiO2 content) can be applied. De-spite the empirical nature of this parameter, it showed in general agood correlation with the solubility of CO2 in mafic melts investigat-ed so far. The simplified parameterization was included as a basis forthe widely-used VolatileCalc model (Newman and Lowenstern,2002), whereas the 7-parameter approach was incorporated in thenew SolEx model for mixed fluids (Witham et al., 2012). Recently,the Π parameter was recalibrated by Lesne et al. (2011b) using 3new data points for alkali basalts from experiments at 100 MPa,still resulting in similar linear relation betweenΠ and CO2 solubilityas reported by Dixon (1997).
0
200
400
600
800
1000
1200
1400
-0.5 0.0 0.5 1.0 1.5 2.0 2.5 3.0
CO
2(p
pm
)
(Dixon, 1997)
50 MPa
This study
Other studies: calibration eq.(13)
Other studies: testing eq.(13)
CO2=165.6EXP^(0.76 )R2=0.96
0
500
1000
1500
2000
2500
3000
3500
-0.5 0.0 0.5 1.0 1.5 2.0 2.5 3.0
CO
2(p
pm
)
(Dixon, 1997)
100 MPa
CO2=343.3EXP^(0.83 )R2=0.98
500
1000
1500
2000
2500
3000
3500
4000
4500
-0.5 0.0 0.5 1.0 1.5 2.0 2.5 3.0
CO
2(p
pm
)
(Dixon, 1997)
200 MPa
CO2=961.1EXP^(0.57 )R2=0.94
1000
3000
5000
7000
9000
11000
13000
15000
-0.5 0.0 0.5 1.0 1.5 2.0 2.5 3.0
CO
2(p
pm
)
(Dixon, 1997)
500 MPa
CO2=2963.3EXP^(0.59 )R2=0.94
a b
c d
Fig. 10. Dependence of CO2 solubility on the parameterΠ derived byDixon (1997) (see text, Eq. (10)) at different pressures: 50MPa (a), 100MPa (b), 200MPa (c), 500MPa (d). The dataare from this study and Shishkina et al. (2010) (black squares) and from other sources (white diamonds) (same as for Fig. 9 and Botcharnikov et al., 2005a,b; Behrens et al., 2009; Iacovinoet al., 2013; Vetere et al., 2014; see Appendix 3c). Crossed symbols are the data thatwere not included into a calibration of the Eq. (13), butwere used for testing (Fig. 12); these data are forcompositions studied in Behrens et al. (2009); Lesne et al., 2011a,b; Iacono-Marziano et al., 2012; Iacovino et al., 2013; Vetere et al., 2014 (see Appendix 3c). The solid lines represent anexponential fit of experimental results with shown equation and R2.
124 T.A. Shishkina et al. / Chemical Geology 388 (2014) 112–129
A disadvantage of theΠ-parameterization approach is that it is lim-ited to the narrow range of SiO2 concentrations from 40 to 49 wt.%which was used for the calibration by Dixon (1997) as discussed alsoin Moore (2008) and to the involved unnecessary normalization to100 MPa CO2 solubility data. The experimental CO2 solubility data ob-tained in this study are combined with data from previous studies andplotted in Fig. 10 as a function ofΠ at five different pressures (see refer-ences infigure caption and data in Table 3c in Appendix). Formost com-positions the Fe2+/Fe3+ ratio is not available. Therefore, for the studiedexperimental glasses the concentration of total iron (Fetotal) was usedinstead of Fe2+ in the Eq. (10). The Fe2+/Fe-total ratio is usually above0.8 (Appendix 2) in the experiments performed with pure CO2 fluid(nominally H2O-free conditions) and therefore the relationships inFig. 10 should not change significantly when Fe-total is used instead ofFe2+. In addition, the contribution of Fe to the Eq. (10) is minor andthis assumption is not expected to change the results significantly. The
data in Fig. 10 clearly demonstrate that the relationship between CO2
solubility and the melt compositional parameterΠ is not linear, in con-trast to suggestions of Dixon (1997) and Lesne et al. (2011b). The solidlines in Fig. 10 are the trends fitted by exponential function through theexperimental data. The phonotephritic compositions investigated byBehrens et al. (2009) at 200 and 500 MPa and Vetere et al (2014) at500MPa are shown in Fig. 10c and d, but not included in the regressionfit due to significant deviation from the trends. The phonotephrites in-vestigated by Behrens et al. (2009) and Vetere et al. (2014) containmore than 9 wt.% Na2O + K2O, which is about 2 times higher thanthat in the basanite and nephelinite from this study containing about4.5 wt.% Na2O + K2O (Table 1). To address the pronounced effect of al-kalies on CO2 solubility, Vetere et al. (2014) have suggested a complexrelationship between dissolved CO2 and melt composition taking intoaccount the degree of melt depolymerization (NBO/T), the proportionof alkalis relative to all cations [(Na + K)/∑cations] and the higher

0
200
400
600
800
1000
1200
1400
0.30 0.35 0.40 0.45 0.50 0.55 0.60
CO
2(p
pm
)
(this study)
50 MPa
This study
Other studies: calibration eq.(13)
Other studies: testing eq.(13)
CO2=16.1EXP^(7.54 *)R2=0.96
0
500
1000
1500
2000
2500
3000
3500
0.30 0.35 0.40 0.45 0.50 0.55 0.60
CO
2(p
pm
)
(this study)
100 MPa
CO2=26.1EXP^(8.35 *)R2=0.99
1000
3000
5000
7000
9000
11000
13000
15000
0.30 0.35 0.40 0.45 0.50 0.55 0.60
CO
2(p
pm
)
(this study)
500 MPa
CO2=462.9EXP^(5.97 *)R2=0.94
500
1000
1500
2000
2500
3000
3500
4000
4500
0.30 0.35 0.40 0.45 0.50 0.55 0.60
CO
2(p
pm
)
200 MPa
CO2=167.1EXP^(5.64 *)R2=0.94
*
*
*
(this study)*
a b
c d
Fig. 11. Dependence of CO2 solubility on parameterΠ* (see text, Eq. (11)) at different pressures: 50MPa (a), 100MPa (b), 200MPa (c), 500 MPa (d). The data are from this study (blacksquares) and from other sources (white diamonds), crossed symbols represent the data not used for calibration of Eq. (13) (same as for Fig. 10) The solid lines represent an exponential fitof experimental results with shown equation and R2.
125T.A. Shishkina et al. / Chemical Geology 388 (2014) 112–129
efficiency of Na in comparison to K in stabilizing CO2 in the melt (pa-rameter Na/(Na + K)). Thus, the Π parameterization probably doesnot account correctly for compositionally-controlled CO2 dissolution inextraordinary alkali-rich mafic compositions such as phonotephrites.
In order to adapt the Π-parameterization for the compositions out-side the SiO2 range investigated previously and to avoid specific linearnormalization at 100 MPa, the relationship between (Si+4 + Al+3)and carbonation (Ca+2 + 0.8K+1 + 0.7Na+1 + 0.4Mg+2 + 0.4Fe+2)terms can also be considered as a ratio instead of difference as was pro-posed by Dixon (1997) and a new parameter Π* can be formulated asfollowing:
Π� ¼ Ca2þ þ 0:8Kþ þ 0:7Naþ þ 0:4Mg2þ þ 0:4Fe2þ� �
= Si4þ þ Al3þ� �
:
ð11Þ
In Fig. 11 CO2 solubility data are plotted versusΠ*. The relationshipsdemonstrate non-linear trends which are best fitted by exponential
functions. In general, these trends are similar to those obtained for Πparameterization as shown in Fig. 10. Surprisingly, the regression coef-ficients for bothΠ andΠ* approaches are also almost identical indicat-ing that the limited range of used compositions and the simplenormalization proposed by Dixon (1997) is valid for a wide composi-tional range. It emphasizes however that specific normalization step(using of the coefficients−6.5 and 20.17 derived from the multiple re-gression; Dixon, 1997) is not required and more simple Π-parameterization approach, i.e., Π*, can be used.
For each pressure, the relationship between CO2 solubility (in wt.%)and Π or Π* can be expressed as
CO2 ¼ A � EXP B�Πð Þ orCO2 ¼ A � EXP B�Π�ð Þ: ð12Þ
The general formalism of this equation was chosen to keep agree-ment with that established for the dataset at 100 MPa, which has thebest regression correlation coefficient for bothΠ andΠ*. Hence, identi-cal form of the exponential equations and systematic shift of the fitted

0
2000
4000
6000
8000
10000
12000
14000
16000
0 2000 4000 6000 8000 10000 12000 14000 16000
CO
2C
alc
(pp
m)
CO2 Exp (ppm)
Linear regression of experimental data (eq.13) ln(CO2)=1.167*ln(Pressure)+0.671* +0.65
Other studiesThis study ±10rel.%
±20rel.%
0
500
1000
1500
2000
2500
3000
3500
4000
0 500 1000 1500 2000 2500 3000 3500 4000
CO
2C
alc
(pp
m)
CO2 Exp (ppm)
Linear regression of experimental data (eq.13) ln(CO2)=1.167*ln(Pressure)+0.671* +0.65
±10rel.%
±20rel.%
ba
Fig. 12. Comparison of calculated CO2 solubilities with experimentally determined values. CO2 concentrations were calculated as a function of pressure and compositional parameterΠusing an empirical equation (see text Eq. (13)) derived from themultiple linear regression of the experimental data on CO2 solubility inmafic melts at 50, 100, 200, 300 and 500MPa (seetext, Appendix 3c). Fig. 12b is an enlargement of the Fig. 12a. Black squares represent the data from this study and from Shishkina et al. (2010), white diamonds represent data from otherstudies (see references in Figs. 9, 10 and Appendix 3c).
126 T.A. Shishkina et al. / Chemical Geology 388 (2014) 112–129
trends with pressure allowed multiple linear regression of the wholedataset in terms of ln(CO2) as a function of Π (or Π*) and lnP:
ln CO2ð Þ ¼ A � lnP þ B �П þ C or ln CO2ð Þ ¼ A � lnP þ B �П � þC ð13Þ
where CO2 is carbon dioxide concentration in wt.% and P is pressure inMPa. The regression coefficients were calibrated using 48 values ofCO2 solubility at pressures of 50, 100, 200, 300 and 500MPa (see datasetand references in Table 3c in Appendix) and are found to be A= 1.167,B= 0.671 and C=0.65 forΠ and A= 1.150, B=6.71 and C=−1.345for Π*.
Fig. 12 shows CO2 solubilities calculated using Eq. (13) and the regres-sion coefficients forΠ vs. CO2 concentrations determined experimentally.In addition to the data used for calibration (see Fig. 10), Eq. (13) was ap-plied for 29 other data obtained for experimentally studied melt compo-sitions in pressure range of 50–500 MPa (e.g. Behrens et al., 2009; Lesneet al., 2011a, 2011b; Iacono-Marziano et al., 2012; Iacovino et al., 2013;Vetere et al., 2014; Table 3c in Appendix). About 40% of calculated valuesagree with experimental data within ±10 rel.% and about 70% within±20 rel.% (Fig. 12). Considering that nearly all CO2 solubility data usedin the dataset for calibration are extrapolated to water-free conditions(systems are never completely anhydrous, see above) and that the erroron CO2 determination is often in the range of ±10 rel.% to ±20 rel.%, itcan be noted that the approach using the parameter Π or Π* is muchmore appropriate to predict CO2 solubility in alkali-rich mafic systemsthan structural parameters such as NBO/T.
The exponential dependence of CO2 solubility on the compositionalparameter Π or Π* indicates that the contribution of an “energetic”term, i.e., contribution of cation carbonation reactions, becomes moreand more dominant with decreasing polymerization or with the pro-portion of such cations. However, this compositional effect on dissolu-tion of carbonate species should diminish with the evolution ofmagma composition from intermediate tomore silicic compositions be-cause CO2 dissolved as carbonate will be progressively replaced by mo-lecular CO2 (e.g., Morizet et al., 2001; Nowak et al., 2003, 2004). Sincemolecular CO2 solubility is dependent on the so called ionic porosityin the melt, it should be more dependent on the network structure ofthe melt than on the ability of melts to form carbonate-bearing species.
4.3. Comparison with the most recent H2O–CO2 solubility model
A direct comparison of our dataset with the two most popular solu-bility models proposed by Newman and Lowenstern (2002) and Papaleet al. (2006) which are predicting the concentration of H2O and CO2 invarious silicate melts, including mafic melts, as a function of the fluidphase composition at a given pressure is out of the scope of this studysince several recent publications have illustrated and discussed the lim-itations of these models as well as the differences between the twomodeling approaches (e,g, Iacono-Marziano et al., 2012; Iacovinoet al., 2013; Ni and Keppler, 2013; Vetere et al., 2014). The model ofDuan (2014) is based on an approach which is very similar to that ofPapale et al. (2006) and is also not considered here. For example, a com-parison between the predictions of the models of Newman andLowenstern (2002) and Papale et al. (2006) and experimental data fora composition close to Etna alkali basalt investigated in this study canbe found in Figure 7 in Iacono-Marziano et al. (2012) and in Figure 3in Iacovino et al. (2013). Both studies show that CO2 solubility is gener-ally underestimated in the intermediate XflH2O range (between ~0.2and 0.8) at pressures above 200MPa. A comparison of our experimentaldata with the predictions of these models for very alkali-rich composi-tions (basanites, nephelinite) would show strong solubility differencesbut data on such compositions were not available when the modelswere developed. On the other hand, a comparison of data with themore recent model of Iacono-Marziano et al. (2012) is moreinteresting, since it involves compositional parameters which havebeen calibrated using a variety of mafic compositions. The comparisonof the experimentally determined solubility curves with the H2O andCO2 concentrations predicted using the model of Iacono-Marzianoet al. (2012) is shown in Fig. 13. Four different compositions withvarying NBO/T have been chosen to illustrate to which extent themodel reproduces experimental data: the nephelinite compositionA2549, the basanite composition E2624, the alkali basalt compositionB2518, and an island-arc tholeiitic composition (N72, compositiongiven in Table 1). This last composition N72 has nearly exactly thesame H2O–CO2 solubility curve than the alkali basalt OB93 investigatedin this study (dotted curve in Fig. 6). The solubility curves from compo-sitionN72determinedbyShishkinaet al. (2010)havebeen chosenbecausethey were used to calibrate the model of Iacono-Marziano et al. (2012)
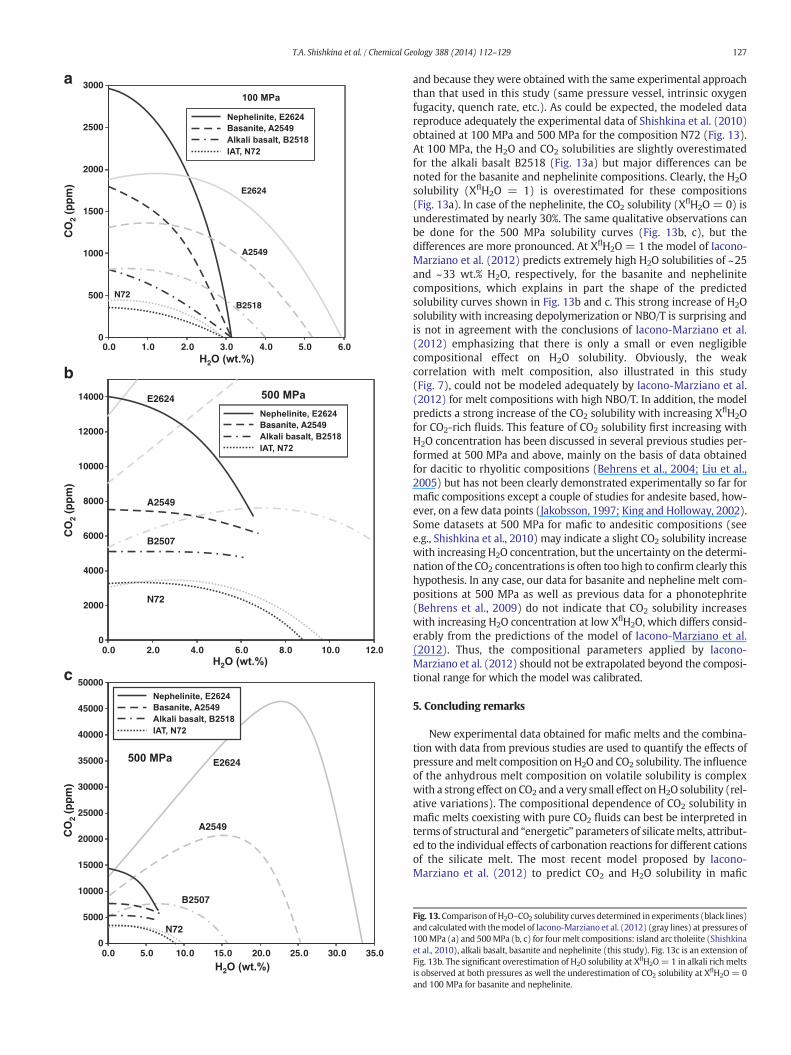
0
500
1000
1500
2000
2500
3000
0.0 1.0 2.0 3.0 4.0 5.0 6.0
2
E2624
A2549
B2518N72
)m
pp(
OC
2
0
2000
4000
6000
8000
10000
12000
14000
0.0 2.0 4.0 6.0 8.0 10.0 12.0
E2624
A2549
B2507
N72
)m
pp(
OC
2
2
0
5000
10000
15000
20000
25000
30000
35000
40000
45000
50000
0.0 5.0 10.0 15.0 20.0 25.0 30.0 35.0
E2624
A2549
B2507
N72
2
)m
pp(
OC
2
Basanite, A2549
Basanite, A2549
Basanite, A2549
a
b
c
127T.A. Shishkina et al. / Chemical Geology 388 (2014) 112–129
and because they were obtained with the same experimental approachthan that used in this study (same pressure vessel, intrinsic oxygenfugacity, quench rate, etc.). As could be expected, the modeled datareproduce adequately the experimental data of Shishkina et al. (2010)obtained at 100 MPa and 500 MPa for the composition N72 (Fig. 13).At 100 MPa, the H2O and CO2 solubilities are slightly overestimatedfor the alkali basalt B2518 (Fig. 13a) but major differences can benoted for the basanite and nephelinite compositions. Clearly, the H2Osolubility (XflH2O = 1) is overestimated for these compositions(Fig. 13a). In case of the nephelinite, the CO2 solubility (XflH2O = 0) isunderestimated by nearly 30%. The same qualitative observations canbe done for the 500 MPa solubility curves (Fig. 13b, c), but thedifferences are more pronounced. At XflH2O = 1 the model of Iacono-Marziano et al. (2012) predicts extremely high H2O solubilities of ~25and ~33 wt.% H2O, respectively, for the basanite and nephelinitecompositions, which explains in part the shape of the predictedsolubility curves shown in Fig. 13b and c. This strong increase of H2Osolubility with increasing depolymerization or NBO/T is surprising andis not in agreement with the conclusions of Iacono-Marziano et al.(2012) emphasizing that there is only a small or even negligiblecompositional effect on H2O solubility. Obviously, the weakcorrelation with melt composition, also illustrated in this study(Fig. 7), could not be modeled adequately by Iacono-Marziano et al.(2012) for melt compositions with high NBO/T. In addition, the modelpredicts a strong increase of the CO2 solubility with increasing XflH2Ofor CO2-rich fluids. This feature of CO2 solubility first increasing withH2O concentration has been discussed in several previous studies per-formed at 500 MPa and above, mainly on the basis of data obtainedfor dacitic to rhyolitic compositions (Behrens et al., 2004; Liu et al.,2005) but has not been clearly demonstrated experimentally so far formafic compositions except a couple of studies for andesite based, how-ever, on a few data points (Jakobsson, 1997; King and Holloway, 2002).Some datasets at 500 MPa for mafic to andesitic compositions (seee.g., Shishkina et al., 2010) may indicate a slight CO2 solubility increasewith increasing H2O concentration, but the uncertainty on the determi-nation of the CO2 concentrations is often too high to confirm clearly thishypothesis. In any case, our data for basanite and nepheline melt com-positions at 500 MPa as well as previous data for a phonotephrite(Behrens et al., 2009) do not indicate that CO2 solubility increaseswith increasing H2O concentration at low XflH2O, which differs consid-erably from the predictions of the model of Iacono-Marziano et al.(2012). Thus, the compositional parameters applied by Iacono-Marziano et al. (2012) should not be extrapolated beyond the composi-tional range for which the model was calibrated.
5. Concluding remarks
New experimental data obtained for mafic melts and the combina-tion with data from previous studies are used to quantify the effects ofpressure andmelt composition on H2O and CO2 solubility. The influenceof the anhydrous melt composition on volatile solubility is complexwith a strong effect on CO2 and a very small effect onH2O solubility (rel-ative variations). The compositional dependence of CO2 solubility inmafic melts coexisting with pure CO2 fluids can best be interpreted interms of structural and “energetic” parameters of silicatemelts, attribut-ed to the individual effects of carbonation reactions for different cationsof the silicate melt. The most recent model proposed by Iacono-Marziano et al. (2012) to predict CO2 and H2O solubility in mafic
Fig. 13. Comparison of H2O–CO2 solubility curves determined in experiments (black lines)and calculatedwith themodel of Iacono-Marziano et al. (2012) (gray lines) at pressures of100MPa (a) and 500MPa (b, c) for fourmelt compositions: island arc tholeiite (Shishkinaet al., 2010), alkali basalt, basanite and nephelinite (this study). Fig. 13c is an extension ofFig. 13b. The significant overestimation of H2O solubility at XflH2O= 1 in alkali richmeltsis observed at both pressures as well the underestimation of CO2 solubility at XflH2O = 0and 100 MPa for basanite and nephelinite.

128 T.A. Shishkina et al. / Chemical Geology 388 (2014) 112–129
melts has limitations and should not be applied in highlydepolymerized and alkali-rich mafic compositions.
Supplementary data to this article can be found online at http://dx.doi.org/10.1016/j.chemgeo.2014.09.001.
Acknowledgements
The authors thank H. Behrens and S. Cichy for the help withperforming the experiments, O. Diedrich for preparation of samplesfor infra-red spectroscopy and microprobe analyses, F. Adams and L.Crede for determinations of redox state of Fe of part of the samples.Many thanks to J.E. Dixon and R. Brooker for the constructive commentsthat helped improving the manuscript. This research has been support-ed by the German Science Foundation (DFG projects Ho1337/21 andНo1337/19), DAAD scholarship A/08/79422 to A. Jazwa and A. Jakubiak,and Europlanet Ri TNA program (grant 228319).
References
Almeev, R.R., Holtz, F., Koepke, J., Haase, K.M., Devey, C.W., 2008. Depths of partial crystal-lization of H2O-bearing MORB: phase equilibria simulations of basalts at the MARnear Ascension Island (7°–11°S). J. Petrol. 49, 25–45.
Baker, D.R., Alletti, M., 2012. Fluid saturation and volatile partitioning between melts andhydrous fluids in crustal magmatic systems: the contribution of experimental mea-surements and solubility models. Earth-Sci. Rev. 114, 298–324.
Behrens, H., Jantos, N., 2001. The effects of anhydrous composition on water solubility ingranitic melts. Am. Mineral. 86, 14–20.
Behrens, H., Romano, C., Nowak, M., Holtz, F., Dingwell, D.B., 1996. Near-infrared spectro-scopic determination of water species in glasses of systemMAlSi3O8 (M= Li, Na, K):an interlaboratory study. Chem. Geol. 128, 41–63.
Behrens, H., Meyer, M., Holtz, F., Benne, D., Nowak, M., 2001. The effect of alkali ionic ra-dius, temperature and pressure on the solubility of water in MAlSi3O8 melts (M= Li,Na, K, Rb). Chem. Geol. 174, 275–289.
Behrens, H., Ohlhorst, S., Holtz, F., Champenois, M., 2004. CO2 solubility in dacitic meltsequilibrated with H2O–CO2 fluids — implications for modelling the solubility of CO2
in silicic melts. Geochim. Cosmochim. Acta 68, 4687–4703.Behrens, H., Misiti, V., Freda, C., Vetere, F., Botcharnikov, R.E., Scarlato, P., 2009. Solubility
of H2O and CO2 in ultrapotassic melts at 1200 and 1250 °C and pressure from 50 to500 MPa. Am. Mineral. 94, 105–120.
Benne, D., Behrens, H., 2003. Water solubility in haplobasaltic melts. Eur. J. Mineral. 15,803–814.
Berndt, J., Liebske, C., Holtz, F., Freise, M., Nowak, M., Ziegenbein, D., Hurkuck, W., Koepke,J., 2002. A combined rapid-quench and H2-membrane setup for internally heatedpressure vessels: description and application for water solubility in basaltic melts.Am. Mineral. 87, 1717–1726.
Blank, J.G., Brooker, R.A., 1994. Experimental studies of carbon dioxide in silicate melts:solubility, speciation, and stable carbon isotope behavior. In: Carrol, M.R., Holloway,J.R. (Eds.), Reviews in Mineralogy 30, pp. 157–186.
Botcharnikov, R.E., Koepke, J., Holtz, F., McCammon, C., Wilke, M., 2005a. The effect ofwater activity on the oxidation and structural state of Fe in a ferro-basaltic melt.Geochim. Cosmochim. Acta 69 (21), 5071–5085.
Botcharnikov, R., Freise, M., Holtz, F., Behrens, H., 2005b. Solubility of C–O–H mixtures innatural melts: new experimental data and application range of recent models. Ann.Geophys. 48 (4–5), 633–646.
Botcharnikov, R.E., Behrens, H., Holtz, F., 2006. Solubility and speciation of C–O–H fluids inandesitic melt at T = 1100–1300 °C and P = 200 and 500 MPa. Chem. Geol. 229,125–143.
Botcharnikov, R.E., Almeev, R.R., Koepke, J., Holtz, F., 2008. Phase relations and liquid linesof descent in hydrous ferrobasalt— implications for the Skaergaard Intrusion and Co-lumbia River flood basalts. J. Petrol. 49 (9), 1687–1727.
Brey, G., 1976. CO2 solubility and solubility mechanisms in silicate melts at high pressures.Contrib. Mineral. Petrol. 51, 215–221.
Brooker, R.A., Kohn, S.C., Holloway, J.R., McMillan, P.F., 2001a. Structural controls on thesolubility of CO2 in silicate melts. Part I: bulk solubility data. Chem. Geol. 174,225–239.
Brooker, R.A., Kohn, S.C., Holloway, J.R., McMillan, P.F., 2001b. Structural controls on thesolubility of CO2 in silicate melts. Part II: IR characteristics of carbonate groups in sil-icate glasses. Chem. Geol. 174, 241–254.
Burnham, C.W., 1975. Water and magmas; a mixing model. Geochim. Cosmochim. Acta39, 1077–1084.
Burnham, C.W., 1979. The importance of volatile constituents. In: Yoder, H.S. (Ed.), The Evo-lution of the Igneous Rocks. Princeton University Press, Princeton, NJ, pp. 439–482.
Di Matteo, V., Mangiacapra, A., Dingwell, D.B., Orsi, G., 2006. Water solubility and specia-tion in shoshonitic and latitic melt composition from Campi Flegrei Caldera (Italy).Chem. Geol. 229, 113–124.
Dingwell, D.B., Holtz, F., Behrens, H., 1997. The solubility of H2O in peralkaline andperaluminous melts. Am. Mineral. 82, 434–437.
Dixon, J.E., 1997. Degassing of alkali basalts. Am. Mineral. 82, 368–378.Dixon, J.E., Pan, V., 1995. Determination of the molar absorptivity of dissolved carbonate
in basanitic glass. Am. Mineral. 80, 1339–1342.
Dixon, E.J., Stolper, E.M., Holloway, J.R., 1995. An experimental study of water and carbondioxide solubilities in mid-ocean ridge basaltic liquids. Part 1: calibration and solubil-ity models. J. Petrol. 36, 1607–1631.
Duan, X., 2014. A general model for predicting the solubility behavior of H2O–CO2 fluids insilicate melts over awide range of pressure, temperature and compositions. Geochim.Cosmochim. Acta 125, 582–609.
Fine, G., Stolper, E., 1985. The speciation of carbon-dioxide in sodium aluminosilicateglasses. Contrib. Mineral. Petrol. 91 (2), 105–121.
Fine, G., Stolper, E., 1986. Carbon dioxide in basaltic glasses: concentrations and specia-tion. Earth Planet. Sci. Lett. 76, 263–278.
Freise, M., 2004. Differenzierung von Basalten einer “Large Igneous Province” am Beispieldes Kerguelen Plateaus. Eine experimentelle Studie(PhD thesis) University ofHannover.
Freise, M., Holtz, F., Nowak, M., Scoates, J., Strauss, H., 2009. Differentiation and crystalli-zation conditions of basalts from the Kerguelen large igneous province: an experi-mental study. Contrib. Mineral. Petrol. 158 (4), 505–527.
Gaillard, F., Pichavant, М., Scaillet, В., 2003. Experimental determination of activities ofFeO and Fe2O3 components in hydrous silicic melts under oxidizing conditions.Geochim. Cosmochim. Acta 67 (22), 4389–4409.
Holloway, J.R., Blank, J.G., 1994. Application of experimental results to C–O–H species innatural melts. In: Carrol, M.R., Holloway, J.R. (Eds.), Reviews in Mineralogy 30, pp.187–230.
Holloway, J.R., Mysen, B.O., Eggler, D.H., 1976. The solubility of CO2 in liquids on the joinCaO–MgO–SiO2–CO2. Carnegie Institute of Washington Yearbook. 75, pp. 626–631.
Holtz, F., Behrens, H., Dingwell, D.B., Taylor, R.P., 1992. Water solubility in aluminosilicatemelts of haplogranite composition at 2 kbar. Chem. Geol. 96, 289–302.
Holtz, F., Behrens, H., Dingwell, D.B., Johannes, W., 1995. Water solubility in haplograniticmelts. Compositional, pressure and temperature dependence. Am. Mineral. 80,94–108.
Holtz, F., Roux, J., Behrens, H., Pichavant, M., 2000. Water solubility in silica andquartzofeldspathic melts. Am. Mineral. 85, 682–686.
Iacono-Marziano, G., Schmidt, B.C., Dolfi, D., 2007. Equilibrium and disequilibriumdegassing of a phonolitic melt (Vesuvius A.D. 79 “White Pumice”) simulated by de-compression experiments. J. Volcanol. Geotherm. Res. 161, 151–164.
Iacono-Marziano, G., Morizet, Y., Le Trong, E., Gaillard, F., 2012. New experimental dataand semi-empirical parameterization of H2O–CO2 solubility in mafic melts. Geochim.Cosmochim. Acta 97, 1–23.
Iacovino, K., Moore, G., Roggensack, K., Oppenheimer, C., Kyle, P., 2013. H2O–CO2 solubil-ity in mafic alkaline magma: applications to volatile sources and degassing behaviorat Erebus volcano, Antartica. Contrib. Mineral. Petrol. 166, 845–860.
Jakobsson, S., 1997. Solubility of water and carbon dioxide in an icelandite at 1400 °C and10 kilobars. Contrib. Mineral. Petrol. 127, 129–315.
Jendrzejewski, N., Trull, T.W., Pineau, F., Javoy, M., 1997. Carbon solubility in Mid-OceanRidge basaltic melt at low pressures (250–1950 bar). Chem. Geol. 138, 81–92.
King, P.L., Holloway, J.R., 2002. CO2 solubility and speciation in intermediate (andesitic)melts: the role of H2O and composition. Geochim. Cosmochim. Acta 66, 1627–1640.
Kubicki, J.D., Stolper, E.M., 1995. Structural roles of CO2 and [CO3]2− in fully polymerized,sodium aluminosilicate melts and glasses. Geochim. Cosmochim. Acta 59, 683–698.
Lesne, P., Scaillet, B., Pichavant, M., Iacono-Marziano, G., Beny, J.M., 2011a. The H2O solu-bility of alkali basaltic melts: an experimental study. Contrib. Mineral. Petrol. 162,133–151.
Lesne, P., Scaillet, B., Pichavant, M., Beny, J.M., 2011b. The carbon dioxide solubility in al-kali basalts: an experimental study. Contrib. Mineral. Petrol. 162, 153–168.
Liu, Y., Zhang, Y., Behrens, H., 2005. Solubility of H2O in rhyolitic melts at low pressuresand a new empirical model for mixed H2O–CO2 solubility in rhyolitic melts. J.Volcanol. Geotherm. Res. 143, 219–235.
Mattey, D.P., 1991. Carbon dioxide solubility and carbon isotope fractionation in basalticmelt. Geochim. Cosmochim. Acta 55, 3467–3473.
Moore, G., 2008. Interpreting H2O and CO2 contents in melt inclusions: constraints fromsolubility experiments and modeling. Rev. Mineral. Geochem. 69, 333–362.
Moore, G., Vennemann, T., Carmichael, I.S.E., 1995. Solubility of water in magmas to2 kbar. Geology 23, 1099–1102.
Moore, G., Vennemann, T., Carmichael, I.S.E., 1998. An empirical model for the solubility ofH2O in magmas to 3 kilobars. Am. Mineral. 83, 36–42.
Morizet, Y., Kohn, S.C., Brooker, R.A., 2001. Annealing experiments on CO2-bearing jadeiteglass: an insight into the true temperature dependence of CO2 speciation in silicatemelts. Mineral. Mag. 65, 701–707. http://dx.doi.org/10.1180/002646101656000.
Mysen, B.O., 1976. The role of volatiles in silicate melts; solubility of carbon dioxide andwater in feldspar, pyroxene, and feldspathoid melts to 30 kb and 1625 °C. Am. J.Sci. 276, 969–996.
Mysen, B.O., 1988. Structure and properties of silicate melts. Developments in Geochem-istry 4. Elsevier, Amsterdam (354 pp.).
Mysen, B.O., Arculus, R.J., Eggler, D.H., 1975. Solubility of carbon dioxide inmelts of andes-ite, tholeiite, and olivine nephelinite composition to 30 kbar pressure. Contrib. Miner-al. Petrol. 53, 227–239.
Newman, S., Lowenstern, J.B., 2002. VolatileCalc: a silicate melt–H2O–CO2 solution modelwritten in Visual Basic for Excel. Comput. Geosci. 28, 597–604.
Ni, H., Keppler, H., 2013. Carbon in silicate melts. Rev. Mineral. Geochem. 75, 251–287.Nowak, M., Porbatzki, D., Spickenbom, K., Diedrich, O., 2003. Carbon dioxide speciation in
silicate melts: a restart. Earth Planet. Sci. Lett. 207, 131–139.Nowak, M., Schreen, D., Spickenbom, K., 2004. Argon and CO2 on the race track in silicate
melts: a tool for the development of a CO2 speciation and diffusion model. Geochim.Cosmochim. Acta 64, 5127–5138.
Paillat, O., Elphick, S.C., Brown, W.L., 1992. The solubility of water in NaAlSi3O8 melts: are-examination of Ab-H2O phase relationships and critical behaviour at high pres-sures. Contrib. Mineral. Petrol. 112, 490–500.

129T.A. Shishkina et al. / Chemical Geology 388 (2014) 112–129
Pan, V., Holloway, J.R., Hervig, R.L., 1991. The pressure and temperature dependence ofcarbon dioxide solubility in tholeiitic basalt melts. Geochim. Cosmochim. Acta 55,1587–1595.
Pandya, N., Muenow, D.W., Sharma, S.K., 1992. The effect of bulk composition on the spe-ciation of water in submarine volcanic glasses. Geochim. Cosmochim. Acta 56,1875–1883.
Papale, P., Moretti, R., Barbato, D., 2006. The compositional dependence of the saturationsurface of H2O + CO2 fluids in silicate melts. Chem. Geol. 229, 78–95.
Pawley, A.R., Holloway, J.R., McMillan, P.F., 1992. The effect of oxygen fugacity on the sol-ubility of carbon–oxygen fluids in basaltic melt. Earth Planet. Sci. Lett. 110 (1–4),213–225.
Pineau, F., Shilobreeva, S., Kadik, A., Javoy, M., 1998. Water solubility and D/H fraction-ation in the system basaltic andesite–H2O at 1250 °C and between 0.5 and 3 kbars.Chem. Geol. 147 (1), 173–184.
Richet, P., Whittington, A., Holtz, F., Behrens, H., Ohlhorst, S., Wilke, M., 2000. Water anddensity of silicate glasses. Contrib. Mineral. Petrol. 138, 337–347.
Scaillet, B., Evans, B.W., 1999. The June 15, 1991 eruption of Mount Pinatubo. I. Phaseequilibria and pre-eruption P–T–fO2–fH2O conditions of the dacite magma. J. Petrol.40, 381–411.
Schmidt, B.C., Behrens, H., 2008. Water solubility in phonolite melts: Influence of meltcomposition and temperature. Chem. Geol. 256, 259–268.
Schuessler, J.A., Botcharnikov, R.E., Behrens, H., Misiti, V., Freda, C., 2008. Oxidation state ofiron in hydrous phono-tephritic melts. Am. Mineral. 93, 1493–1504.
Shishkina, T.A., Botcharnikov, R.E., Holtz, F., Almeev, R.R., Portnyagin, M.V., 2010. Solubil-ity of H2O- and CO2-bearing fluids in tholeiitic basalts at pressures up to 500 MPa.Chem. Geol. 277, 115–125.
Spera, F.J., Bergman, S.C., 1980. Carbon-dioxide in igneous petrogenesis: I. Aspects of thedissolution of CO2 in silicate liquids. Contrib. Mineral. Petrol. 74 (1), 55–66.
Stelling, J., Botcharnikov, R.E., Beermann, O., Nowak, M., 2008. Solubility of H2O- andchlorine-bearing fluids in basaltic melt of Mount Etna at T = 1050–1250 °C andP = 200 MPa. Chem. Geol. 256 (3–4), 102–110.
Stolper, E., 1982. The speciation of water in silicate melts. Geochim. Cosmochim. Acta 46,2609–2620.
Stolper, E., Holloway, J.R., 1988. Experimental-determination of the solubility of carbon-dioxide in molten basalt at low-pressure. Earth Planet. Sci. Lett. 87, 397–408.
Thibault, Y., Holloway, J.R., 1994. Solubility of CO2 in a Ca-rich leucitite: effects of pressure,temperature and oxygen fugacity. Contrib. Mineral. Petrol. 116, 216–224.
Toplis, M.J., Carroll, M.R., 1995. An experimental study of the influence of oxygen fugacityof Fe–Ti oxide stability, phase relations, and mineral–melt equilibria in ferro-basalticsystems. J. Petrol. 36, 1137–1170.
Vetere, F., Botcharnikov, R.E., Holtz, F., Behrens, H., De Rosa, R., 2011. Solubility of H2O andCO2 in shoshonitic melts at 1250 °C and pressures from 50 to 400 MPa: implicationsfor Campi Flegrei magmatic systems. J. Volcanol. Geotherm. Res. 202, 251–261.
Vetere, F., Holtz, F., Behrens, H., Botcharnikov, R.E., Fanara, S., 2014. The effect of alkalisand polymerization on the solubility of H2O and CO2 in alkali-rich silicate melts.Contrib. Mineral. Petrol. 167, 1014.
Webster, J.D., Kinzler, R.J., Mathez, E.A., 1999. Chloride and water solubility in basalt andandesite melts and implications for magmatic degassing. Geochim. Cosmochim. Acta63, 729–738.
Wilson, A.D., 1960. The micro-determination of ferrous iron in silicate minerals by a vol-umetric and colorimetric method. Analyst 85, 823–827.
Witham, F., Blundy, J., Kohn, S.C., Lesne, P., Dixon, J., Churakov, S., Botcharnikov, R., 2012.SolEx: a model for mixed COHSCl-fluid solubilities and exsolved gas compositions inbasalt. Comput. Geosci. 45, 87–97. http://dx.doi.org/10.1016/j.cageo.2011.09.021.
Yamashita, S., Kitamura, T., Kusakabe, M., 1997. Infrared spectroscopy of hydrous glassesof arc magma compositions. Geochem. J. 31, 169–174.