Cleaner Aluminum Melts in Foundries: A Critical Review and Update
Upload
independentCategory
view
3download
0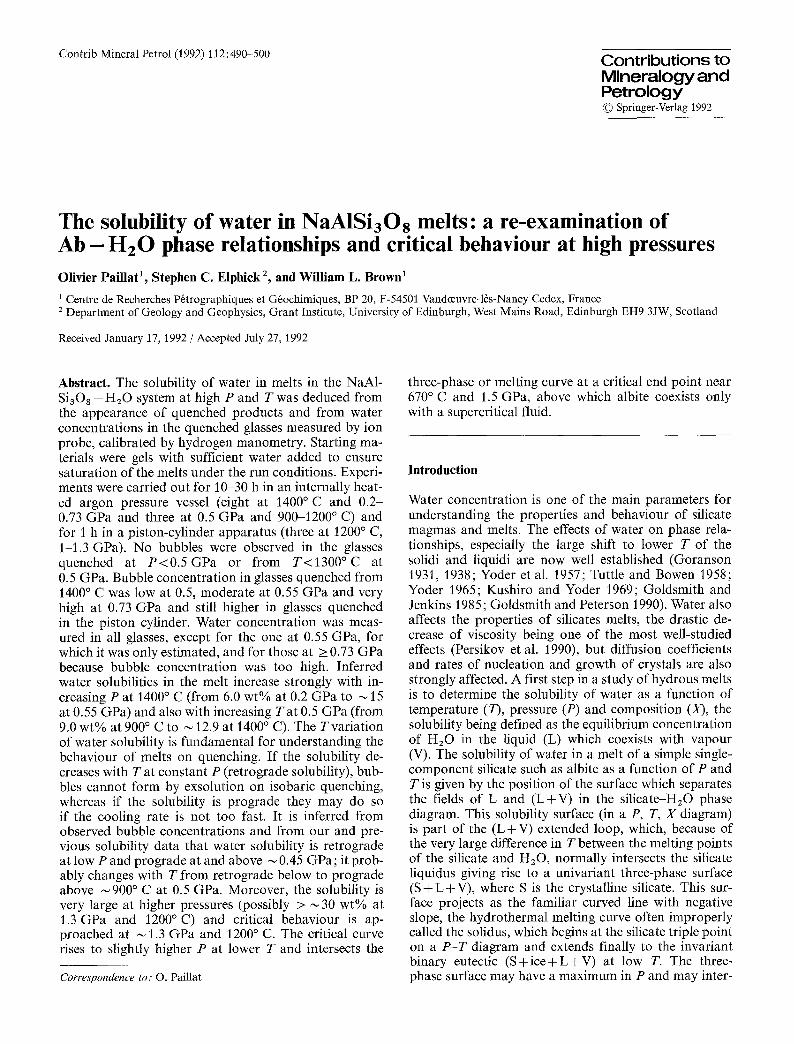
Contrib Mineral Petrol (1992) 112:490-500 C o n t r i b u t i o n s to Mineralogy and Petrology C@_) Springer-Verlag 1992
The solubility of water in NaAISi3Os melts: a re-examination of A b - H 2 0 phase relationships and critical behaviour at high pressures Olivier Paillat ~, Stephen C. Elphick z, and William L. Brown ~
1 Centre de Recherches P6trographiques et G6ochimiques, BP 20, F-54501 Vandceuvre-l~s-Nancy Cedex, France 2 Department of Geology and Geophysics, Grant Institute, University of Edinburgh, West Mains Road, Edinburgh EH9 3JW, Scotland
Received January 17, 1992 / Accepted July 27, 1992
Abstract. The solubility of water in melts in the NaA1- S i 3 0 8 - H 2 0 system at high P and T was deduced from the appearance of quenched products and from water concentrations in the quenched glasses measured by ion probe, calibrated by hydrogen manometry. Starting ma- terials were gels with sufficient water added to ensure saturation of the melts under the run conditions. Experi- ments were carried out for 10-30 h in an internally heat- ed argon pressure vessel (eight at 1400~ and 0.2- 0.73 GPa and three at 0.5 GPa and 900~1200 ~ C) and for 1 h in a piston-cylinder apparatus (three at 1200 ~ C, 1-1.3 GPa). No bubbles were observed in the glasses quenched at P < 0 . 5 G P a or from T < 1 3 0 0 ~ at 0.5 GPa. Bubble concentration in glasses quenched from 1400 ~ C was low at 0.5, moderate at 0.55 GPa and very high at 0.73 GPa and still higher in glasses quenched in the piston cylinder. Water concentration was meas- ured in all glasses, except for the one at 0.55 GPa, for which it was only estimated, and for those at > 0.73 GPa because bubble concentration was too high. Inferred water solubilities in the melt increase strongly with in- creasing P at 1400 ~ C (from 6.0 wt% at 0.2 GPa to ~ 15 at 0.55 GPa) and also with increasing T a t 0.5 GPa (from 9.0 wt% at 900 ~ C to ~ 12.9 at 1400 ~ C). The Tvar ia t ion of water solubility is fundamental for understanding the behaviour of melts on quenching. I f the solubility de- creases with T at constant P (retrograde solubility), bub- bles cannot form by exsolution on isobaric quenching, whereas if the solubility is prograde they may do so if the cooling rate is not too fast. It is inferred from observed bubble concentrations and from our and pre- vious solubility data that water solubility is retrograde at low P and prograde at and above ~ 0.45 GPa; it prob- ably changes with T from retrograde below to prograde above ,,~900 ~ C at 0.5 GPa. Moreover, the solubility is very large at higher pressures (possibly > ,-~ 30 wt% at 1.3 GPa and 1200 ~ C) and critical behaviour is ap- proached at --~ 1.3 GPa and 1200 ~ C. The critical curve rises to slightly higher P at lower T and intersects the
Correspondence to : O. Paillat
three-phase or melting curve at a critical end point near 670~ and 1.5 GPa, above which albite coexists only with a supercritical fluid.
Introduction
Water concentration is one of the main parameters for understanding the properties and behaviour of silicate magmas and melts. The effects of water on phase rela- tionships, especially the large shift to lower T of the solidi and liquidi are now well established (Goranson /931, 1938; Yoder et al. 1957; Turtle and Bowen 1958; Yoder 1965; Kushiro and Yoder 1969; Goldsmith and Jenkins 1985; Goldsmith and Peterson 1990). Water also affects the properties of silicates melts, the drastic de- crease of viscosity being one of the most well-studied effects (Persikov et al. 1990), but diffusion coefficients and rates of nucleation and growth of crystals are also strongly affected. A first step in a study of hydrous melts is to determine the solubility of water as a function of temperature (7), pressure (P) and composition (J0, the solubility being defined as the equilibrium concentration of HzO in the liquid (L) which coexists with vapour (V). The solubility of water in a melt of a simple single- component silicate such as albite as a function of P and T is given by the position of the surface which separates the fields of L and ( L + V ) in the silicate-H~O phase diagram. This solubility surface (in a P, T, X diagram) is part of the (L + V) extended loop, which, because of the very large difference in T between the melting points of the silicate and HzO, normally intersects the silicate liquidus giving rise to a univariant three-phase surface ( S + L + V ) , where S is the crystalline silicate. This sur- face projects as the familiar curved line with negative slope, the hydrothermal melting curve often improperly called the solidus, which begins at the silicate triple point on a P - T diagram and extends finally to the invariant binary eutectic (S + ice + L + V) at low T. The three- phase surface may have a maximum in P and may inter-
491
?
~D
(S+L+V) V R
?
sificate H20 silicate H 2 0
L) o
~D C "
Q"i (s~+v) ~
rvl'~ (s+v) \
\ ~- . . . . T,q
silicate H20 Fig. l a-c. Possible high-T phase relationships between liquid and vapour at three different P for a binary silicate-water system, as- suming congruent melting and boiling. Tg is the glass-transition temperature but its position is only approximately known, a At low P the solubility curve QB of water in the silicate melt intersects the vaporus at the congruent boiling point B of the silicate. The solubility of water in the melt is retrograde, so that a melt L be- comes undersaturated on cooling and cannot exsolve mierobubbles
of vapour, b At intermediate P the L-V loop no longer intersects the silicate side line, but has a maximum T at a critical point C' where liquid and vapour are identical (L=V) . Solubility is a minimum at M' and there are two segments, one Q'M' being retro- grade, the other M'C' prograde. On cooling a melt L first becomes oversaturated and then undersaturated when it cuts the segment M'Q'. r At high P the point of minimum solubility M" is metasta- ble, so that Q'C" is entirely prograde
sect the critical curve which joins the two critical points (see discussion and Fig. 6). However, most simple sili- cate-water systems will not be binary at high T and low P because of incongruent boiling of the melt, and may not even be strictly so at lower T because of incon- gruent dissolution of the silicate in the vapour.
In the high-T part of a T - X diagram, the solubility curve begins at a point Q on an isobaric invariant line ( S + L + V ) and ends at higher T either (1) at a point B called the isobaric boiling point (Fig. I a) on the sili- cate side line where the curve intersects the vaporus or (2) at a point C within the diagram called the critical point (Fig. lb , c) where L = V (see Ricci 1966, Morse 1980, or Dingwell 1986 for further details). In the first case, water solubility in the melt decreases as T increases (retrograde solubility, curve QB, Fig. 1 a), whereas in the second case it either increases as T increases (prograde solubility, curve Q"C', Fig. 1 c), or is prograde only near the critical point (curve M'C', Fig. | b ) after an initial retrograde part (curve Q'M'). If a critical point exists, the solubility curve must have a point of minimum solu- bility M which is either stable (Fig. 1 b) or metastable (Fig. lc); solubility close to the point M is neutral. We chose the system NaA1Si308 (Ab) HzO for experimental study of water solubility in melts at high T and P, even though data at moderate T are abundant (Goranson 1938; Burnham and Jahns 1962; Khitarov et al. 1963; Orlova 1963; Kadik and Lebedev 1968; Voigt etal. 1981 ; Day and Fenn 1982; Hamilton and Oxtoby 1986). It is, along with SiO2-HzO, the most extensively stud- ied silicate melt-water system, and has been used as a basis for general thermodynamic models of water solu- bility in silicate melts (Burnham 1975; Silver and Stolper 1985). Recent studies have focused on water speciation and on the local structure of the melts (McMillan and Holloway 1987; Kohn etal. 1989; Silver and Stolper
1989). Water concentrations in the melts may be deter- mined by chemographic methods (Yoder et al. 1957; Burnham and Jahns 1962; Boettcher and Wyllie 1969; Day and Fenn 1982) in which known amounts of water are added and the phases present identified from the quench products. Water analysis can also be done on homogeneous quenched glasses and the different meth- ods were reviewed by Dingwell (1986) and McMillan and Holloway (1987).
Controversy exists, however, about the validity of water solubilities inferred for melts from those deter- mined experimentally on quenched glasses (Burnham and Jahns 1962; Dingwell et al. 1984; Dingwell 1986; Hamilton and Oxtoby 1986). Most measurements were made on glasses by the weight-loss on ignition method (Goranson 1938; Tuttle and Bowen 1958; Kadik and Lebedev 1968) or by a low-T variant thereof (Hamilton and Oxtoby 1986), although others used a manometric method (Dingwell et al. 1984) or infra-red spectroscopy (Newman et al. 1986). Problems arise for glasses with bubbles. Some authors suggested that bubbly glass should not be analyzed for total water, because they considered that the bubbles were trapped in the melt before quenching, i.e. primary bubbles (Tuttle and Bow- en 1958; Burnham and Jahns 1962; Dingwell etal. 1984). If the bubbles are primary, the water solubility will be overestimated; this will be serious in viscous melts which free themselves of bubbles only very slowly, but it should be less serious at higher water concentrations because of the lower melt viscosity. Burnham and Jahns (1962) showed that the inferred trapped bubble concen- tration varied inversely with P at low to moderate P and low T, and they took account of the water in such bubbles, their number and size being estimated by point counting across thin sections of quenched glasses. In order to avoid as far as possible the presence of bubbles
492
in the melt, one can use large single pieces o f bubble-free glass or gels as start ing materials. I f the bubbles fo rmed dur ing the quench (Kennedy et al. 1962; Kadik and Le- bedev 1968; Boet tcher and Wyllie 1969; Hami l ton and Ox toby 1986), the a m o u n t o f water in them mus t be taken into account , otherwise water solubility will be underestimated. Moreover , Kadik and Lebedev (1968) showed that addi t ional caut ion mus t be used with bub- bly glasses, because they m a y lose water with time by diffusion out o f the sample when stored at r o o m T. To avoid such loss as far as possible, Kadik and Lebedev determined water on the entire uncrushed glass slug, so that their measurements above 0.4-0.5 G P a are the mos t reliable ones in this region. It m a y be possible to deter- mine very high solubilities only by in-situ me thods or possibly by chemograph ic methods (McMil lan and Hol- loway 1987), provided one can identify the nature o f the quench products . Whereas this m a y be no t too diffi- cult near the three-phase surface (Burnham and Jahns 1962), it presents serious problems (see discussion) at high P for water-r ich runs and near-critical condi t ions (Boettcher and Wyllie 1969; Goldsmi th and Jenkins 1985; Goldsmi th and Peterson 1990).
Whether bubbles appear or no t on isobaric quench depends on the way that solubility varies with T and the rate o f quench. 1) I f the solubility is retrograde, the liquid becomes undersaturated dur ing the quench, so that water canno t exsolve f rom it. I f the quench rate is fast enough, there will be insufficient time for exchange o f water between the melt and the v a p o u r before the glass t ransi t ion temperature, Tg, is reached (Fig. 1 a), so tha t the water concent ra t ion in the glass, or at least the centre o f it (see Fig. 3), is tha t o f the melt. 2) I f the solubility is prograde (Fig. 1 c), the liquid becomes supersaturated during the quench and water m a y exsolve f rom it, if the quench rate is no t too fast to inhibit nucleat ion and growth o f bubbles (Bott inga and Javoy 1990); the water in such bubbles mus t be taken into accoun t in order to determine solubility in the melt. 3) I f the solubility changes f rom prograde at high T to re t rograde at low T (Fig. I b), bubbles m a y not form at all on quenching, because the melt will change f rom oversa tura ted to un- dersa tura ted before T~ is reached, or possibly bubbles which started to grow m a y dissolve again. The presence o f exsolved water in bubbles is p r o o f o f p rograde solubil- ity, whereas the absence o f such bubbles is compat ib le with bo th re t rograde, neutral and slightly p rograde solu- bility. By s tudying the effects o f varying P at cons tan t T and quench rate, it should be possible to see whether the solubility changes f rom re t rograde to p rograde at high P ; such a s tudy is underway. We repor t here obser- vat ions on quenched produc ts and da ta on water solubi- lities for A b - H 2 0 at 0 .2 - / .3 G P a and relatively high T (900-1400 ~ C). Because o f the p rograde nature o f the solubility at high P, we have re-examined phase relation- ships at high P, focusing on the possible locat ion o f the critical points where L =V. The change f rom retro- grade to p rograde solubility at higher P implies tha t existing t h e r m o d y n a m i c models o f hydrous silicate melts are either inapplicable wi thout modif ica t ion or can at best be used only at low P.
Experimental methods
Starting materials were gels made according to the method of Ha- milton and Henderson (1968), which were held overnight at 800 ~ C in order to drive off all the carbon and nitrates. After cooling, the gels absorbed up to ~10 wt% water from the atmosphere. 50 to 100 mg gel was loaded with 10 to 30 mg distilled water in platinum capsules which were then sealed. The amount of water in each capsule was almost always much higher than that required to ensure saturation of the melt under the run conditions. Using gels as starting materials has several advantages: 1) they have good chemical homogeneity and precise compositions; 2) mixtures of gel and water tend not to give trapped bubbles during the runs, in contrast to starting materials in a powder form (Tuttle and Bowen 1958, p. 14; Burnham and Jahns 1962); 3) sodium loss is avoided during high-T melting in a furnace either at atmospheric P or even worse under vacnum (in order to produce bubble-free glass from high-viscosity melts, such as NaA1Si3Os); 4) equilibrium is reached much faster than with crystalline or glassy starting mate- rials, hence all owing shorter run times. Because of the low densities of the gels, however, the quantities of quenched products obtained are two to three times smallcr than with crystals or glass. However, no evidence was found using such gels of the formation of metasta- ble HzO-rich emulsions during the runs (Burnham 1981, p. 208).
Experiments were carried out in internally heated argon gas pressure vessels (IHPV) for P below 0.8 GPa. Run Twcre measured with two P t - Pt87Rh ~ a thermocouples; temperature gradients were generally <20 ~ C along a 20 mm capsule. IHPV runs with a molyb- denum furnace are generally limited to a maximum T of ~ 1200 ~ C, because failure of the furnace ceramic occurs at high T through oxidation of the molybdenum by the small amounts of oxygen trapped in the vessel. Gordon M. Biggar (pers. comm.) proposed placing outside the capsule a small amount of a tantalum metal getter to remove the oxygen, so that it is possible to carry out runs between 1200 and 1400 ~ C and 0.1 to 0.8 GPa without damage to or failure of the furnace. P was measured with an accuracy of better than __, 10 MPa using a manganin pressure gauge calibrat- ed against the freezing pressure of Hg at 0 ~ C. The duration of the runs was 10 to 30 hours. The runs were quenched isobarically with an average cooling rate of 7.5 ~ C/s between t400~ C and 500 ~ C. Experiments at 1-1,3 GPa and 1200 ~ C were carried out in a solid-media apparatus. The pressure cell was a talc-boron nitride assembly, with a graphite furnace and alumina and pyro- phyllite inserts; run times were 1 h. T was recorded with a P t - Pt87Rh~3 thermocouple. Quenching was not isobaric and the quench rate (~ 100 ~ C/s) was much faster than for IHPV runs. All the solubility experiments were carried out at the Grant insti- tute of Geology, Edinburgh. Run products were first examined under a binocular microscope and then prepared for examination under the polarizing microscope. Thick sections (~ 100 gm) were made from glass slugs from 1HPV runs, care being taken to ensure that the original rim of the glass slug was preserved, whereas piston-cylinder products were ground and mounted on slides. Ma- jor-element analyses of quenched IHPV run products were per- formed with a Camebax electron microprobe at the University of Nancy.
Two samples (Table 1, numbers IHPV 1 and 6) were analyzed for water by H2 manometry with an extraction line at the C.R.P.G., Nancy; this method was described by Bigeleisen et al. (1952). In order to prevent initial loss of water by diffusion out of the glass (Kadik and Lebedev 1968) or adsorption onto the surface of the glass (Burnham and Jahns 1962; Newman et al. 1986), large single (50-100 mg) glass chips were analyzed. Bubble-free glasses ana- lyzed by this method, from these and other experiments, were used as standards Ibr the ion-probe method. Glasses were analyzed for hydrogen with a Cameca IMS 3F ion probe at the C.R.P.G., Nancy. The method involves measurement of the 1H/28Si ratio in the glass compared with the same ratio in standards of similar composition (see Paillat et al. in preparation) and averaging over a large number of analyses. Because of the small size of the ion beam (~ 5 I, tm2), the method allows one to study the homogeneity
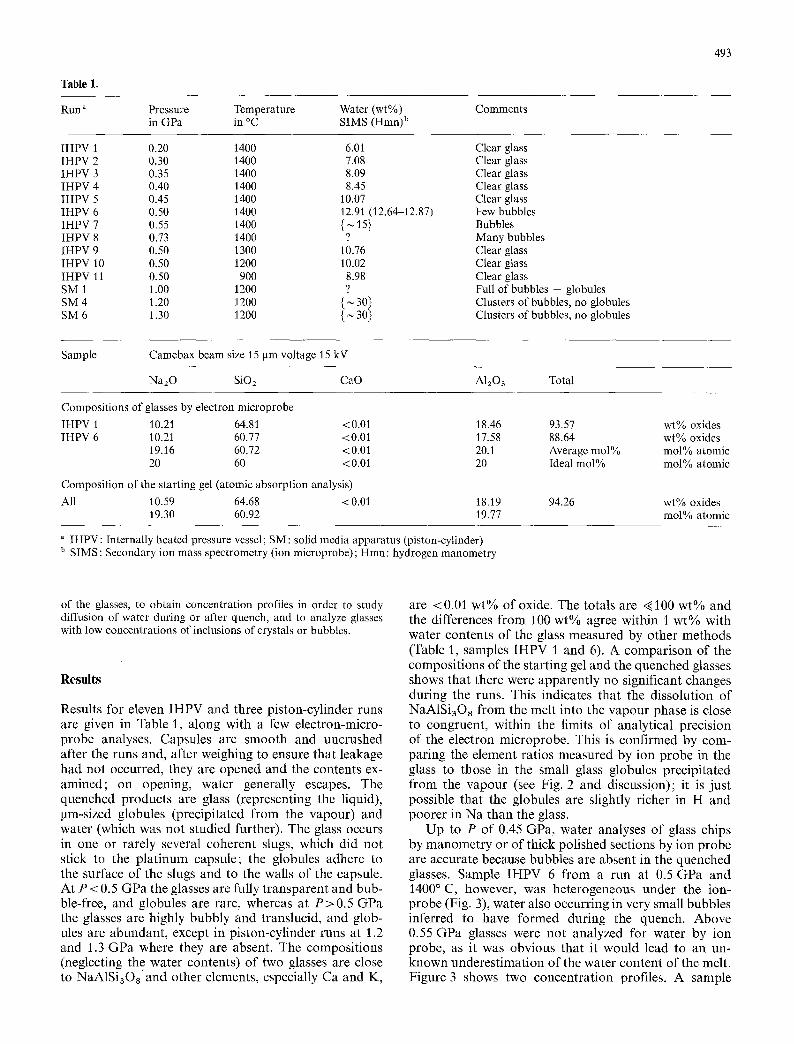
Table 1.
Run ~ Pressure Temperature Water (wt%) Comments in GPa in ~ SIMS (Hmn) ~
493
IHPV 1 0.20 1400 6.01 Clear glass IHPV 2 0.30 1400 7.08 Clear glass IHPV 3 0.35 1400 8.09 Clear glass IHPV 4 0.40 1400 8.45 Clear glass IHPV 5 0.45 1400 10.07 Clear glass IHPV 6 0.50 1400 12.91 (12.64-12.87) Few bubbles IHPV 7 0.55 1400 { ~ 15} Bubbles IHPV 8 0.73 1400 ? Many bubbles IHPV 9 0.50 1300 10.76 Clear glass IHPV 10 0.50 1200 10.02 Clear glass IHPV 11 0.50 900 8.98 Clear glass SM I 1.00 1200 ? Full of bubbles + globules SM 4 1.20 ] 200 { ~ 30} Clusters of bubbles, no globules SM 6 1.30 1200 { ~ 30} Clusters of bubbles, no globules
Sample Camebax beam size 15 gm voltage 15 kV
Na20 SiO2 CaO A1203 Total
Compositions of glasses by electron microprobe IHPV 1 10.21 64.81 <0.01 18.46 IHPV 6 10.21 60.77 <0.01 17.58
19.16 60.72 <0.01 20.1 20 60 < 0.01 20
Composition of the starting gel (atomic absorption analysis) All 10.59 64.68 < 0.01 18.19
19.30 60.92 19.77
93.57 88.64 Average tool% Ideal mol%
94.26
wt% oxides wt% oxides mol% atomic mol% atomic
wt% oxides tool% atomic
a IHPV: Internally heatcd pressure vessel; SM: solid media apparatus (piston-cylinder) b SIMS: Secondary ion mass spectrometry (ion microprobe); Hmn: hydrogen manometry
of the glasses, to obtain concentration profiles in order to study diffusion of water during or after quench, and to analyze glasses with low concentrations of inclusions of crystals or bubbles.
Resu l t s
Results for eleven IHPV and three piston-cylinder runs are given in Table 1, along with a few electron-micro- probe analyses. Capsules are smooth and uncrushed after the runs and, after weighing to ensure that leakage had not occurred, they are opened and the contents ex- amined; on opening, water generally escapes. The quenched products are glass (representing the liquid), gin-sized globules (precipitated from the vapour) and water (which was not studied further). The glass occurs in one or rarely several coherent slugs, which did not stick to the plat inum capsule; the globules adhere to the surface of the slugs and to the walls of the capsule. At P < 0.5 GPa the glasses arc fully t ransparent and bub- ble-free, and globules are rare, whereas at P > 0 . 5 GPa the glasses are highly bubbly and translucid, and glob- ules are abundant , except in piston-cylinder runs at 1.2 and 1.3 GPa where they are absent. The composit ions (neglecting the water contents) of two glasses are close to NaA1Si3Os'and other elements, especially Ca and K,
are <0.01 wt% of oxide. The totals are ~ 100 wt% and the differences f rom 100 wt% agree within I wt% with water contents of the glass measured by other methods (Table 1, samples IHPV 1 and 6). A comparison of the compositions of the starting gel and the quenched glasses shows that there were apparently no significant changes during the runs. This indicates that the dissolution of NaA1SiaO8 from the melt into the vapour phase is close to congruent, within the limits of analytical precision of the electron microprobe. This is confirmed by com- paring the element ratios measured by ion probe in the glass to those in the small glass globules precipitated f rom the vapour (see Fig. 2 and discussion); it is just possible that the globules are slightly richer in H and poorer in Na than the glass.
Up to P of 0.45 GPa, water analyses of glass chips by manomet ry or of thick polished sections by ion probe are accurate because bubbles are absent in the quenched glasses. Sample IHPV 6 f rom a run at 0.5 GPa and 1400 ~ C, however, was heterogeneous under the ion- probe (Fig. 3), water also occurring in very small bubbles inferred to have formed during the quench. Above 0.55 GPa glasses were not analyzed for water by ion probe, as it was obvious that it would lead to an un- known underestimation of the water content of the melt. Figure 3 shows two concentration profiles. A sample
494
r~" 1 globule_.)
0.5
N
0 H/Si Na/Si A1/Si
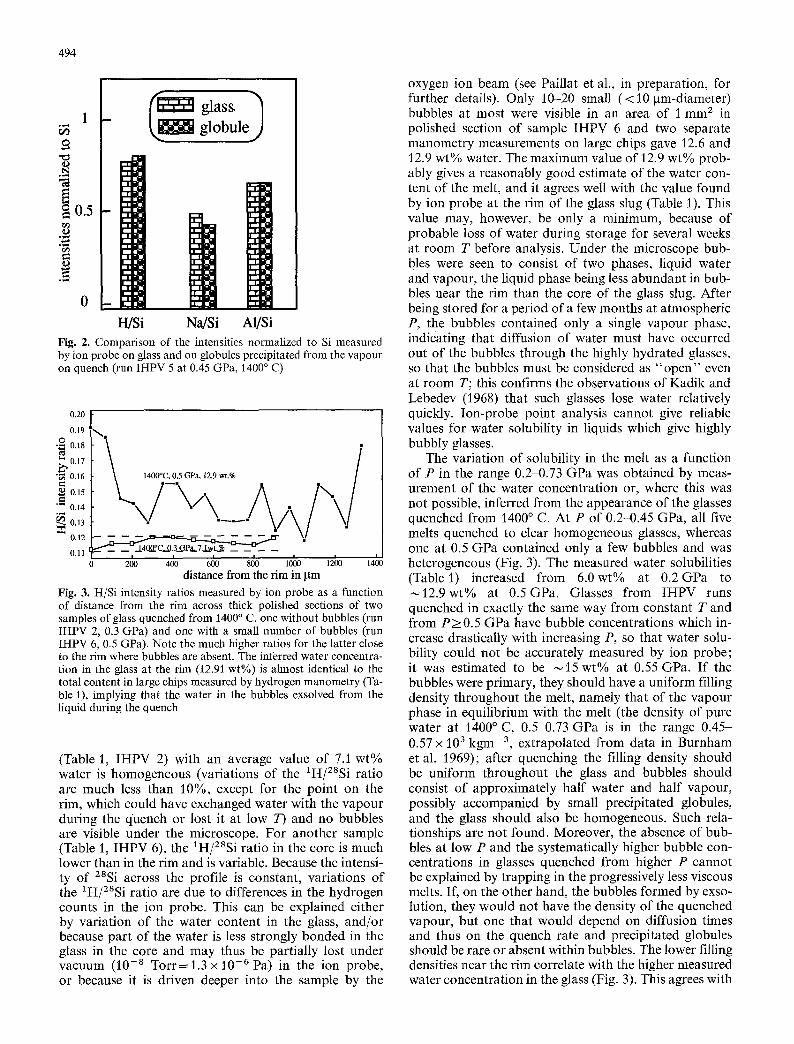
Fig. 2. Comparison of the intensities normalized to Si measured by ion probe on glass and on globules precipitated from the vapour on quench (run IHPV 5 at 0.45 GPa, 1400 ~ C)
0.20 0.19
O �9 ~ 0.18
0.17 "N 0.16
0.15 0.14
~ 0.13 0.12 0.11
1400"C, 0.5 GPa, 12.9 wt.% /
- - - "
J
0 2(]0 400 600 800 1000 1200 1400 distance from the rim in gm
Fig. 3. H/Si intensity ratios measured by ion probe as a function of distance from the rim across thick polished sections of two samples of glass quenched from 1400 ~ C, one without bubbles (run IHPV 2, 0.3 GPa) and one with a small number of bubbles (run IHPV 6, 0.5 GPa). Note the much higher ratios for the latter close to the rim where bubbles are absent. The inferred water concentra- tion in the glass at the rim (12.9~ wt%) is almost identical to the total content in large chips measured by hydrogen manometry (Ta- ble 1), implying that the water in the bubbles exsolved from the liquid during the quench
(Table 1, IHPV 2) with an average value of 7.1 wt% water is homogeneous (variations of the 1H/28Si ratio are much less than 10%, except for the point on the rim, which could have exchanged water with the vapour during the quench or lost it at low T) and no bubbles are visible under the microscope. For another sample (Table 1, IHPV 6), the 1H/ZSSi ratio in the core is much lower than in the rim and is variable. Because the intensi- ty of zssi across the profile is constant, variations of the 1H/28Si ratio are due to differences in the hydrogen counts in the ion probe. This can be explained either by variation of the water content in the glass, and/or because part of the water is less strongly bonded in the glass in the core and may thus be partially lost under vacuum (10 -8 T o r r = l . 3 x 10 6 Pa) in the ion probe, or because it is driven deeper into the sample by the
oxygen ion beam (see Paillat et al., in preparation, for further details). Only 10--20 small ( < 1 0 gm-diameter) bubbles at most were visible in an area of i mm 2 in polished section of sample IHPV 6 and two separate manometry measurements on large chips gave 12.6 and 12.9 wt% water. The maximum value of 12.9 wt% prob- ably gives a reasonably good estimate of the water con- tent of the melt, and it agrees well with the value found by ion probe at the rim of the glass slug (Table 1). This value may, however, be only a minimum, because of probable loss of water during storage for several weeks at room T before analysis. Under the microscope bub- bles were seen to consist of two phases, liquid water and vapour, the liquid phase being less abundant in bub- bles near the rim than the core of the glass slug. After being stored for a period of a few months at atmospheric P, the bubbles contained only a single vapour phase, indicating that diffusion of water must have occurred out of the bubbles through the highly hydrated glasses, so that the bubbles must be considered as " o p e n " even at room T; this confirms the observations of Kadik and Lebedev (1968) that such glasses lose water relatively quickly. Ion-probe point analysis cannot give reliable values for water solubility in liquids which give highly bubbly glasses.
The variation of solubility in the melt as a function of P in the range 0.2-0.73 GPa was obtained by meas- urement of the water concentration or, where this was not possible, inferred from the appearance of the glasses quenched from 1400 ~ C. At P of 0.2-0.45 GPa, all five melts quenched to clear homogeneous glasses, whereas one at 0.5 GPa contained only a few bubbles and was heterogeneous (Fig. 3). The measured water solubilities (Table1) increased from 6 .0wt% at 0 . 2 G P a to ~ 1 2 . 9 w t % at 0 .5GPa. Glasses from IHPV runs quenched in exactly the same way from constant T and from P___ 0.5 GPa have bubble concentrations which in- crease drastically with increasing P, so that water solu- bility could not be accurately measured by ion probe; it was estimated to be ,~15 wt% at 0.55 GPa. If the bubbles were primary, they should have a uniform filling density throughout the melt, namely that of the vapour phase in equilibrium with the melt (the density of pure water at 1400 ~ C, 0.5-0.73 GPa is in the range 0.45- 0.57 x 10³ kgm-3, extrapolated from data in Burnham et al. 1969); after quenching the filling density should be uniform throughout the glass and bubbles should consist of approximately half water and half vapour, possibly accompanied by small precipitated globules, and the glass should also be homogeneous. Such rela- tionships are not found. Moreover, the absence of bub- bles at low P and the systematically higher bubble con- centrations in glasses quenched from higher P cannot be explained by trapping in the progressively less viscous melts. If, on the other hand, the bubbles formed by exso- lution, they would not have the density of the quenched vapour, but one that would depend on diffusion times and thus on the quench rate and precipitated globules should be rare or absent within bubbles. The lower filling densities near the rim correlate with the higher measured water concentration in the glass (Fig. 3). This agrees with
495
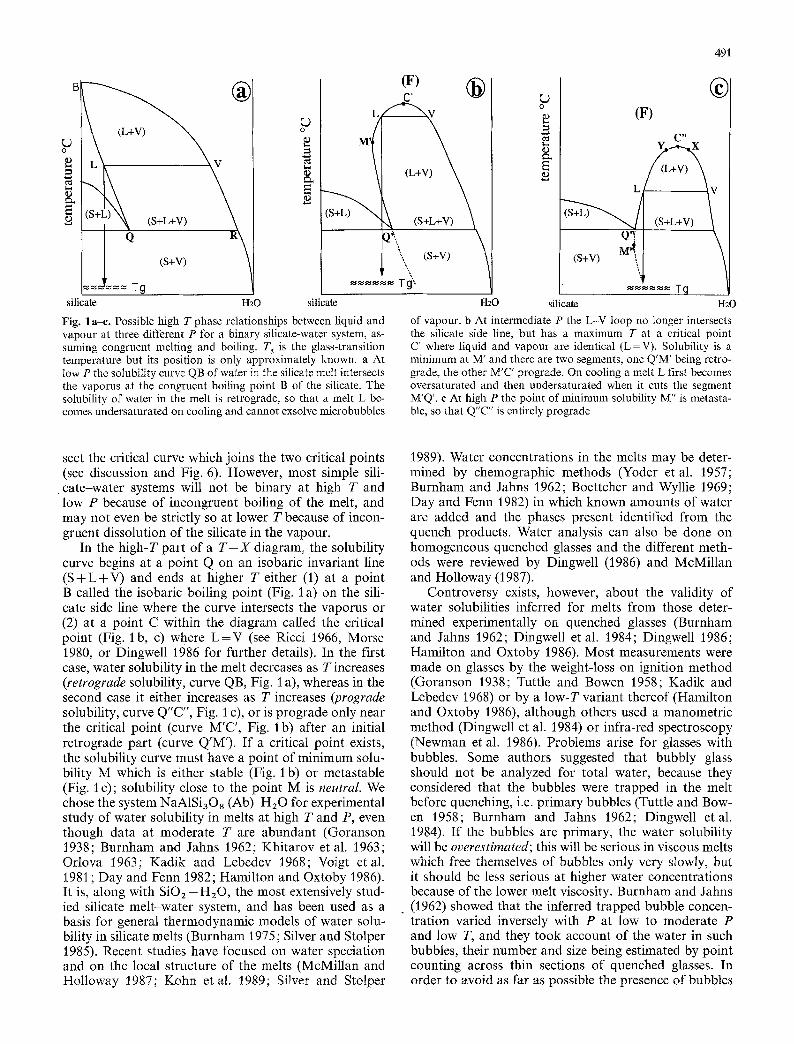
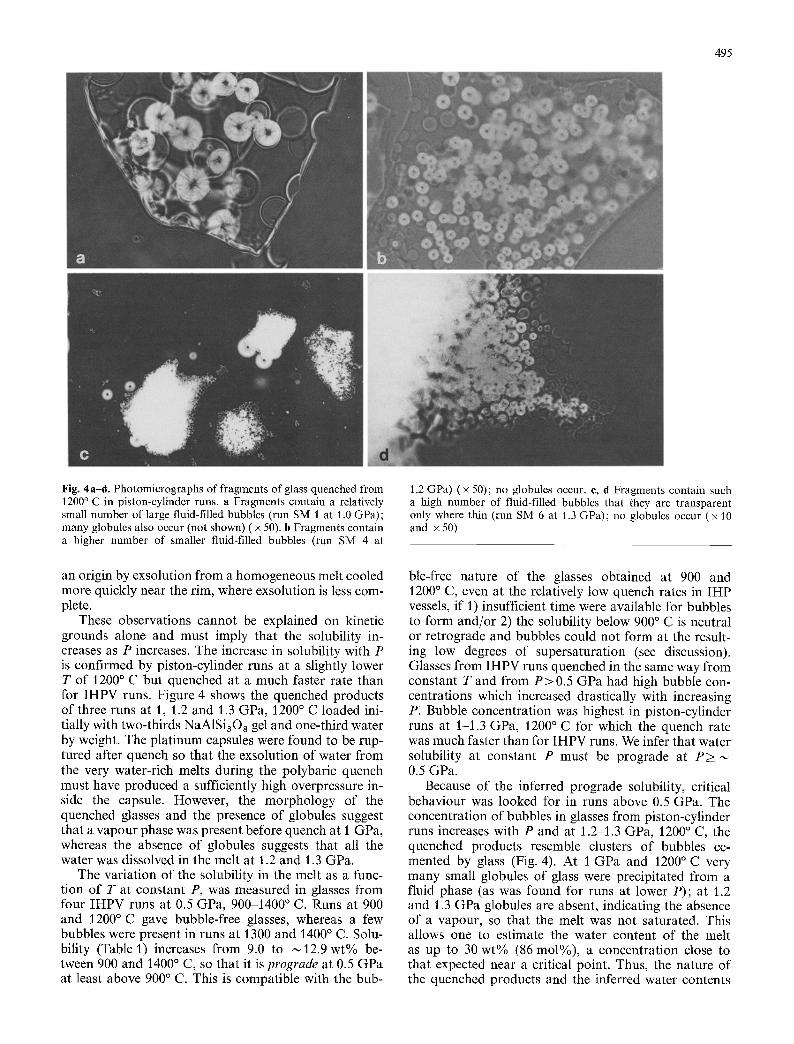
Fig. 4a-d. Photomicrographs of fragments of glass quenched from 1200 ~ C in piston-cylinder runs. a Fragments contain a relatively small number of large fluid-filled bubbles (run SM 1 at 1.0 GPa); many globules also occur (not shown) ( x 50). b Fragments contain a higher number of smaller fluid-filled bubbles (run SM 4 at
1.2 GPa) ( x 50); no globules occur, c, d Fragments contain such a high number of fluid-filled bubbles that they are transparent only where thin (run SM 6 at 1.3 GPa); no globules occur (x 10 and x 50)
an origin by exsolution f rom a homogeneous melt cooled more quickly near the rim, where exsolution is less com- plete.
These observations cannot be explained on kinetic grounds alone and must imply that the solubility in- creases as P increases. The increase in solubility with P is confirmed by piston-cylinder runs at a slightly lower T of 1200 ~ C but quenched at a much faster rate than for IHPV runs. Figure 4 shows the quenched products of three runs at 1, 1.2 and 1.3 GPa, 1200 ~ C loaded ini- tially with two-thirds NaA1Si308 gel and one-third water by weight. The plat inum capsules were found to be rup- tured after quench so that the exsolution of water f rom the very water-rich melts during the polybaric quench must have produced a sufficiently high overpressure in- side the capsule. However, the morphology of the quenched glasses and the presence of globules suggest that a vapour phase was present before quench at 1 GPa, whereas the absence of globules suggests that all the water was dissolved in the melt at 1.2 and 1.3 GPa.
The variat ion of the solubility in the melt as a func- tion of T at constant P, was measured in glasses f rom four I H P V runs at 0.5 GPa, 900 1400 ~ C. Runs at 900 and 1200~ gave bubble-free glasses, whereas a few bubbles were present in runs at 1300 and 1400 ~ C. Solu- bility (Table 1) increases f rom 9.0 to ~12.9 wt% be- tween 900 and 1400 ~ C, so that it isprograde at 0.5 GPa at least above 900 ~ C. This is compatible with the bub-
ble-free nature of the glasses obtained at 900 and 1200 ~ C, even at the relatively low quench rates in I H P vessels, if 1) insufficient time were available for bubbles to form and/or 2) the solubility below 900 ~ C is neutral or retrograde and bubbles could not form at the result- ing low degrees of supersaturation (see discussion). Glasses f rom I H P V runs quenched in the same way f rom constant T and f rom P > 0.5 GPa had high bubble con- centrations which increased drastically with increasing P: Bubble concentration was highest in piston-cylinder runs at 1-1.3 GPa, 1200 ~ C for which the quench rate was much faster than for I H P V runs. We infer that water solubility at constant P must be prograde at P > 0.5 GPa.
Because of the inferred prograde solubility, critical behaviour was looked for in runs above 0.5 GPa. The concentration of bubbles in glasses f rom piston-cylinder runs increases with P and at 1.2-1.3 GPa, 1200 ~ C, the quenched products resemble clusters of bubbles ce- mented by glass (Fig. 4). At 1 GPa and 1200 ~ C very many small globules of glass were precipitated f rom a fluid phase (as was found for runs at lower P); at 1.2 and 1.3 GPa globules are absent, indicating the absence of a vapour, so that the melt was not saturated. This allows one to estimate the water content of the melt as up to 30 wt% (86 tool%), a concentration close to that expected near a critical point. Thus, the nature of the quenched products and the inferred water contents
496
of the melt are persuasive arguments for an estimated critical point of ,-~ 1.3 GPa, ~ 1200 ~ C and XI~ o 0.85-0.9
increased abundance of globules (see discussion). The " 2 precipitated f rom the vapour with P between 0.73 and 1 GPa indicates increasingly higher solubilities of Ab in the vapour close to the inferred critical point.
Discussion
Solubility and phase relationships at high P
The variat ion of water solubility as a function of P and T below 1 GPa can be obtained by combining our data with those of Kadik and Lebedev (1968), Hamil ton and Oxtoby (1986) and others (Fig. 5). Agreement is ex- tremely good at P up to ,,~ 0.5 GPa, if allowance is made for the possible presence of t rapped bubbles of vapour, and data f rom all authors (Goranson 1938; Orlova 1963; Kadik and Lebedev 1968; Hamil ton and Oxtoby 1986) fit on the same set of very steep retrograde to prograde solubility curves. Difficulties are encountered above these P because of the presence of abundant water bub- bles in the glass and the progressive loss of such water with time on storage at low T. Kadik and Lebedev (1968) described quench products at and above 0.7 GPa as "c loudy glasses" with "num ero us extremely small water bubbles" and concluded that the bubbles formed by ex- solution during the quench. F rom their measurements of water solubility and f rom the occurrence of exsolved bubbles, they deduced that the solubility is prograde at P above 0.5 GPa. A strong increase in bubble concen- trat ion in glasses quenched f rom above ~0 .5 GPa was also observed by Hamil ton and Oxtoby (1986).
Few data are available on rates of bubble nucleation and growth during isobaric quenching; a relatively high supersaturat ion is probably required (Bottinga and Ja- voy 1990), because bubbly glasses were not observed at 0.5 GPa by Kadik and Lcbedev and were observed by us at 0.5 GPa only on quench f rom 1300~ C and 1400 ~ C, even though water solubility is weakly prograde between 900 ~ C and 1200 ~ C and more strongly so above 1200 ~ C (Fig. 5). A rough idea of times required for opti- cally visible bubbles to grow may be obtained from dif- fusion coefficients. Although no data on diffusion coeffi- cients o f water are available for hydrous melts and glasses of feldspathic compositions, these may be rough- ly estimated. From the H / D interdiffusion coefficient in alkali feldspar crystals (Behrens and Johannes 1992), and a comparison of argon and alkali diffusion coeffi- cients in alkali feldspar crystals and anhydrous melts and glasses (Smith and Brown 1988, Chap. 16), the diffu- sion coefficient for water in albite-like melts is estimated to be > 1 0 - 9 m2s -1 at 1000 ~ C, and could be larger in hydrous melts by up to 10z-103. The time required for growth of bubbles can be very roughly estimated f rom the Einstein approximat ion xZ~ Dt, where x is distance, t time and D the diffusion coefficient (cf. Smith and Brown 1988, pp 471-472). Even for a coefficient as small as 1 0 - 9 m 2 s -1, diffusion distances at 1000~ are > 10 gm in 1 s, so that there is cnough time available
0.13
0.2 /
0.1 0,5
1400 - {}
0.7 P Ii ,~ 12oo- 0.05
"~176 ! ~i .g
' , , , 1.0
500 I ,' ,'~ ~'0 2~ ~'0 ~'~ water in wt. %
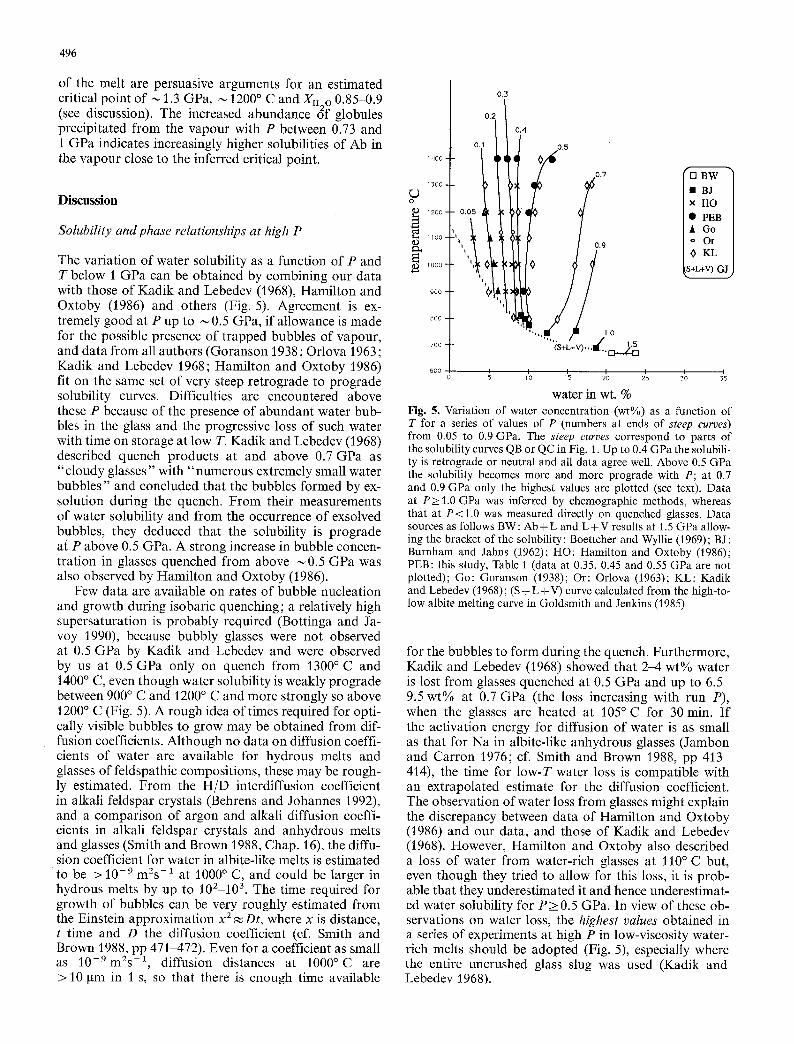
Fig. 5. Variation of water concentration (wt%) as a function of T for a series of values of P (numbers at ends of steep curves) from 0.05 to 0.9 GPa. The steep curves correspond to parts of the solubility curves QB or QC in Fig. 1. Up to 0.4 GPa the solubili- ty is retrograde or neutral and all data agree well. Above 0.5 GPa the solubility becomes more and more prograde with P; at 0.7 and 0.9 GPa only the highest values are plotted (see text). Data at P>1.0 GPa was inferred by chemographic methods, whereas that at P<I .0 was measured directly on quenched glasses. Data sources as follows BW: Ab+L and L+V results at 1.5 GPa allow- ing the bracket of the solubility: Boettcher and Wyllie (1969); B J: Burnham and Jahns (1962); HO: Hamilton and Oxtoby (1986); PEB: this study, Table t (data at 0.35, 0.45 and 0.55 GPa are not plotted); Go: Goranson (1938); Or: Orlova (1963); KL: Kadik and Lebedev (1968); (S + L + V) curve calculated from the high-to- low albite melting curve in Goldsmith and Jenkins (1985)
"-F1 BW "~ �9 BJ l X HO | It PEB | ,i GO |
~+L+V) GJ)
for the bubbles to form during the quench. Furthermore, Kadik and Lebedev (1968) showed that 2-4 wt% water is lost f rom glasses quenched at 0.5 GPa and up to 6.5- 9.5 wt% at 0.7 GPa (the loss increasing with run P), when the glasses are heated at 105~ for 30 rain. I f the activation energy for diffusion of water is as small as that for Na in albite-like anhydrous glasses (Jambon and Carron 1976; cf. Smith and Brown 1988, pp 413 414), the time for low-T water loss is compatible with an extrapolated estimate for the diffusion coefficient. The observation of water loss f rom glasses might explain the discrepancy between data of Hamil ton and Oxtoby 0986) and our data, and those of Kadik and Lebedev (1968). However, Hamil ton and Oxtoby also described a loss of water f rom water-rich glasses at 110 ~ C but, even though they tried to allow for this loss, it is prob- able that they underestimated it and hence underestimat- ed water solubility for P_> 0.5 GPa. In view of these ob- servations on water loss, the highest values obtained in a series of experiments at high P in low-viscosity water- rich melts should be adopted (Fig. 5), especially where the entire uncrushed glass slug was used (Kadik and Lebedev 1968).
497
2.0
1.5
1
0.5
(F)
(S + F) .." N "'--'"-"-""~'-'-~C'2 ~. Iz) ! (s+k+v) (L + v) --_.
/ 300 500 1000 1500
temperature ~
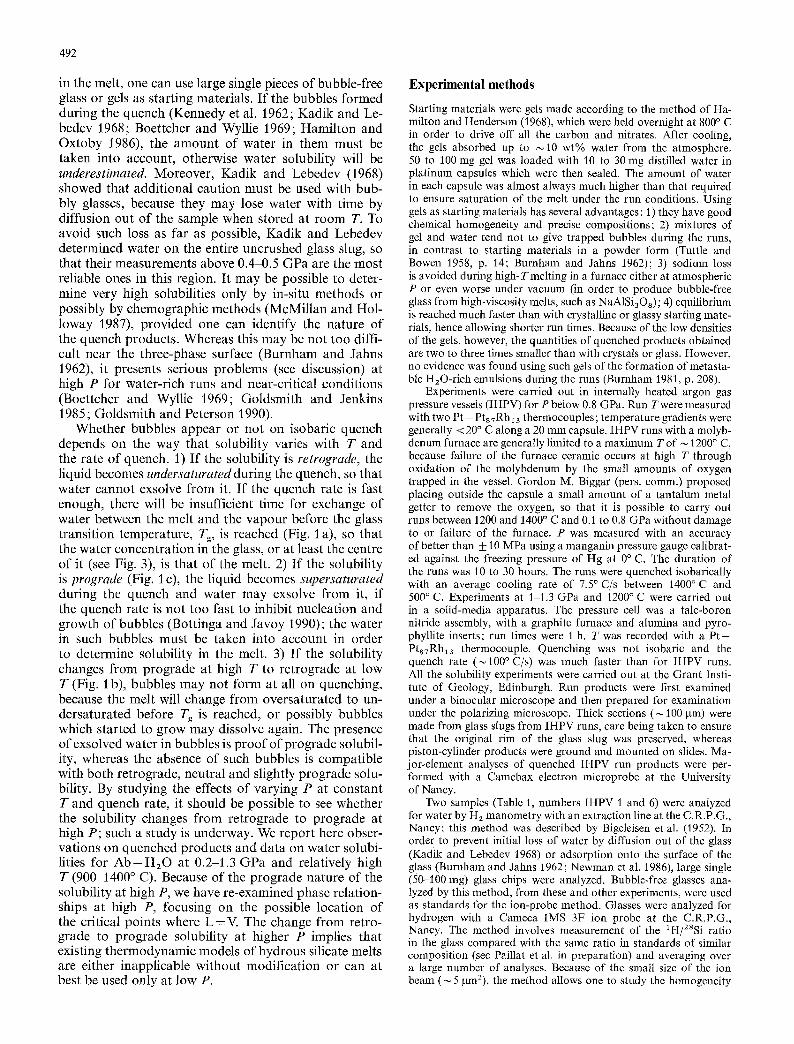
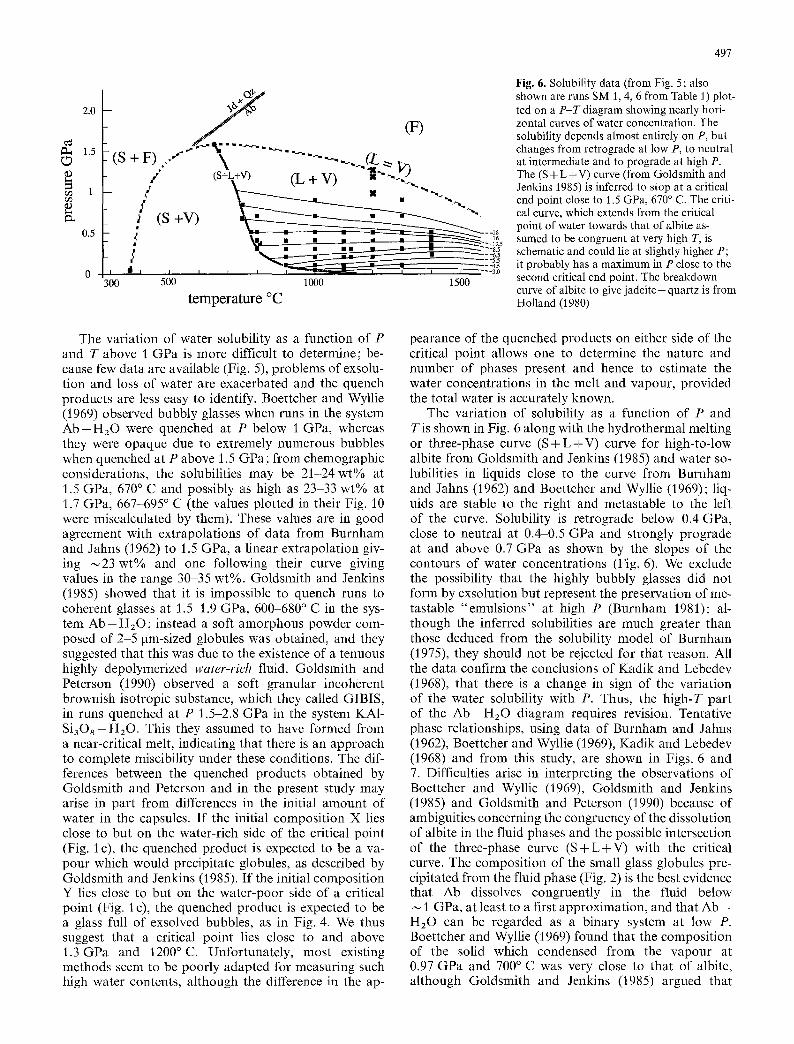
Fig. 6. Solubility data (from Fig. 5 ; also shown are runs SM 1, 4, 6 from Table 1) plot- ted on a P-T diagram showing nearly hori- zontal curves of water concentration. The solubility depends almost entirely on P, but changes from retrograde at low P, to neutral at intermediate and to prograde at high P. The (S + L+V) curve (from Goldsmith and Jenkins 1985) is inferred to stop at a critical end point close to 1.5 GPa, 670 ~ C. The criti- cal curve, which extends from the critical point of water towards that of albite as- sumed to be congruent at very high T, is schematic and could lie at slightly higher P; it probably has a maximum in P close to the second critical end point. The breakdown curve of albite to give jadeite + quartz is from Holland (1980)
The variation of water solubility as a function of P and T above 1 GPa is more difficult to determine; be- cause few data are available (Fig. 5), problems of exsolu- tion and loss of water are exacerbated and the quench products are less easy to identify. Boettcher and Wyllie (1969) observed bubbly glasses when runs in the system A b - - H 2 0 were quenched at P below 1 GPa, whereas they were opaque due to extremely numerous bubbles when quenched at P above 1.5 GPa; from chemographic considerations, the solubilities may be 21-24 wt% at 1.5 GPa, 670 ~ C and possibly as high as 23 33 wt% at 1.7 GPa, 667-695 ~ C (the values plotted in their Fig. 10 were miscalculated by them). These values are in good agreement with extrapolations of data from Burnham and Jahns (1962) to 1.5 GPa, a linear extrapolation giv- ing ~23 wt% and one following their curve giving values in the range 30-35 wt%. Goldsmith and Jenkins (1985) showed that it is impossible to quench runs to coherent glasses at 1.5 1.9 GPa, 600-680 ~ C in the sys- tem A b - H 2 0 ; instead a soft amorphous powder com- posed of 2-5 gm-sized globules was obtained, and they suggested that this was duc to the existence of a tenuous highly depolymerized water-rich fluid. Goldsmith and Peterson (1990) observed a soft granular incoherent brownish isotropic substance, which they called GIBIS, in runs quenched at P 1.5-2.8 GPa in the system KA1- Si3Os H20. This they assumed to have formed from a near-critical melt, indicating that there is an approach to complete miscibility under these conditions. The dif- ferences between the quenched products obtained by Goldsmith and Petcrson and in the present study may arise in part from differences in the initial amount of water in the capsules. If the initial composition X lies close to but on the water-rich side of the critical point (Fig. I c), the quenched product is expected to be a va- pour which would precipitate globules, as described by Goldsmith and Jenkins (1985). If the initial composition Y lies close to but on the water-poor side of a critical point (Fig. I c), the quenched product is expected to be a glass full of exsolved bubbles, as in Fig. 4. We thus suggest that a critical point lies close to and above 1.3 GPa and 1200~ Unfortunately, most existing methods seem to be poorly adapted for measuring such high water contents, although the difference in the ap-
pearance of the quenched products on either side of the critical point allows one to determine the nature and number of phases present and hence to estimate the water concentrations in the melt and vapour, provided the total water is accurately known.
The variation of solubility as a function of P and Tis shown in Fig. 6 along with the hydrothermal melting or three-phase curve ( S + L + V ) curve for high-to-low albite from Goldsmith and Jenkins (1985) and water so- lubilities in liquids close to the curve from Burnham and Jahns (1962) and Boettchcr and Wyllie (1969); liq- uids are stable to the right and metastable to the left of the curve. Solubility is retrograde below 0.4 GPa, close to neutral at 0 .~0 .5 GPa and strongly prograde at and above 0.7 GPa as shown by the slopes of the contours of water concentrations (Fig. 6). We exclude the possibility that the highly bubbly glasses did not form by exsolution but represent the preservation o fmc- tastable "emuls ions" at high P (Burnham 1981); al- though the inferred solubilities are much greater than those deduced from the solubility model of Burnham (1975), they should not be rejcctcd for that reason. All the data confirm the conclusions of Kadik and Lebedev (1968), that there is a change in sign of the variation of the water solubility with P. Thus, the high-T part of the Ab H 2 0 diagram requires revision. Tentative phase relationships, using data of Burnham and Jahns (1962), Boettcher and Wyllie (1969), Kadik and Lebedev (1968) and from this study, are shown in Figs. 6 and 7. Difficulties arise in interpreting the obscrvations of Boettcher and Wyllie (1969), Goldsmith and Jenkins (1985) and Goldsmith and Peterson (1990) because of ambiguities concerning the congruency of the dissolution of albite in the fluid phases and the possible intersection of the three-phase curve ( S + L + V ) with the critical curve. The composition of the small glass globules pre- cipitated from the fluid phase (Fig. 2) is the best evidence that Ab dissolves congruently in the fluid below
1 GPa, at least to a first approximation, and that Ab - H 2 0 can be regarded as a binary system at low P. Boettcher and Wyllie (1969) found that the composition of the solid which condensed from the vapour at 0.97 GPa and 700~ was very close to that of albite, although Goldsmith and Jenkins (1985) argued that
498
o1~ : : j 0.9 lO00Oii900oc (S+L+V
"~2) 1 IO0~ 8
= , ooo I 1 1 I o61- 12 UIt11/-
:" i ?/,Idtl/,J "~176176 tl = 0.5~ ~ ~ O 1400oC
0.3
0.2
0.1
2003 0 0 2 4 6 8 10 12 14 16 18
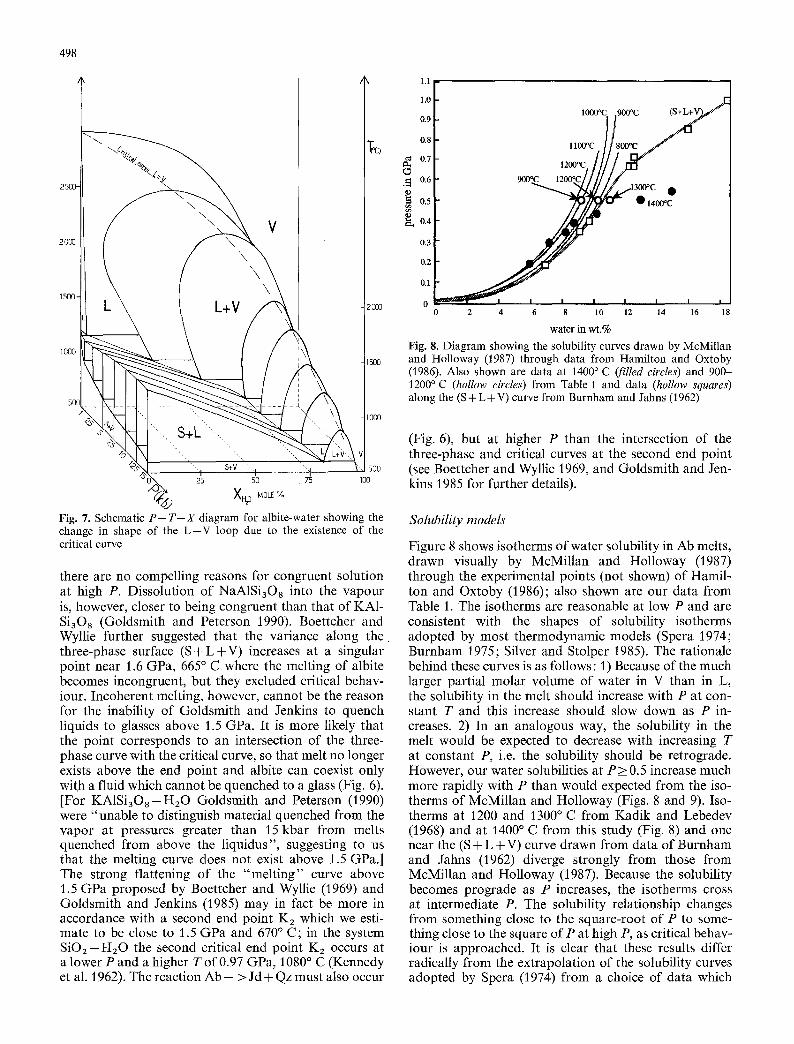
water in wt.% Fig. 8. Diagram showing the solubility curves drawn by McMillan
15oo and Holloway (1987) through data from Hamilton and Oxtoby (1986). Also shown are data at 1400 ~ C (filled circles) and 900- 1200~ (hollow circles) from Table 1 and data (hollow squares) along the (S + L+V) curve from Burnham and Jahns (1962)
lO00
5O0
tO
Fig. 7. Schematic P - T - X diagram for albite-water showing the change in shape of the L--V loop due to the existence of the critical curve
there are no compelling reasons for congruent solution at high P. Dissolution of NaA1Si308 into the vapour is, however, closer to being congruent than that of KA1- SiaO8 (Goldsmith and Peterson 1990). Boettcher and Wyllie further suggested that the variance along t h e three-phase surface ( S + L + V ) increases at a singular point near 1.6 GPa, 665 ~ C where the melting of albite becomes incongruent, but they excluded critical behav- iour. Incoherent melting, however, cannot be the reason for the inability of Goldsmith and Jenkins to quench liquids to glasses above 1.5 GPa. It is more likely that the point corresponds to an intersection of the three- phase curve with the critical curve, so that melt no longer exists above the end point and albite can coexist only with a fluid which cannot be quenched to a glass (Fig. 6). [For KA1Si3Os-H20 Goldsmith and Peterson (1990) were "unable to distinguish material quenched from the vapor at pressures greater than 15 kbar from melts quenched from above the liquidus", suggesting to us that the melting curve does not exist above 1.5 GPa.] The strong flattening of the "melting" curve above 1.5 GPa proposed by Boettcher and Wyllie (1969) and Goldsmith and Jenkins (1985) may in fact be more in accordance with a second end point K2 which we esti- mate to be close to 1.5 GPa and 670 ~ C; in the system SiO2-H20 the second critical end point K2 occurs at a lower P and a higher Tof0.97 GPa, 1080 ~ C (Kennedy et al. 1962). The reaction A b - > Jd + Qz must also occur
(Fig. 6), but at higher P than the intersection of the three-phase and critical curves at the second end point (see Boettcher and Wyllie 1969, and Goldsmith and Jen- kins 1985 for further details).
Solubility models
Figure 8 shows isotherms of water solubility in Ab melts, drawn visually by McMillan and Holloway (1987) through the experimental points (not shown) of Hamil- ton and Oxtoby (1986); also shown are our data from Table 1. The isotherms are reasonable at low P and are consistent with the shapes of solubility isotherms adopted by most thermodynamic models (Spera 1974; Burnham 1975; Silver and Stolper 1985). The rationale behind these curves is as follows: 1) Because of the much larger partial molar volume of water in V than in L, the solubility in the melt should increase with P at con- stant T and this increase should slow down as P in- creases. 2) In an analogous way, the solubility in the melt would be expected to decrease with increasing T at constant P, i.e. the solubility should be retrograde. However, our water solubilities at P > 0.5 increase much more rapidly with P than would expected from the iso- therms of McMillan and Holloway (Figs. 8 and 9). Iso- therms at 1200 and 1300~ C from Kadik and Lebedev (1968) and at 1400 ~ C from this study (Fig. 8) and one near the (S + L + V) curve drawn from data of Burnham and Jahns (1962) diverge strongly from those from McMillan and Holloway (1987). Because the solubility becomes prograde as P increases, the isotherms cross at intermediate P. The solubility relationship changes from something close to the square-root of P to some- thing close to the square of P at high P, as critical behav- iour is approached. It is clear that these results differ radically from the extrapolation of the solubility curves adopted by Spera (1974) from a choice of data which
......... .::::::::: ~i!!!i!ii:
:.:.:.:+:+ i!::{!}::!::~!:: / 1200oc-
0.7
.~-'~ 0.6
0.5
0.4
0.3
0.2
0.1
0
1.0
0.9
0.8
2 4 6 8 10 12 14 16 18
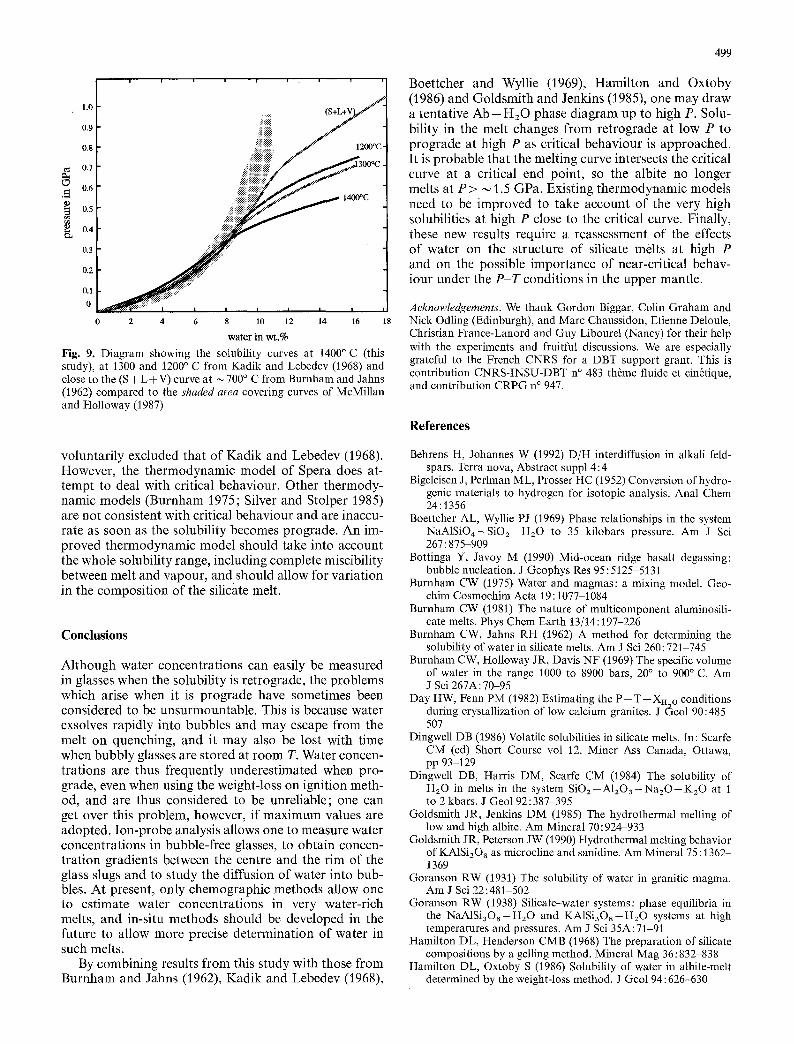
water in wt.% Fig. 9. Diagram showing the solubility curves at 1400~ (this study), at 1300 and 1200 ~ C from Kadik and Lebedev (1968) and close to the (S + L + V) curve at ~ 700 ~ C from Burnham and Jahns (1962) compared to the shaded area covering curves of McMillan and Ho]loway (1987)
voluntar i ly excluded that o f Kadik and Lebedev (1968). However , the t he rmodynamic model o f Spera does at- tempt to deal with critical behaviour. Other thermody- namic models (Burnham 1975; Silver and Stolper 1985) are no t consistent with critical behaviour and are inaccu- rate as soon as the solubility becomes prograde. A n im- proved the rmodynamic model should take into account the whole solubility range, including complete miscibility between melt and vapour , and should allow for var ia t ion in the composi t ion o f the silicate melt.
Conclusions
Al though water concentra t ions can easily be measured in glasses when the solubility is retrograde, the problems which arise when it is p rograde have sometimes been considered to be unsurmountable . This is because water exsolves rapidly into bubbles and m a y escape f rom the melt on quenching, and it m a y also be lost with time when bubbly glasses are stored at r o o m T. Water concen- trat ions are thus frequently underes t imated when pro- grade, even when using the weight-loss on ignit ion meth- od, and are thus considered to be unreliable; one can get over this problem, however, if m a x i m u m values are adopted. Ion -p robe analysis allows one to measure water concent ra t ions in bubble-free glasses, to obtain concen- t rat ion gradients between the centre and the r im of the glass slugs and to s tudy the diffusion o f water into bub- bles. At present, only chemograph ic methods allow one to estimate water concentra t ions in very water-r ich melts, and in-situ methods should be developed in the future to allow more precise determinat ion o f water in such melts.
By combin ing results f rom this s tudy with those f rom B u r n h a m and Jahns (1962), Kadik and Lebedev (1968),
499
Boet tcher and Wyllie (1969), Hami l ton and Oxtoby (1986) and Goldsmi th and Jenkins (1985), one m a y draw a tentative A b - H 2 0 phase diagram up to high P. Solu- bility in the melt changes f rom ret rograde at low P to p rograde at high P as critical behaviour is approached. It is probable that the melt ing curve intersects the critical curve at a critical end point, so the albite no longer melts at P > ~ 1.5 GPa. Existing the rmodynamic models need to be improved to take account o f the very high solubilities at high P close to the critical curve. Finally, these new results require a reassessment o f the effects o f water on the structure o f silicate melts at high P and on the possible impor tance o f near-critical behav- iour under the P T condit ions in the upper mantle.
Acknowledgements. We thank Gordon Biggar, Colin Graham and Nick Odling (Edinburgh), and Marc Chaussidon, Etienne Deloule, Christian France-Lanord and Guy Libourel (Nancy) for their help with the experiments and fruitful discussions. We are especially grateful to the French CNRS for a DBT support grant. This is contribution CNRS-INSU-DBT n ~ 483 thtme fluide et cin~tique, and contribution CRPG n ~ 947.
References
Behrens H, Johannes W (1992) D/H interdiffusion in alkali feld- spars. Terra nova, Abstract suppl 4:4
Bigeleisen J, Perlman ML, Prosser HC (1952) Conversion of hydro- genic materials to hydrogen for isotopic analysis. Anal Chem 24:1356
Boettcher AL, Wyllie PJ (1969) Phase relationships in the system NaA1SiO4-SiO2-H20 to 35 kilobars pressure. Am J Sci 267 : 875-909
Bottinga Y, Javoy M (1990) Mid-ocean ridge basalt degassing: bubble nucleation. J Geophys Res 95:5125-5131
Burnham CW (1975) Water and magmas: a mixing model. Geo- china Cosmochim Acta 19:1077-1084
Burnham CW (1981) The nature of multicomponent aluminosili- cate melts. Phys Chcm Earth 13/14:197-226
Burnham CW, Jahns RH (1962) A method for determining the solubility of water in silicate melts. Am J Sci 260 : 721 745
Burnham CW, Holloway JR, Davis NF (1969) The specific volume of water in the range 1000 to 8900 bars, 20 ~ to 900 ~ C. Am J Sci 267A: 70-95
Day HW, Fenn PM (1982) Estimating the P - T - X n . o conditions during crystallization of low calcium granites. J ~eol 90:485 507
Dingwell DB (1986) Volatile solubilities in silicate melts, in: Scarfe CM (ed) Short Course vol 12. Miner Ass Canada, Ottawa, pp 93 129
Dingwcll DB, Harris DM, Scarfe CM (1984) The solubility of H20 in melts in the system S iO2-A1203-NazO-K20 at 1 to 2 kbars. J Geol 92:387-395
Goldsmith JR, Jenkins DM (1985) The hydrothermal melting of low and high albite. Am Mineral 70:924~933
Goldsmith JR, Peterson JW (1990) Hydrothermal melting behavior of KA1Si308 as microcline and sanidine. Am Mineral 75 : 1362- 1369
Goranson RW (1931) The solubility of water in granitic magma. Am J Sci 22:481-502
Goranson RW (1938) Silicate--water systems: phase equilibria in the NaAISi3Os-H20 and KA1Si308-HzO systems at high temperatures and pressures. Am J Sci 35A: 71-91
Hamilton DL, Henderson CMB (1968) The preparation of silicate compositions by a gelling method. Mineral Mag 36:83~838
Hamilton DL, Oxtoby S (1986) Solubility of water in albite-melt determined by the weight-loss method. J Geol 94: 626-630
500
Holland TJB (1980) The reaction albite=jadeite+quartz deter- mined experimentally in the range 600-1200 ~ C. Am Mineral 65:129-134
Jambon A, Carron J-P (1976) Diffusion of Na, K, Rb and Cs in glasses of albite and orthoclase composition. Geochim Cos- mochim Acta 40: 897403
Kadik AA, Lebedev YeB (1968) Temperature dependence of the solubility of water in an albite melt at high pressures. Geochem Iut 5 : 1172-1181
Kennedy GC, Wasserburg GJ, Heard HC, Newton RC (1962) The upper three-phase region in the system SiO2-H20. Am J Sci 260:501-521
Khitarov NI, Kadik AS, Lebedev YeB (1963) Estimation of the thermal effects of the separation of water from felsic melts based on data for the system albite-water. Geochemistry 7:637 649
Kohn SC, Dupree R, Smith ME (1989) A multinuclear magnetic resonance study of the structure of hydrous albite glasses. Geo- chim Cosmochim Acta 53:2925 2935
Kushiro I, Yoder HS Jr (1969) Silicate systems including a vapor phase. Melting of forsterite and enstatite at high pressures under hydrous conditions. Carnegie Inst Washington Yearb 67 : 153-167
MeMillan PF, Holloway JR (1987) Water solubility in aluminosili- eate melts. Contrib Mineral Petrol 97 : 320-332
Morse SA (1980) Basalts and phase diagrams. Springer, Berlin Heidelberg New York
Newman S, Stolper EM, Epstein S (1986) Measurement of water in rhyolitic glasses: calibration of an infrm'ed spectroscopic technique. Am Mineral 71:1527 1541
Orlova GP (1963) Solubility of water in albite melts under pressure. Int Geol Rev 6:1007-1032
Persikov ES, Zharikov VA, Bukhtiyarov PG, Pol'skoy SF (1990) The effect of volatiles on the properties of magmatic melts. Eur J Mineral 2 : 621-642
Ricci JF (1966) The phase rule and heterogeneous equilibria. Dover Publ, New York
Silver L, Stolper E (1985) A thermodynamic model lbr hydrous silicate melts. J Geol 93:161-178
Silver L, Stolper E (1989) Water in albitic glasses. J Petrol 30 : 667- 709
Smith JV, Brown WL (1988) Feldspar minerals, vol 1. Springer, Berlin Heidelberg New York
Spera FJ (1974) A thermodynamic basis for predicting water solu- bilities in silicate melts and implications for the low velocity zone. Contrib Mineral Petrol 45:175-186
Tuttle OF, Bowen NL (1958) Origin of granite in the light of experi- mental studies in the system NaA1Si3Os-KA1Si3Os-SiOz- H20. Geol Soc Am Mere 74
Voigt DE, Bodnar RJ, Blencoe JG (1981) Water solubility in melts of alkali feldspar composition, Eos Trans Am Geophys Union 62: 428
Yoder HS Jr (1965) Diopside-anorthite-water at five and ten kilo- bars and its bearing on explosive volcanism. Carnegie Inst Washington Yearb 64:82-89
Yoder HS Jr, Stewart DB, Smith JR (1957) Ternary feldspars. Car- negie Inst Washington Yearb 56:206-214
Editorial responsibility: I. Parsons
Copyright © 2022 FDOKUMEN