H2O ALLEGRO
80
French UCITS H2O ALLEGRO ANNUAL ACCOUNTS on 28 June 2019 Management Company: H2O AM LLP Custodian: Caceis Bank Auditor: Kpmg Audit H2O AM LLP 10 Old Burlington Street – London W1S 3AG, United Kingdom - Tél. : +44 (0) 20 7292 1616 Limited Liability Partnership incorporated in England and Wales, authorised by the Financial Services Authority, Under number 529105 www.h2o-am.com Marketing agent: Natixis Invesment Managers International 43 avenue Pierre Mendès France – 75013 Paris France – Tél. : +33 (0)1 78 40 80 00 www.im-natixis.com
-
Upload
khangminh22 -
Category
Documents
-
view
2 -
download
0
Transcript of H2O ALLEGRO

French UCITS
H2O ALLEGRO
ANNUAL ACCOUNTS
on 28 June 2019
Management Company: H2O AM LLP
Custodian: Caceis Bank
Auditor: Kpmg Audit
H2O AM LLP 10 Old Burlington Street – London W1S 3AG, United Kingdom - Tél. : +44 (0) 20 7292 1616 Limited Liability Partnership incorporated in England and Wales, authorised by the Financial Services Authority, Under number 529105
www.h2o-am.com
Marketing agent: Natixis Invesment Managers International 43 avenue Pierre Mendès France – 75013 Paris France – Tél. : +33 (0)1 78 40 80 00
www.im-natixis.com

H2O ALLEGRO 2
Contents
31. Management Report
a) Investment policy 3
Management policy
b) Information on the mutual fund 7
Principal movements during the period
Substancial changes during the period and upcoming
Mutual fund index
Target hedge funds
Efficient portfolio management (EMP) techniques and financial derivative instruments
Acces to the mutual fund documentation
SFTR regulation
c) Risk information 15
Global risk calculation method
Securisation exposure
Risk management
Liquidity management
Treatment of non-liquid assets
d) Environmental, social and governance criteria (« ESG ») 16
e) Energy transition for green growth low 17
182. Governance and compliance obligations
203. Fees and Tax
224. Auditor's Certification
285. Annual financial statements
Page
1. Management Report
H2O ALLEGRO 3
a) Investment policy Management policy
Over the period under review (29/06/2018 – 28/06/2019), after fees, the performances of the different share classes
compared to their corresponding money market rates split as follow:
Share classes Launching date ISIN code 1-year performance3-year annualized performance (*)
5-year annualized performance (*)
I-C (EUR) 16/03/2011 FR0011006188 8.43% 23.29% 17.84%EONIA -0.37% -0.36% -0.27%R-C (EUR) 16/03/2011 FR0011015460 8.03% 22.81% 17.50%EONIA -0.37% -0.36% -0.27%M-D (EUR) 15/07/2016 FR0013076973 7.89%EONIA -0.37%N-C (EUR) 11/10/2017 FR0013186673 7.99%EONIA -0.37%
HUSD-I C 06/02/2015 FR0011973635 11.85% 25.71%LIBOR USD 1 Month 2.37% 1.56%HUSD-R C 30/09/2014 FR0011973627 11.39% 25.18%LIBOR USD 1 Month 2.37% 1.56%
HCHF-I C 10/08/2015 FR0012518389 8.48% 23.45%LIBOR CHF 1 Month -0.78% -0.79%HCHF-R C 11/09/2014 FR0011973585 8.08% 22.60%LIBOR CHF 1 Month -0.78% -0.79%
HSGD-R C 29/07/2014 FR0011973601 9.89% 24.35%LIBOR SGD 1 Month 1.70% 1.18%HSGD-I C 17/05/2018 FR0011973619 8.99%LIBOR SGD 1 Month 1.70%
HGBP-I C 08/03/2012 FR0011192327 11.82% 30.85% 23.02%LIBOR GBP 1 Month 0.71% 0.47% 0.49%
HAUD-I C 29/06/2018 FR0013186632 10.90%30-day Aus Bank Bills 1.97%(*) geometrical annualization.
The fund’s prospectus sets out the hedging of the share classes denominated in different currencies as follows:
For the HGBP-I share class, denominated in GBP, a currency hedging is set up and aims to reduce the impact of the
EUR/GBP pair evolution on the FCP’s performance. This share’s objective is thus to restore as best as possible, during
the FCP’s life span, the strategy’s performance by hedging the EUR/GBP currency risk likely to affect the NAV evolution.
For the HCHF-I and HCHF-R share classes, denominated in CHF, a currency hedging is set up and aims to reduce the
impact of the EUR/CHF pair evolution on the FCP’s performance. These shares’ objective is thus to restore as best as
possible, during the FCP’s life span, the strategy’s performance by hedging the EUR/CHF currency risk likely to affect the
NAV evolution.

1. Management Report
H2O ALLEGRO 4
For the HUSD-I and HUSD-R share classes, denominated in USD, a currency hedging is set up and aims to reduce the
impact of the EUR/USD pair evolution on the FCP’s performance. These shares’ objective is thus to restore as best as
possible, during the FCP’s life span, the strategy’s performance by hedging the EUR/USD currency risk likely to affect the
NAV evolution.
For the HSGD-R share class, denominated in SGD, a currency hedging is set up and aims to reduce the impact of the
EUR/SGD pair evolution on the FCP’s performance. This share’s objective is thus to restore as best as possible, during
the FCP’s life span, the strategy’s performance by hedging the EUR/SGD currency risk likely to affect the NAV evolution.
Considering the variations that happened on the OPCVM’s liabilities, the size of the net assets hedged, and the
calculation methods of the management fees for each share class, performance differences between share classes can
be observed.
The mutual fund falls under the French AMF category of “International bonds and other debt securities”. The fund’s
objective is to outperform the daily compounded EONIA for the EUR denominated shares, the LIBOR CHF 1 month for
the CHF denominated shares, the LIBOR USD 1 month for the USD denominated shares, the LIBOR SGP 1 month for
the SGD denominated share, the LIBOR GBP 1 month for GBP denominated share and the 30-day Bank Accepted Bills
for the AUD denominated shares over a recommended investment period of 4 years and after deduction of management
fees.
The UCITS’s investment policy is compliant with European standards and based upon a global, very active, top-down
investment process in order to achieve performance on global debt and currency markets under all markets conditions.
The management team implements directional strategies (corresponding to the general direction of these markets) as
well as relative value and arbitrage strategies (to play the relative markets trends) on debt and forex markets.
The management of the mutual fund is entrusted to the Management Company H2O AM LLP, which acts on behalf of the
holders and in their exclusive interests. The shares of the mutual fund are nominative. They do not carry any voting rights.
The management company’s policy may be consulted at the management company’s registered office or on the website
of H2O AM LLP at www.h2o-am.com.
The Management Company conducts an assessment process for the selection of intermediaries that takes into account
such objective criteria as research, execution quality as well as commercial monitoring. This procedure is available on the
H2O AM LLP’s website, at www.h2o-am.com.
1. Management Report
H2O ALLEGRO 5
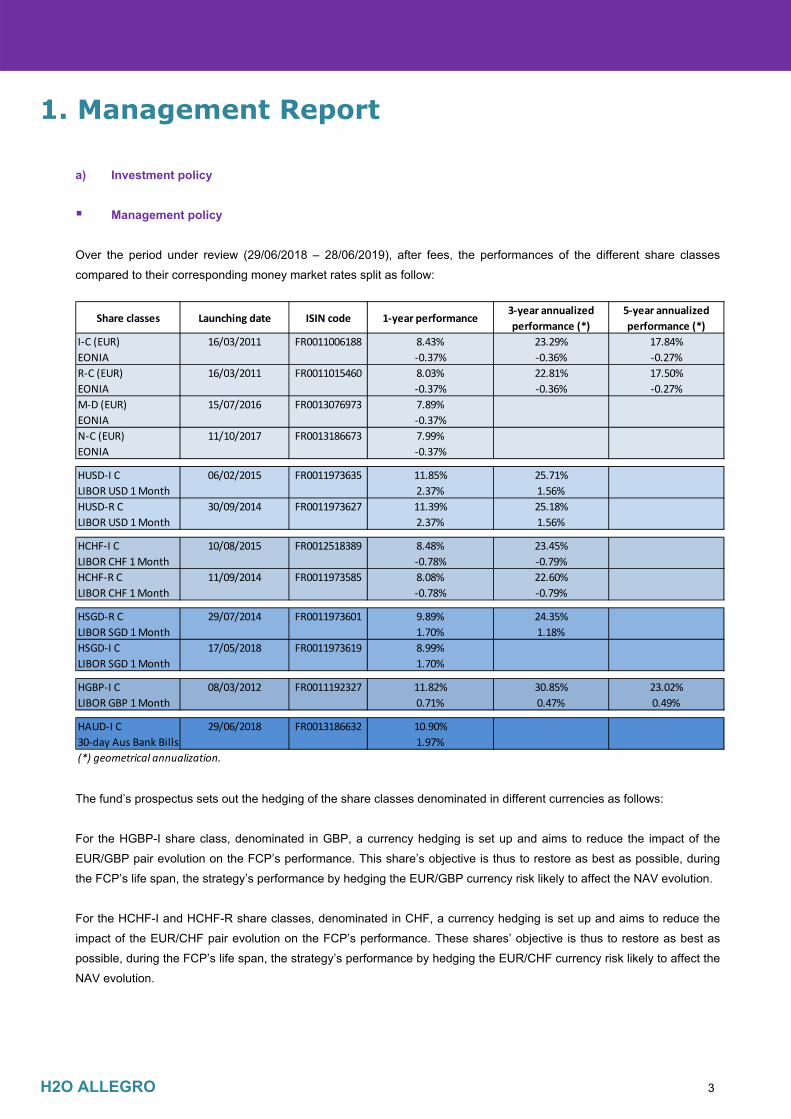
The fund’s absolute performance management process is based upon all the investment team’s views on global
sovereign bonds, credit bonds (corporate and EM), and currencies. Their contribution to the fund’s performance over the
fiscal year is the following:
1. Government and sovereign bonds H2O’s global bond market strategies posted positive returns over the period. They split as
follows:
a. G4 duration: This actively managed directional strategy achieved a negative
contribution over the period due to the overall short duration stance of the portfolio.
Over the period under review, US and European government-bond yields dropped
sharply, especially in 2019 as the Fed maintained its accommodative stance in the
face of the slowdown in global growth, and of inflationary pressures remaining muted
in the US.
b. Relative allocation among the G4 10 year sovereign bond market: during the
period, the “transatlantic arbitrage” (short 10 year US T-Notes versus German
Bunds) generated a negative contribution as a result of the widening of the 10-year
spread;
c. Curve strategies: German curve flattening: positive contribution as a result of the
flattening of the German yield curve over the period (short 2 year & long 10 year), in
particular during Q1 2019, as German 10-year government debt dropped into
negative territory in March for the first time since 2016;
d. Non-G4 sovereign bonds: very positive contribution overall, resulting from the long
“GIPS” bonds. In particular, the Italian BTPs yields contracted by approx. 100 bps
over the period, especially in June 2019, on the back of dovish tone from the
European Central Bank. The Greek and Portuguese spreads tightening vs. the Bund
over the period also contributed positively to performance.
2. Currencies The strategies on currency markets posted very positive returns over the period:
a. Long directional USD exposure: positive contribution over the period (especially
during Q4 2018). The USD strengthened mostly against the euro, while retreating
against the yen and the Canadian dollar;
b. Inter-bloc allocation: slightly positive contribution overall, in part due to the long JPY
strengthening vs. the euro, especially in Q4 2018. The long JPY was reduced during
Q1 2019 and transitioned to a long EUR during Q2 2019;
c. Intra-bloc allocation: strongly positive contribution.
Euro bloc: the short CHF position posted losses over the period on the back of
safe-haven repatriation flows. The long NOK position also detracted slightly over
1. Management Report
H2O ALLEGRO 6
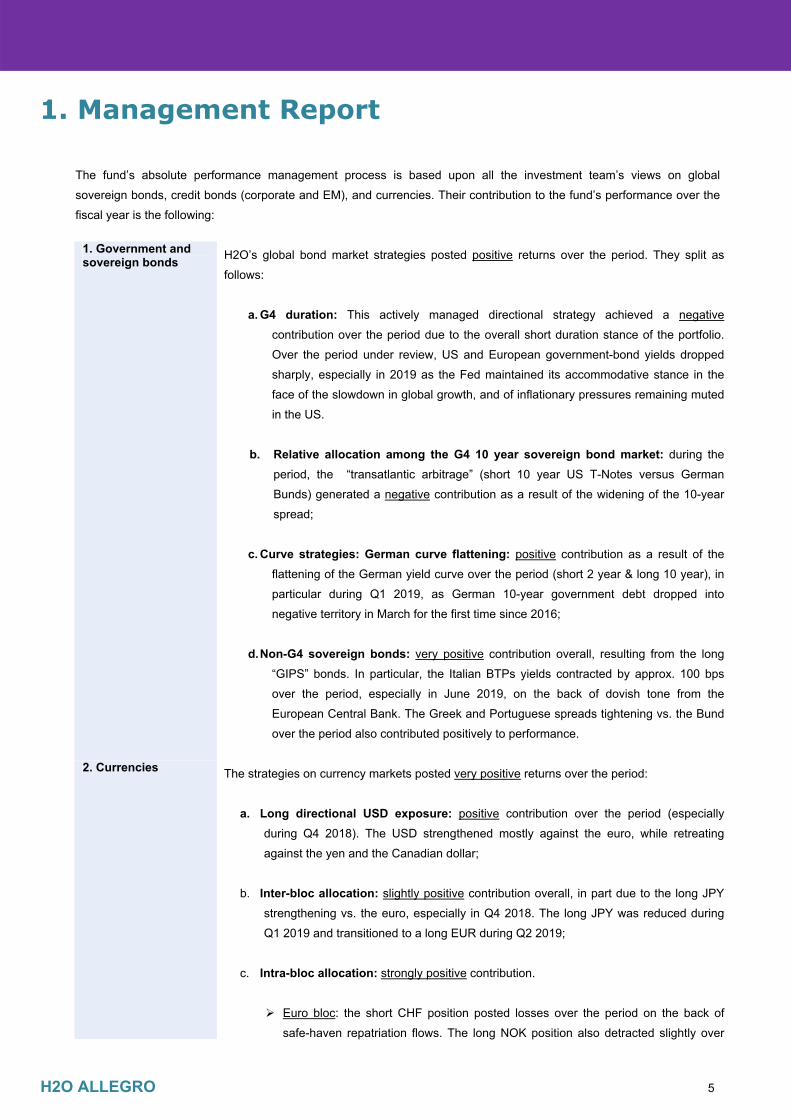
the period;
Commodity currencies bloc: strongly positive contribution from the Canadian
dollar’s strength versus the Aussie and the Kiwi;
d. Emerging currencies strategy: positive contribution. The long Mexican peso vs. US
dollar delivered a strong return over the period. The short positions on a basket of
Asian currencies (including the Korean won and the Taiwanese dollar) against the US
dollar also contributed positively, while the short positioning across South American
currencies (including the Brazilian real & Columbian peso) against the greenback was
more neutral as the losses from the short Brazilian real were absorbed by the gains of
the short Columbian peso. Finally, the long Turkish lira detracted slightly over the
period.
3. Credit markets
The strategies implemented on the credit markets posted a negative contribution over the
period.
a. Selection of corporate bonds: very negative contribution due to the substantial
markdown of the exposure to non-rated European corporate bonds in the wake of the
significant redemptions set off by the June 18th Financial Times article. The fund’s
exposure thereto dropped to 4.0% of managed assets at the end of the period;
b. Selection of EM sovereign bonds: slightly positive contribution of five Turkish
sovereign bonds (7% of managed assets at the end of the period).
Past performance is no guarantee of future performance.
1. Management Report
H2O ALLEGRO 7
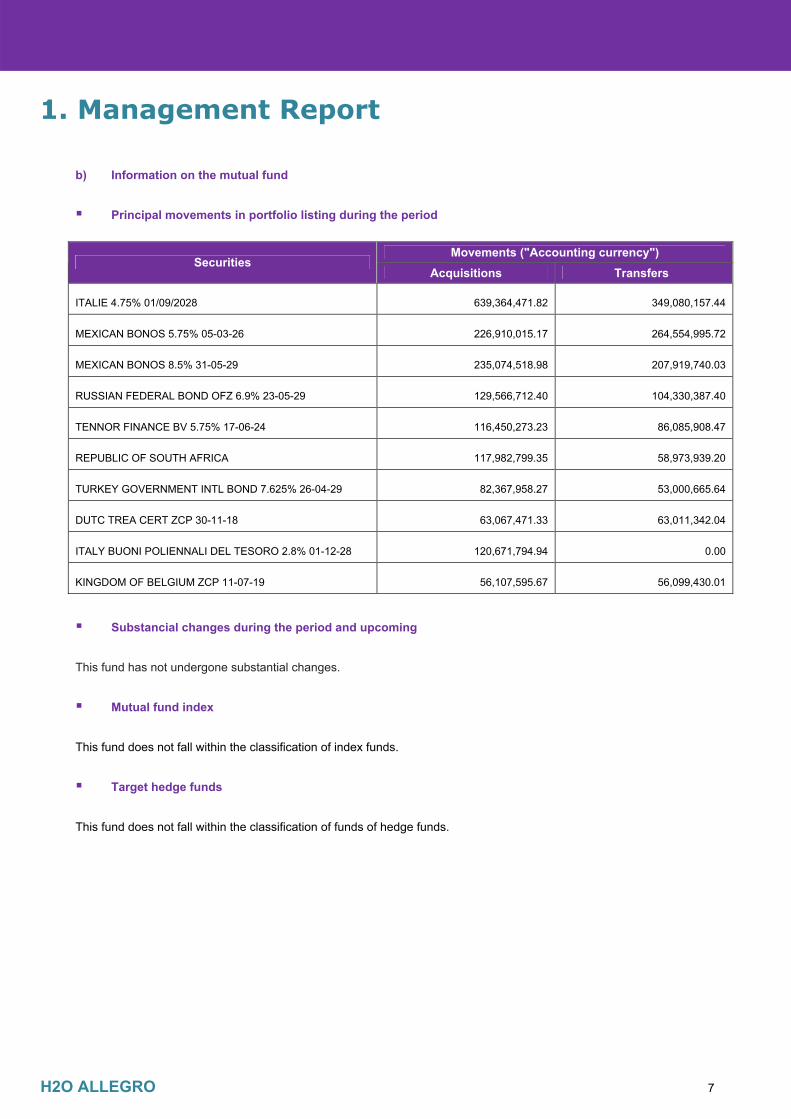
b) Information on the mutual fund Principal movements in portfolio listing during the period
Movements ("Accounting currency") Securities
Acquisitions Transfers
ITALIE 4.75% 01/09/2028 639,364,471.82 349,080,157.44
MEXICAN BONOS 5.75% 05-03-26 226,910,015.17 264,554,995.72
MEXICAN BONOS 8.5% 31-05-29 235,074,518.98 207,919,740.03
RUSSIAN FEDERAL BOND OFZ 6.9% 23-05-29 129,566,712.40 104,330,387.40
TENNOR FINANCE BV 5.75% 17-06-24 116,450,273.23 86,085,908.47
REPUBLIC OF SOUTH AFRICA 117,982,799.35 58,973,939.20
TURKEY GOVERNMENT INTL BOND 7.625% 26-04-29 82,367,958.27 53,000,665.64
DUTC TREA CERT ZCP 30-11-18 63,067,471.33 63,011,342.04
ITALY BUONI POLIENNALI DEL TESORO 2.8% 01-12-28 120,671,794.94 0.00
KINGDOM OF BELGIUM ZCP 11-07-19 56,107,595.67 56,099,430.01
Substancial changes during the period and upcoming
This fund has not undergone substantial changes.
Mutual fund index This fund does not fall within the classification of index funds. Target hedge funds This fund does not fall within the classification of funds of hedge funds.
1. Management Report
H2O ALLEGRO 8
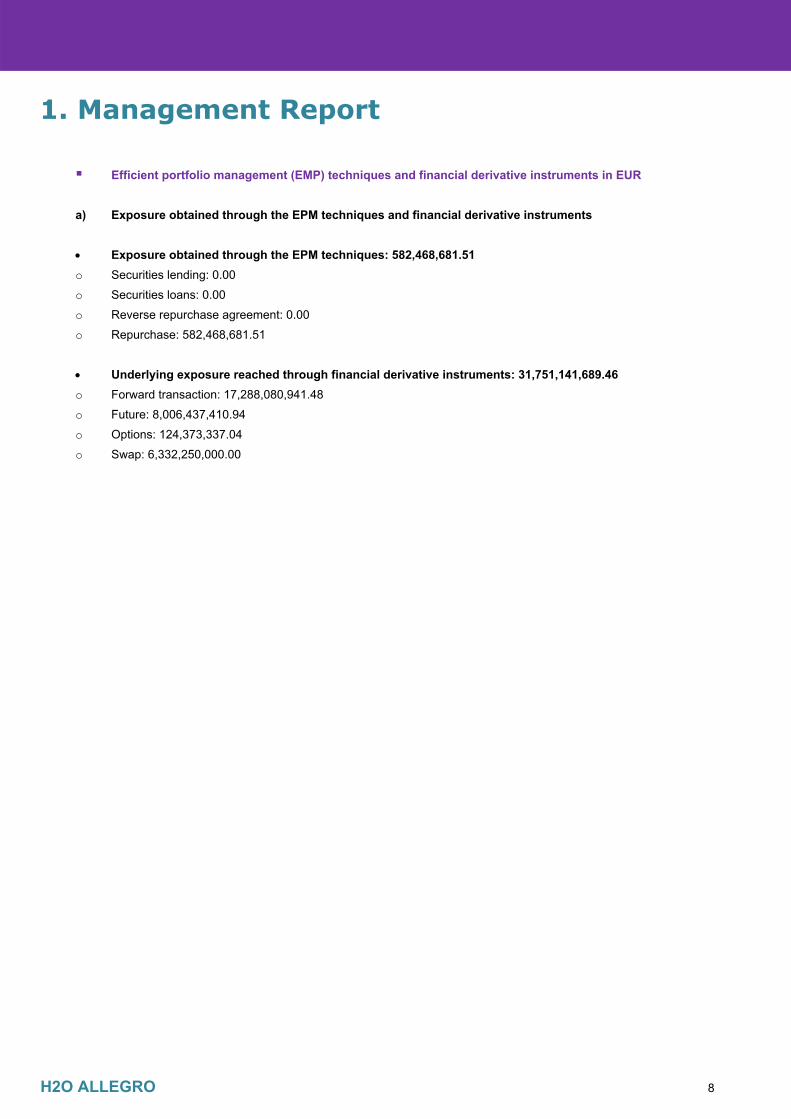
Efficient portfolio management (EMP) techniques and financial derivative instruments in EUR a) Exposure obtained through the EPM techniques and financial derivative instruments
Exposure obtained through the EPM techniques: 582,468,681.51 o Securities lending: 0.00 o Securities loans: 0.00 o Reverse repurchase agreement: 0.00 o Repurchase: 582,468,681.51 Underlying exposure reached through financial derivative instruments: 31,751,141,689.46 o Forward transaction: 17,288,080,941.48 o Future: 8,006,437,410.94 o Options: 124,373,337.04 o Swap: 6,332,250,000.00

1. Management Report
H2O ALLEGRO 9
b) Identity of the counterparty(ies) to EPM techniques and financial derivative instruments
EPM techniques Financial derivative instruments (*)
CREDIT AGRICOLE CIB
BNP PARIBAS FRANCE
JP MORGAN SECURITIES PLC
1599 CABOTO HOLDING SPA MILAN
BARCLAYS BK PLC WHOLESALE LONDRES
BNP PARIBAS FRANCE
MORGAN STANLEY & CO INTL LONDRES
MERRILL LYNCH INTERNATIONAL (GLOBAL FOREIGN
EXCHANGE)
STANDARD CHARTERED PLC
CREDIT SUISSE INTERNATIONAL
BK OF NEW YORK AV PRO BRUXELLES
HSBC BANK PLC
UBS EUROPE SE
NOMURA INTL LONDRES
GOLDMAN SACHS INTL LTD
DEUTSCHE BANK AG LONDRES
SOCIETE GENERALE SA
JP MORGAN SECURITIES PLC
CACIB LONDON
THE TORONTO DOMINION BANK
CREDIT AGRICOLE SA
MERRIL LYNCH INTERNATIONAL LIMITED
JP MORGAN SECURITIES PLC
GOLDMAN SACHS INTL LTD
(*) Excepted derivative listed.
1. Management Report
H2O ALLEGRO 10
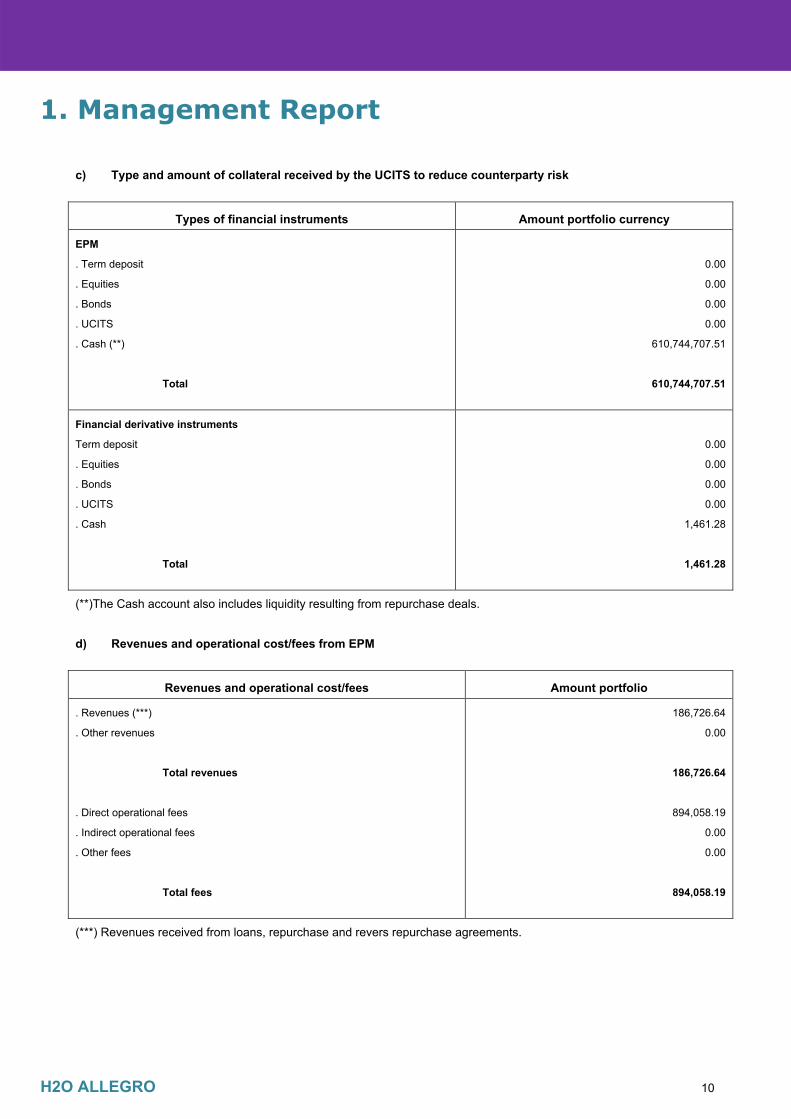
c) Type and amount of collateral received by the UCITS to reduce counterparty risk
Types of financial instruments Amount portfolio currency
EPM
. Term deposit
. Equities
. Bonds
. UCITS
. Cash (**)
Total
0.00
0.00
0.00
0.00
610,744,707.51
610,744,707.51
Financial derivative instruments
Term deposit
. Equities
. Bonds
. UCITS
. Cash
Total
0.00
0.00
0.00
0.00
1,461.28
1,461.28
(**)The Cash account also includes liquidity resulting from repurchase deals.
d) Revenues and operational cost/fees from EPM
Revenues and operational cost/fees Amount portfolio
. Revenues (***)
. Other revenues
Total revenues
. Direct operational fees
. Indirect operational fees
. Other fees
Total fees
186,726.64
0.00
186,726.64
894,058.19
0.00
0.00
894,058.19
(***) Revenues received from loans, repurchase and revers repurchase agreements.
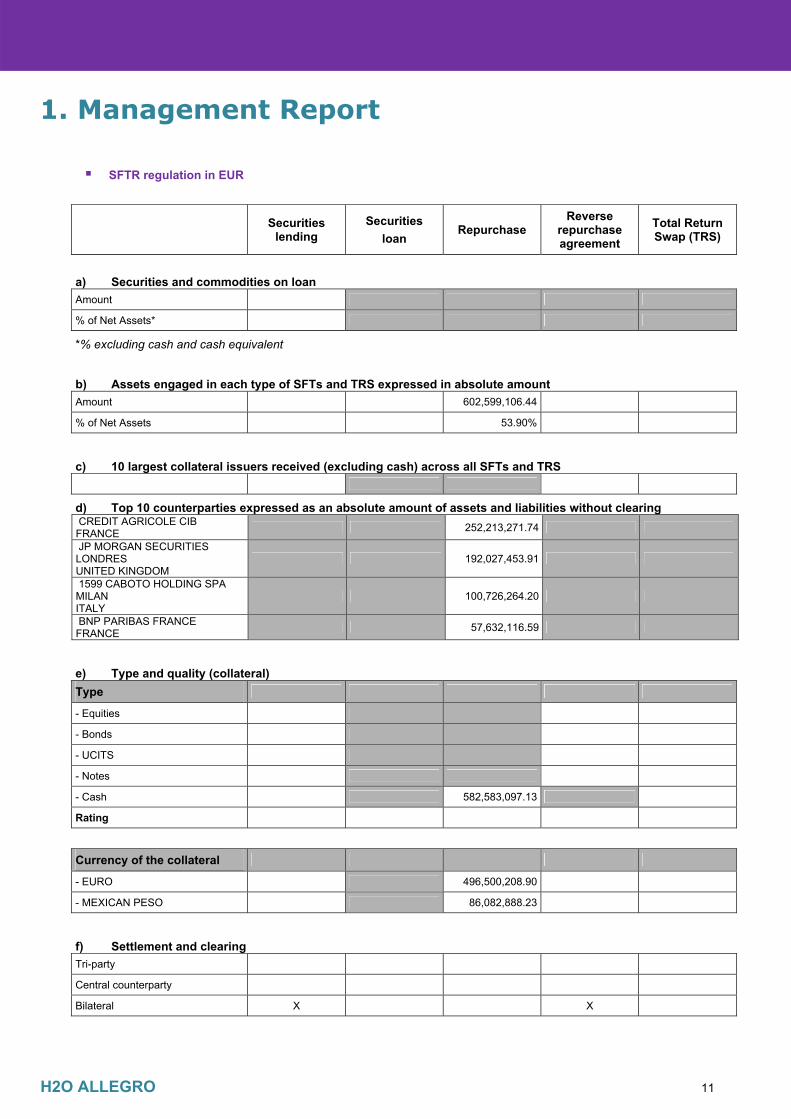
1. Management Report SFTR regulation in EUR
Securities lending
Securities loan
Repurchase Reverse
repurchase agreement
Total Return Swap (TRS)
H2O ALLEGRO 11
a) Securities and commodities on loan Amount
% of Net Assets*
*% excluding cash and cash equivalent
b) Assets engaged in each type of SFTs and TRS expressed in absolute amount Amount 602,599,106.44
% of Net Assets 53.90%
c) 10 largest collateral issuers received (excluding cash) across all SFTs and TRS
d) Top 10 counterparties expressed as an absolute amount of assets and liabilities without clearing (2nd_levels
CREDIT AGRICOLE CIB FRANCE
252,213,271.74
(2nd_levels
JP MORGAN SECURITIES LONDRES UNITED KINGDOM
192,027,453.91
(2nd_levels
1599 CABOTO HOLDING SPA MILAN ITALY
100,726,264.20
(2nd_levels
BNP PARIBAS FRANCE FRANCE
57,632,116.59
e) Type and quality (collateral) Type
- Equities
- Bonds
- UCITS
- Notes
- Cash 582,583,097.13
Rating
Currency of the collateral
- EURO 496,500,208.90
- MEXICAN PESO 86,082,888.23
f) Settlement and clearing Tri-party
Central counterparty
Bilateral X X
1. Management Report
Securities lending
Securities loan
Repurchase Reverse
repurchase agreement
Total Return Swap (TRS)
H2O ALLEGRO 12
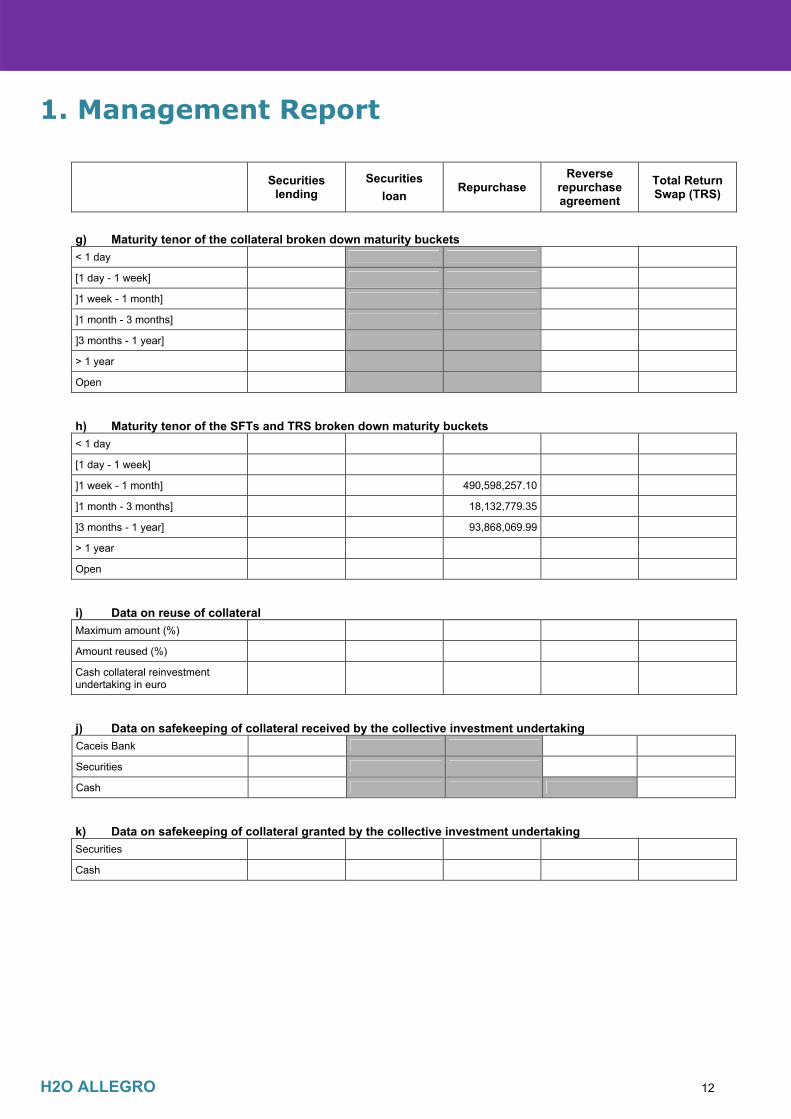
g) Maturity tenor of the collateral broken down maturity buckets < 1 day
[1 day - 1 week]
]1 week - 1 month]
]1 month - 3 months]
]3 months - 1 year]
> 1 year
Open
h) Maturity tenor of the SFTs and TRS broken down maturity buckets < 1 day
[1 day - 1 week]
]1 week - 1 month] 490,598,257.10
]1 month - 3 months] 18,132,779.35
]3 months - 1 year] 93,868,069.99
> 1 year
Open
i) Data on reuse of collateral Maximum amount (%)
Amount reused (%)
Cash collateral reinvestment undertaking in euro
j) Data on safekeeping of collateral received by the collective investment undertaking Caceis Bank
Securities
Cash
k) Data on safekeeping of collateral granted by the collective investment undertaking Securities
Cash
1. Management Report
Securities lending
Securities loan
Repurchase Reverse
repurchase agreement
Total Return Swap (TRS)
H2O ALLEGRO 13
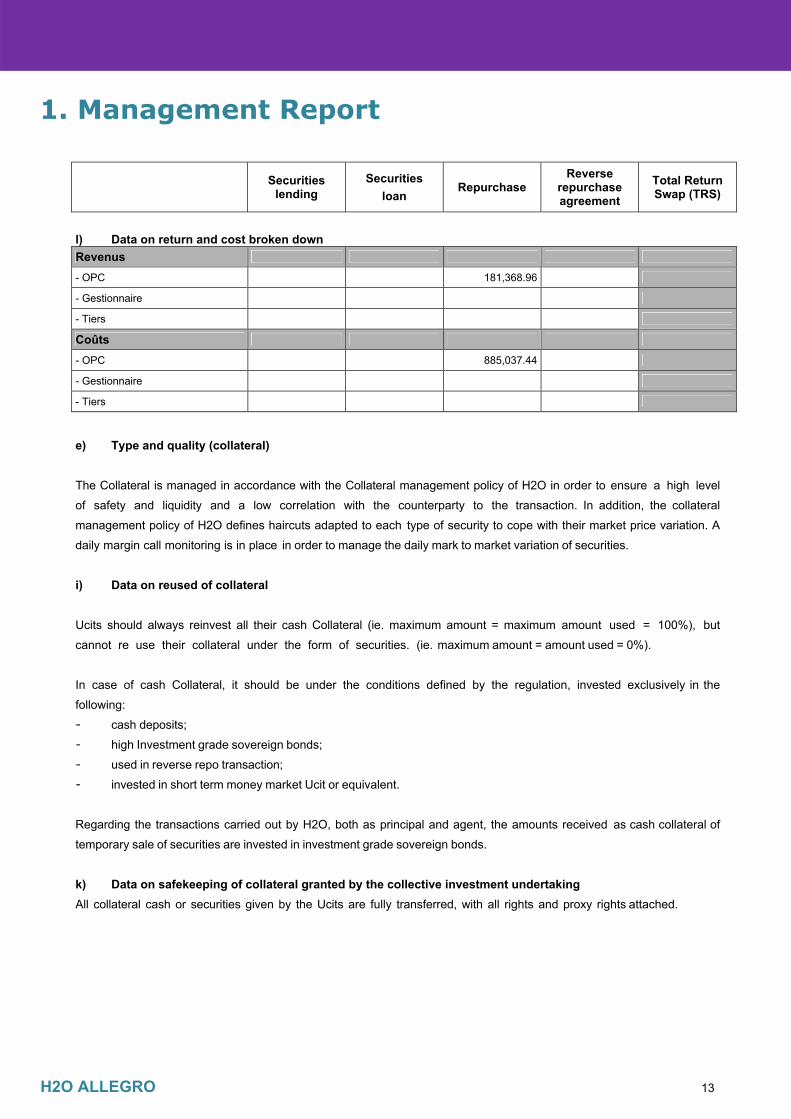
l) Data on return and cost broken down Revenus
- OPC 181,368.96
- Gestionnaire
- Tiers
Coûts
- OPC 885,037.44
- Gestionnaire
- Tiers
e) Type and quality (collateral)
The Collateral is managed in accordance with the Collateral management policy of H2O in order to ensure a high level
of safety and liquidity and a low correlation with the counterparty to the transaction. In addition, the collateral
management policy of H2O defines haircuts adapted to each type of security to cope with their market price variation. A
daily margin call monitoring is in place in order to manage the daily mark to market variation of securities.
i) Data on reused of collateral Ucits should always reinvest all their cash Collateral (ie. maximum amount = maximum amount used = 100%), but
cannot re use their collateral under the form of securities. (ie. maximum amount = amount used = 0%).
In case of cash Collateral, it should be under the conditions defined by the regulation, invested exclusively in the
following:
- cash deposits;
- high Investment grade sovereign bonds;
- used in reverse repo transaction;
- invested in short term money market Ucit or equivalent.
Regarding the transactions carried out by H2O, both as principal and agent, the amounts received as cash collateral of
temporary sale of securities are invested in investment grade sovereign bonds.
k) Data on safekeeping of collateral granted by the collective investment undertaking All collateral cash or securities given by the Ucits are fully transferred, with all rights and proxy rights attached.
1. Management Report
H2O ALLEGRO 14
l) Data on return and cost broken down
All income generated by repos and reverse repos as well as securities lending, net of associated operational costs,
are paid to the UCITS.
Those transactions are undertaken with counterparties selected by H2O. H2O never receives any remuneration
associated with the transactions.
The income generated by those transactions is disclosed in the annual report of the UCITS.
Access to the mutual fund documentation The mutual fund documentation (KIID, prospectus, periodic reports, etc …) is available from the management company,
at its registered office or by writing to the following email address: [email protected].
1. Management Report
H2O ALLEGRO 15
c) Risk information Global risk calculation method The calculation methodology used by the management company for the evaluation of the global risk of the portfolio is as
follows: VAR: absolute Value at risk.
- Leverage of the portfolio: indicative average level:
The indicative average leverage of the Fund is 3/4. However, the Fund may possibly reach a higher leverage. The Fund’s
indicative leverage is calculated as the sum of the nominal positions in all financial contracts held in the Fund.
- Var level during the annual period:
The maximum level of absolute VAR was: 19.44%.
The minimum level of absolute VAR was: 13.89%.
The average level of absolute VAR was: 15.53%.
The calculation methodology used by the management company for the evaluation of the global risk of the portfolio is the parametric 20 days with a Var confidence interval of 99%. It is based on six years of historical data with a half life of two years.
Securisation exposure This fund is not affected by exposure to securitisation. Risk management None.
1. Management Report
H2O ALLEGRO 16
d) Environmental, social and governance criteria (« ESG ») This fund does not take into account the three ESG criteria simultaneously.
1. Management Report
H2O ALLEGRO 17
e) Energy transition for green growth low This UCIT does not report on article 173.
2. Governance and compliance obligations
H2O ALLEGRO 18
Procedure for the selection and evaluation of brokers and counterparties – Execution of orders To enable the management company to fulfil its best execution obligation, the selection and the follow up of brokers and
counterparties on interests rates, bonds, equities, is governed by a specific procedure.
The management company’s policy for the selection of brokers and counterparties for the execution of orders of the
management company is available on its website: http://www.h2o-am.com (rubrique “A propos de H2O AM/Governance
and compliance”). Voting policy Details of the conditions under which the management company intends to exercise the voting rights attached to the
securities held by the mutual funds it manages, as well as the latest annual report, are available from the company’s
registered adress and on its website at: http://www.h2o-am.com (rubrique “A propos de H2O AM/Governance and
compliance”). Remuneration policy The funds managed by H2O are compliant with the UCITS regulation. The management company implements the new
regulation that apply to remunerations in the wake of the implementation of UCITS V regulations.
The remuneration policy is under the supervision and approval of a remuneration Committee comprising a majority of
members who are not employed by H2O.
Regarding the remuneration policy, H2O AM makes a distinction between two categories of personnel: employees and
partners.
• employees are remunerated based on a fixed salary in line with market practice in the United Kingdom, as well as an
annual bonus. This bonus is a function of the individual as well as the collective performance of the company.
• Partners are also remunerated based on a fixed income and annual bonus. They are also entitled to dividends
depending on their share allocation in the capital of H2O, and depending thus on the profitability of H2O.
The supervision and the principles applying to the remuneration policy have not been subject to material modifications
since the launch of H2O in July 2010.
In addition, portfolio managers are authorised to invest in the funds managed by H2O, provided that they disclose the
information to the compliance department of H2O.
2. Governance and compliance obligations
H2O ALLEGRO 19

3. Fees and Tax
H2O ALLEGRO 20
Intermediation costs Details of the conditions under which the management company made use of services to assist with investment decisions
and order execution in the last financial year are available on its website at: http://www.h2o-am.com (rubrique “A propos
de H2O AM/Governance and compliance”). Withholding tax This fund is not affected by the withholding tax.
H2O ALLEGRO 21
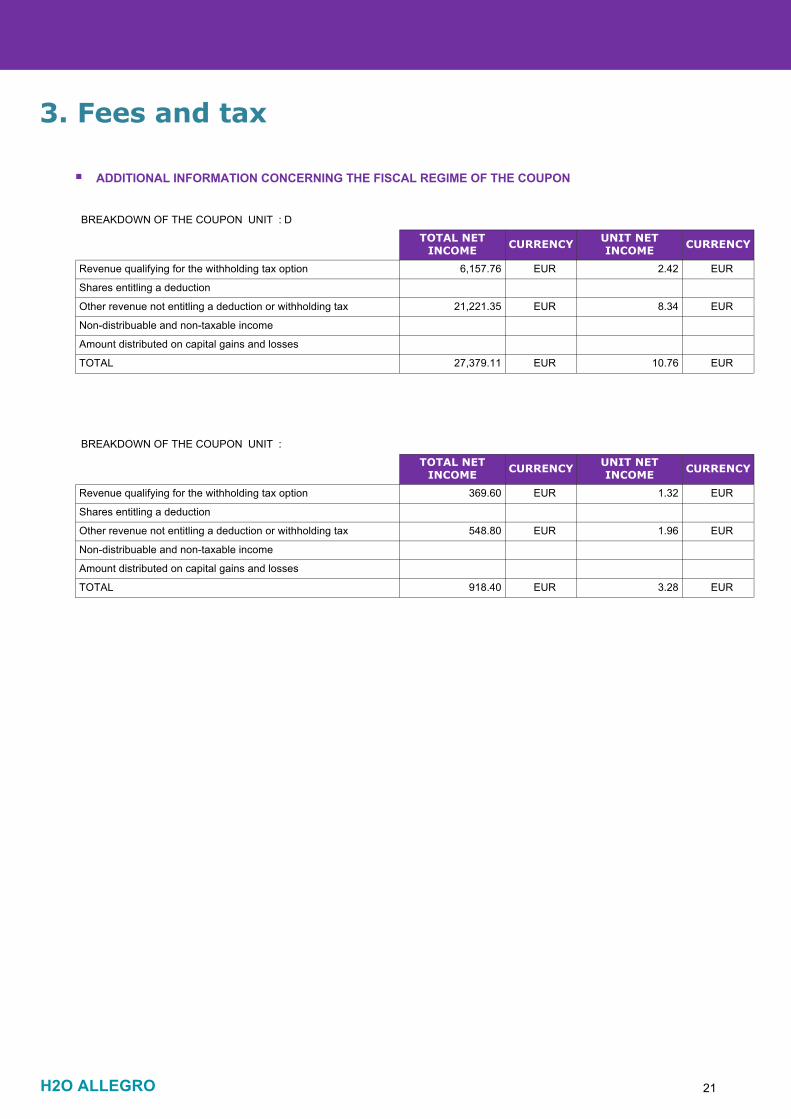
ADDITIONAL INFORMATION CONCERNING THE FISCAL REGIME OF THE COUPON
UNIT NETINCOME
CURRENCYCURRENCYTOTAL NET
INCOME
10.76 EUREUR27,379.11TOTAL
2.42 EUREUR6,157.76Revenue qualifying for the withholding tax option
Shares entitling a deduction
8.34 EUREUR21,221.35Other revenue not entitling a deduction or withholding tax
: DBREAKDOWN OF THE COUPON UNIT
Amount distributed on capital gains and losses
Non-distribuable and non-taxable income
UNIT NETINCOME
CURRENCYCURRENCYTOTAL NET
INCOME
3.28 EUREUR918.40TOTAL
1.32 EUREUR369.60Revenue qualifying for the withholding tax option
Shares entitling a deduction
1.96 EUREUR548.80Other revenue not entitling a deduction or withholding tax
: BREAKDOWN OF THE COUPON UNIT
Amount distributed on capital gains and losses
Non-distribuable and non-taxable income
3. Fees and tax

4. Auditor’s certification
H2O ALLEGRO 22


H2O ALLEGRO 28
Annual financial statements5.
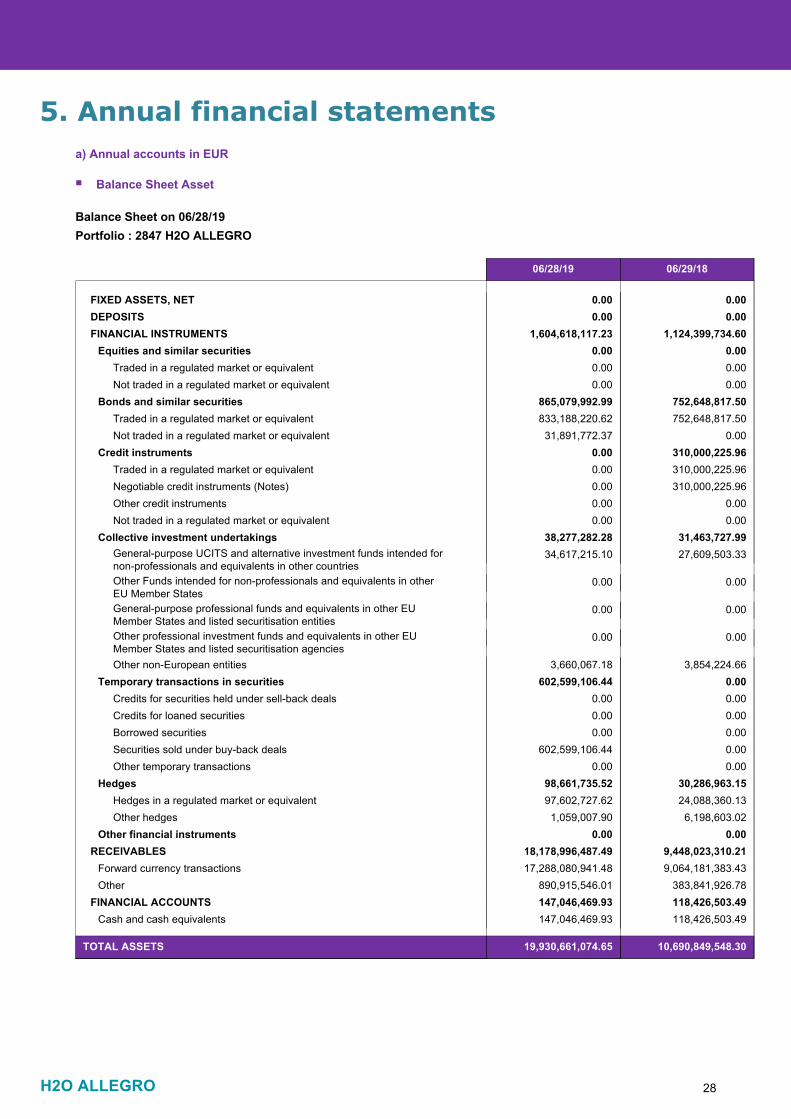
FIXED ASSETS, NET 0.00 0.00
06/28/19 06/29/18
DEPOSITS 0.00 0.00FINANCIAL INSTRUMENTS 1,604,618,117.23 1,124,399,734.60
Equities and similar securities 0.00 0.00Traded in a regulated market or equivalent 0.00 0.00Not traded in a regulated market or equivalent 0.00 0.00
Bonds and similar securities 865,079,992.99 752,648,817.50Traded in a regulated market or equivalent 833,188,220.62 752,648,817.50Not traded in a regulated market or equivalent 31,891,772.37 0.00
Credit instruments 0.00 310,000,225.96Traded in a regulated market or equivalent 0.00 310,000,225.96Negotiable credit instruments (Notes) 0.00 310,000,225.96Other credit instruments 0.00 0.00Not traded in a regulated market or equivalent 0.00 0.00
Collective investment undertakings 38,277,282.28 31,463,727.99General-purpose UCITS and alternative investment funds intended fornon-professionals and equivalents in other countries
34,617,215.10 27,609,503.33
Other Funds intended for non-professionals and equivalents in otherEU Member States
0.00 0.00
General-purpose professional funds and equivalents in other EUMember States and listed securitisation entities
0.00 0.00
Other professional investment funds and equivalents in other EUMember States and listed securitisation agencies
0.00 0.00
Other non-European entities 3,660,067.18 3,854,224.66Temporary transactions in securities 602,599,106.44 0.00
Credits for securities held under sell-back deals 0.00 0.00Credits for loaned securities 0.00 0.00Borrowed securities 0.00 0.00Securities sold under buy-back deals 602,599,106.44 0.00Other temporary transactions 0.00 0.00
Hedges 98,661,735.52 30,286,963.15Hedges in a regulated market or equivalent 97,602,727.62 24,088,360.13Other hedges 1,059,007.90 6,198,603.02
Other financial instruments 0.00 0.00RECEIVABLES 18,178,996,487.49 9,448,023,310.21
Forward currency transactions 17,288,080,941.48 9,064,181,383.43Other 890,915,546.01 383,841,926.78
FINANCIAL ACCOUNTS 147,046,469.93 118,426,503.49Cash and cash equivalents 147,046,469.93 118,426,503.49
TOTAL ASSETS 19,930,661,074.65 10,690,849,548.30
Balance Sheet on 06/28/19Portfolio : 2847 H2O ALLEGRO
Balance Sheet Asset
a) Annual accounts in EUR

H2O ALLEGRO 29
SHAREHOLDERS' FUNDS
06/28/19 06/29/18
1,165,726,990.35901,327,696.74Capital
Allocation Report of distributed items (a) 0.000.00
595.7711.32Brought forward (a)
Allocation Report of distributed items on Net Income (a,b) 217,186,059.89194,610,355.91
-47,652,295.6221,973,238.22Result (a,b)
1,335,261,350.391,117,911,302.19Total net shareholders' funds * Net Assets
FINANCIAL INSTRUMENTS 26,886,525.56680,958,620.80
Transfers of financial instruments 0.0030,662.58
Temporary transactions in securities 0.00582,583,097.13
Sums owed for securities sold under buy-back deals 0.00582,583,097.13
Sums owed for borrowed securities 0.000.00
Other temporary transactions 0.000.00
Hedges 26,886,525.5698,344,861.09
Hedges in a regulated market or equivalent 23,481,337.4297,207,534.92
Other hedges 3,405,188.141,137,326.17
PAYABLES 9,327,914,169.4918,067,228,938.43
Forward currency transactions 8,986,981,654.2317,329,585,572.00
Other 340,932,515.26737,643,366.43
FINANCIAL ACCOUNTS 787,502.8664,562,213.23
Short-term credit 787,502.8664,562,213.23
Loans received 0.000.00
TOTAL LIABILITIES 10,690,849,548.3019,930,661,074.65
Balance Sheet Liabilities on 06/28/19Portfolio : 2847 H2O ALLEGRO
Balance Sheet liabilities
(a) Including adjusment(b) Decreased interim distribution paid during the business year
Annual financial statements5. Annual financial statements
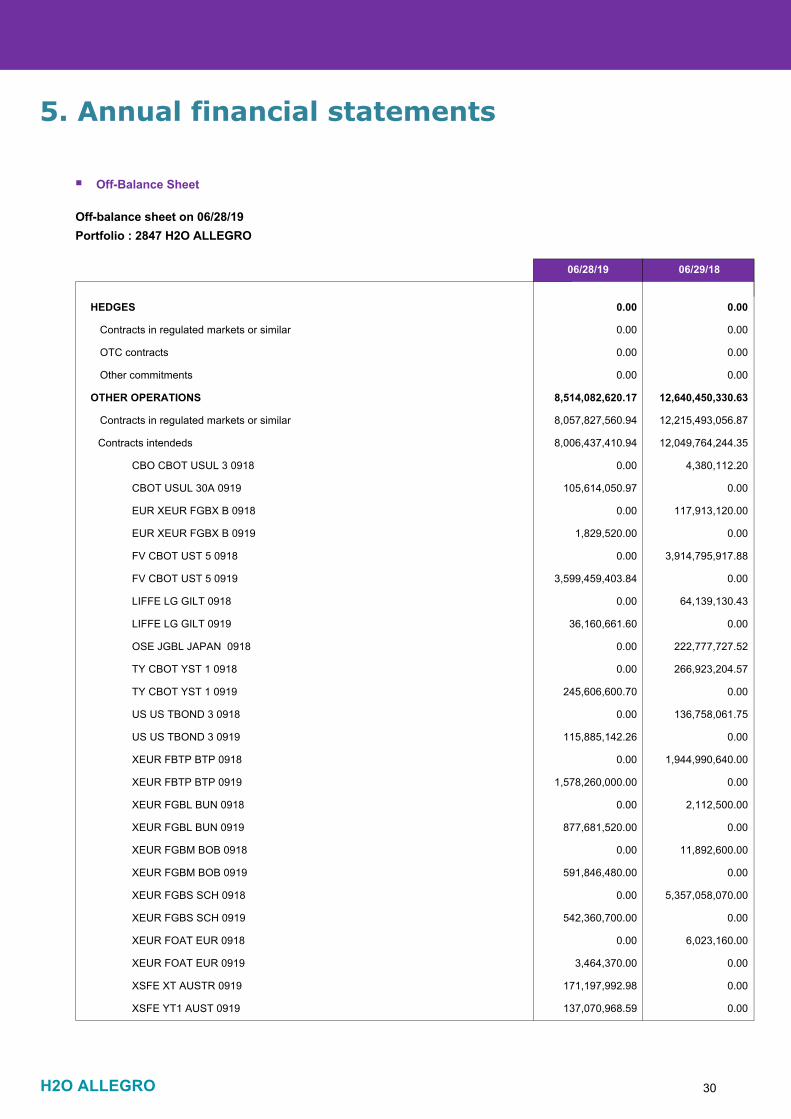
H2O ALLEGRO 30
06/28/19 06/29/18
HEDGES 0.00 0.00
Contracts in regulated markets or similar 0.00 0.00
OTC contracts 0.00 0.00
Other commitments 0.00 0.00
OTHER OPERATIONS 8,514,082,620.17 12,640,450,330.63
Contracts in regulated markets or similar 8,057,827,560.94 12,215,493,056.87
Contracts intendeds 8,006,437,410.94 12,049,764,244.35
CBO CBOT USUL 3 0918 0.00 4,380,112.20
CBOT USUL 30A 0919 105,614,050.97 0.00
EUR XEUR FGBX B 0918 0.00 117,913,120.00
EUR XEUR FGBX B 0919 1,829,520.00 0.00
FV CBOT UST 5 0918 0.00 3,914,795,917.88
FV CBOT UST 5 0919 3,599,459,403.84 0.00
LIFFE LG GILT 0918 0.00 64,139,130.43
LIFFE LG GILT 0919 36,160,661.60 0.00
OSE JGBL JAPAN 0918 0.00 222,777,727.52
TY CBOT YST 1 0918 0.00 266,923,204.57
TY CBOT YST 1 0919 245,606,600.70 0.00
US US TBOND 3 0918 0.00 136,758,061.75
US US TBOND 3 0919 115,885,142.26 0.00
XEUR FBTP BTP 0918 0.00 1,944,990,640.00
XEUR FBTP BTP 0919 1,578,260,000.00 0.00
XEUR FGBL BUN 0918 0.00 2,112,500.00
XEUR FGBL BUN 0919 877,681,520.00 0.00
XEUR FGBM BOB 0918 0.00 11,892,600.00
XEUR FGBM BOB 0919 591,846,480.00 0.00
XEUR FGBS SCH 0918 0.00 5,357,058,070.00
XEUR FGBS SCH 0919 542,360,700.00 0.00
XEUR FOAT EUR 0918 0.00 6,023,160.00
XEUR FOAT EUR 0919 3,464,370.00 0.00
XSFE XT AUSTR 0919 171,197,992.98 0.00
XSFE YT1 AUST 0919 137,070,968.59 0.00
Off-balance sheet on 06/28/19Portfolio : 2847 H2O ALLEGRO
Off-Balance Sheet
Annual financial statements5.

H2O ALLEGRO 31
06/28/19 06/29/18
Options 51,390,150.00 165,728,812.52
CBOT US TRES NT 5A 08/2018 CALL 114,25 0.00 35,808,469.63
CBOT US TRES NT 5A 08/2018 PUT 112,5 0.00 18,694,612.94
CBOT US TRES NT 5A 08/2018 PUT 113,25 0.00 84,563,077.25
EUREX EURO BUND 07/2019 CALL 174 33,615,204.00 0.00
EUREX EURO BUND 07/2019 PUT 170,5 17,774,946.00 0.00
EUREX EURO BUND 08/2018 CALL 160 0.00 18,997,840.12
EUREX EURO BUND 08/2018 CALL 160,5 0.00 7,664,812.58
OTC contracts 456,255,059.23 424,957,273.76
Options 61,932,408.65 424,957,273.76
EUR/GBP OTC 07/2018 CALL ,879 0.00 152,662,832.87
EUR/GBP OTC 07/2018 PUT ,879 0.00 46,076,945.19
EUR/USD OTC 07/2019 CALL 1,167 1,135,983.54 0.00
EUR/USD OTC 07/2019 PUT 1,1025 67,003.79 0.00
USD/KRW OTC 09/2018 CALL 1095 0.00 34,573,139.85
USD/KRW OTC 09/2018 CALL 1125 0.00 18,560,585.97
USD/KRW OTC 09/2018 PUT 1040 0.00 1,509,983.72
USD/MXN OTC 07/2018 CALL 21,25 0.00 5,367,357.25
USD/MXN OTC 07/2018 PUT 19,85 0.00 60,371,724.11
USD/MXN OTC 08/2019 CALL 21 3,651,546.15 0.00
USD/MXN OTC 08/2019 PUT 19 20,906,777.29 0.00
USD/TRY OTC 11/2018 CALL 5,1 0.00 5,633,023.10
USD/TRY OTC 11/2018 PUT 3,8 0.00 16,528.26
USD/TRY OTC 11/2018 PUT 4,2 0.00 507,055.08
USD/TRY OTC 11/2018 PUT 4,2 0.00 236,625.70
USD/TWD OTC 03/2020 PUT 30,1 9,643,410.06 0.00
USD/TWD OTC 09/2019 CALL 31,5 26,527,687.82 0.00
USD/TWD OTC 10/2018 CALL 30 0.00 98,201,267.79
USD/TWD OTC 10/2018 PUT 28,6 0.00 1,240,204.87
Interest rate swaps 394,322,650.58 0.00
FIX/7.065/JIBA3R/0.0 21,795,243.03 0.00
FIX/7.075/JIBA3R/0.0 21,795,243.03 0.00
FIX/7.085/JIBA3R/0.0 21,795,243.03 0.00
Off-balance sheet on 06/28/19Portfolio : 2847 H2O ALLEGRO
Off-Balance Sheet
Annual financial statements5.

H2O ALLEGRO 32
06/28/19 06/29/18
FIX/7.085/JIBA3R/0.0 21,795,243.03 0.00
FIX/7.09/JIBA3R/0.0 21,795,243.03 0.00
FIX/7.12/JIBA3R/0.0 21,795,243.03 0.00
JIBA3R/0.0/FIX/6.934 11,987,383.67 0.00
JIBA3R/0.0/FIX/6.935 11,987,383.67 0.00
JIBA3R/0.0/FIX/7.042 11,987,383.67 0.00
JIBA3R/0.0/FIX/7.045 11,816,135.33 0.00
JIBA3R/0.0/FIX/7.065 11,987,383.67 0.00
JIBA3R/0.0/FIX/7.07 11,987,383.67 0.00
JIBA3R/0.0/FIX/7.07 12,843,625.36 0.00
JIBA3R/0.0/FIX/7.075 11,987,383.67 0.00
JIBA3R/0.0/FIX/7.085 11,987,383.67 0.00
JIBA3R/0.0/FIX/7.09 11,987,383.67 0.00
JIBA3R/0.0/FIX/7.1 11,987,383.67 0.00
JIBA3R/0.0/FIX/7.12 11,987,383.67 0.00
JIBA3R/0.0/FIX/7.145 11,987,383.67 0.00
JIBA3R/0.0/FIX/7.145 11,987,383.67 0.00
JIBA3R/0.0/FIX/7.145 11,987,383.67 0.00
JIBA3R/0.0/FIX/7.15 11,987,383.67 0.00
JIBA3R/0.0/FIX/7.15 11,987,383.67 0.00
JIBA3R/0.0/FIX/7.15 11,987,383.67 0.00
JIBA3R/0.0/FIX/7.151 11,987,383.67 0.00
JIBA3R/0.0/FIX/7.16 11,131,141.98 0.00
JIBA3R/0.0/FIX/7.165 11,987,383.67 0.00
JIBA3R/0.0/FIX/7.167 11,987,383.67 0.00
Other commitments 0.00 0.00
Off-balance sheet on 06/28/19Portfolio : 2847 H2O ALLEGRO
Off-Balance Sheet
Annual financial statements5.
H2O ALLEGRO 33
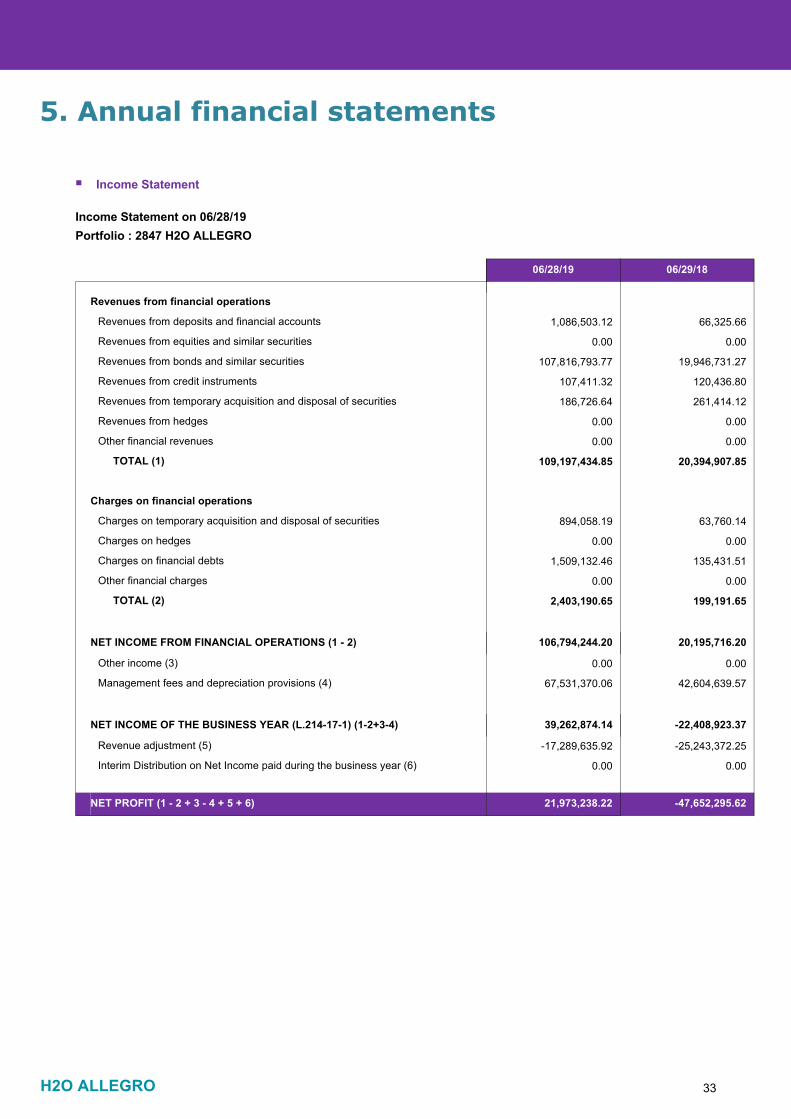
06/28/19
Revenues from financial operations
06/29/18
1,086,503.12Revenues from deposits and financial accounts 66,325.66
0.00Revenues from equities and similar securities 0.00
107,816,793.77Revenues from bonds and similar securities 19,946,731.27
107,411.32Revenues from credit instruments 120,436.80
186,726.64Revenues from temporary acquisition and disposal of securities 261,414.12
0.00Revenues from hedges 0.00
0.00Other financial revenues 0.00
109,197,434.85TOTAL (1) 20,394,907.85
Charges on financial operations
894,058.19Charges on temporary acquisition and disposal of securities 63,760.14
0.00Charges on hedges 0.00
1,509,132.46Charges on financial debts 135,431.51
0.00Other financial charges 0.00
2,403,190.65TOTAL (2) 199,191.65
NET INCOME FROM FINANCIAL OPERATIONS (1 - 2) 106,794,244.20 20,195,716.20
0.00Other income (3) 0.00
67,531,370.06Management fees and depreciation provisions (4) 42,604,639.57
NET INCOME OF THE BUSINESS YEAR (L.214-17-1) (1-2+3-4) 39,262,874.14 -22,408,923.37
-17,289,635.92Revenue adjustment (5) -25,243,372.25
0.00Interim Distribution on Net Income paid during the business year (6) 0.00
NET PROFIT (1 - 2 + 3 - 4 + 5 + 6) 21,973,238.22 -47,652,295.62
Income Statement on 06/28/19Portfolio : 2847 H2O ALLEGRO
Income Statement
Annual financial statements5.

5. Annual financial statements
H2O ALLEGRO 34
b) Annual accounts – Accounting rules
ACCOUNTING RULES AND METHODS
The annual accounts are presented as provided by the ANC Regulation 2014-01 repealing Regulation CRC 2003-02 as
amended.
General accounting principles apply, viz:
- fair picture, comparability, ongoing business,
- proper practice & trustworthiness,
- prudence,
- no unreported change in methods from one period to the next.
Revenues from fixed-yield securities are recognized on the basis of interest actually received.
Acquisitions and disposals of securities are recognized exclusive of costs.
The accounting currency of the portfolio is the EURO.
The accounting period reported on is 12 months.
Asset valuation rules:
Financial instruments are initially recognized at historic cost and carried on the Balance Sheet at their current value: this
is their latest known market value or, in the absence of a market, is determined by any external means or by recourse to
financial models.
Differences between the securities’ current values determined as above and their original historic cost are recognized in
the accounts as “differences on estimation”.
Securities denominated in a currency other than that of the portfolio are valued in accordance with the above principle
and then converted into the currency of the portfolio at the exchange rate obtained on the valuation date.
I - Securities portfolio The management company has delegated accounting management (including the valuation of the Fund’s portfolio) to
CACEIS FUND ADMINISTRATION.
The Fund’s portfolio is valued each time the net asset value is calculated and on closure of the accounts, at the closing
price.
The Fund’s annual accounts are drawn up on the basis of the final net asset value for the financial year.
The Fund complies with the accounting rules and methods prescribed by current regulations and with the UCITS chart of
accounts which, on the day of publication of the prospectus, are as follows:

5. Annual financial statements
H2O ALLEGRO 35
Equities, bonds and other securities traded in a regulated market or equivalent: Equities French equities are valued on the basis of the latest quoted price in the case of securities admitted to a deferred
settlement system or a spot market.
Foreign equities are valued on the basis of the latest price on the Paris stock exchange if the securities are listed in Paris,
or on the first trading day of their main market, converted into euros in accordance with the WMR rate for the currency on
the day of valuation.
Bonds Bonds are valued on the basis of a Bloomberg composite rating retrieved at 5:00 p.m. (Paris time) in accordance with the
WMR rate for the currency on the day of valuation.
Equities, bonds and other securities not traded in a regulated market or equivalent:
Transferable securities, for which the price has not yet been recorded on the valuation date or has been adjusted, are
valued at their expected trading value by the Management Company.
In the case of unlisted transferable securities or those for which a price is not listed on the valuation date, as well as other
items on the balance sheet, the Management Company adjusts its valuation on the basis of variations that seem likely in
view of current events. The statutory auditor is informed of these valuations and the justifications for them during their
audit.
Foreign securities are converted into their equivalent values in euros in accordance with the WMR rate on the day of
valuation.
In accordance with the provisions of the UCITS chart of accounts, and given the current absence of liquidity of the market
for certain assets held, the fund was led from 24 June 2019 to retain a valuation for the relevant assets based either on
estimates or offers of large independent banks of our group is on an extrapolation from this same information.
This valuation method has been retained instead of their probable trading value to approximate a current value of these
assets at a given moment in the absence of transactions representative of a liquid market. Only these would allow to
establish with certainty the current value of the portfolio. These assets represent a value of
55,193,368.14 euros as of June 28, 2019 representing 4.94% of the portfolio. These assets are the following values:
DE000A193EJ6 SWB FIN 7.0 07-23 315,397.26
DE000A19MR53 CHAI FI 7.75 08-20 9,646,472.61
DE000A19SWQ7 CIVI PR 4.0 11-22 8,578,958.91
DE000A19XYF6 LA PERL 7.25 03-23 3,821,956.98
DE000A2R2ZW0 TENN FI 5.75 06-24 7,823,039.62
DE000A2RUR57 TREN PE 8.5 12-23 10,970,767.12
DE000A2RVEV2 EVER ME 5.0 01-24 2,710,958.90
DE000A2RZRF8 RUBI RO 5.0 03-24 7,889,344.26
XS1837089967 ADS SEC 6.5 06-23 3,436,472.48
5. Annual financial statements
H2O ALLEGRO 36
UCITS/AIFs Units or shares of UCITS/AIFs are valued at the last known net asset value. Foreign undertakings for collective
investment that carry out valuations at times that are incompatible with the calculation of the Fund’s net asset value are
valued on the basis of estimates supplied by the administrators of the undertakings, under the supervision and
responsibility of the Management Company.
Transferable debt securities: Transferable debt securities are valued in accordance with the following rules:
BTANs and BTFs are valued on the basis of an average of contributed prices obtained from market-makers;
Unlisted variable-rate debt securities are valued at cost price, adjusted to take into account any potential variations in
credit spreads;
Other fixed-rate, transferable debt securities (certificates of deposit, commercial paper, warrants issued by financial
institutions, etc.) are valued on the basis of market price.
In the absence of an indisputable market price, transferable debt securities are valued by applying a yield curve, adjusted
if necessary, by a margin calculated on the basis of the characteristics of the security (of the issuer).
However, transferable debt securities with a residual maturity of three months or less are valued via the straight-line
method.
Temporary purchases and disposals of securities
Contracts for temporary purchases and sales of transferable securities and equivalent transactions are valued at the
contract rate, adjusted for any margin calls (valued in accordance with the conditions set out in the contract).
In the case of transferable securities that are unlisted or whose price has not been listed on the valuation date, as well as
other items on the balance sheet, the Management Company’s board of directors adjusts its valuation on the basis of
variations that seem likely in view of current events.
Certain fixed-rate transactions with a maturity of over three months may be valued at market price.
2 - Futures and options transactions
Organised futures and options markets Derivatives listed on an organised market are valued on the basis of settlement prices.
Swaps
Asset swaps are valued at the market price based on the residual maturity of the asset and the valuation of the issuer’s
credit spread (or the trend in its rating).

5. Annual financial statements
H2O ALLEGRO 37
Asset swaps with a maturity of three months or less are valued using the straight-line method, except in the case of an
exceptional market event.
Asset swaps with a residual maturity exceeding three months are valued at market price based on the spreads indicated
by the market-makers. In the absence of a market-maker, the spreads will be obtained by any means from the available
contributors.
Other swaps are valued in accordance with the following rules:
Swaps with a maturity of three months or less are valued using the straight-line method. Swaps with a residual maturity
exceeding three months are valued using the turnaround rate in line with a zero-coupon curve.
Complex instruments such as CDS, SES and complex options are valued according to their type using an appropriate
method.
Forward exchange contracts:
These are valued at the currencies’ exchange rate on the valuation date, allowing for the amortisation of
carry-forward/discount.
3 - Off-balance sheet commitments
Off-balance sheet commitments are valued as follows:
A) Commitments on futures markets: 1) Futures: Commitment = reference price (the prices at 5:00 p.m. on Bloomberg, Paris time) x nominal contract value x quantities.
With the exception of commitments under the Euribor contract traded on LIFFE, which are recorded at their nominal
value.
2) Swap commitments: a) interest rate swaps Interest rate swaps with a maturity of 3 months or less:
backed: nominal value + accrued interest (interest differential)
non-backed: nominal value + accrued interest (interest differential)
�Interest rate swaps with a maturity exceeding 3 months:
backed:
° Fixed rate/variable rate
- Appraisal of the fixed-rate portion at market price
5. Annual financial statements
H2O ALLEGRO 38
° Variable rate/fixed rate
- Appraisal of the variable-rate portion at market price
non-backed:
° Fixed rate/variable rate
- Appraisal of the fixed-rate portion at market price
° Variable rate/fixed rate
- Appraisal of the variable-rate portion at market price
b) Other swaps
These will be appraised at market value.
B) Commitments on options markets: Commitment = quantity x nominal contract value (portion) x price of underlying x delta.
4 - Currencies Foreign currency prices are converted into euros in accordance with the WMR rate (4.00 p.m. London time) for the
currency on the day of valuation.
5 - Unlisted financial instruments and other securities � Financial instruments for which the price has not been recorded on the day of valuation are valued at the most recent
officially published price or at their likely trading value, under the responsibility of the management company;
� Foreign securities are converted into the equivalent value in euros in accordance with the WMR rate on the day of
valuation;
� The management company is responsible for appraising financial instruments not traded on a regulated market at their
likely trading value;
� Other financial instruments are appraised at their market value as calculated by the counterparties, under the
supervision and responsibility of the Management Company.
The valuations of unlisted financial instruments and the other securities referred to in this paragraph, together with the
justifications for them, are communicated to the statutory auditor during their audit.
6 - Swing pricing mechanism of net asset value with trigger threshold
The management company has implemented a method of adjusting the net asset value (NAV) with a trigger threshold.
Dealing costs are incurred by investors who take out or purchase their shares, relating to transactions carried out on the
assets of the Fund as a result of the movements (subscriptions/redemptions) of the Fund's liabilities. The purpose of this
mechanism, which is governed by a policy, is to protect the holders who remain in the Fund by making them bear the
lowest possible cost. The result is an adjusted “swing” NAV.
5. Annual financial statements
H2O ALLEGRO 39
If, on a NAV calculation date, the total net subscription/redemption orders of investors over all the Fund's share classes
exceeds a predetermined threshold, on the basis of objective criteria by the management company as a percentage of
net assets, the NAV may be adjusted upwards or downwards, to take into account readjustment costs attributable to net
subscription/redemption orders, respectively. If the Fund issues more than one class of units, the NAV of each class of
units is calculated separately, but any adjustment has, by percentage, the same impact on the total NAV of the unit
classes of the Fund.
The readjustment and triggering cost parameters are determined by the management company and reviewed
periodically. These costs are estimated by the management company on the basis of the transaction costs, the purchase
and sale ranges, and any applicable taxes to the Fund.
The adjustment mechanism will be applied at some point in the future, however, it is not possible to predict accurately
when or how often the management company will make such adjustments.
Investors are advised that the volatility of the Fund's NAV may not reflect only the volatility of the securities held in the
portfolio due to the application of the adjustment mechanism.
The swing-out NAV is the only net asset value of the Fund and the only one communicated to unitholders of the Fund.
However, in the event of an outperformance fee, it is calculated on the NAV before the adjustment mechanism is applied.
Management fees:
Management fees are calculated on the nominal capital on each valuation.
These fees are imputed to the fund’s Income Statement.
Management fees are paid in full to the Fund Manager, which bears all the fund’s operating costs.
The management fees do not include dealing costs.
The maximum rate applied on the basis of net assets is:
- 1.60% TTC on Share SR,
- 1.60% TTC on Share HSGD-SR,
- 1.60% TTC on Share HUSD-SR,
- 1.60% TTC on Share HCHF-SR,
- 1.20% TTC on Share R,
- 0.70% TTC on Share I (C),
- 0.70% TTC on Share I (D),
- 0.70% TTC on Share HGBP-IC,
- 0.70% TTC on Share HAUD-I,
- 0.75% TTC on Share HGBP-I,
- 1.20% TTC on Share HCHF-R,
- 1.20% TTC on Share HSGD-R,
- 1.20% TTC on Share HUSD-R,

5. Annual financial statements
H2O ALLEGRO 40
- 0.70% TTC on Share HUSD-I,
- 0.10% TTC on Share M,
- 0.70% TTC on Share HCHF-I,
- 0.70% TTC on Share HSGD-I,
- 0.80% TTC on Share N (C),
- 0.80% TTC on Share HUSD-N (C).
Outperformance fee
Shares EUR-R, EUR-I(C), EUR-I (D), HSGD-R, HSGD-I, HUSD-R, HUSD-I, HCHF-R, HCHF-I, HAUD-I, HGBP-IC (PRF), EUR-N (C),HUSD-N (C), EUR-SR, HSGD-SR, HUSD-SR and HCHF-SR: 20% TTC of the extra performance de as
measured against the reference index defined below:
HGBP-I and M units: None The outperformance fee applicable to a particular unit class is based on a comparison of the Fund's valued asset and its
reference asset.
The Fund’s valued assets are the portion of the assets corresponding to a specific share class, valued in accordance
with the rules applicable to the assets and taking into account the actual operating and management fees corresponding
to this unit class.
The Fund’s reference assets are the portion of the assets corresponding to a specific unit class, adjusted to take into
account the subscription/redemption amounts applicable to this unit class at each valuation, and valued in accordance
with the performance of the benchmark index (i.e. the reference rate) of the Fund. For EUR-R, EUR-I, EUR-N and EUR-SR units : The reference rate is the daily compounded EONIA. The Fund’s
performance is calculated according to changes in the unit’s net asset value.
For HUSD-I, HUSD-R, HUSD-N and HUSD-SR units : The reference rate is equal to the USD 1-month LIBOR. The
Fund’s performance is calculated according to changes in the unit’s net asset value.
For HGBP-IC (PRF) units : The reference rate is equal to the 1-month GBP LIBOR. The Fund’s performance is calculated
according to changes in the unit’s net asset value.
For HSGD-I, HSGD-R and HSGD-SR units : The reference rate is equal to the 1-month SIBOR. The Fund’s performance
is calculated according to changes in the unit’s net asset value.
For HCHF-I,HCHF-R and HCHF-SR units : The reference rate is equal to the CHF 1-month LIBOR. The Fund’s
performance is calculated on the basis of changes in the net asset value of the unit class.
For HAUD-I units : The benchmark rate is equal to that of Australian 30-day bank accepted bills. The Fund’s performance
is calculated on the basis of the net asset value of each share class.
5. Annual financial statements
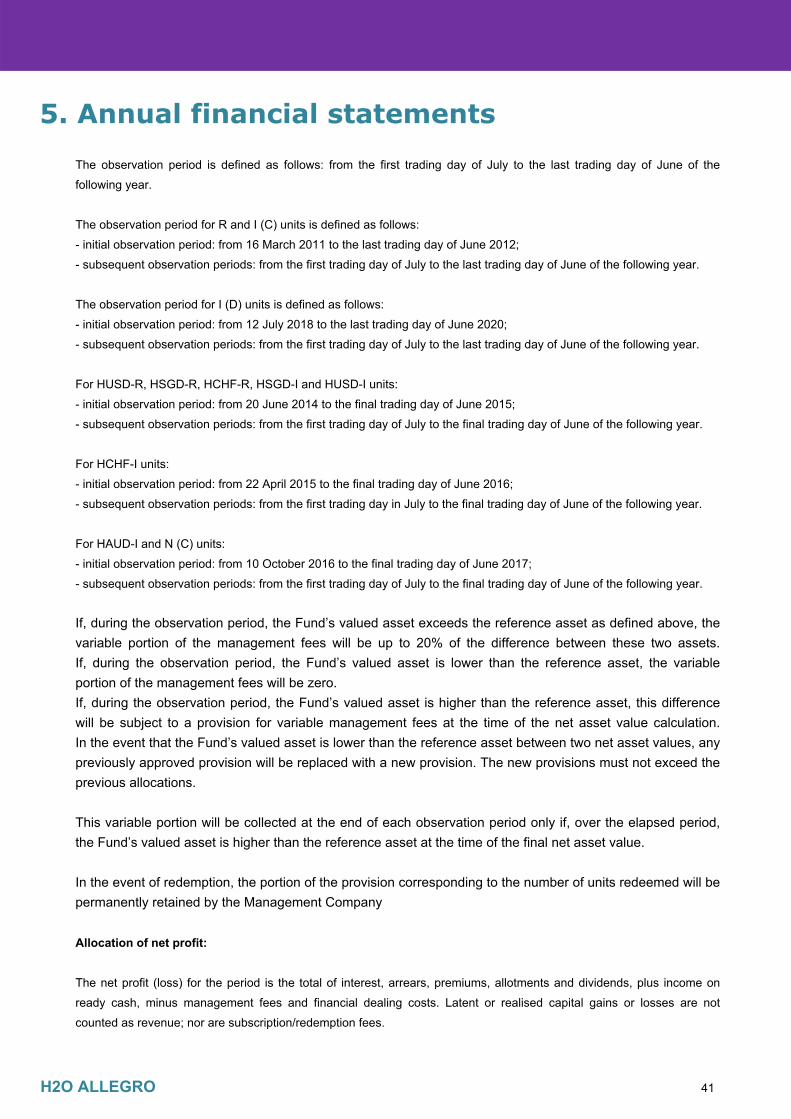
H2O ALLEGRO 41
The observation period is defined as follows: from the first trading day of July to the last trading day of June of the
following year.
The observation period for R and I (C) units is defined as follows:
- initial observation period: from 16 March 2011 to the last trading day of June 2012;
- subsequent observation periods: from the first trading day of July to the last trading day of June of the following year.
The observation period for I (D) units is defined as follows:
- initial observation period: from 12 July 2018 to the last trading day of June 2020;
- subsequent observation periods: from the first trading day of July to the last trading day of June of the following year.
For HUSD-R, HSGD-R, HCHF-R, HSGD-I and HUSD-I units:
- initial observation period: from 20 June 2014 to the final trading day of June 2015;
- subsequent observation periods: from the first trading day of July to the final trading day of June of the following year.
For HCHF-I units:
- initial observation period: from 22 April 2015 to the final trading day of June 2016;
- subsequent observation periods: from the first trading day in July to the final trading day of June of the following year.
For HAUD-I and N (C) units:
- initial observation period: from 10 October 2016 to the final trading day of June 2017;
- subsequent observation periods: from the first trading day of July to the final trading day of June of the following year.
If, during the observation period, the Fund’s valued asset exceeds the reference asset as defined above, the
variable portion of the management fees will be up to 20% of the difference between these two assets.
If, during the observation period, the Fund’s valued asset is lower than the reference asset, the variable
portion of the management fees will be zero.
If, during the observation period, the Fund’s valued asset is higher than the reference asset, this difference
will be subject to a provision for variable management fees at the time of the net asset value calculation.
In the event that the Fund’s valued asset is lower than the reference asset between two net asset values, any
previously approved provision will be replaced with a new provision. The new provisions must not exceed the
previous allocations.
This variable portion will be collected at the end of each observation period only if, over the elapsed period,
the Fund’s valued asset is higher than the reference asset at the time of the final net asset value.
In the event of redemption, the portion of the provision corresponding to the number of units redeemed will be
permanently retained by the Management Company Allocation of net profit: The net profit (loss) for the period is the total of interest, arrears, premiums, allotments and dividends, plus income on
ready cash, minus management fees and financial dealing costs. Latent or realised capital gains or losses are not
counted as revenue; nor are subscription/redemption fees.
5. Annual financial statements
H2O ALLEGRO 42
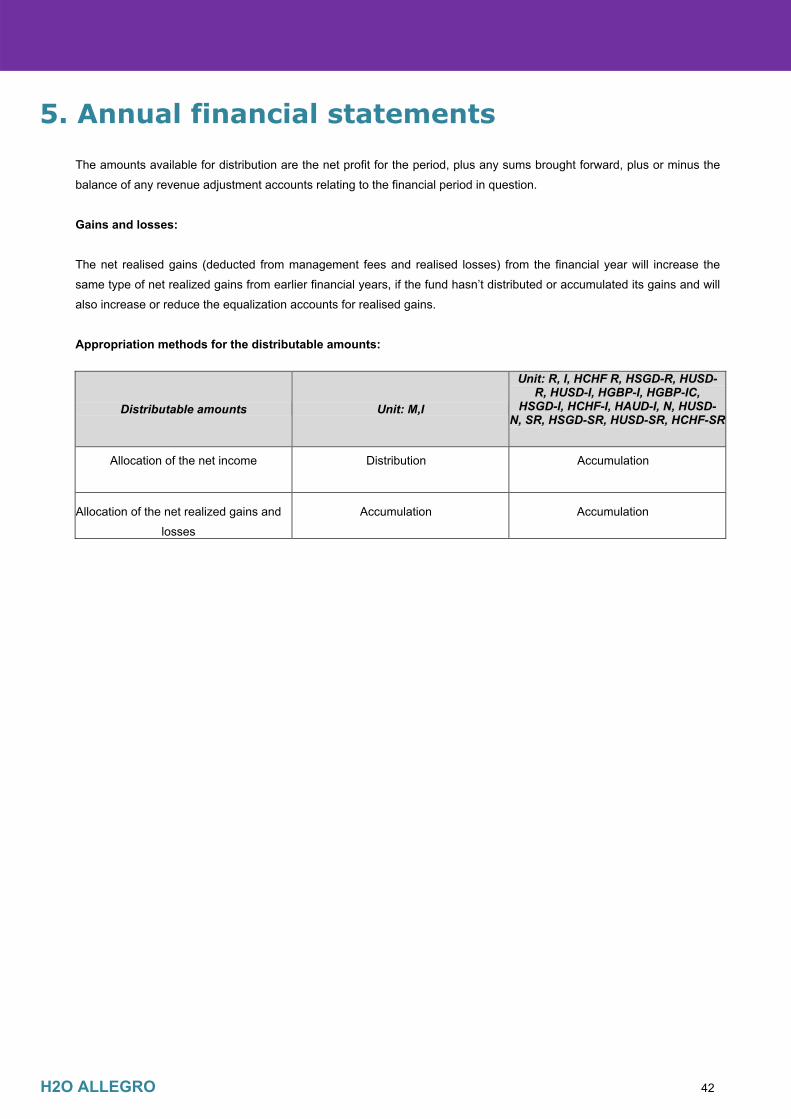
The amounts available for distribution are the net profit for the period, plus any sums brought forward, plus or minus the
balance of any revenue adjustment accounts relating to the financial period in question.
Gains and losses:
The net realised gains (deducted from management fees and realised losses) from the financial year will increase the
same type of net realized gains from earlier financial years, if the fund hasn’t distributed or accumulated its gains and will
also increase or reduce the equalization accounts for realised gains.
Appropriation methods for the distributable amounts:
Distributable amounts Unit: M,I
Unit: R, I, HCHF R, HSGD-R, HUSD- R, HUSD-I, HGBP-I, HGBP-IC,
HSGD-I, HCHF-I, HAUD-I, N, HUSD- N, SR, HSGD-SR, HUSD-SR, HCHF-SR
Allocation of the net income Distribution Accumulation
Allocation of the net realized gains and
losses
Accumulation Accumulation
H2O ALLEGRO 43
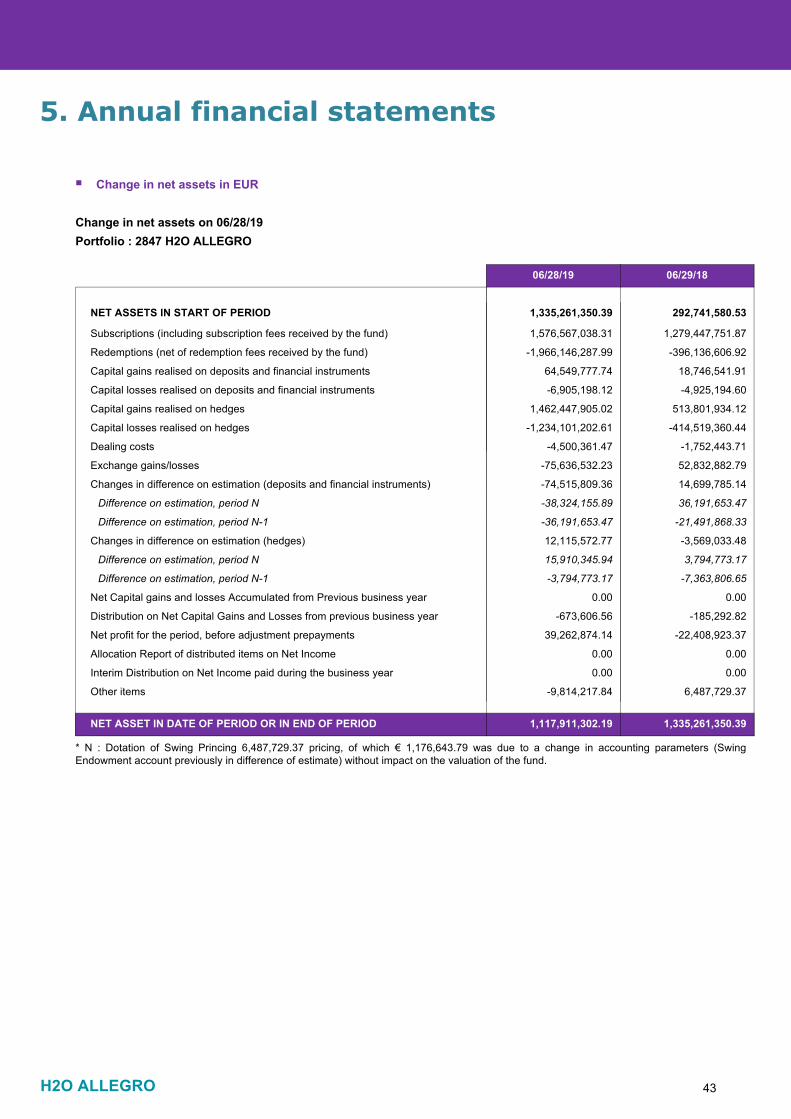
06/28/19
1,335,261,350.39NET ASSETS IN START OF PERIOD 292,741,580.53
06/29/18
1,576,567,038.31Subscriptions (including subscription fees received by the fund) 1,279,447,751.87
-1,966,146,287.99Redemptions (net of redemption fees received by the fund) -396,136,606.92
64,549,777.74Capital gains realised on deposits and financial instruments 18,746,541.91
-6,905,198.12Capital losses realised on deposits and financial instruments -4,925,194.60
1,462,447,905.02Capital gains realised on hedges 513,801,934.12
-1,234,101,202.61Capital losses realised on hedges -414,519,360.44
-4,500,361.47Dealing costs -1,752,443.71
-75,636,532.23Exchange gains/losses 52,832,882.79
-74,515,809.36Changes in difference on estimation (deposits and financial instruments) 14,699,785.14
-38,324,155.89Difference on estimation, period N 36,191,653.47
-36,191,653.47Difference on estimation, period N-1 -21,491,868.33
12,115,572.77Changes in difference on estimation (hedges) -3,569,033.48
15,910,345.94Difference on estimation, period N 3,794,773.17
-3,794,773.17Difference on estimation, period N-1 -7,363,806.65
0.00Net Capital gains and losses Accumulated from Previous business year 0.00
-673,606.56Distribution on Net Capital Gains and Losses from previous business year -185,292.82
39,262,874.14Net profit for the period, before adjustment prepayments -22,408,923.37
0.00Allocation Report of distributed items on Net Income 0.00
0.00Interim Distribution on Net Income paid during the business year 0.00
-9,814,217.84Other items 6,487,729.37
NET ASSET IN DATE OF PERIOD OR IN END OF PERIOD 1,117,911,302.19 1,335,261,350.39
Change in net assets on 06/28/19Portfolio : 2847 H2O ALLEGRO
Change in net assets in EUR
* N : Dotation of Swing Princing 6,487,729.37 pricing, of which € 1,176,643.79 was due to a change in accounting parameters (SwingEndowment account previously in difference of estimate) without impact on the valuation of the fund.
Annual financial statements5.

5. Annual financial statements
H2O ALLEGRO 44
Additional information
Breakdown of financial instruments by legal or commercial type Amount %
Assets
Bonds and similar securities
Bonds and similar securities 0.00 0.00
Convertible bonds traded on a regulated or similar market 9,040,814.96 0.81
Fixed-rate bonds traded on a regulated or similar market 851,081,237.90 76.13
Floating-rate bonds traded on regulated markets 2,123,930.16 0.19
mortgages negotiated on a regulated or assimilated market 2,834,009.97 0.25
TOTAL Bonds and similar securities 865,079,992.99 77.38
Credit instruments
Credit instruments 0.00 0.00
TOTAL Credit instruments 0.00 0.00
Liabilities
Transactions involving transfer of financial instruments
Equities and similar securities 0.00 0.00
Fixed-rate bonds traded on a regulated or similar market 30,662.58 0.00
TOTAL Transactions involving transfer of financial instruments 30,662.58 0.00
Off-balance sheet
Hedges
Equities 0.00 0.00
TOTAL Hedges 0.00 0.00
Other operations
Equities 0.00 0.00
Exchange rate 72,983,187.04 6.53
Rate 8,452,150,211.52 756.07
TOTAL Other operations 8,525,133,398.56 762.59
5. Annual financial statements
H2O ALLEGRO 45
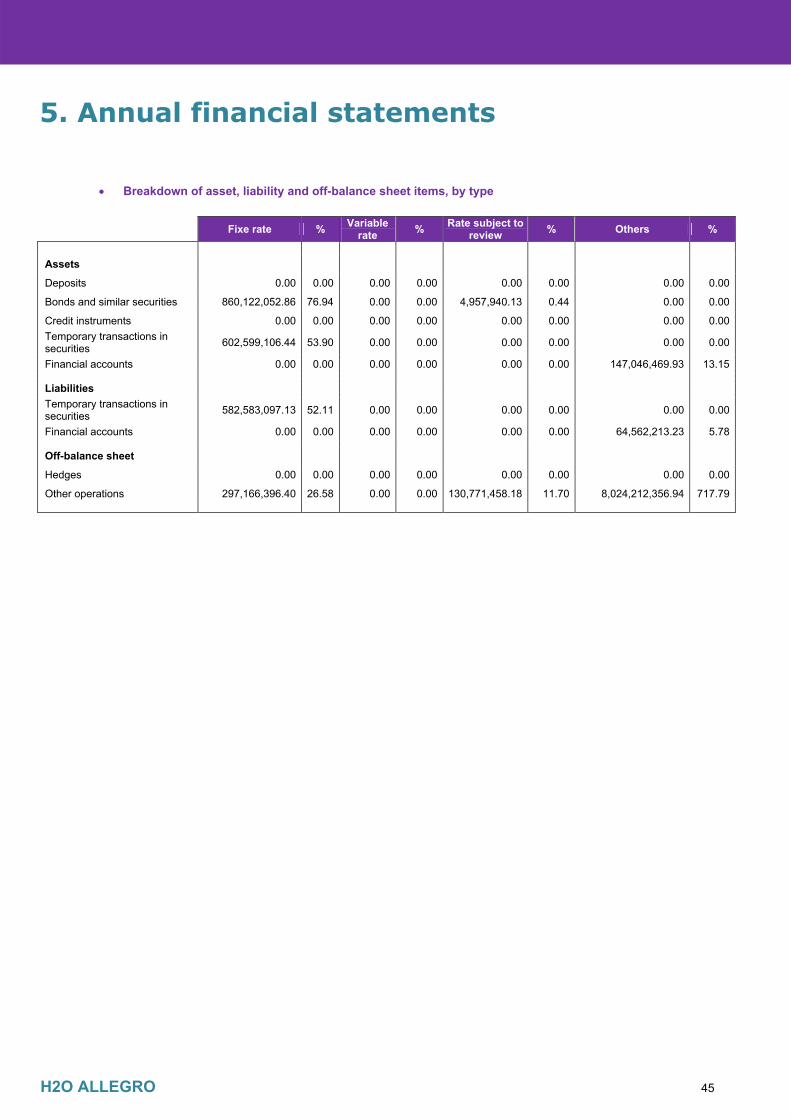
Breakdown of asset, liability and off-balance sheet items, by type
Fixe rate % Variable
rate % Rate subject to review % Others %
Assets
Deposits 0.00 0.00 0.00 0.00 0.00 0.00 0.00 0.00
Bonds and similar securities 860,122,052.86 76.94 0.00 0.00 4,957,940.13 0.44 0.00 0.00
Credit instruments 0.00 0.00 0.00 0.00 0.00 0.00 0.00 0.00
Temporary transactions in securities
602,599,106.44 53.90 0.00 0.00 0.00 0.00 0.00 0.00
Financial accounts 0.00 0.00 0.00 0.00 0.00 0.00 147,046,469.93 13.15
Liabilities
Temporary transactions in securities
582,583,097.13 52.11 0.00 0.00 0.00 0.00 0.00 0.00
Financial accounts 0.00 0.00 0.00 0.00 0.00 0.00 64,562,213.23 5.78
Off-balance sheet
Hedges 0.00 0.00 0.00 0.00 0.00 0.00 0.00 0.00
Other operations 297,166,396.40 26.58 0.00 0.00 130,771,458.18 11.70 8,024,212,356.94 717.79
5. Annual financial statements
H2O ALLEGRO 46
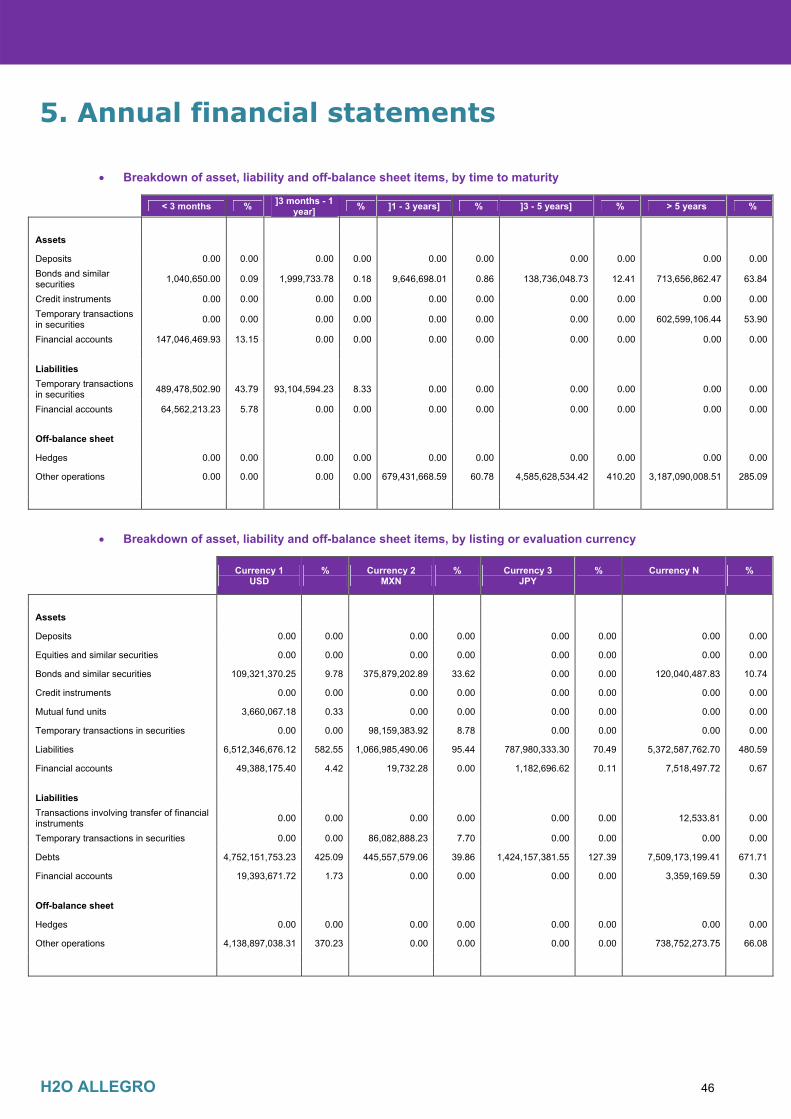
Breakdown of asset, liability and off-balance sheet items, by time to maturity
< 3 months % ]3 months - 1 year] % ]1 - 3 years] % ]3 - 5 years] % > 5 years %
Assets
Deposits 0.00 0.00 0.00 0.00 0.00 0.00 0.00 0.00 0.00 0.00
Bonds and similar securities
1,040,650.00 0.09 1,999,733.78 0.18 9,646,698.01 0.86 138,736,048.73 12.41 713,656,862.47 63.84
Credit instruments 0.00 0.00 0.00 0.00 0.00 0.00 0.00 0.00 0.00 0.00
Temporary transactions in securities
0.00 0.00 0.00 0.00 0.00 0.00 0.00 0.00 602,599,106.44 53.90
Financial accounts 147,046,469.93 13.15 0.00 0.00 0.00 0.00 0.00 0.00 0.00 0.00
Liabilities
Temporary transactions in securities
489,478,502.90 43.79 93,104,594.23 8.33 0.00 0.00 0.00 0.00 0.00 0.00
Financial accounts 64,562,213.23 5.78 0.00 0.00 0.00 0.00 0.00 0.00 0.00 0.00
Off-balance sheet
Hedges 0.00 0.00 0.00 0.00 0.00 0.00 0.00 0.00 0.00 0.00
Other operations 0.00 0.00 0.00 0.00 679,431,668.59 60.78 4,585,628,534.42 410.20 3,187,090,008.51 285.09
Breakdown of asset, liability and off-balance sheet items, by listing or evaluation currency
Currency 1
USD %
Currency 2 MXN
%
Currency 3 JPY
%
Currency N
%
Assets
Deposits 0.00 0.00 0.00 0.00 0.00 0.00 0.00 0.00
Equities and similar securities 0.00 0.00 0.00 0.00 0.00 0.00 0.00 0.00
Bonds and similar securities 109,321,370.25 9.78 375,879,202.89 33.62 0.00 0.00 120,040,487.83 10.74
Credit instruments 0.00 0.00 0.00 0.00 0.00 0.00 0.00 0.00
Mutual fund units 3,660,067.18 0.33 0.00 0.00 0.00 0.00 0.00 0.00
Temporary transactions in securities 0.00 0.00 98,159,383.92 8.78 0.00 0.00 0.00 0.00
Liabilities 6,512,346,676.12 582.55 1,066,985,490.06 95.44 787,980,333.30 70.49 5,372,587,762.70 480.59
Financial accounts 49,388,175.40 4.42 19,732.28 0.00 1,182,696.62 0.11 7,518,497.72 0.67
Liabilities
Transactions involving transfer of financial instruments
0.00 0.00 0.00 0.00 0.00 0.00 12,533.81 0.00
Temporary transactions in securities 0.00 0.00 86,082,888.23 7.70 0.00 0.00 0.00 0.00
Debts 4,752,151,753.23 425.09 445,557,579.06 39.86 1,424,157,381.55 127.39 7,509,173,199.41 671.71
Financial accounts 19,393,671.72 1.73 0.00 0.00 0.00 0.00 3,359,169.59 0.30
Off-balance sheet
Hedges 0.00 0.00 0.00 0.00 0.00 0.00 0.00 0.00
Other operations 4,138,897,038.31 370.23 0.00 0.00 0.00 0.00 738,752,273.75 66.08
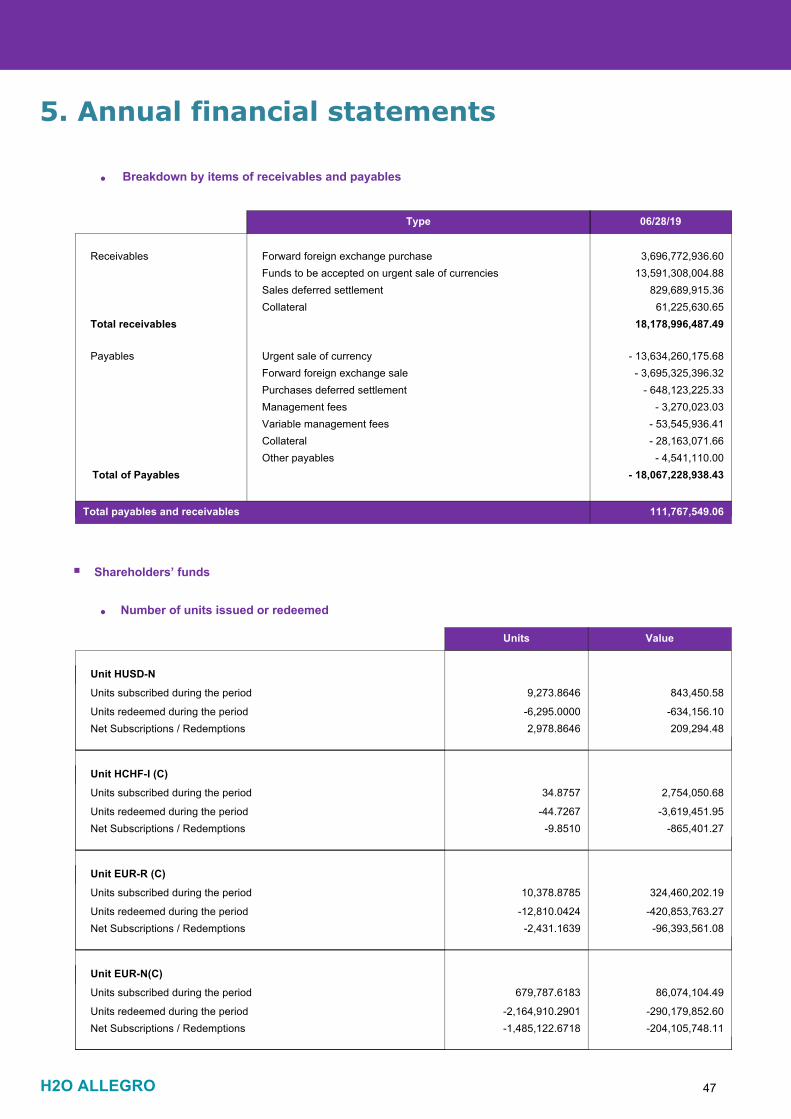
H2O ALLEGRO 47
Forward foreign exchange purchase 3,696,772,936.60
06/28/19Type
ReceivablesFunds to be accepted on urgent sale of currencies 13,591,308,004.88Sales deferred settlement 829,689,915.36Collateral 61,225,630.65
Total receivables 18,178,996,487.49
Urgent sale of currency - 13,634,260,175.68PayablesForward foreign exchange sale - 3,695,325,396.32Purchases deferred settlement - 648,123,225.33Management fees - 3,270,023.03Variable management fees - 53,545,936.41Collateral - 28,163,071.66Other payables - 4,541,110.00
Total of Payables - 18,067,228,938.43
Total payables and receivables 111,767,549.06
Breakdown by items of receivables and payables•
Annual financial statements5.
Units subscribed during the period 9,273.8646 843,450.58
Unit HUSD-N
Units redeemed during the period -6,295.0000 -634,156.10Net Subscriptions / Redemptions 2,978.8646 209,294.48
Units subscribed during the period 34.8757 2,754,050.68
Unit HCHF-I (C)
Units redeemed during the period -44.7267 -3,619,451.95Net Subscriptions / Redemptions -9.8510 -865,401.27
Units subscribed during the period 10,378.8785 324,460,202.19
Unit EUR-R (C)
Units redeemed during the period -12,810.0424 -420,853,763.27Net Subscriptions / Redemptions -2,431.1639 -96,393,561.08
Units subscribed during the period 679,787.6183 86,074,104.49
Unit EUR-N(C)
Units redeemed during the period -2,164,910.2901 -290,179,852.60Net Subscriptions / Redemptions -1,485,122.6718 -204,105,748.11
Units Value
Shareholders’ funds
Number of units issued or redeemed•

H2O ALLEGRO 48
Units subscribed during the period 207.1220 3,557,202.98
Unit HCHF-R (C)
Units redeemed during the period -401.2367 -7,270,829.75Net Subscriptions / Redemptions -194.1147 -3,713,626.77
Units subscribed during the period 3,311.5421 541,086,765.49
Unit EUR-I (C)
Units redeemed during the period -4,449.2336 -746,158,946.89Net Subscriptions / Redemptions -1,137.6915 -205,072,181.40
Units subscribed during the period 218,049.7005 28,698,818.99
Unit HSGD-R (C)
Units redeemed during the period -192,174.6591 -26,812,863.05Net Subscriptions / Redemptions 25,875.0414 1,885,955.94
Units subscribed during the period 407,495.9597 25,881,630.84
Unit HAUD-I (C)
Units redeemed during the period 0.0000 0.00Net Subscriptions / Redemptions 407,495.9597 25,881,630.84
Units subscribed during the period 1,014,629.4204 104,757,339.42
Unit
Units redeemed during the period -1,014,349.4204 -115,622,391.31Net Subscriptions / Redemptions 280.0000 -10,865,051.89
Units subscribed during the period 142,964.5042 26,768,829.97
Unit D
Units redeemed during the period -300,394.0101 -57,313,150.65Net Subscriptions / Redemptions -157,429.5059 -30,544,320.68
Units subscribed during the period 1,739.8568 65,704,300.26
Unit HSGD-I (C)
Units redeemed during the period -9.7807 -371,422.86Net Subscriptions / Redemptions 1,730.0761 65,332,877.40
Units Value
Shareholders’ funds
Number of units issued or redeemed•
Annual financial statements5.
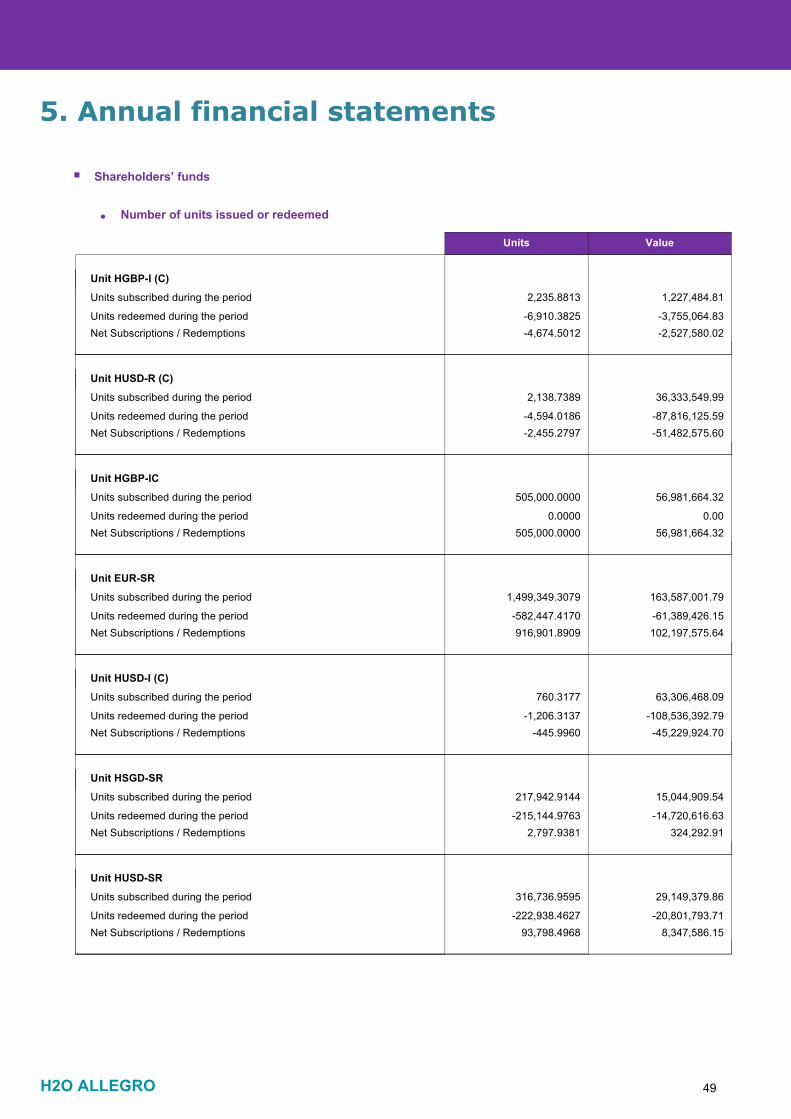
H2O ALLEGRO 49
Units subscribed during the period 2,235.8813 1,227,484.81
Unit HGBP-I (C)
Units redeemed during the period -6,910.3825 -3,755,064.83Net Subscriptions / Redemptions -4,674.5012 -2,527,580.02
Units subscribed during the period 2,138.7389 36,333,549.99
Unit HUSD-R (C)
Units redeemed during the period -4,594.0186 -87,816,125.59Net Subscriptions / Redemptions -2,455.2797 -51,482,575.60
Units subscribed during the period 505,000.0000 56,981,664.32
Unit HGBP-IC
Units redeemed during the period 0.0000 0.00Net Subscriptions / Redemptions 505,000.0000 56,981,664.32
Units subscribed during the period 1,499,349.3079 163,587,001.79
Unit EUR-SR
Units redeemed during the period -582,447.4170 -61,389,426.15Net Subscriptions / Redemptions 916,901.8909 102,197,575.64
Units subscribed during the period 760.3177 63,306,468.09
Unit HUSD-I (C)
Units redeemed during the period -1,206.3137 -108,536,392.79Net Subscriptions / Redemptions -445.9960 -45,229,924.70
Units subscribed during the period 217,942.9144 15,044,909.54
Unit HSGD-SR
Units redeemed during the period -215,144.9763 -14,720,616.63Net Subscriptions / Redemptions 2,797.9381 324,292.91
Units subscribed during the period 316,736.9595 29,149,379.86
Unit HUSD-SR
Units redeemed during the period -222,938.4627 -20,801,793.71Net Subscriptions / Redemptions 93,798.4968 8,347,586.15
Units Value
Shareholders’ funds
Number of units issued or redeemed•
Annual financial statements5.
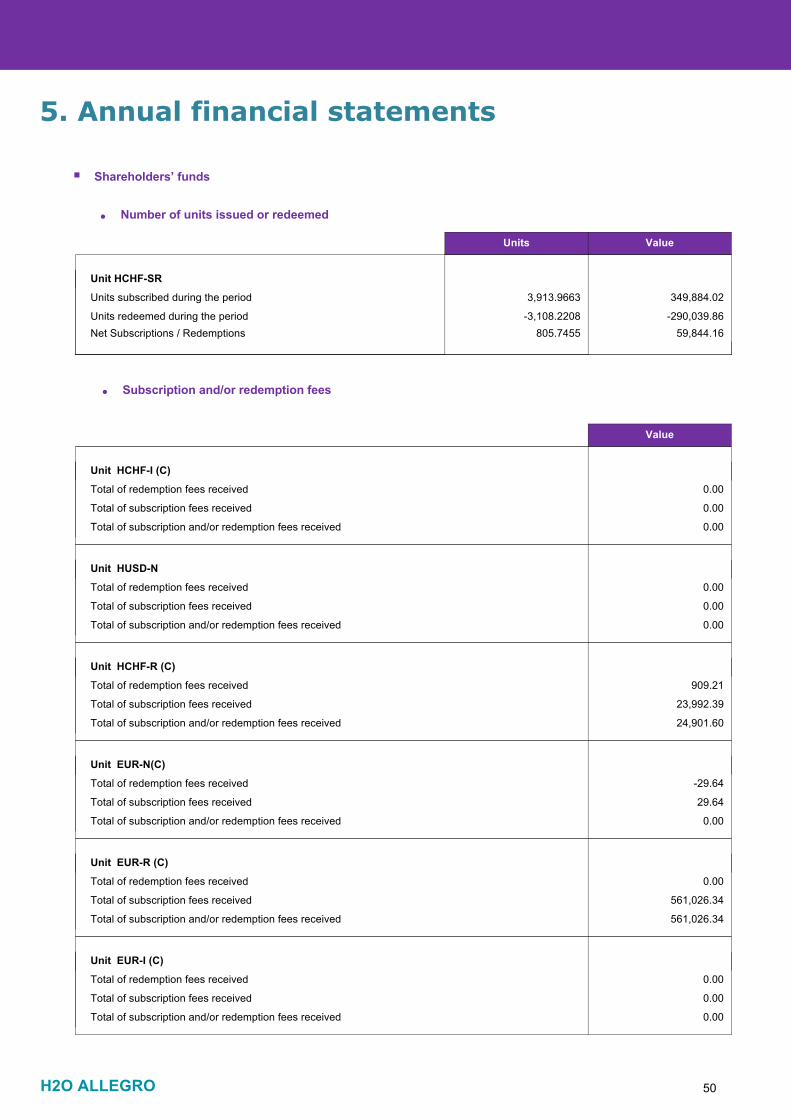
H2O ALLEGRO 50
Units subscribed during the period 3,913.9663 349,884.02
Unit HCHF-SR
Units redeemed during the period -3,108.2208 -290,039.86Net Subscriptions / Redemptions 805.7455 59,844.16
Units Value
Shareholders’ funds
Number of units issued or redeemed•
Annual financial statements5.
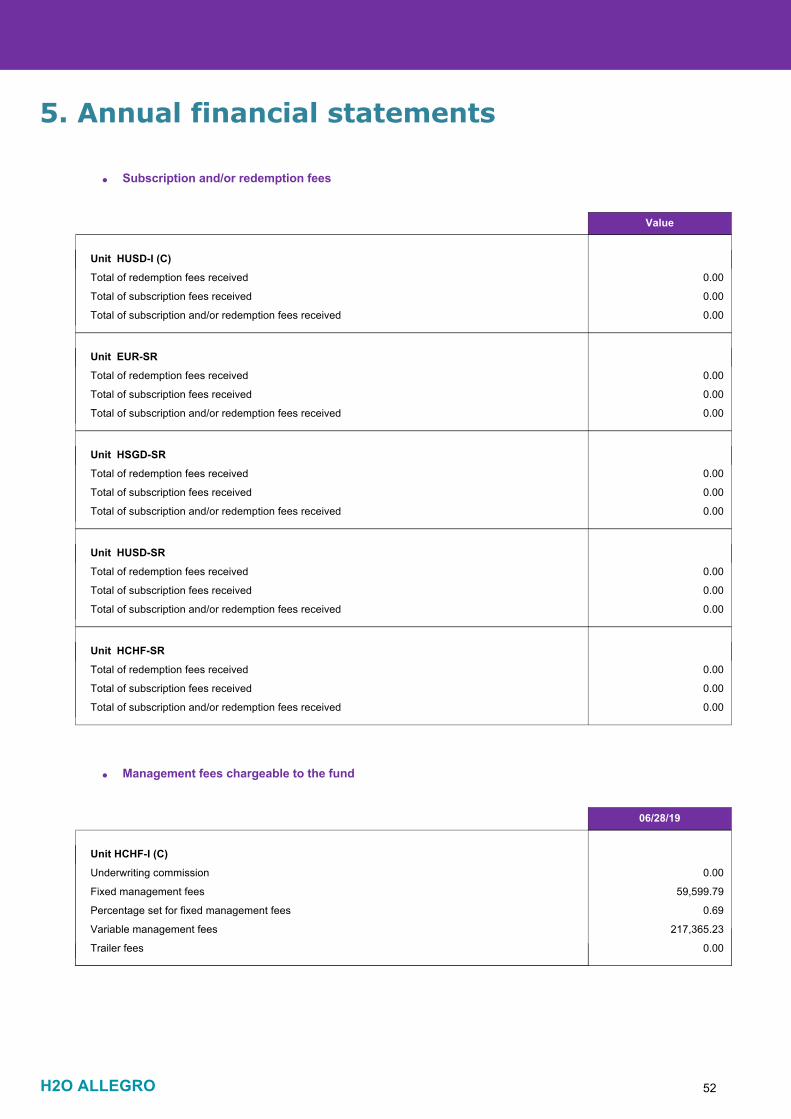
Value
Subscription and/or redemption fees•
Total of subscription fees received 0.00
Total of redemption fees received 0.00
HCHF-I (C)Unit
Total of subscription and/or redemption fees received 0.00
Total of subscription fees received 0.00
Total of redemption fees received 0.00
HUSD-NUnit
Total of subscription and/or redemption fees received 0.00
Total of subscription fees received 23,992.39
Total of redemption fees received 909.21
HCHF-R (C)Unit
Total of subscription and/or redemption fees received 24,901.60
Total of subscription fees received 29.64
Total of redemption fees received -29.64
EUR-N(C)Unit
Total of subscription and/or redemption fees received 0.00
Total of subscription fees received 561,026.34
Total of redemption fees received 0.00
EUR-R (C)Unit
Total of subscription and/or redemption fees received 561,026.34
Total of subscription fees received 0.00
Total of redemption fees received 0.00
EUR-I (C)Unit
Total of subscription and/or redemption fees received 0.00

H2O ALLEGRO 51
Value
5. Annual financial statements
Subscription and/or redemption fees•
Total of subscription fees received 0.00
Total of redemption fees received 0.00
Unit
Total of subscription and/or redemption fees received 0.00
Total of subscription fees received 0.00
Total of redemption fees received 0.00
HAUD-I (C)Unit
Total of subscription and/or redemption fees received 0.00
Total of subscription fees received 0.00
Total of redemption fees received 0.00
HSGD-R (C)Unit
Total of subscription and/or redemption fees received 0.00
Total of subscription fees received 0.00
Total of redemption fees received 0.00
DUnit
Total of subscription and/or redemption fees received 0.00
Total of subscription fees received 0.00
Total of redemption fees received 0.00
HSGD-I (C)Unit
Total of subscription and/or redemption fees received 0.00
Total of subscription fees received 0.00
Total of redemption fees received 0.00
HGBP-I (C)Unit
Total of subscription and/or redemption fees received 0.00
Total of subscription fees received 43,617.80
Total of redemption fees received 0.00
HUSD-R (C)Unit
Total of subscription and/or redemption fees received 43,617.80
Total of subscription fees received 0.00
Total of redemption fees received 0.00
HGBP-ICUnit
Total of subscription and/or redemption fees received 0.00
H2O ALLEGRO 52
Value
5. Annual financial statements
Subscription and/or redemption fees•
Total of subscription fees received 0.00
Total of redemption fees received 0.00
HUSD-I (C)Unit
Total of subscription and/or redemption fees received 0.00
Total of subscription fees received 0.00
Total of redemption fees received 0.00
EUR-SRUnit
Total of subscription and/or redemption fees received 0.00
Total of subscription fees received 0.00
Total of redemption fees received 0.00
HSGD-SRUnit
Total of subscription and/or redemption fees received 0.00
Total of subscription fees received 0.00
Total of redemption fees received 0.00
HUSD-SRUnit
Total of subscription and/or redemption fees received 0.00
Total of subscription fees received 0.00
Total of redemption fees received 0.00
HCHF-SRUnit
Total of subscription and/or redemption fees received 0.00
06/28/19
Unit HCHF-I (C)
0.69Percentage set for fixed management fees
59,599.79Fixed management fees
217,365.23Variable management fees
0.00Trailer fees
0.00Underwriting commission
Management fees chargeable to the fund•

H2O ALLEGRO 53
06/28/19
Unit EUR-N(C)
0.79Percentage set for fixed management fees
1,526,405.83Fixed management fees
6,756,887.96Variable management fees
0.00Trailer fees
0.00Underwriting commission
Unit HUSD-N
0.79Percentage set for fixed management fees
3,786.63Fixed management fees
16,763.82Variable management fees
0.00Trailer fees
0.00Underwriting commission
Unit HCHF-R (C)
1.19Percentage set for fixed management fees
278,753.20Fixed management fees
601,871.80Variable management fees
0.00Trailer fees
0.00Underwriting commission
Unit EUR-R (C)
1.18Percentage set for fixed management fees
6,225,911.69Fixed management fees
14,207,737.59Variable management fees
0.00Trailer fees
0.00Underwriting commission
Unit HSGD-R (C)
1.18Percentage set for fixed management fees
378,918.99Fixed management fees
998,008.85Variable management fees
0.00Trailer fees
0.00Underwriting commission
Management fees chargeable to the fund•
Annual financial statements5.
H2O ALLEGRO 54
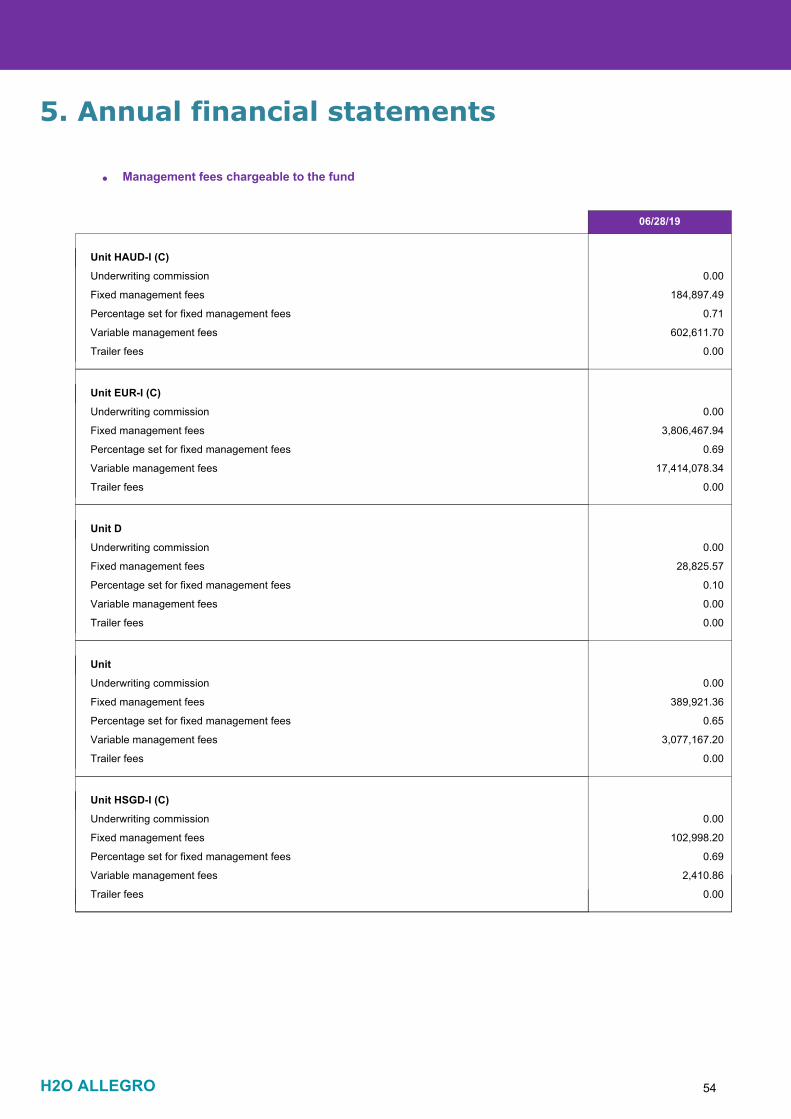
06/28/19
Unit HAUD-I (C)
0.71Percentage set for fixed management fees
184,897.49Fixed management fees
602,611.70Variable management fees
0.00Trailer fees
0.00Underwriting commission
Unit EUR-I (C)
0.69Percentage set for fixed management fees
3,806,467.94Fixed management fees
17,414,078.34Variable management fees
0.00Trailer fees
0.00Underwriting commission
Unit D
0.10Percentage set for fixed management fees
28,825.57Fixed management fees
0.00Variable management fees
0.00Trailer fees
0.00Underwriting commission
Unit
0.65Percentage set for fixed management fees
389,921.36Fixed management fees
3,077,167.20Variable management fees
0.00Trailer fees
0.00Underwriting commission
Unit HSGD-I (C)
0.69Percentage set for fixed management fees
102,998.20Fixed management fees
2,410.86Variable management fees
0.00Trailer fees
0.00Underwriting commission
Management fees chargeable to the fund•
Annual financial statements5.

H2O ALLEGRO 55
06/28/19
Unit HGBP-I (C)
0.74Percentage set for fixed management fees
60,543.40Fixed management fees
0.00Variable management fees
0.00Trailer fees
0.00Underwriting commission
Unit HUSD-R (C)
1.18Percentage set for fixed management fees
872,119.48Fixed management fees
2,873,098.89Variable management fees
0.00Trailer fees
0.00Underwriting commission
Unit HGBP-IC
0.56Percentage set for fixed management fees
255,223.07Fixed management fees
1,347,156.50Variable management fees
0.00Trailer fees
0.00Underwriting commission
Unit HUSD-I (C)
0.69Percentage set for fixed management fees
721,247.50Fixed management fees
3,612,625.02Variable management fees
0.00Trailer fees
0.00Underwriting commission
Unit EUR-SR
1.57Percentage set for fixed management fees
437,675.68Fixed management fees
154,555.67Variable management fees
0.00Trailer fees
0.00Underwriting commission
Management fees chargeable to the fund•
Annual financial statements5.
H2O ALLEGRO 56
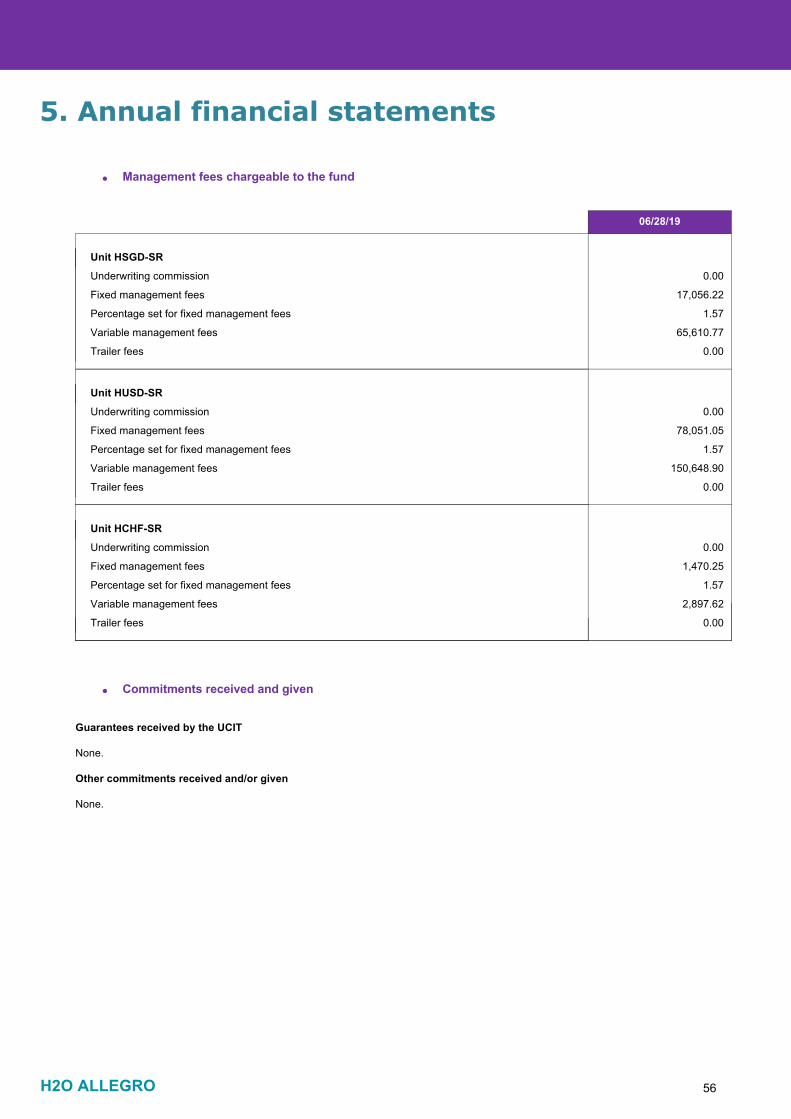
06/28/19
Unit HSGD-SR
1.57Percentage set for fixed management fees
17,056.22Fixed management fees
65,610.77Variable management fees
0.00Trailer fees
0.00Underwriting commission
Unit HUSD-SR
1.57Percentage set for fixed management fees
78,051.05Fixed management fees
150,648.90Variable management fees
0.00Trailer fees
0.00Underwriting commission
Unit HCHF-SR
1.57Percentage set for fixed management fees
1,470.25Fixed management fees
2,897.62Variable management fees
0.00Trailer fees
0.00Underwriting commission
Management fees chargeable to the fund•
Annual financial statements5.
Commitments received and given•
Guarantees received by the UCIT
None.
Other commitments received and/or given
None.
H2O ALLEGRO 57
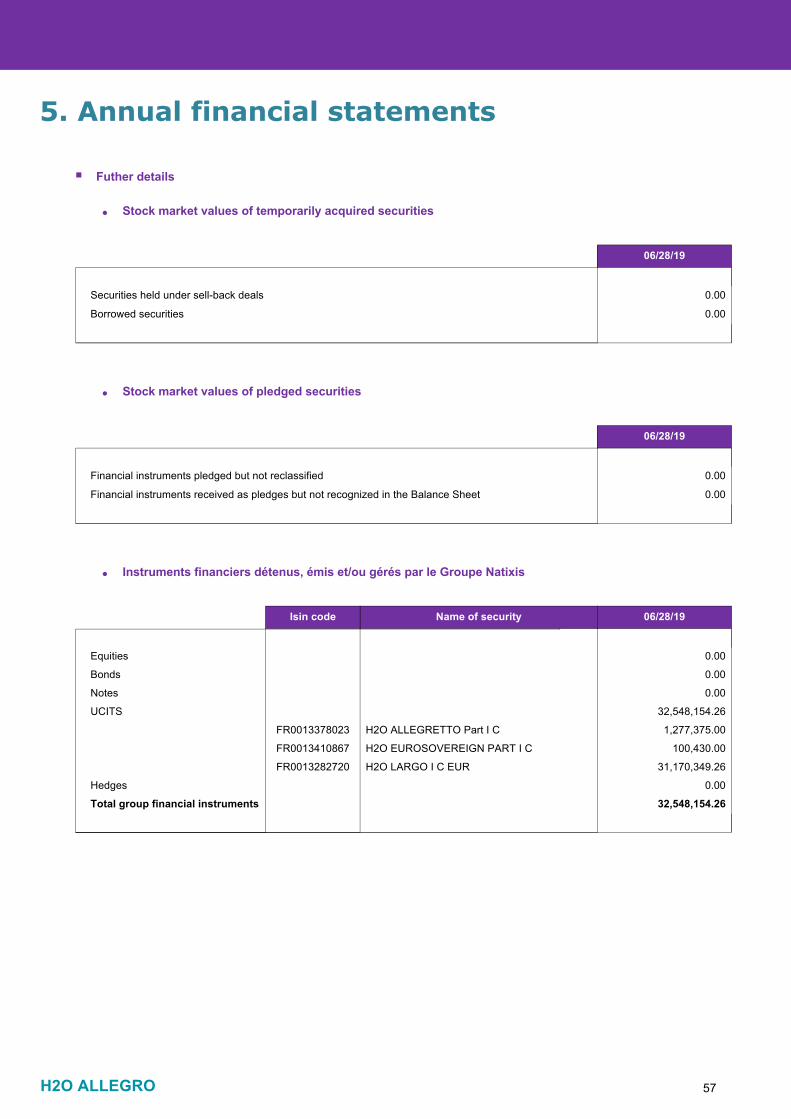
Securities held under sell-back deals 0.00
Borrowed securities 0.00
06/28/19
Financial instruments pledged but not reclassified 0.00
Financial instruments received as pledges but not recognized in the Balance Sheet 0.00
06/28/19
Futher details
Stock market values of temporarily acquired securities•
Stock market values of pledged securities•
Annual financial statements5.
06/28/19Name of securityIsin code
Equities 0.00
Bonds 0.00
Notes 0.00
UCITS 32,548,154.26
1,277,375.00H2O ALLEGRETTO Part I CFR0013378023
100,430.00H2O EUROSOVEREIGN PART I CFR0013410867
31,170,349.26H2O LARGO I C EURFR0013282720
Hedges 0.00
Total group financial instruments 32,548,154.26
Instruments financiers détenus, émis et/ou gérés par le Groupe Natixis•
H2O ALLEGRO 58
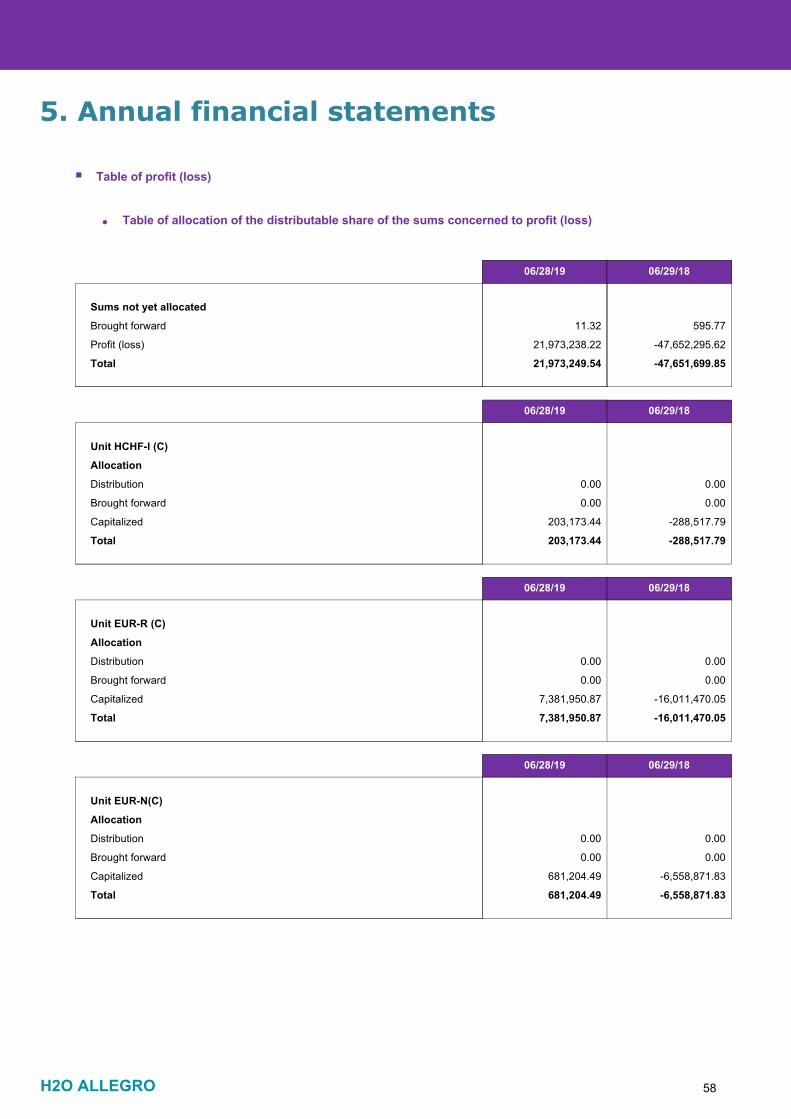
Distribution 0.00 0.00
Brought forward 0.00 0.00
Allocation
Capitalized 203,173.44 -288,517.79
Total 203,173.44 -288,517.79
06/28/19 06/29/18
Sums not yet allocated
Brought forward 11.32 595.77
Profit (loss) 21,973,238.22 -47,652,295.62
Total 21,973,249.54 -47,651,699.85
06/28/19 06/29/18
Unit HCHF-I (C)
Distribution 0.00 0.00
Brought forward 0.00 0.00
Allocation
Capitalized 7,381,950.87 -16,011,470.05
Total 7,381,950.87 -16,011,470.05
06/28/19 06/29/18
Unit EUR-R (C)
Distribution 0.00 0.00
Brought forward 0.00 0.00
Allocation
Capitalized 681,204.49 -6,558,871.83
Total 681,204.49 -6,558,871.83
06/28/19 06/29/18
Unit EUR-N(C)
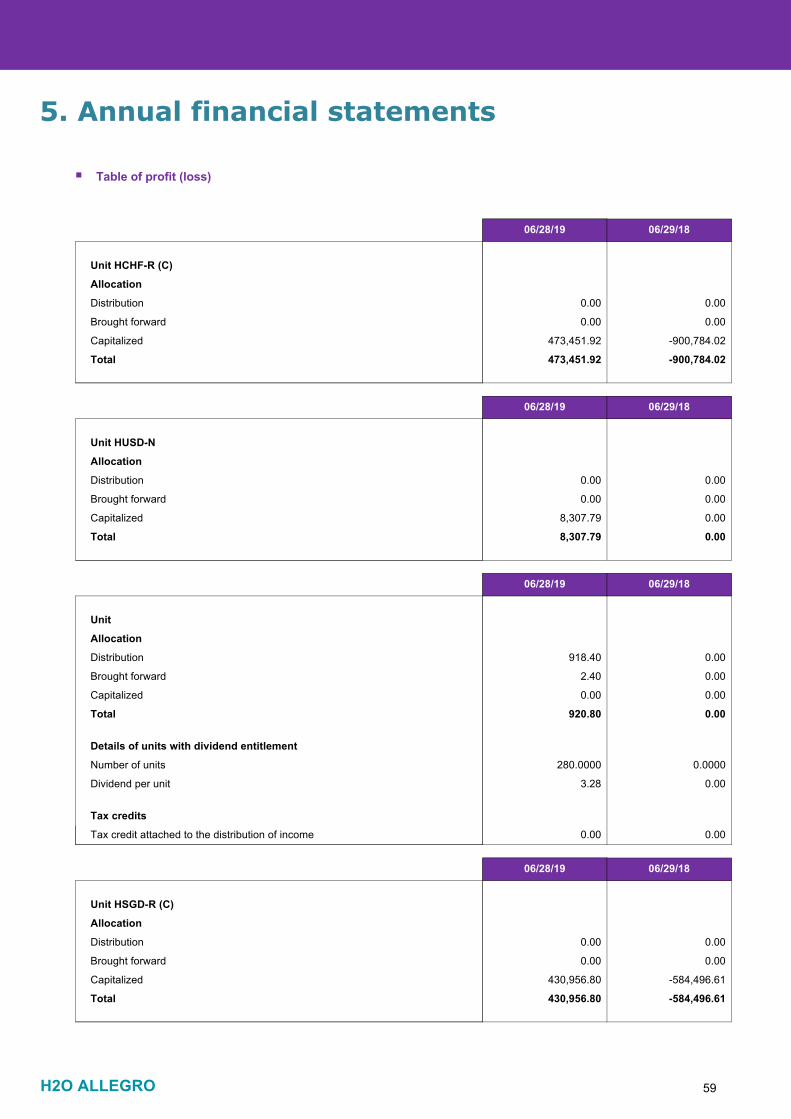
Table of profit (loss)
Annual financial statements5.
Table of allocation of the distributable share of the sums concerned to profit (loss)•
H2O ALLEGRO 59
Distribution 0.00 0.00
Brought forward 0.00 0.00
Allocation
Capitalized 473,451.92 -900,784.02
Total 473,451.92 -900,784.02
06/28/19 06/29/18
Unit HCHF-R (C)
Distribution 0.00 0.00
Brought forward 0.00 0.00
Allocation
Capitalized 8,307.79 0.00
Total 8,307.79 0.00
06/28/19 06/29/18
Unit HUSD-N
Distribution 918.40 0.00
Brought forward 2.40 0.00
Allocation
Capitalized 0.00 0.00
Total 920.80 0.00
Details of units with dividend entitlement
Number of units 280.0000 0.0000
Dividend per unit 3.28 0.00
Tax credits
0.00 0.00Tax credit attached to the distribution of income
06/28/19 06/29/18
Unit
Distribution 0.00 0.00
Brought forward 0.00 0.00
Allocation
Capitalized 430,956.80 -584,496.61
Total 430,956.80 -584,496.61
06/28/19 06/29/18
Unit HSGD-R (C)
Table of profit (loss)
Annual financial statements5.
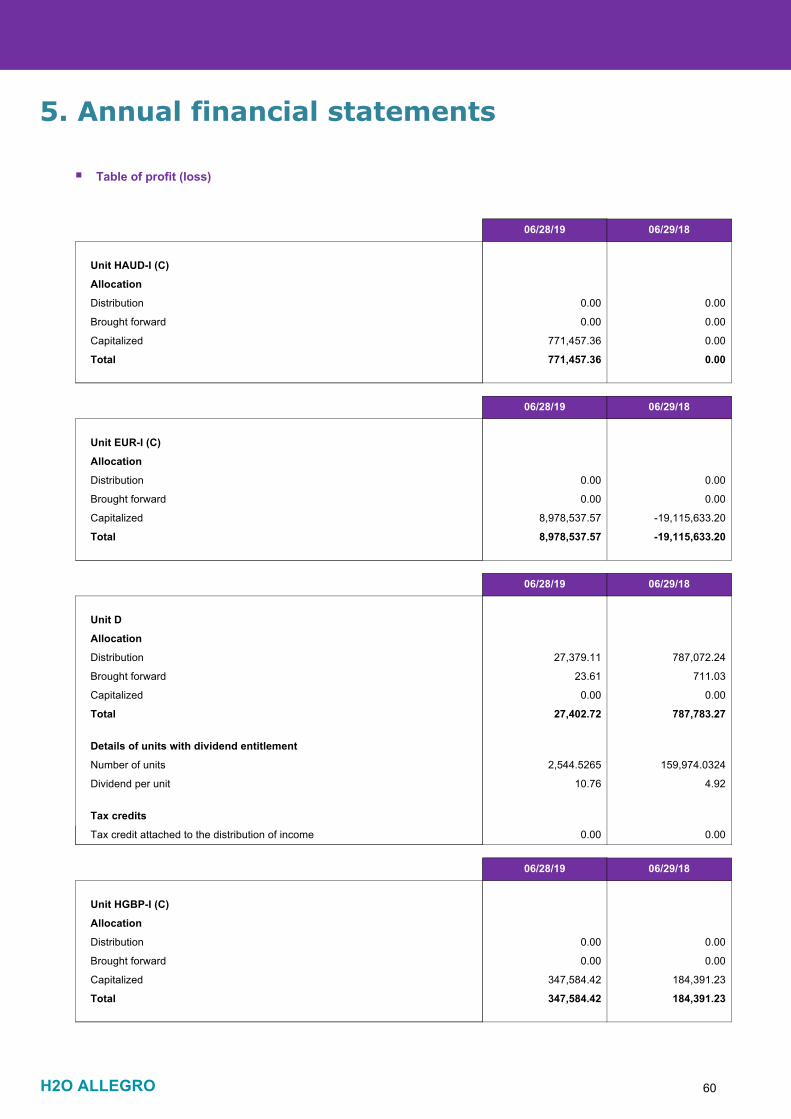
H2O ALLEGRO 60
Distribution 0.00 0.00
Brought forward 0.00 0.00
Allocation
Capitalized 771,457.36 0.00
Total 771,457.36 0.00
06/28/19 06/29/18
Unit HAUD-I (C)
Distribution 0.00 0.00
Brought forward 0.00 0.00
Allocation
Capitalized 8,978,537.57 -19,115,633.20
Total 8,978,537.57 -19,115,633.20
06/28/19 06/29/18
Unit EUR-I (C)
Distribution 27,379.11 787,072.24
Brought forward 23.61 711.03
Allocation
Capitalized 0.00 0.00
Total 27,402.72 787,783.27
Details of units with dividend entitlement
Number of units 2,544.5265 159,974.0324
Dividend per unit 10.76 4.92
Tax credits
0.00 0.00Tax credit attached to the distribution of income
06/28/19 06/29/18
Unit D
Distribution 0.00 0.00
Brought forward 0.00 0.00
Allocation
Capitalized 347,584.42 184,391.23
Total 347,584.42 184,391.23
06/28/19 06/29/18
Unit HGBP-I (C)
Table of profit (loss)
Annual financial statements5.

H2O ALLEGRO 61
Distribution 0.00 0.00
Brought forward 0.00 0.00
Allocation
Capitalized 411,072.36 688.06
Total 411,072.36 688.06
06/28/19 06/29/18
Unit HSGD-I (C)
Distribution 0.00 0.00
Brought forward 0.00 0.00
Allocation
Capitalized 1,132,223.74 0.00
Total 1,132,223.74 0.00
06/28/19 06/29/18
Unit HGBP-IC
Distribution 0.00 0.00
Brought forward 0.00 0.00
Allocation
Capitalized 385,968.57 -2,248,194.77
Total 385,968.57 -2,248,194.77
06/28/19 06/29/18
Unit HUSD-R (C)
Distribution 0.00 0.00
Brought forward 0.00 0.00
Allocation
Capitalized -599,775.86 0.00
Total -599,775.86 0.00
06/28/19 06/29/18
Unit EUR-SR
Table of profit (loss)
Annual financial statements5.

H2O ALLEGRO 62
Distribution 0.00 0.00
Brought forward 0.00 0.00
Allocation
Capitalized 1,252,216.10 -2,916,594.14
Total 1,252,216.10 -2,916,594.14
06/28/19 06/29/18
Unit HUSD-I (C)
Distribution 0.00 0.00
Brought forward 0.00 0.00
Allocation
Capitalized -262.37 0.00
Total -262.37 0.00
06/28/19 06/29/18
Unit HSGD-SR
Distribution 0.00 0.00
Brought forward 0.00 0.00
Allocation
Capitalized 85,411.46 0.00
Total 85,411.46 0.00
06/28/19 06/29/18
Unit HUSD-SR
Distribution 0.00 0.00
Brought forward 0.00 0.00
Allocation
Capitalized 1,447.36 0.00
Total 1,447.36 0.00
06/28/19 06/29/18
Unit HCHF-SR
Table of profit (loss)
Annual financial statements5.
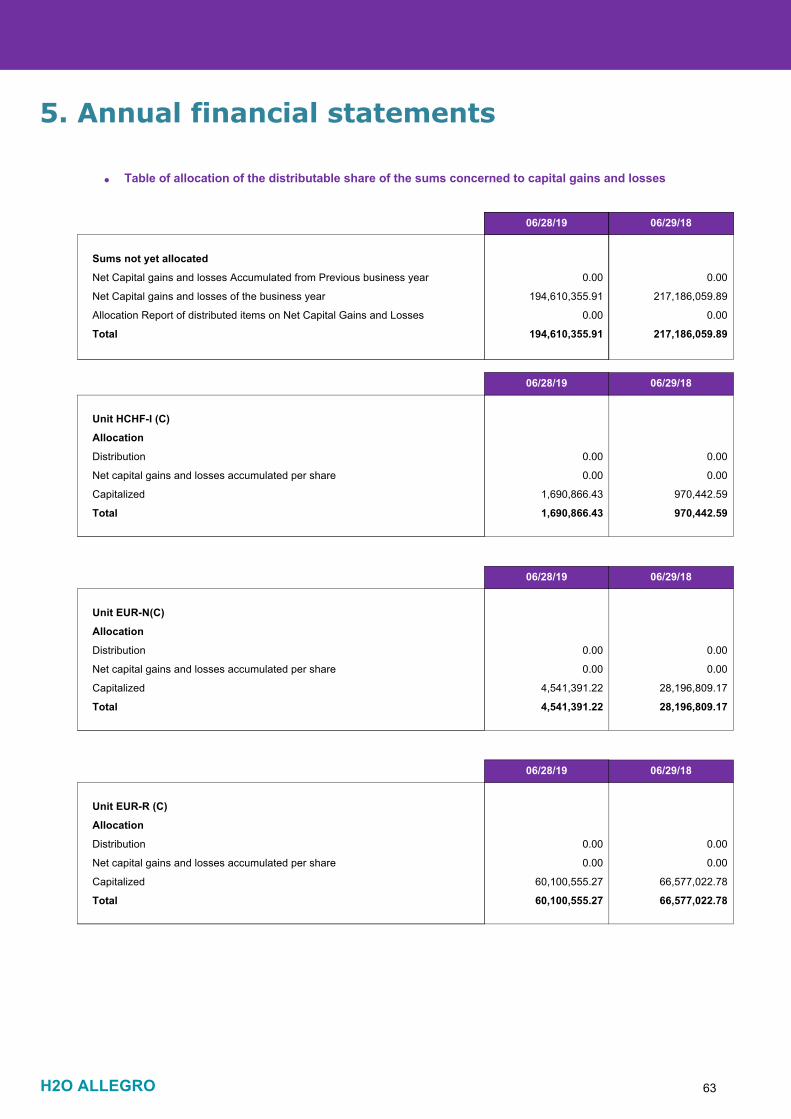
H2O ALLEGRO 63
5. Annual financial statements
Distribution 0.00 0.00
Allocation
Capitalized 1,690,866.43 970,442.59
Total 1,690,866.43 970,442.59
06/28/19 06/29/18
Sums not yet allocated
Net Capital gains and losses Accumulated from Previous business year 0.00 0.00
Total 194,610,355.91 217,186,059.89
Net Capital gains and losses of the business year 194,610,355.91 217,186,059.89
Allocation Report of distributed items on Net Capital Gains and Losses 0.00 0.00
06/28/19 06/29/18
Unit HCHF-I (C)
Net capital gains and losses accumulated per share 0.00 0.00
Table of allocation of the distributable share of the sums concerned to capital gains and losses•
Distribution 0.00 0.00
Allocation
Capitalized 4,541,391.22 28,196,809.17
Total 4,541,391.22 28,196,809.17
06/28/19 06/29/18
Unit EUR-N(C)
Net capital gains and losses accumulated per share 0.00 0.00
Distribution 0.00 0.00
Allocation
Capitalized 60,100,555.27 66,577,022.78
Total 60,100,555.27 66,577,022.78
06/28/19 06/29/18
Unit EUR-R (C)
Net capital gains and losses accumulated per share 0.00 0.00
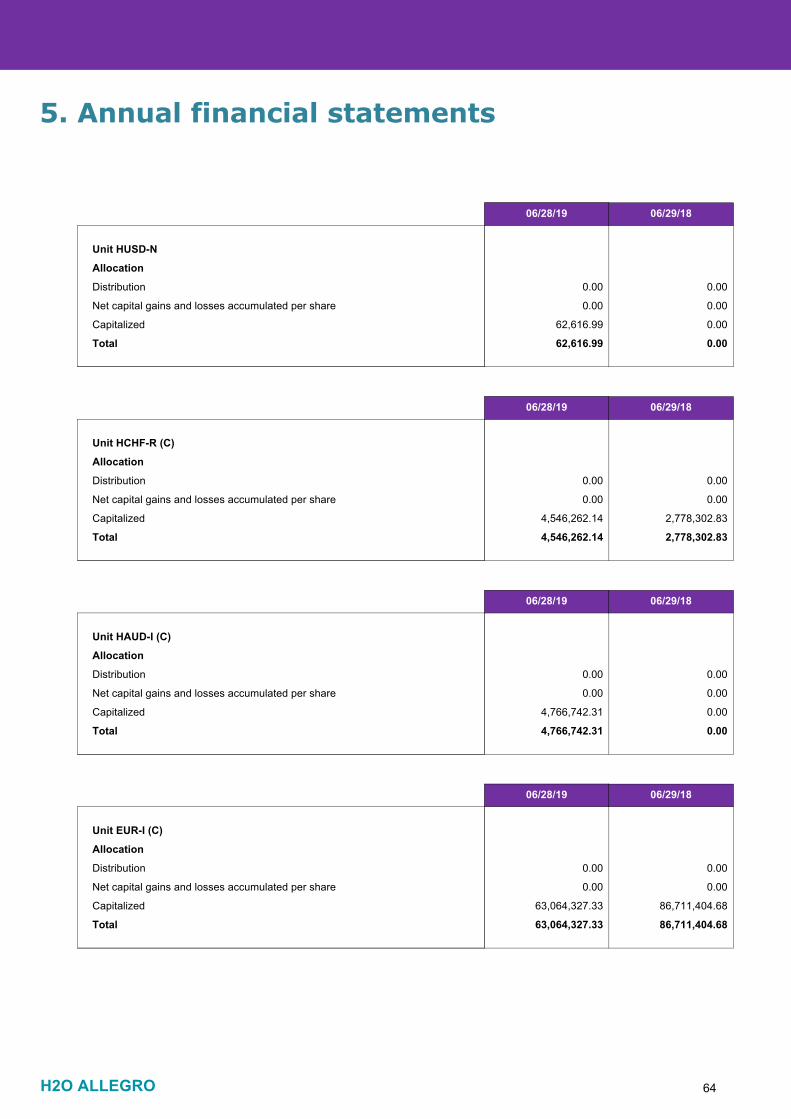
H2O ALLEGRO 64
5. Annual financial statements
Distribution 0.00 0.00
Allocation
Capitalized 62,616.99 0.00
Total 62,616.99 0.00
06/28/19 06/29/18
Unit HUSD-N
Net capital gains and losses accumulated per share 0.00 0.00
Distribution 0.00 0.00
Allocation
Capitalized 4,546,262.14 2,778,302.83
Total 4,546,262.14 2,778,302.83
06/28/19 06/29/18
Unit HCHF-R (C)
Net capital gains and losses accumulated per share 0.00 0.00
Distribution 0.00 0.00
Allocation
Capitalized 4,766,742.31 0.00
Total 4,766,742.31 0.00
06/28/19 06/29/18
Unit HAUD-I (C)
Net capital gains and losses accumulated per share 0.00 0.00
Distribution 0.00 0.00
Allocation
Capitalized 63,064,327.33 86,711,404.68
Total 63,064,327.33 86,711,404.68
06/28/19 06/29/18
Unit EUR-I (C)
Net capital gains and losses accumulated per share 0.00 0.00
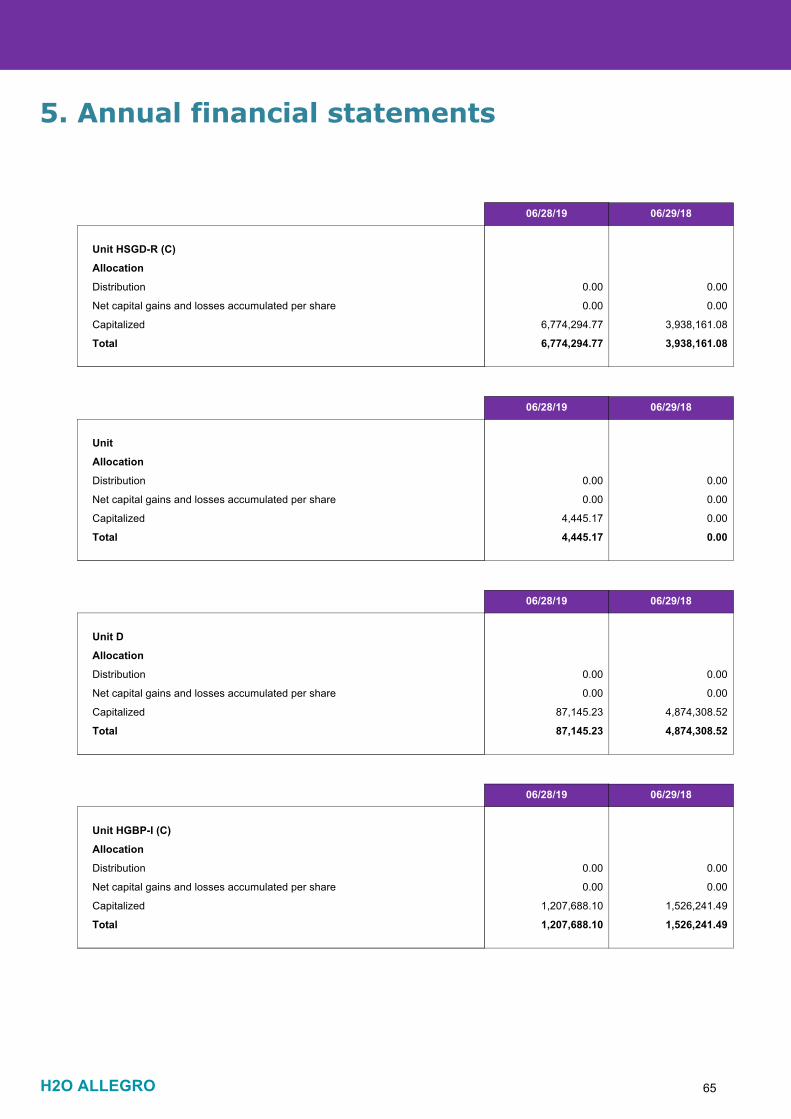
H2O ALLEGRO 65
5. Annual financial statements
Distribution 0.00 0.00
Allocation
Capitalized 6,774,294.77 3,938,161.08
Total 6,774,294.77 3,938,161.08
06/28/19 06/29/18
Unit HSGD-R (C)
Net capital gains and losses accumulated per share 0.00 0.00
Distribution 0.00 0.00
Allocation
Capitalized 4,445.17 0.00
Total 4,445.17 0.00
06/28/19 06/29/18
Unit
Net capital gains and losses accumulated per share 0.00 0.00
Distribution 0.00 0.00
Allocation
Capitalized 87,145.23 4,874,308.52
Total 87,145.23 4,874,308.52
06/28/19 06/29/18
Unit D
Net capital gains and losses accumulated per share 0.00 0.00
Distribution 0.00 0.00
Allocation
Capitalized 1,207,688.10 1,526,241.49
Total 1,207,688.10 1,526,241.49
06/28/19 06/29/18
Unit HGBP-I (C)
Net capital gains and losses accumulated per share 0.00 0.00
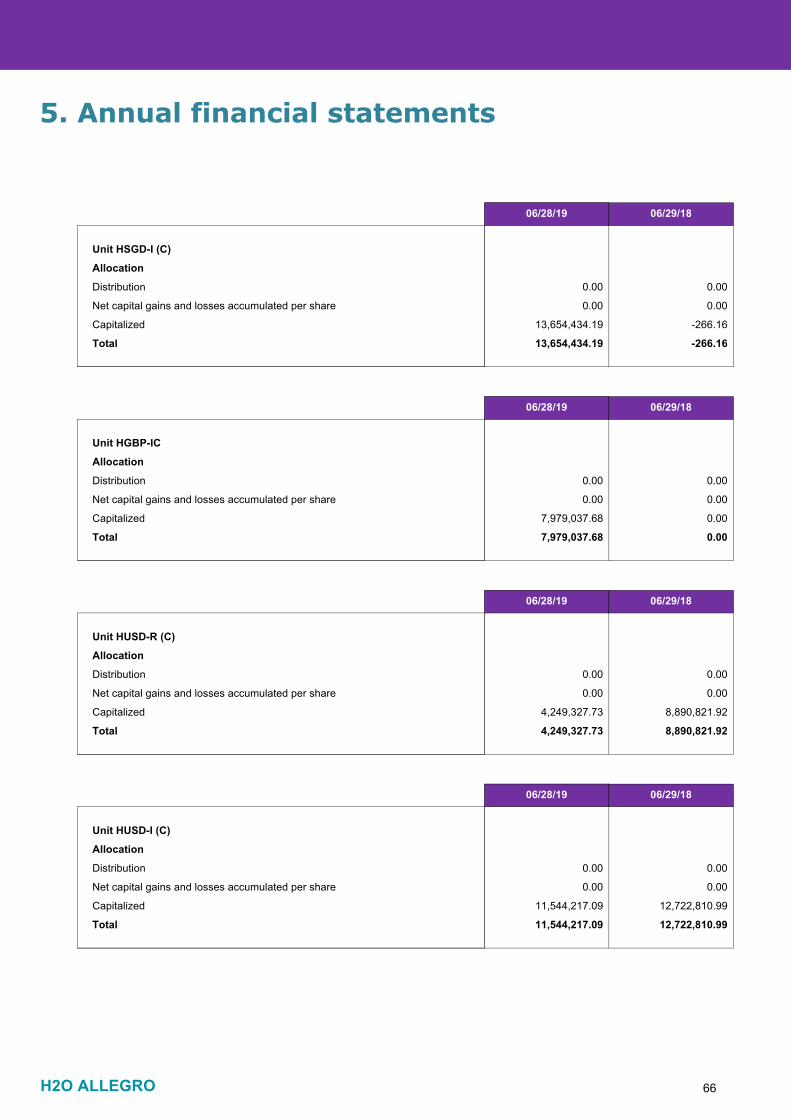
H2O ALLEGRO 66
5. Annual financial statements
Distribution 0.00 0.00
Allocation
Capitalized 13,654,434.19 -266.16
Total 13,654,434.19 -266.16
06/28/19 06/29/18
Unit HSGD-I (C)
Net capital gains and losses accumulated per share 0.00 0.00
Distribution 0.00 0.00
Allocation
Capitalized 7,979,037.68 0.00
Total 7,979,037.68 0.00
06/28/19 06/29/18
Unit HGBP-IC
Net capital gains and losses accumulated per share 0.00 0.00
Distribution 0.00 0.00
Allocation
Capitalized 4,249,327.73 8,890,821.92
Total 4,249,327.73 8,890,821.92
06/28/19 06/29/18
Unit HUSD-R (C)
Net capital gains and losses accumulated per share 0.00 0.00
Distribution 0.00 0.00
Allocation
Capitalized 11,544,217.09 12,722,810.99
Total 11,544,217.09 12,722,810.99
06/28/19 06/29/18
Unit HUSD-I (C)
Net capital gains and losses accumulated per share 0.00 0.00
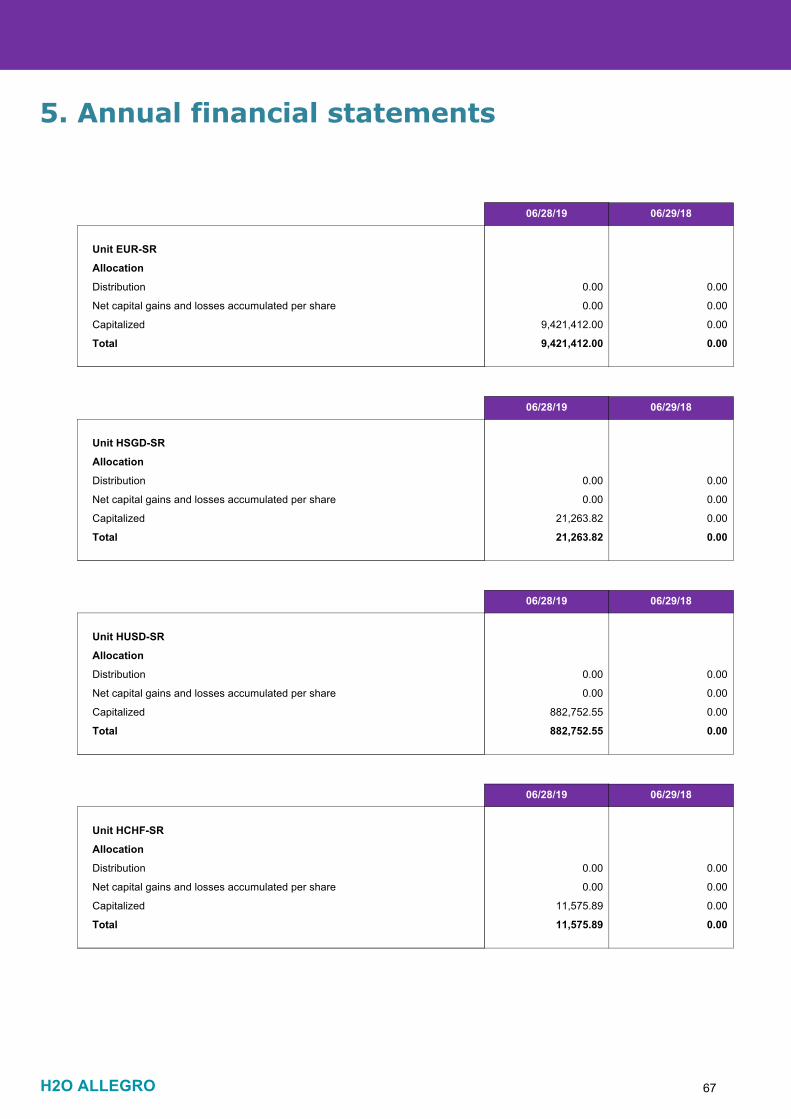
H2O ALLEGRO 67
5. Annual financial statements
Distribution 0.00 0.00
Allocation
Capitalized 9,421,412.00 0.00
Total 9,421,412.00 0.00
06/28/19 06/29/18
Unit EUR-SR
Net capital gains and losses accumulated per share 0.00 0.00
Distribution 0.00 0.00
Allocation
Capitalized 21,263.82 0.00
Total 21,263.82 0.00
06/28/19 06/29/18
Unit HSGD-SR
Net capital gains and losses accumulated per share 0.00 0.00
Distribution 0.00 0.00
Allocation
Capitalized 882,752.55 0.00
Total 882,752.55 0.00
06/28/19 06/29/18
Unit HUSD-SR
Net capital gains and losses accumulated per share 0.00 0.00
Distribution 0.00 0.00
Allocation
Capitalized 11,575.89 0.00
Total 11,575.89 0.00
06/28/19 06/29/18
Unit HCHF-SR
Net capital gains and losses accumulated per share 0.00 0.00

H2O ALLEGRO 68
06/30/15
Global Net Assets in EUR 207,414,226.06
06/30/16
239,271,564.83
06/30/17
292,741,580.53
06/29/18
1,335,261,350.39
06/28/19
1,117,911,302.19
H2O ALLEGRO HUSD-N
0.00Net assets in USD 0.00 0.00 0.00 328,318.81
0.0000Number of shares/units 0.0000 0.0000 0.0000 2,978.8646
0.00NAV per share/unit 0.00 0.00 0.00 110.21
0.00Net Capital Gains and LossesAccumulated per share
0.00 0.00 0.00 21.02
0.00Net income Accumulated pershare
0.00 0.00 0.00 2.78
H20 ALLEGRO HCHF-R
1,951,924.30Net assets in CHF 8,162,124.93 12,087,439.47 25,615,203.24 23,727,261.82
198.9319Number of shares/units 737.0320 843.9846 1,358.1711 1,164.0564
9,812.02NAV per share/unit 11,074.31 14,321.87 18,860.07 20,383.25
2,028.96Net Capital Gains and LossesAccumulated per share
-66.30 1,338.56 2,045.62 3,905.53
60.28Net income Accumulated pershare
121.92 -268.58 -663.23 406.72
H2O ALLEGRO R
46,360,352.50Net assets in EUR 73,032,960.66 93,265,056.71 389,583,415.87 340,356,815.67
2,910.0901Number of shares/units 4,079.8909 4,017.9514 12,707.9732 10,276.8093
15,930.89NAV per share/unit 17,900.71 23,212.09 30,656.61 33,118.91
2,522.92Net Capital Gains and LossesAccumulated per share
169.25 2,672.02 5,238.99 5,848.17
125.08Net income Accumulated pershare
45.71 -470.61 -1,259.95 718.31
H2O ALLEGRO HCHF-I
0.00Net assets in CHF 1,365,768.58 3,455,430.87 8,962,960.65 8,835,701.78
0.0000Number of shares/units 28.5000 55.0441 107.9546 98.1036
0.00NAV per share/unit 47,921.70 62,775.68 83,025.27 90,065.01
0.00Net Capital Gains and LossesAccumulated per share
-922.17 5,854.86 8,989.35 17,235.51
0.00Net income Accumulated pershare
1,230.18 -553.71 -2,672.58 2,071.00
Table of profit (loss) and other typical features of the fund over the past five financial periods
Annual financial statements5.
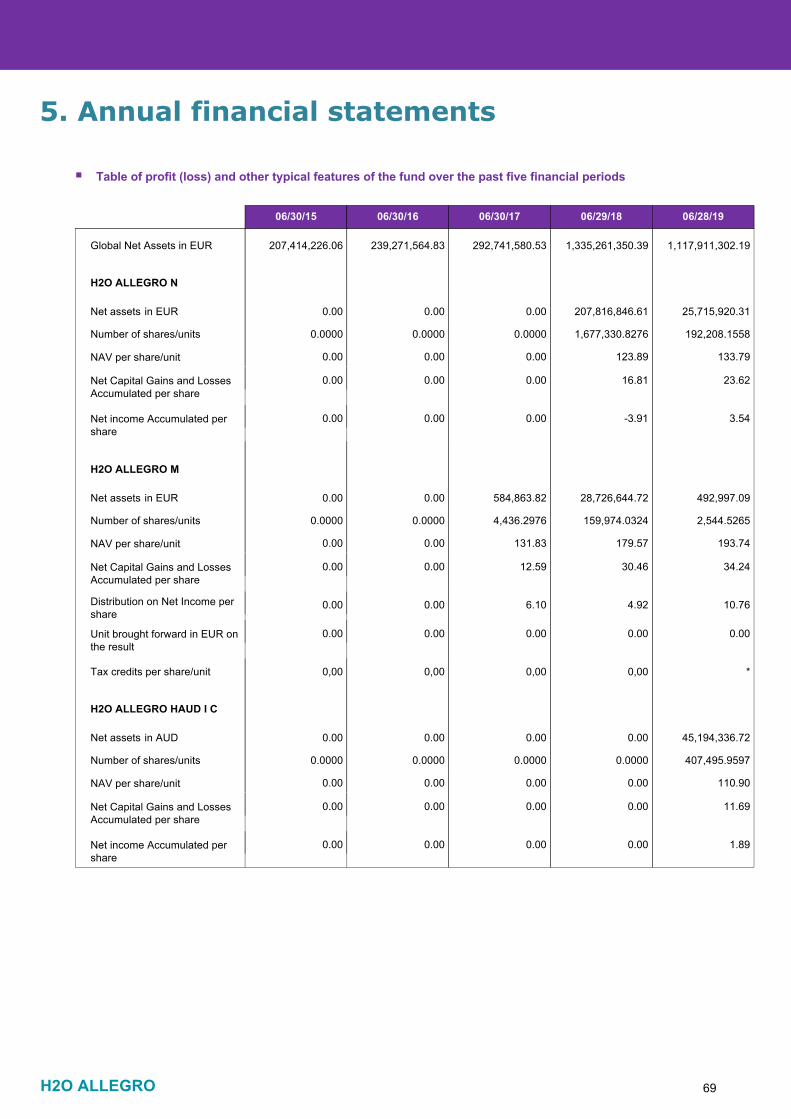
H2O ALLEGRO 69
06/30/15
Global Net Assets in EUR 207,414,226.06
06/30/16
239,271,564.83
06/30/17
292,741,580.53
06/29/18
1,335,261,350.39
06/28/19
1,117,911,302.19
H2O ALLEGRO N
0.00Net assets in EUR 0.00 0.00 207,816,846.61 25,715,920.31
0.0000Number of shares/units 0.0000 0.0000 1,677,330.8276 192,208.1558
0.00NAV per share/unit 0.00 0.00 123.89 133.79
0.00Net Capital Gains and LossesAccumulated per share
0.00 0.00 16.81 23.62
0.00Net income Accumulated pershare
0.00 0.00 -3.91 3.54
H2O ALLEGRO M
0.00Net assets in EUR 0.00 584,863.82 28,726,644.72 492,997.09
0.0000Number of shares/units 0.0000 4,436.2976 159,974.0324 2,544.5265
0.00NAV per share/unit 0.00 131.83 179.57 193.74
0.00Net Capital Gains and LossesAccumulated per share
0.00 12.59 30.46 34.24
0.00Distribution on Net Income pershare
0.00 6.10 4.92 10.76
0.00Unit brought forward in EUR onthe result
0.00 0.00 0.00 0.00
0,00Tax credits per share/unit 0,00 0,00 0,00 *
H2O ALLEGRO HAUD I C
0.00Net assets in AUD 0.00 0.00 0.00 45,194,336.72
0.0000Number of shares/units 0.0000 0.0000 0.0000 407,495.9597
0.00NAV per share/unit 0.00 0.00 0.00 110.90
0.00Net Capital Gains and LossesAccumulated per share
0.00 0.00 0.00 11.69
0.00Net income Accumulated pershare
0.00 0.00 0.00 1.89
Table of profit (loss) and other typical features of the fund over the past five financial periods
Annual financial statements5.
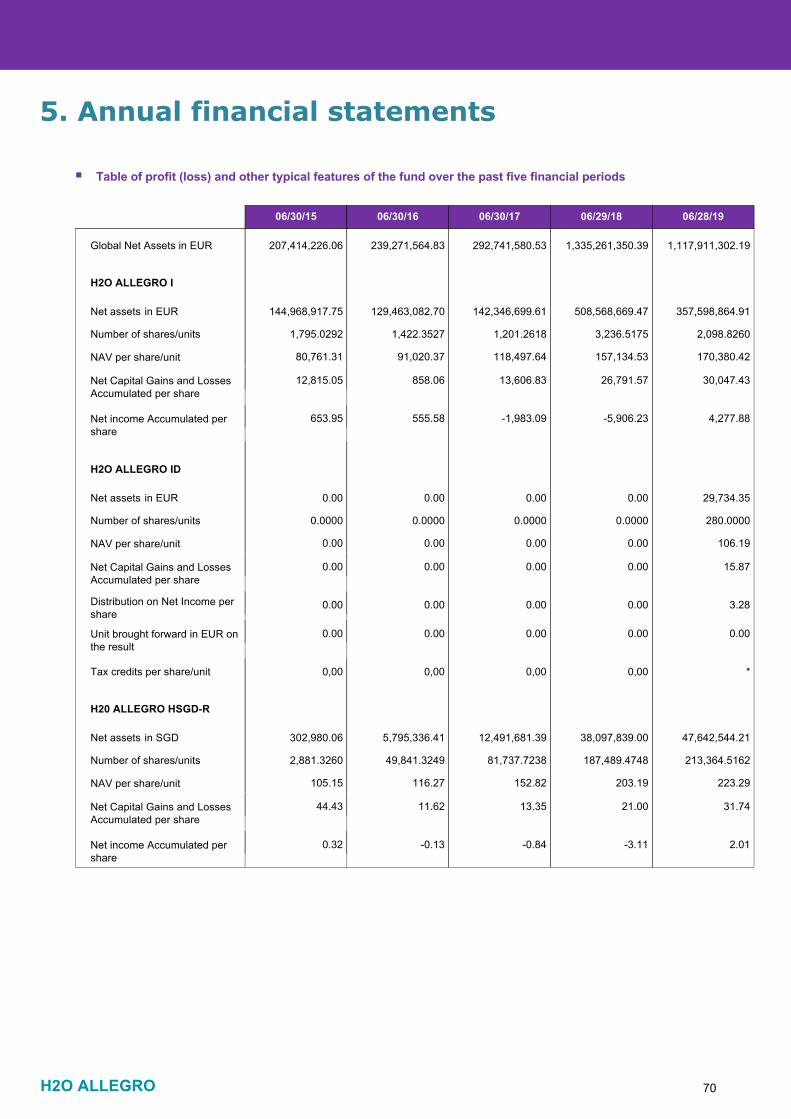
H2O ALLEGRO 70
06/30/15
Global Net Assets in EUR 207,414,226.06
06/30/16
239,271,564.83
06/30/17
292,741,580.53
06/29/18
1,335,261,350.39
06/28/19
1,117,911,302.19
H2O ALLEGRO I
144,968,917.75Net assets in EUR 129,463,082.70 142,346,699.61 508,568,669.47 357,598,864.91
1,795.0292Number of shares/units 1,422.3527 1,201.2618 3,236.5175 2,098.8260
80,761.31NAV per share/unit 91,020.37 118,497.64 157,134.53 170,380.42
12,815.05Net Capital Gains and LossesAccumulated per share
858.06 13,606.83 26,791.57 30,047.43
653.95Net income Accumulated pershare
555.58 -1,983.09 -5,906.23 4,277.88
H2O ALLEGRO ID
0.00Net assets in EUR 0.00 0.00 0.00 29,734.35
0.0000Number of shares/units 0.0000 0.0000 0.0000 280.0000
0.00NAV per share/unit 0.00 0.00 0.00 106.19
0.00Net Capital Gains and LossesAccumulated per share
0.00 0.00 0.00 15.87
0.00Distribution on Net Income pershare
0.00 0.00 0.00 3.28
0.00Unit brought forward in EUR onthe result
0.00 0.00 0.00 0.00
0,00Tax credits per share/unit 0,00 0,00 0,00 *
H20 ALLEGRO HSGD-R
302,980.06Net assets in SGD 5,795,336.41 12,491,681.39 38,097,839.00 47,642,544.21
2,881.3260Number of shares/units 49,841.3249 81,737.7238 187,489.4748 213,364.5162
105.15NAV per share/unit 116.27 152.82 203.19 223.29
44.43Net Capital Gains and LossesAccumulated per share
11.62 13.35 21.00 31.74
0.32Net income Accumulated pershare
-0.13 -0.84 -3.11 2.01
Table of profit (loss) and other typical features of the fund over the past five financial periods
Annual financial statements5.
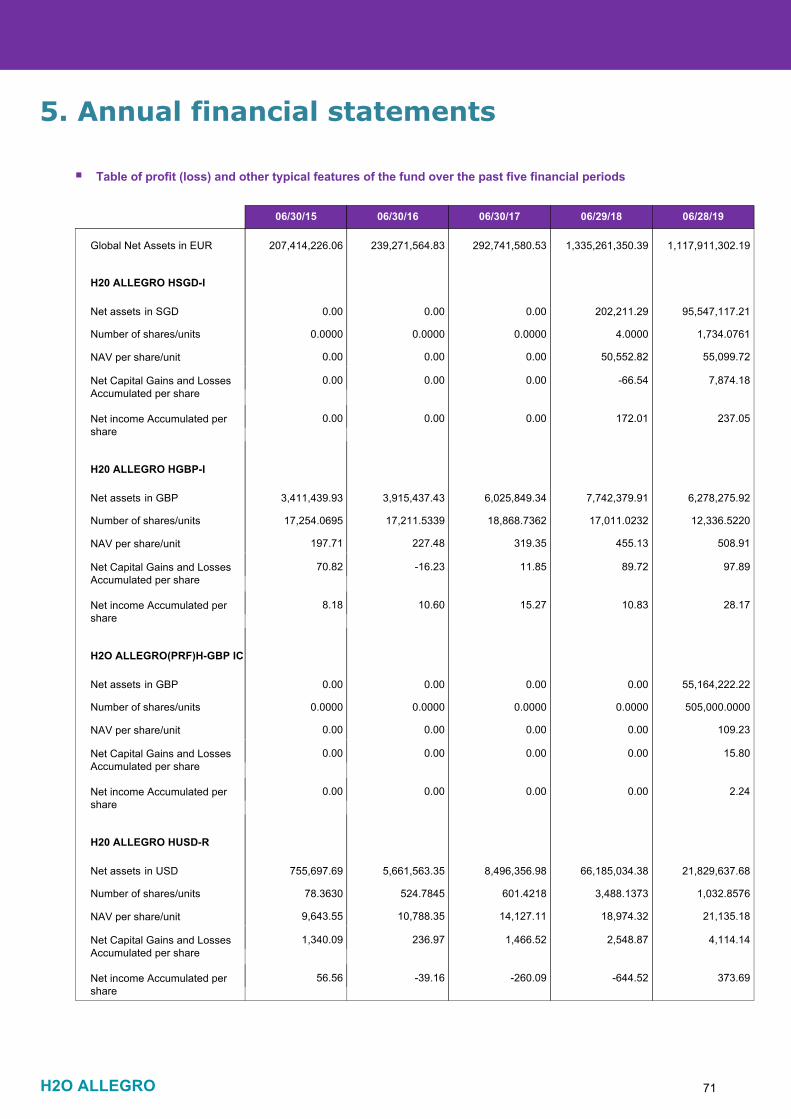
H2O ALLEGRO 71
06/30/15
Global Net Assets in EUR 207,414,226.06
06/30/16
239,271,564.83
06/30/17
292,741,580.53
06/29/18
1,335,261,350.39
06/28/19
1,117,911,302.19
H20 ALLEGRO HSGD-I
0.00Net assets in SGD 0.00 0.00 202,211.29 95,547,117.21
0.0000Number of shares/units 0.0000 0.0000 4.0000 1,734.0761
0.00NAV per share/unit 0.00 0.00 50,552.82 55,099.72
0.00Net Capital Gains and LossesAccumulated per share
0.00 0.00 -66.54 7,874.18
0.00Net income Accumulated pershare
0.00 0.00 172.01 237.05
H20 ALLEGRO HGBP-I
3,411,439.93Net assets in GBP 3,915,437.43 6,025,849.34 7,742,379.91 6,278,275.92
17,254.0695Number of shares/units 17,211.5339 18,868.7362 17,011.0232 12,336.5220
197.71NAV per share/unit 227.48 319.35 455.13 508.91
70.82Net Capital Gains and LossesAccumulated per share
-16.23 11.85 89.72 97.89
8.18Net income Accumulated pershare
10.60 15.27 10.83 28.17
H2O ALLEGRO(PRF)H-GBP IC
0.00Net assets in GBP 0.00 0.00 0.00 55,164,222.22
0.0000Number of shares/units 0.0000 0.0000 0.0000 505,000.0000
0.00NAV per share/unit 0.00 0.00 0.00 109.23
0.00Net Capital Gains and LossesAccumulated per share
0.00 0.00 0.00 15.80
0.00Net income Accumulated pershare
0.00 0.00 0.00 2.24
H20 ALLEGRO HUSD-R
755,697.69Net assets in USD 5,661,563.35 8,496,356.98 66,185,034.38 21,829,637.68
78.3630Number of shares/units 524.7845 601.4218 3,488.1373 1,032.8576
9,643.55NAV per share/unit 10,788.35 14,127.11 18,974.32 21,135.18
1,340.09Net Capital Gains and LossesAccumulated per share
236.97 1,466.52 2,548.87 4,114.14
56.56Net income Accumulated pershare
-39.16 -260.09 -644.52 373.69
Table of profit (loss) and other typical features of the fund over the past five financial periods
Annual financial statements5.
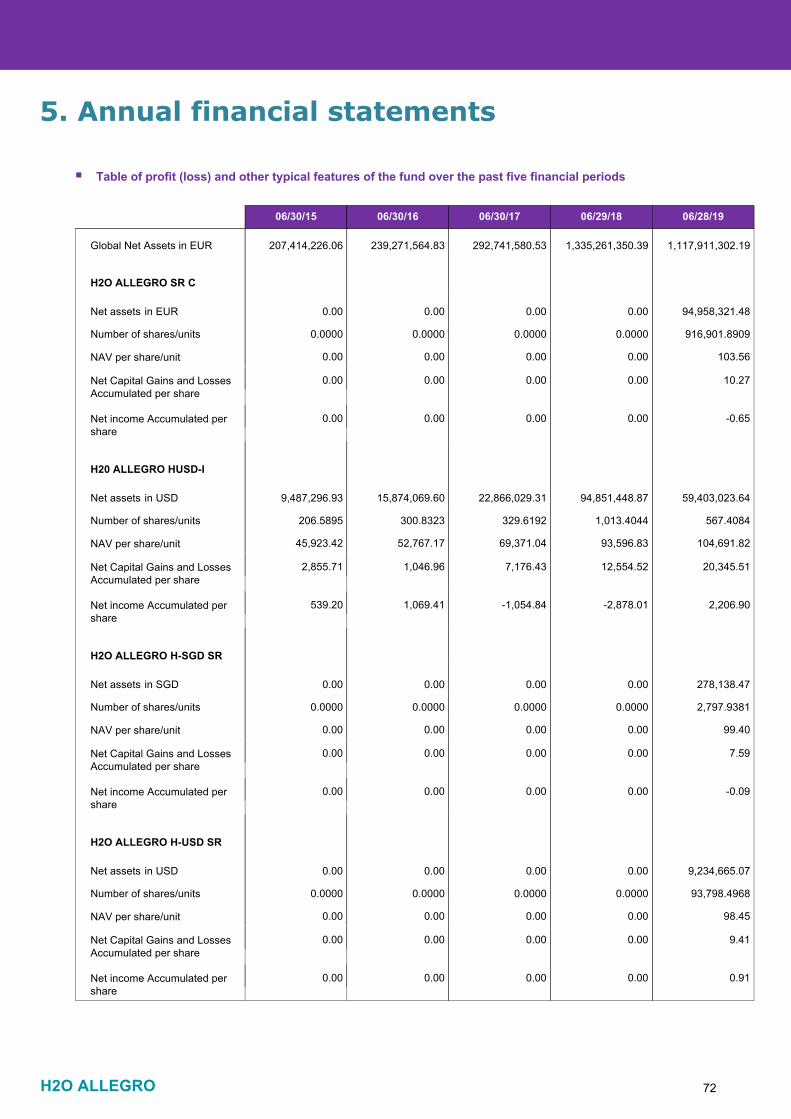
H2O ALLEGRO 72
06/30/15
Global Net Assets in EUR 207,414,226.06
06/30/16
239,271,564.83
06/30/17
292,741,580.53
06/29/18
1,335,261,350.39
06/28/19
1,117,911,302.19
H2O ALLEGRO SR C
0.00Net assets in EUR 0.00 0.00 0.00 94,958,321.48
0.0000Number of shares/units 0.0000 0.0000 0.0000 916,901.8909
0.00NAV per share/unit 0.00 0.00 0.00 103.56
0.00Net Capital Gains and LossesAccumulated per share
0.00 0.00 0.00 10.27
0.00Net income Accumulated pershare
0.00 0.00 0.00 -0.65
H20 ALLEGRO HUSD-I
9,487,296.93Net assets in USD 15,874,069.60 22,866,029.31 94,851,448.87 59,403,023.64
206.5895Number of shares/units 300.8323 329.6192 1,013.4044 567.4084
45,923.42NAV per share/unit 52,767.17 69,371.04 93,596.83 104,691.82
2,855.71Net Capital Gains and LossesAccumulated per share
1,046.96 7,176.43 12,554.52 20,345.51
539.20Net income Accumulated pershare
1,069.41 -1,054.84 -2,878.01 2,206.90
H2O ALLEGRO H-SGD SR
0.00Net assets in SGD 0.00 0.00 0.00 278,138.47
0.0000Number of shares/units 0.0000 0.0000 0.0000 2,797.9381
0.00NAV per share/unit 0.00 0.00 0.00 99.40
0.00Net Capital Gains and LossesAccumulated per share
0.00 0.00 0.00 7.59
0.00Net income Accumulated pershare
0.00 0.00 0.00 -0.09
H2O ALLEGRO H-USD SR
0.00Net assets in USD 0.00 0.00 0.00 9,234,665.07
0.0000Number of shares/units 0.0000 0.0000 0.0000 93,798.4968
0.00NAV per share/unit 0.00 0.00 0.00 98.45
0.00Net Capital Gains and LossesAccumulated per share
0.00 0.00 0.00 9.41
0.00Net income Accumulated pershare
0.00 0.00 0.00 0.91
Table of profit (loss) and other typical features of the fund over the past five financial periods
Annual financial statements5.
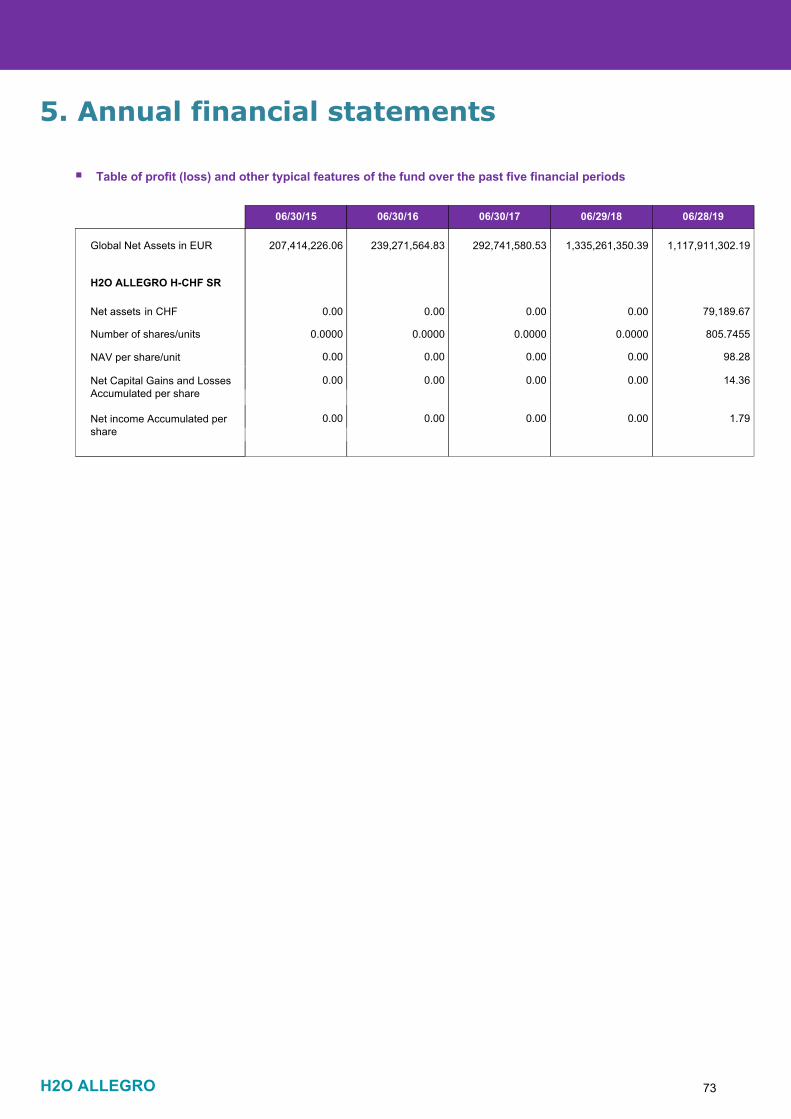
H2O ALLEGRO 73
06/30/15
Global Net Assets in EUR 207,414,226.06
06/30/16
239,271,564.83
06/30/17
292,741,580.53
06/29/18
1,335,261,350.39
06/28/19
1,117,911,302.19
H2O ALLEGRO H-CHF SR
0.00Net assets in CHF 0.00 0.00 0.00 79,189.67
0.0000Number of shares/units 0.0000 0.0000 0.0000 805.7455
0.00NAV per share/unit 0.00 0.00 0.00 98.28
0.00Net Capital Gains and LossesAccumulated per share
0.00 0.00 0.00 14.36
0.00Net income Accumulated pershare
0.00 0.00 0.00 1.79
Table of profit (loss) and other typical features of the fund over the past five financial periods
Annual financial statements5.
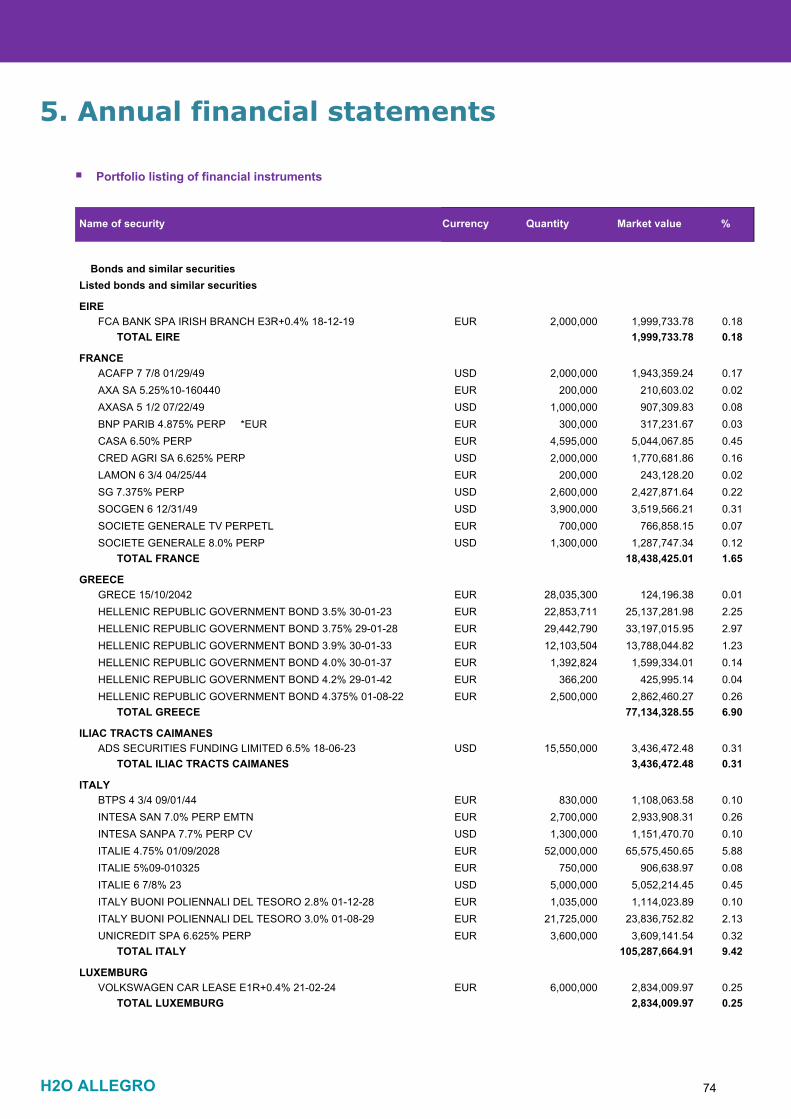
H2O ALLEGRO 74
Bonds and similar securitiesListed bonds and similar securities
EIREFCA BANK SPA IRISH BRANCH E3R+0.4% 18-12-19 EUR 2,000,000 1,999,733.78 0.18
TOTAL EIRE 1,999,733.78 0.18
Currency Quantity Market value %Name of security
FRANCEACAFP 7 7/8 01/29/49 USD 2,000,000 1,943,359.24 0.17AXA SA 5.25%10-160440 EUR 200,000 210,603.02 0.02AXASA 5 1/2 07/22/49 USD 1,000,000 907,309.83 0.08BNP PARIB 4.875% PERP *EUR EUR 300,000 317,231.67 0.03CASA 6.50% PERP EUR 4,595,000 5,044,067.85 0.45CRED AGRI SA 6.625% PERP USD 2,000,000 1,770,681.86 0.16LAMON 6 3/4 04/25/44 EUR 200,000 243,128.20 0.02SG 7.375% PERP USD 2,600,000 2,427,871.64 0.22SOCGEN 6 12/31/49 USD 3,900,000 3,519,566.21 0.31SOCIETE GENERALE TV PERPETL EUR 700,000 766,858.15 0.07SOCIETE GENERALE 8.0% PERP USD 1,300,000 1,287,747.34 0.12
TOTAL FRANCE 18,438,425.01 1.65
GREECEGRECE 15/10/2042 EUR 28,035,300 124,196.38 0.01HELLENIC REPUBLIC GOVERNMENT BOND 3.5% 30-01-23 EUR 22,853,711 25,137,281.98 2.25HELLENIC REPUBLIC GOVERNMENT BOND 3.75% 29-01-28 EUR 29,442,790 33,197,015.95 2.97HELLENIC REPUBLIC GOVERNMENT BOND 3.9% 30-01-33 EUR 12,103,504 13,788,044.82 1.23HELLENIC REPUBLIC GOVERNMENT BOND 4.0% 30-01-37 EUR 1,392,824 1,599,334.01 0.14HELLENIC REPUBLIC GOVERNMENT BOND 4.2% 29-01-42 EUR 366,200 425,995.14 0.04HELLENIC REPUBLIC GOVERNMENT BOND 4.375% 01-08-22 EUR 2,500,000 2,862,460.27 0.26
TOTAL GREECE 77,134,328.55 6.90
ILIAC TRACTS CAIMANESADS SECURITIES FUNDING LIMITED 6.5% 18-06-23 USD 15,550,000 3,436,472.48 0.31
TOTAL ILIAC TRACTS CAIMANES 3,436,472.48 0.31
ITALYBTPS 4 3/4 09/01/44 EUR 830,000 1,108,063.58 0.10INTESA SAN 7.0% PERP EMTN EUR 2,700,000 2,933,908.31 0.26INTESA SANPA 7.7% PERP CV USD 1,300,000 1,151,470.70 0.10ITALIE 4.75% 01/09/2028 EUR 52,000,000 65,575,450.65 5.88ITALIE 5%09-010325 EUR 750,000 906,638.97 0.08ITALIE 6 7/8% 23 USD 5,000,000 5,052,214.45 0.45ITALY BUONI POLIENNALI DEL TESORO 2.8% 01-12-28 EUR 1,035,000 1,114,023.89 0.10ITALY BUONI POLIENNALI DEL TESORO 3.0% 01-08-29 EUR 21,725,000 23,836,752.82 2.13UNICREDIT SPA 6.625% PERP EUR 3,600,000 3,609,141.54 0.32
TOTAL ITALY 105,287,664.91 9.42
LUXEMBURGVOLKSWAGEN CAR LEASE E1R+0.4% 21-02-24 EUR 6,000,000 2,834,009.97 0.25
TOTAL LUXEMBURG 2,834,009.97 0.25
Portfolio listing of financial instruments
Annual financial statements5.
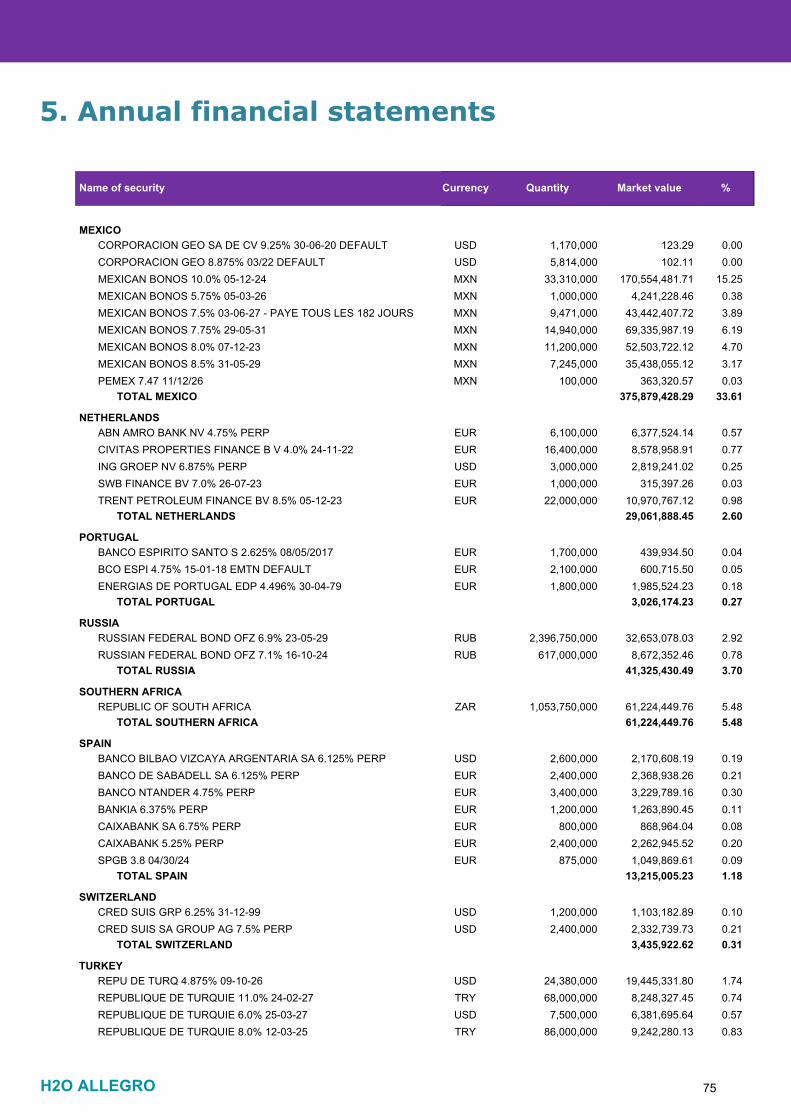
H2O ALLEGRO 75
MEXICOCORPORACION GEO SA DE CV 9.25% 30-06-20 DEFAULT USD 1,170,000 123.29 0.00
Currency Quantity Market value %Name of security
CORPORACION GEO 8.875% 03/22 DEFAULT USD 5,814,000 102.11 0.00MEXICAN BONOS 10.0% 05-12-24 MXN 33,310,000 170,554,481.71 15.25MEXICAN BONOS 5.75% 05-03-26 MXN 1,000,000 4,241,228.46 0.38MEXICAN BONOS 7.5% 03-06-27 - PAYE TOUS LES 182 JOURS MXN 9,471,000 43,442,407.72 3.89MEXICAN BONOS 7.75% 29-05-31 MXN 14,940,000 69,335,987.19 6.19MEXICAN BONOS 8.0% 07-12-23 MXN 11,200,000 52,503,722.12 4.70MEXICAN BONOS 8.5% 31-05-29 MXN 7,245,000 35,438,055.12 3.17PEMEX 7.47 11/12/26 MXN 100,000 363,320.57 0.03
TOTAL MEXICO 375,879,428.29 33.61
NETHERLANDSABN AMRO BANK NV 4.75% PERP EUR 6,100,000 6,377,524.14 0.57CIVITAS PROPERTIES FINANCE B V 4.0% 24-11-22 EUR 16,400,000 8,578,958.91 0.77ING GROEP NV 6.875% PERP USD 3,000,000 2,819,241.02 0.25SWB FINANCE BV 7.0% 26-07-23 EUR 1,000,000 315,397.26 0.03TRENT PETROLEUM FINANCE BV 8.5% 05-12-23 EUR 22,000,000 10,970,767.12 0.98
TOTAL NETHERLANDS 29,061,888.45 2.60
PORTUGALBANCO ESPIRITO SANTO S 2.625% 08/05/2017 EUR 1,700,000 439,934.50 0.04BCO ESPI 4.75% 15-01-18 EMTN DEFAULT EUR 2,100,000 600,715.50 0.05ENERGIAS DE PORTUGAL EDP 4.496% 30-04-79 EUR 1,800,000 1,985,524.23 0.18
TOTAL PORTUGAL 3,026,174.23 0.27
RUSSIARUSSIAN FEDERAL BOND OFZ 6.9% 23-05-29 RUB 2,396,750,000 32,653,078.03 2.92RUSSIAN FEDERAL BOND OFZ 7.1% 16-10-24 RUB 617,000,000 8,672,352.46 0.78
TOTAL RUSSIA 41,325,430.49 3.70
SOUTHERN AFRICAREPUBLIC OF SOUTH AFRICA ZAR 1,053,750,000 61,224,449.76 5.48
TOTAL SOUTHERN AFRICA 61,224,449.76 5.48
SPAINBANCO BILBAO VIZCAYA ARGENTARIA SA 6.125% PERP USD 2,600,000 2,170,608.19 0.19BANCO DE SABADELL SA 6.125% PERP EUR 2,400,000 2,368,938.26 0.21BANCO NTANDER 4.75% PERP EUR 3,400,000 3,229,789.16 0.30BANKIA 6.375% PERP EUR 1,200,000 1,263,890.45 0.11CAIXABANK SA 6.75% PERP EUR 800,000 868,964.04 0.08CAIXABANK 5.25% PERP EUR 2,400,000 2,262,945.52 0.20SPGB 3.8 04/30/24 EUR 875,000 1,049,869.61 0.09
TOTAL SPAIN 13,215,005.23 1.18
SWITZERLANDCRED SUIS GRP 6.25% 31-12-99 USD 1,200,000 1,103,182.89 0.10CRED SUIS SA GROUP AG 7.5% PERP USD 2,400,000 2,332,739.73 0.21
TOTAL SWITZERLAND 3,435,922.62 0.31
TURKEYREPU DE TURQ 4.875% 09-10-26 USD 24,380,000 19,445,331.80 1.74REPUBLIQUE DE TURQUIE 11.0% 24-02-27 TRY 68,000,000 8,248,327.45 0.74REPUBLIQUE DE TURQUIE 6.0% 25-03-27 USD 7,500,000 6,381,695.64 0.57REPUBLIQUE DE TURQUIE 8.0% 12-03-25 TRY 86,000,000 9,242,280.13 0.83
Annual financial statements5.

H2O ALLEGRO 76
TURKEY GOVERNMENT INTL BOND 7.625% 26-04-29 USD 35,250,000 32,865,632.87 2.93
Currency Quantity Market value %Name of security
TURKEY 5 3/4 03/22/24 USD 4,300,000 3,749,594.80 0.34TURQUIE 4.875% 04/43 USD 24,380,000 16,956,424.16 1.52
Total listed bond and similar securities 833,188,220.62 74.53TOTAL TURKEY 96,889,286.85 8.67
Bonds and similar securities not negotiated on a regulated orassimilated market
NETHERLANDSCHAIN FINANCE BV 7.75% 11-08-20 EUR 22,000,000 9,646,472.61 0.86EVEREST MEDTECH BV 5.0% 29-01-24 EUR 10,000,000 2,710,958.90 0.24LA PERLA FASHION FINANCE BV 7.25% 29-03-23 EUR 14,400,000 3,821,956.98 0.34RUBIN ROBOTICS BV 5.0% 29-03-24 EUR 30,000,000 7,889,344.26 0.71TENNOR FINANCE BV 5.75% 17-06-24 EUR 34,000,000 7,823,039.62 0.70
TOTAL Bonds & similar sec. not nego. on reg. market 31,891,772.37 2.85
Total bonds and similar securities 865,079,992.99 77.38
TOTAL NETHERLANDS 31,891,772.37 2.85
Collective investment undertakingsGeneral-purpose UCITS and alternative investment funds intended fornon-professionals and equivalents in other countries
LUXEMBURGQUADRA CAPITAL FX DRIVEN S -A- EUR 2,019.936 2,069,060.84 0.19
TOTAL LUXEMBURG 2,069,060.84 0.19
UNITED KINGDOMH2O ALLEGRETTO Part I C EUR 12,500 1,277,375.00 0.11H2O EUROSOVEREIGN PART I C EUR 1,000 100,430.00 0.01H2O LARGO I C EUR EUR 299,859.0597 31,170,349.26 2.78
TOTAL General-purpose UCITS and alternative investmentfunds intended for non-professionals and equivalents in othercountries
34,617,215.10 3.09
TOTAL UNITED KINGDOM 32,548,154.26 2.90
Other non-European entities
ILIAC TRACTS CAIMANESARCTIC BLUE MASTER FUND H SHARE CLASS USD 45,000 3,660,067.18 0.33
TOTAL Other non-European entities 3,660,067.18 0.33
Total collective investment undertakings 38,277,282.28 3.42
TOTAL ILIAC TRACTS CAIMANES 3,660,067.18 0.33
Transactions involving transfer of financial instrumentsListed bonds and similar securities
DEGROS HOLDING BV 6.5% 17-01-23 EUR 0 -18,128.77 0.00REPU DE TURQ 10.6% 11-02-26 TRY 0 -12,533.81 0.00
Total listed bond and similar securities -30,662.58 0.00
Total transactions involving transfer of financial instruments -30,662.58 0.00
Securities sold under agreements to repurchase
ITALYBTPS 4 3/4 09/01/44 EUR 30,000,000 40,050,490.76 3.58ITALIE 4.75% 01/09/2028 EUR 200,000,000 252,213,271.74 22.56ITALIE 5%09-010325 EUR 15,000,000 18,132,779.35 1.62ITALY BUONI POLIENNALI DEL TESORO 2.8% 01-12-28 EUR 113,000,000 121,627,729.07 10.88
Annual financial statements5.

H2O ALLEGRO 77
ITALY BUONI POLIENNALI DEL TESORO 3.0% 01-08-29 EUR 66,000,000 72,415,451.60 6.48TOTAL ITALY 504,439,722.52 45.12
Currency Quantity Market value %Name of security
MEXICOMEXICAN BONOS 7.5% 03-06-27 - PAYE TOUS LES 182 JOURS MXN 21,400,000 98,159,383.92 8.78
TOTAL Securities sold under agreement to resell 602,599,106.44 53.90
TOTAL MEXICO 98,159,383.92 8.78
Debts representative of securities sold under agreements torepurchase -582,468,681.51 -52.10
Indemnification on securities sold under agreements to repurchase -114,415.62 -0.01
HedgesUrgent commitments closed
Urgent commitments firm on regulated or assimilated marketCBOT USUL 30A 0919 USD 677 2,776,277.66 0.25EUR XEUR FGBX B 0919 EUR -9 -4,320.00 0.00FV CBOT UST 5 0919 USD -34,701 -29,349,401.91 -2.63LIFFE LG GILT 0919 GBP -248 -268,361.65 -0.02TY CBOT YST 1 0919 USD -2,187 -4,127,199.72 -0.37US US TBOND 3 0919 USD -848 -2,561,145.73 -0.23XEUR FBTP BTP 0919 EUR 11,750 60,077,710.00 5.37XEUR FGBL BUN 0919 EUR -5,078 -7,091,800.00 -0.63XEUR FGBM BOB 0919 EUR -4,401 -2,680,310.00 -0.24XEUR FGBS SCH 0919 EUR -4,830 -828,830.00 -0.07XEUR FOAT EUR 0919 EUR 21 55,440.00 0.00XSFE XT AUSTR 0919 AUD -251 -154,865.66 -0.01XSFE YT1 AUST 0919 AUD 703 82,812.15 0.01
Total Firm urgent commitments 15,926,005.14 1.43Total Firm urgent commitments on market reglemente 15,926,005.14 1.43
Commitments with conditional terms
Commitments with conditional terms on OTC marketEUR/USD OTC 07/2019 CALL 1,167 EUR 28,700,000 6,828.27 0.00EUR/USD OTC 07/2019 PUT 1,1025 EUR -28,700,000 -1,078.99 0.00USD/MXN OTC 08/2019 CALL 21 USD -83,000,000 -90,282.94 -0.01USD/MXN OTC 08/2019 PUT 19 USD 83,000,000 455,055.66 0.04USD/TWD OTC 03/2020 PUT 30,1 USD -31,500,000 -265,490.33 -0.02USD/TWD OTC 09/2019 CALL 31,5 USD 126,000,000 543,441.63 0.05
TOTAL Commitments with conditional terms on OTC 648,473.30 0.06
Commitments with conditional terms on regulated or assimilated marketEUREX EURO BUND 07/2019 CALL 174 EUR 700 58,350.00 0.01EUREX EURO BUND 07/2019 PUT 170,5 EUR -700 72,350.00 0.00
TOTAL Commitments with conditional terms 779,173.30 0.07
TOTAL Commitments with conditional terms on regulatedmarket 130,700.00 0.01
Other hedges
Interest rate swapsFIX/7.065/JIBA3R/0.0 ZAR 350,000,000 57.33 0.00FIX/7.075/JIBA3R/0.0 ZAR 350,000,000 75.24 0.00FIX/7.085/JIBA3R/0.0 ZAR 350,000,000 93.16 0.00FIX/7.085/JIBA3R/0.0 ZAR 350,000,000 93.16 0.00
Annual financial statements5.
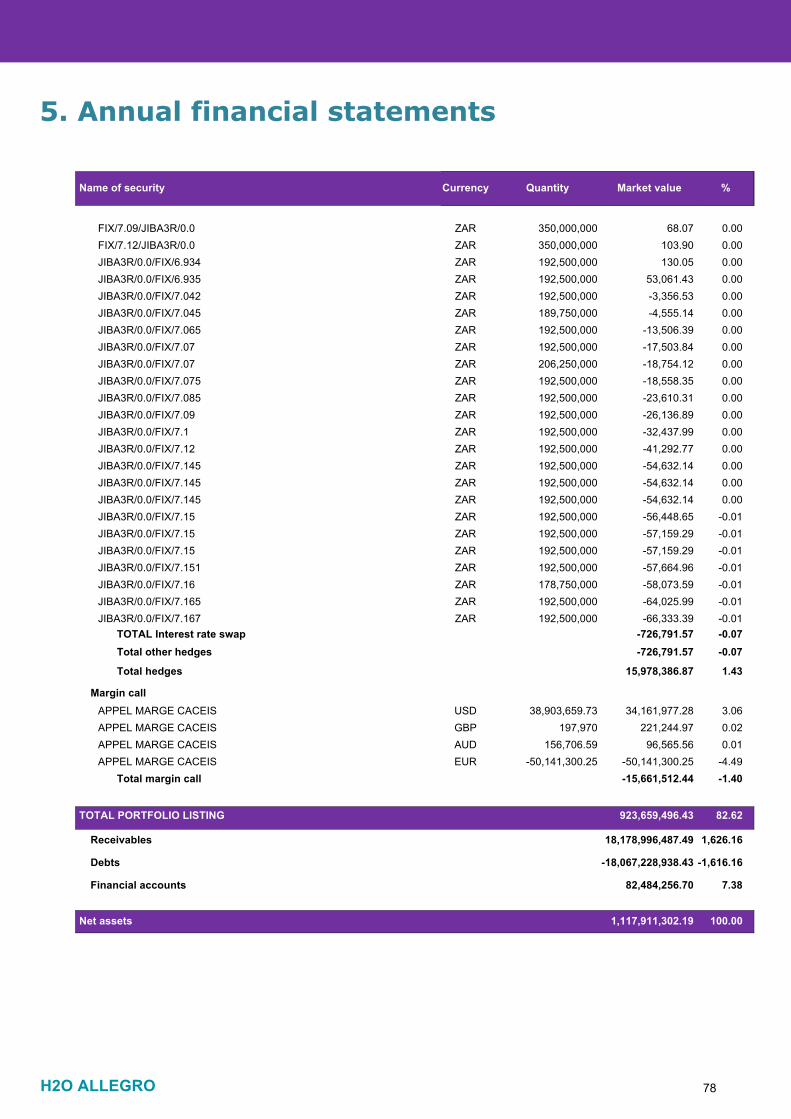
H2O ALLEGRO 78
FIX/7.09/JIBA3R/0.0 ZAR 350,000,000 68.07 0.00
Currency Quantity Market value %Name of security
FIX/7.12/JIBA3R/0.0 ZAR 350,000,000 103.90 0.00JIBA3R/0.0/FIX/6.934 ZAR 192,500,000 130.05 0.00JIBA3R/0.0/FIX/6.935 ZAR 192,500,000 53,061.43 0.00JIBA3R/0.0/FIX/7.042 ZAR 192,500,000 -3,356.53 0.00JIBA3R/0.0/FIX/7.045 ZAR 189,750,000 -4,555.14 0.00JIBA3R/0.0/FIX/7.065 ZAR 192,500,000 -13,506.39 0.00JIBA3R/0.0/FIX/7.07 ZAR 192,500,000 -17,503.84 0.00JIBA3R/0.0/FIX/7.07 ZAR 206,250,000 -18,754.12 0.00JIBA3R/0.0/FIX/7.075 ZAR 192,500,000 -18,558.35 0.00JIBA3R/0.0/FIX/7.085 ZAR 192,500,000 -23,610.31 0.00JIBA3R/0.0/FIX/7.09 ZAR 192,500,000 -26,136.89 0.00JIBA3R/0.0/FIX/7.1 ZAR 192,500,000 -32,437.99 0.00JIBA3R/0.0/FIX/7.12 ZAR 192,500,000 -41,292.77 0.00JIBA3R/0.0/FIX/7.145 ZAR 192,500,000 -54,632.14 0.00JIBA3R/0.0/FIX/7.145 ZAR 192,500,000 -54,632.14 0.00JIBA3R/0.0/FIX/7.145 ZAR 192,500,000 -54,632.14 0.00JIBA3R/0.0/FIX/7.15 ZAR 192,500,000 -56,448.65 -0.01JIBA3R/0.0/FIX/7.15 ZAR 192,500,000 -57,159.29 -0.01JIBA3R/0.0/FIX/7.15 ZAR 192,500,000 -57,159.29 -0.01JIBA3R/0.0/FIX/7.151 ZAR 192,500,000 -57,664.96 -0.01JIBA3R/0.0/FIX/7.16 ZAR 178,750,000 -58,073.59 -0.01JIBA3R/0.0/FIX/7.165 ZAR 192,500,000 -64,025.99 -0.01JIBA3R/0.0/FIX/7.167 ZAR 192,500,000 -66,333.39 -0.01
Total other hedges -726,791.57 -0.07
Total hedges 15,978,386.87 1.43
TOTAL Interest rate swap -726,791.57 -0.07
Margin callAPPEL MARGE CACEIS USD 38,903,659.73 34,161,977.28 3.06APPEL MARGE CACEIS GBP 197,970 221,244.97 0.02APPEL MARGE CACEIS AUD 156,706.59 96,565.56 0.01APPEL MARGE CACEIS EUR -50,141,300.25 -50,141,300.25 -4.49
Total margin call -15,661,512.44 -1.40
TOTAL PORTFOLIO LISTING 923,659,496.43 82.62
Annual financial statements5.
Receivables 18,178,996,487.49 1,626.16
Debts -18,067,228,938.43 -1,616.16
Financial accounts 82,484,256.70 7.38
Net assets 1,117,911,302.19 100.00
ADDITIONAL INFORMATION FOR INVESTORS IN THE FEDERAL REPUBLIC OF GERMANY
The function of the Paying and Information Agent in the Federal Republic of Germany is performed by: CACEIS Bank, Germany Branch Lilienthalallee 34 - 36, D-80939 Munich, Germany (hereinafter: German Paying and Information Agent) Applications for the redemptions and conversion of units may be sent to the German Paying and Information Agent. All payments to investors, including redemption proceeds and potential distributions may be obtained upon request through the German Paying and Information Agent. The following documents may be obtained, free of charge, in hardcopy form at the office of the German Paying and Information Agent:
• the prospectus, • the key investor information document, • the current annual and semi-annual reports, • the Management Regulations, • the custody agreement between the Management Company and CACEIS Bank.
The issue and redemption prices, the net asset value as well as any notices to investors are also available from the German Paying and Information Agent. In addition, the issue and redemption prices are published on www.fundinfo.com and any notices to investors in the Federal Gazette (“www.bundesanzeiger.de”). In addition, communications to investors in the Federal Republic of Germany will be by means of a durable medium (section 167 of the Investment Code) in the following cases:
• suspension of the redemption of the units, • termination of the management of the fund or its liquidation, • any amendments to the fund’s rules which are inconsistent with the previous investment
principles, which affect material investor rights or which relate to remuneration and reimbursement of expenses that may be paid or made out of the asset pool,
• merger of the fund with one or more other funds and • the change of the fund into a feeder fund or the modification of a master fund.
H2O AM LLP Limited Liability Partnership incorporated in England and Wales, authorised by the Financial Services Authority, Under number 529105 10 Old Burlington Street – London W1S 3AG, United Kingdom
![Theoretical studies on the interaction of some endohedral fullerenes {[X@C60]− (X=F−, Cl−, Br−) or [M@C60] (M=Li, Na, K)} with [Al(H2O)6]3+ and [Mg(H2O)6]2+ cations](https://static.fdokumen.com/doc/165x107/63245aa148d448ffa0071bdb/theoretical-studies-on-the-interaction-of-some-endohedral-fullerenes-xc60.jpg)


![Voltammetric Determination of Cocaine in Confiscated Samples Using a Carbon Paste Electrode Modified with Different [UO2(X-MeOsalen)(H2O)].H2O complexes](https://static.fdokumen.com/doc/165x107/63258de1545c645c7f09c2d3/voltammetric-determination-of-cocaine-in-confiscated-samples-using-a-carbon-paste.jpg)


2 e il glutatione](https://static.fdokumen.com/doc/165x107/631e922e0ff042c6110c6b37/studio-chemiometrico-dellinterazione-tra-cu110-orto-fenantrolina2h2oclo42.jpg)


![A new molecular magnetic semiconductor based on tetrathiafulvalene (ttf) and oxamato ligand (opba): [ttf]2[Cu(opba)]·H2O](https://static.fdokumen.com/doc/165x107/6324677548d448ffa0072207/a-new-molecular-magnetic-semiconductor-based-on-tetrathiafulvalene-ttf-and-oxamato.jpg)