Energetic evaluation of a double-effect LiBr-H2O absorption ...
Upload
independentCategory
view
0download
0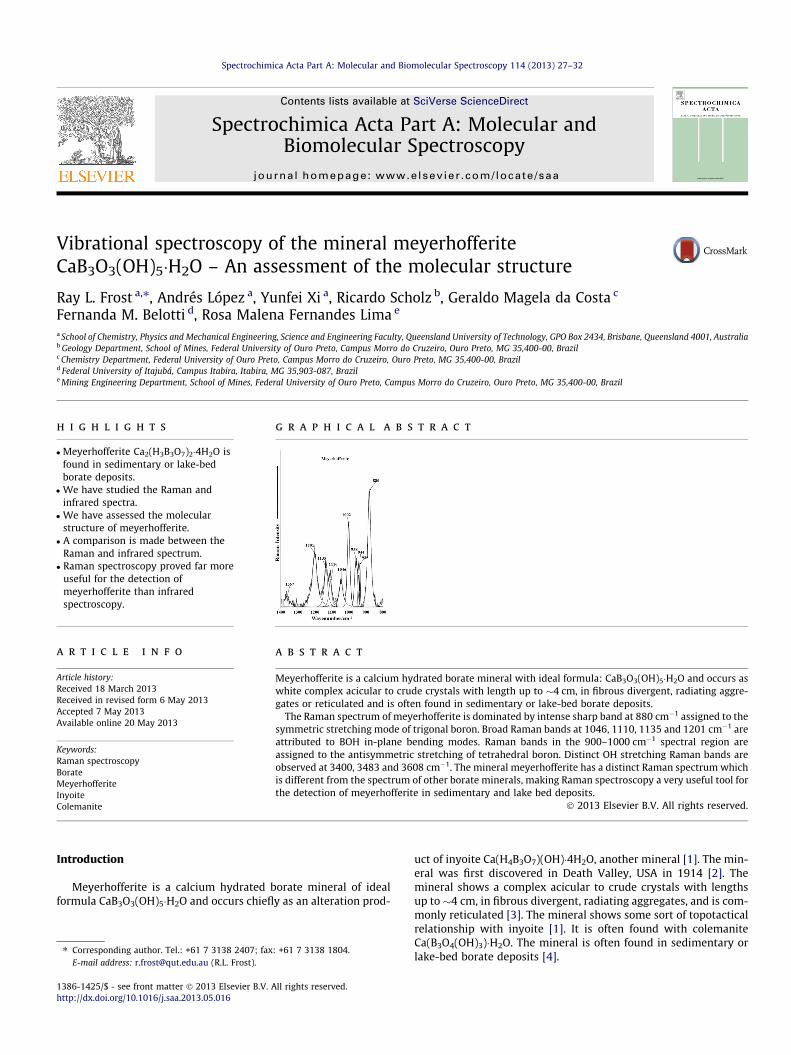
Spectrochimica Acta Part A: Molecular and Biomolecular Spectroscopy 114 (2013) 27–32
Contents lists available at SciVerse ScienceDirect
Spectrochimica Acta Part A: Molecular andBiomolecular Spectroscopy
journal homepage: www.elsevier .com/locate /saa
Vibrational spectroscopy of the mineral meyerhofferiteCaB3O3(OH)5�H2O – An assessment of the molecular structure
1386-1425/$ - see front matter � 2013 Elsevier B.V. All rights reserved.http://dx.doi.org/10.1016/j.saa.2013.05.016
⇑ Corresponding author. Tel.: +61 7 3138 2407; fax: +61 7 3138 1804.E-mail address: [email protected] (R.L. Frost).
Ray L. Frost a,⇑, Andrés López a, Yunfei Xi a, Ricardo Scholz b, Geraldo Magela da Costa c
Fernanda M. Belotti d, Rosa Malena Fernandes Lima e
a School of Chemistry, Physics and Mechanical Engineering, Science and Engineering Faculty, Queensland University of Technology, GPO Box 2434, Brisbane, Queensland 4001, Australiab Geology Department, School of Mines, Federal University of Ouro Preto, Campus Morro do Cruzeiro, Ouro Preto, MG 35,400-00, Brazilc Chemistry Department, Federal University of Ouro Preto, Campus Morro do Cruzeiro, Ouro Preto, MG 35,400-00, Brazild Federal University of Itajubá, Campus Itabira, Itabira, MG 35,903-087, Brazile Mining Engineering Department, School of Mines, Federal University of Ouro Preto, Campus Morro do Cruzeiro, Ouro Preto, MG 35,400-00, Brazil
h i g h l i g h t s
�Meyerhofferite Ca2(H3B3O7)2�4H2O isfound in sedimentary or lake-bedborate deposits.� We have studied the Raman and
infrared spectra.� We have assessed the molecular
structure of meyerhofferite.� A comparison is made between the
Raman and infrared spectrum.� Raman spectroscopy proved far more
useful for the detection ofmeyerhofferite than infraredspectroscopy.
g r a p h i c a l a b s t r a c t
a r t i c l e i n f o
Article history:Received 18 March 2013Received in revised form 6 May 2013Accepted 7 May 2013Available online 20 May 2013
Keywords:Raman spectroscopyBorateMeyerhofferiteInyoiteColemanite
a b s t r a c t
Meyerhofferite is a calcium hydrated borate mineral with ideal formula: CaB3O3(OH)5�H2O and occurs aswhite complex acicular to crude crystals with length up to �4 cm, in fibrous divergent, radiating aggre-gates or reticulated and is often found in sedimentary or lake-bed borate deposits.
The Raman spectrum of meyerhofferite is dominated by intense sharp band at 880 cm�1 assigned to thesymmetric stretching mode of trigonal boron. Broad Raman bands at 1046, 1110, 1135 and 1201 cm�1 areattributed to BOH in-plane bending modes. Raman bands in the 900–1000 cm�1 spectral region areassigned to the antisymmetric stretching of tetrahedral boron. Distinct OH stretching Raman bands areobserved at 3400, 3483 and 3608 cm�1. The mineral meyerhofferite has a distinct Raman spectrum whichis different from the spectrum of other borate minerals, making Raman spectroscopy a very useful tool forthe detection of meyerhofferite in sedimentary and lake bed deposits.
� 2013 Elsevier B.V. All rights reserved.
Introduction
Meyerhofferite is a calcium hydrated borate mineral of idealformula CaB3O3(OH)5�H2O and occurs chiefly as an alteration prod-
uct of inyoite Ca(H4B3O7)(OH)�4H2O, another mineral [1]. The min-eral was first discovered in Death Valley, USA in 1914 [2]. Themineral shows a complex acicular to crude crystals with lengthsup to �4 cm, in fibrous divergent, radiating aggregates, and is com-monly reticulated [3]. The mineral shows some sort of topotacticalrelationship with inyoite [1]. It is often found with colemaniteCa(B3O4(OH)3)�H2O. The mineral is often found in sedimentary orlake-bed borate deposits [4].

28 R.L. Frost et al. / Spectrochimica Acta Part A: Molecular and Biomolecular Spectroscopy 114 (2013) 27–32
Meyerhofferite is triclinic with Point Group: 1 bar [5–7]. Thestructure was first determined by Palache [8] and latter refinedby Burns and Hawthorne [9]. The cell data is space group: P1 witha = 6.632(1) Å, b = 8.337(1) Å, c = 6.4748(6) Å, a = 90.81�(1),b = 101.97�(1), c = 86.76�(1) and Z = 2. The hydrogen bond arrange-ment in the meyerhofferite has been determined [9]. Bonding be-tween the heteropolyhedral chains is through H bonding only,with 6 H bonds along [100], 4 along [010] and 4 between ele-ments of the same heteropolyhedral chain per unit cell. The ther-mal stability of the mineral has been assessed [10,11]. Thisresearch shows the decomposition temperature and mass losses.
Vibrational spectroscopy has been applied to borate glasses[12–15]. There have been a number of studies of borate glassesdoped with a wide range of radioactive atoms [16,17]. Borateglasses are used as a means of containment of radioactive materi-als. There have been a number of studies looking at the effect ofradiation on borate glasses [18,19]. If there is to be an understand-ing of borate glasses and their role in radioactive element contain-ment, then an understanding of the vibrational spectroscopy ofborate minerals needs to be undertaken. The number of vibrationalspectroscopic studies of borate minerals is quite few and far be-tween [20–23]. The number of Raman studies of borate mineralsis also very limited [24,25]. There have been a number of infraredstudies of some natural borates [26–29]. Most of these referencesare not new and there have been no recent studies on the vibra-tional spectroscopy of natural borates. Ross in Farmer’s treatise re-ported the infrared spectra of several borate minerals [30]. The useof infrared spectroscopy is limited by the spatial resolution of thetechnique which is around 25 lm. In comparison, the spatial reso-lution using Raman spectroscopy is 1 lm. Thus, when studying amineral using spectroscopic techniques it is advantageous to useRaman spectroscopy. The selection of the target mineral is moreeasily made. With infrared spectroscopy, any impurities will bemeasured as well as the target mineral.
Yet, there remains the issue of the vibrational spectroscopicstudy of natural borate minerals. In this research, our objective isto study the Raman and infrared spectra of the mineral meyer-hofferite and relate the spectra to the structure of the mineral.
Experimental
Samples and preparation
Off white meyerhofferite single crystals were obtained from thecollection of the Geology Department of the Federal University ofOuro Preto, Minas Gerais, Brazil, with sample code SAA-121. Themineral originated from the Bigadic deposits, Turkey [31–33].Meyerhofferite occurs in evaporate sediments. The crystals are inassociation with other borates such as hydroboracite, inyoite andgypsum. The studied sample was gently crushed and the pure frag-ments were selected under a stereomicroscope Leica MZ4.
X-ray diffraction
X-ray diffractograms were obtained in a Shimadzu XRD 6000diffractometer equipped with an iron tube and a graphite mono-chromator. The scans were done between 10–60� (2h) with a scan-ning speed of 0.5�/min. Silicon was used as an internal standard.Cell parameters were refined by means of the Jade+ program usingleast-square refinement after subtracting the background and theKa2 contribution and using intensity and angular weighting ofthe most intense peaks.
Chemical characterization
Chemical study was done with support of Scanning ElectronMicroscopy (SEM) and Electron Microprobe (EMP). Experiments
and analyses involving electron microscopy were performed in theCenter of Microscopy of the Federal University of Minas Gerais, BeloHorizonte, Minas Gerais, Brazil (http://www.microscopia.ufmg.br).
Meyerhofferite crystals were coated with a 5 nm layer of evap-orated carbon. Secondary Electron and Backscattering Electronimages were obtained using a JEOL JSM-6360LV equipment. Qual-itative and semi-quantitative chemical analyses in the EDS modewere performed with a ThermoNORAN spectrometer model Questand was applied to support the mineral characterization and todetermine potential contaminants or chemical zonation.
A quantitative chemical analysis was carried via EMP. A meyer-hofferite fragment selected for this study was analyzed with theperformance of four spots. The chemical analysis was carried outwith a Jeol JXA8900R spectrometer from the Physics Departmentof the Federal University of Minas Gerais, Belo Horizonte. For eachselected element was used the following standards: Fe – Magne-tite, Mn – Rodhonite, Zn – Sphalerite, F – Fluorite, As – Arsenopy-rite, P – Ca2P2O7, Ca, Si and Al – Anorthite100 and Mg – MgO. Theepoxy embedded meyerhofferite sample was polished in the se-quence of 9 lm, 6 lm and 1 lm diamond paste MetaDI� II Dia-mond Paste – Buhler, using water as a lubricant, with a semi-automatic MiniMet� 1000 Grinder–Polisher – Buehler. Finally,the epoxy embedded sample was coated with a thin layer of evap-orated carbon. The electron probe microanalysis in the WDS(wavelength dispersive spectrometer) mode was obtained at15 kV accelerating voltage and beam current of 10 nA. Chemicalformula was calculated on the basis of nine oxygen atoms.
Raman spectroscopy
Crystals of meyerhofferite were placed on a polished metal sur-face on the stage of an Olympus BHSM microscope, which isequipped with 10�, 20�, and 50� objectives. The microscope ispart of a Renishaw 1000 Raman microscope system, which also in-cludes a monochromator, a filter system and a CCD detector(1024 pixels). The Raman spectra were excited by a Spectra-Phys-ics model 127 He–Ne laser producing highly polarized light at633 nm and collected at a nominal resolution of 2 cm�1 and a pre-cision of ±1 cm�1 in the range between 200 and 4000 cm�1. Re-peated acquisitions on the crystals using the highestmagnification (50�) were accumulated to improve the signal tonoise ratio of the spectra. Spectra were calibrated using the520.5 cm�1 line of a silicon wafer. The Raman spectrum of at least10 crystals was collected to ensure the consistency of the spectra.
Infrared spectroscopy
Infrared spectra were obtained using a Nicolet Nexus 870 FTIRspectrometer with a smart endurance single bounce diamondATR cell. Spectra over the 4000–525 cm�1 range were obtainedby the co-addition of 128 scans with a resolution of 4 cm�1 and amirror velocity of 0.6329 cm/s. Spectra were co-added to improvethe signal to noise ratio.
Spectral manipulation such as baseline correction/adjustmentand smoothing were performed using the Spectracalc softwarepackage GRAMS (Galactic Industries Corporation, NH, USA). Bandcomponent analysis was undertaken using the Jandel ‘Peakfit’ soft-ware package that enabled the type of fitting function to be se-lected and allows specific parameters to be fixed or variedaccordingly. Band fitting was done using a Lorentzian–Gaussiancross-product function with the minimum number of componentbands used for the fitting process. The Gaussian–Lorentzian ratiowas maintained at values greater than 0.7 and fitting was under-taken until reproducible results were obtained with squared corre-lations of r2 greater than 0.995.
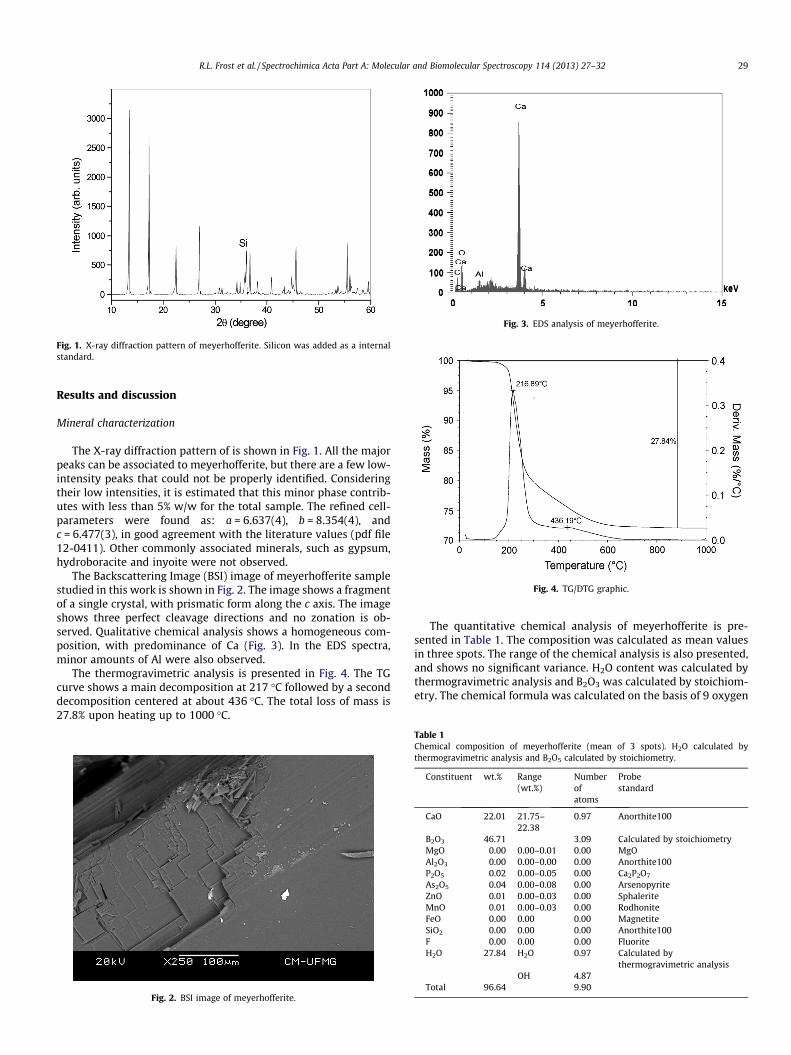
Fig. 1. X-ray diffraction pattern of meyerhofferite. Silicon was added as a internalstandard.
Fig. 3. EDS analysis of meyerhofferite.
Fig. 4. TG/DTG graphic.
R.L. Frost et al. / Spectrochimica Acta Part A: Molecular and Biomolecular Spectroscopy 114 (2013) 27–32 29
Results and discussion
Mineral characterization
The X-ray diffraction pattern of is shown in Fig. 1. All the majorpeaks can be associated to meyerhofferite, but there are a few low-intensity peaks that could not be properly identified. Consideringtheir low intensities, it is estimated that this minor phase contrib-utes with less than 5% w/w for the total sample. The refined cell-parameters were found as: a = 6.637(4), b = 8.354(4), andc = 6.477(3), in good agreement with the literature values (pdf file12-0411). Other commonly associated minerals, such as gypsum,hydroboracite and inyoite were not observed.
The Backscattering Image (BSI) image of meyerhofferite samplestudied in this work is shown in Fig. 2. The image shows a fragmentof a single crystal, with prismatic form along the c axis. The imageshows three perfect cleavage directions and no zonation is ob-served. Qualitative chemical analysis shows a homogeneous com-position, with predominance of Ca (Fig. 3). In the EDS spectra,minor amounts of Al were also observed.
The thermogravimetric analysis is presented in Fig. 4. The TGcurve shows a main decomposition at 217 �C followed by a seconddecomposition centered at about 436 �C. The total loss of mass is27.8% upon heating up to 1000 �C.
Fig. 2. BSI image of meyerhofferite.
The quantitative chemical analysis of meyerhofferite is pre-sented in Table 1. The composition was calculated as mean valuesin three spots. The range of the chemical analysis is also presented,and shows no significant variance. H2O content was calculated bythermogravimetric analysis and B2O3 was calculated by stoichiom-etry. The chemical formula was calculated on the basis of 9 oxygen
Table 1Chemical composition of meyerhofferite (mean of 3 spots). H2O calculated bythermogravimetric analysis and B2O5 calculated by stoichiometry.
Constituent wt.% Range(wt.%)
Numberofatoms
Probestandard
CaO 22.01 21.75–22.38
0.97 Anorthite100
B2O3 46.71 3.09 Calculated by stoichiometryMgO 0.00 0.00–0.01 0.00 MgOAl2O3 0.00 0.00–0.00 0.00 Anorthite100P2O5 0.02 0.00–0.05 0.00 Ca2P2O7
As2O5 0.04 0.00–0.08 0.00 ArsenopyriteZnO 0.01 0.00–0.03 0.00 SphaleriteMnO 0.01 0.00–0.03 0.00 RodhoniteFeO 0.00 0.00 0.00 MagnetiteSiO2 0.00 0.00 0.00 Anorthite100F 0.00 0.00 0.00 FluoriteH2O 27.84 H2O 0.97 Calculated by
thermogravimetric analysisOH 4.87
Total 96.64 9.90
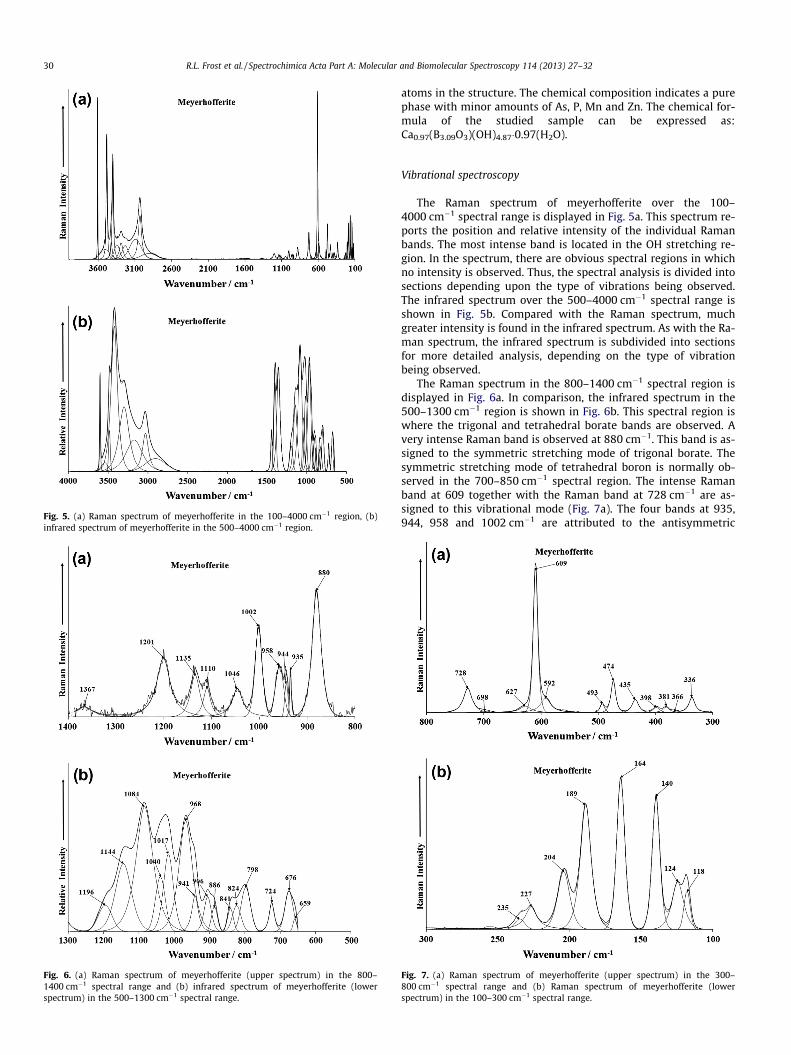
Fig. 5. (a) Raman spectrum of meyerhofferite in the 100–4000 cm�1 region, (b)infrared spectrum of meyerhofferite in the 500–4000 cm�1 region.
Fig. 6. (a) Raman spectrum of meyerhofferite (upper spectrum) in the 800–1400 cm�1 spectral range and (b) infrared spectrum of meyerhofferite (lowerspectrum) in the 500–1300 cm�1 spectral range.
30 R.L. Frost et al. / Spectrochimica Acta Part A: Molecular and Biomolecular Spectroscopy 114 (2013) 27–32
atoms in the structure. The chemical composition indicates a purephase with minor amounts of As, P, Mn and Zn. The chemical for-mula of the studied sample can be expressed as:Ca0.97(B3.09O3)(OH)4.87�0.97(H2O).
Vibrational spectroscopy
The Raman spectrum of meyerhofferite over the 100–4000 cm�1 spectral range is displayed in Fig. 5a. This spectrum re-ports the position and relative intensity of the individual Ramanbands. The most intense band is located in the OH stretching re-gion. In the spectrum, there are obvious spectral regions in whichno intensity is observed. Thus, the spectral analysis is divided intosections depending upon the type of vibrations being observed.The infrared spectrum over the 500–4000 cm�1 spectral range isshown in Fig. 5b. Compared with the Raman spectrum, muchgreater intensity is found in the infrared spectrum. As with the Ra-man spectrum, the infrared spectrum is subdivided into sectionsfor more detailed analysis, depending on the type of vibrationbeing observed.
The Raman spectrum in the 800–1400 cm�1 spectral region isdisplayed in Fig. 6a. In comparison, the infrared spectrum in the500–1300 cm�1 region is shown in Fig. 6b. This spectral region iswhere the trigonal and tetrahedral borate bands are observed. Avery intense Raman band is observed at 880 cm�1. This band is as-signed to the symmetric stretching mode of trigonal borate. Thesymmetric stretching mode of tetrahedral boron is normally ob-served in the 700–850 cm�1 spectral region. The intense Ramanband at 609 together with the Raman band at 728 cm�1 are as-signed to this vibrational mode (Fig. 7a). The four bands at 935,944, 958 and 1002 cm�1 are attributed to the antisymmetric
Fig. 7. (a) Raman spectrum of meyerhofferite (upper spectrum) in the 300–800 cm�1 spectral range and (b) Raman spectrum of meyerhofferite (lowerspectrum) in the 100–300 cm�1 spectral range.
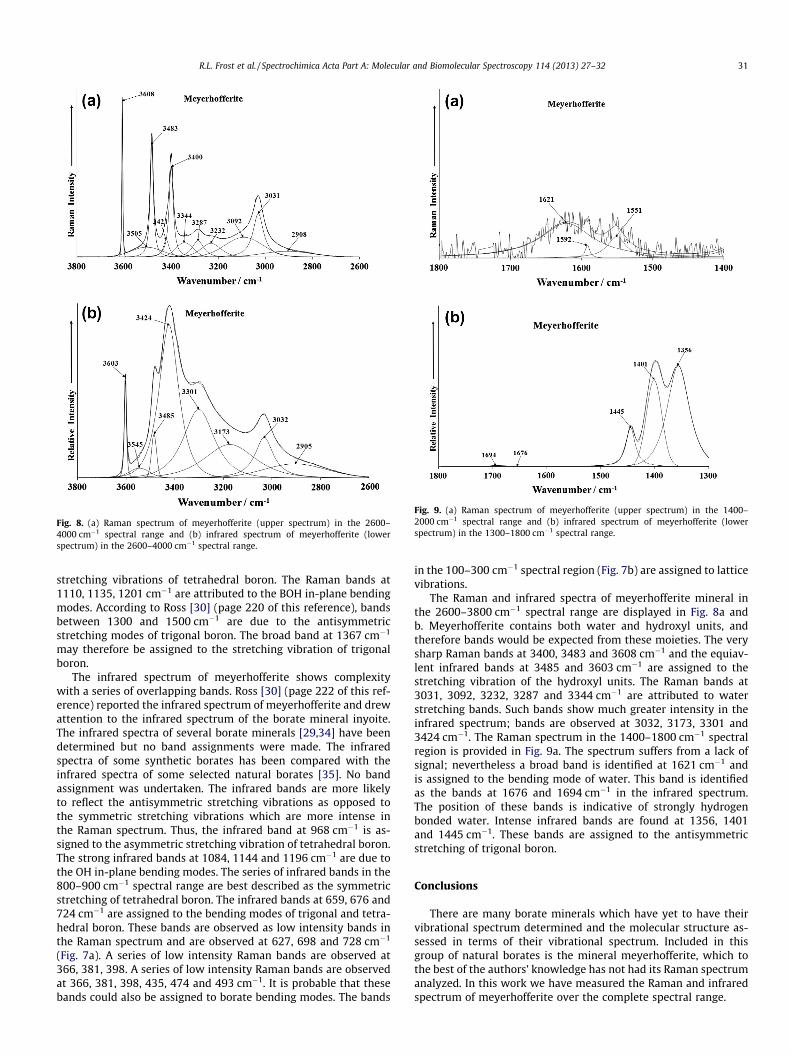
Fig. 8. (a) Raman spectrum of meyerhofferite (upper spectrum) in the 2600–4000 cm�1 spectral range and (b) infrared spectrum of meyerhofferite (lowerspectrum) in the 2600–4000 cm�1 spectral range.
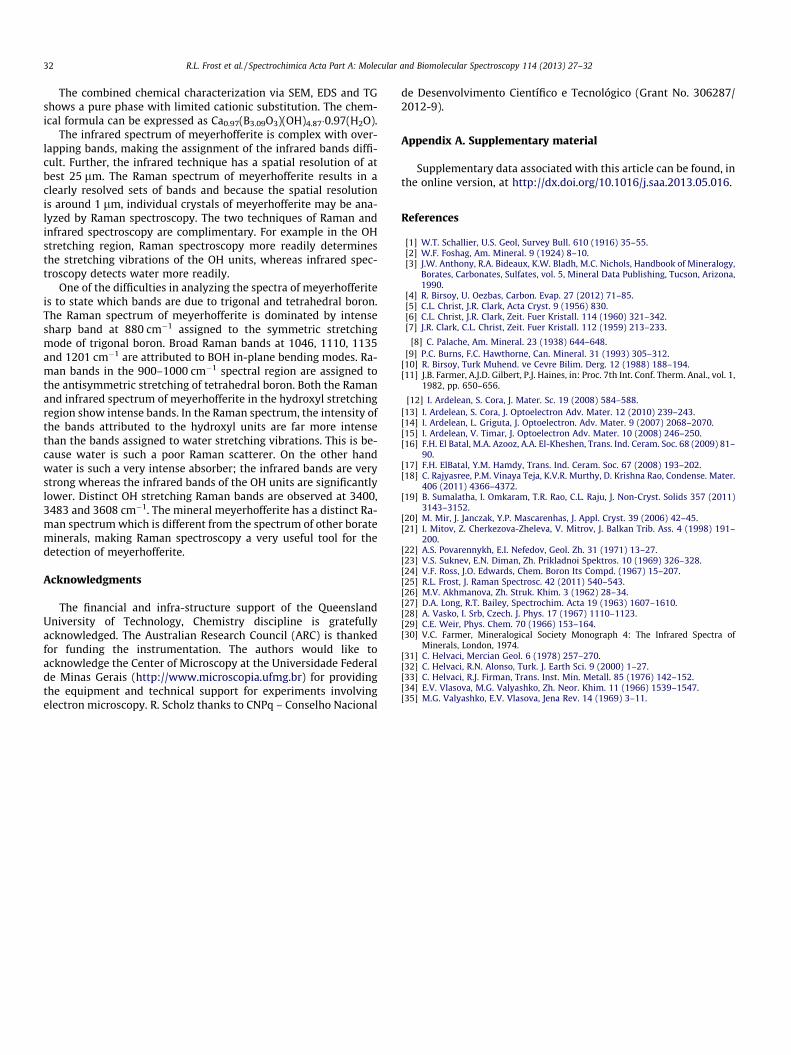
Fig. 9. (a) Raman spectrum of meyerhofferite (upper spectrum) in the 1400–2000 cm�1 spectral range and (b) infrared spectrum of meyerhofferite (lowerspectrum) in the 1300–1800 cm�1 spectral range.
R.L. Frost et al. / Spectrochimica Acta Part A: Molecular and Biomolecular Spectroscopy 114 (2013) 27–32 31
stretching vibrations of tetrahedral boron. The Raman bands at1110, 1135, 1201 cm�1 are attributed to the BOH in-plane bendingmodes. According to Ross [30] (page 220 of this reference), bandsbetween 1300 and 1500 cm�1 are due to the antisymmetricstretching modes of trigonal boron. The broad band at 1367 cm�1
may therefore be assigned to the stretching vibration of trigonalboron.
The infrared spectrum of meyerhofferite shows complexitywith a series of overlapping bands. Ross [30] (page 222 of this ref-erence) reported the infrared spectrum of meyerhofferite and drewattention to the infrared spectrum of the borate mineral inyoite.The infrared spectra of several borate minerals [29,34] have beendetermined but no band assignments were made. The infraredspectra of some synthetic borates has been compared with theinfrared spectra of some selected natural borates [35]. No bandassignment was undertaken. The infrared bands are more likelyto reflect the antisymmetric stretching vibrations as opposed tothe symmetric stretching vibrations which are more intense inthe Raman spectrum. Thus, the infrared band at 968 cm�1 is as-signed to the asymmetric stretching vibration of tetrahedral boron.The strong infrared bands at 1084, 1144 and 1196 cm�1 are due tothe OH in-plane bending modes. The series of infrared bands in the800–900 cm�1 spectral range are best described as the symmetricstretching of tetrahedral boron. The infrared bands at 659, 676 and724 cm�1 are assigned to the bending modes of trigonal and tetra-hedral boron. These bands are observed as low intensity bands inthe Raman spectrum and are observed at 627, 698 and 728 cm�1
(Fig. 7a). A series of low intensity Raman bands are observed at366, 381, 398. A series of low intensity Raman bands are observedat 366, 381, 398, 435, 474 and 493 cm�1. It is probable that thesebands could also be assigned to borate bending modes. The bands
in the 100–300 cm�1 spectral region (Fig. 7b) are assigned to latticevibrations.
The Raman and infrared spectra of meyerhofferite mineral inthe 2600–3800 cm�1 spectral range are displayed in Fig. 8a andb. Meyerhofferite contains both water and hydroxyl units, andtherefore bands would be expected from these moieties. The verysharp Raman bands at 3400, 3483 and 3608 cm�1 and the equiav-lent infrared bands at 3485 and 3603 cm�1 are assigned to thestretching vibration of the hydroxyl units. The Raman bands at3031, 3092, 3232, 3287 and 3344 cm�1 are attributed to waterstretching bands. Such bands show much greater intensity in theinfrared spectrum; bands are observed at 3032, 3173, 3301 and3424 cm�1. The Raman spectrum in the 1400–1800 cm�1 spectralregion is provided in Fig. 9a. The spectrum suffers from a lack ofsignal; nevertheless a broad band is identified at 1621 cm�1 andis assigned to the bending mode of water. This band is identifiedas the bands at 1676 and 1694 cm�1 in the infrared spectrum.The position of these bands is indicative of strongly hydrogenbonded water. Intense infrared bands are found at 1356, 1401and 1445 cm�1. These bands are assigned to the antisymmetricstretching of trigonal boron.
Conclusions
There are many borate minerals which have yet to have theirvibrational spectrum determined and the molecular structure as-sessed in terms of their vibrational spectrum. Included in thisgroup of natural borates is the mineral meyerhofferite, which tothe best of the authors’ knowledge has not had its Raman spectrumanalyzed. In this work we have measured the Raman and infraredspectrum of meyerhofferite over the complete spectral range.
32 R.L. Frost et al. / Spectrochimica Acta Part A: Molecular and Biomolecular Spectroscopy 114 (2013) 27–32
The combined chemical characterization via SEM, EDS and TGshows a pure phase with limited cationic substitution. The chem-ical formula can be expressed as Ca0.97(B3.09O3)(OH)4.87�0.97(H2O).
The infrared spectrum of meyerhofferite is complex with over-lapping bands, making the assignment of the infrared bands diffi-cult. Further, the infrared technique has a spatial resolution of atbest 25 lm. The Raman spectrum of meyerhofferite results in aclearly resolved sets of bands and because the spatial resolutionis around 1 lm, individual crystals of meyerhofferite may be ana-lyzed by Raman spectroscopy. The two techniques of Raman andinfrared spectroscopy are complimentary. For example in the OHstretching region, Raman spectroscopy more readily determinesthe stretching vibrations of the OH units, whereas infrared spec-troscopy detects water more readily.
One of the difficulties in analyzing the spectra of meyerhofferiteis to state which bands are due to trigonal and tetrahedral boron.The Raman spectrum of meyerhofferite is dominated by intensesharp band at 880 cm�1 assigned to the symmetric stretchingmode of trigonal boron. Broad Raman bands at 1046, 1110, 1135and 1201 cm�1 are attributed to BOH in-plane bending modes. Ra-man bands in the 900–1000 cm�1 spectral region are assigned tothe antisymmetric stretching of tetrahedral boron. Both the Ramanand infrared spectrum of meyerhofferite in the hydroxyl stretchingregion show intense bands. In the Raman spectrum, the intensity ofthe bands attributed to the hydroxyl units are far more intensethan the bands assigned to water stretching vibrations. This is be-cause water is such a poor Raman scatterer. On the other handwater is such a very intense absorber; the infrared bands are verystrong whereas the infrared bands of the OH units are significantlylower. Distinct OH stretching Raman bands are observed at 3400,3483 and 3608 cm�1. The mineral meyerhofferite has a distinct Ra-man spectrum which is different from the spectrum of other borateminerals, making Raman spectroscopy a very useful tool for thedetection of meyerhofferite.
Acknowledgments
The financial and infra-structure support of the QueenslandUniversity of Technology, Chemistry discipline is gratefullyacknowledged. The Australian Research Council (ARC) is thankedfor funding the instrumentation. The authors would like toacknowledge the Center of Microscopy at the Universidade Federalde Minas Gerais (http://www.microscopia.ufmg.br) for providingthe equipment and technical support for experiments involvingelectron microscopy. R. Scholz thanks to CNPq – Conselho Nacional
de Desenvolvimento Científico e Tecnológico (Grant No. 306287/2012-9).
Appendix A. Supplementary material
Supplementary data associated with this article can be found, inthe online version, at http://dx.doi.org/10.1016/j.saa.2013.05.016.
References
[1] W.T. Schallier, U.S. Geol, Survey Bull. 610 (1916) 35–55.[2] W.F. Foshag, Am. Mineral. 9 (1924) 8–10.[3] J.W. Anthony, R.A. Bideaux, K.W. Bladh, M.C. Nichols, Handbook of Mineralogy,
Borates, Carbonates, Sulfates, vol. 5, Mineral Data Publishing, Tucson, Arizona,1990.
[4] R. Birsoy, U. Oezbas, Carbon. Evap. 27 (2012) 71–85.[5] C.L. Christ, J.R. Clark, Acta Cryst. 9 (1956) 830.[6] C.L. Christ, J.R. Clark, Zeit. Fuer Kristall. 114 (1960) 321–342.[7] J.R. Clark, C.L. Christ, Zeit. Fuer Kristall. 112 (1959) 213–233.
[8] C. Palache, Am. Mineral. 23 (1938) 644–648.[9] P.C. Burns, F.C. Hawthorne, Can. Mineral. 31 (1993) 305–312.
[10] R. Birsoy, Turk Muhend. ve Cevre Bilim. Derg. 12 (1988) 188–194.[11] J.B. Farmer, A.J.D. Gilbert, P.J. Haines, in: Proc. 7th Int. Conf. Therm. Anal., vol. 1,
1982, pp. 650–656.
[12] I. Ardelean, S. Cora, J. Mater. Sc. 19 (2008) 584–588.[13] I. Ardelean, S. Cora, J. Optoelectron Adv. Mater. 12 (2010) 239–243.[14] I. Ardelean, L. Griguta, J. Optoelectron. Adv. Mater. 9 (2007) 2068–2070.[15] I. Ardelean, V. Timar, J. Optoelectron Adv. Mater. 10 (2008) 246–250.[16] F.H. El Batal, M.A. Azooz, A.A. El-Kheshen, Trans. Ind. Ceram. Soc. 68 (2009) 81–
90.[17] F.H. ElBatal, Y.M. Hamdy, Trans. Ind. Ceram. Soc. 67 (2008) 193–202.[18] C. Rajyasree, P.M. Vinaya Teja, K.V.R. Murthy, D. Krishna Rao, Condense. Mater.
406 (2011) 4366–4372.[19] B. Sumalatha, I. Omkaram, T.R. Rao, C.L. Raju, J. Non-Cryst. Solids 357 (2011)
3143–3152.[20] M. Mir, J. Janczak, Y.P. Mascarenhas, J. Appl. Cryst. 39 (2006) 42–45.[21] I. Mitov, Z. Cherkezova-Zheleva, V. Mitrov, J. Balkan Trib. Ass. 4 (1998) 191–
200.[22] A.S. Povarennykh, E.I. Nefedov, Geol. Zh. 31 (1971) 13–27.[23] V.S. Suknev, E.N. Diman, Zh. Prikladnoi Spektros. 10 (1969) 326–328.[24] V.F. Ross, J.O. Edwards, Chem. Boron Its Compd. (1967) 15–207.[25] R.L. Frost, J. Raman Spectrosc. 42 (2011) 540–543.[26] M.V. Akhmanova, Zh. Struk. Khim. 3 (1962) 28–34.[27] D.A. Long, R.T. Bailey, Spectrochim. Acta 19 (1963) 1607–1610.[28] A. Vasko, I. Srb, Czech. J. Phys. 17 (1967) 1110–1123.[29] C.E. Weir, Phys. Chem. 70 (1966) 153–164.[30] V.C. Farmer, Mineralogical Society Monograph 4: The Infrared Spectra of
Minerals, London, 1974.[31] C. Helvaci, Mercian Geol. 6 (1978) 257–270.[32] C. Helvaci, R.N. Alonso, Turk. J. Earth Sci. 9 (2000) 1–27.[33] C. Helvaci, R.J. Firman, Trans. Inst. Min. Metall. 85 (1976) 142–152.[34] E.V. Vlasova, M.G. Valyashko, Zh. Neor. Khim. 11 (1966) 1539–1547.[35] M.G. Valyashko, E.V. Vlasova, Jena Rev. 14 (1969) 3–11.
Copyright © 2022 FDOKUMEN


![Voltammetric Determination of Cocaine in Confiscated Samples Using a Carbon Paste Electrode Modified with Different [UO2(X-MeOsalen)(H2O)].H2O complexes](https://static.fdokumen.com/doc/165x107/63258de1545c645c7f09c2d3/voltammetric-determination-of-cocaine-in-confiscated-samples-using-a-carbon-paste.jpg)