The Digital Water Utility of the Future
37
A Whitepaper on the Enablers, Applications and Risks of Digitalisation for the Global Water Research Coalition Global Water Research Coalition The Digital Water Utility of the Future
-
Upload
khangminh22 -
Category
Documents
-
view
0 -
download
0
Transcript of The Digital Water Utility of the Future

A Whitepaper on the Enablers, Applications and Risks of Digitalisation for the Global Water Research CoalitionGlobal Water
Research Coalition
The Digital Water Utility of the Future

The digital age is here and developing at an extremely rapid pacei. New technologies and tools can offer convenience, efficiency and cost savings to customers and businesses alike. Internet, email, mobile phones, SMSs, digital maps and online banking are all an integral part of everyday life for water utility customers as well as staff.
Internationally, water utilities in the digital space are starting to adopt remote monitoring and system automation. Typically, installations commence with the trialling and adoption of smart metering and using sensors and monitors on water mains to manage leakage, water loss and pressure. Many are improving their customer interfaces and communication channels to benefit customers as well as improve business efficiency. Drones are starting to be used for high-risk or hazardous manual tasks. Further opportunities abound in smart controls, self-learning algorithms and machine-to-machine communications that can read SCADA, sensor and monitoring data, develop and implement a course of action with little human interaction.
Business insights can now be generated in real time through computer assisted analytics on multiple, disparate data sets. Correlations, opportunities and upcoming challenges can be identified and addressed. The solutions range from improving business efficiency to assessment of environmental impacts. Driving outcomes as varied as lower customer bills to reductions in embedded and operational carbon use. Where this is done across multiple sectors, such as between water and transport, or water and energy, there can be significant opportunities to enhance customer value, improve business efficiency and minimise peaks and disruptions.
The effective implementation of digitalisation requires addressing several key challenges. These include effective engagement of senior management, the development of a cross business digital strategy encompassing integrated:
• Data sharing between business units;
• Approaches to data security, privacy and ethics;
• Understanding of interdependencies within the business and with external customers and stakeholders;
• Reporting of key metrics and data summary to provide a single version of the business to drive effective decision-making.
This paper suggests a four-part approach to digital maturity (Figure 1) designed to complement the IWA Digital Water Report. This report is structured from internal focus (left) to an increasingly external focus (right). Potential benefits from digitalisation are achievable at each stage. The internal approach starts with improving business maturity within business groups (far left) to establishing strong cross business integration (centre left), enhancing the interface with customers and suppliers (centre right), then finally leveraging tighter integration with the community and external agencies (far right). Whilst these stages are comparable to a business maturity model, the difference is that digital technology is allowing these advances in maturity to occur with greater ease and rapidity than in the past. Customers are starting to see many of these changes in businesses they interact with. Consequently, they are likely to expect and demand the outcomes that these advances can deliver from all their service providers.
Executive Summary
/1The Digital Water Utility of the Future

Utilities are at different stages of digital maturity, often with a mixture of components from each stage. While a step-wise approach is not needed, jumping to an external focus without first having prepared the internal business for digitalisation can limit a utility’s ability to store, manage or extract the maximum value from the data collected and systems installed.
Whilst there are many benefits from digitalisation (Figure 1) there are also challenges and risks. Realising the full potential of digitalisation means considering a more integrated business, both internally and externally. This has implications for not only the business structure and supporting business tools, but the culture and skills required to deliver. Externally, the changing nature of customer interactions and expectations are moving towards ever greater transparency and the need to source information in real time where possible. The integration and sharing of data with external businesses provides untapped potential, but the business model for doing this and who is best positioned to extract full value from the available data is currently unclear.
The relatively new nature of digitisation can often make the risks seem daunting. The obvious risks of cybersecurity and data privacy occur at all stages and become greater as we move to more collaboration with external agencies. Protecting data communicated through the Internet of Things (IoT; internet-based machine to machine communications) is particularly significant because there are currently few standards, protocols and regulations in this area. The rapid pace of change in digital technology can make it hard for utilities to keep up with new developments, and optimising deployment is a constant challenge. The most prominent risk
in this area is that of supplier dependency - becoming locked into proprietary software and tools.
However, the most critical risk for the digital utility is people, both in terms of change management and access to skills. Digitalisation presents some level of business disruption. It is essential that the change is well managed with staff. This includes good communication, consideration of cultural aspects and ensuring the right skill set to support the business moving forward. Skill shortage is an emerging risk as many businesses (not just water) simultaneously embrace the digital age and data analysts become in high demand. This is possibly more acute because the skills likely to be valuable in a mature digital utility such as IT, technology and data analysis have not traditionally been core business functions for water utilities. The digital age is challenging us to expand our skill set, engage with a new set of experts to extract maximum value for our customers and our businesses.
Slow adoption or movement to becoming a digital utility may not seem like a major risk. In the past there has not been a significant penalty for water utilities not moving with the latest technology or approaches. This is unlikely to continue. The mass connectivity and influence enabled by the internet is providing individuals with significant ability to affect even some of the more conservative parts of society. This coupled with customer expectations around transparency and timeliness of information means the industry needs to pay attention to the sleeping risk of slow adoption. Adding further pressure is the fact that regulators such as OFWAT are increasingly looking for data and evidence to support the assumptions made in water company investment plans.
/2The Digital Water Utility of the Future

In addition, the ongoing challenges of urbanisation coupled with climate disruption are pushing towards more integrated and resilient urban systems. The design of resilient systems can benefit greatly from using the correct digital tools based on sufficient data. Implementation of these systems can be promoted through digital stakeholder involvement tools, which again require data and understanding of the system.
This discussion paper lays out the many opportunities the digital age offers water utilities, along with the risks and challenges, and how these can be managed.
Figure 1: The four components of a mature digital water utility, from an internal focus (left) moving to an increasingly external focus (right).
/3The Digital Water Utility of the Future

Contents
Executive Summary ................................................................................................................................................................................................1
1. Introduction ............................................................................................................................................................................................................5
2 .Definitions ...............................................................................................................................................................................................................6
3. Enablers for Digitalisation ...............................................................................................................................................................................7
a. Technology .............................................................................................................................................................................................................................7
b. Leadership and Work Culture ................................................................................................................................................................................... 9
c. Internal Capabilities ......................................................................................................................................................................................................... 9
4. Opportunities for Digitalisation ................................................................................................................................................................ 10 (description on what different levels of maturity look like and what it means to move between each level)
a. Efficiencies within Business Units .........................................................................................................................................................................10
b. Integration between Business Units .................................................................................................................................................................. 14
c. Enhancing Customer/Supplier Interface ........................................................................................................................................................ 15
d. Integrating with Community .................................................................................................................................................................................... 19
5. Barriers & Mitigation Measures (brief description) ............................................................................................................................21
a. Leadership and Organisation Culture ................................................................................................................................................................ 21
b. Obsolescence of IT Infrastructure and stranded IT Infrastructure .................................................................................................22
c. Security Management ..................................................................................................................................................................................................23
d. Valuing and securing data ........................................................................................................................................................................................25
6. Case Studies .......................................................................................................................................................................................................26
7. References ........................................................................................................................................................................................................... 33
/4The Digital Water Utility of the Future

/5The Digital Water Utility of the Future
Digitalisation offers a wide range of opportunities for enhancing or re-imagining existing business processes in order to reduce cost, speed up resolution, minimise human intervention, assist decision-making and improve the customer experience. It diversifies our available approaches to address emerging challenges and external developments such as climate change and manage the densification of cities. There are opportunities along the entire system including supply sources, network maintenance, network performance, customer interactions and market-based trading. The ability to gather, analyse
and interpret large quantities of disparate data combined with automation are key enablers. The ability to harness large amounts of disparate data is particularly powerful when combined with the ability to optimise system design, performance and resilience using models and optimization tools. The speed of data analytics and advances in monitoring devices bring about opportunities for optimisation not previously been recognised or achievable. The outcome is better service and value for customers through more proactive, informed and timely decision making that is hopefully holistic and context sensitive.
1 Introduction
/5The Digital Water Utility of the Future

/6The Digital Water Utility of the Future
2 Definitions
Artificial intelligence – the theory and development of computer systems able to perform tasks normally requiring human intelligence, such as visual perception, speech recognition, decision-making, and translation between languages (Oxford Dictionary).
Augmented reality – computer-generated content overlaid on a real-world environment.
Blockchain – a technology that allows digital information to be distributed and certified in a way that is tamper proof in a way where each individual piece of data can only have one owner.
Cloud Computing - the practice of using a network of remote servers hosted on the Internet to store, manage, and process data, rather than a local server or a personal computer (Oxford Dictionary)
Data as a Service – a management strategy that uses cloud computing to deliver data storage, integration, processing and/or analytics services. This service is provided by a third party external to the business.
Digitalisation – the use of digital technologies to change a business model in order to deliver new revenue and value-producing opportunities ii. In this paper, the term digitalisation is used interchangeably with ‘going digital’ and ‘digital utility’.
Digital Twin – a virtual representation of a live water utility or system that enables integration of data, analytics, and visualisation capabilities to control and predict the outcomes, behaviours and potential optimisations from the intelligent systems they’ve deployed.
Edge Computing – is a distributed computing paradigm that brings computation and data storage closer to the location where it is needed, to improve response times and save bandwidth.
Internet of Things – the interconnection via the internet of computing devices embedded in everyday objects enabling them to send a receive data.
LoRaWan – Low power, wide area networking protocol designed to wirelessly connect battery operated ‘things’ to the internet in regional, national or global networks.
Machine Learning – computer programs that can access data and use it learn for themselves.
Process Optimisation – the use of product quality sensors combined with algorithms to optimise the treatment processes, reducing capital & operational costs.
SCADA – Supervisory Control and Data Acquisition, a control system architecture comprised of computers, networked data communications and graphical user interfaces for high level process management.
Software as a Service – a method of software delivery and licensing in which software is accessed online via a subscription, rather than bought and installed on individual computers.
Virtual Reality – the computer-generated simulation of a three-dimensional image or environment that can be interacted with in a seemingly real or physical way by a person using special electronic equipment, such as a helmet with a screen inside or gloves fitted with sensors.
XaaS – anything as a service, refers to the growing diversity of services available over the Internet via cloud computing as opposed to being provided locally, or on premises
/6The Digital Water Utility of the Future

/7The Digital Water Utility of the Future
a. Technology Technology is the fundamental enabler for digitalisation. However, it is changing and emerging at an extremely rapid rate. The key aspects of digital technology include:
Sensors and monitoring devices
Sensors and monitoring devices come in many forms. They can include online monitors within water and sewer treatment plants, distribution networks and other water infrastructure that are able to determine water quality parameters, undertake physical measurements of pressure and flow or monitor the condition of assets. The also include drones and robotic devices (both above and below water) that measure at predetermined locations and times. The devices do not necessarily need to be owned by the water utility. For example, data can be obtained from satellite imagery, or metrological and census agencies.
Sensors are deployed for many different purposes; the key is to be clear on the exact reason for deployment. The uses include:
• Understanding the current status of system processes and to optimise these systems including various aspects of water treatment, pumps and other infrastructure.
• To diagnose and predict detrimental events. This includes not only short-term events such as pressure transients and contaminants in source water, but also longer-term trending data such as water consumption and pipe condition assessment data.
• To understand customer behaviour and assist customers in managing their water use to improve affordability, along with minimising waste and water loss.
Communication devices
The data collected from sensors and monitoring sites needs to be returned to the water utility for analysis and forecasting purposes. Historically, such communication has been through SCADA systems. Early emerging developments were around mobile phone technology, which tend to be relatively expensive. The other main approach is the installation of mesh networks of
3 Enablers for Digitalisation
/7The Digital Water Utility of the Future

communications equipment – using a hub and spoke model of equipment to sort and broadcast data. An example of such networks includes LoRaWan and Wi-Fi hubs.
Analytics and forecasting tools
Analytics can occur both at the point of collection (via edge computing and smart devices) and via centralized data processing. Although edge computing offers a level of data processing at some point the data will need to be integrated for analysis. There are many software options that can collate data from disparate sources and formats. However, in order to do this effectively requires clear data identifiers that enable linkage of the data. Often these identifiers are geo-coordinates or specific points in space that tie the data to a physical location.
The conversion of collated data into knowledge and information requires analytical tools. The objective of many of these tools is to develop understanding of trends and causation, and through this understanding optimize processes to reduce cost, risk and provide enhanced customer value. The most basic of tools looks at data correlations and trigger level exceedances. More advanced analytics engage statistics to determine relationships between disparate data sets. The ultimate stage for analytics is the use of complex predictive tools including artificial intelligence. The appropriate analytic tool depends on the nature of the data, particularly the amount, quality and diversity of data.
Design tools
These are primarily the ability to view and express designs in three dimensions. This can be through augmenting current reality to view current assets with enhancements or to view how the addition of new infrastructure, through to virtual reality, which provides an immersive experience which places the user and designer in the design. This enables clearer visualization of asset placement to reveal potential conflicts and assist in optimizing deign for future operational and maintenance activities.
Separately, the introduction of digital twin technologies enables the simulation of combined datasets e.g. GIS data with real time and discrete monitoring data, to simulate utility functioning and observe the impacts of design and operational changes. By allowing such visualizations, it is possible to evaluate alternative options without expensive construction or operational repair costs to provide prediction of outcomes and determine most suitable alternatives. It also provides the ability to interactively communicate and engage stakeholders in the planning and decision-making processes. Engagement options range from virtual tours of facilities through to interactive games to stimulate interest, learning and facilitate informed decisions.
Data sharing tools
The highest level of digital maturity involves data sharing with suppliers, stakeholders and the community. This can include sharing of data outcomes including sharing of live predictive models such as digital twins. Doing this effectively in the supply chain is relatively straightforward, with asset identification technology coupled with sensors and predictive analytics allowing determination of when replacements and upgrades are required. It also allows ordering of replacements in advance of asset failure. These relationships are typically covered by contractual obligations that provide some protections on the data.
Sharing with stakeholders including other sectors and the community is often more problematic. The primary issue is that much of the data for water utilities concerns personal data or potentially sensitive assets. Such data has a high sensitivity and typically needs a level of de-identification. The development of software and tools that allow parsing of sensitive data between different organizations is in its infancy. However, early signs are quite promising and will hopefully allow effective sharing of sensitive data in a manner that does not compromise privacy.
/8The Digital Water Utility of the Future

b. Leadership and Work Culture Digitisation of a water business is about automation of routine functions, greater availability of data and more effective and efficient decisions. The leader of the future may be likely to have less detailed technical skills but a greater level of understanding of data architecture and analytics and greater people skills as they focus more on human to human interactions. A vital aspect of gaining buy in from employees and enabling change from a cultural perspective is the understanding by the workforce of the value of the data they generate for other parts of the organisation.
Fully embracing the digital utility means having not only an approach to understanding and embracing new technology in a meaningful way, not just being attracted to/by the latest technology. It also means having a culture that trains people to use new technologies and adjust their skills to meet the emerging challenges. This is coupled to the digital economy placing a greater emphasis on customer centricity, agile and adaptive businesses and viewing data as an asset. In addition, digitalisation enables the workforce to have greater mobility.
However, the employees need to be involved in the transition, understand and experience the benefits. It is therefore also about gaining the trust of the employees that need to use the systems. The sociological component cannot be overlooked.
c. Internal CapabilitiesIn addition to leadership and culture, there is a need for the utility to develop the internal capacity. Analytics and data skills are becoming more needed to enable effective systems. However, the cost of acquiring data scientists and advanced analytics experts can be prohibitive. It is likely that water businesses will start moving to an app driven approach to utility management. Key functions could be on apps built by data experts outside of the water industry based on input from expert utility staff or developed collectively by the water industry. This calls for staff who are skilled at transferring their knowledge in a way that can be codified into digital language. It also calls for people skilled in self-direction, communication, creative design and critical thinking. Some of these skills are consistent with the existing workforce skill base, some will need to be developed. The use of low-code/no-code solutions may also be helpful to keep processes within utilities.
A key will be how this is done in a manner that maintains the engagement and broadens the skill base of the existing workforce whilst enabling new skill sets to also be introduced. At the same time, workforce numbers are likely to decline. Whilst redeployment is an option, and some people will be able to move to less routine tasks, a portion of the workforce may not be able to adapt. The transition for the business must therefore be managed carefully.
/9The Digital Water Utility of the Future

/10The Digital Water Utility of the Future
a. Efficiencies within Business Units Better data management can yield a variety of benefits including faster decision-making, new business insights, forecasting and resolution of problems that reduces service disruption. This section outlines the technical changes relating to data and the benefits each can bring.
Data Collection
Accuracy
Automatic data cleansing and assessment of data through data validation and data quality management minimises the amount of inaccurate or incomplete data stored, clears space on servers and makes it easier and quicker for staff to access and use that data.
Storage and availability
Faster access to the ‘right’ data with a ‘single source of truth’ for each data set for the organisation reduces data storage requirements and improves quality control. It is not uncommon for utilities to have multiple versions of data sets that are not identical and have undergone differing degrees of quality control and gap filling. Storing multiple versions wastes server space, creates staff confusion over which data set to use. It often results from a lack of clear accountability and responsibility for checking and maintaining that data set. Moving to a single version of each data set will save money on servers, improve workforce efficiency and the reliability of reported data.
Cloud computing uses the internet to share and store data, processes and applications across devices such as desktops, laptops, mobile phones and tablets. It can
4. Opportunities for Digitalisation(description on what different levels of maturity look like and what it means to move between each level)
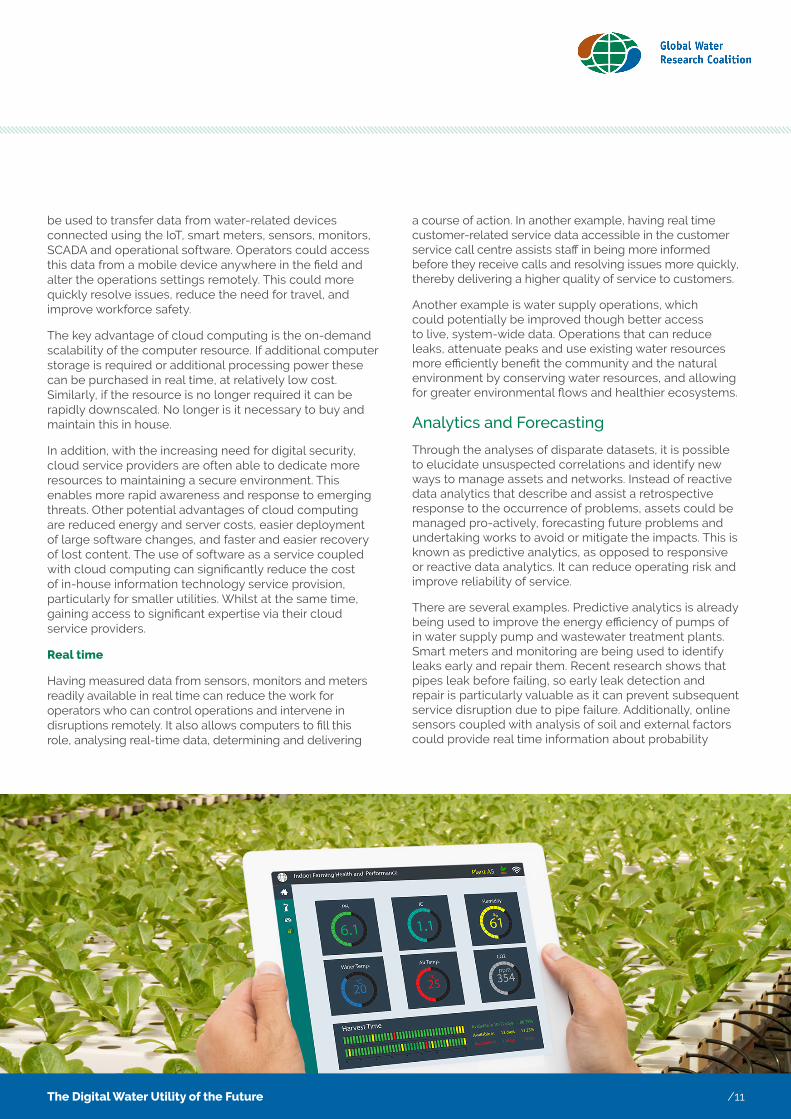
be used to transfer data from water-related devices connected using the IoT, smart meters, sensors, monitors, SCADA and operational software. Operators could access this data from a mobile device anywhere in the field and alter the operations settings remotely. This could more quickly resolve issues, reduce the need for travel, and improve workforce safety.
The key advantage of cloud computing is the on-demand scalability of the computer resource. If additional computer storage is required or additional processing power these can be purchased in real time, at relatively low cost. Similarly, if the resource is no longer required it can be rapidly downscaled. No longer is it necessary to buy and maintain this in house.
In addition, with the increasing need for digital security, cloud service providers are often able to dedicate more resources to maintaining a secure environment. This enables more rapid awareness and response to emerging threats. Other potential advantages of cloud computing are reduced energy and server costs, easier deployment of large software changes, and faster and easier recovery of lost content. The use of software as a service coupled with cloud computing can significantly reduce the cost of in-house information technology service provision, particularly for smaller utilities. Whilst at the same time, gaining access to significant expertise via their cloud service providers.
Real time
Having measured data from sensors, monitors and meters readily available in real time can reduce the work for operators who can control operations and intervene in disruptions remotely. It also allows computers to fill this role, analysing real-time data, determining and delivering
a course of action. In another example, having real time customer-related service data accessible in the customer service call centre assists staff in being more informed before they receive calls and resolving issues more quickly, thereby delivering a higher quality of service to customers.
Another example is water supply operations, which could potentially be improved though better access to live, system-wide data. Operations that can reduce leaks, attenuate peaks and use existing water resources more efficiently benefit the community and the natural environment by conserving water resources, and allowing for greater environmental flows and healthier ecosystems.
Analytics and Forecasting
Through the analyses of disparate datasets, it is possible to elucidate unsuspected correlations and identify new ways to manage assets and networks. Instead of reactive data analytics that describe and assist a retrospective response to the occurrence of problems, assets could be managed pro-actively, forecasting future problems and undertaking works to avoid or mitigate the impacts. This is known as predictive analytics, as opposed to responsive or reactive data analytics. It can reduce operating risk and improve reliability of service.
There are several examples. Predictive analytics is already being used to improve the energy efficiency of pumps of in water supply pump and wastewater treatment plants. Smart meters and monitoring are being used to identify leaks early and repair them. Recent research shows that pipes leak before failing, so early leak detection and repair is particularly valuable as it can prevent subsequent service disruption due to pipe failure. Additionally, online sensors coupled with analysis of soil and external factors could provide real time information about probability
/11The Digital Water Utility of the Future

of pipe failure and be used to increase preventative maintenance to avoid a pipe burst. Resource planning and demand forecasting can also be enhanced through access to additional data, allowing for more accurate examination of the impacts of factors such as climate change, urbanisation and technology changes.
In the mining industry, predictive data analytics are used identify adverse road conditions, allowing drivers (or automated vehicles) to be directed to the best routes, thus reducing wear and tear and fuel costs. One company estimates that this could generate $14M savings per year.
In summary, accurate, available, real-time data can greatly assist utilities in managing their businesses. It can be used to more quickly inform decisions, to forecast futures, identify future problems and rectify them before they occur. Customers benefit from less service disruptions and potentially lower bills.
Data-Driven Decision Support
Data driven decision support can occur at several levels. At the most basic level, it involves the collection and representation of online and potentially discrete samples in a format that is simple to understand and preferably updated automatically. The more complex approach is for automated and collection of results using some form of machine learning or artificial intelligence to detect trends that are too integrated or complex for a human alone to determine.
At present, many water businesses collect data from online monitoring systems including smart meters and other sensors. Data is also collected from field monitoring. The effective use of this data for decision support relies on the data being validated, verified and in a format that integrates with other systems. Without validated and verified data, any decision support system based on the data is unlikely to function effectively.
Verification is about ensuring data that is collected is a true reflection of real events e.g. that the chlorine concentration in a water sample was 1.1 mg/L and not 1.5 mg/L. This includes accurate location of the data to a particular point in space and time. Validation is to ensure that the observation or reading meets the system data requirements. Without effective formatting, including with valid database keys to allow matching of data from disparate sources, it is not possible to rely on data driven decision support systems.
Automation (this should include call centres, back office functions such as finance, along with treatment plant operation.)
Automation can lead to quicker and safer asset inspections, reduced staff requirement in operations, cost savings in new assets, and better management of peaks. This section outlines the technical changes you can make relating to automation and the benefits each can bring.
Monitoring and control devices
Monitoring can be used to manage peaks in water supply, maintaining pressure and supply while attenuating peak demand where possible. If peak demand attenuated consistently, the asset life may be extended, and infrastructure upgrades deferred. In the sewer networks smart systems are already being used to reduce peak loads to sewage treatment plants, reducing the risk of spills and deferring augmentations.
Historically, a lack of real time data meant that managing peaks in water supply and sewer network was done using hydraulic modelling based on limited calibration. The availability of low-cost sensors, with supporting communications and power options mean much more data can be collected. The key is optimising sensor placement and configuration. At the simplest level, system optimisation can be done by operators manually adjusting in response to monitoring.
The next evolution is computer systems that read and respond to monitored measurements with alarms and notifications to assist the operator. There is still the need for a human to interpret the results, decide and commence any changes in operation.
The next stage of evolution is edge computing - a programmed device to handle some or all the response through machine to machine relationships within the water and sewage networks. The programmed device can identify a course of action and, where permitted, implement it without human intervention. Self-learning algorithms can make a program progressively more independent and less in need of operator input, and possibly exceed the capability of humans due to its consistent logic. This approach is likely to become more common due to the volume of data and increasing ability of devices to rapidly process this into information.
/12The Digital Water Utility of the Future

Changes in operation are made by remotely activating control devices. Control devices include valves that adjust flow into and out of tanks or reservoirs, and switches and electrical controllers that operate equipment such as pumps, aerators, agitators, turbines, gates or vents. For example, control devices can be used to automatically shut down certain water sources and switch to others following the automatic detection of poor water quality in a supply system. There are already many high-risk engineering facilities that have sophisticated process controls and are operated remotely. For example, Snowy Hydro’s gas-fired energy generation plant in western Melbourne, Australia is operated remotely from a control centre over 1,000 km away. There is potential for the water industry to operate more of its assets remotely.
Research is ongoing to develop innovative analysis techniques to optimise the efficiency and safety of water systems feeding from multiple alternative water sources. For instance, if water supply data is linked with information about the availability of renewable energy and demand, the supply of water and the use of energy can be better coordinated. Excess renewable energy can be used for other purposes or returned to the grid.
Workforce safety and protection
Robots will be used increasingly in future for the handling of hazardous material or in challenging work environments that could pose serious health and safety issues. Melbourne Water and Seqwater have used drones for the inspection of dam walls and spillways, thus reducing inspection time dramatically. Instead of six staff working for a full day in a high-risk environment (abseiling), a drone can now gather the same amount of data in two hours. As
a bonus, the images produced this way are of high quality, with GPS tagging that allows easy return to the exact location of an issue for targeted repairs.
Staff can be trained using ‘smart helmets’ with screens displaying guidance. Staff safety can also be supported with smart wearables, such as smart items of clothing, protection equipment or watches. There is an ever-increasing range of applications available, e.g. location-trackers which register staff entering or leaving dangerous areas (e.g. high fire- risk areas), ‘wellbeing’ detectors which can measure levels of drowsiness or heat exhaustion, and smart helmets that connect field staff to office- based experts who can virtually guide them through their task if required, this being particularly useful for utilities with skills shortages. In addition, the use of drones and other smart inspection methods can reduce the need for staff to work in high-risk environments such as heights or in confined spaces.
Greater automation of operator tasks, such as asset inspections or responding to SCADA alerts, can reduce the need for staff to work remotely or after hours. Overall, better monitoring, modelling and predictability of asset performance may also enhance worker safety by predicting problems before they occur.
New asset creation
The advent of 3D printing presents a unique opportunity to reduce asset costs. At present commercial printing is primarily restricted to small-scale plastic products. However, recent advances are looking at the options for 3D printing of larger items: with one project looking at printing an entire house, and there are several looking to 3D print steel footbridges.
/13The Digital Water Utility of the Future

Back office functions
At present most back office functions such as accounting, legal services, IT servicing provisions, and human resources are undertaken by humans. A number of these functions are currently looking to be automated, particularly in the areas of accounting and legal services, including contracting. At present, the automation of these functions is largely in the research and development phase. It is anticipated that over the next few years the technologies supporting automation of these functions will become mainstreamed, providing additional opportunities for efficiency gains.
b. Integration between Business UnitsDigitalisation touches every part of a water utility. Successful digitalisation means that the utility has the tools, skills and business processes to harness new technology in order to ultimately improve their customer experience while maintaining (or increasing) returns to the shareholder. This section provides a simplified overview of the key elements of how a digital utility integrates its business units, including asset management, business processes and customer service. Culture is an overarching characteristic that underpins a successful digital utility transformation.
Streamlining of business systems and development of internal efficiency
Digitalisation can facilitate more effective workflows and processes, thus reducing the need for human intervention. Digitalised processes lend themselves particularly well to automation and customer self- servicing. New software tools can find solutions far more quickly and better than humans can, such as those already available to optimise the allocation of expert field staff to the nearest most- urgent jobs. Telecommunication technology such as mobile networks, broadband networks, Wi-Fi, Bluetooth and near-field communication make data and information readily available wherever they are needed, whether within the office or out in the field, in one’s own country or overseas. This means that work need not be delayed or impaired through lack of access to data or documents.
One study estimatesiii that digital transformation in the Australian Government could reduce the volume of transactions through traditional channels by 20% within 10 years: A$17.9 billion in saving through productivity and efficiency benefits for Government, and A$8.7 billion savings in time and convenience for citizens.
‘Building Information Modelling’iv (BIM) is a computer tool for construction projects that facilitates efficient construction and asset management. It can be used for more efficient management of construction projects
within the water industry, and improved management of the assets after they have been built. In the UK, the introduction of BIM has led to 20% cost savings on CAPEX, and the process is now mandatory for centrally procured construction projects in many European Governmentsv.
Tailoring the procurement processes for digital assets and services can ensure each new digital asset is handed from supplier to the water utility with the asset data and data collection procedure prepared, ready for validation and operation. This not only makes the process quicker, it also ensures that the utility is collecting all relevant data from the supplier and minimises their work in validation and operation.
Single version of the truth on reporting indices and all data.
A key advantage of digital systems is the ability to provide an enterprise wide view of all data and information held. Often within utilities, data can be held within specific business units. Only discoverable through discussion and agreement with those business units. A more efficient option is to allow full integration of data, such that it can be meaningfully interrogated and converted to information that supports decision making. This then provides a single source of the truth for all reporting data across the business, avoiding duplication whilst seeking to ensure that only the most current data is used for all decision making.
In addition, having oversight of all or large portions of data collected by the organization allows easier identification of trends and issues. This enables more rapid detection of issues, often in real time, as they arise. Earlier detection results in the ability for faster responses to rectify the issue before they become detectable by customers or cause significant issues for the business.
Deeper insights into system and customer behaviour to allow prediction of events before they occur, and pre-emptive management of complaints and enquiries.
Traditionally water utilities have looked at data based on service function e.g. customer, asset, human resources. Using data from each section to build a complete picture of a utility’s interaction with either an asset, customer or staff member often yield new, valuable insights, which facilitate better decision-making. New methods, models and tools are emerging for managing assets, construction sites and even budgets that are based on finding meaningful patterns and correlations within disparate datasets. These will assist decision makers who, otherwise, would not have access to the insights from the combined, large data sets.
/14The Digital Water Utility of the Future

In water cycle processes that use energy and/or produce renewable energy (such as mini-hydro schemes or biogas capture) it is possible to use models that forecast water/sewage flows as well as energy demand and usage. They can be balanced in the model to determine optimal operating conditions, which supply all water needs, avoid sewage spills, while also minimising greenhouse gas emissions and energy costs. If energy is sold back to the wholesaler, then these systems can work to ensure energy is being produced at times of maximum energy sale price. This integrated approach demonstrates one benefit of cross-business modelling and collaboration.
During a multi-year project such as capital works, there will be many points at which data needs to be accessed and used to inform decisions. For example, during strategy, concept, process selection, preliminary design and detailed design. For a large project or asset, this may involve many gated approval processes. Having data readily accessible and in the right format speeds each step in the decision-making so assets are online sooner. Using correct protocols for requesting and storing data such as Building Information Management (BIM) ensures that the data is in the most usable format now and for future projects.
c. Enhancing Customer/ Supplier Interface Customer service improvements form one of the two key drivers of digitalisation for a water utility. The digital age has enabled a quantum increase in utilities’ knowledge of their customers. A plethora of new communication channels, some of which are two-way, allow the needs, desires and sentiments of customers to be accurately and clearly discerned for the first time. In addition, the utility can determine much more precisely, the nuances of their customers’ use of water through the smart metering of end use demand. Emerging technology allows this greatly increased knowledge of customers to be transformed into new ways of self- servicing or into entirely new service offerings.
A carefully considered interface with suppliers will also improve the utility’s ability to extract the maximum benefit from digitalisation. This includes suppliers delivering digital technology or systems that utilities then use in-house, as well as expert service providers such as data analytics consultants.
/15The Digital Water Utility of the Future

Proactive Customer Engagement through Digital Platforms for Service Delivery
By integrating data from all aspects of the business including billing, faults and emergencies, asset management and internal business processes, water utilities can set up new ways of creating customer value. Customer issues can be recognised more quickly through having the data on hand, potentially even before the customer calls to report a disruption. Customers will no longer need to repeat their story each time they call. Their issues can be resolved more quickly, and dealings will be more consistent and transparent. Some integrated systems in Europe are looking to provide a customer profile based on the incoming phone number that integrates the current bill, payment history, and network data. The system then tries to pre-empt and script for the top three reasons the person could be calling.
Integrating data from all parts of the business is challenging. It can be achieved by locating all data in one central repository or linking staff across different business units that share their data as needed. Restructuring the business can assist in achieving this and is discussed further in Section 3.
Experiences of the energy sector show that customers who have interacted through digital channels over the last year have more positive attitudes towards their energy provider in terms of trust, satisfaction and willingness to interact further. The same benefit might be expected for customers of water industry digital channels, if they are well designed to meet customer needs.
Customer channel migration
Customer service can be improved through offering multiple channels to connect with the customer: personalised and itemised smart-bills, social media, email, online chats, peer-to-peer discussions, mobile phone and tablet apps. This list will grow as technology progresses. Offering online chats as one of them can be efficient for utilities where one staff member can handle several online chats simultaneously instead of just the one phone call. This either leads to faster response times for customer enquiries or reduced need for staff. Customer relationship management software can be used to track and compile information from all the channels on each customer, providing a comprehensive view of that customer’s issues and history with the utility.
Saving all customer transactions in one, easily accessible database can also be very beneficial as it stops customers from having to repeat their story each time they ring and enables faster resolution of issue.
Influencing of Consumer Behaviour
The efficient collection of a vast amount of digitised data will enable the development of customer engagement systems with predictive capabilities that address and, where possible, rectify customer concerns before they contact the water utility. For instance, customers may be informed via a timely SMS of a water main burst affecting their water supply and the expected duration of interruption. This notification is likely to reduce the volume of customer calls seeking reassurance or information. This reduces staff needed in the customer call centre, as well as boosting the utility reputation with customers who may see the utility as more proactive.
Using SMS notifications or emails, or in-house displays, utilities can communicate with their customers about their own water usage or leaks identified on the property. Whilst this can be achieved through manual meter reads, the more frequent (near real-time reads) achieved through digital meters is potentially much more powerful. Some customers enjoy learning about their water use and using it to help reduce their consumption. Likewise, the utility can invite customers to community activities in their local area relating to water. Other personalised communication examples include alerts about emergency repair works in the local street, or a personalised message on their bill referring to a recent customer interaction e.g. “Thank you for reporting a burst.”
Currently many customers receive water saving tips from their utility as a part of their customer bill. Not all those tips may be relevant, for example, not everyone has gardens so is not interested in sprinklers. By collecting and collating residential information, and water use behaviour and even appliance stock through smart meters or sensors, utilities would be able to identify the best water saving approaches for each customer. Personalised water saving tips could then be written on their bill to provide suggestions that are relevant for that person’s situation. It may result in greater uptake of water saving measures, resulting in overall lower water use and deferred augmentations.
There is also opportunity for collaboration with other sectors to jointly influence behaviour in the direction of more sustainable use of resources. For example, water and energy are intimately linked. Combined digital water and energy feedback to customers offers opportunities to significantly improve overall resource efficiency. Financial savings can be substantial when combined.
Similarly, the sharing approaches between sectors is also instructive. For example, the finding that 80% of digital energy users are likely to participate in an energy management program as opposed to 59% of non-digital users has resonance in times of drought when water utilities will be keen to promote water conservationvi.
/16The Digital Water Utility of the Future

Flexible Tariff Structures and Product Offerings
The ability to view customer data in real time presents the opportunity to offer bespoke and tailored customer offerings, including tariff structures. However, the water has traditionally been quite a price inelastic product. Thus, it remains to be seen whether tariff structures can be used to influence customer behaviour. Recent experience from Australia during their Millennium Drought indicates that education has a far greater impact on customer behaviour than tariff structures.
Digital technologies offer the opportunity to provide integration of utility service offerings (including energy, district heating, telecoms, etc.) to reduce customer costs. To date these have not been well explored by water utilities, offering a potential opportunity. A key area for exploration is the opportunity to peak shave in both the water and electricity sectors.
Digitalisation offers the prospect of greater customer choice to meet a range of customer needs, preferences or values. Subject to regulatory approval, flexible tariff structures could be used to incentivise certain behaviours. For example, in areas with smart meters, time-of-use tariffs could be used to increase overnight water use and minimise daytime peaks, thus creating greater value for all customers through deferrals of asset augmentations.
Also subject to regulatory approval, alternative product offerings could be made available to customers analogous to what is offered by telecommunications and energy providers. For example, customers could pay more for greater levels of service. If some customers were willing to accept lower levels of service in exchange for reduced fees, there could be a net financial benefit to all customers by reducing the need to augment or upgrade assets that are constrained.
Self-Service Applications for Customer Engagement
Looking at how other service providers are interacting with their customers sheds light on how some of these alternate channels can be harnessed. For example, the banking sector has seen dramatic transformation due to digitalisation. Many banks now recognise that their success is tightly connected with their ability to implement digital technologies to automate processes, create new products, improve regulatory compliance, and transform the experiences of their customers, effectively self-disrupting key components of the value chainvii. Likewise, energy service providers have experienced greater levels of customer satisfaction, trust and willingness to engage through their digital channels with customers. Water utilities are working to develop digital interfaces specifically targeted to customer needs.
Linking field work to customer outcomes
Most water utilities tend to separate their information technology (IT) and the operational technology (OT). This can create a barrier in communicating information between field workers who are interacting with customers on site and integrating this information with that collected from interactions with customers by call centre staff. Whilst some work is being undertaken by systems such as Salesforce™ to allow better communication across the organization this work is still relatively new. This is an emerging area that should provide significant efficiencies that will enhance the customer experience. Further work is required to fully realize the benefit of such approaches.
Linking asset data to suppliers for greater efficiency in maintaining and renewing assets
Procurement of digital services and technologies is different to buying traditional built engineering assets. Consideration of the digital-specific factors can help water utilities to more efficiently and effectively harness the digital age. The UK Government, for example, has developed a new ‘Digital Marketplace’ to improve digital procurement through all their departmentsviii. This section discusses some of the factors that may be considered in digital procurement.
/17The Digital Water Utility of the Future
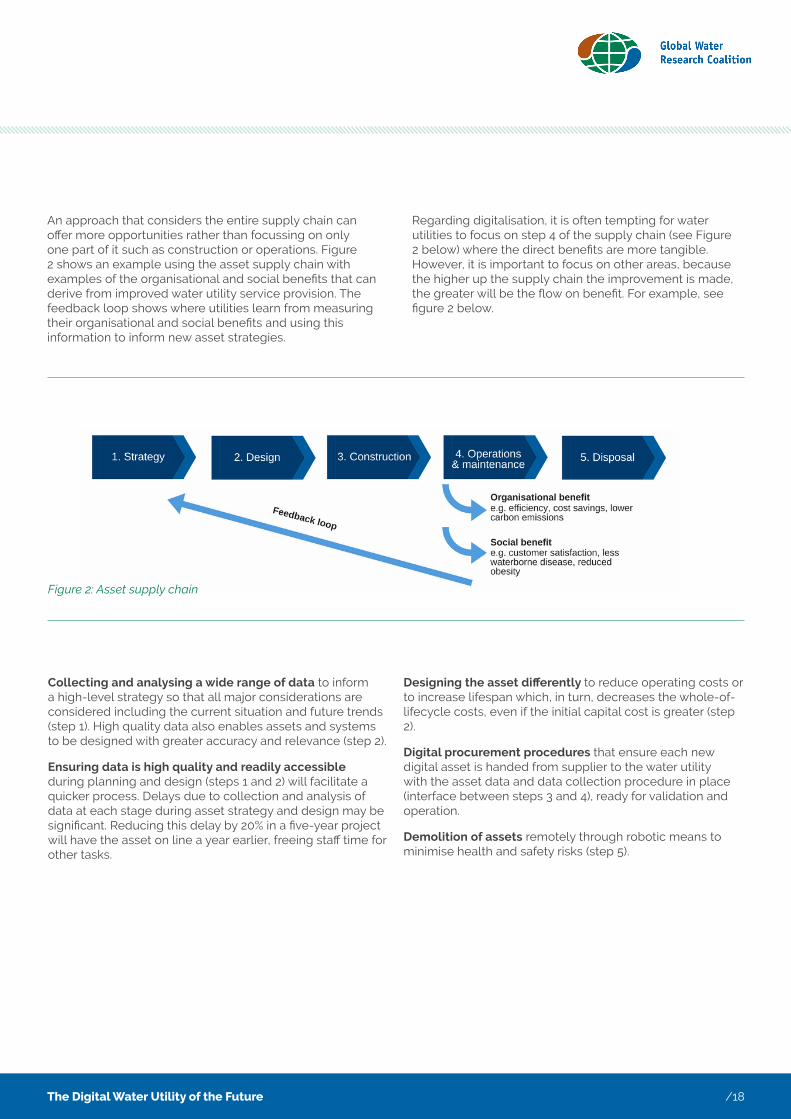
An approach that considers the entire supply chain can offer more opportunities rather than focussing on only one part of it such as construction or operations. Figure 2 shows an example using the asset supply chain with examples of the organisational and social benefits that can derive from improved water utility service provision. The feedback loop shows where utilities learn from measuring their organisational and social benefits and using this information to inform new asset strategies.
Regarding digitalisation, it is often tempting for water utilities to focus on step 4 of the supply chain (see Figure 2 below) where the direct benefits are more tangible. However, it is important to focus on other areas, because the higher up the supply chain the improvement is made, the greater will be the flow on benefit. For example, see figure 2 below.
that will enhance the customer experience. Further work is required to fully realize the benefit of such approaches.
Linking asset data to suppliers for greater efficiency in maintaining and renewing assets
Procurement of digital services and technologies is different to buying traditional built engineering assets. Consideration of the digital-specific factors can help water utilities to more efficiently and effectively harness the digital age. The UK Government, for example, has developed a new ‘Digital Marketplace’ to improve digital procurement through all their departmentsviii. This section discusses some of the factors that may be considered in digital procurement.
An approach that considers the entire supply chain can offer more opportunities rather than focussing on only one part of it such as construction or operations. Figure 2 shows an example using the asset supply chain with examples of the organisational and social benefits that can derive from improved water utility service provision. The feedback loop shows where utilities learn from measuring their organisational and social benefits and using this information to inform new asset strategies.
Regarding digitalisation, it is often tempting for water utilities to focus on step 4 of the supply chain (see Figure 2 below) where the direct benefits are more tangible. However, it is important to focus on other areas, because the higher up the supply chain the improvement is made, the greater will be the flow on benefit. For example, see figure 2 below.
Figure 2: Asset supply chain
• Collecting and analysing a wide range of data to inform a high-level strategy so that all major considerations are considered including the current situation and future trends (step 1). High quality data also enables assets and systems to be designed with greater accuracy and relevance (step 2).
• Ensuring data is high quality and readily accessible during planning and design (steps
• 1 and 2) will facilitate a quicker process. Delays due to collection and analysis of data at each stage during asset strategy and design may be significant. Reducing this delay by 20% in a five-year project will have the asset on line a year earlier, freeing staff time for other tasks.
• Designing the asset differently to reduce operating costs or to increase lifespan which, in turn, decreases the whole-of-lifecycle costs, even if the initial capital cost is greater (step 2).
• Digital procurement procedures that ensure each new digital asset is handed from supplier to the water utility with the asset data and data collection procedure in place (interface between steps 3 and 4), ready for validation and operation.
• Demolition of assets remotely through robotic means to minimise health and safety risks (step 5).
Additionally, creating a feedback loop between benefits measured in existing assets, and designing new assets (Figure 2), ensures that utilities can continue learning and providing maximum organisational, health and social benefit. For example, if installing improved controls in a water treatment process results in a reduced
Figure 2: Asset supply chain
Collecting and analysing a wide range of data to inform a high-level strategy so that all major considerations are considered including the current situation and future trends (step 1). High quality data also enables assets and systems to be designed with greater accuracy and relevance (step 2).
Ensuring data is high quality and readily accessible during planning and design (steps 1 and 2) will facilitate a quicker process. Delays due to collection and analysis of data at each stage during asset strategy and design may be significant. Reducing this delay by 20% in a five-year project will have the asset on line a year earlier, freeing staff time for other tasks.
Designing the asset differently to reduce operating costs or to increase lifespan which, in turn, decreases the whole-of-lifecycle costs, even if the initial capital cost is greater (step 2).
Digital procurement procedures that ensure each new digital asset is handed from supplier to the water utility with the asset data and data collection procedure in place (interface between steps 3 and 4), ready for validation and operation.
Demolition of assets remotely through robotic means to minimise health and safety risks (step 5).
/18The Digital Water Utility of the Future

Additionally, creating a feedback loop between benefits measured in existing assets, and designing new assets (Figure 2), ensures that utilities can continue learning and providing maximum organisational, health and social benefit. For example, if installing improved controls in a water treatment process results in a reduced incidence of water-borne diseases in the general population, a case could be argued for using the savings in hospital costs
towards funding such a process. Likewise, systems that exploit meteorological and environmental data to facilitate the watering of green spaces and to improve riparian vegetation management could lead to improved urban amenities. These, in turn, may raise house prices in the vicinity and part of the increased land-based taxes could potentially fund the cost of the program.
This fourth, most external-facing part of water utility digital maturity involves working with other businesses, service providers and community groups outside the water industry to explore opportunities, insights, efficiencies and innovative service delivery options to benefit the broader community.
Servicing Customers from Common Platform
If all customer information is digitised, there is the option for servicing from a common platform, external to the water business. This could make things easier for customers as well as reduce administrative overhead for utilities. However, it may come at the cost of having a direct customer relationship.
For example, the overhaul of Service NSW illustrates integration of different services for improved customer service. Nine hundred websites and 30 different contact centres were combined into one website and one phone number. The retail outlets offer a range of ways to interact with self- service stations in addition to the traditional service desks. Instead of having to visit separate agencies for a birth certificate and a new driver’s licence, all can now be done in a one-stop-shop. The application for a senior citizens card can now be processed in 3 minutes instead of 2-8 days, resulting in very positive customer feedback (4.8/5)ix.
Community and stakeholder involvement in decision making and initiatives
Digitalisation offers opportunities to involve customers and community members more easily in decision-making. For instance, this could be done through user-friendly mobile phone apps and with serious games to allow participation in water cycle related decisions. The visual screens could also be used to visually demonstrate complex engineering concepts more easily. It can be quite difficult and expensive to involve the community in consultation regarding water and sewerage service options, so these novel digital options may help to increase the degree of consultation achieved.
One successful example of a user-friendly digital representation of complex scientific concept was the Climatedogs videosx developed by the Victorian State Government. They were developed to help farmers understand the impacts of climate change on their farms and plan their water orders and decide which crops to sow based on seasonal forecasts. Each of the global weather systems impacting Victoria’s rainfall was represented as a different dog which had its own entertaining behaviour quirks. While this example was focussed on information dissemination rather than engagement in decision-making, it is easy to imagine a similarly entertaining approach being effective for water industry consultations.
An additional channel for interaction is now available with a range of smart city applications. They allow city authorities, infrastructure and utilities managers, and other city stakeholders to interact with their citizens on local issues such as reporting faults, administration and analysisxi. They have the potential to improve the way a city is managed in a very democratic and personalised way and to increase the competitiveness, cohesion, and sustainability of the city.
Another example for combining customer benefit, customer education and city improvement is the “TreeWiFi” system currently being tested in Amsterdamxii Air pollution monitors, in the form of birdhouses, are distributed across the city. If the pollution is below a certain threshold, the roof of the birdhouse glows green and it starts distributing free Wi-Fi access. When logging in via the “TreeWiFi”, information is provided to show how everyone can contribute to lower pollution (and thus freer Wi-Fi).
The water industry increasingly broadening the value it delivers to its customers in initiatives such as water sensitive urban design, greening the cities, and producing renewable energy. These novel digital approaches to engaging with the community could be used to consult the community on their preferences for new initiatives as well as collect feedback on those already delivered.
d. Integrating with Community
/19The Digital Water Utility of the Future

Optimizing performance across sectors (New Proposed)
Earlier sections have discussed optimising performance of water, sewage, chemical and energy use within a utility. Potentially greater benefits can be obtained by taking a similar approach to optimise performance and manage peaks or disruptions between sectors.
Examples include sharing information between energy and water utilities to optimise performance and help manage peaks in both services. Once the interactions are well-understood, machine to machine relationships between water and electricity networks could automatically optimise the performance of both systems with limited staff involvement.
Real-time data shared between water and transport services could be used to direct the water field crews to the closest disruption, based on both distance and current traffic conditions. The information could also be used to redirect traffic around disruptions or provide advanced warning of potential issues.
New collaborations, insights, service offerings and bundled services
New business value will come from sharing and using data, with information becoming a new strategic asset, which allows value creation beyond traditional pipes and pumps networksxiii. New service offerings such as ‘one utility touchpoint’ that informs water, gas, and energy providers about a new residence could help improve the customer experience as well as reduce administrative overhead in utilities. Likewise, customers may prefer to purchase and keep track of a single service offering of bundled utility services. Customers may currently purchase two utility services, such as gas and electricity, from the same service provider. In future, this could be a bundle of water, gas, electricity and telecommunications. This could reduce administrative overhead costs in water utilities, though this saving may be small as on average only 4% of total water utility costs are associated with the retail interface.
Data sharing with other agencies such as councils, government, and other utility service providers may yields new insights, help us to better understand our customer base and provide for their needs better. There is already a significant private data analytics industry that uses data sets from different customer bases, to elucidate new insights into customers.
This information is then sold on to companies that wish to selectively advertise to different customer bases. Much of the data is publicly available but it takes expertise to extract meaningful and useful information. Water utilities need to think about whom to share their information with and under which conditions, to ensure their data is not used for purposes they do not support. Alternatively, water utilities can think about a new revenue stream based on using insights extracted from their customer data combined with other data sets.
For example, in the energy sector, there are now ‘energy providers’ emerging that do not own any assets at all, but instead, use the decentralised solar panels of community members. They provide value through linking producers and users through an online, blockchain-based, peer-to-peer marketplace for renewable energyxiv,xv.
The IoT is a development of the internet whereby everyday objects have network connectivity, allowing them to send and receive data. Water utilities might consider how attaching sensors to all water using appliances in homes and businesses can revolutionise their understanding of appliance stock and customer usage pattern. For instance, it could be possible for water utilities to know exactly when showerheads are turned on and off as well as what temperatures and flow rates they run on. The information could be used for highly accurate operation of the water supply system for instance, or for more reliable long-range planning. There will be many issues to work through as, for instance, should manufacturers or water utilities take the lead in developing the IoT for water using appliances? How can water utilities ensure that they have rights to the data, how can they use it ethically and who can they share it with?
/20The Digital Water Utility of the Future

a. Leadership and Organisation Culture To fully embrace digitalisation, a utility needs to adopt new ways of working, build new skills and capabilities and become more innovative, agile and collaborative. Even the best-designed technological systems can be easily undermined by a poor workplace culture. The ability to smoothly transition through the stages of digitalisation present a significant challenge to the industry.
Table 1 summarises typical differences between analogue and digital business culture, which serves to illustrate the degree of change required in culture. It may be seen that the digital shift affects the business to its core including ways of interacting with the customer, the organisational structure, staff attitudes and the way people work together. If not handled well, digitalisation may result in a divided organisation with one part moving into the future and the other part reluctantly using the new tools, collaborating poorly, and ultimately undermining the digitalisation journey.
Table 1: Features of analogue culture versus a digital culture, adapted to the water industry and based on work by PWC
Analogue culture Digital culture
Customers and service Products driven by supply
Pushed into market
Understands long-standing customers
Products developed to meet customer demand
Understands digital customers and how to adopt new trends
Organization Layered hierarchy, silos
Complex governance, slow decision-making
Defined roles and tasks
Process focus
Flat hierarchy
Rapid decision-making
Flexible employee roles to achieve a goal
Product and result focus
Attitudes Risk averse, accepts constraints, focus on past lessons learnt
Career progression linear, defined paths
Homogeneous teams
Vision, innovation, curiosity, improvement
Strong collaboration
Varied, rapid career paths, greater cross-sector and cross-industry staff movement
Diversity in teams
5 Barriers & Mitigation Measures (brief description)
/21The Digital Water Utility of the Future

Skills Shortage
WSAA’s Workforce Skills of the Future paper identifies that the core skills of the future are changing, and businesses need to develop new ways to identify and recruit these skills. Talent management and change management will be critical given the transformational forces affecting the industryxvi. Resilience and flexibility, leadership, digital and technological literacy and critical problem solving are likely to be the most important capabilities. From a digital perspective, skilled staff are needed to process the data, turn it into useful insights and actions, and communicate the insights to senior management who may not necessarily be technically minded. Customer engagement experts are also required to harness the digital information and transform it into excellent customer service.
All these staff are currently in short supply. Several recent surveys showed that there is a big shortage of data analytics expertsxvii, with 40%-70% of the companies surveyed struggling to find and retain the data analytics talentxviii, xix. In addition, there is an even greater shortage of people who speak the languages of both data analysts and decision- makers and who can create a bridge between the twoxx. Some utilities have also reported they are struggling to find and keep customer engagement experts in a highly competitive market.
As data analytics is not core business for most water utilities in Australia, it is likely that most will outsource the service leading to the potential risks of supplier dependency (further discussed as a separate risk). At least a moderate level of in-house skill is recommended so that the data analytics service providers can be effectively managed, and insights can be successfully communicated internally to inform business decisions. Customer engagement expertise is closer to core business for most water utilities so this expertise could be developed in-house or outsourced; however, regardless of the approach chosen, it may still be difficult to hold onto staff. The business employee value propositions may assist in attracting and retaining highly sought-after experts.
Digitalisation may change the way water utilities are led, with new roles such as: Chief Digital Officer, Chief Customer Officer, or Digital Water Stewardxxi emerging. It may also be beneficial to up-skill all the decision-makers, so they have an ability to interpret analytics results and translate them into targeted actions. Indeed, the respondents to a recent survey found that 40% of their senior managers had ‘only a moderate understanding of the importance of digital skills’, while 26% were believed to have ‘little or no understanding’ at allxxii.
b. Obsolescence of IT Infrastructure and stranded IT InfrastructureTechnology is rapidly advancing. We are now seeing exponential adoption rates of new technologies xxiii. For instance, the first iPhone was released in 2007, only 10 years ago, yet they have become ubiquitous worldwide. This means that while we may be able to plan for the next three years, it will be increasingly difficult to anticipate and plan for technology changes in 10 years’ time.
To succeed in the future, businesses need to find new ways to keep up with the rate of change. This is challenging. A recent survey of Australian public service leaders found that only 27% “feel confident about my organisation’s readiness to respond to digital trends”. Yet, 80% agreed, “Digital technologies and capabilities empower us to work better with customers and citizens.”
To address this challenge, businesses need to be agile, innovative, and well connected to pick up on, and harness the latest trends. They need to be aware of major shifts to their service provision models that technology can bring, e.g. through decentralisation or competition for managing customer relationship. Transforming the business structure and/or culture can assist in creating a workplace that is more agile to change.
Many digital technologies are available from private suppliers and they are not all compatible with each another. The risk for water utilities is that they may become locked into one brand or supplier, which may not be in business indefinitely and may not be able to provide the ongoing support needed.
Likewise, partnerships with external service providers in data analytics and/or customer engagement are likely to be a part of any digital transformation. These services are in high demand and it may be very difficult for utilities to forge an ongoing, reliable and cost-effective partnership with a single service provider.
Communications systems have traditionally been a major challenge; however, recent developments have seen a move away from proprietary systems to more open source networks with increased competition. Various LPWA (Low-Power Wide- Area Network) communications systems and solutions are emerging. In Australia, the Australian Communications and Media Authority has recently set aside a certain frequency spectrum (929-934 MHz) that will, once implemented, be available for IoT applications. Telecommunications companies are increasingly investing in these LPWA networks. Several utilities are already trialling NBIoT, (“narrow band Internet of Things”, one type of LPWA technology) with various suppliers. Selecting
/22The Digital Water Utility of the Future

suppliers using open source networks are inherently less risky than using suppliers with proprietary systems.
Finding the right strategic partnerships may assist in mitigating the risks. Collaboratively, organisations can leverage skills, capability, technology and costs. The increased availability of communications providers (all using the same LPWA technology) is an important step in creating competition in the market and driving down costs. There are already many proprietary tools available for big data analytics that allow analysis of big data sets. However, it might also be worth considering open-source platforms and open data standards/protocols for greater sharing
of approaches and with the potential for more rapid and widespread deployment.
c. Security ManagementDigital security has many different components. If we look at a generic digital reference framework (Figure 3) which shows the key elements that make up a digital system, security breaches can affect each component. The key to managing cyber security is understanding which levels of the digital architecture are impacted. This will assist in developing the approach to isolating the incident and the extent to which it will affect different parts of the business.
data sets. However, it might also be worth considering open-source platforms and open data standards/protocols for greater sharing of approaches and with the potential for more rapid and widespread deployment55.
c. Security Management
Digital security has many different components. If we look at a generic digital reference framework (Figure 3) which shows the key elements that make up a digital system, security breaches can affect each component. The key to managing cyber security is understanding which levels of the digital architecture are impacted. This will assist in developing the approach to isolating the incident and the extent to which it will affect different parts of the business.
Figure 3: Example reference frameworkxxiv
Security issues are generally easiest to identify and manage at the lower levels of the framework. This is typically because the issue will be localised to key devices or areas of the system. In addition, the higher levels including connection management, intelligence enablement and application enablement provide additional checks and controls to identify issues. Security issues at higher levels provide access to a far broader amount of data and can be more difficult to detect.
The effect of security impacts ranges from immediate impact including disablement of equipment, files or systems, and theft of information through to long term such as the embedding of latent protocols with systems for later deployment. The targets can be as varied as attempting to acquire access to sensitive customer data, through to mimicking device output. Mimicking in particular has significant potential risk. Here devices – sensors, dosing units, valves etc. can appear to be functioning normally yet in reality they could be switched off, overdosing chemical or masking critical system changes. Latent files can be deployed such that the system functions normally until the file is deployed at some time in the future. The trigger for the system to become active can be pre-set to a certain time or event, it may not need further direct contact with the originator.
Tampering with the data and systems that are used to operate water utility infrastructure could have a far more serious effect, such as cutting off water supply, disrupting treatment processes to spread water that is not fit for consumption, flooding houses and sewer overflows through disrupting sewage pumping, or harmful environmental discharge from disrupted sewage treatment. Any such disruptions could be possible by hacking into any internet-based system that connects and operates remote infrastructure.
Fortunately, there are approaches to help utilities improve their security. These include the National Institute for Standards and Technology (NIST)xxv in the US and the ISO Protocolsxxvi. NIST 800-53 is designed to assist utilities understand their current security maturity and actions required to address security deficiencies. Information
Figure 3: Example reference framework xxiv
Security issues are generally easiest to identify and manage at the lower levels of the framework. This is typically because the issue will be localised to key devices or areas of the system. In addition, the higher levels including connection management, intelligence enablement and application enablement provide additional checks and controls to identify issues. Security issues at higher levels provide access to a far broader amount of data and can be more difficult to detect.
The effect of security impacts ranges from immediate impact including disablement of equipment, files or systems, and theft of information through to long term such as the embedding of latent protocols with systems for later deployment. The targets can be as varied as attempting to acquire access to sensitive customer data, through to mimicking device output. Mimicking in particular has significant potential risk. Here devices – sensors, dosing units, valves etc. can appear to be functioning normally yet
/23The Digital Water Utility of the Future

in reality they could be switched off, overdosing chemical or masking critical system changes. Latent files can be deployed such that the system functions normally until the file is deployed at some time in the future. The trigger for the system to become active can be pre-set to a certain time or event, it may not need further direct contact with the originator.
Tampering with the data and systems that are used to operate water utility infrastructure could have a far more serious effect, such as cutting off water supply, disrupting treatment processes to spread water that is not fit for consumption, flooding houses and sewer overflows through disrupting sewage pumping, or harmful environmental discharge from disrupted sewage treatment. Any such disruptions could be possible by hacking into any internet-based system that connects and operates remote infrastructure.
Fortunately, there are approaches to help utilities improve their security. These include the National Institute for Standards and Technology (NIST)xxv in the US and the ISO Protocolsxxvi. NIST 800-53 is designed to assist utilities understand their current security maturity and actions
required to address security deficiencies. Information detect and minimise security impacts. One particular area that is seen to carry specific risk and unusual cybersecurity risks is the IoT. These risks centre on the accessibility of currently deployed devices and the lack of consistent security protocols in many counties in relation to these devices. Such protocols include the ability to have antivirus software on the devices in a manner that it can be easily upgradedxxvii. According to one IT security expertxxviii, there are significant security issues that need to be considered, especially when considering the applications of IoT across water networks. Much effort is currently focussed on network perimeter security - keeping attackers out of our servers, etc. but less effort is being spent on ensuring the confidentiality and integrity of the data itself. When data is not encrypted and signed, it is vulnerable to theft and forgery. For example, in the 2016, over 600,000 patient records were stolen in three attacks on clinics in the USA.
Cybersecurity risks with IoT and possible approaches to resolve them are listed in Table 2. Encryption is one very effective way to protect data and digital operations from cyberattack.
Table 2: Security and Privacy challenges for the IoT xxix
Security and privacy challenges for the IoT
Issues Approach towards solutions
Security Internet security concerns are not new, however the IoT brings them to a new level. Every IoT device that is connected to the internet potentially affects the security and resilience of the internet globally. Ensuring IoT security must be a fundamental priority, to create and maintain trust in the devices and services.
Collaborative approach to developing security protocols and standards.
Exchange information about challenges and solutions.
Privacy Many IoT applications have the potential for increased surveillance and tracking. Concerns about privacy and potential harms may hold back full adoption and acceptance of the IoT
Strategies will need to be developed to respect individual privacy choices across a broad spectrum of expectations. Standards and regulations are required to underpin these strategies.
Standards Standards are critical to achieve best practice operation of IoT devices and resolve issues of security and privacy.
Additionally, to safety and privacy concerns, standards are also important to create interoperability across different systems.
Unified standards will enhance security of devices and curb the proliferation of devices that may act in disrupted ways to the internet. Currently there is a range of (competitive) standards being developed.
/24The Digital Water Utility of the Future

Data deserves the same attention as built assets. Do staff collect and manage it with the same care as they do with built assets? Do managers pay the same attention to it? Managers need to value and encourage databased asset management solutions as an alternative to building new assets — for instance, transport planners are using data analytics to optimise traffic flows with timed freeway ramp signals, thus avoiding the need to build extra lanesxxx. An analogous situation for water utilities could be the analysis of customer demands and the introduction of time-based tariffs to delay or avoid the construction of new assets.
Privacy and security of data is a crucial challenge as utilities reach out to external organisations to optimise performance
through digitisation. Customer data needs to be secure and protected from threats within a company as well as the outside world. Still, the data needs to be accessible and usable, perhaps even with an option to share the data with other companies or within the company, under adequate restrictions. The operational data through remote monitors, sensors, valves, pumps and mechanical equipment and the IoT needs to be secure so hackers cannot interfere and create hazards to human health, community safety or the environment. Data needs to be secured from loss by adequate backup systems, archives for not current data and needs to be subjected to integrity checks. This means systems and procedures need to be adapted to accommodate data security and privacy by design.
d. Valuing and securing data
/25The Digital Water Utility of the Future

Global Water Research Coalition
In the Netherlands, data and information about the state of primary flood defences infrastructure are traditionally acquired on a local scale. In recent years, developments took place supplying a range of measuring and monitoring techniques, systems and strategies that improve accuracy and reliability of flood defences. A parallel with Dutch dikes can be made with dams of drinking water or wastewater reservoirs.
Applying measuring and monitoring strategies and systems requires a well-designed data management
system. In past years, the Dike Data Service Centre (DDSC) was developed for the purpose of collection, storage and distribution of data to give insights to the quality and safety of the dike. DDSC yields live access at anytime and anywhere in the world to real time data. The DDSC was built for dike data, but can hold any data that are x-, y- and z-coordinates through time. Hence data originating from dams, if the sensors are yielding x-, y- and z- data through time, can be hosted as well. The data variables include temperature, water pressure and soil composition.
6 Case StudiesThis section will cover several case studies from around the world that cover digital solutions used in practice at various levels of digital maturity across the service line.
Privacy and security of data is a crucial challenge as utilities reach out to external organisations to optimise performance through digitisation. Customer data needs to be secure and protected from threats within a company as well as the outside world. Still, the data needs to be accessible and usable, perhaps even with an option to share the data with other companies or within the company, under adequate restrictions. The operational data through remote monitors, sensors, valves, pumps and mechanical equipment and the IoT needs to be secure so hackers cannot interfere and create hazards to human health, community safety or the environment. Data needs to be secured from loss by adequate backup systems, archives for not current data and needs to be subjected to integrity checks. This means systems and procedures need to be adapted to accommodate data security and privacy by design.
6. Case Studies
This section will cover several case studies from around the world that cover digital solutions used in practice at various levels of digital maturity across the service line.
Managing and utilising data from Dutch dikes through the Dike Data Service Centre (Improving Efficiencies within Business Units)
In the Netherlands, data and information about the state of primary flood defences infrastructure are traditionally acquired on a local scale. In recent years, developments took place supplying a range of measuring and monitoring techniques, systems and strategies that improve accuracy and reliability of flood defences. A parallel with Dutch dikes can be made with dams of drinking water or wastewater reservoirs.
Applying measuring and monitoring strategies and systems requires a well-designed data management system. In past years, the Dike Data Service Centre (DDSC) was developed for the purpose of collection, storage and distribution of data to give insights to the quality and safety of the dike. DDSC yields live access at anytime and anywhere in the world to real time data. The DDSC was built for dike data, but can hold any data that are x-, y- and z-coordinates through time. Hence data originating from dams, if the sensors are yielding x-, y- and z- data through time, can be hosted as well. The data variables include temperature, water pressure and soil composition.
Figure i: Schematic of the DDSC
Project LiveDike XL was formulated due to primary sea dike non-compliance to water safety standards and was started the with the goals of improving the comprehension and accuracy of dike behaviour, increasing dike monitoring and its alarm system, and improving the life cycle management of the dike in future. To achieve that, a baseline monitoring system was realized and expanded selectively, onsite loading experiments were simulated and obtained data was then analysed to determine the dike strength. The data of the project was proven useful for daily management of the levee as well as in case of emergency. The sensitivity of the dike was reinforced and a solution for realizing a warning system was found as well. The financial return of the project was a factor 10-15.
In recent years several monitoring projects were realized on Dutch dikes. An important goal of gaining a reliable insight in dike strength is that uncertainty in it leads to necessity of safety margins. It was proven that these uncertainties lead to falsely concluding the dikes do not comply to safety standards, leading to unnecessary reinforcements or to falsely concluding the dikes do comply to safety standards when in fact they should be reinforced. By acquiring, modelling and analysing the data, uncertainties are decreased and safety and/or the overall financial efficiency is being increased too. The general conclusion about the ratio between investments in measuring and monitoring versus efficiency increasement is a factor 10 to 20.
Managing and utilising data from Dutch dikes through the Dike Data Service Centre
(Improving Efficiencies within Business Units)
Figure i: Schematic of the DDSC
Project LiveDike XL was formulated due to primary sea dike non-compliance to water safety standards and was started the with the goals of improving the comprehension and accuracy of dike behaviour, increasing dike monitoring and its alarm system, and improving the life cycle management of the dike in future. To achieve that, a baseline monitoring system was realized and expanded selectively, onsite loading experiments were simulated and obtained data was then analysed to determine the dike strength. The data of the project was proven useful for daily management of the levee as well as in case of emergency. The sensitivity of the dike was reinforced and a solution for realizing a warning system was found as well. The financial return of the project was a factor 10-15.
In recent years several monitoring projects were realized on Dutch dikes. An important goal of gaining a reliable insight in dike strength is that uncertainty in it leads to necessity of safety margins. It was proven that these uncertainties lead to falsely concluding the dikes do not comply to safety standards, leading to unnecessary reinforcements or to falsely concluding the dikes do comply to safety standards when in fact they should be reinforced. By acquiring, modelling and analysing the data, uncertainties are
decreased and safety and/or the overall financial efficiency is being increased too. The general conclusion about the ratio between investments in measuring and monitoring versus efficiency increasement is a factor 10 to 20.
The Foundation of Applied Water Research (STOWA) is participating with a group of international partners in the EU-Interreg 2 Seas program 2014-2020 project ‘Polder2C’s. The main goal of this project is to prepare the 2 Seas Region for the emerging trends in Climate Change.
In the Hedwige-Prosperpolder, on the border between the Netherlands and Belgium, the existing Scheldedijk is to be replaced by a new levee in the coming years. The construction phase offers a unique Living Lab of several kilometres of levees. This is where flood defence and emergency response are tested. Before breaching the Scheldedijk and partly digging it out, tests are taken out to research the levee strength. After building a new levee, the existing Scheldedijk can be loaded until an actual breaking point. Simultaneously, prevention, willingly causing and repairing breaches are practised. This will be supported by large scale emergency response exercises. While loading the Scheldedijk, it will be closely measured and monitored. The data acquired will then be stored in the DDSC.
/26The Digital Water Utility of the Future

Global Water Research Coalition
In Singapore, the Marina Catchment has been at the forefront of the digital transformation for Stormwater networks, with the deployment Catchment and Waterways Operations System (CWOS) at the end of 2016 of the to bring about greater operational efficiency and management.
Built since mid-2015 as a collaboration between SUEZ and PUB, the CWOS is based on the Aquadvanced® Urban Drainage platform and existing sensors and models
developed by PUB. Since its deployment, the real-time system has been able to provide optimized operations strategies, with up to one-hour lead time, for the Marina Barrage, a dam built across the Marina channel for water supply and flood control. It has helped to monitor rising water levels within the Marina catchment, assess the severity of rainfall patterns and to monitor water quality from all available data sources.
The Foundation of Applied Water Research (STOWA) is participating with a group of international partners in the EU-Interreg 2 Seas program 2014-2020 project ‘Polder2C’s. The main goal of this project is to prepare the 2 Seas Region for the emerging trends in Climate Change.
In the Hedwige-Prosperpolder, on the border between the Netherlands and Belgium, the existing Scheldedijk is to be replaced by a new levee in the coming years. The construction phase offers a unique Living Lab of several kilometres of levees. This is where flood defence and emergency response are tested. Before breaching the Scheldedijk and partly digging it out, tests are taken out to research the levee strength. After building a new levee, the existing Scheldedijk can be loaded until an actual breaking point. Simultaneously, prevention, willingly causing and repairing breaches are practised. This will be supported by large scale emergency response exercises. While loading the Scheldedijk, it will be closely measured and monitored. The data acquired will then be stored in the DDSC.
Digital transformation for Stormwater Management in Singapore: The Case of the Marina Catchment (Tight Integration between Business Units)
In Singapore, the Marina Catchment has been at the forefront of the digital transformation for Stormwater networks, with the deployment Catchment and Waterways Operations System (CWOS) at the end of 2016 of the to bring about greater operational efficiency and management.
Built since mid-2015 as a collaboration between SUEZ and PUB, the CWOS is based on the Aquadvanced® Urban Drainage platform and existing sensors and models developed by PUB. Since its deployment, the real-time system has been able to provide optimized operations strategies, with up to one-hour lead time, for the Marina Barrage, a dam built across the Marina channel for water supply and flood control. It has helped to monitor rising water levels within the Marina catchment, assess the severity of rainfall patterns and to monitor water quality from all available data sources.
Figure ii: Marina Barrage operations overview – Numbers and values are for illustration purposes only.
CWOS has been
developed to integrate several data streams together in a single platform to provide an effective decision-making tool for Catchment & Waterways Operations. It now has the capability to automatically detect operational anomalies through simple data analytics as well as Machine Learning techniques and provide notifications to users thus saving effort and reducing reaction time.
As a computational platform, CWOS can run simulations using Hydraulic/Hydrological models to anticipate levels and flows in the drainage network coming from rainfall. It has also integrated three water quality models which can be run automatically to provide water quality forecasts. Work is on-going to operationalize this capability. These quantitative simulations provide users with a very powerful tool for decision making. In the case of Marina
Figure ii: Marina Barrage operations overview – Numbers and values are for illustration purposes only.
CWOS has been developed to integrate several data streams together in a single platform to provide an effective decision-making tool for Catchment & Waterways Operations. It now has the capability to automatically detect operational anomalies through simple data analytics as well as Machine Learning techniques and provide notifications to users thus saving effort and reducing reaction time.
As a computational platform, CWOS can run simulations using Hydraulic/Hydrological models to anticipate levels
and flows in the drainage network coming from rainfall. It has also integrated three water quality models which can be run automatically to provide water quality forecasts. Work is on-going to operationalize this capability. These quantitative simulations provide users with a very powerful tool for decision making. In the case of Marina Barrage operations, an optimization module was even developed and implemented considering all operational constraints to provide advisories to operators on the number of gates and pumps to be operated.
Digital transformation for Stormwater Management in Singapore: The Case of the Marina Catchment
(Tight Integration between Business Units)
Case Studies
/27The Digital Water Utility of the Future

Global Water Research Coalition
Veolia has developed an online daily monitoring report for water resources used to produce drinking water, Resources Report. It is available as a webservice in French and in English. It has been applied to cities in France (Le Touquet, Toulon, Fréjus) and is now proposed in new contracts dealing with water scarcity. This report helps drinking water production services to detect critical situations and anticipate water deficits, in order to take appropriate management decisions in issues such as water purchases, transfers, alternative resources, etc. It is a resilience approach to securing continuity of drinking water production in a context of freshwater scarcity and climate change.
The Veolia’s Resources Report provides municipalities with the following information
• Daily status of water supplies and withdrawals for drinking water production, based on operating data
• Perspective with past situations, good management practices and regulations
• Determination of a water supply stress indicator
• Indicators for warning or crisis situations
• Water manager personal analysis
• Ongoing legal restrictions
• Links to websites of interest: local river management, local restrictions, federal water reports
The report uses dynamic graphics to allow comparison of the actual situation to past situations, regulatory values and management practices and includes parameters such as raw water withdrawals, rainfall, water transfers. It also shows a map of the contractual perimeter and decision support indicators to illustrate the status of water resources and drinking water production. This information is available daily, for any type of water resource (river, reservoir, groundwater). An example of the report can be seen in figure iii.
Barrage operations, an optimization module was even developed and implemented considering all operational constraints to provide advisories to operators on the number of gates and pumps to be operated.
Veolia’s Resources Report (Integration between Business Units) Veolia has developed an online daily monitoring report for water resources used to produce drinking water, Resources Report. It is available as a webservice in French and in English. It has been applied to cities in France (Le Touquet, Toulon, Fréjus) and is now proposed in new contracts dealing with water scarcity. This report helps drinking water production services to detect critical situations and anticipate water deficits, in order to take appropriate management decisions in issues such as water purchases, transfers, alternative resources, etc. It is a resilience approach to securing continuity of drinking water production in a context of freshwater scarcity and climate change. The Veolia’s Resources Report provides municipalities with the following information
• Daily status of water supplies and withdrawals for drinking water production, based on • operating data • Perspective with past situations, good management practices and regulations • Determination of a water supply stress indicator • Indicators for warning or crisis situations • Water manager personal analysis • Ongoing legal restrictions • Links to websites of interest: local river management, local restrictions, federal water reports
The report uses dynamic graphics to allow comparison of the actual situation to past situations, regulatory values and management practices and includes parameters such as raw water withdrawals, rainfall, water transfers. It also shows a map of the contractual perimeter and decision support indicators to illustrate the status of water resources and drinking water production. This information is available daily, for any type of water resource (river, reservoir, groundwater). An example of the report can be seen in figure iii. Figure iii: Waternamics® Resources Report example
Smart Management of District Metered Areas (DMAs) in Beijing, China (Improving Efficiencies within Business Units)
In Beijing, China, to reduce the water loss in the network, the pipe networks are partitioned into smaller sub-networks, known as district metered areas (DMAs). The number of DMAs has increased over the past decade with more than 800 built by the Beijing Waterworks Group (BWG) to date. This necessitated a smart digital solution to organise and manage the data retrieved from each DMA to deliver effective decision support. As a result, BWG collaborated with researchers from the Research Centre for Eco-Environmental Sciences, Chinese Academy of Sciences (RCEES, CAS) to gather required data and develop a model that would use Minimum Night Flow (MNF) data to determine which DMA needed maintenance or repair.
Figure iii: Waternamics® Resources Report example
Veolia’s Resources Report
(Integration between Business Units)
Case Studies
/28The Digital Water Utility of the Future

Global Water Research Coalition
In Beijing, China, to reduce the water loss in the network, the pipe networks are partitioned into smaller sub-networks, known as district metered areas (DMAs). The number of DMAs has increased over the past decade with more than 800 built by the Beijing Waterworks Group (BWG) to date. This necessitated a smart digital solution to organise and manage the data retrieved from each DMA to deliver effective decision support. As a result, BWG collaborated with researchers from the Research Centre for Eco-Environmental Sciences, Chinese Academy of Sciences (RCEES, CAS) to gather required data and develop a model that would use Minimum Night Flow (MNF) data to determine which DMA needed maintenance or repair.
As each DMA was unique, the research team collected a suit of data that included properties such as pipe lengths, material and age from the GIS database of the pipe network, the number of properties they supplied from their customer database and flow and pressure data from their SCADA systems. This was fed into their models which correlated MNF data with flow and pressure under different circumstances. The model was applied to the different water loss control measures (e.g. pipe replacement, flow reduction, installation of leak detection mechanisms) and a predicted MNF was produced which was then used in a cost-benefit analysis to advice the best measure to use. Figure iv depicts the process of the water loss control strategy developed through the collaboration.
As each DMA was unique, the research team collected a suit of data that included properties such as pipe lengths, material and age from the GIS database of the pipe network, the number of properties they supplied from their customer database and flow and pressure data from their SCADA systems. This was fed into their models which correlated MNF data with flow and pressure under different circumstances. The model was applied to the different water loss control measures (e.g. pipe replacement, flow reduction, installation of leak detection mechanisms) and a predicted MNF was produced which was then used in a cost-benefit analysis to advice the best measure to use. Figure iv depicts the process of the water loss control strategy developed through the collaboration.
Figure iv. Water loss control strategy optimization for DMAs in Beijing
The conditions of 391 DMAs in Beijing were assessed which resulted in the replacement of pipes in 136 DMAs, the installation of leak detection mechanism in 36 DMAs and pressure reduction in 24 DMAs. This solution was estimated to save Beijing 12.61 million m3 of water, 3.78 million kWh of energy and 37.19 million yuan per year.
Energy savings in municipalities with Watener ICT Smart Solution
(Improving Efficiencies within Business Units)
In Germany, the Water Technology Centre of Karlsruhe (TZW) initiated an EU project with Stadtwerke Karlsruhe (SWKA), a German municipal Water Utility, and partners in Spain to develop a digital solution to improve the network’s operational management in order to reduce the energy consumption of the water distribution system. The SWKA serves a region with 400,000 inhabitants and distributes about 24 Hm3 of water per year. The water is supplied from four treatment plants and main pumping stations and it is distributed by more than 900 km of pipeline.
The outcome was the WatEner ICT Smart Solution (owned by the Inclam Group, Spain), a platform that provides an important set of components for the management of SWKA which includes the visualization of essential operating data, a planning tool for pumping schedules, accurate water demand forecast, efficient use of the hydraulic network model and the automatic detection of anomalies amongst several other features. WatEner has been evaluated and tested by technical experts in Karlsruhe, engineers of SWKA and used by the staff of the control centre (24/7) highlighting a precise Demand Forecast System (DFS) per District Metered Areas (DMA) and efficient planning for the pumping schedules in order to reduce the energy consumption and costs. The outcome of the WatEner implementation show a reduction of energy consumption of 5-7% and energy costs savings up to 50,000 € per year. Watener can also be used for performance monitoring and it can be linked with purchase orders from the power market. Smart Network Solutions from the Water Research Commission (South Africa) Water Technologies Demonstration Programme (WADER)
(Improving Efficiencies within Business Units / Enhancing customer-supplier interface)
The Water Technologies Demonstration Programme (WADER), was set up by the Water Research Commission of South Africa to streamline the water innovation space (with a focus on technology demonstration and assessment).
Figure iv. Water loss control strategy optimization for DMAs in Beijing
The conditions of 391 DMAs in Beijing were assessed which resulted in the replacement of pipes in 136 DMAs, the installation of leak detection mechanism in 36 DMAs and pressure reduction in 24 DMAs. This solution was estimated to save Beijing 12.61 million m3 of water, 3.78 million kWh of energy and 37.19 million yuan per year.
Smart Management of District Metered Areas (DMAs) in Beijing, China
(Improving Efficiencies within Business Units)
Case Studies
/29The Digital Water Utility of the Future
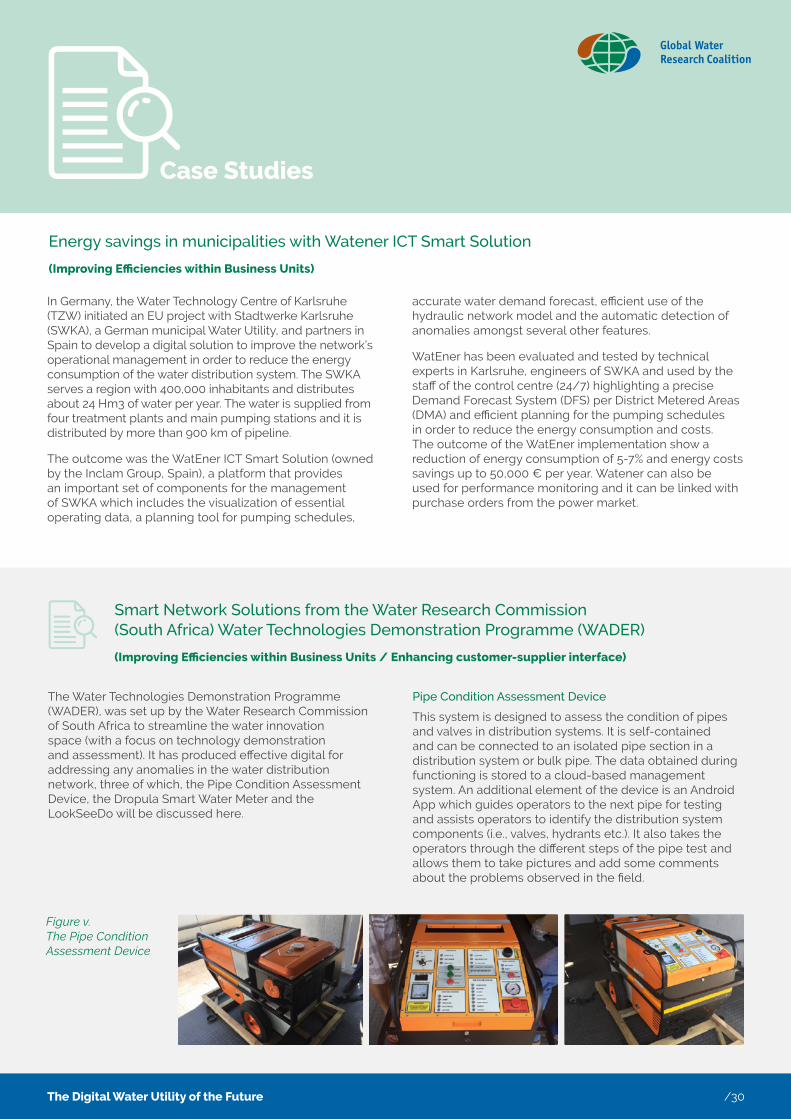
Global Water Research Coalition
In Germany, the Water Technology Centre of Karlsruhe (TZW) initiated an EU project with Stadtwerke Karlsruhe (SWKA), a German municipal Water Utility, and partners in Spain to develop a digital solution to improve the network’s operational management in order to reduce the energy consumption of the water distribution system. The SWKA serves a region with 400,000 inhabitants and distributes about 24 Hm3 of water per year. The water is supplied from four treatment plants and main pumping stations and it is distributed by more than 900 km of pipeline.
The outcome was the WatEner ICT Smart Solution (owned by the Inclam Group, Spain), a platform that provides an important set of components for the management of SWKA which includes the visualization of essential operating data, a planning tool for pumping schedules,
accurate water demand forecast, efficient use of the hydraulic network model and the automatic detection of anomalies amongst several other features.
WatEner has been evaluated and tested by technical experts in Karlsruhe, engineers of SWKA and used by the staff of the control centre (24/7) highlighting a precise Demand Forecast System (DFS) per District Metered Areas (DMA) and efficient planning for the pumping schedules in order to reduce the energy consumption and costs. The outcome of the WatEner implementation show a reduction of energy consumption of 5-7% and energy costs savings up to 50,000 € per year. Watener can also be used for performance monitoring and it can be linked with purchase orders from the power market.
The Water Technologies Demonstration Programme (WADER), was set up by the Water Research Commission of South Africa to streamline the water innovation space (with a focus on technology demonstration and assessment). It has produced effective digital for addressing any anomalies in the water distribution network, three of which, the Pipe Condition Assessment Device, the Dropula Smart Water Meter and the LookSeeDo will be discussed here.
Pipe Condition Assessment Device
This system is designed to assess the condition of pipes and valves in distribution systems. It is self-contained and can be connected to an isolated pipe section in a distribution system or bulk pipe. The data obtained during functioning is stored to a cloud-based management system. An additional element of the device is an Android App which guides operators to the next pipe for testing and assists operators to identify the distribution system components (i.e., valves, hydrants etc.). It also takes the operators through the different steps of the pipe test and allows them to take pictures and add some comments about the problems observed in the field.
Figure v. The Pipe Condition Assessment Device
Smart Network Solutions from the Water Research Commission (South Africa) Water Technologies Demonstration Programme (WADER)
(Improving Efficiencies within Business Units / Enhancing customer-supplier interface)
It has produced effective digital for addressing any anomalies in the water distribution network, three of which, the Pipe Condition Assessment Device, the Dropula Smart Water Meter and the LookSeeDo will be discussed here. Pipe Condition Assessment Device
This system is designed to assess the condition of pipes and valves in distribution systems. It is self-contained and can be connected to an isolated pipe section in a distribution system or bulk pipe. The data obtained during functioning is stored to a cloud-based management system. An additional element of the device is an Android App which guides operators to the next pipe for testing and assists operators to identify the distribution system components (i.e., valves, hydrants etc.). It also takes the operators through the different steps of the pipe test and allows them to take pictures and add some comments about the problems observed in the field.
Figure v. The Pipe Condition Assessment Device
Dropula Smart Water Meter
The Dropula smart water monitoring device reports water consumption, from existing water meters, to BridgIoT’s cloud platform. The solution has been proven to be effective in saving water and enabling behaviour change. Two main modes of saving water are made possible by Dropula through SMS and email notifications sent in the event of anomalous or unexpected behaviour, and through visualised, real-time, and historic usage reporting, which encourages behaviour changes.
Figure vi. Dropula Smart Water Meter Figure vII. The LookSeedo
LookSeeDo
Look See Do’s Remote Technician Tool (RTT) enables a remotely based expert to assist a remotely located field technician to perform maintenance and repairs on equipment, thereby avoiding the requirement of the expert having to travel to site. This is a significant development in that historically the expert would be required to travel to site to perform operations, maintenance and repair procedures. It operates at extremely low bandwidth so that even equipment sites with very poor internet connectivity can be supported. The application works on entry level smart phones or laptop computers. Its unique communication methodology combines various visual tools linked with text which reduces risk of miscommunication.
Energy savings in municipalities with Watener ICT Smart Solution
(Improving Efficiencies within Business Units)
Case Studies
/30The Digital Water Utility of the Future

Global Water Research Coalition
Dropula Smart Water Meter
The Dropula smart water monitoring device reports water consumption, from existing water meters, to BridgIoT’s cloud platform. The solution has been proven to be effective in saving water and enabling behaviour change. Two main modes of saving water are made possible by Dropula through SMS and email notifications sent in the event of anomalous or unexpected behaviour, and through visualised, real-time, and historic usage reporting, which encourages behaviour changes.
LookSeeDo
Look See Do’s Remote Technician Tool (RTT) enables a remotely based expert to assist a remotely located field technician to perform maintenance and repairs on equipment, thereby avoiding the requirement of the expert having to travel to site. This is a significant development in that historically the expert would be required to travel to site to perform operations, maintenance and repair procedures. It operates at extremely low bandwidth so that even equipment sites with very poor internet connectivity can be supported. The application works on entry level smart phones or laptop computers. Its unique communication methodology combines various visual tools linked with text which reduces risk of miscommunication.
Look See Do has also built a Virtual Reality training platform for skills development for technical vocations including safety, operation, and maintenance training for trainees at various levels of competence and experience. The training platform provides a low-level training course development interface which means that non-programmers can develop training courses without the need for Virtual Reality developers to be involved. This provides over 80% reduction in cost for Virtual reality training and the ability to quickly implement new training modules within the organisation.
It has produced effective digital for addressing any anomalies in the water distribution network, three of which, the Pipe Condition Assessment Device, the Dropula Smart Water Meter and the LookSeeDo will be discussed here. Pipe Condition Assessment Device
This system is designed to assess the condition of pipes and valves in distribution systems. It is self-contained and can be connected to an isolated pipe section in a distribution system or bulk pipe. The data obtained during functioning is stored to a cloud-based management system. An additional element of the device is an Android App which guides operators to the next pipe for testing and assists operators to identify the distribution system components (i.e., valves, hydrants etc.). It also takes the operators through the different steps of the pipe test and allows them to take pictures and add some comments about the problems observed in the field.
Figure v. The Pipe Condition Assessment Device
Dropula Smart Water Meter
The Dropula smart water monitoring device reports water consumption, from existing water meters, to BridgIoT’s cloud platform. The solution has been proven to be effective in saving water and enabling behaviour change. Two main modes of saving water are made possible by Dropula through SMS and email notifications sent in the event of anomalous or unexpected behaviour, and through visualised, real-time, and historic usage reporting, which encourages behaviour changes.
Figure vi. Dropula Smart Water Meter Figure vII. The LookSeedo
LookSeeDo
Look See Do’s Remote Technician Tool (RTT) enables a remotely based expert to assist a remotely located field technician to perform maintenance and repairs on equipment, thereby avoiding the requirement of the expert having to travel to site. This is a significant development in that historically the expert would be required to travel to site to perform operations, maintenance and repair procedures. It operates at extremely low bandwidth so that even equipment sites with very poor internet connectivity can be supported. The application works on entry level smart phones or laptop computers. Its unique communication methodology combines various visual tools linked with text which reduces risk of miscommunication.
Figure vi. Dropula Smart Water Meter Figure vii. The LookSeedo
Continued | Smart Network Solutions from the Water Research Commission (South Africa) Water Technologies Demonstration Programme (WADER)
Case Studies
/31The Digital Water Utility of the Future

Global Water Research Coalition
The Metropolitan Sewer District of Greater Cincinnati (MSDGC) covers an area of 290 sq. miles and serves approximately 226,000 customers. It has one of the most challenging collection systems in the United States to manage during wet weather as it contains more than 200 combined sewer overflow points. Together these overflows discharge over 11 billion gallons of sewage into the Ohio River and its tributaries during a typical year. The utility is under two consent decrees to reduce these overflows, with the cost of compliance exceeding $3.2 billion. With sewer rate increases over the last 10 years bringing the typical household’s bill close to the limits of affordability, MSDGC was driven to find new ways that were less costly to address its wet weather challenges and therefore initiated the District’s Smart Sewer System. The goals of the system were to enable real time visibility of the wastewater system and to maximize storage, conveyance, and treatment capacity during wet weather.
The initiative saw level, flow and pressure sensors installed at over 650 locations. By 2018, the Smart Sewer System extended over all combined-sewer areas of the MSDGC collection system, incorporating three major treatment plants, nine wet weather storage and treatment facilities, eight major interceptor sewers, all 276 overflow points, 27 rain gauges and seven river level sites.
Even in its early deployment, the benefits of the system were demonstrated. Remote monitoring has improved the maintenance of wet-weather facilities, and remote control of facilities enables quicker response to extreme events. The
MSDGC quantified that these new capabilities provided by the dedicated wet weather SCADA reduced overflows from the collection system an average of 400 million gallons per year, at a cost of $0.01/gallon. Compared to a cost of $0.40/gallon to store and upwards of $1.00/gallon to treat this overflow volume, the SCADA system is proving to be a very cost-effective investment. In addition, several unanticipated benefits have been uncovered. Treatment plant operators, whose view was previously limited to within the treatment plant, began “seeing” the collection system for the first time. Plant operators now have timely information with which to bring additional equipment online “just-in-time” based on a developing storm and adjust influent gates during periods of river intrusion. Further, specialized alerts generated by the system enable a large industrial customer to adjust its discharge of high-strength waste during specified wet-weather conditions, reducing the threat of release to the environment.
Altogether, the smart sewer network enables MSDGC to optimize the use of existing infrastructure in real-time so that fewer and smaller facilities need to be built in the future, reducing the capital investments needed to comply with the next phase of the consent decrees by tens of millions of dollars. A real-time window into the collection system during wet weather has also exposed the underutilization of interceptor sewers as rainfall is often spatially varied. The upsizing of CSO underflow pipes and the addition of automated control gates that are integrated into the wet-weather SCADA system are planned as future cost effective wet-weather solutions that further leverage the capabilities of a smart sewer network.
Service NSW is a statutory agency within the Department of Customer Service in New South Wales, Australia that acts as a single contact point for a large and growing variety of government services. It consolidates service delivery through collaborations with external organisations that serve the same group of customers and integrates different services for improved customer service.
Service NSW combined 900 websites and 30 different contact centres into one website and one phone number making it easier for NSW residents and businesses to access government services from police services to transport, to environment, land and water
Metropolitan Sewer District of Greater Cincinnati, (Cincinnati, Ohio) Smart Sewer System
(Improving Efficiencies within Business Units)
Servicing Customers from Common Platform – Service NS
(Integrating with Community)
Case Studies
/32The Digital Water Utility of the Future
7 References
i The International Water Association 2019 Digital Water: Industry leaders chart the transformation journey viewed at https://iwa-network.org/publications/digital-water/ on 23/01/2020
ii Gartner 2017 IT Glossary viewed at http://www.gartner.com/it-glossary/digitalization/ on 22/01/2020
iii Deloitte 2015: Digital Government Transformation (Commissioned by Adobe) viewed at https://www2.deloitte.com/content/dam/Deloitte/au/Documents/Economics/deloitte-au-economics-digital-government-transformation-230715.pdf, viewed on 01/2020
iv HM Government 2015, Industrial Strategy: Government and industry working in partnership, viewed at https://assets.publishing.service.gov.uk/government/uploads/system/uploads/attachment_data/file/34710/12-1327-building-information-modelling.pdf, viewed on 22/01/2020
v HM Government, 2015 Digital Built Britain, Level 3, Building Information Modelling – Strategic Plan viewed at https://assets.publishing.service.gov.uk/government/uploads/system/uploads/attachment_data/file/410096/bis-15-155-digital-built-britain-level-3-strategy.pdf viewed on 22/01/2020
vi Accenture, 2015, The New Energy Consumer, Unleashing Business Value in a Digital World, Accenture, viewed at https://www.accenture.com/_acnmedia/accenture/next-gen/insight-unlocking-value-of-digital-consumer/pdf/accenture-new-energy-consumer-final.pdf on 22/01/2020
vii Broeders, H. and Khanna, S. (McKinsey) 2015 Strategic Choices for Banks in the Digital Age at http://www.mckinsey.com/industries/financial-services/our-insights/strategic-choices-for-banks-in-the- digital-age#0, viewed on 22/01/2020
viii UK Government Digital Service 2019 Digital marketplace buyers and suppliers information, viewed at https://www.gov.uk/government/collections/digital-marketplace-buyers-and-suppliers-information on 22/01/2020
ix http://www.themandarin.com.au/4723-pop-cafes-soon-reality-nsw/
x National Climate Change Research Adaptation Facility, 2015, viewed at https://www.nccarf.edu.au/localgov/resources/climatedogs-four-drivers-influence-victorias-climate on 22/01/2020
xi Water Services Association of Australia, 2017, Harnessing the Digital Economy: Digital Utility Roadmap
xii http://treewifi.org/
xiii Gartner 2016 Top 10 Trends Shaping the Utility Industry in 2016, Published: 28 March 2016, Zarko Sumic, Randy Rhodes, Leif Eriksen, Chet Geschickter
xiv https://www.changemakers.com/globalgoals2015/entries/vandebron
xv http://reneweconomy.com.au/2016/bitcoin-inspired-peer-to-peer-solar-trading-trial-kicks-off-in-perth-29362
xvi Water Services Association of Australia, 2017, Workforce Skills of the Future
xvii Business.com, 2016, Big data, big problem: coping with shortage of talent in data analysis viewed at http://www.business.com/recruiting/big-data-big-problem-coping-with-shortage-of-talent-in-data-analysis/on 23/01/2020
xviii Ransbotham, S., Kiron, D., and Kirk Prentice, PMIT Sloan Management Review 2015 The Talent Dividend: analytics talent is driving competitive advantage at data-oriented companies viewed at http://sloanreview.mit.edu/projects/analytics-talent-dividend/ on 23/01/2020
xix Williams, A., CMO 2015, Report reveals Australia faces digital skills shortage viewed at http://www.cmo.com.au/article/573527/report-reveals-australia-faces-digital-skills-shortage/ on 23/01/2020
xx McKinsey, 2016, Achieving a digital state of mind, viewed at https://www.mckinsey.com/industries/technology-media-and-telecommunications/our-insights/achieving-a-digital-state-of-mind on 23/01/2020
/33The Digital Water Utility of the Future

xxi Francesco, B, Gabhoué, B, Schneider, J, (McKinsey) 2015 Recall No. 22 Higher satisfaction at lower costs: Digitizing customer care, viewed at https://www.mckinsey.com/~/media/mckinsey/industries/technology%20media%20and%20telecommunications/telecommunications/our%20insights/lessons%20from%20digital%20telcos%20five%20initiatives%20to%20improve%20business%20performance/higher_satisfaction_at_lower_costs_digitizing_customer_care.ashx on 22/01/2020
xxii Slade Group, 2015, Digital skills fall short viewed at http://www.sladereport.com.au/tag/digital-talent/viewed on 23/01/2020
xxiii The emerging Future, 2019, Disruptive Technology, riding the emerging wave of the future, viewed at http://theemergingfuture.com/disruptive-technology.htm on 22/01/2020
xxiv Internet of Things Alliance Australia 2018, IoT Reference Framework, Application Guide, viewed at http://www.iot.org.au/wp/wp-content/uploads/2016/12/IoT-Reference-Framework-Application-Guide-v1.0.pdf on 23/01/2020
xxv National Institute of Standards and Technology (NIST) 2019 Special Publication 800-53 (Version 4), viewed at https://nvd.nist.gov/800-53 on 23/01/2020
xxvi International Standards Organization 2018 ISO/IEC 27001:2018 Information Security Framework
xxvii Department of Home Affairs Australia, 2019 Draft code of practice: Securing the Internet of Things for Consumers viewed at https://www.homeaffairs.gov.au/reports-and-pubs/files/code-of-practice.pdf on 23/01/2020
xxviii Pers Com, 2015 Linus Chang, founder of Melbourne based encryption company Scram Software
xxix Rose, K., Eldridge, S., Chapin, L., 2015, The Internet of Things: an Overview, Understanding the Issues and Challenges of a More Connected World viewed at http://www.internetsociety.org/sites/default/files/ISOC-IoT-Overview-20151221-en.pdf on 23/01/2020
xxx http://www.me.berkeley.edu/~horowitz/Publications_files/All_papers_numbered/61aj_Gomes_May_Horowit z_TRB04.pdf viewed in December 2015
/34The Digital Water Utility of the Future
Acknowledgements
This paper was kindly prepared and coordinated by PUB – Public Utilities Board and the Water Services Association of Australia (WSAA). In-kind support and input to the case studies was provided by the GWRC Board members and partners.
Disclaimer
The Collaborators and the Global Water Research Coalition (GWRC) assume no responsibility for the content of this publication or for the opinions or statements of fact expressed in this document. The mention of trade names for commercial products does not represent or imply the approval or endorsement thereof by the Collaborators or GWRC. This document is presented solely for informational purposes.
Copyright © 2021
By Global Water Research Coalition
/35The Digital Water Utility of the Future

Global Water Research Coalition
PO Box 497, Unley SA 5061, Australia
www.globalwaterresearchcoalition.net
twitter.com/gwrc2
linkedin.com/company/global-water-research-coalition
Global Water Research Coalition