Projected water consumption in future global agriculture: Scenarios and related impacts
11
Projected water consumption in future global agriculture: Scenarios and related impacts Stephan Pfister a, b, ⁎ , 1 , Peter Bayer c , Annette Koehler a , Stefanie Hellweg a a ETH Zurich, Institute of Environmental Engineering, 8093 Zurich, Switzerland b UC Santa Barbara, Bren School, Santa Barbara, CA 93106-5131, United States c ETH Zurich, Geological Institute, 8092 Zurich, Switzerland abstract article info Article history: Received 7 March 2011 Received in revised form 6 July 2011 Accepted 6 July 2011 Available online xxxx Keywords: Land use Water consumption Water stress Land stress Future scenarios Water footprint Global stress on water and land resources is increasing as a consequence of population growth and higher caloric food demand. Many terrestrial ecosystems have already massively been degraded for providing agricultural land, and water scarcity related to irrigation has damaged water dependent ecosystems. Coping with the food and biomass demand of an increased population, while minimizing the impacts of crop production, is therefore a massive upcoming challenge. In this context, we developed four strategies to deliver the biotic output for feeding mankind in 2050. Expansion on suitable and intensification of existing areas are compared to assess associated environmental impacts, including irrigation demand, water stress under climate change, and the productivity of the occupied land. Based on the agricultural production pattern and impacts of the strategies we identified the trade-offs between land and water use. Intensification in regions currently under deficit irrigation can increase agricultural output by up to 30%. However, intensified crop production causes enormous water stress in many locations and might not be a viable solution. Furthermore, intensification alone will not be able to meet future food demand: additionally, a reduction of waste by 50% along the food supply chain or expansion of agricultural land is required for satisfying current per-capita meat and bioenergy consumption. Suitable areas for such expansion are mainly located in Africa, followed by South America. The increased land stress is of smaller concern than the water stress modeled for the intensification case. Therefore, a combination of waste reduction with expansion on suitable pastures generally results as the best option, along with some intensification on selected areas. Our results suggested that minimizing environmental impacts requires fundamental changes in agricultural systems and international cooperation, by producing crops where it is most environmentally efficient and not where it is closest to demand or cheapest. © 2011 Elsevier B.V. All rights reserved. 1. Introduction Agricultural production is currently accountable for 85% of global water consumption (Shiklomanov and Rodda, 2003) and projected to double by 2050 (Tilman et al., 2002). Irrigated area is expected to rise by a factor of 1.9 by 2050, while climate change is amplifying water stress by changing patterns of water availability in many parts of the world (Lobell et al., 2008). Finally, global production of biological energy resources is expanding and accelerates growth of agricultural production (Melillo et al., 2009). As a consequence of these pressures, water scarcity and land clearing represent major environmental concerns worldwide. The environmental impacts of water consumption and water stress are manifold. While aquatic and water dependent organisms are directly affected by water abstraction, there are also significant indirect effects. For instance, terrestrial ecosystems downstream of the location of water use may suffer from water stress through reduced natural water availability and groundwater drop (Maxwell and Kollet, 2008; Costanza et al., 2007). Agricultural land transfor- mation and occupation have direct ecological impacts on sites as well as on the surrounding landscape (Köllner, 2000). Generally, crop production deprives the land of most of its ecological value, e.g. through biodiversity degradation and disturbance of ecosystem functions. Coping with population growth as well as additional per-capita food demand represents a major challenge in feeding humanity in the future: The world average caloric intake of about 2800 kcal per person-day in the year 2000 is judged adequate for average activities (Lundqvist et al., 2008). However there are still about 570 million people living in countries with an average of less than 2200 kcal per person-day, which is considered the minimal amount to meet basic nutritional needs (Loftas and Ross, 1995). Clearly, this situation needs to be improved, while at the same time taking care that the impact on the environment remains limited. Science of the Total Environment xxx (2011) xxx–xxx ⁎ Corresponding author. Tel.: +41 44 633 75 71; fax: +41 44 633 15 79. E-mail address: stephan.pfi[email protected] (S. Pfister). 1 Present address: UC Santa Barbara, Bren School, Santa Barbara, United States. STOTEN-12770; No of Pages 11 0048-9697/$ – see front matter © 2011 Elsevier B.V. All rights reserved. doi:10.1016/j.scitotenv.2011.07.019 Contents lists available at ScienceDirect Science of the Total Environment journal homepage: www.elsevier.com/locate/scitotenv Please cite this article as: Pfister S, et al, Projected water consumption in future global agriculture: Scenarios and related impacts, Sci Total Environ (2011), doi:10.1016/j.scitotenv.2011.07.019
Transcript of Projected water consumption in future global agriculture: Scenarios and related impacts

Science of the Total Environment xxx (2011) xxx–xxx
STOTEN-12770; No of Pages 11
Contents lists available at ScienceDirect
Science of the Total Environment
j ourna l homepage: www.e lsev ie r.com/ locate /sc i totenv
Projected water consumption in future global agriculture: Scenarios andrelated impacts
Stephan Pfister a,b,⁎,1, Peter Bayer c, Annette Koehler a, Stefanie Hellweg a
a ETH Zurich, Institute of Environmental Engineering, 8093 Zurich, Switzerlandb UC Santa Barbara, Bren School, Santa Barbara, CA 93106-5131, United Statesc ETH Zurich, Geological Institute, 8092 Zurich, Switzerland
⁎ Corresponding author. Tel.: +41 44 633 75 71; fax:E-mail address: [email protected] (S. Pfiste
1 Present address: UC Santa Barbara, Bren School, San
0048-9697/$ – see front matter © 2011 Elsevier B.V. Aldoi:10.1016/j.scitotenv.2011.07.019
Please cite this article as: Pfister S, et al, PrEnviron (2011), doi:10.1016/j.scitotenv.201
a b s t r a c t
a r t i c l e i n f oArticle history:Received 7 March 2011Received in revised form 6 July 2011Accepted 6 July 2011Available online xxxx
Keywords:Land useWater consumptionWater stressLand stressFuture scenariosWater footprint
Global stress on water and land resources is increasing as a consequence of population growth and highercaloric food demand. Many terrestrial ecosystems have already massively been degraded for providingagricultural land, and water scarcity related to irrigation has damaged water dependent ecosystems. Copingwith the food and biomass demand of an increased population, while minimizing the impacts of cropproduction, is therefore amassive upcoming challenge. In this context, we developed four strategies to deliverthe biotic output for feeding mankind in 2050. Expansion on suitable and intensification of existing areas arecompared to assess associated environmental impacts, including irrigation demand, water stress underclimate change, and the productivity of the occupied land. Based on the agricultural production pattern andimpacts of the strategies we identified the trade-offs between land and water use. Intensification in regionscurrently under deficit irrigation can increase agricultural output by up to 30%. However, intensified cropproduction causes enormous water stress in many locations and might not be a viable solution. Furthermore,intensification alone will not be able to meet future food demand: additionally, a reduction of waste by 50%along the food supply chain or expansion of agricultural land is required for satisfying current per-capita meatand bioenergy consumption. Suitable areas for such expansion are mainly located in Africa, followed by SouthAmerica. The increased land stress is of smaller concern than the water stress modeled for the intensificationcase. Therefore, a combination of waste reduction with expansion on suitable pastures generally results as thebest option, along with some intensification on selected areas. Our results suggested that minimizingenvironmental impacts requires fundamental changes in agricultural systems and international cooperation,by producing crops where it is most environmentally efficient and not where it is closest to demand orcheapest.
+41 44 633 15 79.r).ta Barbara, United States.
l rights reserved.
ojected water consumption in future global a1.07.019
© 2011 Elsevier B.V. All rights reserved.
1. Introduction
Agricultural production is currently accountable for 85% of globalwater consumption (Shiklomanov and Rodda, 2003) and projected todouble by 2050 (Tilman et al., 2002). Irrigated area is expected to riseby a factor of 1.9 by 2050, while climate change is amplifying waterstress by changing patterns of water availability in many parts of theworld (Lobell et al., 2008). Finally, global production of biologicalenergy resources is expanding and accelerates growth of agriculturalproduction (Melillo et al., 2009). As a consequence of these pressures,water scarcity and land clearing represent major environmentalconcerns worldwide.
The environmental impacts of water consumption and waterstress are manifold. While aquatic and water dependent organismsare directly affected by water abstraction, there are also significant
indirect effects. For instance, terrestrial ecosystems downstream ofthe location of water use may suffer from water stress throughreduced natural water availability and groundwater drop (Maxwelland Kollet, 2008; Costanza et al., 2007). Agricultural land transfor-mation and occupation have direct ecological impacts on sites as wellas on the surrounding landscape (Köllner, 2000). Generally, cropproduction deprives the land of most of its ecological value, e.g.through biodiversity degradation and disturbance of ecosystemfunctions.
Coping with population growth as well as additional per-capitafood demand represents a major challenge in feeding humanity in thefuture: The world average caloric intake of about 2800 kcal perperson-day in the year 2000 is judged adequate for average activities(Lundqvist et al., 2008). However there are still about 570 millionpeople living in countries with an average of less than 2200 kcal perperson-day, which is considered the minimal amount to meet basicnutritional needs (Loftas and Ross, 1995). Clearly, this situation needsto be improved, while at the same time taking care that the impact onthe environment remains limited.
griculture: Scenarios and related impacts, Sci Total

Table 1Specification of the strategies for agriculture in 2050.
Case 1 Case 2 Case 3 Case 4
Goal Feed global population Feed global population Feed global population Feed global populationwith increased meat/biofuelproduction
Description Intensification on existingagricultural land(including waste reduction)
Expansion to pastures Expansion to pastures andnatural ecosystems (e.g. forests)
Intensification, waste reductionand expansion to pastures
Increase of production oncurrent agricultural areas
+26% agricultural output(I.4 in the Appendix). Calculatedbased on difference betweenoutput of optimal and current irrigation
– – See Case 1
Reduced food losses Food losses after harvest and wasteat distribution and householdlevel reduced by 50%(based on Lundqvist et al., 2008)
– – See Case 1
Agricultural expansion – 100% expansion on pastureswhich are at least moderatelysuitable for rainfedcereals according to(Fischer et al., 2000)
62.5% expansion on pasturesand 37.5% on natural ecosystems;which are highly suitable forrainfed cereals according to(Fischer et al., 2000)
See Case 2
Crops involved in analysis All 160 crops Expansion of maize andwheat only, distributionbased on analysis of mostsuitable cereal in each region(Fischer et al., 2000)
Expansion of maize and wheatonly, distribution based onanalysis of most suitable cereal ineach region (Fischer et al., 2000)
All 160 crops for intensification;maize and wheat for expansion
2 S. Pfister et al. / Science of the Total Environment xxx (2011) xxx–xxx
The objective of the current paper is the evaluation of theenvironmental impacts of water and land use related to the futuredemand of agricultural goods. For this purpose, four strategies toincrease food supply were modeled for the year 2050. The resultingfour cases facilitated the evaluation of potential impacts on land andwater resources of each of these strategies. Furthermore, the spatialdistribution of land andwater usewas characterized and compared, toillustrate the environmental consequences and regional “hot spots”resulting from different actions. The results are intended to provide abasis for policies supporting the reduction of environmental impacts,while enabling agricultural production to feed the global population.We do not present best-guess scenarios.
2. Methods
2.1. Strategies development
Four cases were developed which all describe strategies to provideenough food for sufficiently feeding the future global population. Itwas assumed that distributional concerns are taken care of and thatbasic sustainability criteria aremet, e.g. that no further land expansionis performed on rainforest area. Therefore, the strategies do notinclude the full range of possible developments, as several optimistic,sustainable assumptions are made. Rather, they serve as vehicles toevaluate and identify reasonable strategies to reach a desirable stateof the future, in terms of world food supply.
To meet the future world food demand, global food provisionneeds to increase with population growth. We used an average of UN(UN Population Division, 2009) and U.S. census (U.S. Census Bureau,2009) figures to project population growth from 6.1 billion in 2000 to9.2 billion in 2050, which represents an increase of 51%. A totalincrease in food provision by 60% was assumed to be necessary tocombat malnutrition.
Additional demand for food can be met with different strategiessuch as agricultural expansion, intensification, andwaste reduction. Inreality, these strategies will not be taken in isolation but incombination. However, to illustrate the environmental effect of bothstrategies, we developed separate cases: In Case 1, intensification oncurrent agricultural area by increasing irrigation and fertilization as
Please cite this article as: Pfister S, et al, Projected water consumption iEnviron (2011), doi:10.1016/j.scitotenv.2011.07.019
well as reduction of food waste was assumed. By contrast, Case 2entails expansion only on pastures and Case 3 expansion on both,pastures and natural ecosystems. Finally, a fourth strategy was addedwhere a combination of intensification and expansion was assumed(Case 4) allowing for increased per-capita consumption or for feedinga larger population. An overview of the characteristics of all fourstrategies is presented in Table 1.
Meat and dairy consumption was supposed to remain at the currentlevel (around 500 kcal per capita and day) in Cases 1–3, as forecasts ofincreasedmeat consumption per capitawere considered unsustainable.
In addition tomeat and dairy, also the cultivation shares of biofuelsand other non-edible crops, such as cotton or tobacco, were assumedto remain at the level of the reference year (2000) in Cases 1–3.Further expansion was considered unrealistic due to recognizednegative effects on the environment from such cultivation, includingpressure from high irrigation water use (Dominguez-Faus et al.,2009). However, non-edible crops could be cultivated at the expenseof meat production, or when combining intensification and expansionto provide additional agricultural output for increased meat, fiber orbiofuel production. Case 4 represented such a situation with highermaterial welfare but additional environmental burdens.
All strategies took the impact of climate change on precipitationinto account. As there were many climate models available, we usedthe “multi-model average” predictions of precipitation change of theIPCC A1B scenario (IPCC, 2007a) for the 2050s (21 models, IPCC,2007b). This approach best matched our assessments of populationgrowth and socio-economic developments. In addition to the fourcases with distinct strategies, a base case with constant foodproduction (year 2000 level) was defined. The purpose of this casewas to separately analyze the effects on water scarcity caused bychanged crop water consumption due to climate change and due toprojected increased domestic and industrial water use.
2.1.1. Case 1: Agricultural intensification and reduction of food wasteWith this strategy, productivity on existing agricultural areas
would improve by (i) meeting optimal irrigation water demand(assuming adequate fertilization where required) and (ii) reductionof food losses in the supply chain and at home by 50%, based on(Lundqvist et al., 2008). No agricultural land expansion was assumed.
n future global agriculture: Scenarios and related impacts, Sci Total

3S. Pfister et al. / Science of the Total Environment xxx (2011) xxx–xxx
2.1.2. Case 2: Pasture expansionThe expansion strategies presumed that increased food production
would be supplied by doubling the current grain production frommaize, rice, and wheat (1.75·109 t of grain), as these crops providedabout 60% of food calories (Loftas and Ross, 1995). However, in theanalysis, expansion of rice cultivation was excluded. This choice wasmade, as rice production was mainly favorable over maize and wheatin areas with rainforests (Fischer et al., 2000) and our study rejectedexpansion to such sensitive ecosystems. In Case 2, agriculturalexpansion was assumed to occur on pastures which were reportedto be at least moderately suitable for rainfed cereals productionregarding climate and soil conditions (Fischer et al., 2000). Thisstrategy assumed optimal irrigation that completely met crop waterrequirements (CWR) and proper fertilization on the expansion areas.No intensification of current agricultural area or enhanced produc-tion-chain efficiency was considered.
2.1.3. Case 3: Extensive expansionExpansion was assumed to occur on pastures and natural
ecosystems which were reported to be highly suitable for rainfedcereals production (Fischer et al., 2000), as opposed to Case 2 in whichalso moderately suitable areas were used. Further assumptions wereequivalent to Case 2. Due to limited availability of pastures on highlysuitable areas, 37.5% of expansion occurred on natural areas such asforests.
2.1.4. Case 4: Intensification and expansion (combination of Cases 1 and 2)Increased productivity on existing agricultural areas by universally
meeting irrigation water demands coupled with enhanced foodsupply and consumption efficiency (as in Case 1) were resulting anadditional 60% of current food energy uptake. Agricultural outputfrom expansion (as in Case 2) could provide another additional1.75·109 t of grains available for increased biofuel or meat produc-tion. For maize processed as first-generation biofuel, this amountcould replace about 7.2 billion GJ (7.2·1018 J) of fossil energy,assuming 4.1 GJ net fossil energy saving per tonne of maize (Pfisteret al., 2011). This additional bioenergy corresponded to 1.4% of theworld's current energy demand as reported by the Energy InformationAdministration (2009a) or 7.8% of liquid fuel consumption in globaltransportation in 2006 (Energy Information Administration, 2009b).Alternatively, this additional food energy could more than triplecurrent meat and dairy production, and offer a doubled meat anddairy supply per capita in 2050 or feed a population of 12 billionpeople.
Table 2Loss of food from pastures due to transformation into cropland.
Productivity lossof global pastures
Consequent meatand dairy outputchangea
Resulting change in total foodenergy due to changed meatand dairy outputb
Case 2/4 −6.1% −2.7% −0.4%Case 3 −3.7% −1.6% −0.2%
a 44% of fodder energy comes from pastures, based on (Wirsenius, 2003).b Meat and dairy provide 15% of total food energy (Lundqvist et al., 2008).
2.2. Model description
To model land and water use in the four cases a geographicinformation system (GIS) with a cell size of 5 arc minutes (less than10 km, depending on the latitude) was used. Total water consumption(TW) and irrigation water consumption meeting the irrigation waterrequirements (also called blue water, BW) was calculated based onevapotranspiration, precipitation and plant-growth seasons, accord-ing to the CROPWAT model (FAO, 1999) (see I.1 and I.2 in theAppendix). Land use was calculated based on the yield and growthperiods of the different crops according to Pfister et al. (2011) takinginto account the length of actual growth period of the specific cropscompared to length of natural growth period at the respectivelocation. Corresponding land stress was derived applying a weightingbased on potential net primary productivity of natural vegetation(NPP0) to the calculated land use (see I.3 in the Appendix). Multiplecrop rotations were only considered where already practiced in theyear 2000 and intensification by expanding greenhouse agriculturewas neglected.
Please cite this article as: Pfister S, et al, Projected water consumption iEnviron (2011), doi:10.1016/j.scitotenv.2011.07.019
2.3. Quantification and location of agricultural output in each case
2.3.1. Production increases through intensification (Cases 1 and 4)The potential for increased production for each crop i (Prodincrease,i
(%)) was estimated by the ratio of crop water requirements (TWmax)and the actual crop water consumption in the year 2000 (TWexpected),both modeled in Pfister et al. (2011) based on climate data of the“climate normal period” (1961–1990). We employed the equationand the crop-specific yield correction factors (ky, Table S1 in theAppendix) from FAO (Doorenbos et al., 1986) to calculate changes inproduction amounts per crop i arising from increased irrigation:
Prodincrease;i =1
1− ky· 1−TWexpected;i
.TWmax;i
� �� �−1
0B@
1CA·100% ð1Þ
The resulting overall relative increase in food energy production(Energyincrease) was calculated based on the average Prodincrease,i,weighted by the absolute current production amount Prodi of everycrop i (Eq. (2)). As mass–energy ratio of different crops varies (e.g.significantly between tomatoes and wheat) we separately analyzedthe Prodincrease of the main cereals rice, wheat and maize (providing~60% of all food energy, i=1–3). Energyincrease due to Prodincrease,i ofthe remaining 157 crops (providing ~40% of all food energy, i=4–160) was assumed to be proportional to the annual productiontonnage (Prod):
Energyincrease =∑i=1−3
Prodincrease;i � Prodi
� �
∑i=1−3
Prodið Þ ·60%
+∑i=4−160
Prodincrease;i � Prodi� �
∑i=4−160
Prodið Þ ·40%
ð2Þ
According to our calculations, optimal irrigation on current croppatterns could raise agricultural edible energy production by 26%. Inorder to meet the goal of 60% additional edible energy demandwithout expansion, overall energy losses from field to fork needed tobe reduced by a factor of 1.27: from currently 56% (Lundqvist et al.,2008) to 44%. Such increased food energy efficiency could be achievedby reducing harvesting losses and waste in distribution andhouseholds by 50%.
2.3.2. Production increases through expansion (Cases 2, 3 and 4)The impacts of expansion were calculated based on projected
yields for intensive maize and wheat cultivation based on (Fischer etal., 2000) (see section 2.1.2). The location of expansion was optimizedbased on best suitability for rainfed production and with priority onpastures.
As a side-effect, expansion on pastures led to decreased meat anddairy production. Therefore, we analyzed reductions in pastureproduction for Cases 2, 3 and 4 (I.5 in the Appendix) and estimatedthe resulting energy loss in animal food products as well as for theoverall human diet (Table 2). The calculated loss in meat energy
n future global agriculture: Scenarios and related impacts, Sci Total

4 S. Pfister et al. / Science of the Total Environment xxx (2011) xxx–xxx
revealed to be less than 3%, and corresponded to less than 0.5% of totalfood energy. These values indicated a minor relevance of this aspectand hence the potential decrease in meat and dairy production fromtransforming pastures into cropland is neglected.
2.4. Projected crop water consumption and related water stress
Changes in precipitation due to climate change and resultingchanges in irrigation water demand were taken into account in allcases. For this purpose, we calculated the change in precipitationpredicted by the IPCC “multi-model average” calculations for 2050 forscenario A1B (IPCC, 2007b) compared to the corresponding values ofthe “climate normal period” (1961–1990). These predicted precipi-tation changes are modeled on the “T42” resolution (ca. 2.8 arc-degree cell size) and subsequently interpolated to 5 arc-minuteresolution for each month (see I.6 in the Appendix). Plant adaptationto changed temperatures, changed reference evapotranspiration,climate zone shifts and potentially increased plant-growth produc-tivity due to increased CO2-concentration in the atmosphere (Rostet al., 2009) were neglected in these calculations.
The concept of water stress index (WSI) as proposed by (Pfisteret al., 2009) was used to assess the impact of water consumption onwater scarcity in the watershed. WSI is a spatially resolved function ofthe withdrawal-to-availability ratio within each watershed, and wasbased on the WaterGAP 2 model (Alcamo et al., 2003). For theprospective WSI of the year 2050 (WSI2050), two main factors neededto be considered: changed water availability through climate changeand altered withdrawals due to changing human activities.
WaterGAP 2 results for the IPCC scenario A2 in the time span of2041–2070 (“WaterGAP2050sA2”) (Alcamo et al., 2007) were usedfor our calculations because the global precipitation change of the“ECHAM4-OPYC”model for scenario A2 applied in WaterGAP 2 in thisperiod corresponded to the IPCC “multi-model average” calculationsfor 2050 in scenario A1B (IPCC, 2007b). However, it should be notedthat regional differences among different models were large (IPCC,2007b).
As the predicted population growth in the “WaterGAP2050sA2”was 25% higher than in the scenario A1B selected in this study, thechange inwithdrawals in eachwatershedwas proportionally adjustedto the A1B population increase. In doing so, we assumed the total per-capita withdrawal in 2050 to be equal in the A1B and A2 scenario,according to the estimations of a previous study (Shen et al., 2008).However, this neglected that the two scenarios largely vary byassumptions on technological and socio-economic developments(IPCC, 2007a), leading to different regional patterns of water use.WaterGAP 2 projections did not cover expansion of irrigation whilethey assumed water efficiency improvements and included climatechange (Alcamo et al., 2007). We therefore added the additionalirrigation water use of our simulations for 2050 to the withdrawalcalculations of “WaterGAP2050sA2”. For this purpose, all additionalirrigation water consumption required for the expansion andintensification in the different cases were converted to withdrawals,by globally assuming an optimistic irrigation efficiency of 70%(Hanasaki et al., 2008). Such efficiency could be achieved by usinglinedwater distribution canals and sprinkler irrigation (Brouwer et al.,1989) or a mix of drip irrigation, sprinkler and flood irrigationsystems. While our assumption reflected improved technologicalstandards expected in the future, efficiencies of up to 95%, as achievedby drip irrigation (Postel et al., 2001), seemed not realistic on globalaverage. Note that regional differences in irrigation water efficiencywere not considered in the current paper.
2.5. Impact of increased land use
Land use was calculated based on the yield and growth periods ofspecific crops and the natural length of growth period (Pfister et al.,
Please cite this article as: Pfister S, et al, Projected water consumption iEnviron (2011), doi:10.1016/j.scitotenv.2011.07.019
2011, described in I.3 in the Appendix). To assess the environmentalimpact of land use, we used an indicator based on the potential netprimary productivity (NPP0) of the used land, normalized by theglobal maximal NPP0 value of 1.5 kg carbon/(m2*year) (Haberl et al.,2007). Applied to land use, this indicator consequently presented theland use in equivalents of the most productive and hence absolutelyscarce land areas of the world. It does not explicitly account for theecological quality of land, such as biodiversity.
2.6. Comparing pressure from projected land and water use inagriculture
Environmental impacts from land and water use showed trade-offs. Yield maximization could result in irrigation with low waterefficiency (Rockstrom et al., 2007; Doorenbos et al., 1986; Wisseret al., 2008) (Case 1). On the other hand, rainfed agriculture generallyoccupied more productive land than irrigated cultivation (Cases 2–3).Agricultural expansion could either be on productive ecosystems ormarginal lands, with intensive and extensive production, respectively.For capturing these trade-offs and in order to quantitatively compareglobal agricultural production regarding use of land and waterresources, a conversion factor was proposed that helped to expressirrigation water consumption in terms of land-stress equivalents, i.e.equivalents of most productive land. Assuming that water availabilitycontributed to the productivity of land as much as other parameters(e.g. temperature, soil properties and solar radiation), we derived theconversion based on the average precipitation of 2.50 m/year(Mitchell and Jones, 2005) on areas with maximal NPP0 (N0.99),which are used as reference for land-stress calculations. The resultingconversion factor is hence 0.40(m2*year)/m3, representing the time–area equivalent of most productive areas needed to replenish a certainamount of freshwater consumed. Analysis of average precipitation(1.05 m/year) and LSI (0.41) on agricultural land led to a conversionfactor of 0.39(m2*year)/m3, resulting in a good match with theconversion based on maximal values.
3. Results
3.1. Spatial distribution of production increase
3.1.1. Intensification strategy (Case 1)The relative rise of crop water consumption for agricultural
intensification as modeled in Cases 1 and 4 showed a distinct spatialdistribution (Fig. 1): The highest potential for enhanced irrigationappeared in dry climates where deficit irrigation is currentlyprevalent. Accordingly, in such regions crop production could beraised the most. However, due to high water scarcity in these regions,the expected impacts from irrigation were most pronounced(section 3.3). Among the main hotspots of increased productionwere Western U.S., Australia, and Western China. Further details oncrop-specific production increases are provided in Table S1 in theAppendix. Maize and wheat, which were often cropped in relativelydry climates, played the most important role, while rice productionwould only slightly increase.
3.1.2. Expansion strategies (Cases 2 and 3)In both expansion cases production increased the most in Africa.
Additional energy requirements in 2050 were covered by 1.43·109 tof maize and 3.2·108 t of wheat in Case 2, and by 1.46·109 t of maizeand 2.9·108 t of wheat in Case 3. Wheat production expandedglobally in Case 2 and mainly in Europe in Case 3 (Fig. 2, Figure S1 inthe Appendix). For maize, however, production increases resultedmainly in expansion in Africa and partly in South America for bothcases.
n future global agriculture: Scenarios and related impacts, Sci Total

Fig. 1. Intensification: increase of crop water consumption of agricultural production in Case 1 compared to the year 2000.
5S. Pfister et al. / Science of the Total Environment xxx (2011) xxx–xxx
3.2. Increased irrigation water consumption
Change in irrigation water consumption from 2000 till 2050through climate change only (base case) is listed per continent inTable 3: Precipitation changes resulted in globally lower irrigationwater consumption. However, there were regional differences. Forinstance, irrigation water consumption slightly increased in SouthAmerica, Europe and Australia.
Still, combining climate change and additional crop productionresulted a considerable global increase in annual irrigation waterconsumption of 1125, 169, 142 and 1294 billion m3 in Cases 1, 2, 3 and4, respectively as presented in Table 4: For Cases 1 (intensification)and 4 (intensification and expansion), the increase in crop cultivationtremendously expanded the current global irrigation water consump-tion of 1772 billion m3/year (Pfister et al., 2011). Case 1 was therebymuch more irrigation water-intensive than the current situation, in
Case 2
Case 3
Fig. 2.Maps depict regions with increased grain production (sum of maize and wheat) reporwhich are at least moderately suitable for rainfed cereals) and Case 3 (expansion on pastur
Please cite this article as: Pfister S, et al, Projected water consumption iEnviron (2011), doi:10.1016/j.scitotenv.2011.07.019
contrast to Cases 2 and 3 as expansion took place mainly on rainfedareas. In Case 4 (combining Cases 1 and 2) both agricultural outputs aswell as irrigation water consumption were almost doubled. Thus,irrigation water intensity remained roughly constant.
The four cases showed substantial variations in spatial distributionof additional irrigation water consumption (Fig. 3). The expansionCases 2 and 3 indicated most increases occurring in Africa and SouthAmerica, while Cases 1 and 4 showed a less pronounced spatialpattern.
3.3. Water stress index projections for 2050 (WSI2050)
The water stress index (WSI) was used to roughly indicate areas ofno (b0.1), low (0.1–0.4), moderate (0.4–0.6), high (0.6–0.9) andextreme (N0.9) water scarcity. The prospective WSI2050 values andtheir distribution showed remarkable differences depending on the
ted as additional tonnes per grid cell (5 arc-minute grid): Case 2 (expansion on pastureses and other ecosystems on highly suitable areas for rainfed cereals).
n future global agriculture: Scenarios and related impacts, Sci Total
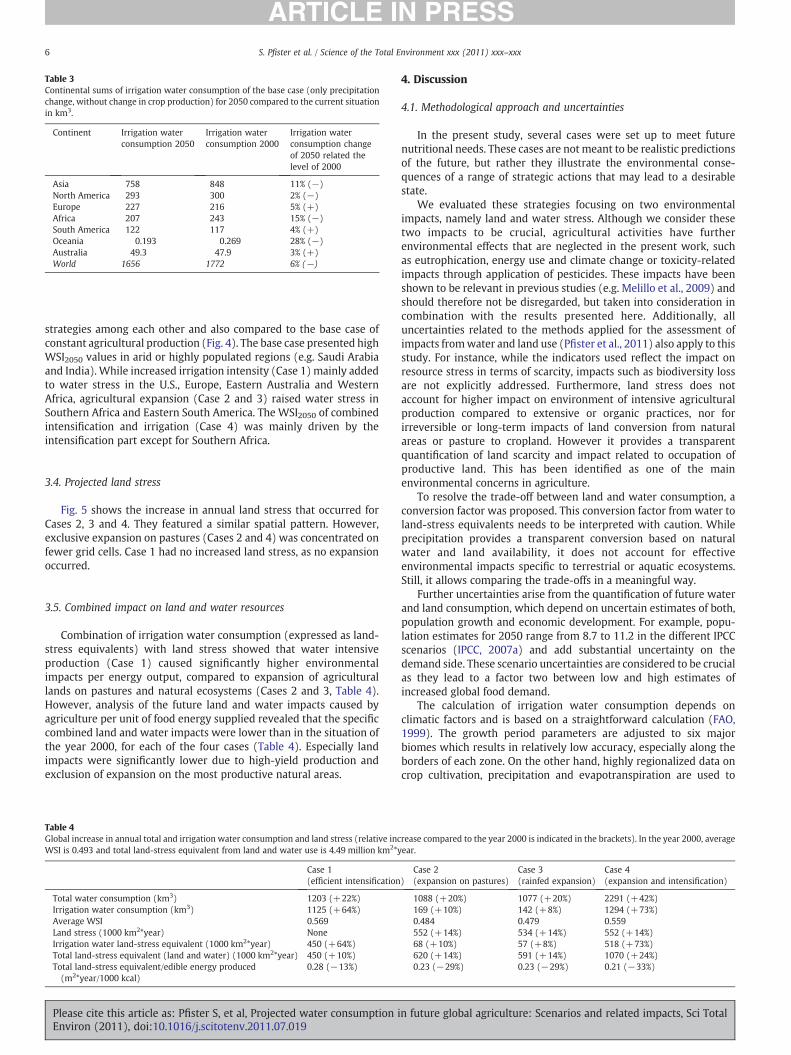
Table 3Continental sums of irrigation water consumption of the base case (only precipitationchange, without change in crop production) for 2050 compared to the current situationin km3.
Continent Irrigation waterconsumption 2050
Irrigation waterconsumption 2000
Irrigation waterconsumption changeof 2050 related thelevel of 2000
Asia 758 848 11% (−)North America 293 300 2% (−)Europe 227 216 5% (+)Africa 207 243 15% (−)South America 122 117 4% (+)Oceania 0.193 0.269 28% (−)Australia 49.3 47.9 3% (+)World 1656 1772 6% (−)
6 S. Pfister et al. / Science of the Total Environment xxx (2011) xxx–xxx
strategies among each other and also compared to the base case ofconstant agricultural production (Fig. 4). The base case presented highWSI2050 values in arid or highly populated regions (e.g. Saudi Arabiaand India). While increased irrigation intensity (Case 1) mainly addedto water stress in the U.S., Europe, Eastern Australia and WesternAfrica, agricultural expansion (Case 2 and 3) raised water stress inSouthern Africa and Eastern South America. The WSI2050 of combinedintensification and irrigation (Case 4) was mainly driven by theintensification part except for Southern Africa.
3.4. Projected land stress
Fig. 5 shows the increase in annual land stress that occurred forCases 2, 3 and 4. They featured a similar spatial pattern. However,exclusive expansion on pastures (Cases 2 and 4) was concentrated onfewer grid cells. Case 1 had no increased land stress, as no expansionoccurred.
3.5. Combined impact on land and water resources
Combination of irrigation water consumption (expressed as land-stress equivalents) with land stress showed that water intensiveproduction (Case 1) caused significantly higher environmentalimpacts per energy output, compared to expansion of agriculturallands on pastures and natural ecosystems (Cases 2 and 3, Table 4).However, analysis of the future land and water impacts caused byagriculture per unit of food energy supplied revealed that the specificcombined land and water impacts were lower than in the situation ofthe year 2000, for each of the four cases (Table 4). Especially landimpacts were significantly lower due to high-yield production andexclusion of expansion on the most productive natural areas.
Table 4Global increase in annual total and irrigation water consumption and land stress (relative incWSI is 0.493 and total land-stress equivalent from land and water use is 4.49 million km2*y
Case 1(efficient intensification
Total water consumption (km3) 1203 (+22%)Irrigation water consumption (km3) 1125 (+64%)Average WSI 0.569Land stress (1000 km2*year) NoneIrrigation water land-stress equivalent (1000 km2*year) 450 (+64%)Total land-stress equivalent (land and water) (1000 km2*year) 450 (+10%)Total land-stress equivalent/edible energy produced(m2*year/1000 kcal)
0.28 (−13%)
Please cite this article as: Pfister S, et al, Projected water consumption iEnviron (2011), doi:10.1016/j.scitotenv.2011.07.019
4. Discussion
4.1. Methodological approach and uncertainties
In the present study, several cases were set up to meet futurenutritional needs. These cases are notmeant to be realistic predictionsof the future, but rather they illustrate the environmental conse-quences of a range of strategic actions that may lead to a desirablestate.
We evaluated these strategies focusing on two environmentalimpacts, namely land and water stress. Although we consider thesetwo impacts to be crucial, agricultural activities have furtherenvironmental effects that are neglected in the present work, suchas eutrophication, energy use and climate change or toxicity-relatedimpacts through application of pesticides. These impacts have beenshown to be relevant in previous studies (e.g. Melillo et al., 2009) andshould therefore not be disregarded, but taken into consideration incombination with the results presented here. Additionally, alluncertainties related to the methods applied for the assessment ofimpacts fromwater and land use (Pfister et al., 2011) also apply to thisstudy. For instance, while the indicators used reflect the impact onresource stress in terms of scarcity, impacts such as biodiversity lossare not explicitly addressed. Furthermore, land stress does notaccount for higher impact on environment of intensive agriculturalproduction compared to extensive or organic practices, nor forirreversible or long-term impacts of land conversion from naturalareas or pasture to cropland. However it provides a transparentquantification of land scarcity and impact related to occupation ofproductive land. This has been identified as one of the mainenvironmental concerns in agriculture.
To resolve the trade-off between land and water consumption, aconversion factor was proposed. This conversion factor from water toland-stress equivalents needs to be interpreted with caution. Whileprecipitation provides a transparent conversion based on naturalwater and land availability, it does not account for effectiveenvironmental impacts specific to terrestrial or aquatic ecosystems.Still, it allows comparing the trade-offs in a meaningful way.
Further uncertainties arise from the quantification of future waterand land consumption, which depend on uncertain estimates of both,population growth and economic development. For example, popu-lation estimates for 2050 range from 8.7 to 11.2 in the different IPCCscenarios (IPCC, 2007a) and add substantial uncertainty on thedemand side. These scenario uncertainties are considered to be crucialas they lead to a factor two between low and high estimates ofincreased global food demand.
The calculation of irrigation water consumption depends onclimatic factors and is based on a straightforward calculation (FAO,1999). The growth period parameters are adjusted to six majorbiomes which results in relatively low accuracy, especially along theborders of each zone. On the other hand, highly regionalized data oncrop cultivation, precipitation and evapotranspiration are used to
rease compared to the year 2000 is indicated in the brackets). In the year 2000, averageear.
)Case 2(expansion on pastures)
Case 3(rainfed expansion)
Case 4(expansion and intensification)
1088 (+20%) 1077 (+20%) 2291 (+42%)169 (+10%) 142 (+8%) 1294 (+73%)0.484 0.479 0.559552 (+14%) 534 (+14%) 552 (+14%)68 (+10%) 57 (+8%) 518 (+73%)620 (+14%) 591 (+14%) 1070 (+24%)0.23 (−29%) 0.23 (−29%) 0.21 (−33%)
n future global agriculture: Scenarios and related impacts, Sci Total

Case 2
Case 1
Case 4
Case 3
Fig. 3. Increased irrigation water consumption for each grid cell for the Cases 1, 2, 3 and 4 compared to the year 2000.
7S. Pfister et al. / Science of the Total Environment xxx (2011) xxx–xxx
Please cite this article as: Pfister S, et al, Projected water consumption in future global agriculture: Scenarios and related impacts, Sci TotalEnviron (2011), doi:10.1016/j.scitotenv.2011.07.019

Case 2
Case 3 Case 4
Case 1
Basecase
Fig. 4. Water stress index (WSI, dimensionless) of the projected cases for 2050, based on withdrawal and availability data from WaterGAP 2. The increased withdrawal due toexpansion and/or intensification has been added based on the additional irrigation water calculation for each of the cases. The base case derived without increased production toreflect change of precipitation and industrial/domestic water use.
8 S. Pfister et al. / Science of the Total Environment xxx (2011) xxx–xxx
increase precision of the result. Thus, although simplifications aremade, our estimations of water consumption are very advanced interms of spatial resolution and number of crops considered. Moreuncertain seem predictions of water availability. The forecasts of 21
Cases 2/4
Case 3
Fig. 5. Increased annual land stress due to expansionmeasured as km2· year per grid cell (5 aand natural ecosystems in Case 3 (bottom).
Please cite this article as: Pfister S, et al, Projected water consumption iEnviron (2011), doi:10.1016/j.scitotenv.2011.07.019
climate change models presented in the IPCC reports are diverse andoften project different trends. Therefore, considerable uncertaintiesare attached to the adopted average monthly precipitation forecasts.Predictions of reference evapotranspiration are even less certain and
rc-minute grid): exclusive expansion on pastures in Cases 2 and 4 (top) and on pastures
n future global agriculture: Scenarios and related impacts, Sci Total
9S. Pfister et al. / Science of the Total Environment xxx (2011) xxx–xxx
therefore no change is included in the crop model. However,compared to the uncertainties related to the scenario selection andcase development, these limitations are considered less relevant forthe results of this study.
A critical parameter for land and water use modeling is the crop-specific yield. Good agricultural practice is assumed for both, the yieldimprovements for intensification based on the ky factors as well as themodeled yields for expansion of maize and wheat production. Suchpositive development might not be achieved in practice everywhere,resulting in higher land and water use per food energy output. In thiscontext, concerns about long-term soil fertility of areas transformedfrom pasture to agricultural land need also to be considered. This addsuncertainty to the selection of appropriate expansion areas, especiallyregarding soil organic carbon, erosion losses and sustainable fertili-zation. While transformation of pastures has been selected includingconstraints of soil features, such as textures and soil phases, theunderlying soil maps are of limited quality (Fischer et al., 2000) andfertilizer provision might be problematic in many of the expansionregions. In addition to the eutrophying effects of fertilizer application,phosphorus (P) supply has often been characterized as a rapidlydepleting resource (e.g. Cordell et al., 2009; Vaccari, 2009). However,recent estimates (U.S. Geological Survey, 2011) suggest no “peakphosphorus” problem in the 21st century, even with a large increasein fertilizer use. Furthermore, proper P recycling as e.g. from wastewater treatment plants and food waste might considerably reduce themineral fertilizer demand. There is also a large reduction potential onthe application side, as the P input to global agriculture is higher thanthe output (MacDonald et al., 2011) and e.g. the phosphorus useefficiency in the U.S. food system is only 15% (Suh and Yee, 2011).Nevertheless, fertilization might become an economic issue due topotentially increased prices of P and potassium (K) from low-qualitymining as well as high energy requirements for producing inorganicnitrogen (N) fertilizer. These issues should be addressed in futureresearch.
An additional uncertainty source is induced by neglecting theclimate-dependence of yield, as we neither account for increasedyields due to CO2-fertilization nor effects due to temperatureincreases. Negative temperature effects have been addressed byLobell et al. (2008) mainly based on statistical analysis with highuncertainties due to data quality constraints. Schlenker and Lobell(2010) offer more detailed assessments for five staple crops in Sub-Saharan Africa and found temperature effects to be significant, exceptfor cassava. Overall the expected yield losses were in the range of 10–20%. However, their analysis also showed that exchanging staplecrops might help limiting such losses and new breeds might be able toperform better under climate change. In this paper, changed croppingpatterns have not been analyzed and add uncertainty to the cases asdoes the simplification of limiting the expansion to wheat or maizecultivations in Cases 2–4.
For the assessment of future water stress index, water useefficiency of 70% was applied globally. This does not account for theregional differences of irrigation facilities and might overestimatewater use in areas with highly efficient technology while under-estimating water use in regions with poorly developed irrigationschemes. Compared to the uncertainties discussed above, this sourceof uncertainty seems to be of lower concern.
Important to note is that cultivating cropswhere it is most suitable forenvironment rather thanwhere it is closest todemandor cheapest, resultsin changed and potentially increased trade flows. Enhanced trade affectssocio-economic conditions and might also lead to further food losses orincreased energy use, which has not been considered in this study.
Finally, not all possible actions to increase agricultural productionor lower food demandwere considered by our four cases. For instance,changes in dietary demand (e.g. reduction of meat consumption) oroptimization on crop choice and rotations on currently occupied landwere not considered here.
Please cite this article as: Pfister S, et al, Projected water consumption iEnviron (2011), doi:10.1016/j.scitotenv.2011.07.019
4.2. Strategy comparison
Global irrigation water consumption needed to increase agriculturalproductionwasbya factor of 7–9higher for intensification (Cases 1and4)than for expansion (Cases 2 and 3). These results reflect the benefit ofrainwater use on expansion areas. By contrast, Case 1 had no additionalimpact from land use, while in Cases 2 and 3 land stress increasedconsiderably. Thus, the trade-off between land- and water-relatedimpacts of both strategies, expansion and intensification, is obvious.Case 3 (rainfed expansion)has comparable impacts onwater and landuseas Case 2 (expansion on pastures), although it included 2·105 km2*yearof land stress from currently natural areas. This expansion on naturalecosystem might be weighted higher regarding its environmental valueand metrics for this should be explored in future.
Important to note is that Case 1 did not produce the same amountof food on the field but improves food supply chain by minimizingwaste. Also the expansion cases could have been coupled with wastereductions, leading to less environmental impacts. A mix of expansionand intensification (such as Case 4) indicates that future relativeincrease in pressure is likely to be higher on water than on landresources, provided that — as assumed in all cases — rainforests andother unique ecosystems are protected. Water stress is driven mainlyby increased water consumption, while precipitation changes due toclimate change are of minor relevance. In absolute terms of land-stress equivalents per food energy produced, increased pressure bywater consumption in the intensification case is higher than landstress from the expansion cases (Table 4).
In Case 1, irrigation water consumption increased mainly in Asia,followed by North America, Europe and Africa. By contrast, irrigationwater consumption as well as land stress mainly increased in Africaand South America for Cases 2 and 3 (Figure S1 in the Appendix).These findings underline the need to advance agriculture ofdeveloping countries, in particular in Africa and partially also SouthAmerica, to better distribute agricultural activities in favorable regionsand alleviate future environmental problems of hotspots. While, froma nutritional point of view, the expansion on pastures currently usedfor meat and dairy production has only aminor impact on overall foodenergy provision (Table 2) it might cause severe social and culturalproblems e.g. for nomadic cultures which are depending on pastures.Such problems are not considered in this study.
As the resource consumption per edible energy was considerablylower in all cases compared to current production (Table 4), caseswithout such improvements might feature 20–50% higher globalimpacts. Additionally, expansion on rainforest and other uniqueecosystems or concentrated overuse of water resources might lead toa much worse picture, way beyond the level of Case 4.
In any case, the increased efficiency is overcompensated by theabsolute increase in agricultural activities. For instance, compared tothe current production volume (base case) the area of severely water-stressed regions will significantly increase, especially in the intensi-fication Cases 1 and 4 (Fig. 4), and create a large challenge for waterresource management in those areas.
4.3. Comparison with other studies
Our analysis represents cases of good practice with strict boundaryconditions (e.g. fair global distribution of resources) and selectedmeasures to increase agricultural production. A combination of thesemeasures might be used to derive strategies for supply of agriculturalgoods in 2050. We compared the outcomes of our results to studiesanalyzing best-guess scenarios. Regarding water consumption thereare large differences in the available studies: while e.g. Molden (2007)and Shen et al. (2008) predict a large increase in irrigation waterconsumption of 622 and 718 km3/year, respectively, for 2050(applying an irrigation efficiency of 70%), Sauer et al. (2010) modeledadditional 181 km3/year until 2030. Falkenmark et al. (2009) predict
n future global agriculture: Scenarios and related impacts, Sci Total

10 S. Pfister et al. / Science of the Total Environment xxx (2011) xxx–xxx
additional irrigation water consumption of 430 km3/year by 2050,while accounting for land expansion of 281 Mha. Our results rangefrom 142 km3/year to 1293 km3/year of additional irrigation waterconsumption, embracing these estimates. Regarding land use, the281 Mha in Falkenmark et al. (2009) is low compared to 450 Mhapredicted for 2050 by Rockstrom et al. (2007). A recent review ofdifferent model outputs for land use change by 2030 compared to theyear 2000 reported additional crop production on125–265 Mha in 2030(Lambin et al., 2011). As we applied a land-stress index and modeledland occupation as “area⁎time” instead of calculating cropland increase,the results cannot directly be compared to other studies. Our expansionscenarios feature land stress of 53 and 55 Mha*year. Using the averageLSI of current cropland (0.4) and a cultivation period of 0.75 years toconvert land stress to land transformation results a cropland expansionof 177 and 183 Mha, respectively. For 2050, these values are on thelower end and reflect the high yields assumed for the high-inputagriculture (fertilization and irrigation) in our expansion cases. Fromthat perspective, the results are in good match with estimates inliterature and also demonstrate the improvement potential achievablethrough best-practice agriculture.
5. Conclusions
Our cases illustrated potential consequences of increasing agricul-tural production on a detailed and highly spatially resolved level.Thereby, they provided a transparent evaluation of potential futureagriculture for policy making. The study reveals possibilities todecrease the specific environmental impacts with good agriculturalpractice and well distributed expansion and/or intensification onexisting cropland. Increased production potentials are mainly locatedin developing countries, in particular in Africa and parts of SouthAmerica. In order to be able to feed the future generations, it seemstherefore necessary to develop agriculture in these regions. Still, landor water resources (and most likely both) will become increasinglystressed and therefore natural resources need to be managed wisely.
Given the overall water and land-stress increase, drought resistantcrop varieties, improved rainwater harvesting, and water conserva-tion should be fostered, especially in semi-arid tropical regions(Rosegrant and Cline, 2003) which are suggested for the lion share ofincreased agricultural production through intensification. However,with technical improvements as required for intensification, there is arisk that increased production will be favored over concentration on asmaller area. In this context, the local and global perspectives need tobe coupled: The presented results can assist comparative analyses ofand decisions about intensification or expansion in agriculture. Incombination with local natural resource management and socio-economic studies, our results can also support decision-making aboutwhere investment in agriculture works best in a global context.
Considering that our strategies are based on assumptions of goodagricultural practice and positive socio-economic development (e.g.fair distribution of food resources), huge obstacles for implementationexist. However, our strategies illustrate that, provided these chal-lenges can be overcome, it is principally possible to supply enoughfood for 50%more people on earth, without the need of rainforest cut-down. In particular, the reduction of the incredible share of food thatis currently wasted (56% from field to fork) could bring enormousbenefits. Also, agricultural expansion into suitable areas for rainfedcultivation has a high potential to save water and alleviate waterstress (Table 2). This result provides hope but also shows that animmense amount of water and land is required and needs to bemanaged wisely for satisfying the additional food demand.
Acknowledgments
The authors thank R. Juraske and F. Stoessel for helpful discussionsregarding agricultural practice; C. Putzlar, H. Haberl, and K. Erb for
Please cite this article as: Pfister S, et al, Projected water consumption iEnviron (2011), doi:10.1016/j.scitotenv.2011.07.019
sharing information onNPP;M. Floerke, C. Tebaldi, and S. Staudenmayerfor providing data for assessing future cases; Sangwon Suh forcomments on a previous version of this manuscript; and Chris Mutelfor English proofreading. This work was supported by the EuropeanCommission under the seventh framework program on environment;ENV. 2008.3.3.2.1: PROSUITE — Sustainability Assessment of Technol-ogies, grant agreement number 227078 as well as ETH Zurich.
Appendix A. Supplementary data
Additional methods and results are available in the supportingonline material as indicated in the text. We also provide the rasterdata tables of the maps in Figs. 1–3 and Fig. 5 (see detailed descriptionin I.7). Supplementary materials related to this article can be foundonline at doi:10.1016/j.scitotenv.2011.07.019.
References
Alcamo J, Doll P, Henrichs T, Kaspar F, Lehner B, Rosch T, et al. Development and testingof the WaterGAP 2 global model of water use and availability. Hydrol Sci J 2003;48:317–37.
Alcamo J, Florke M, Marker M. Future long-term changes in global water resourcesdriven by socio-economic and climatic changes. Hydrol Sci J 2007;52:247–75.
Brouwer C, Prins K, Heibloem M. Irrigation water management: irrigation scheduling.Rome: FAO Land and Water Development Division; 1989.
Cordell D, Drangert J-O, White S. The story of phosphorus: global food security and foodfor thought. Glob Environ Change 2009;19:292–305.
Costanza R, Fisher B, Mulder K, Liu S, Christopher T. Biodiversity and ecosystemservices: a multi-scale empirical study of the relationship between species richnessand net primary production. Ecol Econ 2007;61:478–91.
Dominguez-Faus R, Powers SE, Burken JG, Alvarez PJ. The water footprint of biofuels: adrink or drive issue? Environ Sci Technol 2009;43:3005–10.
Doorenbos J, Kassam AH, Bentvelsen C, Uittenbogaard G. Yield response to water. FAOIrrigation and Drainage Paper no. 33. Rome: Food and Agriculture Organization ofthe United Nations (FAO); 1986.
Energy Information Administration. The International Energy Annual (IEA). http://www.eia.doe.gov/emeu/iea/contents.htm l2009. Accessed December 11, 2009.
Energy Information Administration. International Energy Outlook 2009, Table 70.http://www.eia.doe.gov/oiaf/ieo/graphic_data_transportation.html 2009. AccessedDecember 13, 2009.
Falkenmark M, Rockström J, Karlberg L. Present and future water requirements forfeeding humanity. Food Secur 2009;1:59–69.
FAO. CROPWAT for WINDOWS. Rome: Food and Agriculture Organization of the UnitedNations; 1999.
Fischer G, van Velthuizen H, Nachtergaele F, Medow S. Global agro-ecological zones.FAO and IIASA; 2000 http://www.iiasa.ac.at/Research/LUC/GAEZ/index.htm.Accessed August 3, 2009.
Haberl H, Erb KH, Krausmann F, Gaube V, Bondeau A, Plutzar C, et al. Quantifying andmapping the human appropriation of net primary production in earth's terrestrialecosystems. Proc Natl Acad Sci U S A 2007;104:12,942–5.
Hanasaki N, Kanae S, Oki T, Masuda K, Motoya K, Shirakawa N, et al. An integratedmodel for the assessment of global water resources — part 2: applications andassessments. Hydrol Earth Syst Sci 2008;12:1027–37.
IPCC. Climate change 2007: impacts, adaptation and vulnerability. Cambridge:Cambridge University Press; 2007a.
IPCC. Contribution of working group I to the fourth assessment report of theintergovernmental panel on climate change. In: Solomon SDQ, Manning M, ChenZ, Marquis M, Averyt KB, Tignor M, Miller HL, editors. Cambridge and New York:Cambridge University Press; 2007b.
Köllner T. Species-pool effect potentials (SPEP) as a yardstick to evaluate land-useimpacts on biodiversity. J Clean Prod 2000;8:293–311.
Lambin EF, Meyfroidt P. Global land use change, economic globalization, and thelooming land scarcity. Proc Natl Acad Sci U S A 2011;108:3465–72.
Lobell DB, Burke MB, Tebaldi C, Mastrandrea MD, Falcon WP, Naylor RL. Prioritizingclimate change adaptation needs for food security in 2030. Science 2008;319:607–10.
Loftas T, Ross J. Dimensions of need: an atlas of food and agriculture. Rome: Food andAgriculture Organization; 1995.
Lundqvist J, de Fraiture C, Molden D. Saving water: from field to fork — curbing lossesand wastage in the food chain. SIWI Policy Brief. Stockholm: SIWI; 2008.
MacDonald GK, Bennett EM, Potter PA, Ramankutty N. Agronomic phosphorusimbalances across the world's croplands. Proc Natl Acad Sci U S A 2011;108:3086–91.
Maxwell RM, Kollet SJ. Interdependence of groundwater dynamics and land-energyfeedbacks under climate change. Nat Geosci 2008;1:665–9.
Melillo JM, Reilly JM, Kicklighter DW, Gurgel AC, Cronin TW, Paltsev S, et al. Indirectemissions from biofuels: how important? Science 2009;326:1397–9.
Mitchell TD, Jones PD. An improved method of constructing a database of monthlyclimate observations and associated high-resolution grids. Int J Climatol 2005;25:693–712.
n future global agriculture: Scenarios and related impacts, Sci Total

11S. Pfister et al. / Science of the Total Environment xxx (2011) xxx–xxx
Molden D, editor. Water for food, water for life: a comprehensive assessment of watermanagement in agriculture. London: Earthscan and Colombo: International WaterManagement Institute; 2007.
Pfister S, Koehler A, Hellweg S. Assessing the environmental impacts of freshwaterconsumption in LCA. Environ Sci Technol 2009;43:4098–104.
Pfister S, Bayer P, Koehler A, Hellweg S. The environmental relevance of freshwaterconsumption in global power production. Environ Sci Technol 2011;45:5761–8.doi:10.1021/es1041755.
Postel S, Polak P, Gonzales F, Keller J. Drip irrigation for small farmers— a new initiativeto alleviate hunger and poverty. Water Int 2001;26:3–13.
Rockstrom J, Lannerstad M, Falkenmark M. Assessing the water challenge of a new greenrevolution in developing countries. Proc Natl Acad Sci U S A 2007;104:6253–60.
Rosegrant MW, Cline SA. Global food security: challenges and policies. Science2003;302:1917–9.
Rost S, Gerten D, Hoff H, Lucht W, Falkenmark M, Rockstrom J. Global potential toincrease crop production through water management in rainfed agriculture.Environ Res Lett 2009;4.
Sauer T, Havlík P, Schneider, Schmid E, Kindermann G, Obersteiner M. Agriculture andresource availability in a changing world: the role of irrigation. Water Resour Res2010;46:W06503.
Schlenker W, Lobell DB. Robust negative impacts of climate change on Africanagriculture. Environ Res Lett 2010;5:1–8.
Please cite this article as: Pfister S, et al, Projected water consumption iEnviron (2011), doi:10.1016/j.scitotenv.2011.07.019
Shen YJ, Oki T, Utsumi N, Kanae S, Hanasaki N. Projection of future world waterresources under SRES scenarios: water withdrawal. Hydrol Sci J 2008;53:11–33.
Shiklomanov IA, Rodda JC. World water resources at the beginning of the 21st century.Cambridge: Cambridge University Press; 2003.
Suh S, Yee S. Phosphorus use — efficiency of agriculture and food system in the U.S.Chemosphere 2001;84:806–13. doi:10.1016/j.chemosphere.2011.01.051.
Tilman D, Cassman KG, Matson PA, Naylor R, Polasky S. Agricultural sustainability andintensive production practices. Nature 2002;418:671–7.
U.S. Census Bureau PD. World population: 1950–2050. http://www.census.gov/ipc/www/idb/worldpopgraph.php2009. Accessed January 25, 2010.
U.S. Geological Survey. Mineral commodity summaries. http://globalpnetwork.net/sites/default/files/USGS_2011_PhosRockReserves.pdf2011. Accessed June 2, 2010.
UN Population Division. 2008 revision of world population prospects. New York: UnitedNations Department of Economic and Social Affairs; 2009.
Vaccari D. Phosphorus: a looming crisis. Sci Am 2009;300(6):54–9.Wirsenius S. The biomass metabolism of the food system: a model-based survey of the
global and regional turnover of food biomass. J Ind Ecol 2003;7:47–80.Wisser D, Frolking S, Douglas EM, Fekete BM, Vorosmarty CJ, Schumann AH. Global
irrigation water demand: variability and uncertainties arising from agricultural andclimate data sets. Geophys Res Lett 2008;35.
n future global agriculture: Scenarios and related impacts, Sci Total