
Projected Status of the Ghost Orchid (Dendrophylax lindenii ...

1
Author note: this is a ‘next of final’ version. Copyright restrictions prevent
public posting of the ‘Climate Research’ published MS.
Projected loss of active blanket bogs in Ireland.
John Coll1*
, David Bourke2,3
, Micheline Sheehy Skeffington2, Michael Gormally
3,
John Sweeney1
1 Department of Geography, NUI Maynooth, Maynooth, Co Kildare, Ireland.
2 Botany and Plant Science, NUI Galway, Galway, Ireland.
3
Applied Ecology Unit, Centre for Environmental Science, NUI Galway, Galway,
Ireland.
Abstract
Active blanket bogs are ombrotrophic peatland systems of the boreo-temperate zones,
although blanket peat tends to form only under the warmest and wettest of those
conditions. In Europe, this is common only in Scotland and Ireland, coincident with
the oceanic climate, and constitutes a significant global component of this ecosystem.
Associated with this Atlantic distribution, Ireland has 50% of the remaining blanket
bogs of conservation importance within the Atlantic Biogeographic Region of Europe.
It is anticipated that future climate change will place additional pressure on these
systems. Active blanket bog distributions in Ireland were modelled using seven
bioclimatic envelope modelling techniques implemented in the BIOMOD modelling
framework. The 1961 – 1990 baseline models achieved a very good agreement with
the observed distribution and suggest a strong dependency on climate. The
discrimination ability of the fitted models was assessed using the area under the curve
(AUC; range 0.915 – 0.976) of a receiver operating characteristic (ROC) plot. An
ensemble prediction from all the models was computed in BIOMOD and used to
project changes based on outputs from a dynamically downscaled climate change
scenario for 2031-2060. The consistent predictions between the individual models for
the baseline change substantially for the climate change projections, with losses of ~ -
82% to gains of ~ +15% projected dependant on individual model type. However,
small gains in climate space in the Midlands, east and north east of the country
projected by the consensus model are unlikely to be realised as it will not be possible
for new habitat to form.
Key words: Active blanket bogs, climate change, bioclimatic envelope models,
BIOMOD, climate space.
† Author for correspondence. E-mail: [email protected]

2
1. Introduction
Globally, blanket bogs are rare, accounting for ~ 3% of the total peatland area, and
their distribution is restricted to temperate maritime regions typified by cool summers,
mild winters and year-round rainfall (Kurbatova et al. 2009). Within the climate
space associated with temperate-boreal peatlands, blanket peat tends to form under the
warmest and wettest conditions (Wieder & Vitt 2006), where precipitation is around
three times greater than potential evaporation and there are no sustained dry periods.
Globally, these areas typically occur in mid to high latitudes on the ocean fringes
where precipitation is high and mean annual temperature range is low (Lindsay et al.
1988).
Organic matter accumulates in peat due to low decomposition rates, as a result of
waterlogging and anoxia rather than high plant productivity (Malmer 1992). Blanket
peat vegetation is adapted to these saturated conditions, and is highly sensitive to
changes in water availability (Bragg & Tallis 2001). In these ombrotrophic systems,
high water tables are maintained by sustained precipitation and poor drainage. The
reliance on precipitation makes blanket peat sensitive to climate changes that affect
the net water balance (precipitation – potential evapotranspiration), as this alters the
balance between decomposition and primary production (Heathwaite 1993).
Wetlands, which include blanket bogs, are important providers of ecosystem
services (Maltby 2010) and specialised peatland plant species e.g. bog mosses
(Sphagnum spp.) build and maintain peat. Peat provides an unusually high density of
carbon storage and, where peat is forming, acts as a long-term carbon sink. More
important from a contemporary carbon cycle perspective is the amount of carbon that
has accumulated in peat over many millennia. Therefore, preserving existing peat
stocks is an important climate mitigation strategy, even if new peat were to stop
forming.
In Europe, Atlantic blanket bogs are common only in Scotland and Ireland and
constitute a significant global component of this ecosystem (Sheehy Skeffington &
O’Connell 1998). Between 13.8 per cent and 17 per cent of the Irish land area is
peatland, containing an estimated soil carbon stock of between 53 and 62 per cent of
the national soil carbon stocks (Connolly et al. 2007; Eaton et al. 2008). Ireland’s
peatlands and wetlands are valued as a highly distinctive semi-natural habitat, and
many have protective designations.
Irish blanket bogs are divided into two sub-categories delineated by climate and
terrain: (1) Lowland Atlantic Blanket Bog or Oceanic Blanket Bog is confined to
elevations of < 150m (Schouten 1984), and areas with more than 250 rain d year-1
(Hammond, 1984). (2) Mountain or Upland Blanket Bog occurs in areas above 300m
where annual precipitation exceeds 1250 mm yr-1
(Schouten 1984).
Analysis of grid-based climate data and Irish peatland distribution identified an
east-west gradient primarily related to precipitation, and a north-south gradient related
to temperature (Jones et al. 2006). Although of high conservation value, only ~28%
of blanket bogs in the Republic of Ireland remain in a relatively intact condition
(Malone & O'Connell 2009) due to peat extraction, drainage and forest plantation.
This compares to a figure of ~14% for the remaining intact blanket bog areas for
Northern Ireland (Malone & O'Connell 2009), although a small area of lowland raised
bog area is incorporated in this calculation. Active Blanket Bog is listed as an Annex
1 priority habitat in the EU Habitats Directive (NPWS 2008) and Ireland has 50% of
the remaining blanket bogs of conservation importance within the Atlantic

3
Biogeographic Region of Europe (Malone & O'Connell 2009). Therefore current
conservation strategies need a better understanding of these ecosystems, including the
impacts of climate change. Most recently and in view of the overall status of
Ireland's EU listed habitats remaining unfavourable, it has been recognised that
peatland restoration is not only a priority, but that it will have to take place over a
longer timescale. The global significance of Ireland’s peatland resource has also
recently been recognised, as has the need for all related scientific information to be
synthesised to inform policy-makers (Renou-Wilson et al. 2011).
Given this close relationship between peat formation and climate, it is likely that
future climate change will place additional pressure on these systems (Clark et al.
2010). Climate change is expected to result in a decrease in the summer water table in
peatlands through drier summers, as well as alteration of peat-water pH, while
modification of the nutrient cycle may lead to bogs becoming net emitters of carbon
(Kurbatova et al. 2009). Most bog burst and peat slide events are triggered by high
magnitude rainfall events (Dykes et al. 2008) and UK and Irish data indicate that
roughly half of all slippage events at present occur in the late summer months in
relation to convective storm activity (Warburton et al. 2004). Therefore, more
slippage events could be expected with climate change in the summer months if prior
hotter and dryer conditions lead to surface cracking (Sweeney et al. 2008).
Projected increases in winter rainfall may also lead to increased peat erosion, with
losses of particulate and dissolved organic carbon (POC & DOC) from peat to surface
waters (Clark et al. 2010, Yallop et al. 2010). The hydrological functioning of peat
soils can influence peak river flows and flooding (Bonn et al. 2009, Holden 2009)
through their influence on water retention. While some of the thermal changes
projected with altitude for maritime regions (Coll et al. 2010) may also have
implications for upland peat soils. The interaction between pressures such as over-
grazing, draining, burning, conifer plantation and climate change could further
threaten the delivery of vital services from these ecosystems. Bog habitats in Ireland
are considered vulnerable when the effects of a changing climate are superimposed on
other drivers of change (Jones et al. 2006).
A variety of modelling approaches have been developed and used to convert point
information of species distribution into predictive maps (e.g. Araújo & Guisan 2006;
Heikkinen et al. 2006). Bioclimatic envelope models (BEMs) which can be
considered as a special case of niche-based models or species distribution models
(Guisan and Thuiller 2005, Heikkinen et al. 2006), are increasingly being used.
BEMs correlate current species distributions with climate variables, and may then be
used to project spatial shifts in species climatic envelopes according to selected
climate change scenarios (Thuiller, 2003, Thuiller et al. 2004a,b). The use of BEMs
for habitats is novel and only a limited number of studies have applied these methods
to landforms and habitats (e.g. Fronzek et al. 2006, Parviainen and Luoto 2007, Clark
et al. 2010). However, developing useful and reliable applications of BEMs requires a
considerable amount of knowledge concerning the factors influencing the accuracy of
model predictions (Heikkinen et al. 2006). A fundamental issue for the application of
BEMs in the context of vulnerability analysis is that they can only give information
about exposure to climate stress, not sensitivity (House et al. 2010). Therefore they
do not provide process information, or information on feedbacks within ecosystems
once the climate becomes unsuitable.
The primary aim of this study was to model the impacts of climate change for the
active blanket bog priority habitat for the island of Ireland using climate and elevation
variables as predictors in a BEM framework. A secondary aim was to evaluate the

4
applicability of models in the BIOMOD framework (Thuiller 2003; Thuiller et al.,
2009) to habitat data. Finally a consensus model based on the averaged spatial
probabilities for the selected model categories was used to project changes in future
climate space.
2. Materials and Methods
2.1 Study area
The study area is the whole island of Ireland that covers ~84 421 km2
on the
Atlantic margin of northwest Europe, between ~51o and 56
oN. Elevations reach up to
1038 m above sea level (a.s.l.) (Corrán Tuathail, Co. Kerry). Much of the island is
lowland, partly surrounded by mountains, with a characteristic temperate oceanic
climate. Mean annual temperature (averaged over 1961 to 1990) is highest on the
south-west coast (10.4°C) and lowest inland (8.8°C). On average, annual precipitation
ranges from 750 to 1000 mm in the drier eastern half of the country and >3000 mm
yr-1
in parts of the western mountains (Rohan 1986). Active blanket bog is extensive
in the west, as well as locally on mountains throughout the island.
2.2 Data
Distribution data for Annex I priority habitats and species were provided by the
Irish National Parks and Wildlife Service (NPWS) in a GIS format. The maps are
based on a combination of habitat and species distribution maps compiled from
NPWS surveys (NPWS 2008). These data were complemented by data for Northern
Ireland (NI) Annex I from the Joint Nature Conservancy Council database (JNCC
2007) (Figure 1). Data of this resolution are appropriate for the modelling
undertaken in this study, where these have been converted to binary presence (1) and
absence (0) maps on a regular 10 x 10 km grid. The combined NPWS and JNCC data
provided 491 cells where active blanket bog is recorded present, and 472 cells where
it is recorded absent.
A quality controlled set of the 1961–1990 climate data was used to test and
construct the habitat BEMs for the baseline period. These 10 x 10 km resolution data
are derived from observed monthly climate data for 560 precipitation stations and 70
temperature stations interpolated using a polynomial regression method with an
inbuilt adjustment for elevation for the 1961-1990 baseline period (Sweeney and
Fealy 2003).
Met Éireann (The Irish Meteorological Service) supplied data from the HadCM3-
Q16 general circulation model (GCM) dynamically downscaled to a 14 x 14 km grid
resolution via the regional atmospheric model (RCA3) (McGrath & Lynch 2008).
The output used for the impacts modelling here is for an A1B scenario from the above
GCM and RCM combination. The A1B scenario projects a rise in annual temperature
of 1.3 to 1.8o C, a decrease in summer precipitation by 5 to 10% and an increase in
autumn and winter precipitation by 5 to 10% by 2021-2050 relative to the 1961-1990
baseline (McGrath & Lynch 2008). The projected warming is greatest in the south
and east of the country, whereas for precipitation there is no clear regional trend
(McGrath & Lynch 2008). The HadCM3-Q16 simulation of winter rainfall is in the
intermediate to low range among the ENSEMBLES RCMs (Jacob et al. 2008).
RCA3 simulated climate data for 1961-1990 and 2031-2060 were converted to
daily and monthly mean values for temperature and precipitation variables, and R-

5
based routines (R Development Core Team, 2010) were used to re-interpolate these
data to the 10 x 10 km modelling grid. The climate change signal derived with
respect to the RCA3 simulated 1961-1990 baseline for each 10 x 10 km grid cell was
then applied to the observed data for the variables of interest.
2.3 Derivation of explanatory variables
Both the baseline climate data and the climate change signal data were converted to
monthly and seasonal values for use in the BEMs. In addition to 8 climate variables,
4 variables for topography were also included (see Table S1 in the Supplement). The
data range for the climate variables are provided in Table S2 of the Supplement.
These data reproduce a previously identified east-west gradient primarily related to
precipitation, and a north-south gradient related to temperature for Irish peatlands
(Jones et al. 2006). The range of candidate explanatory variables evaluated also
overlap to some extent with those reported elsewhere (e.g. Fronzek et al. 2006,
Marmion et al. 2009a, Engler et al. 2011).
Mean elevation for each 10 x 10 km grid cell (ArcGIS 9.3) was derived from a
digital elevation model (GTOPO30) with a horizontal grid spacing of 30 arc s (~1 km),
and the range was calculated as highest minus lowest elevation in the focal cell. The
data were then referenced to the climatic datasets.
2.4 Bioclimatic envelope models
The BIOMOD modelling framework (Thuiller, 2003; Thuiller et al., 2009)
implements 9 conventional and new modelling methods, from which a selection of 7
were used in this study for the habitat modelling. The techniques included a mixture
of regression methods: generalised linear models (GLM) and generalised additive
models (GAM); the machine-learning methods artificial neural network (ANN),
random forest (RF) and generalised boosting method (GBM); together with 2
classification methods: classification tree analysis (CTA) and flexible discriminant
analysis (FDA).
A further objective in the model building process was to screen out collinearity in
the covariates selected for the baseline models, this recognises that multiple
regression-based approaches can be hampered by multicollinearity among predictors
(Heikkinen et al. 2006). BIOMOD can usefully specify non-linear terms for GLM in
particular, thereby opening up many more candidate covariate possibilities. However,
there is no screen for collinearity among predictors in BIOMOD per se. Therefore a
combination of correlation matrices and principal components analysis (PCA) were
used to screen the available covariates beforehand, and any collinear terms were
excluded from the final covariate selection used in the BIOMOD modelling. There
was also some a posteriori knowledge of where collinearity in the covariates was
probable based on previous work (Coll et al. 2011, 2013).
For all 7 models, the variables used were; annual temperature range (ATR), mean
winter precipitation (MWP) and temperature (MWT), elevation range (Range) and
mean elevation (Mean). Once the variables are selected, the individual models in
BIOMOD use internal measurements, based on either stepwise regression or
classification error rates; the Akaike information criterion (AIC) statistic is also
evaluated internally and the model with the lowest AIC chosen. BIOMOD also
provides an assessment of variable importance based on the extent to which model
predictions change when a given variable is randomised (Thuiller et al. 2009).

6
We emphasise caution not to interpret too much in relation to which variables were
included or not, as in any multivariate model-building process, producing a single
model can be dubious (Mac Nally 2000). This is particularly true when the candidate
explanatory variables are numerous and the potential causal relationships between
them and the response variable are not well known a priori.
In order to measure changes in climatic suitability for the habitat rather than
interpreting model projections as estimates of the changes in observed habitat
distributions, an ‘unlimited dispersal’ scenario was adopted, whereby the habitat is
assumed to be able to track shifting suitable climate over the entire study area. We
recognize that this is unrealistic for habitat modelling in particular, but the choice
reflects a desire to assess the potential change in the overall climate space for the
active blanket bog habitat in Ireland.
2.5 Model predictive performance
Projections of the probability of occurrence for each individual model were based
on a threshold maximizing the TSS, a commonly used threshold because it produces
the most accurate predictions (Allouche et al. 2006). Model accuracy was also
assessed with the area under the curve (AUC) from receiver operating characteristic
(ROC) plots (Fielding & Bell 1997). Although AUC has been criticised recently (e.g.
Lobo et al. 2008), it still provides an informative measure of model discriminatory
performance (Reineking and Schröder, 2006).
Each individual model in BIOMOD assesses the contribution of the predictor
variables to the model, and with a permutation procedure it is possible to extract a
measure of the relative importance of each variable. Once the models are calibrated, a
standard prediction is made and then one of the variables is randomised and a new
prediction made. The correlation score between that new prediction and the standard
prediction is calculated and is considered to give an estimation of the variable
importance in the model (Thuiller et al. 2009).
BIOMOD also allows the calculation of an ensemble prediction from all the models,
reducing the uncertainties arising from using only a single model. It provides several
methods to calculate the ensemble, such as probability mean and weighted mean. A
PCA of the median value was used and is calculated on the probabilities given by the
models. This ranks the models according to their predictive performance and in the
version of BIOMOD used here, the consensus model is the model whose projection is
the most correlated with the first axis of the PCA (Thuiller et al. 2009). It is
considered to be more reliable because it is less influenced by extreme values
(Thuiller et al. 2009), and a decay weighting of 1.6 was used. The decay gives the
relative importance of the weights; e.g. a decay of 1 is equivalent to a committee
averaging whereby the same weights are given to all the elements.
7
3. Results
3.1 Model performance and the importance of variables
The predicted baseline distributions obtained for all the BIOMOD active blanket
bog models have good TSS values (0.711 - 0.978), Kappa values (0.711 - 0.978); and
AUC range of values (0.915 - 0.976) (Table 1). This consistent performance between
the models for the baseline is reflected in the mean predicted probability for each
model type, which is not the case for the climate change projections, where there are
substantial differences in the mean probabilities (Figure 2).
For the active blanket bog modelling, there is again consistency between the
BIOMOD models in relation to the variable importance. Across the models, Range
and MWP emerge as consistently important, although the relative importance of each
varies between the models according to the influence of the other covariates in each
individual model type (Figure 3).
3.2 Comparison of baseline and projected climate space
A comparison of the mapped predictions for the baseline period from the 7
BIOMOD models with the observed distribution indicate that the pattern of the spatial
distribution of active blanket bog is well captured in all models, with incorrect
predictions mainly occurring in individual grid cells at the margins of the observed
active blanket bog distribution (Figures S1 – 7 in the Supplement).
By contrast, when the A1B scenario climate change data is projected through the
models, the results differ substantially between the different models. The GLM and
FDA models project the greatest potential loss of climate space compared to the
baseline (Table 2, see Figures S1 & S7 in the Supplement). The GAM and ANN
models project substantial potential losses of climate space (Table 2, see Figures S2 &
S3 in the Supplement); while the GBM model projects moderate losses (Table 2, see
Figure S4 in the Supplement), and the RF and CTA models project some potential
gains in climate space relative to the baseline (Table 2; see Figures S5 & S6 in the
Supplement).
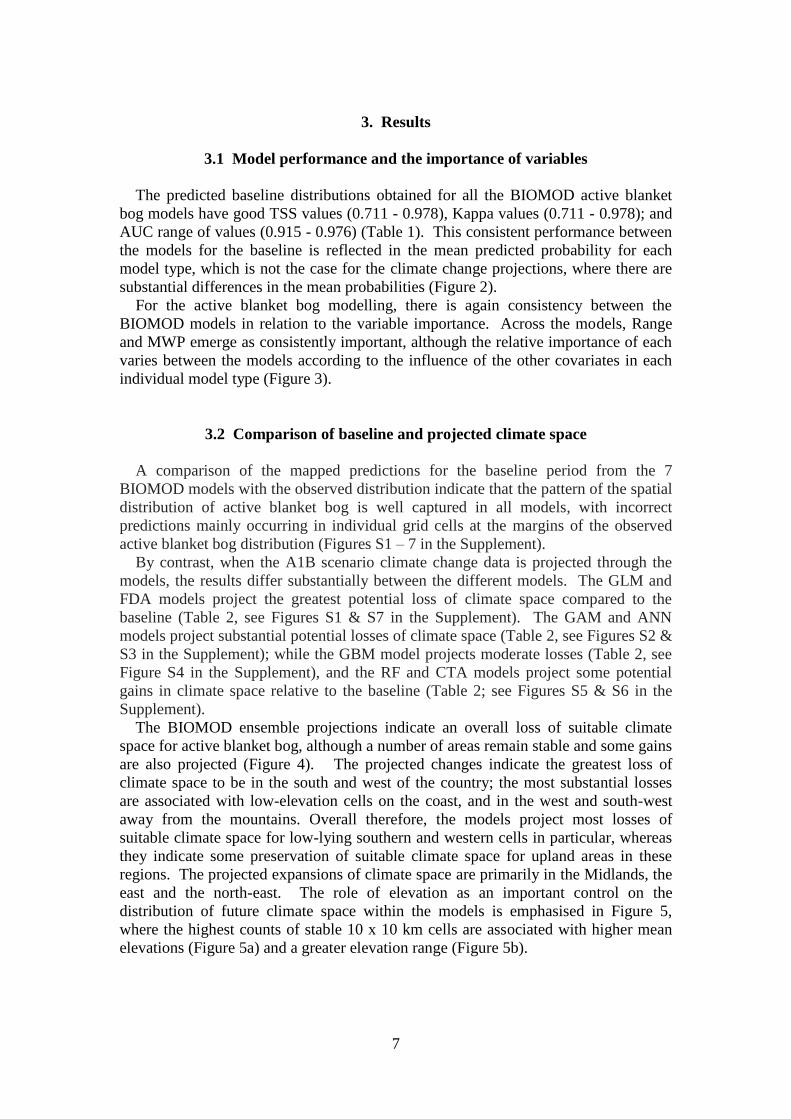
The BIOMOD ensemble projections indicate an overall loss of suitable climate
space for active blanket bog, although a number of areas remain stable and some gains
are also projected (Figure 4). The projected changes indicate the greatest loss of
climate space to be in the south and west of the country; the most substantial losses
are associated with low-elevation cells on the coast, and in the west and south-west
away from the mountains. Overall therefore, the models project most losses of
suitable climate space for low-lying southern and western cells in particular, whereas
they indicate some preservation of suitable climate space for upland areas in these
regions. The projected expansions of climate space are primarily in the Midlands, the
east and the north-east. The role of elevation as an important control on the
distribution of future climate space within the models is emphasised in Figure 5,
where the highest counts of stable 10 x 10 km cells are associated with higher mean
elevations (Figure 5a) and a greater elevation range (Figure 5b).

8
Discussion
4.1 Consensus modelling
Discrimination and calibration are two different but complementary measures of
model performance, so it has been suggested that both should be used in combination
(Harrel 2001). The different discrimination measurements are subject to debate (e.g.,
Fielding & Bell 1997, Guisan & Thuiller 2005), and there is no generally accepted
measure of performance for binary models (Pearce & Ferrier 2000).
Although not directed at this specific issue, the use of consensus methods are
becoming increasingly popular on the basis that they decrease the predictive
uncertainty of single-models by combining their predictions (Marmion et al., 2009b;
Grenouillet et al., 2011). Also, due to the variation in the performance of different
model types, averaging the results of individual models may increase the overall
accuracy of predictions (Araújo & New 2007). Model averaging can be performed by
weighting the individual model projections, by their AUC or TSS scores and
averaging the result, a method shown to be particularly robust if a number of model
families are to be evaluated (Marmion et al. 2009b). In this context, the ensemble
prediction provided by BIOMOD is particularly useful in reducing the uncertainties
associated with any given single model.
4.2 Modelling current distribution
Climatic variables used to determine blanket peat bioclimatic space include
temperature, growing degree days, precipitation and water balance (precipitation
minus potential evaporation) (Clark et al. 2010). Precipitation has been shown to be
more important than temperature in explaining blanket bog distribution in
Fennoscandia (Parviainen & Luoto 2007). In the UK, number of days with rainfall
was considered to be more important than total precipitation in explaining blanket
peat distribution (Clark et al. 2010). This is most likely because the number of rain
days has been linked with Sphagnum moss growth and primary production (Backeus
1988). Maximum temperature is thought to be the main factor limiting the
distribution of upland montane plant species in Britain (Rodwell et al. 1992),
although in the absence of maximum temperature data, mean temperature has been
used to explain blanket peat distribution (Hossell et al. 2000).
Overall the presented climate-based models for the distribution of active blanket
bogs successfully replicated the observed distribution across Ireland. The models are
therefore useful predictors. In general, climate is the primary controlling
environmental factor in the distribution of active blanket bogs at the geographical
scale modelled here; although elevation range through its influence on both
temperature and precipitation is also an important variable in the models.
MWP and Range emerge as the key variables in all the categories of model,
although their relative importance in relation to the other covariates specified varies
between the models. The influence of using elevation range in the models supports
results showing that the inclusion of topographical variables improves the predictive
accuracy of models for this habitat (Coll et al. 2011), which is also the case for
European butterfly species (Luoto & Heikkinen 2008). Climatic and topographical
gradients are known to operate at different spatial scales, with the latter nested in the

9
former (Bruun et al. 2006), so the inclusion of the elevation data in this study provides
a more local component for all the models. Furthermore, elevation range has been
commonly used as a surrogate for environmental and climatic heterogeneity within
grid cells in species richness modelling studies, as topographical heterogeneity
compresses biotic communities into more constricted vertical spaces (e.g. Coblentz &
Riitters 2004) and effectively mingles habitat types and species that are otherwise
often widely spatially separated.
Precipitation and elevation (through its influence on temperature) are known to be
key controls on the habitat distribution in the present, and their importance as
covariates in the models here reflect earlier findings in relation to the key controls on
the active blanket bog habitat distribution (Jones et al. 2006). Hence the future
changes in climate space projected for the habitats and their associated communities
and species in response to the changes in precipitation and winter temperature make
sense both biogeographically and topographically at the finer scale of analysis
presented here for Ireland. This has major implications for the type of blanket bog
most vulnerable to a loss of climate space, since the areas coincident with the greatest
loss of suitable climate space are associated with the lowland blanket bog distribution
along the western Atlantic seaboard.
4.3 Modelling the effect of climate change on active blanket bog distribution
A reduction in the climate space associated with blanket peat in the current study is
consistent with projections using a GLM model based on mean temperature for the
UK (Hossell et al. 2000), but differs from other studies of the region, where BEMs
based on ANNs using measures of soil water deficit and surplus, as well as maximum
and minimum temperature showed little overall change in blanket bog habitat under
the same United Kingdom Climate Impacts Programme 1998 (UKCIP98) scenarios
(Berry et al. 2003). UK-based modelling also indicates that the combination of
temperature and precipitation variables is important in BEMs for blanket peat. It was
found, for example, that models which included measures of both hydrological
conditions and maximum temperature provided a better fit to the mapped peat area
than models based on hydrological variables alone (Clark et al. 2010). In light of this,
it is surprising that the influence of MWT was not more substantial in the models
developed and applied here. However, given the clear importance of elevation range
in all the models, it is possible that it served as a proxy for some of the other seasonal
temperature terms which could have been included.
The significance of temperature in comparison to precipitation and water deficit in
controlling peatland surface wetness has also been more widely debated recently, with
contrasting views (Barber & Langdon 2007, Charman et al. 2009, Booth 2010).
However, it remains unclear whether climatic variables driving shorter-term water
table fluctuations (i.e. water deficit or annual accumulated monthly water deficit) or
longer term measures of surface wetness (i.e. maximum or summer temperature) are
more important for net peat accumulation in terms of the relative influence on
peatland vegetation and structure relative to net organic matter decomposition (Clark
et al. 2010). Nevertheless, combinations of winter precipitation and winter
temperature alongside the terrain variables parsimoniously captured the habitat
distribution here.

10
4.4 Limitations and assumptions of the methods
The limitations and assumptions involved in using a 10 x 10 km grid are well
known. Important controlling variables such as topographic and environmental
heterogeneity will be lost at this resolution, together with important local micro-
climatic controls. A key limitation is the lack of both data and resolution to discern
the differences between lowland and upland blanket bog. This is critical, as the
former is much rarer at a European scale (Sheehy Skeffington & O’Connell, 1998).
For similar scale-dependant reasons no account can be taken of the relative coherence
or patchiness of the active blanket bog habitat within individual grids where the
community presence is recorded. An obvious but important point in relation to the
active blanket bog habitats, is that projected changes in the climate space associated
with the current distribution of active blanket bog are not the same as projecting
changes in the actual distribution over the next century. It has been suggested that
blanket peat habitats, even if not in a state of active growth, could well persist over
decades or longer despite a reduction in climate space (Clark et al. 2010).
The BEMs presented here are based on derived statistical relationships between the
known mapped distribution of active blanket bog habitats and climatic variables; it is
not known whether this mapped distribution represents active blanket bog in an
equilibrium state with current climate. It is therefore possible that the calibrated
baseline models do not fully capture the climate envelope reflecting sustainable
conditions for the active blanket bog habitat presence. In addition, the caveat which
applies to BEMs in general must remain: compared to process-based simulation
models, BEMs are intuitive but also simplistic (Jeschke & Strayer, 2008). BEMs
couple presence-absence data to derive a multivariate and correlative characterisation
of the abiotic ecological niche based upon current distributions and use this to predict
the available climate space under scenarios of global warming. This assumes that
distributions are principally determined by intrinsic physiological tolerances relating
to temperature, moisture etc., a longstanding view in ecology captured in the
fundamental niche concept; whereas the realised niche is essentially the net
occupancy range after accounting for biotic effects (Hutchinson 1957). However, as
BEMs utilise observed ranges for their estimates, they use realised distributions to
predict future distributions. Nevertheless, and despite the criticisms, BEMs and other
models are providing an ever-better understanding of the mechanisms by which
species and ecosystems are affected by climate change, and tremendous
improvements are being made in virtually all aspects of this emerging field (Bellard et
al. 2012).
The final variables selected in the models reflect 2 primary properties of climate
that are key factors affecting species and habitat distribution: temperature and water
(e.g. Whittaker et al. 2007). However, other important environmental information is
omitted in the models. Blanket peat tends to form on impermeable rocks or thick
layers of glacial till on shallow slopes (typically <10°) where saturated conditions are
allowed to develop because of impeded and/or slow drainage (Taylor 1983).
Therefore there is scope to refine the models by the inclusion of more refined
topography and land cover variables; obvious candidates for the active blanket bog
habitats would be further information on slope angle and aspect, which through their
controls on light regimes influence evapotranspiration. For example, differences in
light regimes between north- and south-facing aspects in temperate latitudes can
produce differences in temperature equivalent to a move of ~200 km polewards
(Austin & van Neill 2011). It has also been widely reported that the influence of

11
local topography may create critical climatic refugia that are important even in studies
of very large areas (Coll 2010, Austin & Van Neill 2011). Consequently, there is
scope to incorporate more refined measures in future models which better capture the
influence of topography in creating the conditions necessary for the persistent rainfall
which supports blanket bog formation. However, prior to and throughout the
modelling process we critically considered key assumptions and rigorously evaluated
covariate selection based on the data available. In this sense, we consider that the
results are presented in an appropriate conceptual context (sensu Araújo & Townsend
Peterson 2012).
4.5 Implications of changing climate space for bog distributions
The projected decline in the climate space associated with active blanket bog areas
can be expected to have significant implications for the ecology of these complex
wetland ecosystems and their associated plant and animal species adapted to live in
the wet, nutrient-poor, conditions. Seasonal drying for example may affect surface
micro-topography and hydrology. This in turn will influence the plant composition
and habitat suitability for birds and other species. Loss of unprotected high quality
wetlands such as active blanket bog will result in the direct loss of wetland
biodiversity by physical removal of the habitats and most plant and invertebrate
species, while degradation may cause reduced species diversity and local extinction of
rare or sensitive species (Scally et al. 2010). Such a climate change-driven
degradation and loss may have secondary impacts on the biodiversity value of the
remaining bog areas through increased isolation and fragmentation of the remaining
habitat. Degrading bogs will also have an impact on the climate through changes in
the peatland CO2 and methane (CH4) dynamics.
5 Conclusions and implications for future work
Our results indicate that the distribution of active blanket bog in Ireland is
regionally sensitive to climate change, most notably for lower-lying areas in the south
and west of the country. Increasing temperature and precipitation changes will reduce
the area that is suitable for active blanket bog development. This could have major
implications for the lowland blanket bog distribution along the western Atlantic sea-
board where the projected losses are greatest. Offsetting these losses are the minor
climate space gains in the Midlands and the north east, and some retention of suitable
climate space in upland areas in the south and west. It should, however, be
emphasised that it will not be possible for new habitat to form. These changes may
proportionately affect lowland more than upland blanket bog, with critical
conservation policy implications. Further degradation as result of climate change may
also result in peatlands becoming carbon source ecosystems with the potential to lose
carbon either as trace gases such as carbon dioxide (CO2) and methane (CH4) or
fluvial dissolved organic carbon (Koehler et al. 2010).
Incorporating more detailed information into the BEMs can further improve
confidence and reduce uncertainty in model estimates for the future distribution of
Irish blanket bogs. Specifically information such as bog type and altitude at a finer
scale could better inform us on active blanket bog status and type. Other information

12
concerning e.g. underlying drift, soil conditions, and slope angle and aspect may
improve model results. The distribution models presented here should be applicable to
blanket bog regions outside Ireland, so long as data for the evaluation of the estimates
is available.
Some attempt has been made to deal with uncertainty, at least in relation to
differing results between the model categories, by providing the results from the
individual BEMs implemented in the BIOMOD framework alongside the ensemble
projection. Certainly there is substantial variation in the results between the
individual BEM types when the AIB scenario data is projected through the models.
Although only the downscaled output from one GCM and scenario has been used to
project climate space changes here, the methods lend themselves to using different
GCM and RCM outputs from a range of scenarios (e.g. Fronzek et al. 2011; Garcia et
al. 2012) and from different GCMs to better encapsulate uncertainty. Given the
importance of mean winter precipitation in all the BEM model families, had a wetter
or dryer model or scenario been used from the ENSEMBLES RCMs, the results
projected via the BEMs could have varied further. However, it is also worth noting
that more comprehensive weighting approaches to climate model output which also
incorporate model skill in areas beyond the mean climate state are required even in
domain-specific investigations (Foley et al. 2013).
Overall, such an expanded framework would allow the identification of adaptation
strategies that are robust (i.e. insensitive) to climate change uncertainties, and would
allow more confidence in identifying and targeting vulnerable areas of blanket bog for
priority conservation management measures. However, future research could also
integrate such a scenarios-impacts (top-down) approach alongside a vulnerability-
thresholds (bottom-up) approach. Rather than trying to predict impacts through
individual scenarios, such an integrated approach would help to better identify critical
thresholds for climate change vulnerabilities alongside the multiple other drivers of
change in these sensitive systems.

13
Acknowledgements. We thank: the technical and scientific support staff at NPWS
(Ireland) for supplying the GIS habitat maps for Irish priority habitats and species;
Graham French at the National Biodiversity Network (UK) for supplying the GIS-
enabled Irish Grid data and Steve Wilkinson at the Joint Nature Conservancy Council
(UK) for the priority habitats and species database containing the NI records. We also
thank Ray McGrath and Tido Semmler at Met Éireann for providing the c4i climate
change data. J.C. would also like to thank his ICARUS colleagues R. Teck and C.
Holman for their input in processing the climate change data; and A. Ralph and S.
Bastola for their helpful discussions on some of the statistical elements of the
modelling. D.B. would like to thank the Royal Irish Academy for awarding a Mobility
Grant which enabled his visit to Laboratoire d'Ecologie Alpine, CNRS and Université
Joseph Fourier, Grenoble, France to collaborate with Dr W. Thuiller and his team on
the application of BIOMOD to undertake the climate change and biodiversity
modelling. Without all of their goodwill, assistance and support, our progress in the
methods developed here for Ireland would not have been possible. This research was
supported by the Irish Environmental Protection Agency (EPA) under grants 2007-
CCRP-2.26 and 2010-CCRP-DS-2.3. We would also very much like to thank the 2
anonymous reviewers who provided valuable feedback and comment on the original
manuscript.

14
References
Allouche O, Tsoar A, and Kadmon, R (2006) Assessing the accuracy of species
distribution models: prevalence, kappa and the true skill statistic (TSS). J Appl
Ecol 43: 1223-1232
Araújo MB, Guisan A (2006) Five (or so) challenges for species distribution
modelling. J Biogeogr 33,1677–1688
Araújo MB, New M (2007) Ensemble forecasting of species distributions. Trends
Ecol Evol 22, 42–47
Araújo MB, and Townsend Peterson A (2012) Uses and misuses of bioclimatic
envelope modelling. Ecol 93(7): 1527-1539
Austin MP, Van Niel KP (2011) Improving species distribution models for climate
change studies: variable selection and scale. J Biogeogr 38: 1-8
Backeus I (1988) Weather variables as predictors of Sphagnum growth on a bog. Hol
Ecol 11:146–150
Barber KE, Langdon PG (2007) What drives the peat-based paleoclimate record? A
critical test using multiproxy climate records from northern Britain. Quat Science
Review 26: 3318–3327
Bellard C, Bertelsmeier C, Leadley P, Thuiller W, Courchamp F (2012) Impacts of
climate change on the future of biodiversity. Ecol Lett 15: 365-377
Berry PM, Dawson TP, Harrison PA, Pearson R, Butt N (2003) The sensitivity and
vulnerability of terrestrial habitats and species in Britain and Ireland to climate
change. J Nature Conservation 11:15–23
Bonn A, Allott T, Hubacek K, Stewart, J (2009) Drivers of environmental change in
upland environments. Routledge, Abingdon
Booth RK (2010) Testing the climate sensitivity of peat-based paleoclimate
reconstructions in mid-continental North America. Quat Science Review 29:720–
731
Bragg OM, Tallis JH (2001) The sensitivity of peat-covered upland landscapes.
Catena 42: 345–360
Bruun HH, Moen J, Virtanen R, Grytnes JA, Oksanen L and Angerbjorn A (2006)
Effects of altitude and topography on species richness of vascular plants,
bryophytes and lichens in alpine communities. J Veg Sci: 17 37–46
Charman DJ, Barber KE, Blaauw M, Langdon, PG and others (2009) Climate drivers
for peatland palaeoclimate records. Quat Science Review 28:1811–1819
Clark JM, Gallego-Sala AV, Allott TEH, Chapman SJ and others (2010) Assessing
the vulnerability of blanket peat to climate change using an ensemble of statistical
bioclimatic envelope models. Clim Res 45:131–150
Coblentz DD, Riitters KH (2004) Topographic controls on the regional-scale
biodiversity of the south-western USA. J Biogeogr 31: 1125-1138
Coll J (2010) Climate Change and Europe’s Mountains. In: Price, MF (ed) Europe's
ecological backbone: recognising the true value of our mountains. European
Environment Agency (EEA) Report No 6/2010
Coll J, Bourke D, Sweeney J, Gormally, M, Sheehy Skeffington M (2011)
Developing a predictive modelling capacity for a climate change vulnerable
blanket bog habitat: Assessing baseline climate relationships. Ir Geog 44:1, 27-60
Coll J, Bourke D, Gormally M, Sheehy Skeffington M, and Sweeney J (2013) Climate
change impacts on biodiversity in Ireland: Projecting changes and informing
adaptation measures. Environmental Protection Agency CCRP Report No. 19.
Wexford

15
Coll J, Gibb SW, Price MF, McClatchey J, Harrison J (2010). Developing site scale
projections of climate change in the Scottish Highlands. Clim Res 45:71-85
Connolly J, Holden N, Ward S (2007) Mapping peatlands in Ireland using a rule-
based methodology and digital data. Soil Sci Soc Am J 71, 492–499
Dykes AP, Gunn J, Convery KJ (2008) Landslides in blanket peat on Cuilcagh
Mountain, northwest Ireland. Geomorphology 102 (3-4): 325-340
Eaton JM, McGoff NM, Byrne KA, Leahy P and Kiely G (2008) Land cover change
and soil organic carbon stocks in the Republic of Ireland 1851–2000. Clim Chang
91: 317–334
Engler R, Randin CF, Thuiller W, Dullinger S and others (2011) 21st century climate
change threatens mountain flora unequally across Europe. Glob Change Biol 17:
2330–2341
Fielding A, Bell JF (1997) A review of methods for the assessment of prediction
errors in conservation presence/absence models. Environ Conserv 24:38–49
Foley A, Fealy R, Sweeney J. (2013) Model skill measures in probabilistic regional
climate projections for Ireland. Clim Res 56: 33-49
Fronzek S, Carter TR, Luoto, M (2011) Evaluating sources of uncertainty in
modelling the impact of probabilistic climate change on sub-arctic palsa mires. Nat.
Hazards Earth Syst Sci 11: 2981-2995
Fronzek S, Luoto M, Carter TR (2006) Potential effect of climate change on the
distribution of palsa mires in subarctic Fennoscandia. Clim Res 32: 1-12
Garcia RA, Burgess ND, Cabeza M, Rahbek C, Araújo MB (2012) Exploring
consensus in 21st century projections of climatically suitable areas for African
vertebrates. Glob Change Biol 18 (4), 1253-1269
Grenouillet G, Buisson L, Casajus N, Lek S. (2011) Ensemble modelling of species
distribution: the effects of geographical and environmental ranges. Ecography
34:9-17
Guisan A, Thuiller W (2005) Predicting species distributions: offering more than
simple habitat models. Ecol Lett 9: 993-1009
Hammond RF (1984) The Classification of Irish peats as surveyed by the National
Soil Survey of Ireland. 7th International Peat Congress, Dublin
Harrell EE (2001) Regression Modeling Strategies. Springer- Verlag, New York
Heathwaite AL (1993) Disappearing peat – regenerating peat: the impact of climate
change on British peatlands. Geo Journal 159: 203–208
Heikkinen RK, Luoto M, Araújo MB, Virkalla M, Thuiler W and Sykes MT (2006)
Methods and uncertainties in bioclimatic envelope modelling under climate
change. Prog Phys Geog 30(6): 751-777
Holden J (2009) Upland hydrology. In: Bonn A, Allott T, Hubacek K, Stewart J (eds)
Drivers of environmental change in uplands. Routledge, London
Hossell JE, Briggs B, Hepburn IR (2000) Climate change and UK nature conservation:
a review of the impact of climate change on UK species and habitat conservation
policy. Department of the Environment, Transport and the Regions, London
House JI, Orr HG, Clark JM, Gallego-Sala AV, Freeman C, Prentice C, Smith P
(2010) Climate change and the British Uplands: evidence for decision making.
Clim Res 45: 3–12
Hutchinson GE (1957) Concluding remarks. Population studies: Animal ecology and
demography. Cold Spring Harbor Symp. Quantative Biology 22:415-427
Jacob D, Bøssing Christensen O, Doblas-Reyes FJ, Goodess C and others (2008).
Information on observations, global and regional modelling data availability and
statistical downscaling. ENSEMBLES Technical Report No 4

16
(http://ensemblesrt3.dmi.dk/quicklook/quicklook.html. Last Accessed, October
2013)
Jeschke JM, Strayer DL (2008) Usefulness of Bioclimatic Models for Studying
Climate Change and Invasive Species. Ann N Y Acad Sci 1134: 1-24
JNCC (2007) Second Report by the UK under Article 17 on the implementation of
the Habitats Directive from January 2001 to December 2006. Joint Nature
Conservation Committee, Peterborough
Jones MB, Donnelly A, and Albanito, F (2006) Responses of Irish vegetation to
future climate change. Biol Environ 106B(3): 323-334
Koehler A, Sottocornola M and Kiely G (2011) How strong is the current carbon
sequestration of an Atlantic blanket bog? Glob Change Biol 17, 309–319
Kurbatova J, Li C, Tatarinov F, Varlagin A, Shalukhina N, Olchev A (2009)
Modeling of the carbon dioxide fluxes in European Russia peat bogs
Environ Res Lett , 4 (4): 1-5
Lindsay RA, Charman DJ, Everingham F, O’Reilly RM, Palmer MA, Rowell TA,
Stroud DA (1988) The flow country: the Peatlands of Caithness and Sutherland.
Nature Conservancy Council, Peterborough
Lobo JM, Jimenez-Valverde A, Real R (2008) AUC: a misleading measure of the
performance of predictive distribution models. Glob Ecol Biogeogr 17: 145–151.
Luoto M, Heikkinen RK (2008) Disregarding topographical heterogeneity biases
species turnover assessments based on bioclimatic models. Glob Change Biol 14:
483-494
MacNally R (2000) Regression and model-building in conservation biology,
biogeography and ecology: the distinction between - and reconciliation of -
'predictive' and explanatory models. Biodivers Conserv 9: 655-671
Malmer N (1992) Peat accumulation and the global carbon cycle. In: Boer M, Koster,
E (eds) Greenhouse-Impact on Cold-Climate Ecosystems and Landscapes.
Selected papers of the European Conference on Landscape Ecological Impact of
Climatic Change. Lunteren, The Netherlands. Catena Supplement 22:97–110
Malone S, O’Connell C (2009) Ireland’s Peatland Conservation Action Plan 2020—
halting the loss of peatland biodiversity. Irish Peatland Conservation Council,
Kildare
Maltby E (2010) Effects of climate change on the societal benefits of UK upland peat
ecosystems: applying the ecosystem approach. Clim Res 45: 249–259
Marmion M, Luoto M, Heikkinen RK, Thuiller W (2009a) The performance of
state-of-the-art modelling techniques depends on geographical distribution of
species. Ecol Model 220: 3512–3520
Marmion M, Parviainen M, Luoto M, Heikkinen R, Thuiller W (2009b) Evaluation of
consensus methods in predictive species distribution modelling. Diversity and
Distributions 15: 59-69
McGrath R, Lynch P (eds) (2008) Ireland in a Warmer World: Scientific Predictions
of the Irish Climate in the Twenty-First Century. Community Climate Change
Consortium for Ireland (C4I), Dublin
NPWS (2008) The Status of EU Protected Habitats and Species in Ireland. National
Parks and Wildlife Service, Department of the Environment, Heritage and Local
Government, Dublin
Parviainen M, Luoto M (2007) Climate envelopes of mire complex types in
Fennoscandia. Geogr Ann A 89A:137–151
Pearce J, Ferrier S (2000) Evaluating the predictive performance of habitat models
developed using logistic regression. Ecol Model 133: 225-245

17
R Development Core Team (2010). CRAN R Library repository. Available at:
http://cran.r-project.org/.
Reineking B and Schröder, B (2006) Constrain to perform: Regularization of habitat
models. Ecol Model 193(34): 675-690
Renou-Wilson F, Bolger T, Bullock C, Convery F and others (2011) BOGLAND:
Sustainable Management of Peatlands in Ireland. EPA STRIVE Report Series No
76. Wexford
Rodwell JS, Pigott CD, Ratcliffe DA, Malloch AJC and others (1992) British plant
communities, Vol 3. Grasslands and montane communities. Cambridge University
Press, Cambridge
Rohan PK (1986) The climate of Ireland. The Stationery Office, Dublin
Scally L, Waldren S., Atalah J, Brown, M. and others (2010) Biodiversity and
Environmental Change an Integrated Study Encompassing a Range of Scales,
Taxa and Habitats (Biochange). Draft Technical Project Report. Environmental
Protection Agency, Wexford
Schouten MGC. (1984) Some Aspects of the Ecogeographical Gradient in the Irish
Ombrotrophic Bogs. Proceedings of the 7th International Peat Congress, Dublin
Sheehy Skeffington MJ, O’Connell C (1998) Peatlands of Ireland. Studies in Irish
Limnology. In: Giller, P (ed) Societas Internationalis Limnologiae (SIL). Dublin
Sweeney J, Fealy R. (2003) Establishing Reference Climate Scenarios. In: Sweeney,
J (ed) Climate Change Scenarios and Impacts For Ireland. Environmental
Protection Agency. ERTRI Report 15, Dublin
Sweeney K, Fealy R, McElwain L, Siggins L, Sweeney J, Trinies T. (2008). Changing
Shades of Green: The environmental and cultural impacts of climate change in
Ireland. California, The Irish American Climate Project & Rockefeller Family
Fund, New York
Taylor JA (1983) The peatlands of Great Britain and Ireland. In: Gore AJP (ed)
Ecosystems of the world, Vol. 4B; mires: swamp, bog, fen and moor. Elsevier,
Amsterdam
Thuiller W (2003) BIOMOD - optimizing predictions of species distributions and
projecting potential future shifts under global change. Glob Change Biol 9: 1353-
1362
Thuiller W. (2004a) Patterns and uncertainties of species’ range shifts under climate
change. Glob Change Biol 10: 2020–2027
Thuiller W, Araújo, MB and Lavorel S (2004b) Do we need land-cover data to
predict species distributions in Europe? J Biogeogr 31: 353–361
Thuiller W., Lafourcade, B., Araujo, M. (2009) Model Operating Manual for
BIOMOD. Universite Joseph Fourier, Grenoble
Warburton J, Holden J, Mills AJ (2004) Hydrological controls of surficial mass
movements in peat. Earth Sci Rev 67(1-2): 139-156
Whittaker RJ, Nogues-Bravo D and Araújo MB (2007) Geographic gradients of
species richness: a test of the water-energy conjecture of Hawkins et al. (2003)
using European data for five taxa. Global Ecol Biogeogr 16: 76–89
Wieder R., Vitt DH (2006) Boreal peatland ecosystems. Springer, Berlin
Yallop AR, Clutterbuck B, Thacker J (2010) Increases in humic dissolved organic
carbon export from upland peat catchments: the role of temperature, declining
sulphur deposition and changes in land management. Clim Res 45: 43–56

18
Figures
Figure 1. Current distribution of active blanket bog in Ireland based on National Parks
and Wildlife Service data (Ireland) and Joint Nature Conservancy Council data
(Northern Ireland). Squares: habitat presence (blue) or absence (white) squares.

19
0
0.2
0.4
0.6
0.8
1
GLM -
BL
GLM -
CC
GAM -
BL
GAM -
CC
ANN -
BL
ANN -
CC
GBM -
BL
GBM -
CC
RF - BL RF -
CC
CTA -
BL
CTA -
CC
FDA -
BL
FDA -
CC
Model category
Mean
pre
dic
ted
pro
bab
ilit
y
Figure 2: Summary comparison of the predictive performance of the 7 models
implemented in BIOMOD illustrating the mean probability distribution shifts
associated with the climate change projections (CC; 20131-2060) compared to the
baseline. (BL;1961-1990) baseline mean probability prediction for each model type.
Vertical bars: +/- SE. See Table 1 for model acronyms

20
0
0.1
0.2
0.3
0.4
0.5
0.6
ANN CTA GAM GBM GLM FDA RF
Va
ria
ble
im
po
rta
nc
e
Model category
ATR
MWP
MWT
Range
Mean
Figure 3: Relative importance of the variables used to model the active blanket bog
distribution. Variable importance was calculated as 1 minus the correlation between
the standard prediction and the prediction where the considered variable was
randomised. ATR: annual temperature range, MWP/MWT: mean winter
precipitation/temperature, Range: elevation range, Mean: mean elevation. See Table
1 for model acronyms

21
Figure 4: Mapped BIOMOD consensus model output for the active blanket bog
habitat based on a Principal Components Analysis (PCA) of the median probability
values and the True Skill Statistic (TSS) threshold. Red squares: projected losses of
climate space for the A1B 2031-2060 scenario relative to the baseline; blue squares:
stable climate space grids; green squares: potential climate space gains relative to the
baseline

22
Figure 5: BIOMOD consensus model projected absent, gain, loss and stable summary
count matched to the (a) the mean elevation and (b) the elevation range of the 10 x 10
km grid cells. Vertical bars: +/- SE.
0
50
100
150
200
250
300
350
400
Absent Gain Loss Stable
10 x
10k
m G
rid
cel
l co
un
ta
0
50
100
150
200
250
300
350
400
Absent Gain Loss Stable
10 x
10k
m G
rid
cel
l co
un
ta
0
50
100
150
200
250
300
350
400
Absent Gain Loss Stable
10 x
10k
m G
rid
cel
l co
un
t
b
0
50
100
150
200
250
300
350
400
Absent Gain Loss Stable
10 x
10k
m G
rid
cel
l co
un
t
b

23
Tables
Table 1. Summary comparison of model evaluation statistics with respect to the 7
BIOMOD modelling techniques used. TSS: true skill statistic; Kappa: Cohen’s
Kappa; AUC: area under the curve. GLM: generalized linear models; GAM:
generalized additive models; ANN: artificial neural networks; GBM: general boosting
method; RF: random forests; CTA: classification tree analysis; FDA: flexible
discriminant analysis; CONSENSUS: BIOMOD consensus model weighted values
Model category TSS Kappa AUC
GLM 0.768 0.767 0.942
GAM 0.757 0.757 0.941
ANN 0.711 0.711 0.930
GBM 0.765 0.764 0.944
RF 0.755 0.754 0.942
CTA 0.753 0.753 0.915
FDA
CONSENSUS
0.742
0.978
0.743
0.978
0.936
0.976
Table 2. Summary comparison of individual model baseline prediction calls and
projected changes in climate space associated with the A1B 2031−2060 climate
scenario data applied for each 10 × 10 km grid square. MEAN: average of the 7
model categories (grid cell counts rounded to nearest whole number). See Table 1 for
acronyms
Model
category
Baseline
Predicted
Presence
Baseline
Predicted
Absence
Climate
Change
Projected
Presence
Climate
Change
Projected
Absence
Projected
Loss
Projected
Stable
Projected
Gain
%
change
from
baseline
GLM 487 476 131 832 386 547 30 -73.1
GAM 473 490 266 697 252 666 45 -43.8
ANN 482 481 340 623 196 713 54 -29.5
GBM 513 450 443 520 125 783 55 -13.6
RF 491 472 526 437 84 760 119 +7.1
CTA 500 463 577 386 48 790 125 +15.4
FDA
MEAN
511
494
452
469
89
339
874
624
450
220
485
678
28
65
-82.6
-31.4
Copyright © 2022 FDOKUMEN