
Creation and functioning of a buffer zone in a blanket peatforested catchment
10
Ecological Engineering 62 (2014) 83–92 Contents lists available at ScienceDirect Ecological Engineering journa l h om epage: www.elsevier.com/locate/ecoleng Creation and functioning of a buffer zone in a blanket peat forested catchment Connie O’Driscoll a,b , Mark O’Connor a , Zaki-ul-Zaman Asam a,b , Elvira de Eyto c , Michael Rodgers a , Liwen Xiao b,∗ a Civil Engineering, National University of Ireland, Galway, Ireland b Department of Civil, Structural and Environmental Engineering, Trinity College Dublin, Dublin 2, Ireland c Marine Institute, Newport, Co. Mayo, Ireland a r t i c l e i n f o Article history: Received 27 May 2013 Received in revised form 14 October 2013 Accepted 21 October 2013 Keywords: Peatland forest Buffer zone Phosphorus Retention Grass seeding a b s t r a c t Buffer zones can be used to reduce nutrient and suspended sediment export following forest clearfelling by directing runoff over a vegetated area. This study demonstrates the achievability of constructing a buffer zone by initially clearfelling the standing forest, seeding with two native grass species and direct- ing the water from a semi-natural stream draining an upstream 10 ha forested peatland site through it. Following the clearfelling of the upstream study site this study tested the efficacy of this management practice in reducing nutrient and suspended sediment concentration in the receiving water. The buffer zone reduced total reactive phosphorus (TRP) and suspended sediment (SS) loads by 18% and 33%, respec- tively. Phosphorus (P) retention efficiency was dependent on inlet concentrations, loading and hydraulic loading rates. In storm events with a loading rate of >28 g P ha −1 , a flow rate higher than 88.5 L s −1 and an inlet concentration of <17 g L −1 the buffer zone became a TRP release source. The maximum P concen- tration in the buffer zone did not exceed 40 g L −1 during this study demonstrating that the buffer zone method could be used efficiently in peatland forestry to moderate the high P concentrations and assist in protecting salmonids and freshwater pearl mussels. © 2013 Elsevier B.V. All rights reserved. 1. Introduction Buffer zones are widely used for water management in urban and agricultural catchments (Correll, 2005). The fundamental con- cept is to prevent erosion, increase sedimentation and improve water quality by directing outflow through a vegetated area retain- ing storm runoff and reducing peak discharge. Similarly, buffer zones have been used in forestry (Aust and Blinn, 2004; Luke et al., 2007; Parkyn et al., 2005) and more specifically peatland forestry in boreal conditions (Ihme, 1994; Heikkinen et al., 1995; Kubin et al., 2000; Nieminen et al., 2005; Väänänen et al., 2008). In this study we applied the buffer zone method for the first time to peat- land forestry in moderate oceanic climatic conditions where forests were established without buffer zones and trees planted to the stream edge (Broadmeadow and Nisbet, 2004; Ryder et al., 2011). Approximately 3.75% of the world’s peatlands have been drained for commercial forestry (Joosten and Clarke, 2002). In the northern hemisphere peatland afforestation was practiced ∗ Corresponding author. Tel.: +353 1 896 3741. E-mail address: [email protected] (L. Xiao). extensively during the late 20th century (Paavilainen and Päivänen, 1995) and with many of these peatland forests now reaching har- vestable age, concerns have been raised about the potential impact of forest harvesting on the receiving aquatic systems. Peatland forest harvesting operations in temperate maritime climatic con- ditions are particularly environmentally challenging due to high annual precipitation (Müller, 2000; Rodgers et al., 2010), high soil water content, (Long and Jennings, 2006), low ground bearing capacity (Owende et al., 2002) and typically high ecological sen- sitivity of the receiving waters (O’Driscoll et al., 2012). Increases in nutrient and suspended sediment concentrations have been well documented (Cummins and Farrell, 2003a; Nieminen, 2003; Rodgers et al., 2010,2011) associated with the degradation of log- ging residues and mechanical disturbance on the ground (Cummins and Farrell, 2003a; Nieminen, 2003; Rodgers et al., 2010). Excess Nitrogen (N) and Phosphorus (P) input to receiving waterbod- ies can trigger eutrophication thus deteriorating water quality (European Union, 2000). Similarly, high organically derived sus- pended sediment (SS), could consume oxygen resources further damaging the ecological status of receiving water (Paavilainen and Päivänen, 1995; Greig et al., 2007). With timber production set to increase across Europe, supported by governments for its 0925-8574/$ – see front matter © 2013 Elsevier B.V. All rights reserved. http://dx.doi.org/10.1016/j.ecoleng.2013.10.029
Transcript of Creation and functioning of a buffer zone in a blanket peatforested catchment

Cf
CEa
b
c
a
ARRA
KPBPRG
1
acwiz2ieslws
dt
0h
Ecological Engineering 62 (2014) 83– 92
Contents lists available at ScienceDirect
Ecological Engineering
journa l h om epage: www.elsev ier .com/ locate /eco leng
reation and functioning of a buffer zone in a blanket peatorested catchment
onnie O’Driscoll a,b, Mark O’Connora, Zaki-ul-Zaman Asama,b,lvira de Eytoc, Michael Rodgersa, Liwen Xiaob,∗
Civil Engineering, National University of Ireland, Galway, IrelandDepartment of Civil, Structural and Environmental Engineering, Trinity College Dublin, Dublin 2, IrelandMarine Institute, Newport, Co. Mayo, Ireland
r t i c l e i n f o
rticle history:eceived 27 May 2013eceived in revised form 14 October 2013ccepted 21 October 2013
eywords:eatland forestuffer zone
a b s t r a c t
Buffer zones can be used to reduce nutrient and suspended sediment export following forest clearfellingby directing runoff over a vegetated area. This study demonstrates the achievability of constructing abuffer zone by initially clearfelling the standing forest, seeding with two native grass species and direct-ing the water from a semi-natural stream draining an upstream 10 ha forested peatland site through it.Following the clearfelling of the upstream study site this study tested the efficacy of this managementpractice in reducing nutrient and suspended sediment concentration in the receiving water. The bufferzone reduced total reactive phosphorus (TRP) and suspended sediment (SS) loads by 18% and 33%, respec-
hosphorusetentionrass seeding
tively. Phosphorus (P) retention efficiency was dependent on inlet concentrations, loading and hydraulicloading rates. In storm events with a loading rate of >28 g P ha−1, a flow rate higher than 88.5 L s−1 and aninlet concentration of <17 �g L−1 the buffer zone became a TRP release source. The maximum P concen-tration in the buffer zone did not exceed 40 �g L−1 during this study demonstrating that the buffer zonemethod could be used efficiently in peatland forestry to moderate the high P concentrations and assist inprotecting salmonids and freshwater pearl mussels.
e1vofdawcsiwRga
. Introduction
Buffer zones are widely used for water management in urbannd agricultural catchments (Correll, 2005). The fundamental con-ept is to prevent erosion, increase sedimentation and improveater quality by directing outflow through a vegetated area retain-
ng storm runoff and reducing peak discharge. Similarly, bufferones have been used in forestry (Aust and Blinn, 2004; Luke et al.,007; Parkyn et al., 2005) and more specifically peatland forestry
n boreal conditions (Ihme, 1994; Heikkinen et al., 1995; Kubint al., 2000; Nieminen et al., 2005; Väänänen et al., 2008). In thistudy we applied the buffer zone method for the first time to peat-and forestry in moderate oceanic climatic conditions where forests
ere established without buffer zones and trees planted to thetream edge (Broadmeadow and Nisbet, 2004; Ryder et al., 2011).
Approximately 3.75% of the world’s peatlands have beenrained for commercial forestry (Joosten and Clarke, 2002). Inhe northern hemisphere peatland afforestation was practiced
∗ Corresponding author. Tel.: +353 1 896 3741.E-mail address: [email protected] (L. Xiao).
Ni(pdas
925-8574/$ – see front matter © 2013 Elsevier B.V. All rights reserved.ttp://dx.doi.org/10.1016/j.ecoleng.2013.10.029
© 2013 Elsevier B.V. All rights reserved.
xtensively during the late 20th century (Paavilainen and Päivänen,995) and with many of these peatland forests now reaching har-estable age, concerns have been raised about the potential impactf forest harvesting on the receiving aquatic systems. Peatlandorest harvesting operations in temperate maritime climatic con-itions are particularly environmentally challenging due to highnnual precipitation (Müller, 2000; Rodgers et al., 2010), high soilater content, (Long and Jennings, 2006), low ground bearing
apacity (Owende et al., 2002) and typically high ecological sen-itivity of the receiving waters (O’Driscoll et al., 2012). Increasesn nutrient and suspended sediment concentrations have been
ell documented (Cummins and Farrell, 2003a; Nieminen, 2003;odgers et al., 2010,2011) associated with the degradation of log-ing residues and mechanical disturbance on the ground (Cumminsnd Farrell, 2003a; Nieminen, 2003; Rodgers et al., 2010). Excessitrogen (N) and Phosphorus (P) input to receiving waterbod-
es can trigger eutrophication thus deteriorating water qualityEuropean Union, 2000). Similarly, high organically derived sus-
ended sediment (SS), could consume oxygen resources furtheramaging the ecological status of receiving water (Paavilainennd Päivänen, 1995; Greig et al., 2007). With timber productionet to increase across Europe, supported by governments for its
8 ical En
pa2ku(
obheIt2tm1heAiObcac
o(ao2blTsiterntaiitqbh
2
2
s−wsubcpu
fpbTand1f
sgwfict(f(bficbf2iawsAuvFTwmesff
2
aoztlrwdaauNF1
2
4 C. O’Driscoll et al. / Ecolog
otential to mitigate climate change through carbon sequestrationnd fossil fuel substitution (Forest Service, 2008; Riipinen et al.,009; Laudon et al., 2011), and the future of the afforested blan-et peats uncertain, there is an urgent need for more evidence tonderpin evidence based sustainable forestry policy developmentsEuropean Union, 2000; Laudon et al., 2011; Coillte, 2012).
Mitigation methods such as felling smaller plantation coupes atne time, whole-tree harvesting and the use of buffer zones haveeen suggested (Forest Commission, 1988; Forest Service, 2000),owever, they are not as of yet supported by extensive scientificvidence. Many of the earlier afforested blanket peat catchments inreland and the UK were established without any buffer areas, andrees were planted to the stream edge (Broadmeadow and Nisbet,004; Ryder et al., 2011). Establishing buffer zones by harvestinghe peatland forest alongside water bodies before harvesting the
ain coupe behind has been recommended (Forestry Commission,988; Forest Service, 2000) as a best management practice (BMP)owever, there is limited data available to forest managers on thefficacy of this practice (see Ryder et al., 2011; Finnegan et al., 2012).
fundamental concern for the creation of buffer zones follow-ng harvesting is the slow vegetation recovery (Connaghan, 2007;’Driscoll et al., 2011). The novel grass seeding method describedy O’Driscoll et al. (2011) presents a solution to overcoming thisoncern. In addition, the effectiveness of peatland buffers relies ton extent on factors such as buffer size, hydraulic load and inletoncentrations (Väänänen et al., 2008).
Given that (1) most of the nutrients released after harvestingccur in soluble form during storm events (Rodgers et al., 2010);2) peat has low hydraulic conductivity (Lewis et al., 2011) and Pdsorption capacity (Tamm et al., 1974); and (3) the spate naturef peatland forested catchments in Ireland and the UK (Müller,000; Holden and Burt, 2003) the efficacy of buffer zones for theselanket peat sites is questionable. Based on the findings of ear-
ier studies, four hypotheses were addressed in this present study.hese hypotheses were that: a recently harvested peatland forestite would serve as a vegetated buffer zone if a novel grass seed-ng method was implemented at the site and runoff was directedhrough this buffer zone area by blocking the stream (H1); for-st clearfelling the upstream 10 ha catchment would increase totaleactive phosphorus (TRP), total oxidised nitrogen (TON), ammo-ium (NH4-N) and SS concentrations in the receiving water (H2);he buffer zone would be efficient in removing SS but not TRP, TONnd NH4-N (H3); and factors such as inlet concentrations, load-ng and hydrologic loading rates would play an important rolen percentage retentions (H4). From an international perspectivehe findings of this study will contribute important qualitative anduantitative data on the creation and functioning of buffer zones inlanket peat forested catchments in moderate climates receivingigh and frequent precipitation.
. Materials and methods
.1. Site description and buffer zone construction
Buffer zone construction was carried out in the Glennamong, aub-catchment of the Burrishoole Catchment, Co. Mayo (53◦58′ N,9◦37′ E, 69 m a.s.l.) (Fig. 1). An upstream forest catchment (10 ha)hich was to be felled during the study period was used as the
tudy site and a 1 ha area downstream of this study site wassed for the establishment of the buffer zone. The study site and
uffer zone are drained by a semi-natural stream. The Glennamongatchment was planted in 1972 with a combination of lodgepoleine (Pinus contorta) (86%) and sitka spruce (Picea sitchensis) (13%)sing spaced-furrow ploughing, manually applied rock phosphatem
g
gineering 62 (2014) 83– 92
ertiliser (at a rate of 13.2 kg P ha−1) and nursery-grown trans-lants. Thinning was not generally carried out on upland westernlanket peats due to windthrow risk (Cummins and Farrell, 2003a).he average depth of the peat in the buffer zone was circa 0.5 mnd the peat profile also contained sand deposits of varying thick-ess. These layers were probably formed of the material that wasisplaced from the ditches during the initial drainage in the early980s. A more detailed description of soil characteristics can beound in Asam et al. (2012).
The buffer zone was constructed by initially clearfelling thetanding forest in August 2009. Brash material (branches and log-ing residues) was removed from the site and drainage channelsere defined around the 1 ha area. Two months after clearfelling,ve plots were identified within the buffer zone, three of whichould potentially have stream water from the study site divertedhrough them (buffer plots P1, P2, P3) and two of which could notC1, C2) and would serve as controls. The buffer plots areas were asollows: 0.01 ha (P1 in Fig. 1), 0.036 ha (P2 in Fig. 1), and 0.066 haP3 in Fig. 1) accounting for 1.12% of the area of study site. Eachuffer plot received the same sowing treatment, which comprisedfty: fifty ratios of Holcus lanatus L. and Agrostis capillaris L. The twoontrol plots were left un-seeded. The seed was distributed evenlyy hand at an initial rate of 36 kg ha−1 on top of the undisturbed oldorest residue layer in October 2009. December 2009 and January010 were exceptionally cold months, and a layer of snow measur-
ng 30 cm in depth was recorded on the ground above the seededrea. To eliminate the risk of seed establishment failure, the plotsere re-seeded in February 2010 at the same rate of 36 kg ha−1. The
tream was diverted through the buffer zone in September 2010.reas of preferential flow and furrows were identified and blockedsing either peatbags or corrugated recycled plastic. Bole only har-esting was conducted on the upstream forest (∼10 ha) betweenebruary 2011 and April 2011. The timber was harvested using aimberjack 1470D harvester and the boles (merchantable timber)ere stacked beside the windrow for collection. Some of the brashaterial was laid out in mats to protect the soil surface and reduce
rosion and the remainder was collected into windrows and left onite to degrade. During harvesting an 8-wheeled Timberjack 1110orwarder delivered the boles to truck collection points beside theorest road.
.2. Instrumentation setup and water sampling analysis
In January 2010 the stream was instrumented with two flownd water quality monitoring stations at stable channel sections,ne downstream of the study site and at the inflow to the bufferone (GSS) and the second further downstream at the outflow ofhe buffer zone (BZS). An H-flume, a water level recorder and a dataogger were installed at each station, along with a tipping bucketain gauge. Readings were recorded every 5 min. Water samplesere taken for TRP, TON, NH4-N and SS analysis at each stationuring storm events, on a weekly basis over the study period usingn ISCO automated water sampler. All water samples were frozent −20 ◦C in accordance with the standard methods (APHA, 1998)ntil water quality analyses were conducted. The TRP, TON andH4-N were analysed using a Konelab 20 Analyser (Konelab Ltd.,inland). SS was analysed based on the standard methods (APHA,998).
.3. Soil water extractable (WEP) and total (TP) content
easurement20 cm deep soil cores were collected using a 3 cm diameterouge auger in the buffer zone area. 4, 8, and 14 soil samples

C. O’Driscoll et al. / Ecological Engineering 62 (2014) 83– 92 85
ndaries and seeded plots (P1, P2, P3) and control plots (C1, C2) are presented in detail.
wtsTvwow2wciw5aAhhn
2m
z1awoapimoTs
2
r2ssa
Fdt
osa2bmzrts
hes
L
wa
eis
%
w
Fig. 1. Location of the Burrishoole catchment and the buffer zone catchment bou
ere taken from plot 1, 2, and 3, respectively, and 4 samples wereaken from the control areas in April 2009, 2010 and 2011. Soilamples were analysed for gravimetric water content, WEP andP. The core samples were placed in bags, mixed by hand untilisually homogenised, and subsamples of approximately 0.5 g (dryeight) were removed and extracted in 30 ml of deionised water
n a reciprocating shaker at 250 rpm for 30 min. The supernatantas then filtered (0.45 �m) and measured for P using a Konelab
0 Analyser. Second subsamples of approximately 5 g (wet weight)ere removed and dried to determine their gravimetric moisture
ontent (Macrae et al., 2005). The dried subsamples were then putnto a furnace at a temperature of 550 ◦C for 24 h. 5 ml of 2 N HCl
as added to extract the TP and they were subsequently diluted to0 ml with deionised water. P in the solution was analysed using
Konelab 20 Analyser (Konelab Ltd.) to determine the TP content.s this study was conducted in the year immediately followingarvesting and N increases are typically observed one year afterarvesting (Cummins and Farrell, 2003b), nitrogen analyses wereot conducted on the soil and grass samples.
.4. Aboveground vegetation biomass and P contenteasurement
To estimate the aboveground vegetation biomass in the bufferone, 32 25 cm × 25 cm quadrats were randomly sampled (8 in plot; 11 in plot 2; 9 in plot 3 and 4 in the control plots) in August 2010,nd again in August 2011. All vegetation lying within the quadratas harvested to within 1 cm and dried at 80 ◦C in the laboratory
n the day of collection for 48 h. Samples were then weighed, forbove ground biomass calculation. Dried samples were milled toass a 0.2 cm sieve and TP content of the vegetation was measured
n accordance with Ryan et al. (2001). About 1 g (dry matter) ofilled sample was weighed, and put into a furnace at a temperature
f 550 ◦C overnight, then 5 ml of 2 N HCl was added to extract theP and subsequently diluted to 50 ml with deionised water. P in theolution was analysed using a Konelab 20 Analyser (Konelab Ltd.).
.5. Data analyses
It has been reported that in the peatland forest 70% of the Pelease occurred during episodic storm events (Rodgers et al., 2010,
011). In addition, the performance of buffer zone on P retention isignificantly affected by the hydrological conditions. Therefore thistudy mainly focused on storm events. A storm event was defineds a block of rainfall that was preceded and followed by at least 12 hii
a
ig. 2. In a storm event the peak flow passed GSS at t1 and BZS at t2. The timeifference (t2 − t1) is considered at the time that the runoff needed to pass throughhe buffer zone.
f no rainfall (Hotta et al., 2007). As the flow is variable during atorm event, it is difficult to determine the hydraulic retention timet a certain flow rate using tracers. This buffer zone has a slope of–5◦ and has a relatively small volume of stored water which coulde exchanged with the runoff. The assumption has therefore beenade that the faster the runoff water passing through the buffer
ones the lower the hydraulic retention time. The time that theunoff needed to pass through the buffer zone is estimated as theime difference of the peak flow passing through GSS and BZS intorm events (Fig. 2).
In this study, the nutrient and SS loads in the first year afterarvesting were estimated using the methods described in Rodgerst al. (2010, 2011). The nutrient and SS loads during each sampledtorm event were also estimated using the following equation:
=∑
Ci ∗ Qi∑Qi
∗ QT
here L is the load, Ci and Qi are the instantaneous concentrationnd flow at time i and QT is the total flow during the storm event.
To further investigate the relationship between the retentionfficiency and the flow rate and input concentrations, the peak flownstantaneous retention efficiency was calculated for each sampledtorm event using the following equation:
retention =(
1 − Qt2Ct2
Qt1Ct1
)∗ 100
here Qt1 and Qt2 are the peak flow rates at the GSS and the BZS dur-
ng a storm event, respectively; Ct1 and Ct2 are the concentrationsn the peak flows at the GSS and the BZS during a storm event.Comparisons of discharge and precipitation in the year’s pre-nd post-buffer construction were made using two sample t-tests

8 ical Engineering 62 (2014) 83– 92
ot(aDatbftftu
3
3s
(sbIhUtwfiwT4d(snwwi
adsspwt(
Fig. 3. Daily precipitation recorded at the Marine Institute for (a) the pre-bufferfli
3
Fs
6 C. O’Driscoll et al. / Ecolog
r Mann–Whitney U-tests (where data were non-normal, andransformations were not appropriate). The software package RR Development Core Team, 2008) was used to examine the vari-tion in the TP and the WEP concentrations in the soil samples.ifferences in WEP and TP were examined using analysis of vari-nce (ANOVA) to determine the subset of explanatory variableshat best explained the variation in the data. Model selection wasased on AIC (Akaike information criterion). The data were testedor normality, homogeneity and independence to check whetherhe assumptions of linear modelling were met. Where conditionsor normality were not fulfiled the analysis was performed on logransformed data. Significance was determined at the 95% levelnless otherwise noted.
. Results
.1. Precipitation and runoff retention pre- and post-buffer waterpreading
Total precipitation from a nearby Met Eireann weather stationcirca 5.5 km south of the study site) was 1736 mm pre-buffer waterpreading (September 2009–August 2010) and 1962 mm post-uffer water spreading (September 2010–August 2011) (Marine
nstitute, unpublished data) and precipitation was not significantlyigher in the post-buffer water spreading period (Mann–Whitney-test, P = 0.9004). However, due to a larger number of outliers in
he rainfall data post-buffer water spreading, further investigationas carried out on the variation of daily and monthly precipitation
or these periods (Fig. 3). The number of wet days (>1 mm of precip-tation/day (Hundecha and Bárdossy, 2005)) recorded pre-buffer
ater spreading was 226 and post-buffer water spreading was 213.he average daily precipitation pre-buffer water spreading was.8 mm and post-buffer water spreading was 5.4 mm. Precipitationata indicates that there were 14 heavy precipitation (>20 mm/dayRyder et al., 2011)) occurrences pre-buffer water spreading and 25uch occurrences post-buffer water spreading (Fig. 3). Whilst theumbers of heavy precipitation events were greater post-bufferater spreading (Fig. 3), overall, daily precipitation pre- and post-ater spreading were similar indicating that rainfall is not likely to
mpact on the results.The time it took for the storm to pass through the buffer zone
nd its peak flow rate in both before and after water spreading wasescribed by an exponential relationship (R2 = 0.65, before waterpreading and R2 = 0.55 after water spreading (Fig. 4)). Diverting thetream water through the buffer zone significantly increased the
assing through time (t-test, P < 0.01) (Fig. 4). Storm peak flow ratesere not significantly reduced (Fig. 5a). Monthly runoff passinghrough buffer zone was marginally higher than that of study siteFig. 5b).
wa
0
10
20
30
40
50
60
70
80
90
Stor
m la
g tim
e (m
inut
e)
0
B
20
After water sy = 42.7 4e
R² = 0.5
Before water sy = 21.6 53
R² = 0.6
40
spreadie-0.038x
553 2
spreadi 3e-0.1x
650 7
6
Peak
ig. 4. Runoff passing through the buffer zone in different storm events before and aftepreading, respectively.
ooding, (b) the post-buffer flooding and (c) the monthly periods. The grey linendicates the threshold for storm occurrence.
.2. Suspended sediment (SS) retention
The average SS concentrations measured before clearfellingere 43.47 ± 51 SS mg L−1 and 11.99 ± 28.55 SS mg L−1 at the GSS
nd BZS, respectively (Fig. 6). After clearfelling, the average
ng
ng
0
flow r
80
ate (l/ s)
A
B
100
After water sp r
Before water s
120
reading
spreading
0
r water spreading; 15 and 65 storm events were included before and after water

C. O’Driscoll et al. / Ecological Engineering 62 (2014) 83– 92 87
F ly run1
San(w(piswtd(ighho
Fd2
3
scfGoamtowere released from the study site in the year following clearfelling(February 2011 to January 2012). The TRP input loading rate to thebuffer zone was 55 kg TRP ha−1. From February 2011 to January
ig. 5. (a) Storm peak flows at the GSS and the BZS after water spreading, (b) month:1).
S concentrations were 27.47 ± 27 SS mg L−1 at the GSSnd14.65 ± 11 SS mg L−1 at the BZS. The values observed wereot typical of reported baseline values for upland peat sitesRodgers et al., 2011). The most likely causes of these high valuesere (1) buffer zone construction, (2) buffer water spreading, and
3) the development of an old forest road during the study sitere-felling baseline data collection period. Further investigations
nto the nature of the SS released from the buffer zone over thetudy period indicated that the majority of SS released pre-fellingas derived from inorganic material (i.e. the road material) and
he majority of SS released post-felling was organic in nature (i.e.isturbance from felling activities on the upstream study site)Fig. 7). A total of 3780.5 kg of SS were released from the study siten the year following clearfelling (February 2011 to January 2012),iving the SS input loading rate to the buffer zone of 33,754 kg SS
a−1. From February 2011 to January 2012, a total of 11051.5 kg SSa−1 was retained by the buffer zone, with the retention efficiencyf ∼33%.01020304050607080901
50
2500
10/2009 05/2010 11/2010 06/2011 12/2011
Flow
rat
e (l
/s)
SS (
mg/
l)
Time
GSS
BZS
ig. 6. The daily discharge-weighted mean SS concentrations at the GSS and the BZSuring the study period. Dash lines indicate the harvesting period (February–April011) and the y-axis is expressed in the logarithmic scale.
2
Fi
off passing through the GSS and the BZS after water spreading (dash line represents
.3. Nutrient runoff and retention
The average P concentration measured in the rainfall during thetudy period was 4 ± 3 �g L−1 TRP. Total reactive phosphorus (TRP)oncentrations at the GSS and BZS stations were low before clear-elling, with average values of 13 ± 4 �g L−1 and 12 ± 3 �g L−1 at theSS and BZS, respectively (Fig. 9). Four weeks after the clearfellingperations began, daily discharge weighted mean P concentrationst the GSS station started to increase and increased gradually to aaximum of 101.7 �g L−1 by the end of the felling period. During
he same period the maximum P concentration in the buffer zoneutflow did not exceed 40 �g L−1 (Fig. 8). A total of 6.17 kg of TRP
012, a total of 9.7 kg TRP ha−1 was retained by the buffer zone, with
0
20
40
60
80
100
120
07/ 2009 01/ 2010 08/ 2010 02/ 2011 09/ 2011 04/ 2012
SS m
g/l
Time
GS % organi cGB % organi c
ig. 7. The % or organic matter content measured in the SS samples. The dash linesndicate the felling period (February–April 2011).
88 C. O’Driscoll et al. / Ecological Engineering 62 (2014) 83– 92
01020304050607080900
20
40
60
80
100
120
10/2009 05/2010 11/2010 06/2011 12/2011
Flow
rat
e (l
/s)
TR
P (u
g/l)
Time
GSSBZSGSS flow rate
Ft(
tolsbrw
Fett
a
b
02468
1012141618
Buffer Control
WE
P (µ
g/g
dry
mat
ter)
2009
2010
2011
0.3
0.4
0.5
0.6
gP/g
dry
soil)
2009
2010
2011
ig. 8. The daily discharge-weighted mean TRP concentrations at the GSS andhe BZS during the study period. Dash lines indicate the harvesting periodFebruary–April 2011).
he retention efficiency of ∼18%. Analyses from 20 storm eventsver the duration of the study period highlighted that higher TRPoading rates resulted in lower retention percentages (Fig. 9a). Intorm events with a loading rate of >28 g P ha−1, the buffer zone
ecame a TRP release source (Fig. 9a). The buffer zone started toelease P when the flow rate was higher than 88.5 L s−1 (Fig. 9b) andhen the inlet P concentration was lower than 17 �g L−1 (Fig. 9c).y = -1.1129x + 31.143R² = 0.111 7
-100
-50
0
50
100
0 10 20 30 40
TR
P r
eten
tion
(%)
GSS (g TRP/h.ha)
y = 23.092ln(x) - 25.567R² = 0.6964
-60
-40
-20
0
20
40
60
80
100
0 20 40 60 80 100TR
P re
tent
ion
(%)
Time fo r storm to pass th rough the buffe r zone (min)
y = 42.51ln(x) - 122.05R² = 0.6698
-60
-40
-20
0
20
40
60
80
100
0 50 10 0 15 0 200
TR
P re
tent
ion
(%)
Inlet TR P concentration (ug/l)
a
b
c
ig. 9. (a) The relationships between retention efficiency and loads during stormvents; (b) the relationship between % retention and time for storm to pass throughhe buffer zone; and (c) the relationship between % retention and inlet concentra-ions.
0.0
0.1
0.2
Buffer ControlT
P (m
Fz
atdn0tbta2trras
tabac7m
4
4
sbzHifl1
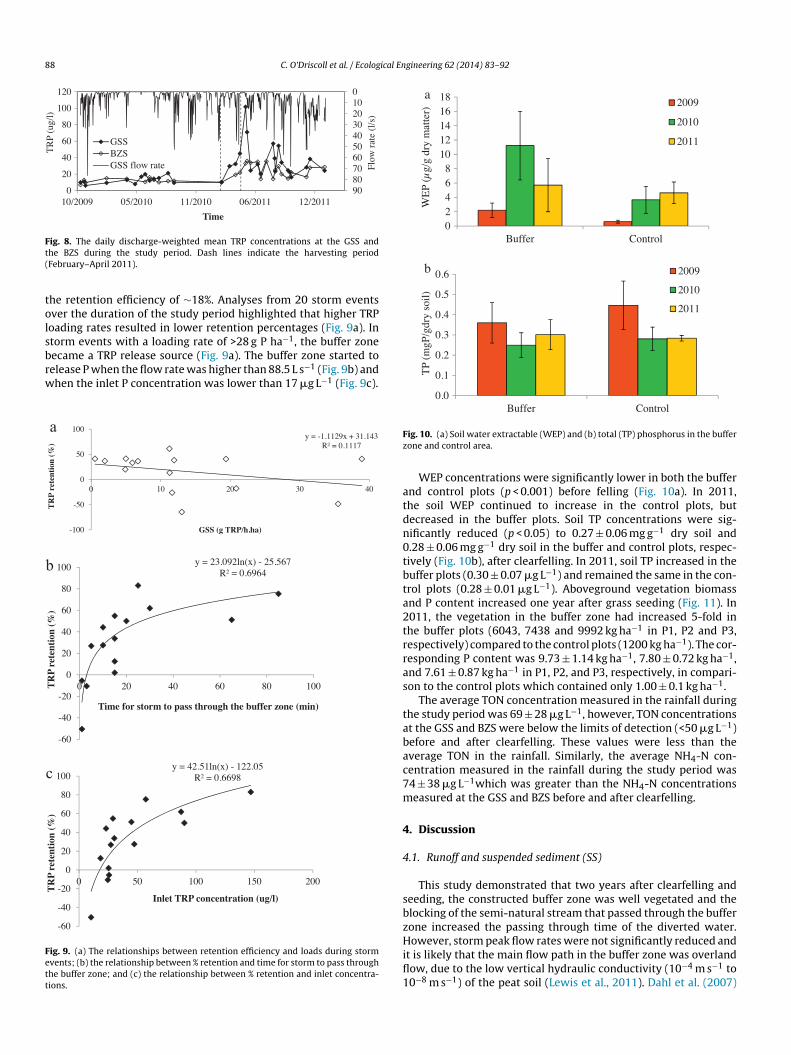
ig. 10. (a) Soil water extractable (WEP) and (b) total (TP) phosphorus in the bufferone and control area.
WEP concentrations were significantly lower in both the buffernd control plots (p < 0.001) before felling (Fig. 10a). In 2011,he soil WEP continued to increase in the control plots, butecreased in the buffer plots. Soil TP concentrations were sig-ificantly reduced (p < 0.05) to 0.27 ± 0.06 mg g−1 dry soil and.28 ± 0.06 mg g−1 dry soil in the buffer and control plots, respec-ively (Fig. 10b), after clearfelling. In 2011, soil TP increased in theuffer plots (0.30 ± 0.07 �g L−1) and remained the same in the con-rol plots (0.28 ± 0.01 �g L−1). Aboveground vegetation biomassnd P content increased one year after grass seeding (Fig. 11). In011, the vegetation in the buffer zone had increased 5-fold inhe buffer plots (6043, 7438 and 9992 kg ha−1 in P1, P2 and P3,espectively) compared to the control plots (1200 kg ha−1). The cor-esponding P content was 9.73 ± 1.14 kg ha−1, 7.80 ± 0.72 kg ha−1,nd 7.61 ± 0.87 kg ha−1 in P1, P2, and P3, respectively, in compari-on to the control plots which contained only 1.00 ± 0.1 kg ha−1.
The average TON concentration measured in the rainfall duringhe study period was 69 ± 28 �g L−1, however, TON concentrationst the GSS and BZS were below the limits of detection (<50 �g L−1)efore and after clearfelling. These values were less than theverage TON in the rainfall. Similarly, the average NH4-N con-entration measured in the rainfall during the study period was4 ± 38 �g L−1which was greater than the NH4-N concentrationseasured at the GSS and BZS before and after clearfelling.
. Discussion
.1. Runoff and suspended sediment (SS)
This study demonstrated that two years after clearfelling andeeding, the constructed buffer zone was well vegetated and thelocking of the semi-natural stream that passed through the bufferone increased the passing through time of the diverted water.
owever, storm peak flow rates were not significantly reduced andt is likely that the main flow path in the buffer zone was overlandow, due to the low vertical hydraulic conductivity (10−4 m s−1 to0−8 m s−1) of the peat soil (Lewis et al., 2011). Dahl et al. (2007)

C. O’Driscoll et al. / Ecological En
0
2000
4000
6000
8000
10000
12000
14000
Plot 1 Plot 2 Plot 3 Control
Tota
l Abo
vegr
ound
Bio
mas
s (k
g/ h
a)
2010
2011
0
2
4
6
8
10
12
Plot 1 Plot 2 Plot 3 Control
Ave
rage
P c
onte
nt in
A
bove
grou
nd B
iom
ass
(Kg/
ha) 2010
2011
a
b
F2
pdetacatbssawaTtshttrdoc
4
ao2i
trs2tsleteidrwpe
tfeHsibfebtewplpw1rflwfiSllctt4
4
faCefaeCrt1
ig. 11. (a) Above ground biomass and (b) P content in the buffer zone in 2010 and011. Error bars indicate standard deviation.
roposed four major flow path types – diffuse flow, overland flow,irect flow and drainage flow – in riparian buffer areas. Hoffmannt al. (2009) found that compared with the other three flow pathypes; the overland flow had a lower residence time. Addition-lly, the creation of sheet flows has been considered a primaryondition for buffer zones (Väänänen et al., 2008). However, inrtificially drained forested peatland the presence of furrows con-ributes to higher flow velocity and lower residence times in theuffer (Väänänen et al., 2008). Although the buffer did not reducetorm peak flows it did reduce SS concentrations in the runoff con-iderably with 33% retention efficiency. The reduction in SS is likely
result of the successful vegetation growth in the buffer zonehich allows the suspended particles to efficiently settle down
mong ground vegetation and surface soil (Nieminen et al., 2005).he smaller SS retention efficiency observed in this study comparedo the 70% observed by Nieminen et al. (2005) for a buffer with theame % of watershed area (1.1%) is likely a direct result of relativelyigher flow rates in our study sites, the slope of the buffer area andhe furrows with preferential flow. While best management prac-ices (BMPs), such as the laying of geo-textile material beneath theoad were implemented during the road development period thisata highlights the ongoing and un-resolved issue of the impactsf forest road construction and the importance of pre-felling dataollection in inflow versus outflow studies.
.2. Phosphorus (P) retention
The values of total TRP released from the study site after felling
re comparable to similar studies which examined the impactsf clearfelling peatland catchments on water quality (Nieminen,003; Cummins and Farrell, 2003a; Rodgers et al., 2010). The TRPnput loading rate reported for this study was high in comparison
cile
gineering 62 (2014) 83– 92 89
o studies reviewed by Hoffmann et al. (2009). The high loadingate was primarily due to the high runoff from the upstream studyite which is characteristic of blanket peat catchments (Müller,000; Holden and Burt, 2003), combined with the high P concen-rations and the relatively small buffer zone area (1.1% of the studyite). The P retention result (18%) observed in the current study isower than comparable studies (see Väänänen et al., 2008), how-ver, it supports the findings of Asam et al. (2012) which usedhe laboratory flume approach to assess the phosphorus retentionfficiency of blanket peat buffers. The lower retention observedn this study is likely a result of preferential flow in the furrowsuring high hydraulic loading which increased flow velocity andeduced the residence time (Koskiaho et al., 2003). The longer theater residence time the longer time available for P-consumingrocesses such as microbial immobilisation, soil sorption and veg-tative uptake, to be involved in P retention (Väänänen et al., 2008).
During buffer zone establishment, soil WEP increased, reflectinghe leaching P caused by the decomposition of fallen needles on theorest floor (Hyvönen et al., 2000; Piirainen et al., 2004) and low-red plant uptake after clearfelling (Walbridge and Lockaby, 1994;erz, 1996). Consequently, due to the leached P after clearfelling,
oil TP reduced in the buffer and control plots. The grass seed-ng resulted in increased aboveground vegetation biomass in theuffer plots compared to the control in 2010 and this increased 5-old in 2011 highlighting that the novel seeding practice (O’Driscollt al., 2011) on clearfelled blanket peat was successful in improvinguffer zone function. Vegetation has an important role in P reten-ion, not only through P accumulation in the living biomass (Silvant al., 2004) but also because the living vegetation slows down theater flow in the buffer zones and thereby reduces the formation ofreferential flow paths (Braskerud, 2001). Initially added P in wet-
ands and peatlands is rapidly allocated into the litter-microbialool and uptake by vegetation and adsorption in soil will followithin the time scale of several days (Richardson and Marshall,
986; Kellogg and Bridgham, 2003). However, although the bufferetained 18% of P, when the loading rate was >28 g P ha−1, theow rate was higher than 88.5 L s−1, and the inlet P concentrationas lower than 17 �g L−1 the buffer became a source of P. Thisnding contrasts with the findings of Braskerud et al. (2005) andyversen and Borch (2005) where higher P retention with a higheroad was reported. Though the P retention efficiency is relativelyow (18%), the buffer zone does appear to moderate the high P con-entration efficiently. During the course of the study, even thoughhe highest input TRP concentrations were more than 100 �g L−1,he maximum TRP concentration in the buffer zone did not exceed0 �g L−1.
.3. Nitrogen
Both TON and NH4-N concentrations did not exceed the rain-all values measured during the study period. Increased levels of Nre typically associated with forest clearfelling (Nieminen, 1998;ummins and Farrell, 2003b) and are linked tothe biological min-ralisation of organic matter and the reduced uptake from biomassollowing the removal of the trees (Nieminen, 1998; Cumminsnd Farrell, 2003b). However, these increases typically occur sev-ral years after clearfelling (Lundmark-Thelin and Johansson, 1997;ummins and Farrell, 2003b; Palviainen et al., 2004). The delayedelease of N is reportedly due to the initial high N immobilisation ofhe brash material, which has a high carbon C:N ratio (Nieminen,998). Both ammonium and nitrate are absorbed from bulk pre-
ipitation by tree canopies (Hyvärinen, 1990). Enhanced leaching ofnorganic nitrogen from drained peatlands after clearfelling is mostikely due to nitrification and the production of nitrate (Vitousekt al., 1982). However, increased nitrification after clearfelling does
9 ical En
ntNw
b2cuNp
4
wT2PeantRmBbrmhin(svvecit
aiott1baDKofosmbtTfcbahN
twmtHtl
5
dpbnpecwsoiSwrattzr
A
ewfaftH
R
A
A
A
A
B
B
B
0 C. O’Driscoll et al. / Ecolog
ot necessarily lead to leaching of nitrate from clearfelled areas ashe production of nitrate may stimulate the production of N2O and2O which are emitted to the atmosphere (Nieminen, 1998) andere not measured by this study.
A similar study examining the nitrogen retention by peatlanduffer areas applied nitrogen additions to the inflow (Vikman et al.,010) rather than rely on an expected increase from a clearfelledatchment as was the case in this study. Further work could focus onsing applied nitrogen additions to the inflow and measure gaseous2O and N2 which can account for 15% of the total N removed in aeatland buffer (Silvan et al., 2002).
.4. Implications for forestry and water quality management
Two major concerns from forest clearfelling to water qualityere highlighted by this study, increased SS and P concentration.
he P concentration in water from pristine peatlands rarely exceeds0 �g L−1 (Kenttämies, 1981), which is marginally higher than theO4-P found in rain water (Soveri and Peltonen, 1996; Rodgerst al., 2010). Additionally, the P concentration in water drainingfforested peatlands (drained and with fertiliser applications) didot exceed 20 �g L−1 at 40 sites (O’Driscoll et al., 2012). Many ofhese peatland rivers are ecologically sensitive, containing IUCNed List species (salmonids and fresh water pearl mussels) whichake them important biodiversity refuges (O’Driscoll et al., 2012).
MPs such as clearfelling smaller plantation sizes at one time haveeen shown to reduce the concentration in the larger receivingivers (Rodgers et al., 2010; O’Driscoll et al., 2013). However, thisanagement strategy does not reduce the total P load leaving the
arvested catchment (Rodgers et al., 2010) which is particularlymportant for catchments draining into sensitive lakes that act as aatural sink for any increased run off of nutrients and sedimentDrinan et al., 2013). Yanai (1998) reported negligible P loss totreams over 3 years from harvesting using the whole tree har-esting method and the by-products of WTH are gaining increasingalue due to the rising demands for renewable energy (Vanguelovat al., 2010; Laudon et al., 2011). However, in the peatland forestatchments that are to receive a second rotation of forestry, theres a concern that WTH may deplete the nutrient pools and affecthe growth of second rotation (Kaarakka, 2013).
The buffer zone in the current study retained 9.7 kg TRP ha−1
nd 11051.5 kg SS ha−1 released due to forestry operations includ-ng road development and clearfelling. However, the sustainabilityf the buffer zone retention capacity is of great importance becausehe increased P load from clearfelled peatlands continues for upo 4 years after the clearfelling ceases (Ahtiainen and Huttunen,999; Rodgers et al., 2010). The P retention capacity of vegetateduffers is limited and no biogeochemical transfer in buffer areas isble to reduce the quantity of P stored (Dorioz et al., 2006). HighRP losses have been recorded from grassed buffer zones (Uusi-ämppä, 2005) and management practices such as grass cultivationr low impact temporary sheep grazing need to be investigatedor the peatland buffer zone. Additionally, given that the majorityf P is released in storm events and the buffer became a releaseource in higher flows, investigation of peak runoff control (PRC)ethods also warrants further investigation. The PRC method has
een shown to effectively reduce peak runoff rate, peak concentra-ions and subsequently SS and nutrients (Martilla and Kløve, 2010).he buffer in the current study was created by harvesting the treesrom a strip beside the stream a year before clearfelling the mainoupe and allowing the area to revegetate. A buffer zone can also
e created by leaving an intact strip of forest adjacent to the streamnd clearfelling the main coupe of trees behind it, a method whichas been shown to be successful in the UK (Broadmeadow andisbet, 2004). It is thought that the buffer allowed sedimentationC
C
gineering 62 (2014) 83– 92
o occur because of a slowing down of surface runoff due to theell-structured and drier character of forest soils, the increasedacroposity from tree roots and soil fauna (Goudie, 2006) and
he damming effect created by falling debris and protruding roots.owever, this option has not been pursued for peatland forests in
he west of Ireland due to thin soil depths, exposure and high winds,eading to the increased risk of windthrow (Finnegan et al., 2012).
. Conclusion
Of the four study hypotheses outlined in the introduction, theata presented here fully support H1, H3 and H4, and partially sup-ort H2. Two years after clearfelling and seeding, the constructeduffer zone was well vegetated and the blocking of the semi-atural stream that passed through the buffer zone increased theassing through time of the diverted water, in line with H1. For-st clearfelling the upstream 10 ha catchment increased the TRPoncentration in the receiving water. However, SS concentrationsere much higher before felling highlighting the ongoing and unre-
olved issue of the impacts of forest road construction. Thus, H2 wasnly partially supported, as the data did not indicate an increasen SS after clearfelling. The buffer zone was efficient in removingS with retention efficiency of 33% but less efficient in removing Pith the retention efficiency of 18% as hypothesised in H3. Finally, P
etention efficiency was dependent on inlet concentrations, loadingnd hydraulic loading rates (H4). From an international perspectivehe findings of this study contributes important scientific qualita-ive and quantitative data on the creation and functioning of bufferones in blanket peat forested catchments in moderate climateseceiving high and frequent precipitation.
cknowledgments
This work was funded by the Department of Agriculture, Fish-ries and under the STIMULUS program 2007–2013. The authorsish to acknowledge the input of Coillte in allowing access to state
orestry for this project, and for providing logistical support anddvice. The authors gratefully acknowledge the help and supportrom the, Marine Institute and the EPA. Sincere thanks are also giveno Kilian Kelly, Liz Ryder, Joanne Finnegan, John Regan and Markealy.
eferences
htiainen, M., Huttunen, P., 1999. Long-term effects of forestry managements onwater quality and loading in brooks. Boreal Environ. Res. 4, 101–114.
PHA, 1998. Standard Methods for the Examination of Water and Wastewater, 20thed. American Public Health Association, Washington, DC.
sam, Z.Z., Kaila, A., Nieminen, M., Sarkkola, S., O’Driscoll, C., O’Connor, M., Sana,A., Rodgers, M., Xiao, L., 2012. Assessment of phosphorus retention efficiencyof blanket peat buffer areas using a laboratory flume approach. Ecol. Eng. 49,160–169.
ust, W.M., Blinn, C.R., 2004. Forestry best management practices for timber har-vesting and site preparation in the eastern United States: an overview of waterquality and productivity research during the past 20 years (1982–2002). WaterAir Soil Pollut. 4, 5–36.
raskerud, B.C., Tonderski, K.S., Wedding, B., Bakke, R., Blankenberg, A.-G.B., Ulén,B., Koskiaho, J., 2005. Can constructed wetlands reduce the diffuse phospho-rus loads to eutrophic water in cold temperate regions? J. Environ. Qual. 34,2145–2155.
raskerud, B.C., 2001. The influence of vegetation on sedimentation and resus-pension of soil particles in small constructed wetlands. J. Environ. Qual. 30,1447–1457.
roadmeadow, S., Nisbet, T.R., 2004. The effects of riparian forest management onthe freshwater environment: a literature review of best management practice.
Hydrol. Earth Syst. Sci. 8, 286–305.oillte, 2012. http://www.coillte.ie/coillteforest/responsible forest managementand certification/certification introduction/ (retrieved 04.10.13).
onnaghan, J., 2007. Management options for forests on western peatlands: vege-tation survey. A Report to Coillte Teoranta (unpublished).

ical En
C
C
C
D
D
D
E
F
F
F
F
G
G
H
H
H
H
H
H
H
H
I
J
K
K
K
K
K
L
L
L
L
L
M
M
M
N
N
N
O
O
O
O
P
P
P
P
R
R
R
R
R
R
R
S
S
S
S
C. O’Driscoll et al. / Ecolog
orrell, D.L., 2005. Principles of planning and establishment of buffer zones. Ecol.Eng. 24 (5), 433–439.
ummins, T., Farrell, E.P., 2003a. Biogeochemical impacts of clearfelling and refor-estation on blanket peatland streams. I. Phosphorus. For. Ecol. Manage. 180(1–3), 545–555.
ummins, T., Farrell, E.P., 2003b. Biogeochemical impacts of clearfelling and refor-estation on blanket-peatland streams. II. Major ions and dissolved organiccarbon. For. Ecol. Manage. 180, 557–570.
ahl, M., Nilsson, B., Langhoff, J.H., Refsgaard, J.C., 2007. Review of classification sys-tems and new multi-scale typology of groundwater–surface water interaction.J. Hydrol. 344, 1–16.
orioz, J.M., Wang, D., Poulenard, J., Trévisan, D., 2006. The effect of grass bufferstrips on phosphorus dynamic—a critical review and synthesis as a basis forapplication in agricultural landscapes in France. Agric. Ecosyst. Environ. 11,4–21.
rinan, T.J., Graham, C.T., O’Halloran, J., Harrison, S.S.C., 2013. The impact of catch-ment conifer plantation forestry on the hydrochemistry of peatland lakes. Sci.Total Environ. 443, 603–620.
uropean Union, 2000. Directive 2000/60/EC of the European Parliament and of theCouncil of 23 October 2000 establishing a framework for community action inthe field of water policy. Off. J. Eur. Communities L327, 1–73.
innegan, J., Regan, J.T., de Eyto, E., Ryder, E., Tiernan, D., Healy, M.G., 2012. Nutri-ent dynamics in a peatland forest riparian buffer zone and implications for theestablishment of planted saplings. Ecol. Eng. 27, 155–164.
orestry Commission, 1988. Forests and Water Guidelines, 1st ed. HMSO, London(revised 2nd ed., 1991; revised 3rd ed., 1993; revised 4th ed., 2003).
orest Service, 2000. Forest Harvesting and the Environment Guidelines. IrishNational Forest Standard, Forest Service, Department of the Marine and NaturalResources, Dublin.
orest Service, 2008. Indicative Forestry Statement. “The right trees in the rightplaces”. Department of Agriculture, Fisheries and Food, Report.
oudie, A., 2006. The Human Impact on the Natural Environment: Past, Present andFuture, 6th ed. Blackwell Sci., New Jersey.
reig, S.M., Sear, D.A., Carling, P.A., 2007. A review of factors influencing the avail-ability of dissolved oxygen to incubating salmonid embryos. Hydrol. Process.21, 323–334.
eikkinen, K., Ihme, R., Osma, A.-M., Hartikainen, H., 1995. Phosphate removal bypeat from peat mining drainage water during overland flow wetland treatment.J. Environ. Qual. 24, 597–602.
erz, R., 1996. Cruisin’ the Timber: An Analysis of Forestry Management and WaterQuality in Coastal North Carolina. M.S. Thesis. Nicholas School of the Environ-ment of Duke University.
offmann, C.C., Kjaergaard, C., Uusi-Kämppä, J., Hansen, H.C.B., Kronvang, B., 2009.Phosphorus retention in riparian buffers: review of their efficiency. J. Environ.Qual. 38 (5), 1942.
olden, J., Burt, T.P., 2003. Runoff production in blanket peat covered catchments.Water Resour. Res. 39, 6-1-6–6-1-9.
otta, N., Kayama, T., Suzuki, M., 2007. Analysis of suspended sedi-ment yields after low impact forest harvesting. Hydrol. Process. 21,3565–3575.
undecha, Y., Bárdossy, A., 2005. Trends in daily precipitation and temperatureextremes across Western Germany in the second half of the 20th century. Int. J.Climatol. 25, 1189–1202.
yvärinen, A., 1990. Deposition on forest soils—effect of tree canopy on throughfall.In: Kauppi, P., Anttila, P., Kenttämies, K. (Eds.), Acidification in Finland. SpringerVerlag, Berlin/Heidelberg, pp. 199–213.
yvönen, R., Olsson, B.A., Lundkvist, H., Staaf, H., 2000. Decomposition and nutrientrelease from Picea abies (L.) Karst. and Pinus sylvestris L. logging residues. For.Ecol. Manage. 126, 97–112.
hme, R., 1994. Use of the Overland Flow Wetland Treatment System for the Purifica-tion of Runoff Water from Peat Mining Areas. VTT Julkaisuja. Technical ResearchCentre of Finland (VTT), Espoo, 140 pp. (in Finnish with English summary).
oosten, H., Clarke, D., 2002. Wise Use of Mires and Peatlands: Background andPrinciples Including a Framework for Decision-making. International Mire Con-servation Group and International Peat Society, Saarijärvi, Finland.
aarakka, 2013. The Long-Term Effects of Whole-Tree Harvest at Final Felling onSoil Properties in a Norway Spruce (Picea abies (L) Karst.) Stand (2013). OpenAccess. Paper 166.
ellogg, L.E., Bridgham, S.D., 2003. Phosphorus retention and movementacross an ombrotrophicminerotrophic peatland gradient. Biogeochemistry 63,299–315.
enttämies, K., 1981. The effects on water quality of forest drainage and fertilizationin peatlands. Publ. Water Res. Inst. 43, 24–31.
oskiaho, J., Ekholm, P., Räty, M., Riihimäki, J., Puustinen, M., 2003. Retaining agri-cultural nutrientsin constructed wetlands–experiences under boreal conditions.Ecol. Eng. 20, 89–103.
ubin, E., Ylitolonen, A., Välitalo, J., Eskelinen, J., 2000. Prevention of nutrient leach-ing from a forest regeneration area using overland flow fields. In: Haigh, M.,Krecek, J. (Eds.), Environmental Reconstruction in Headwater Areas. KluwerAcademic Publishers, Dordrecht, pp. 161–169.
audon, H., Sponseller, R.A., Lucas, R.W., Futter, M.N., Egnell, G., Bishop, K.,Agren, A., Ring, E., Högberg, P., 2011. Consequences of more intensiveforestry for the sustainable management of forest soils and waters. Forests 2,243–260.
T
U
gineering 62 (2014) 83– 92 91
ewis, C., Albetson, J., Xu, X., Kiely, G., 2011. Spatial variability of hydraulic conduc-tivity and bulk density along a blanket peatland hillslope. Hydrol. Process. 26(10), 1527–1537.
ong, M., Jennings, P., 2006. Analysis of the peat slide at Pollatomish, County Mayo,Ireland. Landslides 3, 51–61.
uke, S.H., Luckai, N.J., Burke, J.M., Prepas, E.E., 2007. Riparian area in the Cana-dian boreal forest and linkages with water quality in streams. Environ. Rev. 15,79–97.
undmark-Thelin, A., Johansson, M.-B., 1997. Influence of mechanical site prepara-tion decomposition and nutrient dynamics of Norway spruce (Picea abies (L.)Karst.) needle litter and slash needles. For. Ecol. Manage. 96, 101–110.
acrae, M.L., Redding, T.E., Creed, I.F., Bell, W.R., Devito, K.J., 2005. Soil, surface waterand ground water phosphorus relationships in a partially harvested Boreal Plainaspen catchment. For. Ecol. Manage. 206, 315–329.
artilla, H., Kløve, B., 2010. Managing runoff, water quality and erosion in peatlandforestry by peak runoff control. Ecol. Eng. 36, 900–911.
üller, M., 2000. Hydrogeographical studies in the Burrishoole Catchment, New-port, Co. Mayo, Ireland: affects of afforestation on the run-off regime ofsmall mountain spate river catchments. Verh. Internat. Verein. Limnol. 27,1146–1148.
ieminen, M., Ahti, E., Nousiainen, H., Joensuu, S., Vuollekoski, M., 2005. Capacityof riparian buffer zones to reduce sediment concentrations in discharge frompeatlands drained for forestry. Silva Fennica 39 (3), 331–339.
ieminen, M., 1998. Changes in nitrogen cycling following the clearcutting ofdrained peatland forests in southern Finland. Boreal Environ. Res. 3, 9–21.
ieminen, M., 2003. Effects of clear-cutting and site preparation on water qualityfrom a drained Scots pine mire in southern Finland. Boreal Environ. Res. 8, 53–59.
’Driscoll, C., Rodgers, M., O’Connor, M., Asam, Z.-Z, de Eyto, E., Poole, R., Xiao, L.,2011. A potential solution to mitigate phosphorus release following clearfellingin peatland catchments. Water Air Soil Pollut. 221, 1–11.
’Driscoll, C., de Eyto, E., Rodgers, M., O’Connor, M., Asam, Z.-Z., Xiao, L., 2012. Diatomassemblages and their associated environmental factors in upland peat forestrivers. Ecol. Indic. 18, 443–451.
’Driscoll, C., de Eyto, E., Rodgers, M., O’Connor, M., Asam, Z.-Z., Xiao, L., 2013. Bioticresponse to forest harvesting in acidic blanket peat fed streams: a case studyfrom Ireland. For. Ecol. Manage., http://dx.doi.org/10.1016/j.foreco.2013.09.018.
wende, P.M.O., Lyons, J., Haarlaa, R., Peltola, A., Spinelli, R., Molano, J., Ward, S.M.,2002. Operations protocol for eco-efficient wood harvesting on sensitive sites.In: ECOWOOD Partnership.
aavilainen, E., Päivänen, J., 1995. Peatland Forestry: Ecology and Principles.Springer, Berlin.
alviainen, M., Finér, L., Kurka, A.-M., Mannerkoski, H., Piirainen, S., Starr, M., 2004.Decomposition and nutrient release from logging residues after clear-cutting ofmixed boreal forest. Plant Soil 263, 53–67.
arkyn, S.M., Davis-Colley, R.J., Bryce Copper, A., Stroud, M.J., 2005. Prediction ofstream nutrient and sediment yield changes following restoration of forestedriparian buffers. Ecol. Eng. 24, 551–558.
iirainen, S., Finer, L., Mannerkoski, H., Starr, M., 2004. Effects of forest clear-cuttingon the sulphur, phosphorus and base cations fluxes through podzolic soil hori-zons. Biogeochemistry 69, 405–424.
Development Core Team, 2008. R: A Language and Environment for StatisticalComputing. R Foundation for Statistical Computing, Vienna, Austria, ISBN: 3-900051-07-0 http://www.Rproject.org
ichardson, C.J., Marshall, P.E., 1986. Processes controlling movement, storage, andexport of phosphorus in a fen peatland. Ecol. Monogr. 56, 279–302.
iipinen, M.P., Bowker, J.D., Dobson, M., 2009. Comparison of structural and func-tional stream assessment methods to detect changes in riparian vegetation andwater pH. Freshw. Biol. 54, 2127–2138.
odgers, M., O’Connor, M., Healy, M.G., O’Driscoll, C., Asam, Z., Nieminen, M., Poole,R., Müller, M., Xiao, L., 2010. Phosphorus release from forest harvesting on anupland blanket peat catchment. For. Ecol. Manage. 260 (12), 2241–2248.
odgers, M., O’Connor, M., Robinson, M., Müller, M., Poole, R., Xiao, L., 2011. Sus-pended solid yield from forest harvesting on upland blanket peat. Hydrol.Process. 25, 207–216.
yan, J., George, E., Abdul, R., 2001. Soil and Plant Analysis Laboratory Manual, 2nded, Available from ICARDA, Aleppo, Syria: Jointly published by the InternationalCentre for Agricultural Research in the Dry Areas and the National AgriculturalResearch Centre.
yder, L., de Eyto, E., Gormally, M., Sheehy-Skeffington, M., Dillane, M., Poole, R.,2011. Riparian zone creation in established coniferous forests in Irish uplandpeat catchments: physical, chemical and biological implications. In: Biology andEnvironment: Proceedings of the Royal Irish Academy, 111B.
ilvan, N., Regina, K., Kitunen, V., Vasander, H., Laine, J., 2002. Gaseous nitrogen lossfrom a restored peatland buffer zone. Soil Biol. Biochem. 34, 721–728.
ilvan, N., Vasander, H., Laine, J., 2004. Vegetation is the main factor in nutrientretention in a constructed wetland buffer. Plant Soil 25, 179–187.
overi, J., Peltonen, K., 1996. Lumen ainepitoisuudet ja talvikauden laskeumaSuomessa vuosina 1976–1993. Suomen Ympäristökeskus 97 (in Finnish).
yversen, N., Borch, H., 2005. Retention of soil particle fractions and phosphorus incold-climate buffer zones. Ecol. Eng. 25, 382–394.
amm, C.O., Holman, H., Popovic, B., Wiklander, G., 1974. Leaching of plant nutrientsfrom soils as a consequence of forest operations. Ambio 3, 221–222.
usi-Kämppä, J., 2005. Phosphorus purification in buffer zones in cold climates. Ecol.Eng. 24, 491–502.

9 ical En
V
V
V
V
Walbridge, M.R., Lockaby, B.G., 1994. Effects of forest management onbiochemical functions in southern forested wetlands. Wetlands 14,
2 C. O’Driscoll et al. / Ecolog
äänänen, R., Nieminen, M., Vuollekoski, M., Nousiainen, H., Sallantaus, T., Tuittila,E.-S., Ilvesniemi, H., 2008. Retention of phosphorus in peatland buffer zones atsix forested catchments in southern Finland. Silva Fennica 42 (2), 211–231.
anguelova, E., Pitman, R., Luiro, J., Helmisaari, H-S., 2010. Long term impacts ofwhole tree harvesting on soil carbon and nutrient sustainability in the UK.
Biogeochemistry 101, 43–59.ikman, A., Sarkkola, S., Koivusalo, H., Sallantaus, T., Laine, J., Silvan, N., Nousi-ainen, H., Nieminen, M., 2010. Nitrogen retention by peatland buffer areas atsix forested catchments in southern and central Finland. Hydrobiologia 641,171–183.
Y
gineering 62 (2014) 83– 92
itousek, P.M., Gosz, J.R., Charles, C.G., Melillo, J.M., Reiners, W.A., 1982. A compara-tive analysis of potential nitrification and nitrate mobility in forest ecosystems.Ecol. Monogr. 52, 155–177.
10–17.anai, D.R., 1998. The effect of whole-tree harvest on phosphorus cycling in northern
hardwood forest. For. Ecol. Manage. 104, 281–295.