Discovery of uranium mineralizations in the rhyolite–granite ...
Upload
univ-rennes1Category
view
0download
0
This article appeared in a journal published by Elsevier. The attachedcopy is furnished to the author for internal non-commercial researchand education use, including for instruction at the authors institution
and sharing with colleagues.
Other uses, including reproduction and distribution, or selling orlicensing copies, or posting to personal, institutional or third party
websites are prohibited.
In most cases authors are permitted to post their version of thearticle (e.g. in Word or Tex form) to their personal website orinstitutional repository. Authors requiring further information
regarding Elsevier’s archiving and manuscript policies areencouraged to visit:
http://www.elsevier.com/copyright
Author's personal copy
Mineralogical sources of the buffer capacity in a granite catchmentdetermined by strontium isotopes
Christina Weyer a,*, Gunnar Lischeid b, Luc Aquilina c, Anne-Catherine Pierson-Wickmann c,Charlotte Martin c
a Department for Ecological Modelling, University of Bayreuth, Dr.-Hans-Frisch-Street 1-3, D-95440 Bayreuth, Germanyb Institute of Landscape Hydrology, Leibniz-Center for Agricultural Research e.V., Eberswalder Street 84, D-15374 Müncheberg, Germanyc Géosciences, University of Rennes 1, Campus de Beaulieu, 263, Avenue du Général Leclerc, F - 35042 Rennes, France
a r t i c l e i n f o
Article history:Available online 16 April 2008
a b s t r a c t
The role of different minerals in base cation release and thus the increase of bufferingcapacity of groundwater against acid deposition is controversially discussed in the litera-ture. The 87Sr/86Sr ratios and base cation concentration were investigated in whole rockleachates, mineral separates, precipitation, soil solution, groundwater and stream watersamples in the Lehstenbach catchment (Germany) to identify the weathering sequenceof the granite bedrock. Three different approaches were followed in parallel. It wasassumed that the contribution of different minerals to base cation supply of the groundwa-ter with increasing weathering intensity would be observed by investigating (1) unweath-ered rock leachates, deep groundwater and shallow groundwater, (2) groundwater samplesfrom new groundwater wells, reflecting the initial weathering of the drilled bedrock, andgroundwater from wells that were drilled in 1988, (3) stream water during baseflow, dom-inated by deep groundwater, and stream water during high flow, being predominantlyshallow groundwater. Whereas the first approach yielded consistent patterns, there wassome evidence that groundwater from the new wells initially reflected contamination bythe filter gravel rather than cation release in an initial stage of weathering. Time seriessamples of stream water and groundwater solute concentrations and isotope ratios turnedout to reflect varying fractions of soil water and precipitation water at baseflow and highflow conditions rather than varying contributions of different minerals that prevail at dif-ferent stages of granite weathering.
The early phase of weathering was clearly dominated by base cation release from biotiteweathering and to a lesser extent by apatite dissolution. Feldspars contributed to base cat-ion release as well, but could not be regarded as endmembers of the mixing diagram. Therewas no clear evidence for a contribution from calcite. Correspondingly, base cation input byatmospheric deposition and liming had only minor effects on groundwater buffer capacity.
� 2008 Elsevier Ltd. All rights reserved.
1. Introduction
Acidification of soils, surface water and groundwater isstill of major concern in silicate ecosystems, despite a sig-nificant reduction in acid deposition (H+, S-compounds) inthe last 20 a (Likens et al., 1998; Stoddard et al., 1999; Ale-
well et al., 2000; Busch et al., 2001; Armbruster et al.,2003; Matzner et al., 2004). Deep groundwater is usuallyless acidic than surface water (Neal et al., 1990a,b; Davieset al., 1992) due to release of base cations via weathering.Thus, deep groundwater plays an important role in the buf-fering of acid deposition (Reynolds et al., 1986; Cook et al.,1991). Similarly, an accidental groundwater change lead tolong-lasting increases of pH (up to 1.5 pH units), alkalinity(up to 500 lE/L) and Ca concentrations (up to 9 mg/L) in
0883-2927/$ - see front matter � 2008 Elsevier Ltd. All rights reserved.doi:10.1016/j.apgeochem.2008.04.006
* Corresponding author. Fax: +49 921 555799.E-mail address: [email protected] (C. Weyer).
Applied Geochemistry 23 (2008) 2888–2905
Contents lists available at ScienceDirect
Applied Geochemistry
journal homepage: www.elsevier .com/locate /apgeochem

Author's personal copy
the catchment runoff of a shallow soil catchment (Nealet al., 1997). During drilling, the loss of air-flush circulationresulted in the opening of groundwater fracture routes tothe stream via the stream bed.
The buffering capacity of the bedrock depends on rate ofrelease of base cations, i.e., the abundance and the weath-erability of certain minerals. Reynolds et al. (1986) empha-sized the effect of CaCO3 in the bedrock on the bufferingcapacity of groundwater. Cook et al. (1991) traced the alka-line geochemistry of groundwater to dissolution of second-ary vein calcite and to hydrolysis of silicate minerals.Moncoulon et al. (2004) concluded that the weatheringrate in a catchment plays the most important part in soilbuffering capacity. Weathering processes can be enhancedby acidic atmospheric inputs, as shown by Åberg et al.(1989), Likens et al. (1998, 2002) and Probst et al. (1999).In addition, atmospheric cation inputs might add to thegeological source of buffer capacity (Moncoulon et al.,2004; Probst et al., 2000).
Chemical weathering models have been developed bymany authors to investigate ecosystem sensitivity to acidicdeposition (Christoffersen and Seip, 1982; April et al., 1986;Fritz et al., 1992; Probst et al., 2000). These models are usu-ally based on the assumption that the most abundant min-erals like plagioclase, K-feldspar, biotite and muscovite ingranite bedrock are the major cation sources (Blum et al.,1994; Bullen et al., 1997; Négrel et al., 2001, 2003). Traceminerals such as calcite or apatite are often not taken intoaccount. However, there is now increasing evidence thatplagioclase is not the predominating geochemical Ca sourcein many acid rock catchments in spite of being the predom-inant Ca-bearing mineral (Clow et al., 1997; White et al.,1999; Jacobson and Blum, 2000; Négrel et al., 2003; Olivaet al., 2004). Thus, an additional Ca source is required to ex-plain the observed chemical composition of the weatheringsolution. White et al. (1999) pointed out the role of dissem-inated calcite in the chemical weathering of granitoid rocks,using Ca/Na ratios compared to plagioclase stoichiometriesand flow-through experiments. Likewise, Clow et al. (1997),Blum et al. (1998), Jacobson and Blum (2000) and Négrelet al. (2003) emphasized the contribution of calcite presentin trace amounts in silicate bedrock (gneiss, granite) to thechemical composition of the weathering solution. Olivaet al. (2004) attribute more than 90% of the Ca export fromhigh elevation watersheds in the Pyrenees (France) to thedissolution of apatite and other trace Ca-rich minerals, rep-resenting less than 1% of the total rock volume. Similar re-sults were found by Aubert et al. (2002) and Blum et al.(2002). Harlavan and Erel (2002) observed preferential re-lease of Pb and rare earth elements from some accessoryphases (i.e. allanite, sphene and apatite) during granitoidweathering.
87Sr/86Sr ratios have been used in geology to determinethe age and the origin of rocks (Faure, 2001). Now they areincreasingly used to identify Ca sources due to the similarchemical behaviour of Sr and Ca (Åberg et al., 1989; Goszand Moore, 1989; Wickman and Jacks, 1992; Miller et al.,1993; Bailey et al., 1996; Clow et al., 1997). Åberg et al.(1989), Wickman and Jacks (1992), Bain and Bacon (1994),Clow et al. (1997), Probst et al. (2000), Harrington andHerczeg (2003) studied weathering processes and Frape
et al. (1984), Kay and Darbyshire (1986), Négrel et al.(2003) and Gosselin et al. (2004) water–rock interactionsin watersheds using Sr isotope ratios. The impact of atmo-spheric inputs on water quality in watersheds was investi-gated by Graustein and Armstrong (1983), Gosz and Moore(1989) and Probst et al. (2000). A summary concerning themethodology of Sr isotopes in general and the use of Sr iso-topes to identify hydrological and hydrogeochemical pro-cesses in watersheds is given e.g. in Bullen and Kendall(1998).
In the present study, 87Sr/86Sr ratios and major and traceelements were determined in a granite catchment in orderto ascertain the mineralogical sources of the buffer capacity.To that end, different parallel approaches that were as-sumed to give the same results were followed. First, leach-ing experiments were performed with unweathered rocksamples and the chemical and isotopic composition of sep-arated minerals were determined. Second, groundwatersamples from different sites and different depths were ana-lysed as well as rain water, soil solution and stream wateron different dates. Third, groundwater samples from wells,that were installed in 1995 and 1996 and that exhibitedvery high and steadily decreasing Ca concentration, werecompared to wells that were drilled in 1988. The enhancedCa concentration of the new installed wells was traced backto enhanced base cation release after drilling of theunweathered bedrock. Thus, it was hypothesized that thedegree of contribution of different minerals to base cationsupply of the groundwater with increasing weatheringintensity would be observed by investigating
(1) unweathered rock leachates, deep groundwater andshallow groundwater,
(2) groundwater samples from new groundwater wells,reflecting the initial weathering of the drilled bed-rock, and groundwater from wells that were drilledin 1988,
(3) stream water during baseflow, predominantly deepgroundwater, and stream water during high flow,being predominantly shallow groundwater.
2. Site description
The study was performed in the Lehstenbach watershed(50�080N and 11�520E) in the Fichtelgebirge Mountains inSE Germany (Gerstberger et al., 2004). The watershed areais 4.19 km2 and elevation ranges from 690 m to 877 m a.s.l.(Fig. 1).
Bedrock is variscan granite of two different facies: thefine-grained Outer Granite having a porphyritic structureand the middle- to coarse-grained Core Granite (Stettner,1964). The Outer Granite is 291 ± 7 Ma and the Core Gran-ite of 288 ± 4 Ma (Besang et al., 1976). The two facies showvery similar mineralogical composition: the predominantminerals are quartz (36%), K-feldspar (29–38%) and plagio-clase (17–24%).In addition, biotite and muscovite compriseanother 8–10%. Less than 0.5% of the total volume is due toaccessory minerals, including apatite.
The thickness of the regolith is very heterogeneous, andexceeds 40 m at many sites in the catchment due to inten-sive tertiary weathering (Lischeid et al., 2002). The area
C. Weyer et al. / Applied Geochemistry 23 (2008) 2888–2905 2889

Author's personal copy
was not glaciated during the pleistocene. Drilling profilesdown to 27 m depth show an irregular interlayering of san-dy to sandy-loamy grus, strongly weathered granite andsome massive boulders up to several meters in diameter.Dystric cambisols and podzols predominate. In the riparianzone, fibric histosols and dystric gleysols are found, repre-senting about one third of the watershed area. Soils arestrongly acidified showing a pH(H2O) in the A-horizon aslow as 3.70 (Gerstberger et al., 2004). The climate is hu-mid-continental, annual mean air temperature is 5.75 �Cand annual mean precipitation is between 950 and1250 mm. Dense Norway spruce stands cover more than95% of the watershed area.
Groundwater circulates mainly in the regolith that canbe considered as a porous aquifer with a saturated hydrau-lic conductivity of 3 � 10�6 m s�1 (Lischeid et al., 2002,2004a). Mean groundwater level is close to the surface dur-ing the whole year in the riparian zone and more than10 m below the surface in the upper part of the catchment.Amplitudes of groundwater level variations are less than1 m in the riparian zone and more than 5 m in the upperpart of the catchment. There are 13 observation wells inthe catchment gauged down to 10 m depth at least, butno production wells. Seven out of these wells were in-
stalled 1995 and 1996. Some of these wells initially exhib-ited very high Ca concentrations that clearly decreasedduring subsequent years. It was speculated that drillingmight have enhanced access to unweathered Ca-bearingminerals in the solid granite rock, leading to substantial re-lease of additional buffer capacity of the groundwater. Inaddition, shallow piezometers were installed at differentwetland sites in the watershed.
The area is drained by a dense network of naturalstreams and artificial channels, some of which are ephem-eral, especially in the upper part of the catchment. Meanresidence time of water measured at the catchment outletis 3.6 a. Mean annual runoff is 461 mm (1988–1999)(Lischeid et al., 2002). Groundwater flow in the regolithparallel to the stream at the catchment outlet is thereforelikely to play a negligible role in the total outflow (Lischeidet al., 2002). Stream discharge is generated by deepgroundwater recharge during baseflow conditions anddoes not fall below 0.25 mm per day even during longerdry periods. During heavy rainstorms the riparian zone issaturated to the surface, thus hydrologically connected tothe stream which can explain the strong increase (10–20fold over baseflow) in stream discharge during heavyrainstorms (Lischeid et al., 2002).
Fig. 1. Map of the Lehstenbach watershed in the Fichtelgebirge mountains in SE Germany. Gauss–Krüger coordinates [m] are given on the axes.
2890 C. Weyer et al. / Applied Geochemistry 23 (2008) 2888–2905
Author's personal copy
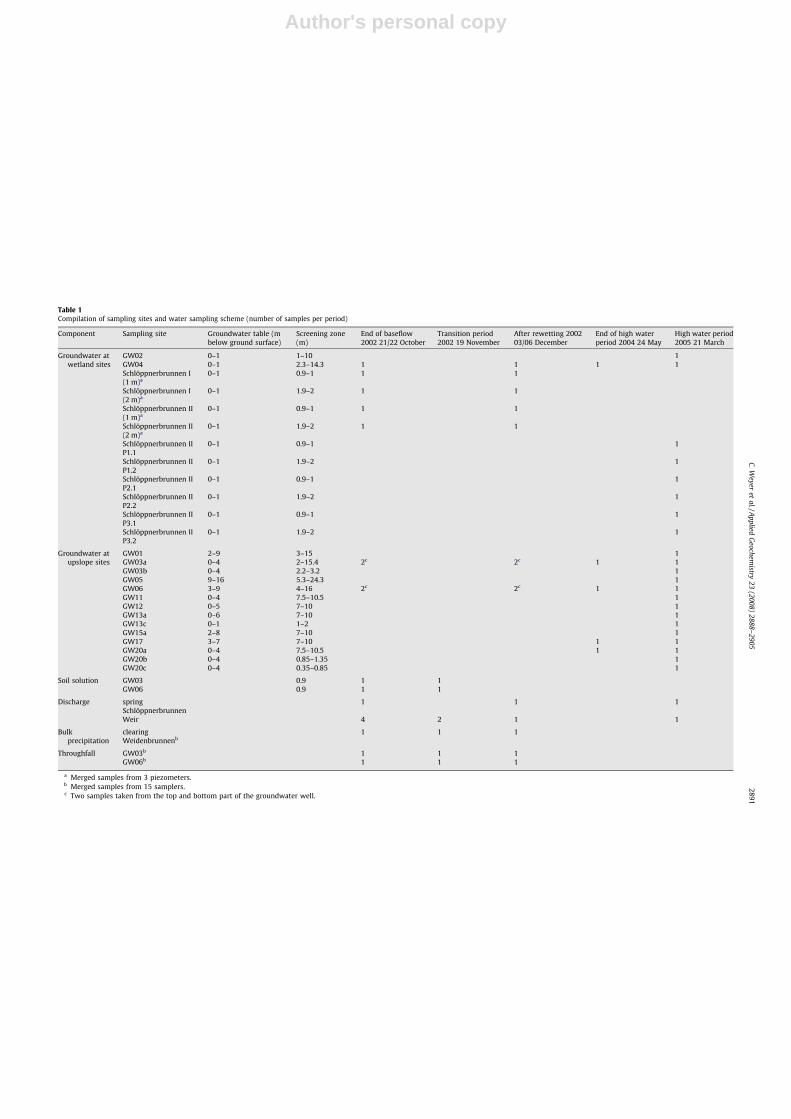
Table 1Compilation of sampling sites and water sampling scheme (number of samples per period)
Component Sampling site Groundwater table (mbelow ground surface)
Screening zone(m)
End of baseflow2002 21/22 October
Transition period2002 19 November
After rewetting 200203/06 December
End of high waterperiod 2004 24 May
High water period2005 21 March
Groundwater atwetland sites
GW02 0–1 1–10 1GW04 0–1 2.3–14.3 1 1 1 1Schlöppnerbrunnen I(1 m)a
0–1 0.9–1 1 1
Schlöppnerbrunnen I(2 m)a
0–1 1.9–2 1 1
Schlöppnerbrunnen II(1 m)a
0–1 0.9–1 1 1
Schlöppnerbrunnen II(2 m)a
0–1 1.9–2 1 1
Schlöppnerbrunnen IIP1.1
0–1 0.9–1 1
Schlöppnerbrunnen IIP1.2
0–1 1.9–2 1
Schlöppnerbrunnen IIP2.1
0–1 0.9–1 1
Schlöppnerbrunnen IIP2.2
0–1 1.9–2 1
Schlöppnerbrunnen IIP3.1
0–1 0.9–1 1
Schlöppnerbrunnen IIP3.2
0–1 1.9–2 1
Groundwater atupslope sites
GW01 2–9 3–15 1GW03a 0–4 2–15.4 2c 2c 1 1GW03b 0–4 2.2–3.2 1GW05 9–16 5.3–24.3 1GW06 3–9 4–16 2c 2c 1 1GW11 0–4 7.5–10.5 1GW12 0–5 7–10 1GW13a 0–6 7–10 1GW13c 0–1 1–2 1GW15a 2–8 7–10 1GW17 3–7 7–10 1 1GW20a 0–4 7.5–10.5 1 1GW20b 0–4 0.85–1.35 1GW20c 0–4 0.35–0.85 1
Soil solution GW03 0.9 1 1GW06 0.9 1 1
Discharge springSchlöppnerbrunnen
1 1 1
Weir 4 2 1 1
Bulkprecipitation
clearingWeidenbrunnenb
1 1 1
Throughfall GW03b 1 1 1GW06b 1 1 1
a Merged samples from 3 piezometers.b Merged samples from 15 samplers.c Two samples taken from the top and bottom part of the groundwater well.
C.Weyer
etal./A
ppliedG
eochemistry
23(2008)
2888–2905
2891
Author's personal copy
The watershed is still highly affected by atmosphericdeposition (S oxides, N oxides, protons, base cations) thatpeaked in the 1970s and steadily decreased thereafter(Matzner et al., 2004). Due to the decreasing SO4 deposi-tion, SO4-concentration in the topsoil has shown a decreas-ing trend, whereas in the groundwater no clear pattern ofconcentration trends was observed (Lischeid et al.,2004a). In contrast, pH and alkalinity of runoff were closelycorrelated to discharge and decreased during high flowconditions to 3.9 and �0.1 m molc L�1, respectively(Lischeid et al., 2004a). The catchment has been limed withdolomite several times in the past, excluding the riparianzone. In general, Ca and Na are the predominant cationsin streams and groundwater (Lischeid et al., 2004a).
3. Methods
3.1. Sampling
Groundwater, soil solution, precipitation and runoffwere sampled at different sites in the catchment in orderto investigate temporal and spatial variability of Sr isotoperatios and solute concentrations (Fig. 1, Table 1). Samplingdates were selected to represent the hydrological periods:end of baseflow (October 2002), a hydrological transitionperiod (November 2002), after rewetting of the catchment(December 2002), end of a high water period (May 2004)and during a high water period (March 2005). Groundwa-ter was sampled at wetland and hillslope sites at differentdepths (Table 1). Groundwater from the upper part of theaquifer was sampled by a pump submerged 1 m belowthe groundwater table (GW03a, GW06) and 1 m abovethe lower end of the gauge (GW01, GW02, GW03a,GW04, GW06, GW11, GW12, GW13a, GW17, GW20a). Alow pumping rate (0.05 L s�1) was used in order to avoidmixing of the water in the well. At the sites Schlöppner-brunnen I and II, GW03b, GW13c, GW20b and GW20cgroundwater was sampled in piezometers with a sub-merged pump. At Schlöppnerbrunnen I and II, samplesfrom 3 piezometers each gauged at 1 m and 2 m depths,respectively, were merged.
Suction cups at 1 m depth collected soil solution at sitesGW03 and GW06. At each site, soil solution from severalsuction cups yielded an aggregated sample. The vacuumwas maintained between �200 and �300 hPa (Lischeidet al., 2002). Stream discharge at the catchment outletwas recorded every 10 min. Water samples were taken athourly intervals by an automatic sampler, but only selectedsamples were analysed. The Schlöppnerbrunnen spring wassampled manually on two dates. Open field precipitationwas collected over 14-day periods at a clearing close tothe watershed boundary at 765 m a.s.l. (Fig. 1), andthroughfall was collected at sites GW03 and GW06. At eachsite, precipitation collected in 15 rain collectors was mergedto yield an aggregated sample per date and site.
Samples of plagioclase and K-feldspar were obtainedfrom a crushed unweathered Core Granite sample. The 0–200 lm fraction of the crushed rock was sieved to give a100–200 lm fraction. A plagioclase and a K-feldspar sam-ple were obtained using magnetic, heavy liquids and hand
picking techniques. The purity of the mineral separateswas tested by visual inspection using a binocular micro-scope. Due to the very similar density of plagioclase(2.63–2.66 g cm�3) and quartz (2.65 g cm�3) in the sample,it was not possible to separate the two mineral types.Therefore, the number of plagioclase grains in three times100 mineral grains was determined under a binocularmicroscope and the mean percentage of plagioclase andquartz in the sample was calculated. Mineral separateswere digested in sealed Teflon vessels using high-purityHNO3, HF and HCl. The Teflon vessels remained on a heat-ing plate for several days. The ICP-MS analysis of the min-eral samples was additionally validated by analysing100 mg of the CRPG Biotite Mica-Fe standard and of theANRT K-feldspar FK-N standard and a replicate, respec-tively, that were digested as were the mineral samples.
Trace minerals such as apatite or microcrystalline cal-cite could not be separated from the bedrock because oftheir extremely small grain size. In other studies, traceminerals were at least semi-quantitatively identified byXRD (e.g. Jahnke, 1984; Valsami-Jones et al., 1998). In thepresent study, however, samples from the drill cores atGW17 (P17) and GW20 (P20) that were taken from 3depths (3–4 m, 6–7 m, 9–10 m) were used for sequentialleaching experiments to chemically extract easily solubletrace minerals from the bedrock according to the methodof Clow et al. (1997). 150 g of crushed and sieved(<2 mm) granite of each sample were leached with150 mL of deionized water in three sequential steps. Foreach step, samples were shaken for 1 h, centrifuged, dec-anted and filtered through a 0.2 lm cellulose-acetate-membrane filter and stored in polyethylene bottles in thedark at less than 4 �C.
The same procedure was used for a sequential leachingexperiment with a sample of the dolomite used for limingof the catchment. Because of the greater sample volumecompared to that of trace minerals in the granite, only20 g dolomite were shaken with 90 mL deionized water.
3.2. Chemical analysis
Water samples were filtered through 0.45 and 0.2 lmcellulose-acetate-membrane filters, respectively. Theywere stored in polyethylene bottles in the dark at less than4 �C until further analysis. Major and trace element con-centrations of water and mineral digests were determinedby ICP–MS (HP4500�) and are precise to within 1 and 3%.Major element concentrations of sequential leachingexperiment samples were determined by ICP–OES (VarianVista-Pro CCD Simultanous), and trace element concentra-tions by ICP–MS (Agilent 7500 ce).
Strontium was separated from water, digested mineralsand from sequential-leach experiments samples using Sr-SPEC (EiChrom Industries, 100–150 lm) and Dowex AG50 W-X8 (200–400 mesh, Bio-Rad�) resin. 87Sr/86Sr-ratioswere determined by mass spectrometry (Finnigan MAT262). Isotope ratios have been corrected for natural andanalytical stable isotope fractionation to 88Sr/86Sr =8.375209 and for 87Rb-traces, with the same mass as 87Srto 85Rb/87Rb = 2.59265. 87Sr/86Sr ratios are precise to with-in 6 � 10�6–26 � 10�6 (2r, standard error). The NIST 987
2892 C. Weyer et al. / Applied Geochemistry 23 (2008) 2888–2905
Author's personal copy
standard yielded values of 0.710217 (n = 33; 2r = 32 �10�6) and 0.710241 (n = 14; 2r = 6 � 10�6) for watersamples, 0.710159 (n = 4; 2r = 5 � 10�6) for mineral digestsamples and 0.710253 (n = 11; 2r = 7 � 10�6) for sequen-tial leaching experiment samples.
3.3. Principal component analysis
It was assumed that the water samples representedvarying fractions of single endmembers. In order to deter-mine these endmembers a principal component analysis(PCA) was performed using data from different sources.The data set comprised (1) Ca, Mg, Ba, Na, K, Sr and Rb con-centrations and 87Sr/86Sr ratios of the water samples, di-gested mineral samples and sequential leachate samplesof the study, (2) Ca, Mg, Ba, Na, K, Sr and Rb concentrationsof leachates from Irber (1996) and Irber et al. (1997) usingsamples from the Lehstenbach catchment and granite sam-ples from other sites in the Fichtelgebirge Mountains andin the Ore Mountains (East Germany) and (3) Ca, Mg, Ba,Na, K and Rb concentrations of digested mineral samplesfrom the Bohemian Massif, the Fichtelgebirge mountainsand the nearby Mitterteich granites from Siebel (1995)and Siebel et al. (1997). There were no Sr isotope ratiosavailable for these biotite samples. Assuming that the87Sr/86Sr ratio of biotite is always highly radiogenic, a nota-tional Sr isotope ratio of 5.00 was used for these samples.The concentrations in groundwater samples and from thedifferent leaching experiments were not comparable dueto different methodologies. Besides, not all elements wereanalysed in all of the studies. Thus, it was not possible touse concentration ratios. Instead, the data were normalisedusing Eq. (1). The element concentration data were dividedby the mean values of the respective dataset. Then themean value of all these quotients for one author was calcu-lated. This value was used to divide every element concen-tration given by the author. Data were then logtransformed in order to obtain a Gaussian distributionand z-standardised with respect to the whole dataset(mean value = 0, standard deviation = 1) Eq. (2).
cx;norm ¼cx
1n �P
ncxð1Þ
where cx,norm is the normalised concentration of element x;cx is the concentration of element x; 1
n
Pncx is the mean of
the concentrations of all n elements from one dataset usedfor the PCA (i.e. datasets of mineral leaching, water sam-ples, minerals from the present study, the dataset from Ir-ber (1996) and Irber et al. (1997) and the dataset fromSiebel (1995) and Siebel et al. (1997))
cx;stand ¼logðcx;normÞ � 1
n
Pn logðcÞn;m
SDðlogðcÞn;mÞð2Þ
where cx,stand is the z-standardised concentration of ele-ment x; 1
n
Pn logðcÞn;m is the mean of the concentrations
of all n elements from all m datasets used for the PCA;SD(log(c)n,m is the standard deviation of the concentrationsof all n elements from all m datasets used for the PCA.
Principal components with an eigen value greater than1 were extracted, using a varimax rotation.
3.4. Saturation indices
For all samples from groundwater outside the wetlandsthe saturation indices (SI) with respect to biotite, feldsparsand apatite were calculated based on the chemical equilib-ria (3)–(6). Albite and K-feldspar were used as correspond-ing endmembers of the feldspar mixing series
Biotite : KAl3Si3O10ðOHÞ2 þ 10Hþ
! Kþ þ 3Al3þ þ 3H4SiO4 log Ksp ¼ 12:703 ð3Þ
Albite : NaAlSi3O8 þ 8H2O! Naþ þ AlðOHÞ�4 þ 3H4SiO4
log Ksp ¼ �18:002 ð4Þ
K-feldspar : KAlSi3O8 þ 8H2O! KþAlðOHÞ�4 þ 3H4SiO4
log Ksp ¼ �20:573 ð5Þ
Apatite : Ca5ðPO4Þ3OHþ 4Hþ
! 5Ca2þ þ 3HPO2�4 þH2O log Ksp ¼ �3:42 ð6Þ
The ionic activity products (IAP) were calculated using Eq.(7), the saturation indices (SI) using Eq. (8). The solubilityproduct values (logKsp) for the different minerals were ta-ken from the USGS Software FREEQC. The saturation indexwith respect to calcite could not be calculated due to thelack of hydrogen carbonate data.
IAP ¼Y
anx ð7Þ
where IAP is the ionic activity product, and a is the ionicactivity of the dissolved species x and n the stoichiometricnumber
SI ¼ pKsp � pIAP ð8Þ
4. Results
As will be shown in this section, three different groupsof groundwater wells could be discerned: The wetlandgroup (wetland wells) comprises predominantly shallowgroundwater wells in the wetland areas that have verylow O2 concentration (not shown). This group consists ofthe wells Schlöppnerbrunnen II, Schlöppnerbrunnen I(1 m) and wells GW02 and GW04. The second group com-prises predominantly deep groundwater wells at upslopesites that were mostly installed in 1987–1988 (deepgroundwater group I) (old wells), that is, the wells GW01,GW03a and GW06. The wells of the last group resemblethose of the second group with respect to gauging depth,upslope location and O2 concentration of the groundwatersamples. However, these wells were installed in 1995 or la-ter. This group will be named the deep groundwater groupII (new wells). It consists of the wells GW11, GW12,GW13a, GW13c, GW17, GW20a, GW20c and Schlöppnerb-runnen I (2 m). The results will be presented for the threegroups.
4.1. Single solutes
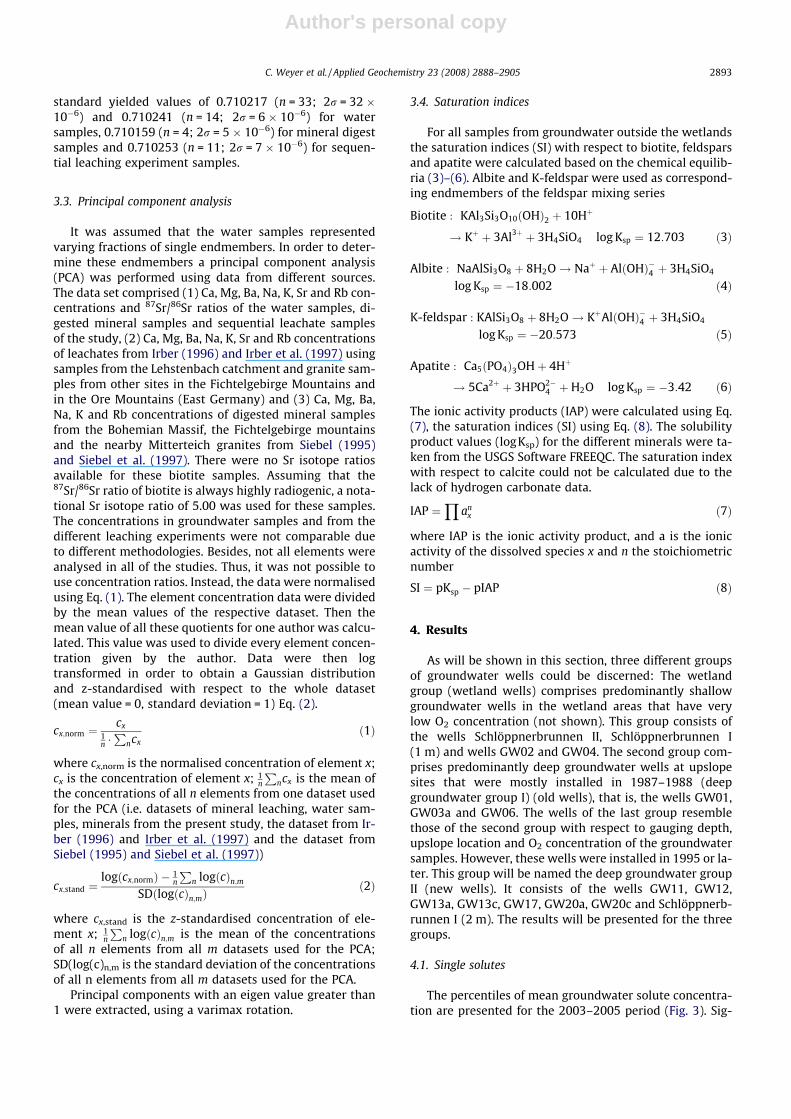
The percentiles of mean groundwater solute concentra-tion are presented for the 2003–2005 period (Fig. 3). Sig-
C. Weyer et al. / Applied Geochemistry 23 (2008) 2888–2905 2893

Author's personal copy
nificant trends could be identified only at some singlewells (Lischeid et al., 2004a), but not for whole groups.The pH values of groundwater group I are around 5, andthose of the deep groundwater group II and of the wetlandgroup around 6. Due to long-lasting atmospheric deposi-tion, SO4 is the prevailing anion in the groundwater sam-ples (Lischeid et al., 2004a). Sulfate concentration in thewetland wells is substantially less compared to theremaining wells, which is traced back to dissimilatorySO4 reduction as well as to the effect of decreasing SO4
deposition since the late 1970s (Lischeid et al., 2004a). Cor-respondingly, decreasing deposition presumably led tolower Ca and Mg concentrations in the shallow wetlandwells. In addition, liming of the forest soils with dolomitewas restricted to the upslope sites. It is remarkable thatthe deep groundwater group II exhibits the highest Ca con-centrations, and also the highest range of Ca contents. Thesame holds for Mg, although to a lower degree.
The highest Ca concentrations were observed in thegroundwater of wells GW11, GW12, GW17 and GW20aafter drilling in 1995 and 1996 and decreased substantiallylater in 3 of the wells (Fig. 2). This effect was much morepronounced in well GW20a than in well GW12 andGW17. In well GW13a, that is located downstream ofGW20a (Fig. 1), Ca concentrations started to increase assoon as they decreased in well GW20a. High Ca concentra-tions were associated with high Mg and SO4 concentra-tions and high pH values (not shown).
4.2. 87Sr/86Sr ratios and Sr concentrations
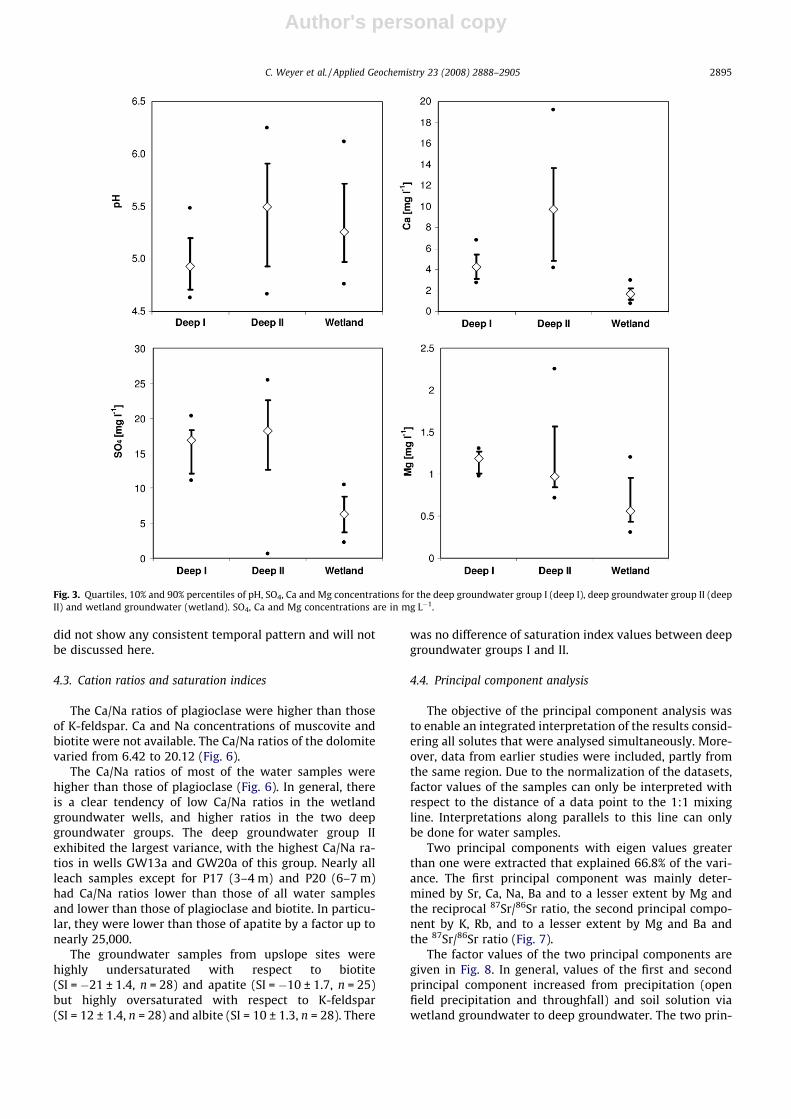
Strontium isotope ratios are plotted in the form of aKeeling diagram versus the reciprocal Sr concentrations(1/[Sr]) in Fig. 4. In this representation, mixing of a con-stant background component with a component with vary-
ing concentration would yield a straight line (Faure, 2001).The three groundwater groups could clearly be differenti-ated based on 87Sr/86Sr ratios and Sr concentrations.
Samples from the deep groundwater group I exhibitedhigh 87Sr/86Sr ratios and high Sr concentrations. Theyclearly differed from those of the deep groundwater groupII with low 87Sr/86Sr ratios and high Sr concentrations. TheSr isotope ratios of the deep groundwater group I werevery close to or slightly exceeding those of plagioclase. Incontrast, the deep groundwater group II showed Sr isotoperatios similar to those of the apatite and dolomite leachsamples, especially at well GW20a. Most of the leach sam-ples showed Sr isotope ratios ranging between those ofapatite and precipitation to the values of plagioclase(Fig. 6). There was no clear relationship with depth ornumber of sequential leaching steps. The 87Sr/86Sr ratiosof the dolomite used for liming of the catchment increasedduring the sequential leaching experiment from0.708051 ± 6 � 10�7 to 0.708142 ± 8 � 10�7 (Fig. 4).
The samples from the wetland group are characterizedby low 87Sr/86Sr ratios and low Sr concentrations. In addi-tion, soil solution samples of sites GW03 and GW06 plot inthis field. Moreover, the wetland samples were close tothose of precipitation and throughfall.
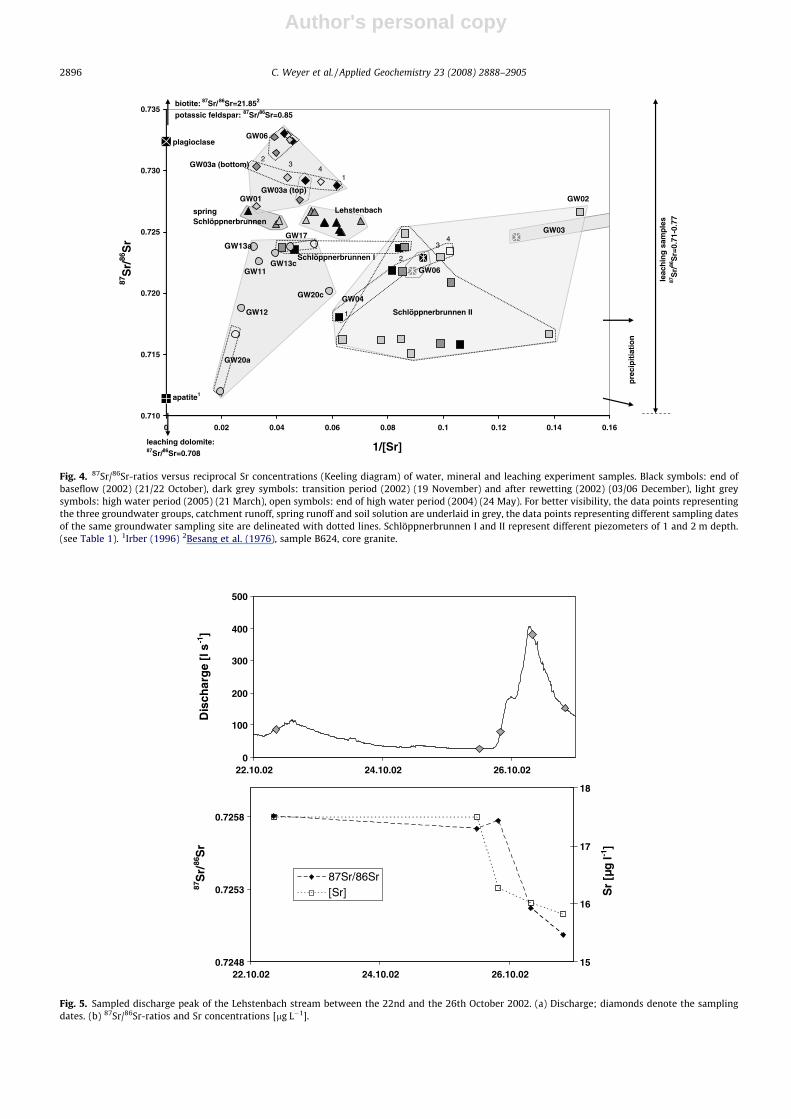
Stream water samples from the catchment outlet plotbetween the three groundwater endmembers (Fig. 4). The87Sr/86Sr ratios and Sr concentrations in the Lehstenbachcatchment runoff decreased during stormflow in October2002 compared to baseflow (Fig. 5). The 87Sr/86Sr ratiosand Sr concentrations in the runoff of the Schlöppnerbrun-nen spring were intermediate between those of the twodeep groundwater components. There are no wetlands inthe subcatchments of that spring.
Strontium isotope ratios and concentrations of thegroundwater wells as well as the precipitation samples
0
5
10
15
20
25
30
35
40
45
50
01.01.97 01.01.98 01.01.99 01.01.00 31.12.00 31.12.01 31.12.02 31.12.03
date
Ca
[mg
l-1]
GW20a
GW17
GW13a
GW12
GW11
Fig. 2. Time series of Ca concentrations [mg L�1] in groundwater wells GW11, GW12, GW13a, GW17 and GW20a from 1997 to 2003. The lack of data for theApril and September sampling dates 2001 is due to analytical problems.
2894 C. Weyer et al. / Applied Geochemistry 23 (2008) 2888–2905
Author's personal copy
did not show any consistent temporal pattern and will notbe discussed here.
4.3. Cation ratios and saturation indices
The Ca/Na ratios of plagioclase were higher than thoseof K-feldspar. Ca and Na concentrations of muscovite andbiotite were not available. The Ca/Na ratios of the dolomitevaried from 6.42 to 20.12 (Fig. 6).
The Ca/Na ratios of most of the water samples werehigher than those of plagioclase (Fig. 6). In general, thereis a clear tendency of low Ca/Na ratios in the wetlandgroundwater wells, and higher ratios in the two deepgroundwater groups. The deep groundwater group IIexhibited the largest variance, with the highest Ca/Na ra-tios in wells GW13a and GW20a of this group. Nearly allleach samples except for P17 (3–4 m) and P20 (6–7 m)had Ca/Na ratios lower than those of all water samplesand lower than those of plagioclase and biotite. In particu-lar, they were lower than those of apatite by a factor up tonearly 25,000.
The groundwater samples from upslope sites werehighly undersaturated with respect to biotite(SI = �21 ± 1.4, n = 28) and apatite (SI = �10 ± 1.7, n = 25)but highly oversaturated with respect to K-feldspar(SI = 12 ± 1.4, n = 28) and albite (SI = 10 ± 1.3, n = 28). There
was no difference of saturation index values between deepgroundwater groups I and II.
4.4. Principal component analysis
The objective of the principal component analysis wasto enable an integrated interpretation of the results consid-ering all solutes that were analysed simultaneously. More-over, data from earlier studies were included, partly fromthe same region. Due to the normalization of the datasets,factor values of the samples can only be interpreted withrespect to the distance of a data point to the 1:1 mixingline. Interpretations along parallels to this line can onlybe done for water samples.
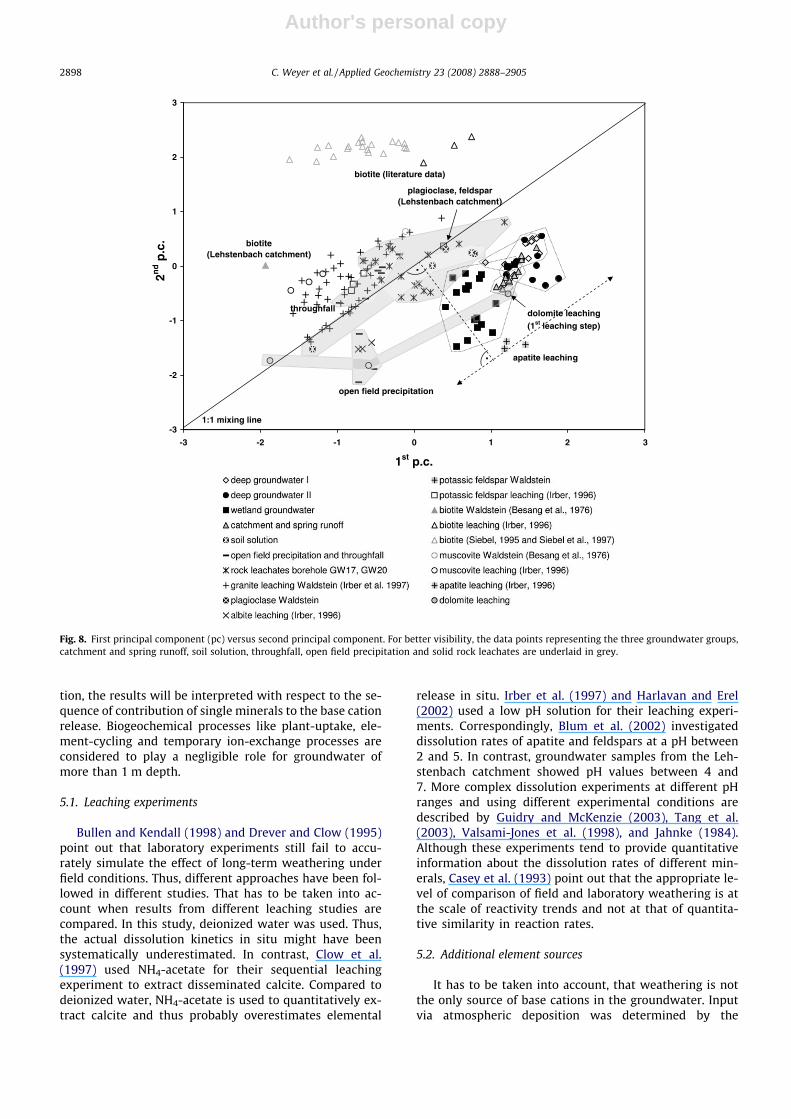
Two principal components with eigen values greaterthan one were extracted that explained 66.8% of the vari-ance. The first principal component was mainly deter-mined by Sr, Ca, Na, Ba and to a lesser extent by Mg andthe reciprocal 87Sr/86Sr ratio, the second principal compo-nent by K, Rb, and to a lesser extent by Mg and Ba andthe 87Sr/86Sr ratio (Fig. 7).
The factor values of the two principal components aregiven in Fig. 8. In general, values of the first and secondprincipal component increased from precipitation (openfield precipitation and throughfall) and soil solution viawetland groundwater to deep groundwater. The two prin-
Fig. 3. Quartiles, 10% and 90% percentiles of pH, SO4, Ca and Mg concentrations for the deep groundwater group I (deep I), deep groundwater group II (deepII) and wetland groundwater (wetland). SO4, Ca and Mg concentrations are in mg L�1.
C. Weyer et al. / Applied Geochemistry 23 (2008) 2888–2905 2895
Author's personal copy
2
2
0.710
0.715
0.720
0.725
0.730
0.735
0 0.02 0.04 0.06 0.08 0.1 0.12 0.14 0.16
1/[Sr]
87S
r/86
Sr
Schlöppnerbrunnen I
plagioclase
GW06
GW03
GW04
Lehstenbach
GW06
GW03a (bottom)
springSchlöppnerbrunnen
pre
cip
itia
tio
n
apatite1
GW20a
GW17
GW12
GW20c
GW11
GW13a
GW01 GW02
GW13c
Schlöppnerbrunnen II
GW03a (top)
leac
hin
g s
amp
les
87S
r/86
Sr=
0.71
-0.7
7
potassic feldspar: 87Sr/86Sr=0.85
biotite: 87Sr/86Sr=21.852
1
34
1
34
leaching dolomite:87Sr/86Sr=0.708
Fig. 4. 87Sr/86Sr-ratios versus reciprocal Sr concentrations (Keeling diagram) of water, mineral and leaching experiment samples. Black symbols: end ofbaseflow (2002) (21/22 October), dark grey symbols: transition period (2002) (19 November) and after rewetting (2002) (03/06 December), light greysymbols: high water period (2005) (21 March), open symbols: end of high water period (2004) (24 May). For better visibility, the data points representingthe three groundwater groups, catchment runoff, spring runoff and soil solution are underlaid in grey, the data points representing different sampling datesof the same groundwater sampling site are delineated with dotted lines. Schlöppnerbrunnen I and II represent different piezometers of 1 and 2 m depth.(see Table 1). 1Irber (1996) 2Besang et al. (1976), sample B624, core granite.
0.7248
0.7253
0.7258
22.10.02 24.10.02 26.10.02
87S
r/86
Sr
15
16
17
18
Sr
[µg
l-1]
87Sr/86Sr[Sr]
0
100
200
300
400
500
22.10.02 24.10.02 26.10.02
Dis
char
ge
[l s
-1]
Fig. 5. Sampled discharge peak of the Lehstenbach stream between the 22nd and the 26th October 2002. (a) Discharge; diamonds denote the samplingdates. (b) 87Sr/86Sr-ratios and Sr concentrations [lg L�1].
2896 C. Weyer et al. / Applied Geochemistry 23 (2008) 2888–2905

Author's personal copy
cipal components allowed delineation of precipitationfrom groundwater, mostly due to higher values on the firstprincipal component of the latter (Fig. 8). Wetland ground-water with lower values on the second principal compo-nent and slightly lower values on the first can clearly bedistinguished from groundwater outside the wetlands(deep groundwater groups I and II). The samples of deepgroundwater group I show considerable overlap with thedeep groundwater group II. Catchment runoff sampleshad an intermediate position between wetland groundwa-
ter on the one hand and the two deep groundwater groupson the other hand. Spring runoff plotted in the field of deepgroundwater groups I and II (Fig. 8).
Based on this analysis, biotite could be clearly identifiedas an endmember. Most of the biotite samples showed thehighest factor values for the second principal component(Fig. 8) due to high concentrations of K, Rb and Mg andhigh 87Sr/86Sr ratios. On the other hand, the apatite leachsamples from Irber (1996) and the first leaching step sam-ple from the dolomite leach had high factor values of thefirst principal component, due to high Ca, Na and Sr valuesand low 87Sr/86Sr ratios. In contrast to dolomite, that plotin the range of groundwater, the distance of apatite leach-ing samples from the 1:1 mixing line was greater than thatof all water samples. Thus, apatite could be considered asan endmember. The plagioclase and K-feldspar samplefrom the granite in the Lehstenbach catchment and the al-bite and K-feldspar leach samples from Irber (1996) plotbetween the biotite and the water samples and could thusnot be considered as endmembers.
5. Discussion
The discussion is organized as follows: In the first sec-tion the methodology of the leaching experiments will becompared to that of other studies. Second, additionalsources of base cation release beside weathering will beevaluated. Third, the three different approaches to identifythe weathering sequence will be discussed. In the last sec-
0.709
0.714
0.719
0.724
0.729
0.734
0.739
0.744
0 0.5 1 1.5 2 2.5Ca/Na
87S
r/86
Sr
potassic feldspar: 87Sr/86Sr=0.85
Schlöppnerbrunnen IIGW04
Schlöppnerbrunnen I
GW03a (bottom)
GW06
Lehstenbach spring Schlöppnerbrunnen
plagioclase
GW03
GW20aCa/Na=9.47 (end of high water)
GW03
GW06open field precipitation
GW17 3-4m
apatite1
Ca/Na=1784
biotiteCa/Na=11-242
87Sr/86Sr=21.853
GW20aCa/Na=4.45 (high water)
GW20c
GW17
GW12
GW01GW02GW13aCa/Na=5.32
GW11GW13c
GW20 6-7 m GW03a (top)
leaching dolomiteCa/Na=6.42-20.12
GW17 6-7 m
GW06
Fig. 6. 87Sr/86Sr-ratios versus Ca/Na ratios of water, mineral and leaching experiment samples. Black symbols: end of baseflow (2002) (21/22 October), darkgrey symbols: transition period (2002) (19 November) and after rewetting (2002) (03/06 December), light grey symbols: high water period (2005) (21March), open symbols: end of high water period (2004) (24 May). Rock leachates 3–4 m, 6–7 m and 9–10 m represent rock leachates from both drill coresfrom wells GW17 and GW20. For better visibility, the data points representing the three groundwater groups, catchment runoff, spring runoff, soil solution,throughfall and open field precipitation are underlaid in grey, the data points representing different sampling dates of the same groundwater sampling siteare delineated with dotted lines. Schlöppnerbrunnen I and II represent different piezometers of 1 and 2 m depth (see Table 1). 1 Irber (1996) 2 Irber (1996),granite samples leaching experiments of 2, 5 and 20 h 3 Besang et al. (1976), sample B624, granite core.
-1
-0.5
0
0.5
1
Sr
Ca
Na
Ba
Mg
K Rb
87Sr/86S
r
1st p.c.2nd p.c.
Fig. 7. Loadings of the parameters used for the PCA on the three principalcomponents (pc).
C. Weyer et al. / Applied Geochemistry 23 (2008) 2888–2905 2897
Author's personal copy
tion, the results will be interpreted with respect to the se-quence of contribution of single minerals to the base cationrelease. Biogeochemical processes like plant-uptake, ele-ment-cycling and temporary ion-exchange processes areconsidered to play a negligible role for groundwater ofmore than 1 m depth.
5.1. Leaching experiments
Bullen and Kendall (1998) and Drever and Clow (1995)point out that laboratory experiments still fail to accu-rately simulate the effect of long-term weathering underfield conditions. Thus, different approaches have been fol-lowed in different studies. That has to be taken into ac-count when results from different leaching studies arecompared. In this study, deionized water was used. Thus,the actual dissolution kinetics in situ might have beensystematically underestimated. In contrast, Clow et al.(1997) used NH4-acetate for their sequential leachingexperiment to extract disseminated calcite. Compared todeionized water, NH4-acetate is used to quantitatively ex-tract calcite and thus probably overestimates elemental
release in situ. Irber et al. (1997) and Harlavan and Erel(2002) used a low pH solution for their leaching experi-ments. Correspondingly, Blum et al. (2002) investigateddissolution rates of apatite and feldspars at a pH between2 and 5. In contrast, groundwater samples from the Leh-stenbach catchment showed pH values between 4 and7. More complex dissolution experiments at different pHranges and using different experimental conditions aredescribed by Guidry and McKenzie (2003), Tang et al.(2003), Valsami-Jones et al. (1998), and Jahnke (1984).Although these experiments tend to provide quantitativeinformation about the dissolution rates of different min-erals, Casey et al. (1993) point out that the appropriate le-vel of comparison of field and laboratory weathering is atthe scale of reactivity trends and not at that of quantita-tive similarity in reaction rates.
5.2. Additional element sources
It has to be taken into account, that weathering is notthe only source of base cations in the groundwater. Inputvia atmospheric deposition was determined by the
-3
-2
-1
0
1
2
3
-3 -2 -1 0 1 2 3
1st p.c.
2nd p
.c.
dolomite leaching(1st leaching step)
apatite leaching
biotite (literature data)
plagioclase, feldspar(Lehstenbach catchment)
biotite (Lehstenbach catchment)
open field precipitation
throughfall
1:1 mixing line
.
.
Fig. 8. First principal component (pc) versus second principal component. For better visibility, the data points representing the three groundwater groups,catchment and spring runoff, soil solution, throughfall, open field precipitation and solid rock leachates are underlaid in grey.
2898 C. Weyer et al. / Applied Geochemistry 23 (2008) 2888–2905
Author's personal copy
throughfall samplers. In addition, there are two othersources that need to be discussed.
5.2.1. LimingDuring the last decades, the Lehstenbach upslope area
was repeatedly limed to counteract the harmful effects ofacid deposition on the soils. Liming was performed in thewetlands to avoid enhanced mineralization of the peat.Usually, about 4 t ha�1 dolomite were applied during sin-gle campaigns. Different parts of the catchment were limedduring different campaigns. Assuming one liming cam-paign per decade, annual Ca input via liming is about 20times that by deposition (Lischeid et al., 2004b), and about0.2% of the total Ca pool of the regolith (Besang et al.,1976). Correspondingly, a considerable amount of Sr inputhas to be taken into account (Clow et al., 1997; Probstet al., 2000).
In subsequent liming campaigns, different materialswere used with presumably different 87Sr/86Sr ratios. Onlythose in leachates of the dolomite used during the lastcampaign could be measured. The values of0.708051 ± 6 � 10�7–0.708142 ± 8 � 10�7 correspond wellto the data for dolomite given in the literature, ranging be-tween 0.7056 and 0.7095 (Fouke et al., 1996; Sillen et al.,1998; Zachariah et al., 1999; Qing et al., 2001; Drouetet al., 2005).
As only the upslope sites were limed, dolomite couldexplain the difference in Sr concentration between thewetland and the deep groundwater components. Dolomitewould also be in line with the higher Ca/Na ratios of thewater samples compared to that of plagioclase (Fig. 6).Numerous studies have focused on the response of soilsolution and surface water to liming (e.g. Geary and Dris-coll, 1996; Driscoll et al., 1996; Traaen et al., 1997; Alewellet al., 2000; Frank and Stuanes, 2003; Hindar et al., 2003;Dorland et al., 2005). However, the impact of liming ongroundwater quality is rarely addressed. Gunn et al.(2001) did not find a clear effect of liming on groundwaterquality at a study site at Sudbury, Canada, within the firstyear. Peters et al. (1999) and Lorz et al. (2003) did not ob-serve any effect of liming on stream water Ca concentra-tion in two Czech shallow soil catchments. They ascribedthat to ion exchange processes in the topsoil. Driscollet al. (1996) argue that dissolution of applied CaCO3 infreely draining upland soils is relatively limited in contrastto wetland soils and thus could have little effect on soilsolution chemistry. Correspondingly, in the Lehstenbachcatchment, monitoring of groundwater wells and springsdownslope of areas that were limed in 1999 did not showany increase of Ca concentration within six years. Accord-ingly, the high Ca concentrations after drilling in the newgroundwater wells can not be explained by liming. More-over, liming cannot be the reason for the difference of87Sr/86Sr ratios and Ca/Na ratios between the two deepgroundwater groups. Thus, it is concluded that limingshould not be considered a major Ca source for thegroundwater.
5.2.2. Contamination by filter gravelAccording to the Sr isotope and base cation ratios, two
different groups of deep groundwater wells could be dis-
cerned (Figs. 4 and 6). These two groups differ neither withrespect to mean gauging depth nor to location within thecatchment or to the fraction of unweathered bedrock inthe drill cores. However, the deep groundwater wells ofthe second group were installed later compared to the firstgroup, and were installed in a different manner. Thus,whether this distinction is based on an artefact needs tobe checked. The most probable reason for that would bea contaminated filter gravel as has been observed else-where (Kloppmann et al., 2001; Malard et al., 2005).
Unfortunately, no samples from the filter gravel wereavailable, and any inferences are based on indirect evi-dence only. However, there is some evidence that pointto filter gravel contamination. First of all, the high Ca con-centrations in the groundwater samples observed immedi-ately after installation of the new wells, and the slowdecrease thereafter (Fig. 2) are consistent with filter gravelcontamination. Moreover, the delayed increase of Ca con-centration in well 13a compared to that of well 20a, whichis located exactly upstream of the former, can be explainedby a contamination plume that has been released by apoint source upstream. In fact, the observed time lag corre-sponds to mean groundwater flow velocity in the catch-ment. Second, the catchment runoff is located betweendeep groundwater group I and the wetland groundwatergroup in the mixing diagrams (Figs. 4 and 6). Thus, it canbe argued that the wells of group II are affected by contam-ination which is restricted to the close proximity of thewells and which does not show up in the stream.
Third, a crude mass balance approach helps to identifythe most probable source of the high Ca concentrationsin the second deep groundwater group. Filter gravel wasinstalled between 1 and 10 m. Assuming, that the cross-sectional zone of influence is about 1 m2, accounting forconverging groundwater flow lines in the vicinity of thewell, considering a mean porosity of 0.1, and a groundwa-ter flux velocity of 5 � 10�6 m s�1, then the volume of af-fected groundwater of 9 m3 would be exchanged 160times/a. The observed maximum increase of Ca concentra-tion at well GW20a by about 20 mg L�1 during the firstyear would then correspond to a release of 2.88 kg Ca.
The total mass of filter gravel per well is about 580 kg.Correspondingly, contamination of the filter gravel with1.2% CaCO3 would be necessary to release 2.88 kg Ca. Thatseems to be a plausible amount. The maximum amount ofCa that could be released by apatite weathering is in thesame range. According to Richter and Stettner (1979),accessory minerals sum to 0.3% of the bedrock mass.Assuming, that this is entirely due to apatite, and thatthe diameter of the cross sectional area where weatheringwas enhanced by drilling is about twice the diameter of thedrilling core, and that the density is 2.5 g cm�3, this wouldcorrespond to 8.34 kg apatite. Assuming further that theapatite is purely Ca5(PO4)3(OH), this would be equal to3.33 kg Ca which is in the order of that found in thegroundwater. Based on these very optimistic assumptions,the total Ca mass provided by apatite weathering wouldindeed have been sufficient for explaining the observed in-crease in Ca concentration in the groundwater at wellGW20a in the first year. However, apatite would then havebeen completely dissolved. Thus, apatite dissolution alone
C. Weyer et al. / Applied Geochemistry 23 (2008) 2888–2905 2899
Author's personal copy
would have been insufficient to explain the high amountsof Ca released over a period of several years as was ob-served in the groundwater of the new wells.
According to Fig. 3, deep groundwater wells of the firstand second group do not only differ with respect to Ca con-centrations, but also with respect to Sr isotope ratios. How-ever, the linear correlation between Ca concentration andSr isotope ratios in groundwater wells from the affectedwells GW11–GW20a is not significant at the a = 0.1 level.Thus, it is concluded that Ca concentration data and Sr iso-tope ratios point to different sources.
5.3. Three different approaches to identify the weatheringsequence
Three different approaches were used to identify the se-quence of base cation release by different minerals in theLehstenbach catchment. It was hypothesized that the con-tribution of different minerals to base cation supply of thegroundwater with increasing weathering intensity wouldbe observed by investigating
(1) unweathered rock leachates, deep groundwater andshallow groundwater;
(2) groundwater samples from new groundwater wells,reflecting the initial weathering of the drilled bed-rock, and groundwater from wells that were drilledin 1988;
(3) stream water baseflow period, dominated by deepgroundwater contribution, and stream water duringhigh flow, being dominated by shallow ground-water.
5.3.1. Rock leachates, deep groundwater and shallowgroundwater
Three distinct groups of groundwater wells were iden-tified based on Sr isotope ratios and base cation values:Wetland wells, upslope deep groundwater wells mostlyinstalled in 1988 (deep groundwater group I), and ups-lope deep groundwater wells installed in 1995 or later(deep groundwater group II). Mean gauging depth doesnot differ between the latter two groups. In addition,there is no clear depth dependency of isotope ratios orbase cation concentration within the single groups.Please compare GW02 and GW04 with the shallow wellsin the wetland group (Table1, Figs. 4 and 6), GW03 (top)and GW03 (bottom) in the deep groundwater group I,and GW13a–c and GW20a–c in the deep groundwatergroup II.
In contrast, the lower Sr isotope ratios and lower cationconcentrations in the wetland groundwater are mostly dueto a larger contribution of precipitation and throughfallwater (Figs. 4 and 6). This is corroborated by the fact thatsoil solution at the upslope sites GW03a and GW06 exhib-ited a corresponding shift, compared to the groundwatersamples from the same sites. Correspondingly, Aubertet al. (2002) found clear differences between upslopegroundwater and saturated zone groundwater in the gra-nitic Strengbach catchment in the Vosges Mountains inFrance.
However, mixing with precipitation cannot explain thelow Sr isotope ratios in the drill core leachates of the wellsthat were installed in 1995, which are substantially lesscompared to plagioclase, feldspars or biotite (Fig. 6). Ithas been argued before that the low Sr isotope ratios inthe groundwater of these wells are not correlated withthe high Ca concentration released by the filter gravel. Cor-respondingly, an effect of liming is not very likely. Apatitedissolution would be in line with the low Sr isotope ratios.However, the Ca/Na and Rb/Sr ratios of the rock leachatesare opposite to those of apatite (Figs. 4 and 6; Rb/Sr ratiosnot shown). In contrast, factor values of most of the rockleachates on the two principal components are in the rangeof those of plagioclase and K-feldspar from the Lehsten-bach catchment. On the other hand, some rock leachatesamples (GW17 3–4 m and 6–7 m) show higher Sr isotoperatios than those of plagioclase and more similar to thoseof biotite than to those of feldspars (Figs. 6 and 8). Thus,the rock leachates point to (preferential) cation releasefrom feldspars and biotite dissolution in an initial phaseof weathering (Brantley et al., 1998; Stillings et al., 1996;see discussion below).
5.3.2. New groundwater wells and wells drilled in 1988Groundwater from the new groundwater wells differs
from groundwater from the wells drilled in 1988 with re-spect to their Sr isotope ratios and element ratios (Figs. 4and 6). As discussed above, this was mainly due to contam-ination by filter gravel in the new wells. However, due tothe lack of correlation between Ca concentrations and87Sr/86Sr ratios in the groundwater of the new wells, thelow 87Sr/86Sr ratios in the groundwater of the new wellscan in part be ascribed to another base cation source thanfilter gravel contamination. Apatite dissolution and prefer-ential release of non radiogenic Sr from feldspars would bein line with the low Sr isotope ratios (see discussion be-low). This confirms the conclusion, that apatite and prefer-ential release from feldspars play an important role for therelease of base cations in the initial phase of weathering aswas deduced from rock leachates.
In contrast, 87Sr/86Sr ratios in groundwater from wellsdrilled in 1988 (deep groundwater group I) are similar tothose of plagioclase (Fig. 4). However, Ca/Na ratios of thisgroup are between those of plagioclase and those of biotiteand apatite (Fig. 6). Moreover, water samples plot betweenfeldspars and biotite on the one hand and apatite leachsamples on the other hand in the PCA (Fig. 8). Thus, it isconcluded, that biotite and apatite have to be consideredas base cation sources for groundwater from the old wells.In fact, two different element sources like biotite and apa-tite dissolution could yield a Sr isotope ratio similar to thatof plagioclase (Bullen and Kendall, 1998). There is likely acontribution from plagioclase and feldspar to the buffercapacity of groundwater as well, but to an unknowndegree.
To summarize, except for biotite, that seems to play animportant role for the groundwater in the old wells, noclear differences of base cation sources between the oldand the new wells could be observed. Contamination by fil-ter gravel probably masks differences in the weatheringdegree between the two groups.
2900 C. Weyer et al. / Applied Geochemistry 23 (2008) 2888–2905
Author's personal copy
5.3.3. Time series of stream water and groundwater soluteconcentration and isotope ratios
It was assumed that the contribution of precipitation,soil solution and shallow groundwater component shouldincrease during extended high flow periods. In fact, Sr iso-tope ratios and Sr concentrations of stream water and ofgroundwater samples at well GW03a and GW04 becamemore similar to that of rainwater and soil solution fromupslope sites during the high water period (Fig. 4). In con-trast, temporal variability in well GW06 is almost negligi-ble. This is traced back to the fact that the groundwaterlevel in GW06 was much lower compared to GW03a andGW04. A similar decrease of 87Sr/86Sr ratios and Sr concen-trations in the stream was observed, e.g., by Clow et al.(1997) and by Åberg (1995). Åberg (1995) explained thisas the increasing contribution of rainwater to the streamwhich seems to hold for the Lehstenbach catchment aswell.
Throughfall 87Sr/86Sr ratios were modified compared tothose of open field precipitation (Fig. 6) due to dry deposi-tion on trees and leaching of needles (Graustein and Arm-strong, 1983; Gosz and Moore, 1989). The higher values ofthe second principal component (K, Rb) of throughfall sam-ples compared to open field precipitation can be ascribedto K and Rb leaching from the spruce-needles (Fig. 8).Potassium and Rb show very similar chemical propertiesand therefore similar chemical behaviour. The temporalvariability of the 87Sr/86Sr ratios and Sr concentrations inopen field precipitation and throughfall is attributed to fac-tors like the meteorological conditions (Graustein andArmstrong, 1983) and thus to variations of atmosphericcomposition.
To summarize, consistent patterns were found in thetime series of Sr isotope ratios and base cation concentra-tion in stream water and groundwater. However, this wasmainly due to an increasing fraction of soil water and pre-cipitation during high flow. Correspondingly, these timeseries could not be used to infer the varying contributionsof different minerals that prevail at different stages ofgranite weathering.
5.4. The weathering sequence
In spite of the restrictions discussed above, the data givesome information about the weathering sequence of theLehstenbach granite, similarly as has been found else-where (Bullen and Kendall, 1998; Bullen et al., 1997; Blumand Erel, 1997; Hodson et al., 1996; White et al., 2001).These results are summarized as follows.
5.4.1. Plagioclase and feldsparBeside quartz, plagioclase and feldspar are the prevail-
ing minerals. In spite of that, these minerals cannot be con-sidered as endmembers due to their low Ca/Na ratio(Fig. 6) and low factor values for the two principal compo-nents (Fig. 8). The plagioclase and feldspar sample from theFichtelgebirge region plot within the range of the Lehsten-bach groundwater samples. The calculated saturation indi-ces revealed that all deep groundwater samples areoversaturated with respect to plagioclase and feldspar. So-dium-rich plagioclase was found to be stable in river
waters and groundwaters with alkaline pH (pH 7–10)(Gı́slason and Arnórsson, 1993). This seems to hold forthe waters in the catchment as well (pH 5–7), althoughthe saturation state becomes pH dependent below pH 7.
However, the lower Sr isotope ratios and higher Ca/Naratios of the deep groundwater group II, i.e. the newwells-group, could in part be attributed to a preferentialrelease of non-radiogenic Sr yielding a Sr isotope ratio low-er than that of the bulk mineral in an initial stage of weath-ering as described for microcline and albite by Brantleyet al. (1998). Similar to Sr, high values of Ca and Na canbe observed early in dissolution (Stillings et al., 1996). Thisis corroborated by a lower Sr isotope ratio but a similar Ca/Na ratio of most of the solid rock leachates compared tothat of plagioclase and feldspar (Fig. 6).
The mixing of biotite and the dissolution of anotherbase cation source with a low Sr isotope ratio (apatite,preferential release from feldspars, liming) in deep ground-water may result in a 87Sr/86Sr ratio near to that of plagio-clase and feldspars (deep groundwater group I). Thus,plagioclase and feldspars certainly contribute to the buffercapacity of the groundwater in addition to biotite, apatiteand/or liming, although to unknown degrees. However,trace minerals like calcite or apatite can play a major rolein the chemical weathering of granitoid rocks despite theirminor fraction in the bedrock (White et al., 1999; Aubertet al., 2002; Oliva et al., 2004). This is corroborated by aCa excess found in many groundwater and surface watersamples relative to the plagioclase stoichiometry (e.g. Clowet al., 1997; Blum et al., 1998; White et al., 1999; Probstet al., 2000; Oliva et al., 2004).
5.4.2. BiotiteAccording to the results, the buffer capacity of the deep
groundwater is dominated by biotite weathering. All watersamples outside the wetlands were highly undersaturatedwith respect to biotite. Due to the high K and Rb concentra-tion, all data for biotite samples in the literature exhibitedhigh factor values for the second principal component. Cor-respondingly, some of the unweathered rock leachates andthe deep groundwater samples from the Lehstenbachcatchment had high factor values for this component(Fig. 8). This corresponds to the fact that biotite is consid-ered to be easily weathered (Blum and Erel, 1997; Bullenet al., 1997; Hodson et al., 1996). In contrast, Drever andClow (1995) argue that biotite weathering rates do not ex-ceed those of feldspars due to oxide coatings attached tothe minerals.
5.4.3. ApatiteApatite data in the literature exhibit a high variance of
element concentration and Sr isotope ratios that rendersa clear interpretation difficult (Bonhomme, 1967; VanGaans et al., 1995; Sun and Higgins, 1996; Tilton et al.,1997; Charoy, 1999; Sha and Chappell, 1999; Négrelet al., 2001). However, the apatite leachates analysed by Ir-ber (1996) could be regarded as a missing endmember forthe deep groundwater samples (Figs. 4, 6 and 8). Thesesamples were taken from granite in the Ore Mountains,but of the same age as the Lehstenbach catchment granite.The low Sr isotope ratio of 0.711416 is comparable with
C. Weyer et al. / Applied Geochemistry 23 (2008) 2888–2905 2901
Author's personal copy
the value of 0.709 given by Bonhomme (1967) for the Bré-zouard granite apatite in the Vosges mountains (France)and of 0.70679 by Négrel et al. (2001) for the Monzograniteapatite in the Vienne District (west of the french MassifCentral). All these rocks are about the same age between288 and 315 Ma.
As apatite is non radiogenic (Probst et al., 2000) and hasa low 87Sr/86Sr ratio, apatite dissolution would be in linewith the low Sr isotope ratios of deep groundwater II sam-ples and the second base cation source in addition to bio-tite of deep groundwater I samples. This hypothesiswould be consistent with the Rb/Sr ratios of the deepgroundwater samples that are very close to those of apatite(data not shown) and the higher Ca/Na ratios of nearly allwater samples compared to those of plagioclase (Fig. 6).Moreover, deep groundwater samples had high factor val-ues of the first principal component (Fig. 8), indicating animportant influence of a Ca- and Sr-rich source. Last butnot least, the groundwater samples were highly undersat-urated with respect to apatite.
According to Irber et al. (1997), apatite has to be consid-ered as a major host of Sr in the Lehstenbach granite. Theyfound between 1000 ppm for early-formed apatites to10,000 ppm in late formed apatite grains. Based on acidleaching experiments, several authors have found apatiteto be an easily soluble trace mineral releasing considerableamounts of Sr (Irber et al., 1997; Blum et al., 2002; Harla-van and Erel, 2002). Oliva et al. (2004) concluded that morethan 80% of the Ca export from the watershed can beattributed to the weathering of trace minerals (epidote,prehnite, apatite and bytownite). However, the dissolutionrate of apatite is pH dependent and is at its minimum atcircumneutral pH, corresponding to the range of pH 5–7in the waters in the Lehstenbach catchment (Wu and For-sling, 1995; Valsami-Jones et al., 1998; Guidry and McKen-zie, 2003). Although the dissolution rate of apatite dependsalso on factors such as the distance from equilibrium (Gui-dry and McKenzie, 2003), the carbonate content (Jahnke,1984) and the presence of weak acids (Tang et al., 2003),the dissolution rate of apatite is always higher than thoseof silicate minerals (feldspars, biotite), but lower thanthose of carbonates (calcite, dolomite).
Based on Sr isotope and element ratios, the influence ofapatite could not be distinguished from dolomite as a basecation source (Figs. 4 and 6). Only the greater distance ofapatite compared to that of dolomite from the 1:1 mixingline in the PCA plot and the considerations given abovewith respect to the role of liming for groundwater pointto apatite rather then to dolomite as the missingendmember.
To summarize, apatite seems to play a role as a base cat-ion source in the initial stage of weathering. However, itsinfluence is apparently obscured due to contamination byfilter gravel.
5.4.4. CalciteSeveral authors have found that disseminated calcite, a
very soluble trace mineral (e.g. Hodson et al., 1996), canhave an important influence on the chemical compositionof surface waters and groundwaters in crystalline catch-ments and can explain excess Ca (Clow et al., 1997; Blum
et al., 1998; White et al., 1999; Jacobson and Blum, 2000;Négrel et al., 2003). Clow et al. (1997) showed that weath-ering of calcite, present in trace amounts in silicate bed-rock (Loch Vale, Colorado) can account for between 43and 59% of the total Ca flux in stream water. Blum et al.(1998) found that the cation and HCO3 flux in a predomi-nantly silicate watershed within the High Himalayan Crys-talline Series is predominantly derived from dissolution ofa small amount of calcite (�1%).
The Sr isotope ratios of the unweathered rock leachatesdetermined in the study varied over a wide range indepen-dent of the number of leaching steps (Fig. 6). Thus, no sin-gle element source could be identified. Moreover, Srisotope ratios for trace calcite in granite vary between0.706 (Blomqvist et al., 2000) and 1.06962 (Clauer et al.,1989). However, in the study the Ca/Na ratios of the leach-ates were lower compared to the groundwater samples(Fig. 6), and the leachates plot in the opposite directionin the principal component diagrams, compared to calciteand apatite (Fig. 8). Furthermore, Besang et al. (1976) andStettner (1964) do not mention calcite as an accessorymineral in the granite bedrock in contrast to apatite. Thus,it is concluded that the role of calcite is negligible in theLehstenbach catchment.
6. Conclusions
The role of different minerals in base cation release,thus increasing the buffering capacity of groundwateragainst acid deposition, is controversially discussed in theliterature. The 87Sr/86Sr ratios and base cation concentra-tion in whole rock leachates, mineral separates, precipita-tion, soil solution, groundwater and stream watersamples in the Lehstenbach catchment (Germany) wereinvestigated to identify the weathering sequence of thegranite bedrock.
Feldspar weathering contributes to base cation release,but these minerals cannot be regarded as endmembers ofthe mixing diagram. Instead, biotite weathering playedan important role for base cation release. In addition, therewas some evidence that apatite played an important role inthe initial stage of weathering. There was no clear evidencefor a contribution from calcite. Correspondingly, base cat-ion input by atmospheric deposition and liming had onlyminor effects on groundwater buffer capacity.
The extensive study revealed some ambiguities andcoincidences that had to be investigated carefully. In con-trast to prior assumptions, the observed decrease of theSr isotope ratios in the stream during discharge peaks didnot reflect the contribution of a different weathering sys-tem in the upper aquifer layers, but was due to the in-creased contribution of precipitation and soil water. Theexceptionally high release of Ca in some wells shortly afterinstallation was in the first place due to contaminated filtergravel. In contrast, the observed decrease of the Sr isotoperatios in these wells was consistent with that of the drillingcore leachates, pointing to preferential cation release byfeldspars in an initial phase of weathering. Although theextensive data set yielded a puzzling picture at the firstsight, it was concluded that this critical mass of data wasnecessary to prevent premature inferences.
2902 C. Weyer et al. / Applied Geochemistry 23 (2008) 2888–2905

Author's personal copy
Acknowledgements
The authors are grateful to Andreas Kolb for samplingand the staff of the central analytical laboratory of BITÖKfor major and trace element analysis at the University ofBayreuth (Germany). We are also thankful to Nicole Morinand Joel Macé for 87Sr/86Sr analysis, to Martine Le Coz-Bouhnik for major and trace element analysis and to Mar-ie-Annick Chassonneau from the Geoscience Institute ofthe University of Rennes 1 (France) for help in mineral sep-aration. This work was funded by the German Federal Min-istry for Education, Science, Research and Technology(BMBF) under grant no. PT BEO 51-0339476 D and the Ger-man Research Foundation (DFG) within the research groupFOR 562.
References
Åberg, G., 1995. The use of natural strontium isotopes as tracers inenvironmental studies. Water Air Soil Pollut. 79, 309–322.
Åberg, G., Jacks, G., Hamilton, P.J., 1989. Weathering rates and 87Sr/86Srratios: an isotopic approach. J. Hydrol. 109, 65–78.
Alewell, C., Manderscheid, B., Gerstberger, P., Matzner, E., 2000. Effects ofreduced atmospheric deposition on soil solution chemistry andelemental contents of spruce needles in NE-Bavaria, Germany. J.Plant Nutr. Soil Sci. 163, 509–516.
April, R., Newton, R., Truettner Coles, L., 1986. Chemical weathering intwo Adirondack watersheds: past and present-day rates. Geol. Soc.Am. Bull. 97, 1232–1238.
Armbruster, M., Abiy, M., Feger, K.H., 2003. The biogeochemistry of twoforested catchments in the Black Forest and the Eastern oreMountains (Germany). Biogeochem. 65, 341–368.
Aubert, D., Probst, A., Stille, P., Viville, D., 2002. Evidence of hydrologicalcontrol of Sr behavior in stream water (Strengbach catchment, Vosgesmountains, France). Appl. Geochem. 17, 285–300.
Bailey, S.W., Hornbeck, J.W., Driscoll, C.T., Gaudette, H.E., 1996. Calciuminputs and transport in a base-poor forest ecosystem as interpretedby Sr isotopes. Water Resour. Res. 32, 707–719.
Bain, D.C., Bacon, J.R., 1994. Strontium isotopes as indicators of mineralweathering in catchments. Catena 22, 201–214.
Besang, C., Harre, W., Kreuzer, H., Lenz, H., Müller, P., Wendt, I., 1976.Radiometrische datierung, geochemische und petrographischeuntersuchungen der fichtelgebirgsgranite. Geol. Jahrb. E 8, 3–71.
Blomqvist, R., Ruskeeniemi, T., Kaija, J., Ahonen, L., Paananen, M., Smellie,J., Grundfelt, B., Pedersen, K., Bruno, J., Pérez del Villar, L., Cera, E.,Rasilainen, K., Pitkänen, P., Suksi, J., Casanova, J., Read, D., Frape, S.2000. The Palmottu Natural Analogue Project. Phase II: Transport ofRadionuclides in a Natural Flow System at Palmottu. EuropeanCommission, Brussels (EUR19611), Luxembourg.
Blum, J.D., Erel, Y., 1997. Rb-Sr isotope systematics of a granitic soilchronosequence: the importance of biotite weathering. Geochim.Cosmochim. Acta 61, 3193–3204.
Blum, J.D., Erel, Y., Brown, K., 1994. 87Sr/86Sr ratios of Sierra Nevadastream waters: implications for relative mineral weathering rates.Geochim. Cosmochim. Acta 58, 5019–5025.
Blum, J.D., Gazis, C.A., Jacobson, A.D., Chamberlain, C.P., 1998. Carbonateversus silicate weathering in the Raikhot watershed within the highHimalayan cristalline series. Geology 26, 411–414.
Blum, J.D., Klaue, A., Nezat, C.A., Driscoff, C.T., Johnson, C.E., Siccama, T.G.,Eagar, C., Fahey, T.J., Likens, G.E., 2002. Mycorrhizal weathering ofapatite as an important calcium source in base-poor forestecosystems. Nature 417, 729–731.
Bonhomme, M., 1967. Ages radiométriques de quelques granites desvosges moyennes. Bull. Carte Géologique Alsace Lorraine 20,101–106.
Brantley, S.L., Chesley, J.T., Stillings, L.L., 1998. Isotopic ratios and releaseof strontium measured from weathering feldspars. Geochim.Cosmochim. Acta 62, 1493–1500.
Bullen, T.D., Kendall, C., 1998. Tracing of weathering reactions and waterflowpaths: a multi-isotope approach. In: Kendall, C., McDonell, J.J.(Eds.), Isotope Tracers in Catchment Hydrology. Elsevier Science BV,Amsterdam, pp. 611–646.
Bullen, T.D., White, A., Blum, A., Harden, J., Schulz, M., 1997. Chemicalweathering of a soil chronosequence on granitoid alluvium: II.
Mineralogic and isotopic constraints on the behavior of strontium.Geochim. Cosmochim. Acta 61, 291–306.
Busch, G., Lammel, G., Beese, F.O., Feichter, J., Dentener, F.J., Roelofs, G.J.,2001. Forest ecosystems and the changing patterns of nitrogen inputand acid deposition today and in the future based on a scenario.Environ. Sci. Pollut. Res. 8, 95–102.
Casey, W.H., Banfield, J.F., Westrich, H.R., McLaughlin, L., 1993. What dodissolution experiments tell us about natural weathering? Chem.Geol. 105, 1–15.
Charoy, B., 1999. Beryllium speciation in evolved granitic magmas:phosphates versus silicates. Eur. J. Mineral. 11, 135–148.
Christoffersen, N., Seip, H.M., 1982. A model for streamwater chemistry atBirkenes, Norway. Water Resour. Res. 18, 977–996.
Clauer, N., Frape, S.K., Fritz, B., 1989. Calcite veins of Stripa granite(Sweden) as records of the origin of the groundwaters and theirinteractions with the granitic body. Geochim. Cosmochim. Acta 53,1777–1781.
Clow, D.W., Mast, M.A., Bullen, T.D., Turk, J.T., 1997. Strontium 87/strontium 86 as a tracer of mineral weathering reactions and calciumsources in an alpine/subalpine watershed, Loch Vale, Colorado. WaterResour. Res. 33, 1335–1351.
Cook, J.M., Edmunds, W.M., Robins, N.S., 1991. Groundwater contributionto an acid upland lake (Loch Fleet, Scotland) and the possibilities foramelioration. J. Hydrol. 125, 111–128.
Davies, T.D., Tranter, M., Wigington Jr., P.J., Eshleman, K.N., 1992. ‘Acidicepisodes’ in surface waters in Europe. J. Hydrol. 132, 25–69.
Dorland, E., van den Berg, L.J.L., Brouwer, E., Roelofs, J.G.M., Bobbink, R.,2005. Catchment liming to restore degraded, acidified heathlands andmoorland pools. Restor. Ecol. 13, 302–311.
Drever, J.I., Clow, D.W., 1995. Weathering rates in catchments. In:White, A. (Ed.), Chemical Weathering Rates of Silicate Minerals.Reviews in Mineralogy, 31. Mineralogical Society of America, pp.464–483.
Driscoll, C.T., Cirmo, C.P., Fahey, T.J., Biette, V.L., Bukaveckas, P.A., Burns,D.A., Gubala, C.P., Leopold, D.J., Newton, R.M., Raynal, D.J., Schofield,C.L., Yavitt, J.B., Porcella, D.B., 1996. The experimental watershedliming study: comparison of lake and watershed neutralizationstrategies. Biogeochem. 32, 143–174.
Drouet, T., Herbauts, J., Demaiffe, D., 2005. Long-term records ofstrontium isotopic composition in tree rings suggest changes inforest calcium sources in the early 20th century. Global Change Biol.11, 1926–1940.
Faure, G., 2001. Origin of Igneous Rocks, The Isotopic Evidence. Springer-Verlag, Berlin, Heidelberg.
Fouke, B.W., Beets, C.J., Meyers, W.J., Hanson, G.N., Melillo, A.J., 1996. Sr-87/Sr-86 chronostratigraphy and dolomitization history of the SeroeDomi formation, Curacao (Netherlands Antilles). Facies 35, 293–320.
Frank, J., Stuanes, A.O., 2003. Short-term effects of liming and vitalityfertilization on forest soil and nutrient leaching in a scots pineecosystem in Norway. Forest Ecol. Manage. 176, 371–386.
Frape, S.K., Fritz, P., McNutt, R.H., 1984. Water–rock interaction andchemistry of groundwaters from the Canadian Shield. Geochim.Cosmochim. Acta 48, 1617–1627.
Fritz, B., Richard, L., McNutt, R.H., 1992. Geochemical modelling of Srisotopic signatures in the interaction between granitic rocks andnatural solutions. In: Kharaka, Y.K., Maest, A.S. (Eds.), Proceedings of7th International Conference Water–Rock Interaction. Balkema,Rotterdam, Netherlands, pp. 927–930.
Geary, R.J., Driscoll, C.T., 1996. Forest soil solutions: acid/base chemistryand response to calcite treatment. Biogeochem. 32, 195–220.
Gerstberger, P., Foken, T., Kalbitz, K., 2004. The Lehstenbach andSteinkreuz Catchments in NE Bavaria, Germany. In: Matzner, E.(Ed.), Biogeochemistry of Forested Catchments in a ChangingEnvironment – A German Case Study. Ecological Studies, vol. 172.Springer-Verlag, pp. 15–41.
Gı́slason, S.R., Arnórsson, S., 1993. Dissolution of primary basalticminerals in natural waters: saturation state and kinetics. Chem.Geol. 105, 117–135.
Gosselin, D.C., Harvey, F.E., Frost, C., Stotler, R., Mcfarlane, P.A., 2004.Strontium isotope geochemistry of groundwater in the central part ofthe Dakota (Great Plains) aquifer, USA. Appl. Geochem. 19, 359–377.
Gosz, J.R., Moore, D.I., 1989. Strontium isotope studies of atmosphericinputs to forested watersheds in New Mexico. Biogeochem. 8, 115–134.
Graustein, W.C., Armstrong, R.L., 1983. The use of strontium-87/strontium-86 ratios to measure atmospheric transport into forestedwatersheds. Science 219, 289–292.
Guidry, M.W., McKenzie, F.T., 2003. Experimental study of igneous andsedimentary apatite dissolution: control of ph, distance from
C. Weyer et al. / Applied Geochemistry 23 (2008) 2888–2905 2903
Author's personal copy
equilibrium, and temperature on dissolution rates. Geochim.Cosmochim. Acta 67, 2949–2963.
Gunn, J., Sein, R., Keller, B., Beckett, P., 2001. Liming of acid and metalcontaminated catchments fort he improvement of drainage waterquality. Water Air Soil Pollut. 130, 1439–1444.
Harlavan, Y., Erel, Y., 2002. The release of Pb and REE from granitoids bythe dissolution of accessory phases. Geochim. Cosmochim. Acta 66,837–848.
Harrington, G.A., Herczeg, A.L., 2003. The importance of silicateweathering of a sedimentary aquifer in arid central Australiaindicated by very high 87Sr/86Sr ratios. Chem. Geol. 199, 281–292.
Hindar, A., Wright, R.F., Nilsen, P., Larssen, T., Høgberget, R., 2003. Effectson stream water chemistry and forest vitality after whole-catchmentapplication of dolomite to a forest ecosystem in southern Norway.Forest Ecol. Manage. 180, 509–525.
Hodson, M.E., Langan, S.J., Wilson, M.J., 1996. A sensitivity analysis of thePROFILE model in relation to the calculation of soil weathering rates.Appl. Geochem. 11, 835–844.
Irber, W., 1996. Laugungsexperimente an Peraluminischen Graniten alsSonde für Alterationsprozesse im Finalen Stadium derGranitkristallisation mit Anwendung auf das Rb-Sr-Isotopensystem.PhD Thesis, FU Berlin.
Irber, W., Förster, H.-J., Hecht, L., Möller, P., Morteani, G., 1997.Experimental, geochemical, mineralogical and O-isotope constraintson the late-magmatic history of the Fichtelgebirge granites(Germany). Geol. Runds. 86, S110–S124.
Jacobson, A.D., Blum, J.D., 2000. Ca/Sr and 87Sr/86Sr geochemistry ofdisseminated calcite in Himalayan silicate rocks from Nanga Parbat:influence on river-water chemistry. Geology 28, 463–466.
Jahnke, R.A., 1984. The synthesis and solubility of carbonate flourapatite.Am. J. Sci. 284, 58–78.
Kay, R.L.F., Darbyshire, D.P.F., 1986. A strontium isotope study ofgroundwater–rock interaction in the carnmenellis granite. In:Hitchon, B. (Ed.), 5th International Symposium Water–RockInteraction, Reykjavik, Iceland, pp. 329–332.
Kloppmann, W., Matray, J.M., Aranyossy, J.F., 2001. Contamination of deepformation waters by drilling fluids: correction of the chemical andisotopic composition and evaluation of errors. Appl. Geochem. 16,1083–1096.
Likens, G.E., Driscoll, C.T., Buso, D.C., Mitchell, M.J., Lovett, G.M., Bailey,S.W., Sicaama, T.G., Reiners, W.A., Alewell, C., 2002. Biogeochem. 60,235–316.
Likens, G.E., Driscoll, C.T., Buso, D.C., Siccama, T.G., Johnson, C.E., Lovett,G.M., Fahey, T.J., Reiners, W.A., Ryan, D.F., Martin, C.W., Bailey, S.W.,1998. The biogeochemistry of calcium at Hubbard Brook.Biogeochem. 41, 89–173.
Lischeid, G., Alewell, C., Moritz, K., Bittersohl, J., 2004b. Trends in theinput–output relations: the catchment budgets. In: Matzner, E. (Ed.),Biogeochemistry of Forested Catchments in a Changing Environment–A German Case Study. Ecological Studies, 172. Springer-Verlag, pp.437–454.
Lischeid, G., Kolb, A., Alewell, C., 2002. Apparent translatory flow ingroundwater recharge and runoff generation. J. Hydrol. 265, 195–211.
Lischeid, G., Lange, H., Moritz, K., Büttcher, H., 2004a. Dynamics of runoffand runoff chemistry at the Lehstenbach and Steinkreuz catchment.In: Matzner, E. (Ed.), Biogeochemistry of Forested Catchments in aChanging Environment – A German Case Study. Ecological Studies,172. Springer-Verlag, pp. 399–436.
Lorz, C., Hruska, J., Kram, P., 2003. Modeling and monitoring of long-termacidification in an upland catchment of the Western Ore Mountains,SE Germany. Sci. Total Environ. 310, 153–161.
Malard, F., Datry, T., Gibert, J., 2005. Subsurface sediment contaminationduring borehole drilling with an air-actuated down-hole hammer. J.Contam. Hydrol. 79, 156–164.
Matzner, E., Zuber, T., Alewell, C., Lischeid, G., Moritz, K., 2004. Trends indeposition and canopy leaching of mineral elements as indicated bybulk deposition and throughfall measurements. In: Matzner, E. (Ed.),Biogeochemistry of Forested Catchments in a Changing Environment– A German Case Study. Ecological Studies, 172. Springer-Verlag, pp.233–250.
Miller, E.K., Blum, J.D., Friedland, A.J., 1993. Determination of soilexchangeable-cation loss and weathering rates using Sr isotopes.Nature 362, 438–441.
Moncoulon, D., Probst, A., Party, J.P., 2004. Weathering, atmosphericdeposition and vegetation uptake: role for ecosystem sensitivity toacid deposition and critical load. Compte. Rend. Geosci. 336,1417–1426.
Neal, C., Hill, T., Alexander, S., Reynolds, B., Hill, S., Dixon, A.J., Harrow, M.,Neal, M., Smith, C.J., 1997. Stream water quality in acid sensitive UK
upland areas; an example of potential water quality remediationbased on groundwater manipulation. Hydrol. Earth Syst. Sci. 1,185–196.
Neal, C., Robson, A., Smith, C.J., 1990a. Acid neutralization capacityvariations for the Hafren forest stream, mid-wales: inferences forhydrological processes. J. Hydrol. 121, 85–101.
Neal, C., Smith, C.J., Walls, J., Billingham, P., Hill, S., Neal, M., 1990b.Hydrogeochemical variations in Hafren forest stream waters, mid-wales. J. Hydrol. 116, 185–200.
Négrel, P., Casanova, J., Aranyossy, J.-F., 2001. Strontium isotopesystematics used to decipher the origin of groundwaters sampledfrom granitoids: the Vienne Case (France). Chem. Geol. 177, 287–308.
Négrel, P., Casanova, J., Blomqvist, R., Kaija, J., Frape, S., 2003. Strontiumisotopic characterization of the Palmottu hydrosystem (Finland):water–rock interaction and geochemistry of groundwaters. Geofluids3, 161–175.
Oliva, P., Dupré, B., Martin, F., Viers, J., 2004. The role of trace minerals inchemical weathering in a high-elevation granitic watershed (Estibère,France): chemical and mineralogical evidence. Geochim. Cosmochim.Acta 68, 2223–2244.
Peters, N.E., Cerny, J., Havel, M., Krejci, R., 1999. Temporal trends of bulkprecipitation and stream water chemistry (1977–1997) in a smallforested area, Krusne hory, northern Bohemia, Czech Republic.Hydrolog. Process. 13, 2721–2741.
Probst, A., El Gh’mari, A., Aubert, D., Fritz, B., McNutt, R., 2000. Strontiumas a tracer of weathering processes in a silicate catchment polluted byacid atmospheric inputs, Strengbach, France. Chem. Geol. 170,203–219.
Probst, A., Party, J.P., Fevrier, C., Dambrine, E., Thomas, A.L., Stussi, J.M.,1999. Evidence of springwater acidification in the Vosges mountains(North-East of France): Influence of bedrock buffering capacity. WaterAir Soil Pollut. 114, 395–411.
Qing, H., Bosence, D.W.J., Rose, E.P.F., 2001. Dolomitization by penesalinesea water in Early Jurassic peritidal platform carbonates, Gibraltar,western Mediterranean. Sedimentol. 48, 153–163.
Reynolds, B., Neal, C., Hornung, M., Stevens, P.A., 1986. Baseflow bufferingof streamwater acidity in five mid-wales catchments. J. Hydrol. 87,167–185.
Richter, P., Stettner, G., 1979. Geochemische und petrographischeUntersuchungen der Fichtelgebirgsgranite. Geologica Bavarica 78,Bayerisches Geologisches Landesamt, München.
Sha, L.-K., Chappell, B.W., 1999. Apatite chemical composition,determined by electron microprobe and laser-ablation inductivelycoupled plasma mass spectrometry, as a probe into granitepetrogenesis. Geochim. Cosmochim. Acta 63, 3861–3881.
Siebel, W., 1995. Constraints on Variscan granite emplacement in north-east Bavaria, Germany: further clues from a petrogenetic study of theMitterteich granite. Geol. Runds. 84, 384–398.
Siebel, W., Trzebski, R., Stettner, G., Hecht, L., Casten, U., Höhndorf, A.,Müller, P., 1997. Granitoid magmatism of the NW Bohemian massifrevealed: gravity data, composition, age relations and phase concept.Geol. Runds. 86, S45–S63.
Sillen, A., Hall, G., Richardson, S., Armstrong, R., 1998. 87Sr/86Sr ratios inmodern and fossil food-webs of the Sterkfontein Valley: implicationsfor early hominid habitat preference. Geochim. Cosmochim. Acta 62,2463–2473.
Stettner, G., 1964. Erläuterungen zur Geologischen Karte von Bayern1:25000, Blatt Nr. 5837 Weißenstadt. Bayerisches GeologischesLandesamt, München.
Stillings, L.L., Drever, J.L., Brantley, S.L., Sun, Y., Oxburgh, R., 1996. Rates offeldspar dissolution at pH 3–7 with 0–8 mM oxalic acid. Chem. Geol.132, 79–90.
Stoddard, J.L., Jeffries, D.S., Lükewille, A., Clair, T.A., Dillon, P.J., Driscoll,C.T., Forsius, M., Johannessen, M., Kahl, J.S., Kellogg, J.H., Kemp, A.,Mannio, J., Monteith, D.T., Murdoch, P.S., Patrick, S., Rebsdorf, A.,Skjelkvale, B.L., Stainton, M.P., Traaen, T., van Dam, H., Webster, K.E.,Wieting, J., Wilander, A., 1999. Regional trends in aquatic recoveryfrom acidification in North America and Europe. Nature 401,575–578.
Sun, S., Higgins, N.C., 1996. Neodymium and strontium isotope study ofthe Blue Tier Batholith, NE Tasmania, and its bearing on the origin oftin-bearing alkali feldspar granites. Ore Geol. Rev. 10, 339–365.
Tang, R., Hass, M., Wu, W., Gulde, S., Nancollas, G.H., 2003. Constantcomposition dissolution of mixed phases. II. Selective dissolution ofcalcium phosphates. Colloid Interface Sci. 260, 379–384.
Tilton, G.R., Ames, L., Schertl, H.P., Schreyer, W., 1997. Reconnaissanceisotopic investigations on rocks of an undeformed granite contactwithin the coesite-bearing unit of the Dora Maira Massif. Lithos 41,25–36.
2904 C. Weyer et al. / Applied Geochemistry 23 (2008) 2888–2905

Author's personal copy
Traaen, T.S., Frogner, T., Hindar, A., Kleiven, E., Lande, A., Wright, R.F.,1997. Whole-catchment liming at Tjønnstrond, Norway: an 11-yearrecord. Water Air Soil Pollut. 94, 163–180.
Valsami-Jones, E., Ragnarsdottir, K.V., Putnis, A., Bosbach, D., Kemp, A.J.,Cressey, G., 1998. The dissolution of apatite in the presence ofaqueous metal cations at pH 2–7. Chem. Geol. 151, 215–233.
Van Gaans, P.F.M., Vriend, S.P., Poorter, R.P.E., 1995. Hydrothermalprocesses and shifting element association patterns in the W-Snenriched granite of Regoufe, Portugal. J. Geochem. Explor. 55,203–222.
White, A.F., Bullen, T.D., Schulz, M.S., Blum, A.E., Huntington, T.G., Peters,N.E., 2001. Differential rates of feldspar weathering in graniticregoliths. Geochim. Cosmochim. Acta 65, 847–869.
White, A.F., Bullen, T.D., Vivit, D.V., Schulz, M.S., Clow, D.W., 1999. Therole of diseminated calcite in the chemical weathering of granitoidrocks. Geochim. Cosmochim. Acta 63, 1939–1953.
Wickman, T., Jacks, G., 1992. Strontium isotopes in weathering budgeting. In:Kharaka, Y.K., Maest, A.S. (Eds.), Proceedings of 7th InternationalConference Water–Rock Interaction. Balkema, Rotterdam, pp. 611–614.
Wu, L., Forsling, W., 1995. Surface complexation of calcium minerals inaqeous solution. III. Ion exchange and acid-base-properties of hydrousfluorite surfaces. J. Colloid Interface Sci. 174, 178–184.
Zachariah, J.K., Bhaskar Rao, Y.J., Srinivasan, R., Gopalan, K., 1999. Pb, Srand Nd isotope systematics of uranium mineralised stromatoliticdolomites from the proterozoic Cuddapah supergroup, south India:constraints on age and provenance. Chem. Geol. 162, 49–64.
C. Weyer et al. / Applied Geochemistry 23 (2008) 2888–2905 2905
Copyright © 2022 FDOKUMEN