
Dilation in granite during servo-controlled triaxial strength tests

Speciation of Actinides in Granite Subjected
to Tracer Studies
Melissa A. Denecke, Wout de Nolf, Alexander Rack, Remi Tucoulou,
Tonya Vitova, Gerald Falkenberg, Sousan Abolhassani,
Peter Cloetens, and Bernhard Kienzler
Abstract Tomographic studies of granite from the Asp€o Underground Laboratory inSweden are performed to understand the observed release of natural uranium in
column studies upon application of groundwater flow. X-ray phase-sensitive tomog-
raphy images reconstructed from in-line X-ray phase contrasted radiographs were
compared with scanning fluorescence tomography reconstructions. The latter are
based on sinograms of X-ray emission lines recorded with spatial resolution on a
nanometer scale for a granite rock containingU after being subjected to a radionuclide
tracer experiment. The results show that the U distribution follows microfissures or
pores in the granite.Naturally occurringTh is revealed to be intimately associatedwith
what appears to be feldspar, suggesting its being present as a dopant ion in the mineral
structure. Neptunium tracer was not found in a sample prepared using FIB lift-out
techniques, although the presence of Np was identified in the original granite piece
during screening experiments prior to FIB-ing. The Np-containing part of the sample
broke off during the preparation. Although this case study was limited to only three
M.A. Denecke (*), T. Vitova, and B. Kienzler
Karlsruhe Institute of Technology, Institute for Nuclear Waste Disposal, P.O. Box 3640 76021
Karlsruhe, Germany
e-mail: [email protected], [email protected], [email protected]
W. de Nolf
Department of Chemistry, University of Antwerp, Universiteitsplein 1, 2610 Antwerp, Belgium
e-mail: [email protected]
A. Rack, R. Tucoulou, and P. Cloetens
European Synchrotron Radiation Facility, 6 rue Jules Horowitz, 38043 Grenoble Cedex, France
e-mail: [email protected], [email protected], [email protected]
G. Falkenberg
HASYLAB at DESY, Notkestr. 85, 22607 Hamburg, Germany
e-mail: [email protected]
S. Abolhassani
Laboratory for Materials Behaviour, Paul-Scherrer-Insitute, CH-5232 Villigen PSI Villigen,
Switzerland
e-mail: [email protected]
S.N. Kalmykov and M.A. Denecke (eds.), Actinide Nanoparticle Research,DOI 10.1007/978-3-642-11432-8_16, # Springer-Verlag Berlin Heidelberg 2011
413

samples, initial interpretation of results confirm that Th is less likely thanU to become
mobile in groundwater upon drilling and excavation of emplacement caverns and
shafts for a nuclear waste repository in granite bedrock.
1 Introduction
Granite is considered a potential host rock for the disposal of radioactive wastes
notably in the Nordic countries Sweden and Finland. The retention properties of
pristine and altered granite are to this end of utmost importance. Granite generally
contains varying natural amounts of uranium and thorium. The natural background
of these elements poses a potential source for these actinide elements, should they
dissolve and enter groundwater upon drilling and excavation of shafts and deposi-
tion tunnels for emplacement of the waste packages in the granite host rock for a
nuclear waste repository. Elution of natural uranium (nat-U) from the host granite
rock during migration experiments performed on granite drill cores from the Asp€oHard Rock Laboratory (HRL) in Sweden has been reported to be significant [1].
The concentrations of nat-U in the granite rock bore cores at Asp€o HRL are on the
order of around 5 mg/g and associated groundwater nat-U borehole concentration on
the order of 1 E–10 mol/L. The concentrations of natural 238U eluted during tracer
migration experiments in the Asp€o granite experiment was reported to exceed the233U tracer concentrations significantly. Apart from experimentally induced break-
through peaks, the 238U concentration was in the range of 2–4 � 10�7 mol/l. These
values surmount the U concentration of the groundwater as well as the calculated
solubility of U(IV) minerals. The nat-U initial breakthrough was eluted faster than
the inert tritiated water (HTO) in the tracer cocktail. This indicates that the nat-U
was already present in the groundwater, filling the granite fractures in significant
amounts prior to the tracer experiments. The nat-U released exhibits repeated
breakthrough-like elution curves following interruption and subsequent restarting
of granite core column flushing. The amount nat-U released is greater than expected
from simple dissolution of low soluble U(IV) species. The interpretation of these
results is that after drilling and during storage, the cores were in contact with air,
which led to oxidation of naturally occurring U(IV) species in the granite to more
soluble U(VI) species.
Granite also contains natural levels of thorium in amounts similar to that for U
(4–8 mg/g) at Asp€o. Thorium is redox insensitive and is present in tetravalent form
under natural conditions with a stable Rn electron shell configuration. No break-
through for nat-Th was observed in column migration studies. For this reason, we
performed a comparative study of the distribution of uranium and thorium in granite
pieces stemming from a bore core column migration study, in order to ascertain
if differences in their spatial distributions relative to micropores of the granite exist.
No 233U was in the tracer cocktail introduced onto this particular column in the
experiment. The tracer cocktail did contain 237Np(V) and 241Am, and previous X-ray
fluorescence and X-ray absorption near edge structure spectroscopy investiga-
tions performed using an X-ray beam with micrometer dimensions and confocal
414 M.A. Denecke et al.

excitation/detection geometry (confocal m-XRF/m-XANES) revealed neptunium to
be immobilized in the granite as Np(IV) localized within microfissures having
dimensions on the order of tens of microns [2]. Due to the small size of fissures
where neptunium was immobilized, we selected to perform the comparative inves-
tigations presented here using a submicron spatial resolution. Our original intention
was also to determine if the immobilized Np(IV) “hot spots” are present as
precipitated hydrolysis (particulate) products or if they are present as sorbed Np
localized at regions on the fissure walls. This difference in species, particulate
versus sorbed species, is crucial for predicting potential remobilization of Np into
flowing groundwater. However, during focused ion beam (FIB) preparation of a
piece of granite, which exhibited Np La1 and Lb1 intensity in m-XRF screening
experiments to select appropriate pieces for the investigation (see below), the
sample broke at a fissure seam. As no Np was found remaining on the sample, we
assume that the Np was lost with the piece that broke off.
The chapter is structured as follows. Details of the sample preparation and
experimental details of the screening and tomography studies, including their
reconstruction using measured sinograms of X-ray emission lines and radiograms
are presented first. The results of the studies are then presented and discussed in
detail. In the concluding remarks, we discuss the lessons learned from this investi-
gation and the implications of the results for nuclear waste disposal in thorium/
uranium-containing granite.
2 Experimental
2.1 Sample Preparation
The granite pieces investigated stem from the same Asp€o granite bore core section,where previous investigations identified Np(IV) in a posttracer experiment men-
tioned above [2]. Initially, the granite section was cut into small pieces and mounted
onto a quartz slide using an acrylic resin. By means of repeated grinding, recutting,
and mounting, pieces with dimensions less than 1 mm were obtained. These pieces
were then screened for their elemental content using scanning m-XRF at Hamburg
Synchrotron Radiation Laboratory (HASYLAB) experimental station BL-L. Three
granite pieces, which were observed to exhibit X-ray emission lines for Np, Th, andU,
were selected for further study at the ID22NI station at the European Synchrotron
Radiation Facility (ESRF) and designated as sample 1, sample 3, and sample 6,
respectively. Sample 1 was downsized further using an FIB.
2.1.1 Sample 1
An optical microscopic image of sample 1 before FIB extraction of a suitable sized
piece, its Fe, Np, and Zn distributions, the FIB-cut sample 1 mounted on its copper
Speciation of Actinides in Granite Subjected to Tracer Studies 415

sample holder, and the key stages of FIB preparation are depicted in Fig. 1a–f,
respectively. A Zeiss NVision40 instrument was used for FIB sample preparation,
equipped with a Ga liquid metal ion source and a field emission electron source; the
scanning electron microscope (SEM) column is a GEMINI high resolution column.
Sample 1 was freed from embedding resin prior to FIB milling and subsequently
mounted in the correct orientation for milling. As large amounts of material had to
be removed, the sample was milled at 30 kV with a beam current of 27 nA and 3 nA.
An approximately 60 � 25 mm2 pillar-shaped section (selected from the region at
right angles where a diagonal line of Np La intensity was measured near the corner
of the granite piece, see Fig. 1b) was cut using the lift-out FIB technique. The FIB
lift-out technique is well known for sample preparation for transition electron
microscope (TEM) studies [3]. In this technique, the sample is cut directly from
the “bulk” specimen using FIB (Fig. 1d), lifted out with a micromanipulator (the cut
sample and attached micromanipulator are visible at the bottom of Fig. 1e) and
transferred to a copper sample holder (Fig. 1f). The copper holder is mounted onto a
standard SEM holder, which fits onto the ID22NI sample holder.
2.1.2 Sample 3
Sample 3 was used without any further treatment than the repeated cutting and
grinding (Fig. 2a), by simply removing the resin-mounted sample of approximately
Fe U
240 µm
Np
~60 µm
23 µm
60 µm
420
µm
450
µm
a b c
d e f
Fig. 1 Sample 1 screening and preparation. (a) Microscopic image of an approximately
250 � 450 mm2 granite piece before FIB lift-out to prepare sample 1. (b) 2D elemental distribution
screening results. The maps are made from Fe Ka, U La1, and Np La1 intensities measured with
scanning m-XRF (step size ¼ 20 mm; counting time ¼ 7 s). Np appears along a diagonal across the
lower right corner, likely localized in a micro fissure. (c) Micrograph of sample 1 pillar approxi-
mately 60 mm long, after FIB lift-out and mounting on a copper holder. SEM images of: (d) FIB
trenches during cutting of the sample 1 pillar. The sample silhouette is indicated by dotted lines. (e)Lift-out using a W tip micromanipulator attached to the sample with sputtered carbon. (f) The final
60 � 23 mm2 pillar shaped sample 1 after transferring and mounting onto a copper sample holder
416 M.A. Denecke et al.

500 � 340 mm2 dimensions from the glass slide (Fig. 2c). The sample on the resin
was mounted on a capillary tip, which was placed on an IUCr standard brass pin.
The m-XRF screening showed sample 3 to contain U, especially near one corner
(Fig. 2b). This corner of the sample was placed in the beam path for the tomography
studies (Fig. 2d) by mounting and aligning the capillary plus sample onto an IUCr
standard eucentric goniometer head. This goniometer head can be directly mounted
onto the sample positioning system at ID22NI.
2.1.3 Sample 6
Screening results of a rectangular section of the precut and ground sample 6
(Fig. 3a) using m-XRF showed this section to contain a significant amount of Th
a b
resin
sample
c
~250 µm
d
Fig. 2 (a) Micrograph of prethinned sample 3 embedded in resin on a glass slide mount. (b) 2D
distribution scanning m-XRF results for Fe, Sr, Ba, and U (500 � 340 mm2, step size ¼ 20 mm;
counting time ¼ 7 s). (c) Profile of sample removed from slide mount. (d) Projection radiograph of
the corner of sample 3 placed in the beam path for the tomographic scan. The field of view is
(250 mm)2. The embedding resin used for cutting and grinding the sample is visible on the left
Speciation of Actinides in Granite Subjected to Tracer Studies 417
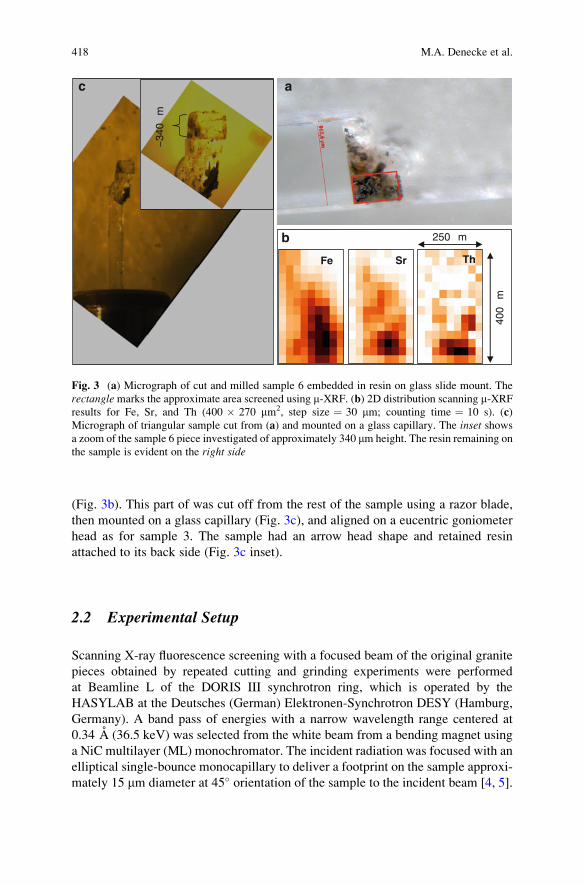
(Fig. 3b). This part of was cut off from the rest of the sample using a razor blade,
then mounted on a glass capillary (Fig. 3c), and aligned on a eucentric goniometer
head as for sample 3. The sample had an arrow head shape and retained resin
attached to its back side (Fig. 3c inset).
2.2 Experimental Setup
Scanning X-ray fluorescence screening with a focused beam of the original granite
pieces obtained by repeated cutting and grinding experiments were performed
at Beamline L of the DORIS III synchrotron ring, which is operated by the
HASYLAB at the Deutsches (German) Elektronen-Synchrotron DESY (Hamburg,
Germany). A band pass of energies with a narrow wavelength range centered at
0.34 A (36.5 keV) was selected from the white beam from a bending magnet using
a NiC multilayer (ML) monochromator. The incident radiation was focused with an
elliptical single-bounce monocapillary to deliver a footprint on the sample approxi-
mately 15 mm diameter at 45� orientation of the sample to the incident beam [4, 5].
SrFe
400
µm
Th
250 µm
~34
0µm
a
b
c
Fig. 3 (a) Micrograph of cut and milled sample 6 embedded in resin on glass slide mount. The
rectangle marks the approximate area screened using m-XRF. (b) 2D distribution scanning m-XRFresults for Fe, Sr, and Th (400 � 270 mm2, step size ¼ 30 mm; counting time ¼ 10 s). (c)
Micrograph of triangular sample cut from (a) and mounted on a glass capillary. The inset showsa zoom of the sample 6 piece investigated of approximately 340 mm height. The resin remaining on
the sample is evident on the right side
418 M.A. Denecke et al.

The sample was mounted on an x, y positioning stage to scan in a step-by-step
fashion (i.e., pixel by pixel in generally 20 mm steps) over selected sample areas.
The fluorescence emitted by the sample was detected at an angle of 90� to the
incoming beam using either a Si-drift detector (Vortex, SII Technologies Inc.) or a
Si(Li) detector (Gresham Scientific Instruments Ltd.). Two-dimensional X-ray
intensity maps were obtained using a 7–10 s acquisition time for each pixel.
X-ray fluorescence spectra of each pixel were evaluated by nonlinear least-square
fits using the AXIL software package [6]. Elemental distribution maps were
obtained by plotting background-corrected fluorescence intensities for selected
emission lines as a function of pixel position and scaling intensities, with white
being assigned the pixel with the smallest fluorescence intensity signal and black
the pixel with the highest intensity of 100%; the remaining pixel intensities were
scaled gray shades accordingly on a relative linear scale.
High resolution experiments were performed at the ID22NI station (NI ¼nanoimaging) at the ESRF. ID22NI is a synchrotron hard X-ray nanoprobe recently
built at the ESRF and mostly dedicated to 2D and 3D multimodal analysis (fluores-
cence, diffraction, imaging) of heterogeneous materials. It offers an accurate and
powerful analytical tool coupling noninvasive properties, high detection limits, and
deep submicron spatial resolution. A wide range of scientific communities includ-
ing Earth and Planetary Sciences [7], Biology and Medicine [8], and Material
Sciences [9] have already shown a strong interest in this new end-station supple-
menting existing methods for sample characterization.
ID22NI has been developed as the continuation of the existing ID22 beamline at
the ESRF sharing the same X-ray source and some of the main optical elements,
previously described in [10]. The X-ray beam focusing is performed with
Kirkpatrick-Baez (KB) ML mirrors, in our case W/B4C as ML, which delivered
a focal spot size of approximately 127 nm (H) � 147 nm (V) at a nominal
incident energy of 23 keV. A double crystal [Si(111)] monochromator is also
available but offers lower flux, down from around 1012 ph/s with the ML
to 1010 ph/s, which is less desirable for the trace concentrations in our system
of interest.
A photograph of the sample stage setup is shown in Fig. 4. The sample was
placed at the focal spot on an x,y,z positioning system plus rotation stage. In contrast
to most of the existing hard X-ray microprobes measuring XRF, the sample was
placed in normal incidence (and not at 45�), thus avoiding any lateral resolution
degradation due to beam projection on the sample surface. Two silicon drift
detectors (Vortex 50 mm2, SII Nanotechnology USA Inc., Northridge, CA)
mounted on each side of the sample were used simultaneously to measure the
fluorescence signal. In our case, these were placed as near �90� from the incoming
beam as possible. The sample stage was on a motorized ramp to move it down-
stream from the focal spot, where magnified radiographs using the ESRF FReLoN
CCD camera in combination with visible light microscopy optics and a scintillator
[11] were recorded, in order to align the sample along the axis of rotation.
Following alignment, a series of radiographs was recorded from 0� to 180� in
0.1� steps for samples 3 and 6 (24 mm physical pixel size of the FReLoN CCD,
Speciation of Actinides in Granite Subjected to Tracer Studies 419

1 mm effective detector pixel size, 200 nm estimated pixel size in the images). The
sample stage was then returned to the beam focus, and two dimensional (2D) XRF
images were recorded in fast scanning mode by continuously translating the sample
through the beam using piezo-driven motors and reading out integrated detector
counts at specified time intervals, corresponding to recording fluorescence spectra
at pixels of defined size. For samples 1 and 6, a 400 mm and 200 mm thick Al foil
filter, respectively, was placed in front of the detector to reduce the high incoming
count rate and associated dead time.
Horizontal line scans of interest were selected from 2D elemental distributions
constructed from the fast XRF scan data. Fluorescence tomographic sinograms
were recorded at horizontal sections of interest selected from 2D images (indicated
as dotted lines in Figs. 6, 10 and 14) by repeatedly registering fast line scans
and changing the sample orientation angle in incremental steps from 0� to 180�.Because two fluorescence detectors were used, it was not necessary to rotate the
sample the full 360�. Reconstruction of emission sinograms to obtain elemental
distributions in sample cross sections was performed by means of the maximum
likelihood expectation maximization (MLEM [12]) algorithm implemented in the
XRDUA software version 5.1.12.1 [13].
2
3
5
6
1
4
Fig. 4 Photograph of the experimental set-up. (1) 127 nm (H) � 147 nm (V) focused beam
delivered by the KB mirror system (multilayer ¼ W/B4C, nominal energy ¼ 23 keV). (2) Solid
state Si drift fluorescence detector (Vortex, SII Instruments). (3) Sample appearing as a white spotdue to the illumination by the in-line microscope. (4) In-line microscope. (5) Sample rotation with
fine positioning piezo stages. (6) Positioning stage (x, y, z). The latter can also be ramped
downstream in order to record radiographic projection images with a high resolution indirect
X-ray image detector (FReLoN CCD camera with microscope visible light optics and scintillator,
ESRF in-house design)
420 M.A. Denecke et al.

2.3 Data Analysis
Elemental distributions of 2D scanned areas were obtained by plotting measured
emission intensities registered at each pixel. The emission intensities are obtained
from fits to each pixel fluorescence spectrum using the program PyMCA [14],
available as freeware from the ESRF beamline instrumentation software support
group (BLISS). Three dimensional images were reconstructed from the radio-
graphic projection images using the ESRF software package PyHST, saved as
binary volumes with 32-bit resolution. Classical X-ray microtomography measures
the 3D distribution of the linear attenuation coefficient by assigning different gray
values to different constituents in the image. Due to the use of partial coherent
synchrotron light for imaging, diffraction of X-rays at interfaces within the sample
contributes to the contrast in our case as well, the so-called in-line X-ray phase
contrast (edge enhancement). Better visibility of features within the tomographic
image with respect to the in-line X-ray phase contrast was obtained after applying a
phase-retrieval algorithm. The latter was performed by means of the code ANKA-
phase, based on the approach by Paganin et al., to get a phase map using only a
single sample-to-detector distance (18 cm) [15]. Commonly, holotomography is
performed at ID22NI in order to derive quantitative phase maps while conserving
the high spatial resolution [16]. The latter requires scanning the sample at different
distances from the detector. Due to stability issues with the mounted sample (cf.
motion artifacts in Figs. 11 and 12), the single-distance approach was chosen. It
does not allow for a quantitative study but delivers qualitative information about the
morphology of the main constituents present in the sample while introducing an
acceptable image blurring with respect to holotomography. A comparison of the
reconstructed in-line X-ray phase contrast tomogram and the tomogram after phase
retrieval is shown in Fig. 5. The phase shift of short wavelength radiation when it
Fig. 5 Tomographic reconstructions using plain in-line X-ray phase contrast (edge-enhancement,
left) and the corresponding image after phase-retrieval has been performed (right). The resin
mount attached to the left flank of the sample is more evident in the in-line X-ray phase contrast
image
Speciation of Actinides in Granite Subjected to Tracer Studies 421

transverses material comprised of light elements is greater than their attenuation or
absorption. This is especially evident in the organic resin attached to the sample,
which appears nearly transparent in the plain in-line X-ray phase contrast tomo-
graphic reconstruction, as it only weakly attenuates and hence is only visible due to
its edges. In contrast, the resin is clearly evident in the reconstruction after phase
retrieval.
3 Results and Discussion
3.1 Sample 6
The element distribution maps for major elements with atomic numbers Z �19
present in sample 6 and extracted from 2D fast XRF scans measured over a
184 � 298 mm2 (2 mm steps) area are shown in Fig. 6. It is evident from the
distribution maps that Y and Nb are concentrated on the left hand of the area, the
transition metals, the alkaline metals, and the alkaline earth metals are concentrated
to the right, whereby Rb dominates the top of the sample and Sr the bottom. The Zr
is found intermittently as localized hot spots. Thorium is concentrated at the bottom
of the area scanned and near, but not on, one of the Zr hot spots; it is rather
associated with areas with significant but lower Zr Ka intensity. No correlation
between elements is particularly noticeable, but a negative correlation between the
Zr hot spots and a number of elements (Th, Nb, Y, Sr, Rb, Fe) exists. The dotted line
in the Nb distribution indicates the sample position where the emission tomo-
graphic cross section shown in Fig. 7 was measured.
In the element distributions extracted from the emission sinograms and dis-
played in Fig. 7, Th is observed to be concentrated in the upper corner of the
triangular shaped sample in an egg-like form. The Th distribution is depicted as an
overlay image to the corresponding phase-retrieval tomographic cross section and
also as a RGB overlay for Fe, Sr, and Th. Inspection of these images reveals that Th
is associated with an area of higher contrast (lighter gray scale, i.e., higher electron
density) and positively correlated to the emission tomogram for Sr Ka fluorescence.
The Th hot spot is relatively large, around 35 mm across, and exhibits fine fissures
running through it with dimensions of a few micrometers. It is not only associated
directly with Sr but also has a Sr layer on one side and both ends. The fact that Th is
not associated with Fe or Mn points to it likely not being associated with biotite
(or associated altered phases such as clinochlore) in sample 6. If the observed
fissures are considered indications of cleavage planes at different angles, then this
Th-containing part of the granite rock might be a tectosilicate. As it is not appar-
ently associated with K and only small Ca K intensity, this Th-containing grain
may be a plagioclase feldspar comprised of majority sodium endmember, albite
(Na K emission at ~1.05 eV is energetically too low to be observed here). The U
distribution is shown in Fig. 7, too. However, the counts associated with the darkest
422 M.A. Denecke et al.

K Ca Ti V
Mn Fe Zn Ga
Sr Y Zr
Th
Rb
Nb
Fig. 6 Element distributions for major elements with Z <19 present in sample 6 extracted from
y, z scans measured over a 184 � 298 mm2 (2 mm steps) area. The dotted line in the Nb distributionindicates the sample position where the emission tomographic cross section shown in Fig. 7 was
measured
Speciation of Actinides in Granite Subjected to Tracer Studies 423

U pixels are around 50 times less than the Th counts. If the same scaling were used
in both distribution maps, instead of a relative linear scale, the U would not be
visible.
The Y distribution is localized in the lower left corner of Fig. 7, as is the Nb
distribution (not shown). This part of sample 6 may be fergusonite, YNb04 [17].
Some Ce was detected in this area, too, which is quite typical for this mineral. Iron
is associated with the lightest areas in the phase-retrieval tomogram. Areas rich in
Rb are situated between the Y- and Fe-containing grains and between an Fe feature
and the Th hot spot. Calcium is not always associated with Fe and is generally found
in the same pixels as Ti (not shown). Zirconium is observed to have high fluores-
cence intensity in the pixels indicated. These might be ZrSiO4 and are visible in
the phase-retrieval tomogram as round structures at the top left border of the
Y-containing grain and the lower right edge of the irregularly shaped large Fe
grain. Neither U nor Th is associated with the Zr hot spots.
Ca
Zr
Fe Rb
Sr Y U
Th Fe, Sr, Th
Fig. 7 Element distributions in a selected cross section of sample 6 (indicated in Fig. 6). Image
dimensions are 215 � 193 mm2. In the top right, two full-field tomographic images are depicted:
the in-line X-ray phase contrast tomogram cross section is shown with Fe, Sr, Th as RGB overlay
printed on top while the slice after phase-retrieval is shown with Th only. All images are scaled to
80% maximum intensity
424 M.A. Denecke et al.

3.2 Sample 3
Two-dimensional element distributions for a 100 � 100 mm2 area in sample 3 are
shown in Fig. 8. The area at the top of the image is dominated by K, Rb, and,
interestingly, some Ba. The concentrated Ba and K pixels in the upper left quadrant
of the images outline the protruding feature in the radiogram displayed in Fig. 2d.
One of the near vertically oriented fissures visible in Fig. 2d can also be discerned in
the K and Ba maps as white areas. Strontium is concentrated at the bottom two-
thirds of the image, as are Ca, Mn, Fe, Ga, and Y. The distribution of Y is
remarkable, being concentrated along lines running in different directions, possibly
outlining grain interfaces. The Fe maps shows Fe hot spots to be embedded in a
diffuse Fe distribution, likely marking accessory or secondary minerals in the
Fig. 8 Element distributions for major elements with Z <19 present in sample 3 extracted from
y, z scans measured over a 100 � 100 mm2 (1 mm steps) area. The U distribution extracted
from both L and M emission lines are shown
Speciation of Actinides in Granite Subjected to Tracer Studies 425

surrounding rock forming aluminosilicates. Three of these Fe hot spots are asso-
ciated with relatively high Th La intensity. The U distribution extracted from L and
M emission lines are both shown. The U is concentrated at the top left of both these
images. There is also some Th intensity in the same area, but the Th fluorescence
counts are around 60 times less than the U counts in these pixels. The Th appears
more concentrated in the hot spots to the right in Fig. 8. The U appears to follow a
fissure at the left side of the sample. The distribution of Zn is at first glance similar
to that of U. As the Np distribution in the granite in the previous post-tracer m-XRFstudy was also observed to be positively correlated to that for Zn [2], a correlation
plot of the U versus the Zn distribution for the top half of the images in Fig. 8 was
created (see Fig. 9). There is no strong correlation evident between these elements;
there is no U present in pixels with the highest Zn Ka intensity (data points on the
abscissa in Fig. 9). The normalized amount of Zn in pixels exhibiting significant U
La intensity is clustered at around 20%.
A 2D scan with smaller step size over a 280 � 50 mm2 stripe across the entire
width of sample 3 was recorded, in order to select appropriate horizontal slices to
record emission sinograms. The resulting 2D element distributions are shown in
Fig. 10. The dashed line in the Fe distribution shows the position where the first
emission cross section depicted in Fig. 11 was recorded. This plane transects two of
the three prominent Fe hot spots and another smaller one to the left, as well as the
near vertically oriented fissures, which appear white in the images. In the recon-
structed emission tomogram, the Fe hot spots are observed to be associated with
pores; they appear as light areas next to dark spots, indicating pores in underlying
100
80
60
40
20
20 40 60
Zn–K
80 1000
0
U–
L
Fig. 9 Correlation plot for distributions of Zn Ka versus U La (normalized) intensities for the
upper half of the images shown in Fig. 8
426 M.A. Denecke et al.

phase-retrieval tomogram in Fig. 11. The pores are embedded in the areas of high Sr
concentration. Unlike the Th–Sr association observed in a grain for sample 6, the U
in sample 3 is not correlated with Sr at all. Uranium is concentrated in the area of
sample 3, which is dominated by pores and fissures in the upper left of the cross
section (corresponding to far left of Figs. 8 and 10) and pores at the protrusion at
the bottom of Fig. 11. Note that U is not associated with the pores, where Fe is
concentrated.
Another emission sinogram was measured at a position on sample 3, which was
6 mm below that for Fig. 11. The reconstructed tomogram is shown in Fig. 12, also
as an overlay of the phase-retrieval tomogram. The Fe in this cross section is not
associated with any hot spots, and its distribution is generally similar to the Sr
distribution, concentrated at the bottom of the image and with Ca on the edge of the
sample. This is evident in the correlation plots for Fe versus Sr and Ca shown in
Fig. 13. Calcium might have been in the areas inside the sample, too, but was not
detected due to self-absorption of the low energy emission. This might explain the
deviation of the Fe–Ca correlation curve in Fig. 13 from a straight line to one
having more like two different slopes. The Sr is found concentrated at boundaries
between grains with different densities, as well as at pores in sample 3. Herein
might lie the reason for the strange spikes in the Sr Ka intensity observed at Fe Karelative intensities of around 14%, 22%, and 35% and indicated in Fig. 13 as dotted
lines; Sr is concentrated in the pores, but Fe distribution remains more homoge-
neous. We do not interpret these spikes as indicative of the presence of any true
solid solution (FexSr1�x) phase. The U is not associated with these Sr-rich pores but
solely with those at the top left of the image, where the pores are near, but not on
Fig. 10 Element distributions for sample 3 extracted from y, z scans measured over a 280 (2.8 mmsteps) � 50 (0.5 mm steps) mm2 area located near the top of the radiographic image shown in
Fig. 2d. The dashed line in the Fe distribution shows the position where the emission cross section
depicted in Fig. 11 was recorded
Speciation of Actinides in Granite Subjected to Tracer Studies 427

top, an area of high Rb concentration. The U is observed to be not only adjacent to
(or lining) pore walls in the upper left part of sample 3, but some U is also found in
the lighter area of the phase-retrieval tomogram between pores. This may indicate
diffusion from pores into the surrounding matrix. This matrix is associated with
some K (not shown) and not associated with high concentrations of any Z > 19
U
CaFe
SrRb
Fe, Sr, U
Fig. 11 Element distributions in a selected cross section of sample 3 (indicated by the dashed linein Fig. 10) and plotted together with the (partially transparent) phase-retrieval tomographic cross
section (motion artifacts are present as well). Image dimensions are 183 � 190 mm2 (0.2 mmsteps). In the top left image, the tomographic cross section is shown together with Fe, Sr, U as RGB
overlay. The inset in the upper right of the overlay is a zoom of the U distribution (without RGB
color coding). All images are scaled to 80% maximum intensity, except for the RGB image, which
is scaled to 30% maximum intensity for Fe and Sr and to 10% for U
428 M.A. Denecke et al.

elements. This may indicate that it is an Na–Al–Si mineral such as Na-rich alkali
feldspar or albite, NaAlSi3O8.
3.3 Sample 1
The Ga distribution measured in a 2D scan over sample 1 is shown at the left of
Fig. 14. Sputtered Ga atoms not evacuated during the FIB process were redeposited
U
CaFe
SrRb
ZnFe,Sr,U
Fig. 12 Element distributions in a cross section of sample 3 reconstructed from fluorescence
sinograms recorded 6 mm below the slice shown in Fig. 10. Image dimensions are 199 � 114 mm2
(0.2 mm steps). A partially transparent phase-retrieval tomographic slice is depicted under each
image (motion artifacts are present as well). In the top left image, Fe, Sr, U distributions are shown
as an RGB overlay. The inset in the upper right of the overlay is a zoom of the U distribution.
All images are scaled to 80% maximum intensity, except for the RGB, which is scaled to 60%
maximum intensity for Fe and Sr and to 20% for U
Speciation of Actinides in Granite Subjected to Tracer Studies 429

00
20
40
Sr–
K
60
80
100
0
20
40
Ca
–K
60
80
100
20 40 60
Fe–K
80 100 0 20 40 60
Fe–K
80 100
Fig. 13 Correlation plots for distributions of normalized intensities for Fe Ka versus Sr Ka (left)and versus Ca Ka (right) for the emission tomographic cross sections shown in Fig. 12
b
a
Fig. 14 (a) Silhouette of sample 1 as measured Ga distribution. The image height is ~65 mm. The
dark diagonal stripe at the top marks where the W-manipulator was attached for lift-out FIB. The
dotted line in the lower half marks the position where the emission tomographic cross section
shown in (b) was measured. (b) Tomogram RGB overlay for Ga, Rb, U in a 37.25 � 28.5 mm2
(0.125 mm steps) cross section. A U hot spot 2–3 steps in width, sandwiched between the Ga
coating from FIB preparation and Rb from the sample corpus is indicated
430 M.A. Denecke et al.

at the attacked areas. This led to a high amount of Ga deposited on the surface of
sample 1 to such an extent that it caused saturation of the detectors during XRF
scanning. In addition, the Cu sample holder also caused large numbers of counts
and therefore deadtime in the detector. We had to use a 400 mm thick Al filter in
front of the detectors for these measurements. In fact, the Ga image in Fig. 14 is a
composite of a number of smaller 2D scans, from which bad lines of data were
removed (remeasured and “pasted” in). Figure 15 shows the elemental distributions
extracted from data of one of these small area scans. In addition to the Ga from the
FIB process, we observed W emission in the XRF spectra as an artifact from the
micromanipulator used in the FIB lift-out. Unlike the other two samples, this small
granite piece did not exhibit any measurable amounts of metals others than those
shown in Fig. 15 (except a small U hot spot, see below). Part of the area where a
piece of the sample pillar broke off during FIB preparation is in the lower part of
these images. In this region, we find small globular Fe structures 400 nm and less in
size. This likely marks the fissure, where the Np was observed to be localized in
the scanning XRF studies (Fig. 1). We did not find, however, any emission signal
for Np any more in this FIB-cut sample. The Np was presumably lost with the piece
that broke off.
In the 2D scan of the bottom of the sample pillar, a single hot spot of U emission
was observed. An emission tomogram of the cross section at the pillar height
containing U was recorded. The dotted line in the lower half of the Ga distribution
in Fig. 14a left this position. The resulting emission tomogram is displayed in
Fig. 14b as an RGB overlay for Ga, Rb, and U. A U hot spot 2–3 steps in width or
250–375 nm in size is found sandwiched between the Ga coating from FIB
preparation and Rb from the sample corpus is indicated.
4 Conclusions
One of the lessons we learned from this investigation is that care must be used when
applying FIB technology to prepare samples for subsequent synchrotron-based
XRF studies. It is well-established that FIB will induce damage and a large
deposition of Ga ions on the surface of the material [18], the extent of which
depends on the beam current and the nature of the sputtered material. It is therefore
necessary to remove damaged areas by several milling steps, using smaller beam
currents, and at a final stage using a low voltage milling (usually 2 kV). This was
not done in this case, and the results indicate that the amount of deposited Ga was
very large. However, in our FIB-cut sample 1, the Ga defines the sample silhouette
remarkably. This could potentially be used to facilitate creating exact overlays of
phase-sensitive tomograms with emission tomograms. By leaving Ga-markers on a
sample corpus, one could more easily align cross section image overlays. To avoid
detector deadtimes, the marking could be left as thin lines with varying pattern. Our
sample 3 and 6 had a pyramidal or arrow shape. This shape naturally tapers towards
the sample top, which was helpful in aligning tomographic cross sections with the
Speciation of Actinides in Granite Subjected to Tracer Studies 431

K-K Mn-K Fe-K Ga-K
Rb-K Sr-K W-L1
Fig. 15 Element distributions from a 2D scan of sample 1. The image dimensions are
10.75 � 37.375 mm2 (125 nm steps). Recorded with a 200 mm Al filter in front of the detector
432 M.A. Denecke et al.

correct emission ones. Having element markers available such as lines and patterns
of a deposited element drawn with FIB or other techniques and defining the sample
contours, however, would have been advantageous and facilitated the image over-
lay alignment.
We were not able to directly address our original question if the observed Np(IV)
hot spots immobilized in the granite during a tracer study [2] are present as preci-
pitated hydrolysis particulate products or if they are present as sorbed Np localized
at regions on the fissure walls. This is because no Np was observed in the nano-XRF
images of sample 1, the only granite piece originally observed to exhibit Np
fluorescence in the m-XRF screening studies prior to FIB preparation of the sample.
Apparently, the sample broke off at the fissure during the lift-out procedure and the
Np was lost. Note, however, that nanosized Fe structures were observed on the
remaining fissure wall, but no Np was found there. It appears unlikely that the Np
was exclusively sorbed onto the lost fissure wall and not on the remaining one,
meaning that Np was unlikely to be present as a sorbed species on the fissure walls.
This is an indirect indication that the Np was likely present as particulate hydrolysis
products formed when the Np(V) of the tracer solution was reduced to Np(IV),
which then subsequently hydrolyzed to particles large enough to be occluded within
the fissure. The Fe nanoparticulate structures on the fissure wall might have been
involved in the process responsible for Np immobilization. To corroborate this
interpretation, TEM/EDX investigations of selected pieces from the remaining bulk
sample 1 and neighboring sections of the original granite bore core used in the
tracer study are planned in hopes of finding Np and evaluating its correlation to Fe.
These results can hopefully be compared to new data collected at the Hard X-Ray
Micro/Nanoprobe beamline P06 [19] now in its commissioning phase at the new
light source PETRAIII in Hamburg, Germany.
The sort of problem we faced here of samples breaking or crumbling, where the
area of interest consists of fissures, pores, or grain boundaries, may pose a general
challenge for any investigation with nanometer resolution. Preparation of heteroge-
neous samples to obtain dimensions small enough for a reasonable field of view
(<~150 mm) in such nanotomography studies may destroy the fissures, pores, or
grain boundaries of original interest, as preferential cleavage at these areas during
sample preparation using methods such as cutting, grinding, or FIB-ing of the
sample will likely occur. Using impregnation methods to “glue” the heterogeneous
parts of samples together prior to cutting might not help for micropores and grain
boundaries, as even with vacuum impregnation these are difficult to fill with resin.
A different strategy using a technique that does not require reducing samples to
such small dimensions such as confocal irradiation-detection geometry [20] might
be advantageous. However, this will not offer the resolution attainable in a similar
emission tomography experiment. Typical resolution of confocal m-XRF is on the
order of 10–20 mm in the lateral and depth dimensions.
What we also learned about the samples is that the Th and U in these granite
pieces was found to be likely generally associated with feldspar, in case of Th, and
with micropores in the case of U. That Th is intimately associated with mineral
phases suggests that it is present as a trace structural component. Although this case
Speciation of Actinides in Granite Subjected to Tracer Studies 433
study was limited to only three samples and the Th-mineral association should be
corroborated by, e.g., XRD studies, initial interpretation of results suggest that Th is
less likely than U to become mobile in groundwater upon drilling and excavation
emplacement caverns and shafts for a nuclear waste repository in granite. This is
because Th is redox stable and expected to be relatively less soluble than U as a
structural component of the host rock, isolated from micropores. The U that was
observed to be associated with granite pores may be U that became mobilized upon
eluting the granite bore core with groundwater and transported via the pores. We
cannot know this for sure without extensive further study. However, it does not
matter if the U observed was originally associated with the pores in the granite, or if
it was mobilized from another part of the granite and transported to there, we may
still conclude from these results that the U in the granite pieces studied would
present a higher potential contamination source in groundwater upon drilling
activities in granite bed rock than Th in these samples. If the U was originally
associated with the pores, it has more contact with water than the Th, which appears
isolated from pores. If the U was transported to the granite piece studied, this
already attests its mobility.
In closing, a short comment on the relevance of such investigation to nuclear
waste disposal is in order. Studies of the association of U and Th in granite
components using microscopic and alpha track imaging were performed in the
1980s (see, e.g., [21]). From these and other investigations, insight into the general
modes of occurrence of these elements in granite were identified: (1) associated
with accessory minerals, (2) along grain boundaries, (3) in microfissures and pores,
and (4) associated with quartz and feldspar grains. Indeed, our study reported here
did not discover anything otherwise. However, it is known that these occurrences
can be influenced by, e.g., alteration. Drilling and excavating of the granite also
affects changes, the extent and mechanism of which is not known well-enough to be
quantified. Further study using this type of investigation, in combination with
migration studies such as the one reported in [1] for characterization of proposed
nuclear repository sites in granite host rock, would be necessary to be able to
successfully include these in models and codes used for safety cases.
Acknowledgments We thank HASYLAB and the ESRF for awarding us beamtime. We also are
grateful to E. Sobolla (KIT-INE) and Julijana Krbanjevic (PSI) for preparation of the ground and
FIB-ed samples and J. G€ottlicher (KIT) for expert improvement of this manuscript. We acknowl-
edge financial support as a Joint Research Group between the German Helmholtz Society and the
Russian Basic Research Foundation (HRJRG-011 and 07-03-92280-SIG_a).
References
1. Kienzler, B, Vejmelka, P, R€omer, J, Jansson, M (2009) Actinide migration in fractures of
granite host rock: laboratory and in situ investigations. Nucl. Technol. 165:223–240
2. Denecke, MA, Brendebach, B, De Nolf, W, Falkenberg, G, Janssens, K, Simon, R (2009)
Spatially resolved m-XRF and m-XAFS study of a fractured granite bore core following a
radiotracer experiment. Spectrochim. Acta B 64:791–795
434 M.A. Denecke et al.

3. Overwijk, MHF, van den Heuvel, FC, Bulle-Lieuwma, CWT (1993) Novel scheme for the
preparation of transmission electron microscopy specimens with a focused ion beam. J. Vac.
Sci. Technol. B11:2021–2024
4. Falkenberg, G, Rickers, K, Bilderback, DH, Huang, R (2003) A Single-bounce Capillary for
Focusing of Hard X-rays. http://hasyweb.desy.de/science/annual_reports/2003_report/part1/
intern/11062.pdf
5. Huang, R, Bilderback, DH (2006) Single-bounce monocapillaries for focusing synchrotron
radiation: modeling, measurements and theoretical limits. J. Synchrotron Radiat. 13:74–84
6. Vekemans, B, Janssens, K, Vincze, L, Adams, F, Van Espen, P (1994) Analysis of X-ray
spectra by iterative least squares (AXIL): new developments. X-ray Spectrom. 23:278
7. Bleuet, P, Simionovici, A, Lemelle, L, Ferroir, T, Cloetens, P, Tucoulou, R, Susini, J (2008)
Hard X-rays nanoscale fluorescence imaging of earth and planetary science samples. Appl.
Phys. Lett. 92:213111
8. Ortega, R, Cloetens, P, Deves, G, Carmona, A, Bohic, S (2007) Iron storage within dopamine
neurovesicles revealed by chemical nano-imaging. PLoS ONE 2(9):e925
9. Bleuet, P, Cloetens, P, Gergaud, P, Mariolle, D, Chevalier, N, Tucoulou, R, Susini, J, Chabli,
A (2009) A hard X-ray nanoprobe for scanning and projection nanotomography. Rev. Sci.
Instrum. 80:056101
10. Somogyi, A, Tucoulou, R, Martinez-Criado, G, Homs, A, Bleuet, P, Simionovici, A (2005)
ID22: a multitechnique hard X-ray microprobe beamline at the European Synchrotron Radia-
tion Facility. J. Synchrotron Radiat. 12:208–215
11. Labiche, J-C, Mathon, O, Pascarelli, S, Newton, MA, Ferre, GG, Curfs, C, Vaughan, G, Homs,
A, Carreiras, DF (2007) The fast readout low noise camera as a versatile X-ray detector for
time resolved dispersive extended X-ray absorption fine structure and diffraction studies of
dynamic problems in materials science, chemistry, and catalysis. Rev. Sci. Instrum. 78:
0901301
12. Lange, K, Carson, R (1984) EM reconstruction algorithms for emission and transmission
tomography. J. Comput. Assist. Tomogr. 8(2):306
13. De Nolf, W, Janssen, K (2010) Micro X-ray diffraction and fluorescence tomography for the
study of multilayered automotive paints. Surf. Interf. Anal. 42:411–418
14. Sole, VA, Papillon, E, Cotte, M, Walter, P, Susini, J (2007) A multiplatform code for the
analysis of energy-dispersive X-ray fluorescence spectra. Spectrochim. Acta B62:63
15. Paganin, D, Mayo, SC, Gureyev, TE, Miller, PR, Wilkins, SW (2002) Simultaneous phase and
amplitude extraction from a single defocused image of a homogeneous object. J. Microsc.
206:33–40
16. Cloetens, P, Ludwig, W, Baruchel, J, Van Dyck, D, Van Landuyt, J, Guigay, JP, Schlenker, M
(1999) Holotomography: quantitative phase tomography with micrometer resolution using
hard synchrotron radiation X-rays. Appl. Phys. Lett. 75:2912–2914
17. Weitzel, H, Schrocke, H (1980) Kristallstrukturverfeinerungen von euxenit, Y(Nb0.5Ti0.5)2O6,
und M-fergusonit, YNbO4. Zeitschrift f€ur Kristallographie 152:69–8218. Abolhassani, S, Gasser, P (2006) Preparation of TEM samples of metal-oxide interface by
focused ion beam. J. Microsc. doi: 10.1111/j.1365-2818.2006.01599
19. Schroer, CG, Boye, P, Feldkamp, JM, Patommel, J, Samberg, D, Schropp, A, Schwab, A,
Stephan, S, Falkenberg, G, Wellenreuther, G, Reimers, N (2010) Hard X-ray nanoprobe at
beamline P06 at PETRA III. Nucl. Instrum. Methods Phys. Res. A 616:93–97
20. Denecke, MA, Janssens, K, Proost, K, Rothe, J, Noseck, U (2005) Confocal micro-XRF and
micro-XAFS studies of uranium speciation in a tertiary sediment from a waste disposal natural
analogue site. Environ. Sci. Technol. 39(7):2049–2058
21. Schoch, AE, Scheepers, R (1990) The distribution of uranium and thorium in the cape
columbine granite from the southwestern cape province, South Africa. Ore Geol. Rev.
5:223–246
Speciation of Actinides in Granite Subjected to Tracer Studies 435
Copyright © 2022 FDOKUMEN