Study on formation mechanism of granite eluvium landslide by ...
Upload
independentCategory
view
1download
0
International Journal of Rock Mechanics & Mining Sciences 61 (2013) 43–56
Contents lists available at SciVerse ScienceDirect
International Journal ofRock Mechanics & Mining Sciences
1365-16
http://d
n Corr
E-m
journal homepage: www.elsevier.com/locate/ijrmms
Dilation in granite during servo-controlled triaxial strength tests
Javier Arzua, Leandro R. Alejano n
Natural Resources and Environmental Engineering Department, University of Vigo, Campus Lagoas-Marcosende, Vigo, Pontevedra, Spain
a r t i c l e i n f o
Article history:
Received 26 April 2012
Received in revised form
20 October 2012
Accepted 12 February 2013Available online 15 March 2013
Keywords:
Dilation angle
Strength tests
Post-failure
Volumetric strain
09/$ - see front matter & 2013 Elsevier Ltd. A
x.doi.org/10.1016/j.ijrmms.2013.02.007
esponding author. Tel.: þ34 986 81 23 74; fa
ail address: [email protected] (L.R. Alejano).
a b s t r a c t
We investigated the stress–strain response of three different intact granitic rocks. To do this, a press
with servo-controlled loading was modified to control the confining pressure in triaxial tests and to
measure the volume of hydraulic fluid displaced from Hoek’s triaxial cell so that this volume could be
related to volumetric strain in the rock sample. A series of unconfined and confined compressive tests
were performed on the rock samples and results were plotted, analysed and interpreted regarding the
most relevant parameters, including elastic, strength and post-failure parameters, with special
attention paid to the dilation angle. Our main conclusions refer to the capability to investigate
consistent post-failure rock properties by means of servo-controlled loading set-ups, which we plan to
improve in the future. The dilation angle of granite was captured, with all the tested granites showing
similar behaviour trends that fit reasonably well with recently developed theories on plastic shear-
strain and confinement-stress-dependent dilation and that are analogous to those observed for other
hard rocks.
& 2013 Elsevier Ltd. All rights reserved.
1. Introduction
Granites, very common in Galicia (NW Spain) as in many otherparts of the globe, are typically used as slabs and plaques inconstruction and civil engineering works and also as aggregate.Underground excavations in granite rock masses for civil engi-neering and mining applications are also very common, so abetter understanding of granite behaviour should contribute toimproving design capabilities, construction techniques and safetyin the execution of excavations in this type of rock mass.
In the late 1960s and early 1970s, a number of authors [1–4]were able to study the behaviour of rock failure beyond the peakof the stress–strain curve using a closed loop servo-controlled testmachine. In this period also, Crouch [5] improved existing testingcapabilities in experimentally determining volumetric strain inthe post-failure range of compressive tests. Since then, manyother authors (e.g., Medhurst in his doctoral thesis [6] andothers [7,8]) have performed tests in both soft and hard rocks(including coal, limestone, marble, sandstone, quartzite and granite)aimed at obtaining complete stress–strain curves. Although agood knowledge of this curve is of paramount relevance to rockmechanics [9,10], it is no easy task to estimate it at the scale ofthe rock mass.
Since avoiding rock mass failure is usually a major rockmechanics goal, knowledge of what happens after failure could
ll rights reserved.
x: þ34 986 81 190 24.
seem to be of little or no interest. However, a number of authors[11,12] have indicated that knowing the post-failure plasticparameters for rock masses is necessary to achieve modellingobjectives, understand certain rock behaviour mechanisms andestimate the extent of plastic zones around excavations.
Moreover, the use of numerical modelling has increasedsubstantially in recent years and not only relies on reliable inputparameters but also opens up possibilities for more complex andrealistic models. Accordingly, now more than ever, it is importantto be able to provide realistic representations of the completestress–strain curve and to correctly characterize rock behaviour innumerical models.
A reasonable parameter for evaluating plastic behaviour isthe dilation angle (c). However, due to inherent difficulties inobtaining it, dilatancy has seldom been taken into considerationin initial numerical models; and when it was considered, theapproach, typically poorly developed and simplistic, generallyconsisted of an associated flow rule (friction angle made equal tothe dilation angle: f¼c) or a non-associated flow rule (c¼0).Neither approach is realistic enough [13,14] and so could result inpossible calculation errors.
In an attempt to provide a more correct approach to dilatancy,a number of authors [15–22] have proposed parameters ormodels that fit the dilatant behaviour of rocks. The need for realdata to compare with modelling results is a common issue in all ofthese studies and serves as the starting point for our own study.In other words, for samples of three granitic rocks we provide realconfined and unconfined stress test data for a press with fullyservo-controlled loading.
J. Arzua, L.R. Alejano / International Journal of Rock Mechanics & Mining Sciences 61 (2013) 43–5644
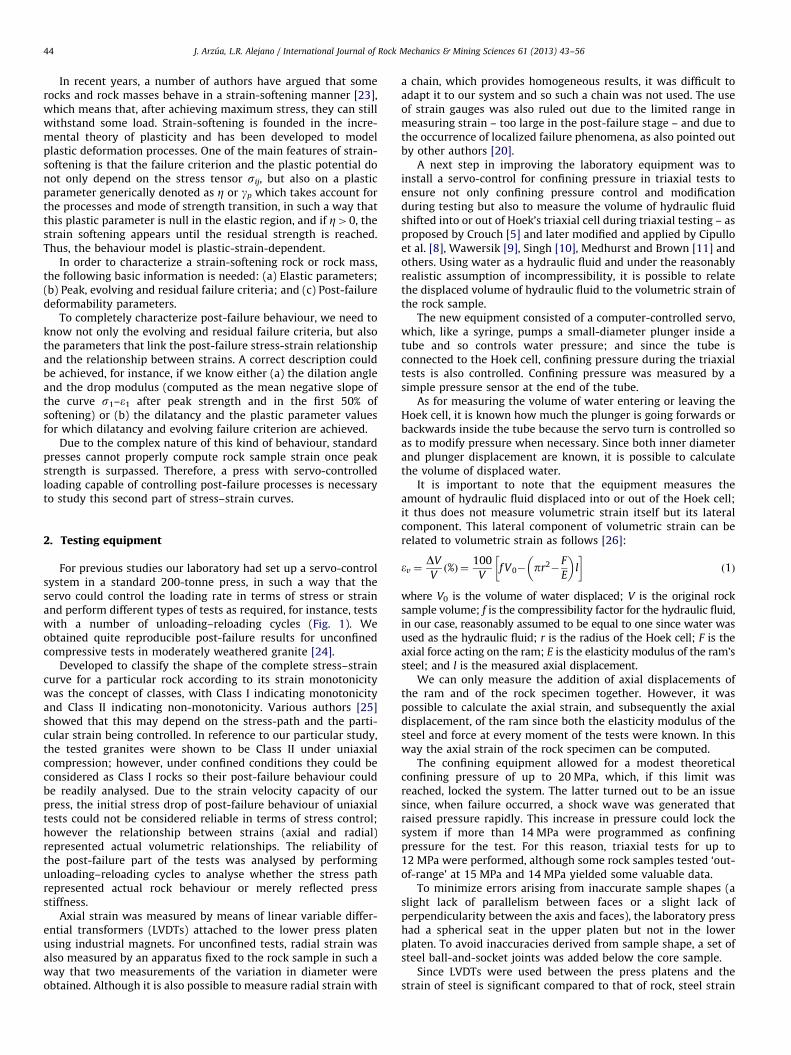
In recent years, a number of authors have argued that somerocks and rock masses behave in a strain-softening manner [23],which means that, after achieving maximum stress, they can stillwithstand some load. Strain-softening is founded in the incre-mental theory of plasticity and has been developed to modelplastic deformation processes. One of the main features of strain-softening is that the failure criterion and the plastic potential donot only depend on the stress tensor sij, but also on a plasticparameter generically denoted as Z or gp which takes account forthe processes and mode of strength transition, in such a way thatthis plastic parameter is null in the elastic region, and if Z40, thestrain softening appears until the residual strength is reached.Thus, the behaviour model is plastic-strain-dependent.
In order to characterize a strain-softening rock or rock mass,the following basic information is needed: (a) Elastic parameters;(b) Peak, evolving and residual failure criteria; and (c) Post-failuredeformability parameters.
To completely characterize post-failure behaviour, we need toknow not only the evolving and residual failure criteria, but alsothe parameters that link the post-failure stress-strain relationshipand the relationship between strains. A correct description couldbe achieved, for instance, if we know either (a) the dilation angleand the drop modulus (computed as the mean negative slope ofthe curve s1–e1 after peak strength and in the first 50% ofsoftening) or (b) the dilatancy and the plastic parameter valuesfor which dilatancy and evolving failure criterion are achieved.
Due to the complex nature of this kind of behaviour, standardpresses cannot properly compute rock sample strain once peakstrength is surpassed. Therefore, a press with servo-controlledloading capable of controlling post-failure processes is necessaryto study this second part of stress–strain curves.
2. Testing equipment
For previous studies our laboratory had set up a servo-controlsystem in a standard 200-tonne press, in such a way that theservo could control the loading rate in terms of stress or strainand perform different types of tests as required, for instance, testswith a number of unloading–reloading cycles (Fig. 1). Weobtained quite reproducible post-failure results for unconfinedcompressive tests in moderately weathered granite [24].
Developed to classify the shape of the complete stress–straincurve for a particular rock according to its strain monotonicitywas the concept of classes, with Class I indicating monotonicityand Class II indicating non-monotonicity. Various authors [25]showed that this may depend on the stress-path and the parti-cular strain being controlled. In reference to our particular study,the tested granites were shown to be Class II under uniaxialcompression; however, under confined conditions they could beconsidered as Class I rocks so their post-failure behaviour couldbe readily analysed. Due to the strain velocity capacity of ourpress, the initial stress drop of post-failure behaviour of uniaxialtests could not be considered reliable in terms of stress control;however the relationship between strains (axial and radial)represented actual volumetric relationships. The reliability ofthe post-failure part of the tests was analysed by performingunloading–reloading cycles to analyse whether the stress pathrepresented actual rock behaviour or merely reflected pressstiffness.
Axial strain was measured by means of linear variable differ-ential transformers (LVDTs) attached to the lower press platenusing industrial magnets. For unconfined tests, radial strain wasalso measured by an apparatus fixed to the rock sample in such away that two measurements of the variation in diameter wereobtained. Although it is also possible to measure radial strain with
a chain, which provides homogeneous results, it was difficult toadapt it to our system and so such a chain was not used. The useof strain gauges was also ruled out due to the limited range inmeasuring strain – too large in the post-failure stage – and due tothe occurrence of localized failure phenomena, as also pointed outby other authors [20].
A next step in improving the laboratory equipment was toinstall a servo-control for confining pressure in triaxial tests toensure not only confining pressure control and modificationduring testing but also to measure the volume of hydraulic fluidshifted into or out of Hoek’s triaxial cell during triaxial testing – asproposed by Crouch [5] and later modified and applied by Cipulloet al. [8], Wawersik [9], Singh [10], Medhurst and Brown [11] andothers. Using water as a hydraulic fluid and under the reasonablyrealistic assumption of incompressibility, it is possible to relatethe displaced volume of hydraulic fluid to the volumetric strain ofthe rock sample.
The new equipment consisted of a computer-controlled servo,which, like a syringe, pumps a small-diameter plunger inside atube and so controls water pressure; and since the tube isconnected to the Hoek cell, confining pressure during the triaxialtests is also controlled. Confining pressure was measured by asimple pressure sensor at the end of the tube.
As for measuring the volume of water entering or leaving theHoek cell, it is known how much the plunger is going forwards orbackwards inside the tube because the servo turn is controlled soas to modify pressure when necessary. Since both inner diameterand plunger displacement are known, it is possible to calculatethe volume of displaced water.
It is important to note that the equipment measures theamount of hydraulic fluid displaced into or out of the Hoek cell;it thus does not measure volumetric strain itself but its lateralcomponent. This lateral component of volumetric strain can berelated to volumetric strain as follows [26]:
ev ¼DV
Vð%Þ ¼
100
Vf V0� pr2�
F
E
� �l
� �ð1Þ
where V0 is the volume of water displaced; V is the original rocksample volume; f is the compressibility factor for the hydraulic fluid,in our case, reasonably assumed to be equal to one since water wasused as the hydraulic fluid; r is the radius of the Hoek cell; F is theaxial force acting on the ram; E is the elasticity modulus of the ram’ssteel; and l is the measured axial displacement.
We can only measure the addition of axial displacements ofthe ram and of the rock specimen together. However, it waspossible to calculate the axial strain, and subsequently the axialdisplacement, of the ram since both the elasticity modulus of thesteel and force at every moment of the tests were known. In thisway the axial strain of the rock specimen can be computed.
The confining equipment allowed for a modest theoreticalconfining pressure of up to 20 MPa, which, if this limit wasreached, locked the system. The latter turned out to be an issuesince, when failure occurred, a shock wave was generated thatraised pressure rapidly. This increase in pressure could lock thesystem if more than 14 MPa were programmed as confiningpressure for the test. For this reason, triaxial tests for up to12 MPa were performed, although some rock samples tested ‘out-of-range’ at 15 MPa and 14 MPa yielded some valuable data.
To minimize errors arising from inaccurate sample shapes (aslight lack of parallelism between faces or a slight lack ofperpendicularity between the axis and faces), the laboratory presshad a spherical seat in the upper platen but not in the lowerplaten. To avoid inaccuracies derived from sample shape, a set ofsteel ball-and-socket joints was added below the core sample.
Since LVDTs were used between the press platens and thestrain of steel is significant compared to that of rock, steel strain

Fig. 1. Evolution of a servo-controlled test based on a given strain function. Axial strain in the abscissa axis and major principal stress in the ordinate axis.
J. Arzua, L.R. Alejano / International Journal of Rock Mechanics & Mining Sciences 61 (2013) 43–56 45
had to be subtracted from the measured strain. This importantaspect also had to be considered in triaxial tests.
Drilling equipment and circular diamond saws were used tocarve the rock specimens, all in accordance with rock mechanicsstandards [27].
3. Tested rocks
An experimental programme was planned to study threegranitic rocks locally known as Amarelo Paıs, Blanco Mera andVilachan, all hard rocks extensively used as building and orna-mental materials.
Amarelo Paıs, classified as slightly weathered granite, has a tancolour and is a coarse-grained hard rock (1–3 mm). Blanco Mera isa bright white-coloured granite, also a coarse-grained hard rock(1–6 mm). Vilachan, classified as a micaceous granite, is a pale-coloured, medium-grained hard rock (0.5–1 mm).
To evaluate the geological and chemical nature of the rocks,samples were characterized using an optical microscope. Thinsections of rock (Fig. 2) were cut and prepared for study, thenexposed to white and polarized light under a petrographic opticalmicroscope in order to analyse the samples and perform a modalanalysis. These thin sections could be described quantitatively bypoint counting and qualitatively in terms of dominant minerals.The modal analysis of the transparent dominant minerals in thethree rocks is presented in Table 1.

Table 1Quantitative modal analysis of the studied rocks derived from petrography
analysis of thin sections.
Mineral phases Modal analysis (%)
Amarelo Paıs Blanco Mera Vilachan
Quartz 26 20 41
Alkaline feldspar 25 27 15
Plagioclase 22 35 12
Biotite 6 5 4
Muscovite 18 7 16
Sericite 1 1 –
Chlorite – 4 3
Opaques 1 – –
Accessories o1 o1 9
Table 2Summarized results of density, tilt and Brazilian tests for the three granitic rocks
studied (mean results and standard deviation between brackets).
Rock Density (g/cm3) fb (1) st (MPa)
Amarelo Paıs 2.61 (0.01) 29 (2) 6.65 (1.05)
Blanco Mera 2.60 (0.01) 33 (3) 6.12 (0.99)
Vilachan 2.59 (0.01) 28 (2) 6.93 (0.72)
Fig. 2. Petrographic study of rock samples showing pictures of hand samples and
thin-section photographs in white and polarized light for the three granites
studied: (a) Amarelo Paıs; (b) Blanco Mera; (c) Vilachan.
J. Arzua, L.R. Alejano / International Journal of Rock Mechanics & Mining Sciences 61 (2013) 43–5646
4. Testing
Samples were cut from 40-cm cubes taken from the sawingfacilities of a rock supplier. Some 30 specimens measuring 54 mm
in diameter (NX size) were cut for each rock type in order to havea reliable number of samples to test.
Unconfined and confined (0–15 MPa) compression strengthtests were performed on around 30 samples representing eachrock type. Other tests, namely, density, tilt and Brazilian tests,aimed at characterizing the rocks were also performed, alwaysapplying the best rock mechanics standards [27]. Some 200 non-destructive and destructive tests were performed in total.
4.1. Non-destructive tests
4.1.1. Density tests
In order to determine density, twelve tests were per-formed on Amarelo Paıs, fourteen tests on Blanco Mera, andnineteen tests on Vilachan. The values of the means andstandard deviations for the tests for each rock are presentedin Table 2.
4.1.2. Tilt tests
The recommended method for characterizing the basic frictionangle of a smooth joint in rock mechanics standards [27] is basedon shear strength tests. However, applying the definition for thisparameter, as proposed by Barton [28], it is possible to obtain thefriction angle as the inclination of a sawed rock slab placed overanother slab of the same rock at the point when the upper slabstarts to slide along the lower slab. Using this method, eighteentests were performed on Amarelo Paıs, twelve tests on BlancoMera, and six tests on Vilachan (Table 2).
4.2. Destructive tests
4.2.1. Brazilian tests
Standard Brazilian tests were performed in order to obtain thetensile strength of the three rocks studied. Since this kind of testis easy and rapid, a large number of tests were performed on eachrock: 26 on Amarelo Paıs, 20 on Blanco Mera, and nineteen onVilachan (Table 2).

Table 3Results of testing on Amarelo Paıs samples.
Sample s3 s1peak s1
res E n M
MPa MPa MPa GPa – GPa
A1 RCS 0 77.50 – 21.67 0.13 –
A2 RCS 0 84.64 – 22.36 0.19 –
A3 RCS 0 76.66 2 17.63 0.20 –
A4 RCS 0 75.60 5 22.92 0.18 –
A5 RCS 0 80.34 2 20.27 0.15 –
A6 RCS 0 76.91 2 18.59 0.18 –
A7 RCS 0 68.47 – 17.60 0.21 –
A8 RCS 0 77.19 2 19.30 0.17 –
A9 RCS 0 74.85 2 18.97 0.17 –
A10 RCS 0 76.17 – 16.35 0.19 –
A11 RCS 0 80.08 – 15.95 0.16 –
A12 RCS 0 74.74 1 16.00 0.15 �19.11
A1 TRX 2 130.42 32 30.54 0.19 �17.39
A2 TRX 2 117.33 30 23.40 0.19 �16.00
A3 TRX 2 112.29 27 22.32 0.22 �16.67
A4 TRX 2 110.31 31 23.95 0.20 �17.65
A5 TRX 4 134.20 44 25.06 0.19 �21.06
A6 TRX 4 130.02 43 24.36 0.22 �17.39
A7 TRX 4 129.89 54 25.25 0.20 �17.15
A8 TRX 4 129.50 46 23.84 0.22 �22.10
A9 TRX 6 153.90 51 27.48 0.21 �21.05
A10 TRX 6 170.72 45 30.02 0.21 �19.55
A11 TRX 6 175.43 48 30.01 0.20 �19.05
A12 TRX 6 169.00 51 30.40 0.18 �17.57
A13 TRX 10 192.75 80 28.06 0.22 �19.03
A14 TRX 10 213.99 75 35.49 0.19 �21.69
A15 TRX 10 200.71 87 33.69 0.15 �21.74
A16 TRX 10 193.09 68 29.45 0.21 �20.18
A17 TRX 12 214.99 81 31.20 0.20 �18.52
A18 TRX 12 230.14 80 36.08 0.20 �20.00
Table 4Results of testing on Blanco Mera samples.
Sample s3 s1peak s1
res E n M
MPa MPa MPa GPa – GPa
B1 RCS 0 125.77 – 33.11 0.15 –
B2 RCS 0 116.50 – 33.83 0.18 –
B3 RCS 0 110.18 – 29.48 0.15 –
B4 RCS 0 100.48 – 27.63 0.10 –
B5 RCS 0 121.32 – 34.14 0.17 –
B6 RCS 0 79.26 – 29.44 – –
B7 RCS 0 84.57 2 25.40 0.16 –
B8 RCS 0 110.77 – 33.66 0.14 –
B9 RCS 0 106.66 – 25.17 0.08 –
B10 RCS 0 118.26 – 33.26 0.13 –
B11 RCS 0 111.43 – 31.64 0.16 –
B12 RCS 0 125.34 – 30.88 0.10 –
B1 TRX 2 187.03 30 42.86 0.16 �25.00
B2 TRX 2 183.41 42 44.19 0.17 �21.05
B3 TRX 2 172.44 40 42.18 0.16 �23.52
B4 TRX 2 177.82 34 43.07 0.18 �18.47
B5 TRX 4 216.71 38 45.86 0.15 �18.38
B6 TRX 4 212.58 50 42.82 0.16 �17.24
B7 TRX 4 196.84 52 42.65 0.18 �21.52
B8 TRX 4 214.13 54 45.55 0.17 �22.72
B9 TRX 6 235.39 65 42.86 0.18 �24.46
B10 TRX 6 228.20 51 43.41 0.18 �20.83
B11 TRX 6 218.35 70 44.10 0.17 �17.24
B12 TRX 6 240.16 74 45.17 0.20 �18.97
B13 TRX 10 282.30 93 47.28 0.15 �22.05
B14 TRX 10 252.18 74 41.49 0.21 �22.56
B15 TRX 10 259.22 115 46.17 0.16 �21.74
B16 TRX 10 269.80 85 47.12 0.17 �22.25
B17 TRX 14 311.62 180 46.96 0.18 �21.82
B18 TRX 12 307.62 112 48.26 0.15 �19.76
B19 TRX 12 291.80 82 44.66 0.17 �24.88
J. Arzua, L.R. Alejano / International Journal of Rock Mechanics & Mining Sciences 61 (2013) 43–56 47
4.2.2. Uniaxial compressive tests
A total of ninety uniaxial and triaxial compressive testswere performed. Pictures of all samples were taken before andafter testing and, if a shear band occurred, its orientation wasmeasured.
As explained above, in these tests the granites were character-ized as having Class II behaviour. Hence, after failure, the stress–strain relations obtained were not significant, due to the extre-mely brittle nature of the rock samples in the press: the rockcrushed in an explosive manner, splitting the sample into frag-ments. Whenever possible, however, the parameters were esti-mated. Results for the unconfined strength tests are presented inTables 3 to 5, together with confined strength test results.
4.2.3. Triaxial tests
Typical results for confined strength tests are shown in Fig. 3.The first graph shows how to obtain the main geotechnicalparameters: peak strength s1
peak, residual strength s1res, apparent
elastic Young’s modulus E, apparent Poisson’s ratio n, andthe drop modulus M. Pictures of all the samples were takenbefore and after and, if a shear band occurred, its orientation wasmeasured.
First to be observed from Fig. 3 is the high degree of radialdeformation occurring for the peak strength level in the threegranitic rocks. For some granites (for instance, Lac du Bonnet asdescribed in [29]), the radial strain at peak corresponds to roughlyhalf the axial strain; for the rocks studied here, the peak radialand axial strain are roughly equal.
It was previously commented that it is not possible in triaxialtests to directly measure radial deformation, as the use of straingauges has to be ruled out. It is possible, however, to measurevolumetric strain and, based on this value, to estimate the radial
Table 5Results of testing on Vilachan granite samples.
Sample s3 s1peak s1
res E n M
MPa MPa MPa GPa – GPa
C1 RCS 0 127.45 – 27.27 0.11 –
C2 RCS 0 116.92 – 25.84 0.17 –
C3 RCS 0 114.17 – 22.92 – –
C4 RCS 0 121.22 – 23.09 0.19 –
C5 RCS 0 119.09 – 25.53 0.15 –
C6 RCS 0 104.30 – 21.13 0.17 –
C7 RCS 0 129.18 – 23.51 0.12 –
C8 RCS 0 117.96 – 23.07 0.28 –
C9 RCS 0 113.53 – 21.88 0.19 –
C10 RCS 0 106.61 – 21.03 0.14 –
C11 RCS 0 113.60 – 24.09 0.20 –
C12 RCS 0 108.77 – 22.39 0.11 –
C1 TRX 2 146.25 – 24.00 0.11 �13.37
C2 TRX 2 141.99 40 23.16 0.17 �15.32
C3 TRX 2 140.91 34 24.45 0.20 �17.97
C4 TRX 2 146.13 36 24.14 0.22 �18.18
C5 TRX 4 169.53 52 29.41 0.17 �15.68
C6 TRX 4 160.13 53 27.82 0.18 �19.05
C7 TRX 6 185.76 50 29.27 – �15.29
C8 TRX 4 161.01 43 27.21 0.22 �15.49
C9 TRX 4 160.88 35 27.04 0.20 �20.07
C11 TRX 6 187.84 49 27.79 0.19 �19.17
C12 TRX 6 195.46 47 31.70 0.18 �19.05
C13 TRX 10 239.61 71 33.10 0.20 �22.03
C14 TRX 10 241.22 70 34.85 0.18 �21.51
C15 TRX 10 209.77 64 27.82 0.21 �22.72
C16 TRX 10 231.61 63 30.23 0.17 �19.84
C17 TRX 15 266.22 – 32.12 0.14 �21.74
C18 TRX 15 259.45 – 31.29 0.19 �21.13

Fig. 3. Stress–strain graph for confined compression test on granitic rock samples.
In the upper graph it is shown how to obtain the values for peak and residual
strength (s1peak and s1
res), apparent elastic Young’s modulus (E), apparent Poisson’s
ratio (n) and drop modulus (M). (a) Amarelo Paıs, (b) Blanco Mera and (c) Vilachan.
Fig. 4. Complete stress–strain curves for Amarelo Paıs granite for confined
strength tests at different confining pressures. The most relevant tendency is for
peak strength and residual strength to increase, apparent Young’s modulus to
slightly increase and radial and volumetric strain to decrease as confining
pressure grows.
J. Arzua, L.R. Alejano / International Journal of Rock Mechanics & Mining Sciences 61 (2013) 43–5648
deformation using the following formula [16]:
ev ¼ e1þ2� e3-e3 ¼ev�e1
2ð2Þ
We found that a more accurate calculation is provided as follows:
e3 ¼ 1�
ffiffiffiffiffiffiffiffiffiffiffi1�ev
1�e1
sð3Þ
The derivation of the estimate and the accuracy of theapproach used for Eq. (3) are presented in Appendix 1. For theanalysed tests the difference between the two formulations is notrelevant.
It was now possible to obtain the complete stress–straincurves for each performed test (as shown in Fig. 3). It was alsopossible to compare the curves for each rock in such a way as toview the main deformational behaviour tendencies according toincreasing confining pressure, as shown in Fig. 4. Tables 3 to 5summarize the results obtained for the uniaxial and triaxialcompression tests on granitic samples.
5. Interpretation of results
5.1. Classic parameters
The results obtained in Tables 3 to 5 were analysed in order todeduce the main geomechanical features of the rocks. First, peakand residual Mohr–Coulomb (M–C) and Hoek–Brown (H–B) fail-ure criteria were fitted to the peak and residual strength valuesobtained as a result of testing. These fits, together with theoriginal test data, are presented in Fig. 5 and the main resultsare shown in Tables 6 to 8. Residual strength has been generallyestimated as the lowest principal strength value observed ineach test. In tests where final stress and strain values were associ-ated with an unloading cycle, the residual strength value wasapproximated.
Since triaxial tests were only performed for up to 12 MPa ofconfinement, the curvature of the enveloping failure was not verymarked. Consequently, both studied failure criteria fitted wellwith the results.
Note the very good regression analyses obtained at peak forthe M–C failure criterion (Tables 6 to 8) and also the good fit forthe H–B criterion. As for residual data, M–C criterion seems to fitresults slightly better than H–B criterion. When trying to fit H–Bcriterion to residual data some problems arose (sci
2o0), so sometests were excluded from the analysis to obtain reasonable data.In the final output, the very high values of the H–B parameter mand the friction angle f can be observed and, in addition, thefact that these friction angles moderately diminish from peak toresidual, especially for the Amarelo Paıs and Blanco Mera granites.
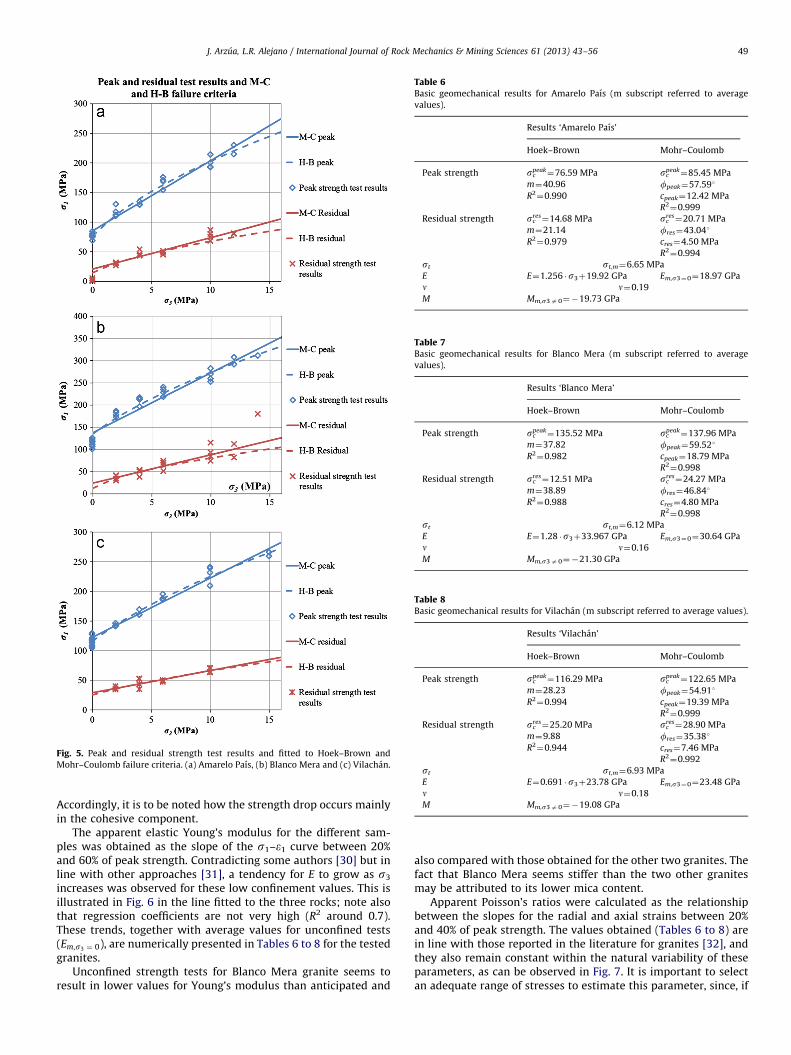
Fig. 5. Peak and residual strength test results and fitted to Hoek–Brown and
Mohr–Coulomb failure criteria. (a) Amarelo Paıs, (b) Blanco Mera and (c) Vilachan.
Table 6Basic geomechanical results for Amarelo Paıs (m subscript referred to average
values).
Results ‘Amarelo Paıs’
Hoek–Brown Mohr–Coulomb
Peak strength scpeak¼76.59 MPa sc
peak¼85.45 MPa
m¼40.96 fpeak¼57.591
R2¼0.990 cpeak¼12.42 MPa
R2¼0.999
Residual strength scres¼14.68 MPa sc
res¼20.71 MPa
m¼21.14 fres¼43.041
R2¼0.979 cres¼4.50 MPa
R2¼0.994
st st,m¼6.65 MPa
E E¼1.256 �s3þ19.92 GPa Em,s3¼0¼18.97 GPa
n n¼0.19
M Mm,s3a0¼�19.73 GPa
Table 7Basic geomechanical results for Blanco Mera (m subscript referred to average
values).
Results ‘Blanco Mera’
Hoek–Brown Mohr–Coulomb
Peak strength scpeak¼135.52 MPa sc
peak¼137.96 MPa
m¼37.82 fpeak¼59.521
R2¼0.982 cpeak¼18.79 MPa
R2¼0.998
Residual strength scres¼12.51 MPa sc
res¼24.27 MPa
m¼38.89 fres¼46.841
R2¼0.988 cres¼4.80 MPa
R2¼0.998
st st,m¼6.12 MPa
E E¼1.28 �s3þ33.967 GPa Em,s3¼0¼30.64 GPa
n n¼0.16
M Mm,s3a0¼�21.30 GPa
Table 8Basic geomechanical results for Vilachan (m subscript referred to average values).
Results ‘Vilachan’
Hoek–Brown Mohr–Coulomb
Peak strength scpeak¼116.29 MPa sc
peak¼122.65 MPa
m¼28.23 fpeak¼54.911
R2¼0.994 cpeak¼19.39 MPa
R2¼0.999
Residual strength scres¼25.20 MPa sc
res¼28.90 MPa
m¼9.88 fres¼35.381
R2¼0.944 cres¼7.46 MPa
R2¼0.992
st st,m¼6.93 MPa
E E¼0.691 �s3þ23.78 GPa Em,s3¼0¼23.48 GPa
n n¼0.18
M Mm,s3a0¼�19.08 GPa
J. Arzua, L.R. Alejano / International Journal of Rock Mechanics & Mining Sciences 61 (2013) 43–56 49
Accordingly, it is to be noted how the strength drop occurs mainlyin the cohesive component.
The apparent elastic Young’s modulus for the different sam-ples was obtained as the slope of the s1–e1 curve between 20%and 60% of peak strength. Contradicting some authors [30] but inline with other approaches [31], a tendency for E to grow as s3
increases was observed for these low confinement values. This isillustrated in Fig. 6 in the line fitted to the three rocks; note alsothat regression coefficients are not very high (R2 around 0.7).These trends, together with average values for unconfined tests(Em,s3 ¼ 0), are numerically presented in Tables 6 to 8 for the testedgranites.
Unconfined strength tests for Blanco Mera granite seems toresult in lower values for Young’s modulus than anticipated and
also compared with those obtained for the other two granites. Thefact that Blanco Mera seems stiffer than the two other granitesmay be attributed to its lower mica content.
Apparent Poisson’s ratios were calculated as the relationshipbetween the slopes for the radial and axial strains between 20%and 40% of peak strength. The values obtained (Tables 6 to 8) arein line with those reported in the literature for granites [32], andthey also remain constant within the natural variability of theseparameters, as can be observed in Fig. 7. It is important to selectan adequate range of stresses to estimate this parameter, since, if

Fig. 6. Apparent elastic Young’s modulus versus confining pressure for the three
rocks studied.
Fig. 7. Apparent Poisson’s ratio versus confining pressure for the three rocks
studied.
Fig. 8. Drop modulus versus confining pressure for the three rocks studied.
J. Arzua, L.R. Alejano / International Journal of Rock Mechanics & Mining Sciences 61 (2013) 43–5650
selected over the ‘onset-of-dilatancy’ point, abnormally highvalues may be obtained.
The drop modulus M was computed as the mean negative slopeof the curve s1–e1 after peak strength and in the first 50% ofsoftening. A general perspective on the results of our tests indi-cates that this modulus tends not to remain constant all along thesoftening process. Therefore, our estimates of M in the differenttriaxial tests are indicative, average values for this parameter(Mm,s3 a0) are shown in Tables 6–8. Future studies will focus on adetailed analysis of the softening process and correlation of thestress drop with a softening or plastic parameter.
Fig. 8 shows estimated values for the drop modulus graphedagainst s3. At such low confining pressure values and for suchbrittle materials, a slightly decreasing trend can be observed asconfining pressure grows, as reported in classic studies by VonKarman [33]. The drop modulus results for the unconfined strengthtests are excluded for mean estimates due to the brittleness of the
materials used, commented above; even if calculated rigorously,these results would have to be used with care.
Note that peak and residual strength criteria, elastic para-meters and drop modulus, together with the dilation angle valuespresented in next section provide a complete set of parameters tosimulate the (strain softening and variable dilatancy) mechanicalbehaviour of the tested rock specimens. This model is much morerealistic than those traditionally used in rock engineering applica-tions (elastic-perfectly-plastic); however, further studies areneeded to propose models better able to represent rock beha-viour, particularly for large strain situations.
Finally, the orientation of shear bands (Fig. 9) was tracked,measuring the so called b angle as the slope of the shear bandwith a horizontal line, whenever possible and compared withconfining pressure. Results similar to those reported by otherauthors [34] were obtained, with shear band inclinations becom-ing less sharp with confinement. This trend is graphed in Fig. 10.Future research will focus on providing further insights on thisissue [35].
5.2. Dilatancy
Due to the confining pressure equipment incorporated in ourservo-control press we could now obtain the complete stress–strain curve in triaxial tests, as depicted in Fig. 11. These curvesare still relevant in rock mechanics and, in the last thirty years,although significant success has been achieved in terms ofmethodologies for estimating reasonably good elastic parametersand failure criteria in rocks, joints and rock masses, this has notbeen the case for post-failure behaviour, mainly due to thedifficulties associated with defining a model that adequatelyreflects observed complete stress–strain curves. In routine engi-neering applications, therefore, dilatancy seems to receive rela-tively little attention; this is hardly surprising since, apart fromthe inherent difficulties in estimating dilatancy, many problemsin rock mechanics are solved by simply avoiding failure.
Dilatancy can be defined as a change in volume resulting fromthe shear distortion of an element in a material. The dilation angle(c) is a suitable parameter for describing the behaviour of adilatant material, since – as will be shown below – it representsthe ratio of plastic volume change to plastic shear strain.
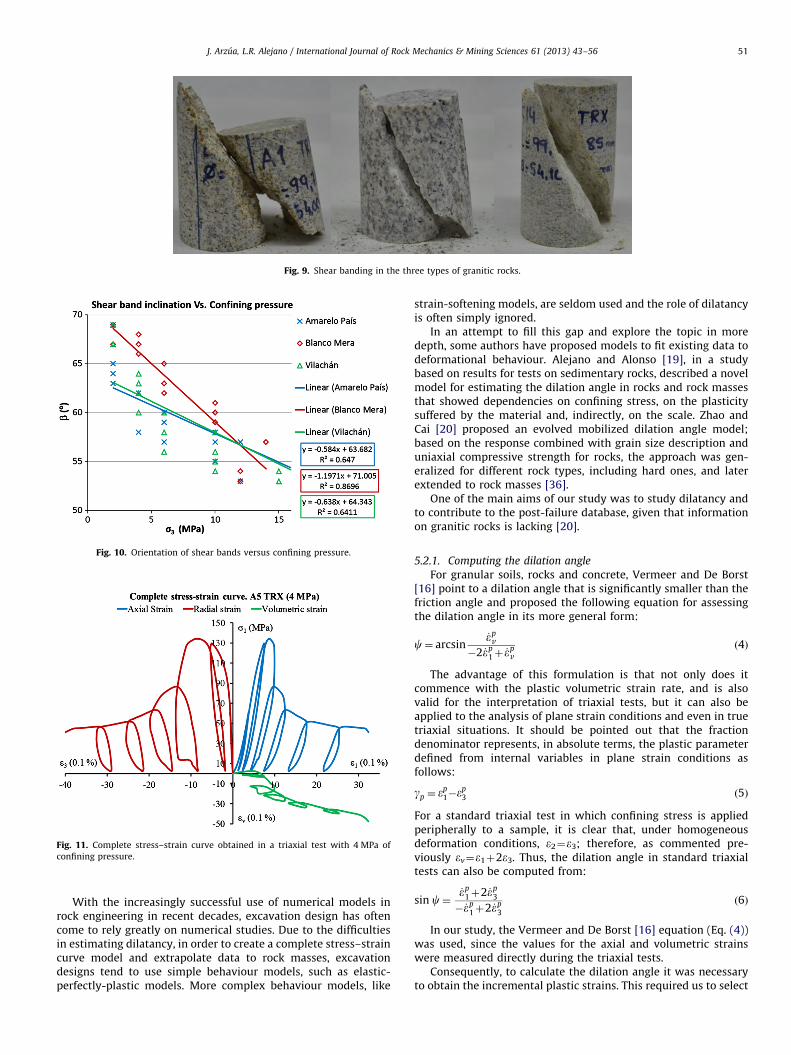
Fig. 9. Shear banding in the three types of granitic rocks.
Fig. 10. Orientation of shear bands versus confining pressure.
Fig. 11. Complete stress–strain curve obtained in a triaxial test with 4 MPa of
confining pressure.
J. Arzua, L.R. Alejano / International Journal of Rock Mechanics & Mining Sciences 61 (2013) 43–56 51
With the increasingly successful use of numerical models inrock engineering in recent decades, excavation design has oftencome to rely greatly on numerical studies. Due to the difficultiesin estimating dilatancy, in order to create a complete stress–straincurve model and extrapolate data to rock masses, excavationdesigns tend to use simple behaviour models, such as elastic-perfectly-plastic models. More complex behaviour models, like
strain-softening models, are seldom used and the role of dilatancyis often simply ignored.
In an attempt to fill this gap and explore the topic in moredepth, some authors have proposed models to fit existing data todeformational behaviour. Alejano and Alonso [19], in a studybased on results for tests on sedimentary rocks, described a novelmodel for estimating the dilation angle in rocks and rock massesthat showed dependencies on confining stress, on the plasticitysuffered by the material and, indirectly, on the scale. Zhao andCai [20] proposed an evolved mobilized dilation angle model;based on the response combined with grain size description anduniaxial compressive strength for rocks, the approach was gen-eralized for different rock types, including hard ones, and laterextended to rock masses [36].
One of the main aims of our study was to study dilatancy andto contribute to the post-failure database, given that informationon granitic rocks is lacking [20].
5.2.1. Computing the dilation angle
For granular soils, rocks and concrete, Vermeer and De Borst[16] point to a dilation angle that is significantly smaller than thefriction angle and proposed the following equation for assessingthe dilation angle in its more general form:
c¼ arcsin_ep
v
�2_ep1þ
_epv
ð4Þ
The advantage of this formulation is that not only does itcommence with the plastic volumetric strain rate, and is alsovalid for the interpretation of triaxial tests, but it can also beapplied to the analysis of plane strain conditions and even in truetriaxial situations. It should be pointed out that the fractiondenominator represents, in absolute terms, the plastic parameterdefined from internal variables in plane strain conditions asfollows:
gp ¼ ep1�e
p3 ð5Þ
For a standard triaxial test in which confining stress is appliedperipherally to a sample, it is clear that, under homogeneousdeformation conditions, e2¼e3; therefore, as commented pre-viously ev¼e1þ2e3. Thus, the dilation angle in standard triaxialtests can also be computed from:
sin c¼_ep
1þ2_ep3
�_ep1þ2_ep
3
ð6Þ
In our study, the Vermeer and De Borst [16] equation (Eq. (4))was used, since the values for the axial and volumetric strainswere measured directly during the triaxial tests.
Consequently, to calculate the dilation angle it was necessaryto obtain the incremental plastic strains. This required us to select
J. Arzua, L.R. Alejano / International Journal of Rock Mechanics & Mining Sciences 61 (2013) 43–5652
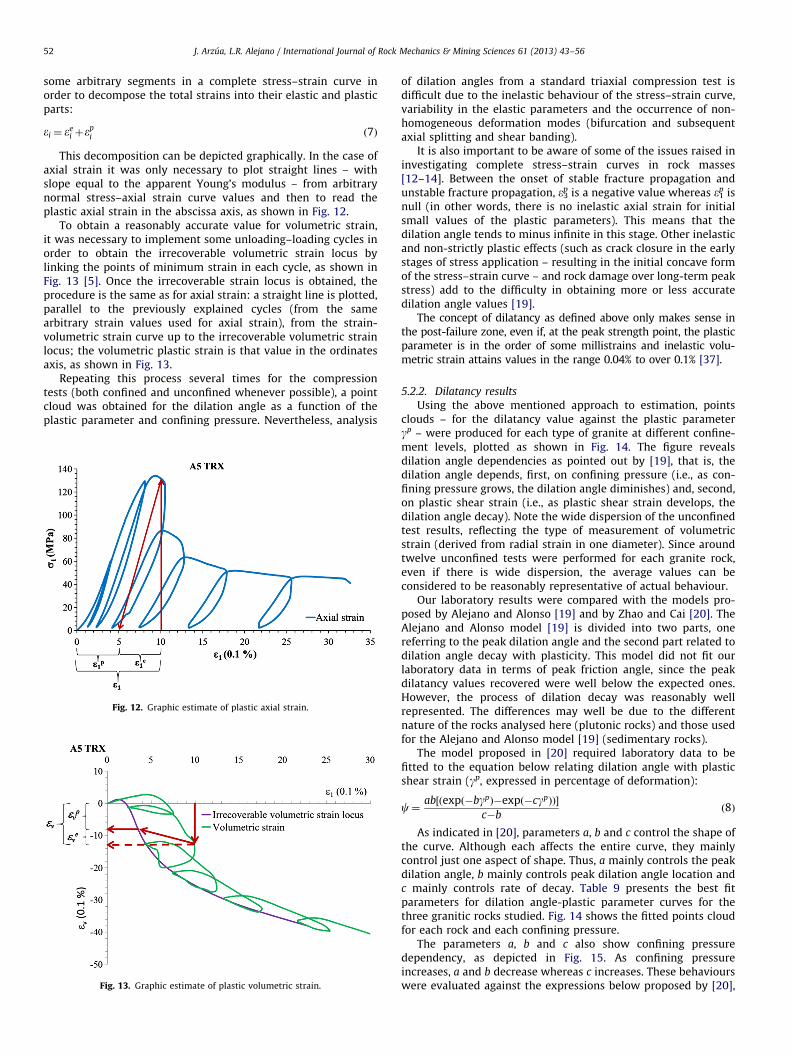
some arbitrary segments in a complete stress–strain curve inorder to decompose the total strains into their elastic and plasticparts:
ei ¼ eei þe
pi ð7Þ
This decomposition can be depicted graphically. In the case ofaxial strain it was only necessary to plot straight lines – withslope equal to the apparent Young’s modulus – from arbitrarynormal stress–axial strain curve values and then to read theplastic axial strain in the abscissa axis, as shown in Fig. 12.
To obtain a reasonably accurate value for volumetric strain,it was necessary to implement some unloading–loading cycles inorder to obtain the irrecoverable volumetric strain locus bylinking the points of minimum strain in each cycle, as shown inFig. 13 [5]. Once the irrecoverable strain locus is obtained, theprocedure is the same as for axial strain: a straight line is plotted,parallel to the previously explained cycles (from the samearbitrary strain values used for axial strain), from the strain-volumetric strain curve up to the irrecoverable volumetric strainlocus; the volumetric plastic strain is that value in the ordinatesaxis, as shown in Fig. 13.
Repeating this process several times for the compressiontests (both confined and unconfined whenever possible), a pointcloud was obtained for the dilation angle as a function of theplastic parameter and confining pressure. Nevertheless, analysis
Fig. 12. Graphic estimate of plastic axial strain.
Fig. 13. Graphic estimate of plastic volumetric strain.
of dilation angles from a standard triaxial compression test isdifficult due to the inelastic behaviour of the stress–strain curve,variability in the elastic parameters and the occurrence of non-homogeneous deformation modes (bifurcation and subsequentaxial splitting and shear banding).
It is also important to be aware of some of the issues raised ininvestigating complete stress–strain curves in rock masses[12–14]. Between the onset of stable fracture propagation andunstable fracture propagation, e3
p is a negative value whereas e1p is
null (in other words, there is no inelastic axial strain for initialsmall values of the plastic parameters). This means that thedilation angle tends to minus infinite in this stage. Other inelasticand non-strictly plastic effects (such as crack closure in the earlystages of stress application – resulting in the initial concave formof the stress–strain curve – and rock damage over long-term peakstress) add to the difficulty in obtaining more or less accuratedilation angle values [19].
The concept of dilatancy as defined above only makes sense inthe post-failure zone, even if, at the peak strength point, the plasticparameter is in the order of some millistrains and inelastic volu-metric strain attains values in the range 0.04% to over 0.1% [37].
5.2.2. Dilatancy results
Using the above mentioned approach to estimation, pointsclouds – for the dilatancy value against the plastic parametergp – were produced for each type of granite at different confine-ment levels, plotted as shown in Fig. 14. The figure revealsdilation angle dependencies as pointed out by [19], that is, thedilation angle depends, first, on confining pressure (i.e., as con-fining pressure grows, the dilation angle diminishes) and, second,on plastic shear strain (i.e., as plastic shear strain develops, thedilation angle decay). Note the wide dispersion of the unconfinedtest results, reflecting the type of measurement of volumetricstrain (derived from radial strain in one diameter). Since aroundtwelve unconfined tests were performed for each granite rock,even if there is wide dispersion, the average values can beconsidered to be reasonably representative of actual behaviour.
Our laboratory results were compared with the models pro-posed by Alejano and Alonso [19] and by Zhao and Cai [20]. TheAlejano and Alonso model [19] is divided into two parts, onereferring to the peak dilation angle and the second part related todilation angle decay with plasticity. This model did not fit ourlaboratory data in terms of peak friction angle, since the peakdilatancy values recovered were well below the expected ones.However, the process of dilation decay was reasonably wellrepresented. The differences may well be due to the differentnature of the rocks analysed here (plutonic rocks) and those usedfor the Alejano and Alonso model [19] (sedimentary rocks).
The model proposed in [20] required laboratory data to befitted to the equation below relating dilation angle with plasticshear strain (gp, expressed in percentage of deformation):
c¼ab½ðexpð�bgpÞ�expð�cgpÞÞ�
c�bð8Þ
As indicated in [20], parameters a, b and c control the shape ofthe curve. Although each affects the entire curve, they mainlycontrol just one aspect of shape. Thus, a mainly controls the peakdilation angle, b mainly controls peak dilation angle location andc mainly controls rate of decay. Table 9 presents the best fitparameters for dilation angle-plastic parameter curves for thethree granitic rocks studied. Fig. 14 shows the fitted points cloudfor each rock and each confining pressure.
The parameters a, b and c also show confining pressuredependency, as depicted in Fig. 15. As confining pressureincreases, a and b decrease whereas c increases. These behaviourswere evaluated against the expressions below proposed by [20],
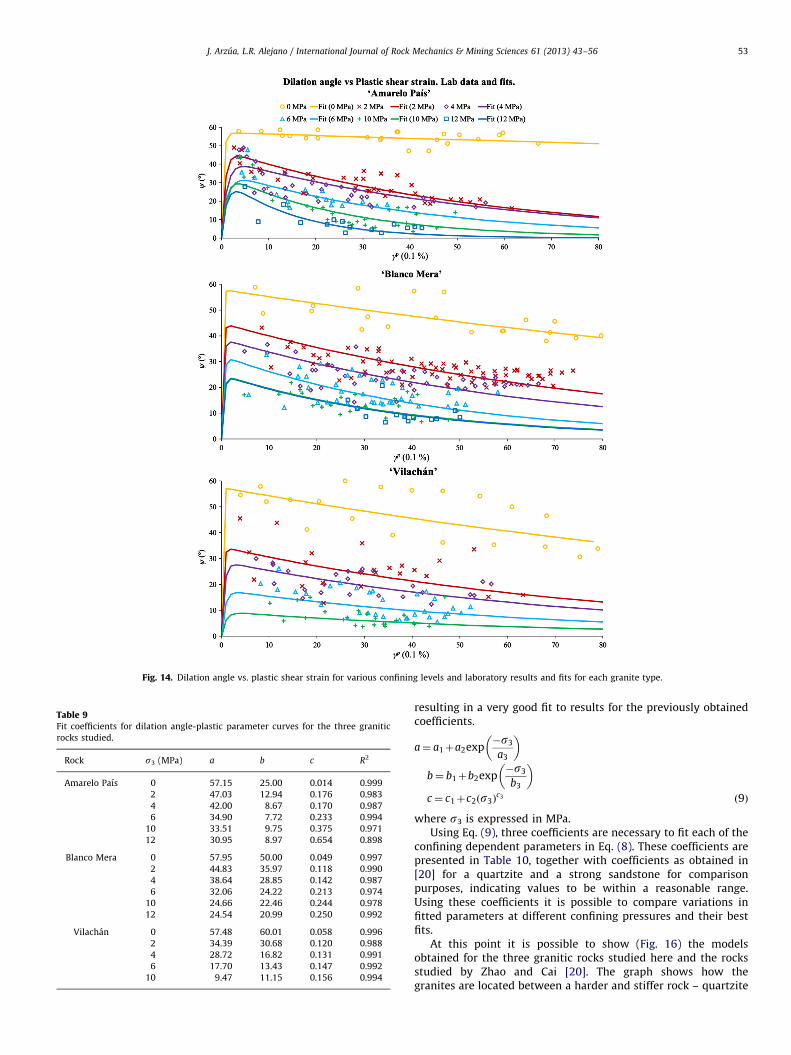
Fig. 14. Dilation angle vs. plastic shear strain for various confining levels and laboratory results and fits for each granite type.
Table 9Fit coefficients for dilation angle-plastic parameter curves for the three granitic
rocks studied.
Rock s3 (MPa) a b c R2
Amarelo Paıs 0 57.15 25.00 0.014 0.999
2 47.03 12.94 0.176 0.983
4 42.00 8.67 0.170 0.987
6 34.90 7.72 0.233 0.994
10 33.51 9.75 0.375 0.971
12 30.95 8.97 0.654 0.898
Blanco Mera 0 57.95 50.00 0.049 0.997
2 44.83 35.97 0.118 0.990
4 38.64 28.85 0.142 0.987
6 32.06 24.22 0.213 0.974
10 24.66 22.46 0.244 0.978
12 24.54 20.99 0.250 0.992
Vilachan 0 57.48 60.01 0.058 0.996
2 34.39 30.68 0.120 0.988
4 28.72 16.82 0.131 0.991
6 17.70 13.43 0.147 0.992
10 9.47 11.15 0.156 0.994
J. Arzua, L.R. Alejano / International Journal of Rock Mechanics & Mining Sciences 61 (2013) 43–56 53
resulting in a very good fit to results for the previously obtainedcoefficients.
a¼ a1þa2exp�s3
a3
� �
b¼ b1þb2exp�s3
b3
� �c¼ c1þc2ðs3Þ
c3 ð9Þ
where s3 is expressed in MPa.Using Eq. (9), three coefficients are necessary to fit each of the
confining dependent parameters in Eq. (8). These coefficients arepresented in Table 10, together with coefficients as obtained in[20] for a quartzite and a strong sandstone for comparisonpurposes, indicating values to be within a reasonable range.Using these coefficients it is possible to compare variations infitted parameters at different confining pressures and their bestfits.
At this point it is possible to show (Fig. 16) the modelsobtained for the three granitic rocks studied here and the rocksstudied by Zhao and Cai [20]. The graph shows how thegranites are located between a harder and stiffer rock – quartzite

Fig. 15. Variations in fitting parameters (a, b and c) at different confining pressures (abscissa axis) and the best fits for each granite type.
Table 10Plastic shear strain parameters and confining pressure dependent dilation angle model as proposed by Zhao and Cai [20], for the three studied granitic rocks (this study)
and two other rocks (Zhao and Cai [20]).
n a1 a2 a3 b1 b2 b3 c1 c2 c3
1 63.17 11.92 2.80 5.83 36.25 6.77 0.14 1.14 1.23
2 29.01 28.05 4.76 8.26 17.49 1.5 0.014 0.0749 0.711
3 21.13 36.71 4.92 20.63 29.44 2.97 0.047 0.049 0.589
4 3.79 53.65 4.46 10.38 49.69 2.19 0.058 0.050 0.295
5 14.63 34.90 3.40 4.06 15.56 5.54 0.08 0.40 0.58
1. Quartzite (Zhao and Cai [20]), 2. Amarelo Paıs, 3. Blanco Mera, 4. Vilachan, and 5. Strong sandstone (Zhao and Cai [20])
J. Arzua, L.R. Alejano / International Journal of Rock Mechanics & Mining Sciences 61 (2013) 43–5654
(labelled 1) – and a softer rock – sandstone (labelled 2) – as wasanticipated.
6. Conclusions
Within the framework of a study of the post-failure behaviourof rocks and rock masses, an experimental programme based on apress with fully servo-controlled loading was set up in order totest and study post-failure stress–strain behaviour in granitesamples. A total of around 90 unconfined and confined compres-sion strength tests with loading–unloading cycles and computa-tion of volumetric strain in confined tests were performed. Thisensured for every cycle that the strength attained represents thepoint of an evolving strength criterion; it also enabled us to locate
what is known as the irrecoverable strain locus, which wouldenable us to obtain reliable values for the dilation angle.
Peak and residual strength, apparent Young’s modulus, appar-ent Poisson’s ratio, estimated drop modulus and shear bandinclination were estimated for each test and dilation anglebehaviour was computed all throughout the deformation process.
The dilation angle was computed from data in each ofthe compression tests when this was possible. As previouslyobserved, this angle was shown to be dependent on both confin-ing stress and plastic shear strain. Test results were comparedwith previously proposed models and our data fitted reasonablywell with those of the Zhao and Cai [20] model. Accordingly, wecalculated best fit parameters for our data, obtaining adjustmentcurves very similar to those reported by Zhao and Cai [20] foranalogous rocks, since our granite dilation angle results were
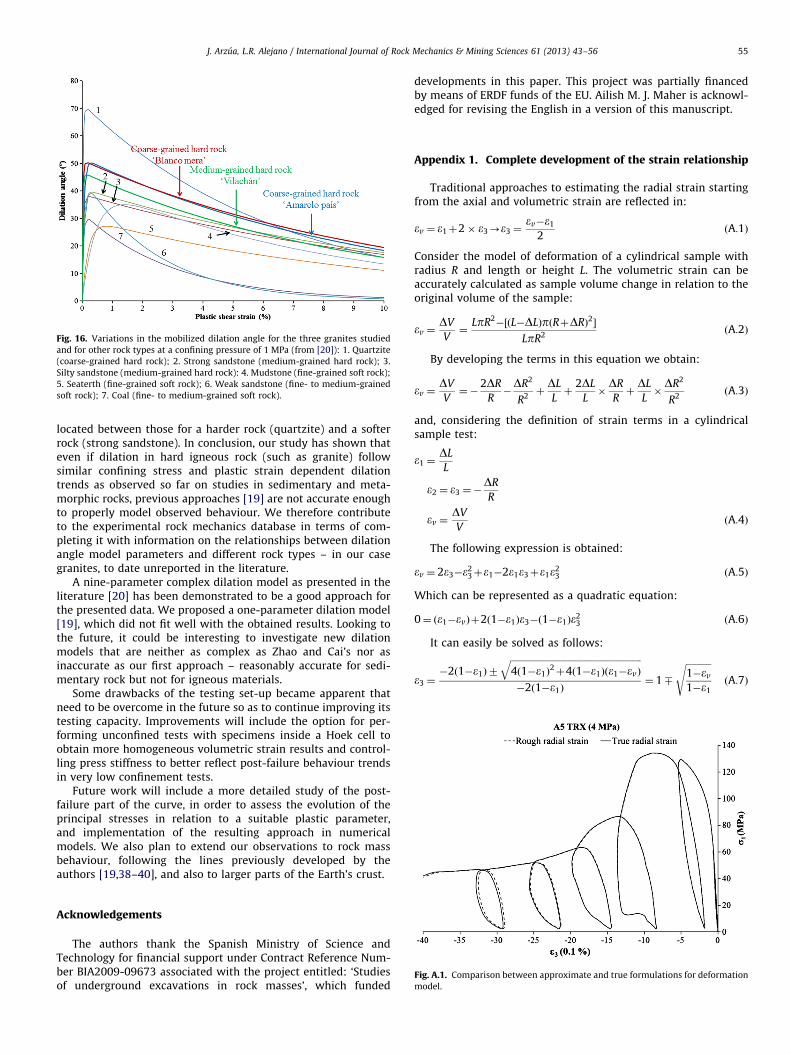
Fig. 16. Variations in the mobilized dilation angle for the three granites studied
and for other rock types at a confining pressure of 1 MPa (from [20]): 1. Quartzite
(coarse-grained hard rock); 2. Strong sandstone (medium-grained hard rock); 3.
Silty sandstone (medium-grained hard rock): 4. Mudstone (fine-grained soft rock);
5. Seaterth (fine-grained soft rock); 6. Weak sandstone (fine- to medium-grained
soft rock); 7. Coal (fine- to medium-grained soft rock).
J. Arzua, L.R. Alejano / International Journal of Rock Mechanics & Mining Sciences 61 (2013) 43–56 55
located between those for a harder rock (quartzite) and a softerrock (strong sandstone). In conclusion, our study has shown thateven if dilation in hard igneous rock (such as granite) followsimilar confining stress and plastic strain dependent dilationtrends as observed so far on studies in sedimentary and meta-morphic rocks, previous approaches [19] are not accurate enoughto properly model observed behaviour. We therefore contributeto the experimental rock mechanics database in terms of com-pleting it with information on the relationships between dilationangle model parameters and different rock types – in our casegranites, to date unreported in the literature.
A nine-parameter complex dilation model as presented in theliterature [20] has been demonstrated to be a good approach forthe presented data. We proposed a one-parameter dilation model[19], which did not fit well with the obtained results. Looking tothe future, it could be interesting to investigate new dilationmodels that are neither as complex as Zhao and Cai’s nor asinaccurate as our first approach – reasonably accurate for sedi-mentary rock but not for igneous materials.
Some drawbacks of the testing set-up became apparent thatneed to be overcome in the future so as to continue improving itstesting capacity. Improvements will include the option for per-forming unconfined tests with specimens inside a Hoek cell toobtain more homogeneous volumetric strain results and control-ling press stiffness to better reflect post-failure behaviour trendsin very low confinement tests.
Future work will include a more detailed study of the post-failure part of the curve, in order to assess the evolution of theprincipal stresses in relation to a suitable plastic parameter,and implementation of the resulting approach in numericalmodels. We also plan to extend our observations to rock massbehaviour, following the lines previously developed by theauthors [19,38–40], and also to larger parts of the Earth’s crust.
Fig. A.1. Comparison between approximate and true formulations for deformation
model.
Acknowledgements
The authors thank the Spanish Ministry of Science andTechnology for financial support under Contract Reference Num-ber BIA2009-09673 associated with the project entitled: ‘Studiesof underground excavations in rock masses’, which funded
developments in this paper. This project was partially financedby means of ERDF funds of the EU. Ailish M. J. Maher is acknowl-edged for revising the English in a version of this manuscript.
Appendix 1. Complete development of the strain relationship
Traditional approaches to estimating the radial strain startingfrom the axial and volumetric strain are reflected in:
ev ¼ e1þ2� e3-e3 ¼ev�e1
2ðA:1Þ
Consider the model of deformation of a cylindrical sample withradius R and length or height L. The volumetric strain can beaccurately calculated as sample volume change in relation to theoriginal volume of the sample:
ev ¼DV
V¼
LpR2�½ðL�DLÞpðRþDRÞ2�
LpR2ðA:2Þ
By developing the terms in this equation we obtain:
ev ¼DV
V¼�
2DR
R�DR2
R2þDL
Lþ
2DL
L�DR
RþDL
L�DR2
R2ðA:3Þ
and, considering the definition of strain terms in a cylindricalsample test:
e1 ¼DL
L
e2 ¼ e3 ¼�DR
R
ev ¼DV
VðA:4Þ
The following expression is obtained:
ev ¼ 2e3�e23þe1�2e1e3þe1e2
3 ðA:5Þ
Which can be represented as a quadratic equation:
0¼ ðe1�evÞþ2ð1�e1Þe3�ð1�e1Þe23 ðA:6Þ
It can easily be solved as follows:
e3 ¼�2ð1�e1Þ7
ffiffiffiffiffiffiffiffiffiffiffiffiffiffiffiffiffiffiffiffiffiffiffiffiffiffiffiffiffiffiffiffiffiffiffiffiffiffiffiffiffiffiffiffiffiffiffiffiffiffiffiffiffiffiffiffiffi4ð1�e1Þ
2þ4ð1�e1Þðe1�evÞ
q�2ð1�e1Þ
¼ 18
ffiffiffiffiffiffiffiffiffiffiffi1�ev
1�e1
sðA:7Þ

J. Arzua, L.R. Alejano / International Journal of Rock Mechanics & Mining Sciences 61 (2013) 43–5656
Since the positive root has no physical meaning, the final validequation remains:
e3 ¼ 1�
ffiffiffiffiffiffiffiffiffiffiffi1�ev
1�e1
sðA:8Þ
It is important to note that Eq. (A.1) will be produced if secondand third order infinitesimal terms are rejected during develop-ment of the equation.
If the two formulations are compared, a slight difference canbe observed at very high strain levels, as depicted in Fig. A.1.This difference is not relevant in this study, so the simplifiedformulation was used to obtain radial strain.
References
[1] Hudson JA, Brown ET, Fairhurst C. Optimizing the control of rock failure inservo-controlled laboratory tests. Rock Mech 1971;3(4):217–24.
[2] Rummel F, Fairhurst C. Determination of the post-failure behavior of brittlerock using a servo-controlled testing machine. Rock Mech 1970;2(4):189–204.
[3] Wawersik WR, Brace WF. Post-failure behavior of a granite and diabase. RockMech 1971;3(2):61–85.
[4] Wawersik WR, Fairhurst C. A study of brittle rock fracture in laboratorycompression experiments. Int J Rock Mech Min Sci 1970;7(5):561–4.
[5] Crouch SL. Experimental determination of volumetric strains in failed rock.Int J Rock Mech Min Sci 1970;7(6):589–603.
[6] Medhurst TP. Estimation of the in situ strength and deformability of coal forengineering design. PhD thesis. University of Queensland, Australia; 1996.
[7] Elliot GM, Brown ET. Yield of a soft, high porosity rock. Geotechnique1985;35(4):413–23.
[8] Cipullo A, White W, Lee IK. Computer controlled volumetric strain measure-ments in metadolerite. Bull Eng Geol Environ 1985;32(1):55–65.
[9] Wawersik WR. Technique and apparatus for strain measurements on rock inconstant confining pressure experiments. Rock Mech 1975;7(4):231–41.
[10] Singh AB. Study of rock fracture by permeability method. J GeotechGeoenviron 1997;123(7):601–8.
[11] Medhurst TP, Brown ET. A study of the mechanical behavior of coal for pillardesign. Int J Rock Mech Min Sci 1998;35(8):1087–105.
[12] Hudson JA, Brown ET, Fairhurst C. Shape of the complete stress–strain curvefor rock. In: Proceedings of the 13th symposium on rock mechanics.University of Illinois; 1971.
[13] Jaeger J, Cook NGW, Zimmerman RW. Fundamentals of rock mechanics. 4th ed.Oxford: Wiley-Blackwell; 2007.
[14] Price AM, Farmer IW. Application of yield models to rock. Int J Rock MechMin Sci 1979;16(2):157–60.
[15] Kudoh K, Koyama T, Nambo S. Support design of a large underground cavernconsidering strain-softening of the rock. Ninth ISRM congress, Paris. Balkema,Rotterdam 1999; 1, 407-411.
[16] Vermeer PA, De Borst R. Non-associated plasticity for soils, concrete and rock.Heron 1984;29(3):64.
[17] Detournay E. Elasto-plastic model of a deep tunnel for a rock with variabledilatancy. Rock Mech Rock Eng 1986;19:99–108.
[18] Yuan S, Harrison JP. An empirical dilatancy index for the dilatant deformationof rock. Int J Rock Mech Min Sci 2004;41(4):679–86.
[19] Alejano LR, Alonso E. Considerations of the dilatancy angle in rocks and rockmasses. Int J Rock Mech Min Sci 2005;42(4):481–507.
[20] Zhao XG, Cai M. A mobilized dilation angle model for rocks. Int J Rock MechMin Sci 2010;47(3):368–84.
[21] Cook NGW. An experiment proving that dilatancy is a pervasive volumetricproperty of brittle rock loaded to failure. Rock Mech 1970;2(4):181–8.
[22] Holcomb DJ. Quantitative model of dilatancy in dry rock and its applicationto westerly granite. J Geophys Res 1978;83(B10):4941–50.
[23] Hoek E, Brown ET. Practical estimates of rock mass strength. Int J Rock MechMin Sci 1997;34(8):1165–86.
[24] Alejano LR, Posada D, Rodriguez-Dono A. Servo-controlled strength tests onmoderately weathered granite. In: Proc. of the EUROCK 2009 symposium.Rock engineering in difficult ground conditions. London: CRC. Taylord &Francis Gr.; 2009 Soft Rock & Karst. 181-6.
[25] Hudson JA, Crouch SL, Fairhurst C. Soft, stiff and servo-controlled testingmachines: a review with reference to rock failure. Eng Geol 1972;6:155–89.
[26] Farmer IW. Engineering behavior of rocks. 2nd ed. London: Chapman & Hall;1983.
[27] ISRM. The complete ISRM suggested methods for rock characterization,testing and monitoring: 1974–2006. Prepared by the commission on testingmethods, ISRM. Ankara, Turkey: Ulusay R, Hudson JA; 2007.
[28] Barton N. The shear strength of rock and rock joints. Int J Rock Mech Min Sci1976;13:1–24.
[29] Martin CD, Read RS. AECL’s mine by experiment: a test tunnel in brittle rock.Rock mechanics: tools & techniques. In: Proc. of the NARMS’96 symposium.In Aubertin, Hassani and Mitri, Montreal, 19–21 June. Balkema: Rotterdam;1996.
[30] Bukowska M. Mechanical properties of carboniferous rocks in the upperSilesian coal basin under uniaxial and triaxial compression tests. J Min Sci2005;41(2):129–33.
[31] Brown ET, Bray JW, Santarelli FJ. Influence of stress-dependent elastic modulion stresses and strain around axisymmetric boreholes. Rock Mech Rock Eng1987;22:189–203.
[32] Gercek H. Poisson’s ratio values for rocks. Int J Rock Mech Min Sci2007;44(1):1–13.
[33] Von Karman Th. Festigkeitsversuche unter allseitigem Druck. Verh Dtsch Ing1911;55:1749–57.
[34] Besu�elles P, Desrues J, Raynaud P. Experimental characterization of thelocalization phenomenon inside a Vosgues sandstone in a triaxial cell. Int JRock Mech Min Sci 2000;37:1123–237.
[35] Vardoulakis IG, Sulem J. Application of bifurcation theory of rock mechanicsproblems. In: Hudson. J, editor. Comprehensive rock engineering, vol. 1.Oxford: Pergamon Press; 1993. p. 576–610.
[36] Zhao XG, Cai M. Influence of plastic shear strain and confining-dependentrock dilation on rock failure and displacement near an excavation boundary.Int J Rock Mech Min Sci 2010;47:723–38.
[37] Scholz CH. Micro-fracturing and the inelastic deformation of rock in com-pression. J Geophys Res 1968;73:1417–32.
[38] Alejano LR, Rodriguez-Dono A, Alonso E, Fernandez-Manın G. Ground reac-tion curves for tunnels excavated in different quality rock masses showingseveral types of post-failure behaviour. Tunnel Underground Space Technol2009;24(6):689–705.
[39] Alejano LR, Alonso E, Rodriguez-Dono A, Fernandez-Manın G. Application ofthe convergence–confinement method to tunnels in rock masses exhibitingHoek–Brown strain-softening behaviour. Int J Rock Mech Min Sci 2010;47(1):150–60.
[40] Alejano LR, Rodriguez-Dono A, Veiga M. Plastic radii and longitudinaldeformation profiles of tunnels excavated in strain-softening rock masses.Tunnel Underground Space Technol. 2012;30:169–82.
Copyright © 2022 FDOKUMEN