Experimental analysis of kaolinite particle orientation during triaxial path
22
INTERNATIONAL JOURNAL FOR NUMERICAL AND ANALYTICAL METHODS IN GEOMECHANICS Int. J. Numer. Anal. Meth. Geomech. 2011; 35:947–968 Published online 14 May 2010 in Wiley Online Library (wileyonlinelibrary.com). DOI: 10.1002/nag.936 Experimental analysis of kaolinite particle orientation during triaxial path Mahdia Hattab 1, ∗, † and Jean-Marie Fleureau 2 1 Laboratoire de Physique et Mécanique des Matériaux, FRE CNRS 3236, Université Paul Verlaine, Ile du Saulcy – 57045 Metz Cedex1, France 2 Laboratoire de Mécanique des Sols, Structures et Matériaux, UMR CNRS 8579, Ecole Centrale Paris, Grande voie des vignes, 92295 Châtenay Malabry Cedex, France SUMMARY The goal of this study was to analyze the relation between the behaviour of a clayey material at the macroscopic scale and its microfabric evolution. This may lead to a better understanding of macroscopic strain mechanisms especially the contractancy and dilatancy phenomena. The approach proposed in this paper is based on the study of clay particles orientation by SEM picture analysis after different phases of triaxial loading. In the initial state of the samples (one-dimensional compression), the SEM observations highlight a microstructural anisotropy with a preferential orientation of the particles normal to the loading direction. During isotropic loading, densification of the clayey matrix occurs related to a random orientation of particles indicated by the term ‘depolarization’. In the earlier stages of constant 3 drained triaxial path on slightly overconsolidated specimens, the microstructural depolarization seems to persist inside a macroscopic domain, in which only the volumetric strains due to the isotropic part of the stress tensor evolve. Then, a rotation mechanism of the particles towards preferred directions seems to be activated. The phenomenon appears directly linked to the evolution of the deviatoric part of the stress tensor. Copyright 2010 John Wiley & Sons, Ltd. Received 2 October 2009; Revised 26 March 2010; Accepted 29 March 2010 KEY WORDS: consolidation; anisotropy; microfabric; microscopy; clay behaviour; triaxial tests 1. INTRODUCTION The approach usually used in classical soil mechanics to characterize strain mechanisms consists in considering the global (macroscopic) level, using, for example, the principles of the continuous media mechanics in the formal framework of elasto-plasticity. Numerous ‘phenomenological’ constitutive models were developed such as the elasto-plastic Cam Clay models that are especially adapted to describe the behaviour of remoulded reconstituted clays [1, 2]. A particular interest for the dilatancy phenomenon was shown in these works and stress-dilatancy theories have been developed through the energy principles [1, 3, 4]. Triaxial test constitutes, in this way, a basic method for experimental investigation [5]. Henkel [6] established the link between the appearance of dilatancy, its evolution, and the overconsolidation state of the clay represented by the OCR parameter. Some studies, more focused on strain mechanisms, tried to get a better understanding of the coupling between the isotropic and deviatoric mechanisms by carrying out triaxial tests on particular stress paths [7]. These studies contributed to improving and refining the writing of ∗ Correspondence to: Mahdia Hattab, Laboratoire de Physique et Mécanique des Matériaux, FRE CNRS 3236, Université Paul Verlaine, Ile du Saulcy – 57045 Metz Cedex1, France. † E-mail: [email protected] Copyright 2010 John Wiley & Sons, Ltd.
Transcript of Experimental analysis of kaolinite particle orientation during triaxial path
INTERNATIONAL JOURNAL FOR NUMERICAL AND ANALYTICAL METHODS IN GEOMECHANICSInt. J. Numer. Anal. Meth. Geomech. 2011; 35:947–968Published online 14 May 2010 in Wiley Online Library (wileyonlinelibrary.com). DOI: 10.1002/nag.936
Experimental analysis of kaolinite particle orientation duringtriaxial path
Mahdia Hattab1,∗,† and Jean-Marie Fleureau2
1Laboratoire de Physique et Mécanique des Matériaux, FRE CNRS 3236, Université Paul Verlaine, Ile duSaulcy – 57045 Metz Cedex1, France
2Laboratoire de Mécanique des Sols, Structures et Matériaux, UMR CNRS 8579, Ecole Centrale Paris, Grandevoie des vignes, 92295 Châtenay Malabry Cedex, France
SUMMARY
The goal of this study was to analyze the relation between the behaviour of a clayey material at themacroscopic scale and its microfabric evolution. This may lead to a better understanding of macroscopicstrain mechanisms especially the contractancy and dilatancy phenomena. The approach proposed in thispaper is based on the study of clay particles orientation by SEM picture analysis after different phases oftriaxial loading. In the initial state of the samples (one-dimensional compression), the SEM observationshighlight a microstructural anisotropy with a preferential orientation of the particles normal to the loadingdirection. During isotropic loading, densification of the clayey matrix occurs related to a random orientationof particles indicated by the term ‘depolarization’. In the earlier stages of constant �3 drained triaxialpath on slightly overconsolidated specimens, the microstructural depolarization seems to persist inside amacroscopic domain, in which only the volumetric strains due to the isotropic part of the stress tensorevolve. Then, a rotation mechanism of the particles towards preferred directions seems to be activated. Thephenomenon appears directly linked to the evolution of the deviatoric part of the stress tensor. Copyright� 2010 John Wiley & Sons, Ltd.
Received 2 October 2009; Revised 26 March 2010; Accepted 29 March 2010
KEY WORDS: consolidation; anisotropy; microfabric; microscopy; clay behaviour; triaxial tests
1. INTRODUCTION
The approach usually used in classical soil mechanics to characterize strain mechanisms consistsin considering the global (macroscopic) level, using, for example, the principles of the continuousmedia mechanics in the formal framework of elasto-plasticity. Numerous ‘phenomenological’constitutive models were developed such as the elasto-plastic Cam Clay models that are especiallyadapted to describe the behaviour of remoulded reconstituted clays [1, 2]. A particular interestfor the dilatancy phenomenon was shown in these works and stress-dilatancy theories have beendeveloped through the energy principles [1, 3, 4]. Triaxial test constitutes, in this way, a basicmethod for experimental investigation [5]. Henkel [6] established the link between the appearanceof dilatancy, its evolution, and the overconsolidation state of the clay represented by the OCRparameter. Some studies, more focused on strain mechanisms, tried to get a better understandingof the coupling between the isotropic and deviatoric mechanisms by carrying out triaxial testson particular stress paths [7]. These studies contributed to improving and refining the writing of
∗Correspondence to: Mahdia Hattab, Laboratoire de Physique et Mécanique des Matériaux, FRE CNRS 3236,Université Paul Verlaine, Ile du Saulcy – 57045 Metz Cedex1, France.
†E-mail: [email protected]
Copyright � 2010 John Wiley & Sons, Ltd.

948 M. HATTAB AND J.-M. FLEUREAU
the constitutive models, but without link with the local mechanisms that occur at the microscopicscale. Other approaches of dilatancy phenomenon were also conducted in the framework of discreteelements, by considering the macroscopic deformation of granular packings through the propertiesof particle contacts [8–10].
However, partly because of the lack of experimental data, especially in clayey materials, incor-porating in continuous models the local mechanisms that occur at the microscopic scale remainsa complex approach. In this way, work can be found in the literature, in particular for granularmaterial, where fabric is regarded as a tensor representing the anisotropy of the granular packing,e.g. [11–14].
From the experimental point of view, a few works investigated the microfabric of clayey materialswhere the specimens are subjected to a given loading. Thus, starting from direct shear testson kaolin, Morgenstern and Tchalenko [15], using polarized light microscopy, showed a strongorientation of the clay particles in the direction of the movement. Several investigators used varioustechniques to study the evolution of clay fabric during one-dimensional compression tests: X-raydiffraction [16, 17], scanning electron microscopy [18, 19]. These works show that the structuralanisotropy of remoulded materials progressively develops itself with the loading. Bai and Smart[20] used digital image analysis of both optical and scanning electron micrographs to highlight thechange of kaolin microstructure on undrained axisymmetric triaxial paths. The authors observedfirst an increase in the anisotropy of the samples with strain followed by a decrease. However, theyreported some difficulties, suggesting a possible instability in the microstructural response to thestrain increase, since similar samples showed opposite responses under the same conditions. Hicheret al. [21] used scanning and transmission electron microscope photographs to study the changesin the microfabric of saturated kaolin and bentonite specimens after drained triaxial tests: theyobserved the creation of structural anisotropy during loading and concluded that the mechanicalbehaviour is largely dependent on the changes that occur at the particle scale.
The aim of this paper is to try to deduce a local mechanism of orientation, by analyzing the corre-spondence between the particles orientation and the phenomenological behavior at the macroscopiclevel. This study has been carried out by means of isotropic and ‘classical’ axisymmetric drainedtriaxial paths (i.e. with �3 =constant) performed on remoulded saturated, normally consolidatedand overconsolidated, kaolin samples.
2. MATERIAL PROPERTIES AND EXPERIMENTAL PROCEDURE
2.1. Material properties
Tests were performed on specimens of ‘kaolin P300’, which is an industrial clay known as ‘yellowclay’ containing about 95% of pure kaolinite. The liquid and plastic limits are wL =40% andwP =20%, respectively, and the unit weight of solid grains is �s =2.65 ·�w.
X-ray diffraction analysis (Figure 1) and SEM observations indicate a large proportion ofkaolinite particles, some quartz grains, and traces of illite. SEM pictures on Figure 2 show a globalview of the clayey matrix fabric (Figure 2(a)), as well as front (Figure 2(b)) and side (Figure 2(c))views of kaolinite particles.
The term kaolinite particle is used here to indicate a grouping of face-to-face stacked unit layers(unit cell of clayey minerals).
2.2. Experimental set-up
The experimental set-up used for the mechanical tests consists of a triaxial cell similar to Bishop–Wesley cell [22]. The cell is connected to three pressure–volume controllers and a microcomputerfor control and data acquisition. The controllers assure the control of the radial stress �3, of theaxial stress �1 (generated by the displacement of a jack in the bottom part of the cell), and of theback pressure. They also allow the measurement of volume changes, force, and axial displacement.Triaxial tests were carried out on saturated samples, the first step consisting in checking the qualityof the saturation by following Skempton’s coefficient B =�u/��3, until B was close to 1.
Copyright � 2010 John Wiley & Sons, Ltd. Int. J. Numer. Anal. Meth. Geomech. 2011; 35:947–968DOI: 10.1002/nag

EXPERIMENTAL ANALYSIS OF KAOLINITE PARTICLE ORIENTATION 949
3020100
500
1000
1500
0.35 nmK (002)
0.97nmI(001)
0.7 nmK (001)
0,33nm Quartz
0.42nmQuartz
I (U
.A)
°2θ (Cu-Kα)
Figure 1. X-ray diffraction analysis.
Figure 2. SEM observation of kaolinite: (a) P300 kaolinite; (b) kaolinite particles,front view; and (c) kaolinite particles, side view.
Specimens were prepared from clay slurry at a water content of twice the liquid limit. The slurrywas poured in a cylindrical rigid mould (diameter=100m), then consolidated under a vertical stressof 120 kPa in several steps. After removing a large sample from the mould, cylindrical specimenswere trimmed to reach a slenderness ratio (length to diameter) equal to 1 (H = D =35mm). Thespecimen was then placed in the triaxial cell, with an anti-frictional system allowing drainage at
Copyright � 2010 John Wiley & Sons, Ltd. Int. J. Numer. Anal. Meth. Geomech. 2011; 35:947–968DOI: 10.1002/nag

950 M. HATTAB AND J.-M. FLEUREAU
the two ends. The anti-frictional device was a ‘sandwich’ made of two circular smooth plates anda latex layer lubricated by means of grease. This kind of device appears as an optimal compromiseto maintain the homogeneity of the sample up to large strains, by significantly reducing frictionat the sample ends [23–25].
Several triaxial loading tests were carried out before the microstructural investigations. Anisotropic loading test was performed under an effective isotropic stress p′
c,0 =1400kPa. Sevendrained triaxial tests were carried out: (i) three normally consolidated tests (NC700, NC1000,and NC1400, with effective isotropic stresses p′
c,0 of 700, 1000, and 1400 kPa, respectively); (ii)three overconsolidated tests with an OCR of 1.4. In that case, the specimens were first isotropi-cally consolidated to an isotropic stress p′
c,0 =1400kPa, then they were re-consolidated to p′c,1 =
1000kPa) and finally sheared under �′3 =1000kPa. This value was chosen so that the behaviour of
the specimen was contractant. The tests were stopped when the axial strain reached ε1 =5, 15, and25%, respectively, and (iii) one overconsolidated test at OCR 9.33 with an effective consolidationstress p′
c,0 =1400kPa.Before each microscopic observation, the specimens were withdrawn from the cell after triaxial
unloading. This unloading was carried out by first removing the deviatoric stress, then the isotropicstress under undrained conditions.
2.3. Method used for the analysis of particles orientation
The method consists in analyzing the orientation of the clay particles using SEM pictures ontwo planes of the specimen, horizontal, and vertical, the specimen being in a given macroscopicstate of stress and strain. Two small parallelepipedic samples are extracted from the center of thespecimen (Figure 3(a)), and marked as (1) or (2) according to their orientation with respect to thedirection of the principal stresses of the triaxial loading, �1 and �3. In order to keep the fabricin suitable conditions inside the material after triaxial unloading, the samples were first frozenin liquid nitrogen and then freeze-dried [26]. The (H ) or (V ) planes used for the observationswere obtained by fracturing the frozen samples. Regarding the vertical plane, the Y axis of themicrograph (Figure 3(b) and Figure 3(c)) was chosen so that it coincides with the Z axis of thecylindrical specimen.
The SEM pictures were taken at various points in the observation planes. Considering, forinstance, the photo of Figure 4(a) taken at a given observation point, the analytical method consistsin randomly extracting from this photo representative surfaces, to isolate them (Figure 4(b)), toidentify each particles seen sideways and to draw manually a segment having the same dimensionand orientation. A treatment of the photo is shown in Figure 4(c) where all the particles arerepresented. Orientation of 0◦ corresponds to the X axis. Image processing of the diagram thusobtained allows to calculate the orientation of all the represented particles with respect to the Xaxis. An angular distribution diagram can then be drawn as a rose diagram giving the percentageof side particles as a function of their orientation (Figure 4(d)). A global rose diagram is thenplotted as the result of the treatment of at least six isolated pictures randomly taken from differentobservation points. The diameter of the clay particles being smaller than 2�m, each representativesurface (zone of 20×20�m, Figure 4(b)) can be considered to contain a large enough number ofparticles (between 1000 and 1500 particles in the vertical planes) to be statistically significant.
3. MECHANISMS OF MACROSCOPIC STRAIN
3.1. Basic notions and triaxial testing procedure
In soils, as in other porous media, the application of a stress tensor �′ generates volume changes.�′ may be divided into two parts: the deviatoric part q ·c and the isotropic part p′ · I , such as:
�′ij = p′�ij +qcij (1)
Copyright � 2010 John Wiley & Sons, Ltd. Int. J. Numer. Anal. Meth. Geomech. 2011; 35:947–968DOI: 10.1002/nag

EXPERIMENTAL ANALYSIS OF KAOLINITE PARTICLE ORIENTATION 951
Figure 3. Cross-sections for the SEM observations: (a) samples for observation and stress state;(b) horizontal plane of observation; and (c) vertical plane of observation.
0˚
0˚
90˚
180˚̊
270˚
Y
X
-a- -b-
-c--d-
Figure 4. Method of analysis and picture treatment.
Copyright � 2010 John Wiley & Sons, Ltd. Int. J. Numer. Anal. Meth. Geomech. 2011; 35:947–968DOI: 10.1002/nag
952 M. HATTAB AND J.-M. FLEUREAU
In the special case of an axisymmetric compression test, the isotropic effective stress is definedby p′ = (�′
1 +2�′3)/3; and the deviatoric part of the effective stress tensor by q =�′
1 −�′3. �′
1 is themajor principal effective stress and �′
3 the minor principal effective stress. �ij is the identity matrixand cij = ( 2
3 − 13 − 1
3 ).An increase in the isotropic stress tensor always generates a contractive volumetric strain
(volume decrease) dεp′v �0, whereas an increase in the deviatoric part of the stress tensor produces
a volumetric strain which can be positive or negative, i.e. dεqv�0 for contractant material or
dεqv�0 for dilatant material. The sign of dε
(d)v is highly dependent on the overconsolidation
ratio (OCR).Dilatancy is defined as the volumetric strain increase phenomenon caused by an increase in
the deviatoric part of the effective stress tensor (Equation (1)). It is, therefore, difficult to observeand to analyze the phenomenon in a classical drained triaxial test (under �′
3 =constant), where theeffective mean stress p′ evolves at the same time as the deviatoric stress q . Under these conditions,the total increment of volumetric strain (dεt
v), experimentally accessible, is global and corresponds
to a simultaneous evolution of the two indistinguishable parts of the strain, i.e. dεp′v and dε
qv .
On the contrary, the purely deviatoric stress path (under constant p′), being liberated from theisotropic part of the stress, permits a precise survey of the dilatancy phenomenon. In this case, the
part of the strain due to the evolution of the isotropic stress is zero (dεp′v =0), and the evolution
of the volumetric strain obtained experimentally corresponds to the evolution of the deviator qalone. In what follows, the macroscopic kaolin behaviour analysis will focus on the descriptionof these strain mechanisms (more especially on the volumetric strain evolution) obtained from theexperimental results, while considering three different loading paths, i.e. the isotropic stress path(where only p′ acts), the purely deviatoric stress path (where only q acts) in order to describethe dilatancy phenomenon precisely, and then the classical drained stress path under constant �′
3(where the stresses p′ and q both act simultaneously).
3.2. Isotropic stress path
Figure 5(a) presents, in the (log p′−e) plane, a representative isotropic loading–unloading curvefor the kaolin derived from a large number of tests. This curve highlights two linear behaviours:the normally consolidated behaviour represented by the Cc slope, which is the compressibilityindex, and the overconsolidated behaviour represented by the Cs slope, which is the swelling index.Therefore, the strain on the isotropic stress path verifies the system of equations (Equation (2)),the stress state being �′
1 =�′2 =�′
3 (Figure 5(b)). e is the void ratio and p′ the effective mean stress(p′
1 is taken equal to 1 kPa). One notes that the values obtained for the compression and swellingindices (Cc =0.191 and Cs =0.066) are usual values for a clay with low plasticity index [27]:
e = e�−Cc log
(p′
p′1
)
e = e�−Cs log
(p′
p′1
) (2)
Assuming the OC path to be reversible (see the loading–unloading path, Figure 5(a)), the volumetricstrain increment on this path can be expressed by the following equation, e0 being the initial voidratio before isotropic loading:
dεtv =dε p′
v =− Cs
2.3(1+e0)
dp′
p′ (3)
3.3. Dilatancy phenomenon and purely deviatoric stress paths (constant p′)
In the triaxial test, a purely deviatoric stress path can be performed, consisting in maintainingthe effective mean stress p′ constant. The increment of the effective stress tensor applied to the
Copyright � 2010 John Wiley & Sons, Ltd. Int. J. Numer. Anal. Meth. Geomech. 2011; 35:947–968DOI: 10.1002/nag

EXPERIMENTAL ANALYSIS OF KAOLINITE PARTICLE ORIENTATION 953
Figure 5. Isotropic paths on P300 kaolinite: (a) NC path and OC path and (b) isotropic stress state.
specimen corresponds thus to the increment of the deviatoric tensor dq cij (Equation (1)), and thedeviatoric strain becomes εt
v =εqv .
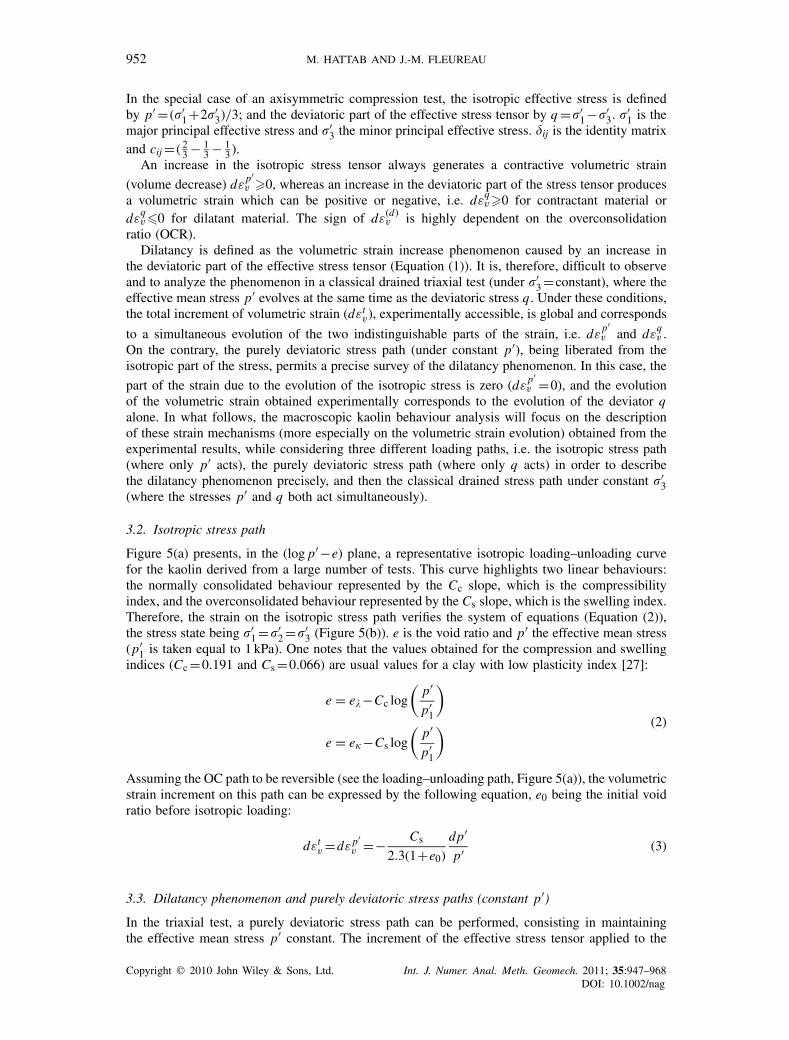
Several tests under constant p′, with OCRs ranging from 1 to 50, were performed on kaolinby Hattab and Hicher [7] and a thorough dilatant behaviour analysis of the overconsolidatedclays has been carried out. The results of the tests show in particular that in the earlier stages ofoverconsolidated clay loading, a first phase appears in the (q −εv) plane with no volumetric strain(Figure 6(a)). Then, the behaviour becomes either contractant, when the OCR is less than 2.5, ordilatant when the OCR is higher than 2.5, a large dilatancy characterizing very high OCR. Threedomains in the (p′−q) plane can be identified:
• a ‘constant volume’ domain (called volumetric pseudo-elastic domain by Biarez and Hicher,1994), limited by the experimental (OABC) in (q − p′) plane (Figure 6(a)),
• a contractancy domain limited by the curve (BC) on the one hand and by the critical state lineM (deduced from normally consolidated tests) on the other hand,
• a dilatancy domain limited by the experimental curve (OAB) on the one hand and by theexperimental curve of maximum strength (�) on the other hand.
These results projected in the (log p′−e) plane (Figure 6(b)) show that all the paths performed underconstant p′, whatever the OCR, tend at the end of loading towards the critical state representedby the CSL line (the CSL line was deduced from normally consolidated tests as well).
3.4. Classical triaxial path (constant �3)
Is, in this case of loading, the total volumetric strain εtv results from the evolution of the two
components of the applied stress tensor, the isotropic component p′ and the deviatoric component q .The triaxial drained behaviour of remoulded clays is now well-known (in particular that of
kaolin, which has been the subject of numerous studies in the past) and has been conceptualized inparticular by Biarez and Hicher [5]. These studies highlight the contractant behaviour of normallyconsolidated or weakly overconsolidated (OCR<2) clays, and the dilatant behaviour of highlyoverconsolidated clays (OCR>2), the dilatancy appearing after a first phase of contractancy.Indeed, test results show, in the early stages of overconsolidated samples loading, curves in the(p′−e) plane that exhibit a path following roughly the swelling curve Cs. Afterwards, the pathleads progressively towards the critical state. This contractancy/dilatancy phenomenon is wellhighlighted by the example shown in Figure 7, where two loading paths are represented, one underconstant �′
3 and the other one on purely deviatoric path. Both kinds of paths were performed atOCRs, OCR=5 and OCR=8, the effective isotropic stress being p′
c,0 =1000kPa.
Copyright � 2010 John Wiley & Sons, Ltd. Int. J. Numer. Anal. Meth. Geomech. 2011; 35:947–968DOI: 10.1002/nag
954 M. HATTAB AND J.-M. FLEUREAU
Figure 6. Purely deviatoric paths at different OCR (Hattab and Hicher, 2004): (a) dilatancy phenomenonand (b) evolution of paths in the (log p′−e) plane.
e
p' (kPa)
100 1000
0.50
0.55
0.60
0.65
0.70
0.75
0.80
Figure 7. Pseudo-elastic domain of kaolinite derived from constant �′3 paths.
As, the behaviour along the Cs curve verify the relation (Equation (3)), where �tv =�p′
v , thevolumetric strain obtained in the first phase of the constant �′
3 path can thus be considered asindependent from the deviator q evolution.
Copyright � 2010 John Wiley & Sons, Ltd. Int. J. Numer. Anal. Meth. Geomech. 2011; 35:947–968DOI: 10.1002/nag

EXPERIMENTAL ANALYSIS OF KAOLINITE PARTICLE ORIENTATION 955
3.5. Discussion
These studies show that two strain mechanisms occur simultaneously during a triaxial loading, anisotropic-type mechanism due to the isotropic part of the stress tensor (p′), and a deviatoric-typemechanism due to the deviatoric part of the stress tensor (q). A domain has been identified inthe (p′−q) plane in which only the isotropic mechanism is activated whatever the stress path.Outside this domain (following, for instance, a constant �′
3 loading) a coupling between the twomechanisms takes place, resulting in a plastic flow phenomenon. The phenomenon continues untilreaching the critical state defined by a volumetric strain increment equal to 0. A detailed study ofthis specific point can be found in Hattab and Hicher [7].
To establish a link between these macroscopic mechanisms and the microfabric of the clay,we tried to understand how the components of the macroscopic stress tensor can be related tothe orientation of the clay particles observed at the microscopic scale. Observations were thusperformed on the isotropic path, and under different stress states on the constant �′
3 path, especiallyin the first stage of the loading and close to the critical state. Analysis of the particle orientationmechanism after constant �′
3 tests allows to follow first the effect of the isotropic mechanismidentified at the macroscopic scale, then the effect of the deviatoric part of the stress tensor on theparticle orientation.
4. EVOLUTION OF THE ORIENTATION OF CLAYEY PARTICLES IN AXISYMMETRICTRIAXIAL LOADING
The approach for the microstructural analysis proposed here consists in following, by SEM obser-vations, the change in the orientation of the kaolinite particles during a triaxial test for differentvalues of the axial strain.
Initially, all the clay specimens were consolidated in a consolidometer under an effective verticalstress �′
v =120kPa. The triaxial loading applied to the samples at the global level was as follows:isotropic loading up to the isotropic stress p′
c,0 =1400kPa, isotropic unloading until the OCRreached 1.4 (p′
c,1 =1000kPa), then classical drained triaxial path with �′3 =1000kPa. The obser-
vations were performed on the horizontal plane and on the vertical plane, (i) in the initial state,(ii) after the isotropic loading, and (iii) along the triaxial path (�′
3 =1000kPa) at the specific axialstrains ε1 =5% ε1 =15% et ε1 =25%, as shown in Figure 8.
As indicated before, all the microscopic observations were performed on the samples afterunloading for the recovery of samples. It was assumed that the effect of unloading did not modifythe orientation of particles.
4.1. Initial state analysis
Qualitative analysis of the SEM photos in the initial state (Figure 9) shows that the clay is composedof ‘agglomerates’ of different sizes, constituted by the associations of particles. The porosity seemsto be bimodal with, on the one hand, an inter-agglomerate macroporosity that appears at somepoint to be large enough and, on the other hand, an intra-agglomerate porosity, highly dependent
Figure 8. Points for microstructural analysis in the (p′–q) plane.
Copyright � 2010 John Wiley & Sons, Ltd. Int. J. Numer. Anal. Meth. Geomech. 2011; 35:947–968DOI: 10.1002/nag

956 M. HATTAB AND J.-M. FLEUREAU
9 m
11 m
Figure 9. SEM observation of kaolinite in initial condition (after one-dimensionalcompression at �′
v =120kPa). Vertical plane.
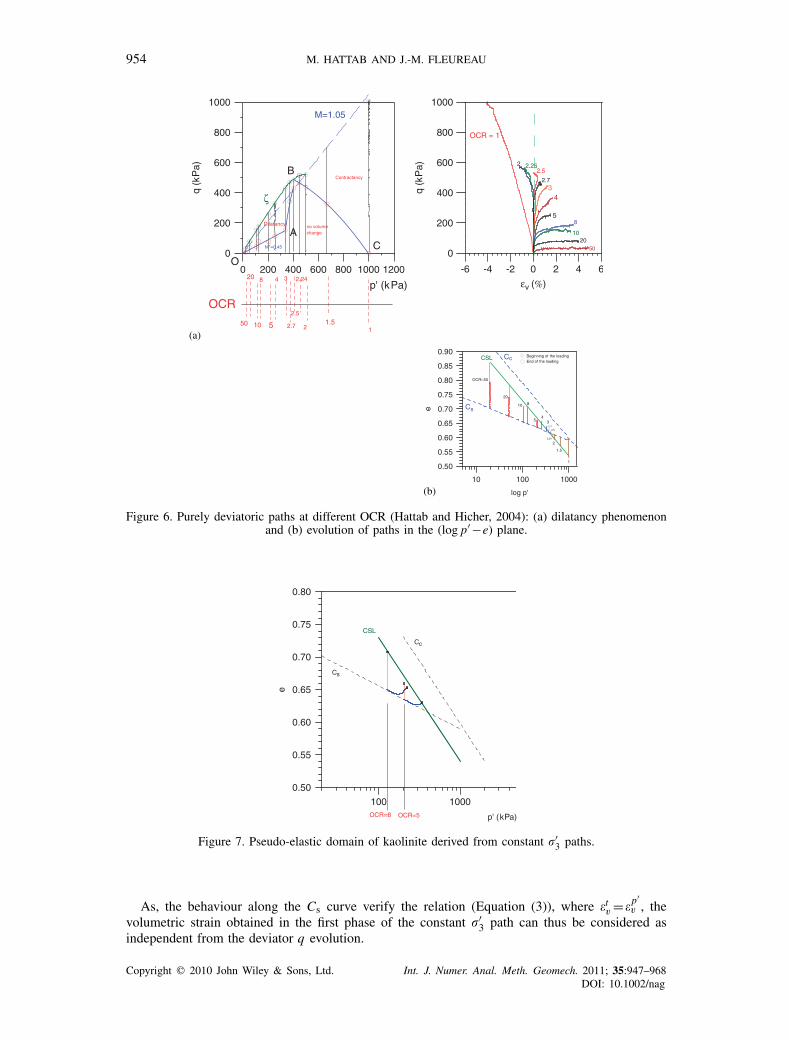
on the way in which particles orient themselves to a higher or lesser degree inside the agglomerate.The global rose diagrams shown in Figure 12 result from several observations carried out atdifferent points on the vertical and horizontal planes (Figures 10 and 11). The global rose diagramderived from the analysis on the vertical plane (Figure 12(a)) indicates the structural anisotropywith a preferential orientation of the particles towards horizontal. A few particles oriented in the[15◦–30◦], [30◦–45◦], and [45◦–60◦] ranges can be observed, but their percentage remains verylow with respect to the particles oriented in the [0◦–15◦] range.
4.2. Orientation of the particles under isotropic loading
Microscopic observations were performed after isotropic consolidation of the specimen under theeffective isotropic stress p′
c,0 =1400kPa (Figure 14).The analysis of SEM photos (Figures 13(a) and 13(b)) highlights a decrease in the pore space
compared with the initial state, related to a more random orientation of the particles (even thoughthe orientation in the horizontal plane remains significant). This reorientation of the particles canbe clearly observed in the vertical plane; the corresponding global rose diagram (Figure 15(b))shows that the percentage of orientation (particles viewed sideways) is globally the same between0◦ and 60◦, and even though it appears more reduced between 60◦ and 90◦, it remains larger thanin the initial state (Figure 12(a)).
Consequently, between the initial state and the isotropic loading at p′c,0 =1400kPa, two mech-
anisms can be defined:
• a decrease of the pore space,• a rotation of the kaolinite particles, which leads to a tendency towards structural isotropy
(disorientation phenomenon).
Copyright � 2010 John Wiley & Sons, Ltd. Int. J. Numer. Anal. Meth. Geomech. 2011; 35:947–968DOI: 10.1002/nag
EXPERIMENTAL ANALYSIS OF KAOLINITE PARTICLE ORIENTATION 957
Figure 10. Microfabric in initial condition �′v =120kPa, example of a region observed on vertical plane.
Figure 11. Microfabric in initial condition �′v =120kPa, example of a region observed on horizontal plane.
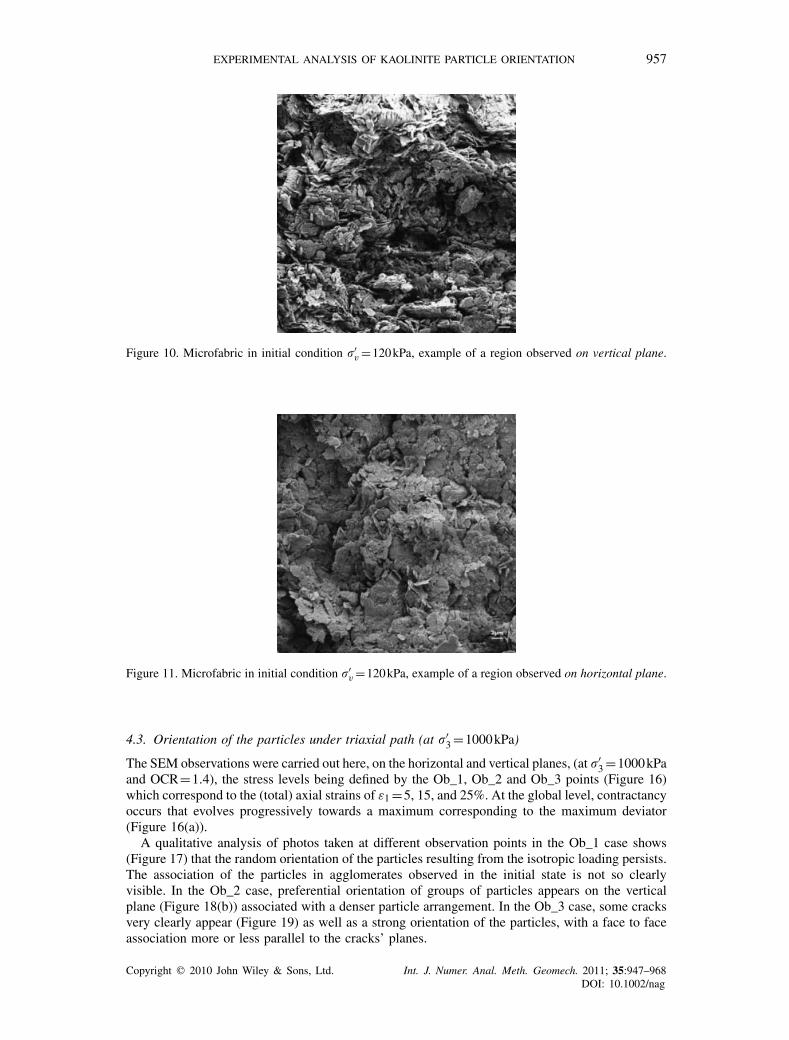
4.3. Orientation of the particles under triaxial path (at �′3 =1000kPa)
The SEM observations were carried out here, on the horizontal and vertical planes, (at �′3 =1000kPa
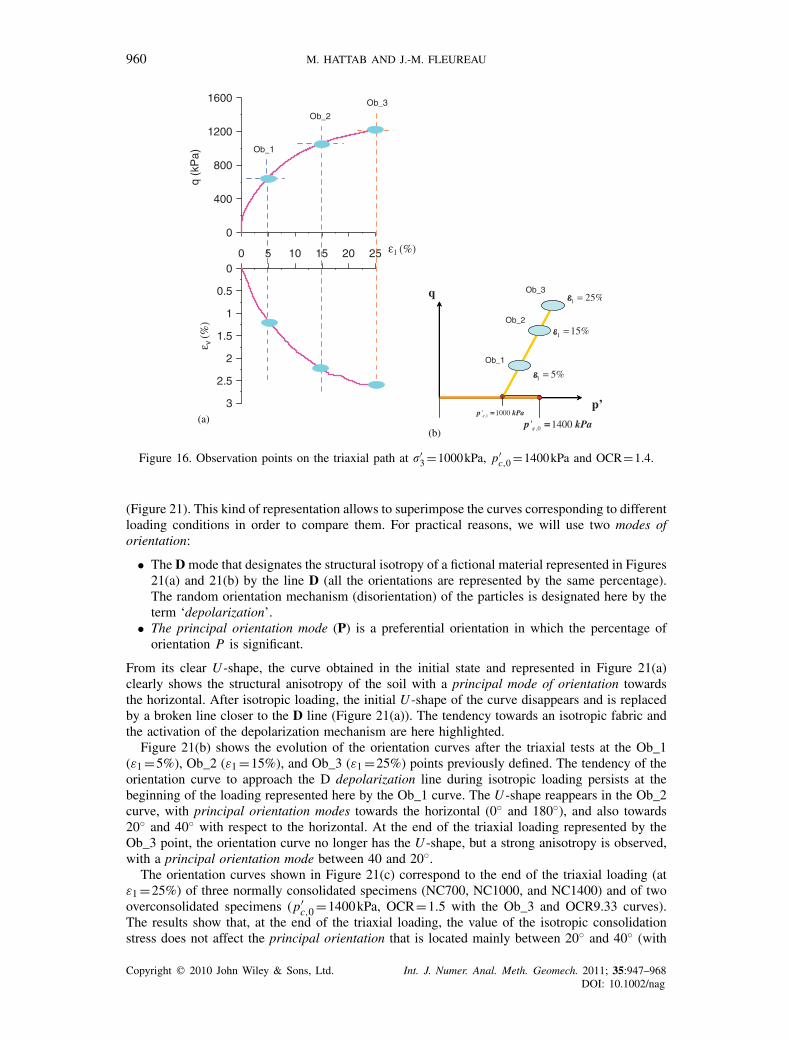
and OCR=1.4), the stress levels being defined by the Ob_1, Ob_2 and Ob_3 points (Figure 16)which correspond to the (total) axial strains of ε1 =5, 15, and 25%. At the global level, contractancyoccurs that evolves progressively towards a maximum corresponding to the maximum deviator(Figure 16(a)).
A qualitative analysis of photos taken at different observation points in the Ob_1 case shows(Figure 17) that the random orientation of the particles resulting from the isotropic loading persists.The association of the particles in agglomerates observed in the initial state is not so clearlyvisible. In the Ob_2 case, preferential orientation of groups of particles appears on the verticalplane (Figure 18(b)) associated with a denser particle arrangement. In the Ob_3 case, some cracksvery clearly appear (Figure 19) as well as a strong orientation of the particles, with a face to faceassociation more or less parallel to the cracks’ planes.
Copyright � 2010 John Wiley & Sons, Ltd. Int. J. Numer. Anal. Meth. Geomech. 2011; 35:947–968DOI: 10.1002/nag

958 M. HATTAB AND J.-M. FLEUREAU
Figure 12. Global rose diagram of angular distribution of the particles viewed sideways. Initial state�′
v =120kPa: (a) vertical plane and (b) horizontal plane.
Figure 13. Microfabric after an isotropic loading at p′c,0 =1400kPa:
(a) horizontal plane and (b) vertical plane.
The evolution of the angular distribution rose diagram, shown in Figure 20 according to thelevel of loading, leads to the following remark:
The global rose diagram on the vertical plane shows that the tendency towards structural isotropyprovoked by the isotropic loading seems to be maintained at the beginning of the triaxial loading,even after 5% of axial strain (Ob_1 point). At ε1 =15% (Ob_2 point), a preferential orientationbetween 165◦ and 150◦ occurs, which corresponds to a slope of approximately 20◦ with respectto the horizontal. Orientation appears much more pronounced at ε1 =25% (Ob_3 point), with ahigh percentage of oriented particles between 30◦ and 45◦. This evolution toward a very markedstructural anisotropy at the end of loading has also been observed by Hicher et al. [21] on twodifferent types of clay, the kaolinite studied here and a bentonite.
5. MULTISCALE APPROACH OF THE BEHAVIOUR
The angular distribution rose diagram of the vertical planes may be analyzed as orientation curvesgiving the percentage P of particles viewed from the side as a function of their orientation
Copyright � 2010 John Wiley & Sons, Ltd. Int. J. Numer. Anal. Meth. Geomech. 2011; 35:947–968DOI: 10.1002/nag

EXPERIMENTAL ANALYSIS OF KAOLINITE PARTICLE ORIENTATION 959
10 100 100020 50 200 500 2000
0.45
0.5
0.55
0.6
0.65
0.7
0.75
p'(kPa)
e
Cc
Cs
1400 kPa
Figure 14. Isotropic path in (log p′−e) plane at specimen scale.
0
15
30
45
607590105
120
135
150
165
180
195
210
225
240255 270 285
300
315
330
345
0
0
15
30
45
607590105
120
135
150
165
180
195
210
225
240255 270 285
300
315
330
345
Gradual rotation of particles
(a)
(b)
4 8 12 16
0 4 8 12 16
Figure 15. Global Rose diagram of angular distribution of the edge view particles. Isotropic loadingp′
c,0 =1400kPa: (a) horizontal plane and (b) vertical plane.
Copyright � 2010 John Wiley & Sons, Ltd. Int. J. Numer. Anal. Meth. Geomech. 2011; 35:947–968DOI: 10.1002/nag
960 M. HATTAB AND J.-M. FLEUREAU
Figure 16. Observation points on the triaxial path at �′3 =1000kPa, p′
c,0 =1400kPa and OCR=1.4.
(Figure 21). This kind of representation allows to superimpose the curves corresponding to differentloading conditions in order to compare them. For practical reasons, we will use two modes oforientation:
• The D mode that designates the structural isotropy of a fictional material represented in Figures21(a) and 21(b) by the line D (all the orientations are represented by the same percentage).The random orientation mechanism (disorientation) of the particles is designated here by theterm ‘depolarization’.
• The principal orientation mode (P) is a preferential orientation in which the percentage oforientation P is significant.
From its clear U -shape, the curve obtained in the initial state and represented in Figure 21(a)clearly shows the structural anisotropy of the soil with a principal mode of orientation towardsthe horizontal. After isotropic loading, the initial U -shape of the curve disappears and is replacedby a broken line closer to the D line (Figure 21(a)). The tendency towards an isotropic fabric andthe activation of the depolarization mechanism are here highlighted.
Figure 21(b) shows the evolution of the orientation curves after the triaxial tests at the Ob_1(ε1 =5%), Ob_2 (ε1 =15%), and Ob_3 (ε1 =25%) points previously defined. The tendency of theorientation curve to approach the D depolarization line during isotropic loading persists at thebeginning of the loading represented here by the Ob_1 curve. The U -shape reappears in the Ob_2curve, with principal orientation modes towards the horizontal (0◦ and 180◦), and also towards20◦ and 40◦ with respect to the horizontal. At the end of the triaxial loading represented by theOb_3 point, the orientation curve no longer has the U -shape, but a strong anisotropy is observed,with a principal orientation mode between 40 and 20◦.
The orientation curves shown in Figure 21(c) correspond to the end of the triaxial loading (atε1 =25%) of three normally consolidated specimens (NC700, NC1000, and NC1400) and of twooverconsolidated specimens (p′
c,0 =1400kPa, OCR=1.5 with the Ob_3 and OCR9.33 curves).The results show that, at the end of the triaxial loading, the value of the isotropic consolidationstress does not affect the principal orientation that is located mainly between 20◦ and 40◦ (with
Copyright � 2010 John Wiley & Sons, Ltd. Int. J. Numer. Anal. Meth. Geomech. 2011; 35:947–968DOI: 10.1002/nag

EXPERIMENTAL ANALYSIS OF KAOLINITE PARTICLE ORIENTATION 961
Figure 17. Ob_1 observation point—microfabric after triaxial loading at �′3 =1000kPa and ε1 =5%
p′c,0 =1400kPa: (a) horizontal plane and (b) vertical plane.
respect to the horizontal). All the curves show a meaningful number of particles oriented towardsthe horizontal (which appear in principal mode).
5.1. Symmetry of orientation
The angle of principal orientations identified on the curves in Figures 21(b) and (c) may appeareither in the quadrant A of the schematic representation proposed in Figure 21(d) (this is the caseof the Ob_3 and OCR9.33 curves, see Figure 21(c)), or in the quadrant B (case of the NC700,NC1000, and NC1400 curves, see Figure 21(c)), or even in both quadrants A and B (less frequent,case of the Ob_2 curve, see Figure 21(b)). Figure 21(c) especially highlights the symmetry, withrespect to the axis =90◦, of the orientation curves at the end of the triaxial loading. One candraw a possible analogy between this result observed at the local level, and the appearance anddevelopment of localizations, experimentally observed at the macroscopic level of the specimen,with either a slip plane or two slip planes, according to the position of the loading axis and thepiston/specimen contact.
Therefore, the following hypothesis about the orientation of the particles (apart from the disor-dered structure) can be advanced: an orientation (between 0◦ and 90◦ with respect to thehorizontal) that appears in quadrant A is equivalent to the same orientation in quadrant B (Figure21(d)).
Copyright � 2010 John Wiley & Sons, Ltd. Int. J. Numer. Anal. Meth. Geomech. 2011; 35:947–968DOI: 10.1002/nag

962 M. HATTAB AND J.-M. FLEUREAU
Figure 18. Ob_2 observation point—microfabric after triaxial loading at �′3 =1000kPa and ε1 =15%
p′c,0 =1400kPa: (a) horizontal plane and (b) vertical plane.
5.2. Global behaviour and mechanism of orientation of the particles
In Figure 22, we reconsider the macroscopic behaviour of the normally consolidated clay (under�′
3 =1400kPa), and of the overconsolidated clay (OCR=1.4; p′c,0 =1400kPa) on triaxial paths.
The isotropic strain mechanism domain has been identified here on the (p′−e) path of the over-consolidated clay, and represented in the (p−q) plane in Figure 22 (this domain being characterizedby e=e(p′) and e(q)=0).
The study of the microfabric discussed above showed that isotropic loading induced a depo-larization, which means a random particle organization. Triaxial loading of the overconsolidatedclay seems to maintain the depolarization inside the domain of e=e(p′) in the early stages ofloading, as the analysis at the Ob_1 point shows (see Figure 22, where the insert diagrams areschematic representations of the principal orientation modes). In the (p′−q −) space, this resultsin a depolarization plane (Figure 23), first induced by the isotropic loading, represented by twosurfaces in the (p′−) plane (because of the structural anisotropy of the initial sample), then bya plane inclined on the triaxial path. When moving out of the e=e(p′) domain, when the loadingpath continues to larger strains, the rotation of the particles becomes more apparent and theirorientation progressively tends towards 20◦ and 40◦, which are the principal orientations observedat the Ob_2 point and close to the critical state at the Ob_3 point. Moreover, as already specified,the orientations towards the horizontal remain significant. This mechanism can be associated withthe plastic flow (in the formal framework of elastoplasticity) that occurs at the macroscopic level
[7], where the total volumetric strain is the result of a coupling between the strains εp′v and ε
qv .
The influence of the deviatoric part of the stress seems, from a certain point on the loadingpath, predominant in the rotation mechanism towards privileged planes. It results in two surfaces,in the (p′−q −) space, presenting a symmetry with respect to =90◦ (Figure 23).
Copyright � 2010 John Wiley & Sons, Ltd. Int. J. Numer. Anal. Meth. Geomech. 2011; 35:947–968DOI: 10.1002/nag

EXPERIMENTAL ANALYSIS OF KAOLINITE PARTICLE ORIENTATION 963
Figure 19. Ob_3 observation point—microfabric after triaxial loading at �′3 =1000kPa and ε1 =25%
p′c,0 =1400kPa: (a) horizontal plane and (b) vertical plane.
Three main points can thus be put forward:
• the increase in the effective mean stress p′, on the triaxial path, leads to depolarization upto a certain point; at the macroscopic level, this point seems to correspond approximately tothe limit of the e=e(p′) domain associated with volumetric strain, only dependent on theisotropic part of the stress tensor;
• Above that specific point, the rotation mechanism of groups of particles towards a privilegedorientation is activated;
• The orientation of groups of particles towards privileged planes is due to the evolution of thedeviatoric part of the stress tensor.
5.3. At the critical state
The principal orientations observed at 25% of axial strain for different OCRs are shown in Figure 24where the following tests are represented: NC1400, NC1000, NC700, OCR1.4, and OCR9.33 (withp′
c,0 =1400kPa). For all the cases shown here, whichever the value of the consolidation stress, theexperimental points are located close to two symmetrical planes (0◦−40◦ and 180◦−140◦) of thecritical state defined by q/p′ = M =1.05.
The latter orientation is observed on groups of particles and not on individual particles dispersedeverywhere in the material. The same phenomenon is observed on most of the photographs.Therefore, the consolidation stress does not seem to influence the microstructural organization ofthe clay. Even if, at the macroscopic scale, no shear plane was observed according to the criticalstate concept (see, for instance, the tests in Figure 22), this study shows that the material presentsdifferent zones in which the particles may associate themselves according to two orientations, onetowards 40◦ (or 140)◦) activated with a slip mechanism, the other in a steady zone oriented towards0◦ (or 180◦).
Copyright � 2010 John Wiley & Sons, Ltd. Int. J. Numer. Anal. Meth. Geomech. 2011; 35:947–968DOI: 10.1002/nag

964 M. HATTAB AND J.-M. FLEUREAU
Figure 20. Global rose diagrams and evolution of orientation of the edge view particles under triaxialloading OCR=1.5�′
3 =1000kPa p′c,0 =1400kPa: (a) vertical plane and (b) horizontal plane
6. CONCLUSION
This research proposes an explanation of the link between the state of stress and strain at themacroscopic global level of the sample and the microstructure of a kaolinite. The approach consistsin studying the orientation of clay particles from scanning electron microscope observations.
Copyright � 2010 John Wiley & Sons, Ltd. Int. J. Numer. Anal. Meth. Geomech. 2011; 35:947–968DOI: 10.1002/nag

EXPERIMENTAL ANALYSIS OF KAOLINITE PARTICLE ORIENTATION 965
180
0
10
20
30
5
15
25
%P
-a-
D
90˚(direction of σ’1)
αα0˚180˚
AB
-d-
α
160 140 120 100 80 60 40 20 0
0
5
10
15
20
25
30
%P
θ (°)
-c-
180 160 140 120 100 80 60 40 20 0
θ (°)
0
10
20
30
5
15
25
%P
-b-
D
180 160 140 120 100 80 60 40 20 0
θ (°)
Figure 21. Microstructural evolution and stress level definition of orientation modes.
At the macroscopic level, two strain mechanisms occur simultaneously during triaxial loading,an isotropic-type mechanism due to the isotropic part of the stress tensor, and a deviatoric-typemechanism due to the deviatoric part of the stress tensor. A domain has been identified in thestress plane in which only the isotropic mechanism is activated whatever the stress path. For themicroscopic investigations, observations were performed after the isotropic path, and after differentstress states of the constant �′
3 path, especially in the first stage of the loading and close to thecritical state.
In the initial condition of the sample (after one dimensional consolidation), the microfabricanalysis highlights the association of the particles in agglomerates and the anisotropy of fabric,with a preferential orientation of the particles towards the horizontal (orientation of 0◦). Isotropicloading results in a volume decrease related, at the microscopic level, to a densification of theclay matrix and a more random orientation of the clay particles. The global rose diagram derivedfrom the analysis and treatment of SEM photos shows an increase in the structural isotropy of
Copyright � 2010 John Wiley & Sons, Ltd. Int. J. Numer. Anal. Meth. Geomech. 2011; 35:947–968DOI: 10.1002/nag

966 M. HATTAB AND J.-M. FLEUREAU
0 5 10 15 20 25
0
500
1000
1500
2000
2500
NC (sig'3 = 1400 kPa)
OCR = 1,4 (p'c,0 =1400 kPa)
0 5 10 15 20 25
6
4
2
0
800 1200 1600 2000
0
500
1000
1500
2000
2500
800 1200 1600 2000
0.35
0.4
0.45
0.5
0.55
0.6
q (kPa) q (kPa)
εv (%) e
ε1 (%) p' (kPa)
p' (kPa)
ε1 (%)
CSL
Cs
Cc
M=1.05
e=e(p')e(q)=0
OCR11.5
Ob_1
Ob_2Ob_3
Figure 22. Orientation of particles on the triaxial path.
Figure 23. Orientation mechanism of particles along the triaxial path in the (p′,q,) coordinate system.
the microfabric, designated here by the term depolarization and represented by the straight line ofdepolarization D.
The study of slightly overconsolidated clay (OCR=1.4) submitted to drained triaxial test showsthat the depolarization is maintained at the beginning of the loading. This depolarization mechanism
Copyright � 2010 John Wiley & Sons, Ltd. Int. J. Numer. Anal. Meth. Geomech. 2011; 35:947–968DOI: 10.1002/nag

EXPERIMENTAL ANALYSIS OF KAOLINITE PARTICLE ORIENTATION 967
Figure 24. Microstructure at the critical state.
seems to occur in the (macroscopic) domain in which only an isotropic mechanism acts, the
volumetric strain being due to the isotropic part of the stress tensor (εtv =ε
p′v ). Slightly beyond this
domain, a rotation of the particles by groups takes place towards two active principal orientations of20◦ to 40◦, with a significant orientation towards the horizontal (0◦). The latter rotation mechanismof particles towards preferred planes becomes more important after a certain point on the triaxialpath. This point seems directly linked, at the macroscopic scale, to the deviatoric mechanismactivation. At the critical state, the orientation of the particles does not seem to be affected eitherby the OCR, or by the consolidation stress for the normally consolidated specimens. The clay, atthe end of loading, seems to be structured into different zones:
• the zones where the principal orientation develops by groups of particles orientating towardplanes of 40◦ (and 140◦), which can be considered as active, to which a slip mechanism canbe assigned,
• the steady zones where the particles tilt towards the horizontal.
REFERENCES
1. Roscoe KH, Schofield AN, Wroth CP. On the yielding of soils. Geotechnique 1958; 8(1):22–53.2. Schofield AN, Wroth CP. Critical State Soil Mechanics. McGraw-Hill: New York, 1968.3. Rowe PW. The stress dilatancy relation for static equilibrium of an assembly of particles in contact. Proceedings
of the Royal Society 1962; A269:500–527.4. Dafalias YF. An anisotropic critical state clay plasticity model. Proceedings of the 2nd International Conference
on Constitutive Laws for Engineering Materials: Theory and Applications, Tucson, Arizona. Elsevier: New York,1987; 513–521.
5. Biarez J, Hicher P-Y. Elementary Mechanics of Soils Behaviour. Saturated Remoulded Soils. A.A.Balkema:Rotterdam, Brookfield, 1994.
6. Henkel DJ. The effect of overconsolidation on the behaviour of clays during shear. Geotechnique 1956; 6:139–150.7. Hattab M, Hicher P-Y. Dilating behaviour of overconsolidated clay. Soils and Foundations 2004; 44(4):27–40.8. Jenkins JT. Volume change in small strain axisymmetric deformations of a granular material. In Micromechanics
of Granular Materials, Satake M, Jenkins JT (eds). Elsevier: New York, 1988; 143–152.9. Matsuoka H, Geka H. A stress–strain model for granular materials concerning mechanism of fabric change. Soils
and Foundations 1983; 23(2):83–97.10. Goddard JD, Didwania AK. Computations of dilatancy and yield surfaces for assemblies of rigid frictional
spheres. Quarterly Journal of Mechanics and Applied Mathematics 1998; 51(1):14–43.11. Oda M. Inherent and induced anisotropy in plasticity theory of granular soils. Mechanics of Materials 1993;
16:35–45.12. Emeriault F, Cambou B. Micromechanical modelling of anisotropic non-linear elasticity of granular medium.
International Journal of Solids and Structures 1996; 33(18):2591–2607.
Copyright � 2010 John Wiley & Sons, Ltd. Int. J. Numer. Anal. Meth. Geomech. 2011; 35:947–968DOI: 10.1002/nag
968 M. HATTAB AND J.-M. FLEUREAU
13. Nemat-Nasser S, Zhang J. Constitutive relations for cohesionless frictional granular material. Journal of Plasticity2002; 18:531–547.
14. Wan R, Al-Mamun M. Behaviour of granular material in relation to their fabric dependencies. Soils andFoundations 2005; 45(2):77–86.
15. Morgenstern NR, Tchalenko JS. Microscopic structures in Kaolin subjected in direct shear. Geotechnique 1967;17:309–328.
16. Martin RT, Ladd CC. Fabric of consolidated kaolinite. Clays and Clay Minerals 1975; 23:17–25.17. Guillot X, Bergaya F, Fleureau J-M, Al-Mukhtar M. Influence of stresses and suction on volume change behaviour
and microscopic properties of a Ca-smectite. Proceedings of the International Symposium on Suction, Swelling,
Permeability and Structure of Clays, Shizuoka, Japan, 2001; 69–77.18. Delage P, Lefebvre G. Study of the structure of a sensitive Champlain clay and of its evolution during consolidation.
Canadian Geotechnical Journal 1984; 21:21–35.19. Pusch R. Microstructural changes in soft quick clay at failure. Canadian Geotechnical Journal 1997; 7:1–7.20. Bai X, Smart P. Change in microstructure of kaolin in consolidation and undrained shear. Geotechnique 1997;
47(5):1009–1017.21. Hicher P-Y, Wahyudi H, Tessier D. Microstructural analysis of inherent and induced anisotropy in clay. Mechanics
of Cohesive-frictional Materials 2000; 5:341–371.22. Bishop AW, Wesley LP. A hydraulic triaxial apparatus for controlled stress path testing. Geotechnique 1975;
25(4):657–670.23. Hicher P-Y. Comportement mécanique des argiles saturées sur divers chemins de sollicitations monotones et
cycliques application à une modélisation élastoplastique et viscoplastique. Thèse de doctorat d’état ès sciencesphysiques Paris 6, 1985.
24. Lade PV, Tsai J. Effects of localization in triaxial tests on clays. Proceedings of the ICSMFE, San Francisco,1985; 549–552.
25. Frost JD, Yang C. Effect of end platens on microstructure evolution in dilatant specimens. Soils and Foundations2003; 43(4):1–11.
26. Delage P, Pellerin M. Influence de la lyophilisation sur la structure d’une argile sensible du Quebec. ClayMinerals 1984; 19:151–160.
27. Biarez J, Favre JL. Parameters filing and statistical analysis of data in soils mechanics. Proceedings of the 2ndInternational Conference on Applications Statistics and Probability in Soil and Structural Engineering, Aachen,Germany, vol. 2. Deutsche Gesellschaft für Erd-und Grundbau e.V: Essen, Germany, 15–18 September 1975;249–264.
Copyright � 2010 John Wiley & Sons, Ltd. Int. J. Numer. Anal. Meth. Geomech. 2011; 35:947–968DOI: 10.1002/nag