The band structure and triaxial shape in 118Xe
16
Nuclear Physics A510 (1990) 173-188 North-Holland THE BAND STRUCTURE AND TRIAXIAL SHAPE IN ‘18Xe C.B. MOON, J.C. KIM, J.U. KWON and B.N. SUNG Department of Physics, Seoul National University, Seoul 151-742, Korea K. FURONO, T. KOMATSUBARA, T. HOSODA, T. KANEKO, SC. JEONG, 1. KURNIAWAN and T. AOKI instifure of Physics, The ~ni~rsity of Tsukuba, Tsukuba 305, Japan Received 28 March 1989 (Revised 2 October 1989) Abstract: High-spin states of i18Xe have been investigated by means of y-ray spectroscopy using the 92Mo(29Si, 2pn) reaction at a bombarding energy of 110 MeV. Several new side bands as well as the yrast band were established. The first band crossings both in the yrast sequence and in the even-spin sequence of the y-band were observed at hw,=0.39 MeV and hw,= 0.31 MeV respectively. The -y-dependent cranked shell-model calculation was performed to interpret the band crossing in the y-band. NUCLEAR REACTION 9tMo(Z9Si, n2p), E = 110 MeV, measured E,, I,, W,,(e), yy-coin. E “sXe deduced levels, J, n; band structure. Cranked shell mode1 calculation. Enriched target, Ge, Ge(Li) detectors. 1. Introduction Recently, several investigations have been made on the structure of neutron deficient Xe, Ba and Ce isotopes. These nuclei are in the mass region with 2 3 50 and 50 < N 6 82, which is one of the best-known transitional regions and provides fruitful testing grounds for detailed theoretical descriptions such as the interacting boson model (IBA) ‘) and the cranked shell model (CSM) ‘). The latter approach, in particular, has been successful, only when applied to the well-deformed nuclei. More recently, however, the y-dependent CSM ‘) approach has been made to describe the band structures of y-soft nuclei in the A- 150 transitional regions. And it was pointed out by Frauendorf and May ‘) that, in the transitional nuclei, the excitation of quasiparticles changes the average static shape of the nucleus and results in stabilizing the nucleus in different deformations. So far, the level structures of the neutron deficient Xe isotopes have been studied in detail up to ‘*‘Xe [refs. 4-‘o)]. For the excited states in “*Xe, the yrast band up to (20+) state ‘1-13)and a few levels in y-band 14) have been reported. 0375-9474~9O/S~3.~0 @ Elsevier Science Publishers B.V. (Noah-Holland)
-
Upload
stmikhandayani -
Category
Documents
-
view
5 -
download
0
Transcript of The band structure and triaxial shape in 118Xe
Nuclear Physics A510 (1990) 173-188 North-Holland
THE BAND STRUCTURE AND TRIAXIAL SHAPE IN ‘18Xe
C.B. MOON, J.C. KIM, J.U. KWON and B.N. SUNG
Department of Physics, Seoul National University, Seoul 151-742, Korea
K. FURONO, T. KOMATSUBARA, T. HOSODA, T. KANEKO, SC. JEONG, 1. KURNIAWAN and T. AOKI
instifure of Physics, The ~ni~rsity of Tsukuba, Tsukuba 305, Japan
Received 28 March 1989 (Revised 2 October 1989)
Abstract: High-spin states of i18Xe have been investigated by means of y-ray spectroscopy using the 92Mo(29Si, 2pn) reaction at a bombarding energy of 110 MeV. Several new side bands as well as the yrast band were established. The first band crossings both in the yrast sequence and in the even-spin sequence of the y-band
were observed at hw,=0.39 MeV and hw,= 0.31 MeV respectively. The -y-dependent cranked shell-model calculation was performed to interpret the band crossing in the y-band.
NUCLEAR REACTION 9tMo(Z9Si, n2p), E = 110 MeV, measured E,, I,, W,,(e), yy-coin. E “sXe deduced levels, J, n; band structure. Cranked shell mode1 calculation. Enriched target,
Ge, Ge(Li) detectors.
1. Introduction
Recently, several investigations have been made on the structure of neutron deficient Xe, Ba and Ce isotopes. These nuclei are in the mass region with 2 3 50 and 50 < N 6 82, which is one of the best-known transitional regions and provides fruitful testing grounds for detailed theoretical descriptions such as the interacting boson model (IBA) ‘) and the cranked shell model (CSM) ‘). The latter approach, in particular, has been successful, only when applied to the well-deformed nuclei.
More recently, however, the y-dependent CSM ‘) approach has been made to describe the band structures of y-soft nuclei in the A- 150 transitional regions. And it was pointed out by Frauendorf and May ‘) that, in the transitional nuclei, the excitation of quasiparticles changes the average static shape of the nucleus and results in stabilizing the nucleus in different deformations.
So far, the level structures of the neutron deficient Xe isotopes have been studied in detail up to ‘*‘Xe [refs. 4-‘o)]. For the excited states in “*Xe, the yrast band up to (20+) state ‘1-13) and a few levels in y-band 14) have been reported.
0375-9474~9O/S~3.~0 @ Elsevier Science Publishers B.V. (Noah-Holland)
174 C.B. Moon et al. / The band structure
In this article, we report our new results of more extensive measurements on
‘18Xe and discuss the two-quasiparticle band structures in “‘Xe in the framework
of the y-dependent CSM. A brief account of the present work has already been
given elsewhere “).
2. Experimental procedure and data analysis
The present experiment was performed with the 12 UD tandem Van de Graaff
accelerator at the University of Tsukuba. High-spin states in l18Xe were populated
by means of the 92Mo(29Si, 2pn) reaction using silicon ion beams 29Si+9 of Flab =
110 MeV. The target was 1 mg/cm thick metallic 92Mo foil enriched to 90%. In order
to stop recoil products, a thick lead backing was made by evaporating on the target.
The y-ray spectra were acquired with four Ge detectors [two HP Ge and two
Ge(Li)], whose energy resolutions were 1.9- 2.5 keV (FWHM) at 1332 keV y-ray
energy. They were positioned at a distance of 18 cm from the target and at angles
of 80”, 150”, 210” and 280” with respect to the beam direction. Lead shields were
inserted between Ge detectors in order to suppress the cross talk of -y-rays due to
Compton scatterings. The standard radioactivity source 15*Eu was used for the y-ray
energy calibration and relative efficiency measurement of Ge detectors. Additionally,
two 20.3 cm diameter x 15.2 cm long NaI(T1) detectors were placed above and below
the target as a sum-energy filter.
The yy-coincidence measurements were carried out at the beam energy of
110 MeV. A conventional fast/slow coincidence circuit with a time resolution of
20 ns was used. During the course of experiments, the event-by-event data sets fed
by the CAMAC system were transferred and accumulated on the disk memory of
the VAX/750 computer. After data taking for a certain period, the data on the disk
were transferred to magnetic tapes. A total of 1.96 x 10’ events were recorded on
magnetic tapes. The data analysis was done with aid of a VAX/780 computer.
In the off-line analysis, the data sets were added to a 2048 x 2048 two-dimensional
spectrum with careful correction for the gain shifts. The gated spectra were obtained
by gating with a narrow slice on one axis (e.g. Z$, axis) and subtracting the Compton
backgrounds. Examples of gated spectra are shown in fig. 1.
The angular distribution measurements were performed at a bombarding energy
of 110 MeV and at six angles of 75”, 90”, 105”, 125”, 148” and 154” with respect to
the beam direction, while one at 90” served as a monitor.
The angular distribution coefficients A2/Ao and Ah/A, were obtained by fitting
truncated Legendre polynomials of fourth order to the data and are listed in table
1. Fig. 2 shows ,y2 distributions of some spin hypotheses for the 846 and 1022 keV
transitions.
One useful quantity obtained in the present yy-coincidence measurement and
used to distinguish stretched dipoles from quadrupoles is the relative intensity ratio
Z,(150”)/Z,(80°) normalized to 338 keV transition. Values are listed in the third

C.B. Moon et al. / The band structure 175
1500 -
c 5 1000.
s
500
0 00
846 KEV GATE
CHANNEL
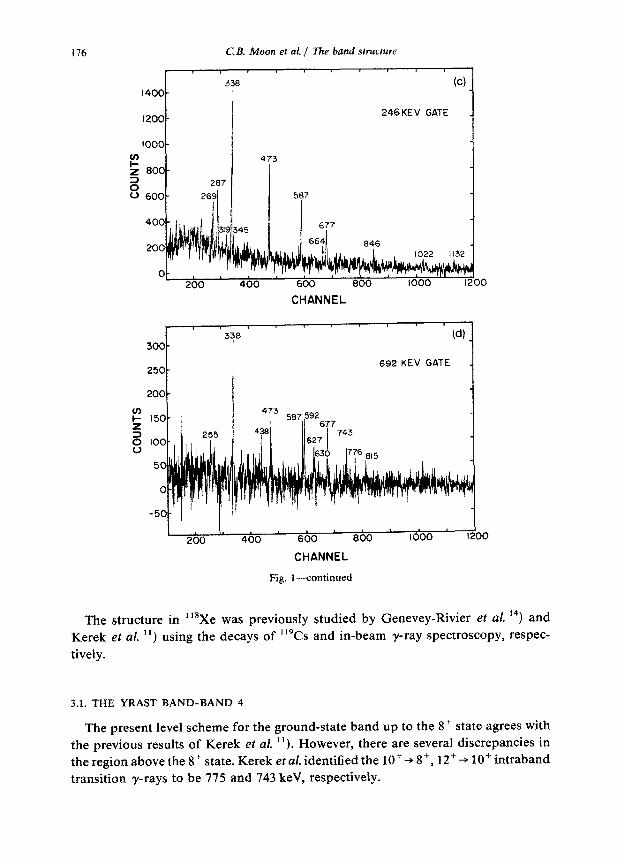
Fig. 1. Coincidence spectra of y-rays obtained from the 92Mo(29Si, 2pn) “‘Xe reaction at the energy of 110 MeV. Gamma-ray energies are labelled in keV.
column of table 1. One can clearly see that quadrupole transitions have a value of -1, while dipole ones are about ~0.7.
3. The level scheme
The y-rays identified in the present work are listed in table 1. The level scheme of ‘18Xe inferred from our data is shown in fig. 3. The ordering of levels and spin-parity assignments was based on excitation functions, intensities, y-ray angular distribution and coincidence relations.
176 C.3. Moon et at. / The band structure
1200 246 KEV GATE
1000
r z 800
(3 0 600
400
200
0 0
CHANNEL
692 KEV GATE
CHANNEL
Fig. l-continued
The structure in “*Xe was previously studied by Genevey-Rivier et al. 14) and
Kerek et al. “) using the decays of ‘19Cs and in-beam y-ray spectroscopy, respec-
tively.
3.1. THE YRAST BAND-BAND 4
The present level scheme for the ground-state band up to the 8+ state agrees with
the previous results of Kerek et al. ‘l). However, there are several discrepancies in
the region above the 8+ state. Kerek et al. identified the lo+-+ 8+, 12’+ lO+ intraband
transition y-rays to be 775 and 743 keV, respectively.

C.3. Moon et al. f The band sowture 177
TABLE 1
Properties of y-rays assigned to “sXe in the g2Mo(29Si, n2p) reaction at Elab = 110 MeV
E,.? (keV) I,? q150°)
&@W 4/A, &IA, J,rr+JT Band labels
191.3 246.0* 254.9 274.3 269.0 286.9 “) 319.0* 337.1 345.0* 423.6 438.7 “) 438.6 “) 457.0 473.1 500.5 513.3 =)* 515.0* 538.0* 545.0” 556.5* 556.0* > 586.9 590.6* 592.0* > 600.4 ‘) 622.6 “) 627.6* 630.6” 630.8* ) 637.7 “) 637.7 ‘) > 664.0* 676.9 680.0* 692.3 719.6 725.4* 737.1 “) 742.9 775.8 775.8 > 787.8 796.6 815.3 845.7* 847.0” 867.0 923.8
(1 6
Cl Cl
9 1.5 4
100 3 1
10
1.5 97
9
8
7
84
11
4 15 6
16
8
5 56
3 7 1 2
24
25
3 4 1
21
2 2
0.86 0.78
0.80 1.09 0.79 1 .oo
0.05 (17) -0.05 (29) 0.33 (8) 0.02 (13)
0.14( 1) -0.05 (1)
0.60 0.003 (5) 0.27 (7)
0.94 0.17 (1) -0.05 (2) 1.02 0.08 (14) -0.23 (25)
1.18
1.02
1.00
1.11 0.81 0.97
0.18 (12) 0.02 (19)
0.20 (2) -0.07 (3)
0.26 (19) -0.04 (31)
0.01 (8) 0.15 (13) 0.13 (8) -0.11(14)
0.98 > 0.81 (14)
0.88 0.18 (14)
0.77 0.95 0.20 (2)
0.84 0.09 (28) 0.93 0.12 (13)
0.26 (30) 0.93 0.18 (6)
0.90 0.16 (6)
0.84 0.26 (14) 0.94
0.51 - 0.09 (3)
1.11
-0.28 (21)
-0.11 (26)
- 0.02 (4)
-0.33 (46) - 0.05 (20)
0.01 (45) 0.06 (9)
0.03 (10)
0.51 (21)
0.10 (4)
(12+)-* 12+
(9-J-+9-
2+*0+
7-+5- (lo+)+ 10+
(3+)-*2+
4++2+ 9-+7- 4++2+
(7)-+5- 6+-+4’
‘“,+1:P+’ +
2++2+ (12+)+ 10+
6+-+6+ 11-+9- 8++6+ lO+ + 8+ 4++4+
(7+)+(5+)
8++6+
(9+) -? (7+) (14+)+(12+)
13-+ 11- 11-+ 10+
10++8+ 12++ 10+ 14+ + 12+ 16+ + 14+
(15-)+(13-j
9-+8+ (18+)+(16+) (17-f-r fls-)
2 + 3262 keV 2
5+4 1 -+ 3262 keV
2 2+3
2 4 2 3
5+4 6+5
1 4 3 5 2 1
l-+3 5 6 4
s*4 5
s-+4 3 5 5
5+4 6 1 2 4 6 S 3
3+4 1 4 4 4 4 3 5
3+4 4 3
l-4

178 C.B. Moon et al. / The band structure
TABLE l-continued
E, “1 (kev) 1, “1 AJAr, .%/A, J:-+J; Band labels
1022.1
1029.2*
1103.9
1112.1*
1132.6 1143.5
1162.9
1185.4*
1187.3*
14
1
1
1
3 3
il
4
<l
0.55 -0.13 (6) 0.10 (10) 7-+6+
(3+) + (2+) 4++2+
(5+)+(4+)
0.53 0.13 (15) -0.17 (24) (9-)+(8+) 0.47 (7-)-+6+
(7-)+6+
0.54 - 0.24 (26) 0.09 (41) 5-+4+
3-4
6+4
5+4
6+4
2+4
1+4
6+4
3+4
3262 keV+ 4
“) Uncertainties +0.3 keV (*; kO.5 keV).
b, Uncertainties are a few percent for the strong transitions and up to 50% for the weak.
‘) Contains impurities from another reactions.
Parenthesized numbers in the 4th and 5th column are percentage errors.
In the present work, however, the ordering of the 775 and the 743 keV transitions
was found to be reversed. The reasons were based on y-ray intensities, excitation
functions and, in particular, the relationships to the side bands.
The previously reported ‘I) 765 keV (14++ 12+) and 812 keV (18++ 16+) transi-
tions were not observed in the yrast band. The existence of the 776 keV doublet was
evident from the fact that there was a 776 keV line in the spectrum gated by the
776 keV line (see fig. 1).
Considering the intensities of the 776 and 788 keV y-rays, we concluded that the
second 776 keV line should be placed on top of the 12+ level. In the spectrum gated
on the 847 keV line, both the 743 and the 776 keV peaks were present and the
intensities of the 776 keV line was stronger than that of 743 keV. Hence, we assigned
the 847 keV line as the (18++ 16+) transition. The present yrast level scheme is in
good agreement with the result of Janzen et al. 12).
3.2. THE NEGATIVE-PARITY BAND - BAND 3
We began by investigating the 846 keV transition decaying from the 2920 keV
level to the ground-band 8+ state. A ,y* analysis of the angular distribution for the
846 keV y-ray, where as usual a gaussian distribution of magnetic substates was
assumed and the mixing ratio S was varied, showed pure electric dipole characteris-
tics, i.e., 6 = 0 as shown in fig. 2. Therefore, we have assigned a spin-parity of
J” = 7- to the 2920 keV level. There exist similar negative bands in heavier Xe
isotopes 6-‘o). The 2920 keV state decays also to the 2420 keV level, which in turn
feeds into the ground-band 6+ state via the 1022 keV transition. The 1022 keV line
showed pure electric dipole nature (see fig. 2).
We have established the 5- state at 1996 keV as the band head and it should be
noted that J” = 5- band head was not observed in the heavier Xe isotopes 6-‘o). The

C.B. Moon et al. / The band structure 179
ARCTANiDELTA)
118XE I022KEV
ARCTANt DELTA)
Fig. 2. ,yz tests for the angular distributions of the 846 and 1022 keV transitions in “*Xe.
1996 keV state decays, via the 1185 keV transition, to the ground-band 4+ state and
corresponds to the 1994 keV state reported previously by Genevey-Rivier et al. 14).
3.3. THE GAMMA BAND - BANDS 5 AND
The quasi-y-band built on the 2+ state at 928 keV confirmed the previous result
of ref. 14) up to the 6+ state at 1998 keV with characteristic strong even-odd stagger-
ing. However, the present result extended the even-spin sequence levels up to
C.B
2
Moon es al. /
3 5925.5
‘The band structwe
5 5355.6
f
6
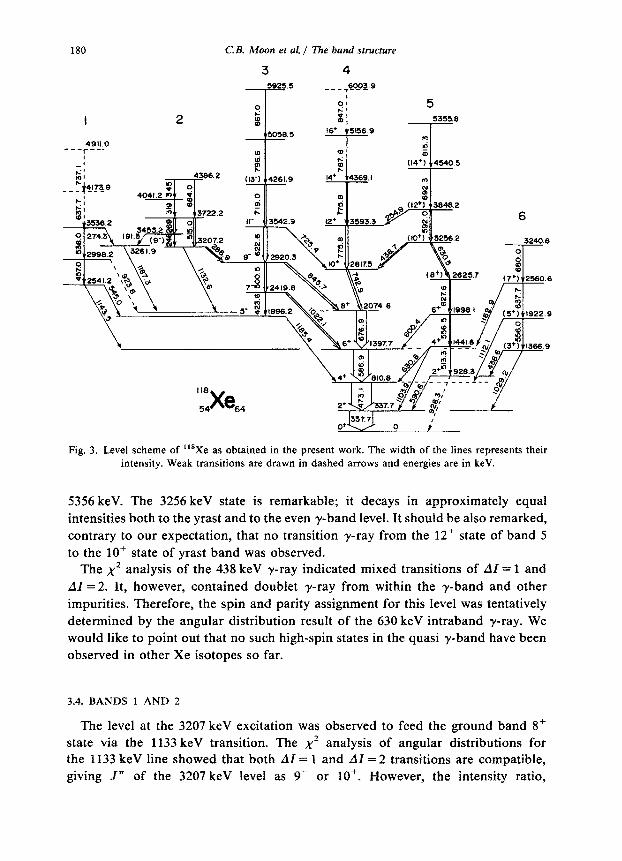
Fig. 3. Level scheme of “‘Xe as obtained in the present work. The width of the lines represents their
intensity. Weak transitions are drawn in dashed arrows and energies are in keV.
5356 keV. The 3256 keV state is remarkable; it decays in approximately equal intensities both to the yrast and to the even y-band level. It should be also remarked, contrary to our expectation, that no transition -y-ray from the 12+ state of band 5 to the lO+ state of yrast band was observed.
The x2 analysis of the 438 keV y-ray indicated mixed transitions of AI = 1 and Af =2. It, however, contained doublet y-ray from within the y-band and other impurities. Therefore, the spin and parity assignment for this level was tentatively determined by the angular distribution result of the 630 keV intraband y-ray. We would like to point out that no such high-spin states in the quasi y-band have been observed in other Xe isotopes so far.
3.4. BANDS 1 AND 2
The level at the 3207 keV excitation was observed to feed the ground band 8+ state via the 1133 keV transition. The x2 analysis of angular distributions for the 1133 keV line showed that both Af = 1 and Al = 2 transitions are compatible, giving J” of the 3207 keV level as 9- or lo+. However, the intensity ratio,

C.B. Moon et al. I The band structure 181
I?( 150”)/1,(80”) showed that the 1133 keV transition is more like a dipole character.
This band, built on the 3207 keV level, consists of the Al = 2 cascades interwoven
by Al = 1 cascades.
The 2541 keV level decays tc .h~ ground-band 6’ state and the negative-parity
band 5- state by the 1143 and 545 keV transitions respectively. This 2541 keV
band head was also observed by Genevey-Rivier et al. 14). The spin-parity of this
band head is likely to be 7- and the band is of the AI = 2 stretch cascade type.
However, since its transitic 1s were all very weak, we could neither determine the
clear ordering of transition, nor the spin-parity assignments. Finally, the band head
at the 3262 keV excitation feeds into the ground-band 8+ state via the 1187 keV
transition and is connected to the side bands by the 274 and 192 keV transitions,
respectively.
4. Discussion
4.1. EXPERIMENTAL AND THEORETICAL ROUTHIANS
Fig. 4a shows the plots of the present experimental routhians (e’) as a function
of frequency w for various bands in “‘Xe. The reference was the ground reference
(g), parametrized using the expression:
E:(w) = --$J~J~-$~~J~+ h2/8J,,, (1)
where we used the Harris parameters J0 = 6.3 MeV-’ fi2 and 5, = 140.5 MeV3h4 as
determined by fitting the ground-state band of “‘Xe.
1.4- la)
Fig. 4. (a) Experimental routhians(e’) plotted against rotational frequency (hw). The ground band
reference has been used with parameters J,, = 6.3 MeV-‘h* and _r, = 140.5 MeV3tr4 as described in the
text. The arabic numbers represent the band numbers given in fig. 3. (b) Theoretical routhians obtained
from CSM calculations in fig. 5. The quasiparticle notations are same as those in fig. 5.

182 C.B. Moon et al. / The band srructure
Two backbends are observed in the present experiment, one in the yrast band (band 4) at hw, = 0.39 MeV and the other in the y-band (band 5) at hw, = 0.31 MeV.
To compare with experimental routhians, a CSM calculation was performed using the method described by Bengtsson and Frauendorf “). Fig. 5 shows the calculated quasiparticle trajectories of li8Xe. For the calculation, we have used the following parameters: quadrupole deformation, Q = 0.25; hexadecapole deformation, Ed = 0; triaxiality parameter, y = -17” (the Lund convention); pairing gap parameters for neutrons and protons, A, = A, = 1.25 MeV. The value of .Q was derived from the
0 01 02 0.3 3.4 05 0.6
fio( MeV)
Fig. 5. Cranked shell-model calculations for “sXe. Quasiparticle energies (e’) are plotted against
rotational frequency (ho). The full and dash-dotted curves correspond to signature cr = +$ and the dashed and dash-double-dotted curves to (I = -4. Diabatic trajectories are labelled with capital letters and adiabatic trajectories with small letters. The trajectories are also Iabeiled at ho = 0 with their quantum
numbers. (a) neutrons; (b) protons.
C.B. Moon et al. J The band structure 183
B(E2,2++ O’), which was consistent with the value used in Meyer-ter-Vehn calcula-
tion in Xe isotopes r6). The value of y was chosen to reproduce the first crossing
at Rw, = 0.39 MeV in the quasineutron trajectories. For the pairing gap parameters,
recent compilations of separation energies “) gave rise to A, = 1.37 MeV and A,, =
1.35 MeV. However, considering a slight reduction of the pair field in excited
configurations ‘), we chose A, = A,, = 1.25 MeV.
The trajectories A(a), B(b), C(c) and D(d) in fig. 5 refer to the h1r/2 orbitals and
E(e) and F(f) to the g7/2 orbitals for both quasi-neutrons and protons.
To obtain, in the present CSM calculation, the diabatic trajectories, we incorpor-
ated the method developed by Shimizu et al. ‘*).
The theoretical routhians derived from fig. 5 in the CSM scheme are presented
in fig. 4b.
In the above CSM calculation, we have assumed the yrast crossing at hwc=
0.39 MeV is due to neutron quasiparticles Y(h11,2)2 and adjusted y-deformation as
y = -17”. In fact, the crossing frequency is very sensitive to the y-value and it was
found that with y = +lO”, the above crossing frequency is also obtainable from the
proton quasiparticles r( h22,2) 2.
However, the signature splitting in odd-A neighboring nuclei is also highly
sensitive to the -y-value. Therefore, we have calculated CSM trajectories for ‘19Xe
(see fig. 6) using two different values of y, e.g. -17” and +lO”, and compared with
the recent data of lr9Xe obtained by Barci et al. 19). The comparison shows that
though both neutron and proton quasiparticles predict the backbend near the
observed value, the experimental (Y = *i signature splitting of the hlr,* quasineutron
of r19Xe cannot be reconciled with y=+lO” but with y= -17”. The unfavored
signature levels of “‘1 [ref. ‘“)I have not yet been observed and no comparison
could bemade. This shows our choice of parameters used in the CSM calculation
for “*Xe is consistent with all existing data, and, thereby, the yrast backbend at
hw,- 0.39 MeV is probably due to the u(h 11,2)2 alignment. Though the above
conclusion is corroborated by the fact that the first yrast backbending in 122Xe
[ref. *)I, 124,126,‘28Xe [ref. “)I and 13’Xe [ref. “)I originates from the same v(h,,,,)*,
it can not be considered as indisputable, and the question of the cause of the yrast
backbend in “*Xe is still open.
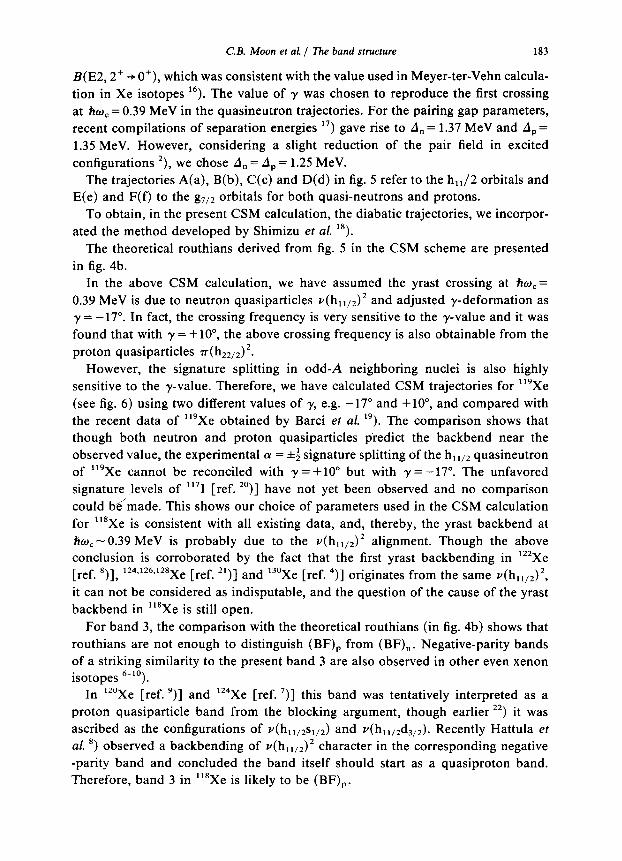
For band 3, the comparison with the theoretical routhians (in fig. 4b) shows that
routhians are not enough to distinguish (BF), from (BF),. Negative-parity bands
of a striking similarity to the present band 3 are also observed in other even xenon
isotopes 6-1o).
In “‘Xe [ref. ‘)I and lz4Xe [ref. ‘)] this band was tentatively interpreted as a
proton quasiparticle band from the blocking argument, though earlier 22) it was
ascribed as the configurations of v(h 11,2s1,2) and V(hll12d3,2). Recently Hattula et
al. “) observed a backbending of v(h ,,,2)2 character in the corresponding negative
-parity band and concluded the band itself should start as a quasiproton band.
Therefore, band 3 in “*Xe is likely to be (BF),.

184 C.B. Moon et al. / The band structure
y=-170 I 1 I I
&;=0.25 , I
I.64 c
-161 , , , , , 1
0 0.1 0.2 0.3 0.4 0.5
An= , I
An= 1.25 MeV $= +& ’ ’ I 1 I I I ’ -I-
-.., - ‘... -
-t-
%w( MeV) (a) (b)
Fig. 6. Cranked shell-model calculations for ‘19Xe. Quasiparticle energies (e’) are plotted against
rotational frequency (hw). The full and short-dashed curves correspond to parity and signature (-, rf,
and the long-dashed and dot-dashed curves to (+, ri). (a) for y = -17”; (b) for y = 10”. The experimental
data of ph,,,, for ‘19Xe are shown by dots (o = f) and crosses (a = -f) in quasineutron configurations
and rh,,,z for “‘I by dots (a = $) in quasiproton configurations. (The odd-even mass differences 1.25
are added in ‘19Xe and “‘I respectively).
As shown in fig. 4a, we have observed a backbending in the y-band (band 5) at
hw, = 0.31 MeV. Experimental routhians for the upper section of this y-band are
apparently like the (AB), configuration in fig. 4b. However, it is not clear whether
one could apply the result of the CSM calculation of fig. 4b, since deformations in
the y-band would be considerably different from deformations in the yrast band.
To pursue this problem further and also calculate the crossing frequency of the
y-band we have employed, in the following section, the y-dependent CSM method
recently proposed by Chen et al. 23).
4.2. BAND CROSSING IN THE y-BAND
The y-dependent CSM3,23) q re uires to calculate total routhians E’ expressed as
a function of rotational frequency o and y deformation parameter, i.e.,
(2)

C.B. Moon et al. / The band structure 185
where e;, Eh,,, and e, are the quasiparticle energy, the core energy and the
y-vibrational energy respectively. In eq. (2), e: are obtained by the standard CSM
calculations for the given w- and y-values, EL,,, has a phenomenological
expression 3, as
E;,,,(o, y)=~V,,cos3 y-$~~(&+$o~J~)~cos~(y+30~), (3)
e, = (E2+) 9+J81-72sin23y
9-JgI-72sin23y’ (4)
where E2+ is the excitation energy of the 2+ state in the ground band. In the present
calculation, the prolate-oblate energy difference parameter VP, was chosen as
VP, = -400 keV, which was provided by the signature splitting in the h,,,2
quasineutron bands of l19Xe nucleus 19). For Harris parameters in eq. (3),
Jo = 9 MeV-‘h2 and J,, = 33 MeV3h4 were used. These values are obtained from the
super band in ‘22Xe [ref. ‘)I, which is considered more stable. It was found that
variation of the &2 parameter within the values of 0.20-0.25 affected very little the
crossing frequency and the signature splitting of the h,,,2 orbitals in both quasi-
neutron and proton. This suggests that the triaxiality parameter y plays a dominant
role.
In the y-dependent CSM calculation, the y-values of triaxiality are determined
as those corresponding to the minimum of total routhian when they are varied as
a function of y at a given w-value. We have carried out these calculations at hw = 0.2,
0.3, 0.4 and 0.5 MeV. Fig. 7 shows a typical result at hw = 0.3 MeV, where total
-120 -Iti -60 -60 -40 -20 0 20 40 60
Ytdegree) Fig. 7. Total routhians for the indicated configurations, at hw = 0.30 MeV, as function of the triaxiality
parameter y in Lund convention.
186 C.B. Moon et al. / The band structure
TABLE 2
The y-deformations for the various bands in “‘Xe obtained by
the calculation described in the text
Band y-deformations (deg)
frw (MeV): 0.2 0.3 0.4 0.5
ground-state -5 -10 -15 -22
(A, -30 -20 -30 -20 -30 -20 -30 -20
(AB), 5 8 5 0
YWB), -30 -30 -30 -30
(BF), “) 10
“) Gamma value represents only at hw =0.30 MeV.
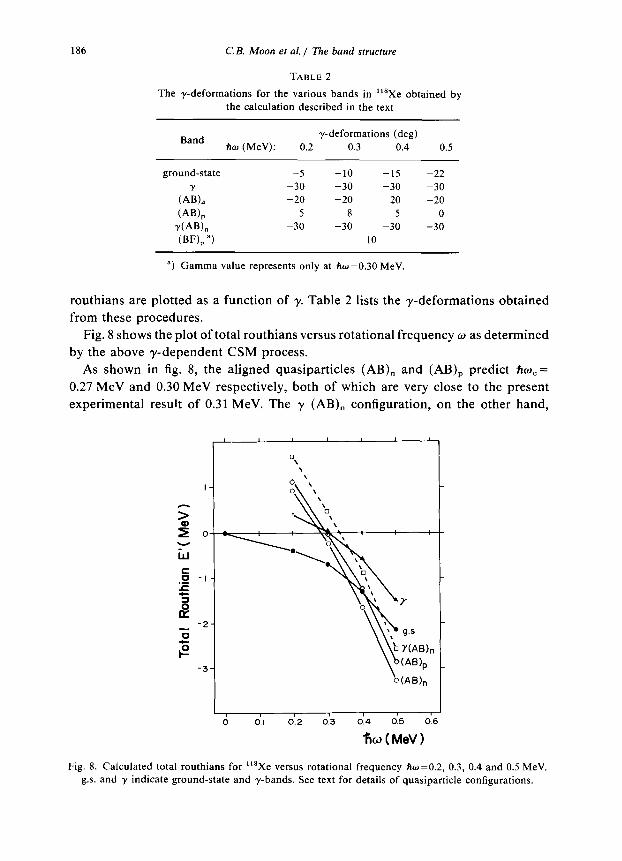
routhians are plotted as a function of y. Table 2 lists the y-deformations obtained
from these procedures.
Fig. 8 shows the plot of total routhians versus rotational frequency w as determined
by the above y-dependent CSM process.
As shown in fig. 8, the aligned quasiparticles (AB), and (AB), predict hw,=
0.27 MeV and 0.30 MeV respectively, both of which are very close to the present
experimental result of 0.31 MeV. The y (AB), configuration, on the other hand,
I I , I
0 01 0.2 0.3 0.4 0.5 06
ficd(MeV)
Fig. 8. Calculated total routhians for “‘Xe versus rotational frequency ho =0.2, 0.3, 0.4 and 0.5 MeV.
g.s. and y indicate ground-state and y-bands. See text for details of quasiparticle configurations.

C.B. Moon et al. / The band structure 187
gives fro, = 0.36 MeV, a somewhat larger value. One might prefer (AB), to (AB), from the fact that the crossing comes earlier and there is a significant transition from the (lo+) state of the band 5 to the lO+ state of the yrast band. For the case of (AB), , the lower hw, value compared to that of the yrast band would be explained by the reduction of pairing correlations due to large y-deformation.
The first backbending in the y-band has been also observed in 13’Ce [ref. ‘“)I. In their similar calculation to the present, the responsible configuration was attributed to the y(AB),, while the first bhckbend in the yrast band was due to the (AB), quasiparticles.
This work was partly supported by the Science Promotion Foundation of Ministry of Education, R.O.K., C.B.M. and J.C.K. would like to express their thanks to the staff of Tandem Accelerator Laboratory of the Tsukuba University for their help and hospitality.
References
1) A. Arima and F. Iachello, Phys. Rev. Lett. 39 (1975) 1069
2) R. Bengtsson and S. Fraudendorf, Nucl. Phys. A327 (1979) 139
3) S. Frauendorf and F.R. May, Phys. Len. B125 (1983) 245
4) T. Lonnroth, J. Hattula, H. Helppi, S. Juutinen, K. Honkanen and A, Kerek, Nucl. Phys. A431
(1984) 256
5) T. Liinnroth, S. Vajda, O.C. Kistner and M.H. Rafailovich, Z. Phys. A317 (1984) 215
6) W. Lieberz, S. Freund, A. Granderath, A. Gelberg, A. Dewald, R. Reinhardt, R. Wirowski, K.O. Zell and P. von Brentano, Z. Phys. A330 (1988) 221
7) W. Gast, U. Kaup, H. Hanewinkel, R. Reinhardt, K. Schiffer, K.P. Schmittgen, K.O. Zell, J.
Wrzesinski, A. Gelberg and P. von Bretano, Z. Phys. A318 (1984) 123
8) J. Hattula, S. Juutinen, M. Jiilskeliiinen, T. Lonnroth, A. Dakkanen, M. Piiparinen and G. Sletten,
J. of Phys. 613 (1987) 57
9) K. Loewenich, K.O. ZeII, A. Dewald, W. Gast, A. Gelberg, W. Lieberg, P. von Brentano and P. Van
Isacker, Nucl. Phys. A460 (1986) 316
10) MS. Rouabah, Th. Byrski, F.A. Beck, D. Curien, Il. Hass, J.C. Merdinger, J.P. Vivien, J. Gizon and B. Nyako, Z. Phys. A328 (1987) 493
11) A. Kerek, T. Lonnroth, K. Honkanen, E. der Mateosian and P. Thieberger, Z. Phys. A317 (1984) 169
12) V.P. Janzen, J.C. Waddington, J.A. Cameron, D. Popescu and D. Rajnauth, McMaster Annual
Report (1985) p. 62
13) V.P. Janzen, CR. Bingham, M.P. Carpenter, L.L. Riedinger, W. Schmitz, J.A. Cameron, J.K.
Johansson, D.G. Popescu, D.D. Rajnauth, J.C. Waddington, J. Debug, G. Kajrys, S. Monaro and S. Pilotte, Bull. Am. Phys. Sot. (1987) 1096
14) J. Genevey-Rivier, A. Charvet, G. Marguier, C. Richard-Serre, J. D’auria, A. Huck, G. Klotz, A.
Knipper and G. Walter, Nuci. Phys. A283 (1977) 45
15) C.B. Moon, J.C. Kim, T. Komatsubara, T. Hosoda, T. Kaneko, SC. Jeong, I. Kumiawan and T. Aoki, Z. Phys. A331 (1988) 111
16) J. Meyer-ter-Vehn, Nucl. Phys. AZ49 (1975) 141
17) A.H. Wapstra and G. Audi, Nucl. Phys. A432 (1985) 55
18) Y.R. Shimizu and K. Matsuyanagi, Prog. Theor. Phys. 74 (198.5) 1346

188 C.B. Moon et al. / 7’he band structure
19) V. Barci, J. Gizon, A. Gizon, J. Crawford, J. Genevey, A. Plochocki and M.A. Cunningham, Nucl.
Phys. A883 (1982) 309
20) W.F. Diel, Jr., P. Chowdhury, U. Garg, M.A. Quader, P.M. Stwertka, S. Vajda and D.B. Fossan,
Phys. Rev. C31 (1985) 456
21) H. El-Samman, V. Barci, A. Gizon, J. Gizon, L. Hildingsson, D. Jerrestan, W. Klamra, R.
Kossakowski, Th. Lindblad, T. Bengtsson and G.A. Leander, Nucl. Phys. A427 (1984) 397 and
references therein
22) H. Kusakari, K. Kito, K. Sato, M. Sugawara and H. Katsuragawa, Nuci. Phys. A401 (1983) 445
23) Y.S. Chen, S. Frauendorf and G.A. Leander, Phys. Rev. C28 (1983) 2437 24) D.M. Todd, R. Aryaenejad, D.J.G. Love, A.H. Nelson, P.J. Nolan, P.J. Smith and P.J. Twin, J. of
Phys. GIO (1984) 1407