Future Water Security across Urban Southeast Asia - MDPI
21
water Review Double Exposures: Future Water Security across Urban Southeast Asia Theresa E. Lorenzo * and Ann P. Kinzig School of Life Sciences, Arizona State University, Tempe, AZ 85202, USA; [email protected] * Correspondence: [email protected] Received: 16 November 2019; Accepted: 24 December 2019; Published: 30 December 2019 Abstract: Southeast Asia is one of the most dynamic regions in the world in terms of economic growth and urbanization. At the same time, the region is also prone to multiple hydro-meteorological disasters, which are projected to be intensified by climate change. This paper analyzes the combined effect of economic development and climate change on the future water security of middle-income Southeast Asian countries using the double exposure framework, focusing on the effects in urban areas. A review of the existing literature reveals unequal water security outcomes across the region as a result of combined climate, economic, and urbanization pressures. The water supply and sanitation infrastructure of upper-middle-income Southeast Asian countries are vulnerable to damage from intensified disasters, potentially decreasing both immediate and longer-term water quality. In lower-middle-income countries, the water quality will be the more important water security challenge in the short-term as opposed to water quantity, mainly due to the fast growth of industries. Lower-middle-income countries, though less vulnerable to disasters, will still have lower future water security compared to upper-middle-income countries, as they have less capacity to address water quality and quantity challenges brought about by both industrial growth and urbanization. Across the region, future water quantity and quality challenges may result in slower economic and urban growth if not planned adequately. Keywords: water security; Southeast Asia; sustainable development; multiple exposures; double exposures; sustainable urban water management 1. Introduction 1.1. Background Southeast Asia is one of the fastest-growing regions in the world in terms of both economy and population, with urbanization expected to continue at a high pace in the coming years [1]. Hydro-meteorological disasters, such as floods and cyclones are prevalent in this region, which is naturally disaster-prone [2]. Climate change is projected to intensify these disasters and cause changes in precipitation patterns further, both of which will further add to water stress. At the same time, Southeast Asia is industrializing, with industry and service playing an increasingly important role in the region’s economies as compared to agriculture, and some countries have set targets of becoming developed countries within 30 years [3,4]. Both climate change and future development will certainly impact future water security in the region. Water security is defined by the United Nations (UN) as “The capacity of a population to safeguard sustainable access to adequate quantities of and acceptable quality water for sustaining livelihoods, human well-being, and socio-economic development, for ensuring the protection against water-borne pollution and water-related disasters, and for preserving ecosystems in a climate of peace and political stability” [5]. Although the impact of climate change on water security in the region has Water 2020, 12, 116; doi:10.3390/w12010116 www.mdpi.com/journal/water
-
Upload
khangminh22 -
Category
Documents
-
view
1 -
download
0
Transcript of Future Water Security across Urban Southeast Asia - MDPI
water
Review
Double Exposures: Future Water Security acrossUrban Southeast Asia
Theresa E. Lorenzo * and Ann P. Kinzig
School of Life Sciences, Arizona State University, Tempe, AZ 85202, USA; [email protected]* Correspondence: [email protected]
Received: 16 November 2019; Accepted: 24 December 2019; Published: 30 December 2019 �����������������
Abstract: Southeast Asia is one of the most dynamic regions in the world in terms of economicgrowth and urbanization. At the same time, the region is also prone to multiple hydro-meteorologicaldisasters, which are projected to be intensified by climate change. This paper analyzes the combinedeffect of economic development and climate change on the future water security of middle-incomeSoutheast Asian countries using the double exposure framework, focusing on the effects in urbanareas. A review of the existing literature reveals unequal water security outcomes across the regionas a result of combined climate, economic, and urbanization pressures. The water supply andsanitation infrastructure of upper-middle-income Southeast Asian countries are vulnerable to damagefrom intensified disasters, potentially decreasing both immediate and longer-term water quality.In lower-middle-income countries, the water quality will be the more important water securitychallenge in the short-term as opposed to water quantity, mainly due to the fast growth of industries.Lower-middle-income countries, though less vulnerable to disasters, will still have lower future watersecurity compared to upper-middle-income countries, as they have less capacity to address waterquality and quantity challenges brought about by both industrial growth and urbanization. Acrossthe region, future water quantity and quality challenges may result in slower economic and urbangrowth if not planned adequately.
Keywords: water security; Southeast Asia; sustainable development; multiple exposures; doubleexposures; sustainable urban water management
1. Introduction
1.1. Background
Southeast Asia is one of the fastest-growing regions in the world in terms of both economyand population, with urbanization expected to continue at a high pace in the coming years [1].Hydro-meteorological disasters, such as floods and cyclones are prevalent in this region, which isnaturally disaster-prone [2]. Climate change is projected to intensify these disasters and cause changesin precipitation patterns further, both of which will further add to water stress. At the same time,Southeast Asia is industrializing, with industry and service playing an increasingly important role inthe region’s economies as compared to agriculture, and some countries have set targets of becomingdeveloped countries within 30 years [3,4].
Both climate change and future development will certainly impact future water security in theregion. Water security is defined by the United Nations (UN) as “The capacity of a population tosafeguard sustainable access to adequate quantities of and acceptable quality water for sustaininglivelihoods, human well-being, and socio-economic development, for ensuring the protection againstwater-borne pollution and water-related disasters, and for preserving ecosystems in a climate of peaceand political stability” [5]. Although the impact of climate change on water security in the region has
Water 2020, 12, 116; doi:10.3390/w12010116 www.mdpi.com/journal/water
Water 2020, 12, 116 2 of 21
been covered extensively [6–8], the impact of future economic development on water security has notbeen explored in as much detail. Economic water security in the region has been measured as theproductivity of economic sectors as compared to their water use through the National Water SecurityIndex [9]. This index, however, does not address the variation in the quantity and quality of waterinputs needed to sustain the economic growth of different countries, nor how the wastewater outputof different economic sectors can affect water quality. As the economies of countries across the regionare composed of different types of industries and services, their water input needs and wastewateroutputs will also vary accordingly, with some economic sectors and industry types considered as morepolluting than others. The water security implications of increasing urbanization across the region havealso been discussed, but have not been placed in the greater context of economic development [9,10].As water security in Southeast Asia is affected by the simultaneous impacts of both climate changeand economic development, there is a need to understand the probable water security outcomes andchanges in the context that may arise from the combination of the two phenomena.
The combined effect of climate change and economic development on water security will beanalyzed in this paper using the double exposure framework, which is used to examine the interactionsbetween global environmental change and globalization [11]. Specifically, this paper will focuson outcome double exposure, studying how the combination of environmental and global changephenomena can exacerbate existing inequalities across the region, and context double exposure, wherethe combination of the two phenomena can increase vulnerability to different shocks and stresses.The inclusion of multiple stressors, particularly socio-economic factors, in long-term governmentplanning is needed to ensure effective future climate adaptation and sustainable urban futures [12].The messages of the double exposure framework have been incorporated in water security analysesat different scales and in different contexts, such as the construction of an index identifying specificgroups vulnerable to both climate change and water conflict in Chad [13], and in studies examiningwater governance in the USA [14], as well as in India [15]. In Southeast Asia specifically, the doubleexposure framework has been mostly used in single countries at the household and community scale,for example, examining seasonal water insecurity [16] and the vulnerability of coastal communitiesto multiple stressors [17]. The futures of selected coastal megacities in the region have also beencompared using the double exposure framework [18]. However, to the best of the authors’ knowledge,this framework has not yet been applied in a broad cross-country analysis throughout the region.
1.2. Methods
This article applies the double exposure framework to middle-income countries in Southeast Asiaas defined by the World Bank [19] through the analysis of existing literature and broad socio-economicdata. This paper draws on both peer-reviewed studies and grey literature sources. The major typesof literature reviewed include (a) economic reports from regional and international developmentagencies; (b) reports on climate change and water resources from the same agencies as (a); (c)socio-economic factbooks and databases published by national, regional, and international agencies;and (d) peer-reviewed journals. The primary database consulted for the peer-reviewed studies was theWeb of Science, accompanied by hand-searching of relevant studies on Google Scholar. The authorsconducted a search of grey literature through three methods: a keyword search using both the Web ofScience and the Google search engine, searching the reference list of relevant peer-reviewed articles,and searching for published reports from key international development agencies that conduct researchin the field of water security, climate change, and economic development throughout Southeast Asia.The three main development agencies doing work in the region that touched on one or multiple of thesefields, as identified by the authors, were the World Bank, Asian Development Bank, and UN-Water.The authors did not enforce strict dates of coverage during their literature search, but focused onstudies from 2000 until the present, particularly those conducted in the last decade.
In this paper, both climate and economic development trends resulting from globalization andtheir impacts on water security on the region as a whole will first be discussed separately, after which

Water 2020, 12, 116 3 of 21
the impacts resulting from their combination will be analyzed in terms of outcome and context doubleexposure. This article will focus on the “sustaining livelihoods, human well-being, and socio-economicdevelopment” aspects of water security. Through a qualitative cross-country comparative analysis ofpast trends and future outlooks in the realms of climate change and economic development acrossSoutheast Asia, this review ultimately aims to identify the areas in the region which are most likely toexperience the strongest water security stress in the future and discuss the reasons leading to this futurestress. Both climate change and socio-economic development stresses should be analyzed in order toadequately plan for not only climate change adaptation, but also for sustainable future urban growth.
2. Review of Water Security Drivers across Southeast Asia
2.1. Trends and Outlook on Economic Growth
Out of the Southeast Asian countries, Cambodia, Lao PDR, Myanmar, Indonesia, the Philippines,and Vietnam are considered lower-middle (LM) income countries, while Thailand and Malaysia areconsidered upper-middle (UM) income countries [19]. The economies of the first three countries, wereupgraded to a lower-middle-income designation from low income during the past decade, namely 2016for Cambodia [20], 2011 for Lao People’s Democratic Republic [21], and 2015 for Myanmar [22], whilethe other countries’ economies are considered more established. Throughout this paper, Cambodia, LaoPDR, and Myanmar will be collectively referred to as LM, with the remaining countries of Indonesia,the Philippines, Vietnam, Malaysia, and Thailand referred to as UM.
Over the period of 2010–2018, agriculture as a percentage of GDP declined while services asa percentage of GDP rose in all middle income Southeast Asian countries considered save for Lao PDR(Table 1). Since 2010, LM countries are experiencing fast growth in both services (Services refers tocategories G-U as defined by the United Nations 23, some of which are wholesale and retail trade,transportation and storage, food and accommodation, information and communication, financial andinsurance, real estate, professional, scientific, and technical activities, etc.) and industry (Industry refersto categories B-F defined by the United Nations [23], namely mining and quarrying, manufacturing,electricity, gas, steam, and air-conditioning supply, water supply, water management, and remediationactivities, and construction) (Table 1), while the economic expansion of UM countries is mostly in theservices sector.
Table 1. Composition of Southeast Asian middle-income-country Gross Domestic Product for 2010 and2018. Data compiled by the authors from the World Bank [24].
CountryAgriculture Industry Manufacturing 1 Services
% of GDP % of GDP % of GDP % of GDP
2010 2018 2010 2018 2010 2018 2010 2018
LM
Cambodia 34.0 22.0 22.0 32.0 15.0 16.0 38.3 39.5Lao PDR 33.0 26.0 30.0 32.0 11.0 7.0 43.6 41.6Myanmar 37.0 25.0 26.0 32.0 20.0 24.0 36.7 43.2
UM
Indonesia 14.0 13.0 43.0 40.0 22.0 20.0 40.7 43.4Malaysia 10.0 8.0 40.0 39.0 23.0 22.0 48.5 52Thailand 11.0 8.0 40.0 35.0 31.0 27.0 49.5 56.9Philippines 12.0 9.0 33.0 31.0 21.0 19.0 55.1 60Vietnam 18.0 15.0 32.0 34.0 13.0 16.0 36.9 41.2
1 Manufacturing is calculated as part of Industry Gross Domestic Product (GDP).
The economies of countries in LM and UM countries differ in terms of the growth of industry, asthe former group generally registered an increase in the percentage of industry and manufacturing(save for Lao PDR) as part of their Gross Domestic Product(GDP), while the share of industry in the
Water 2020, 12, 116 4 of 21
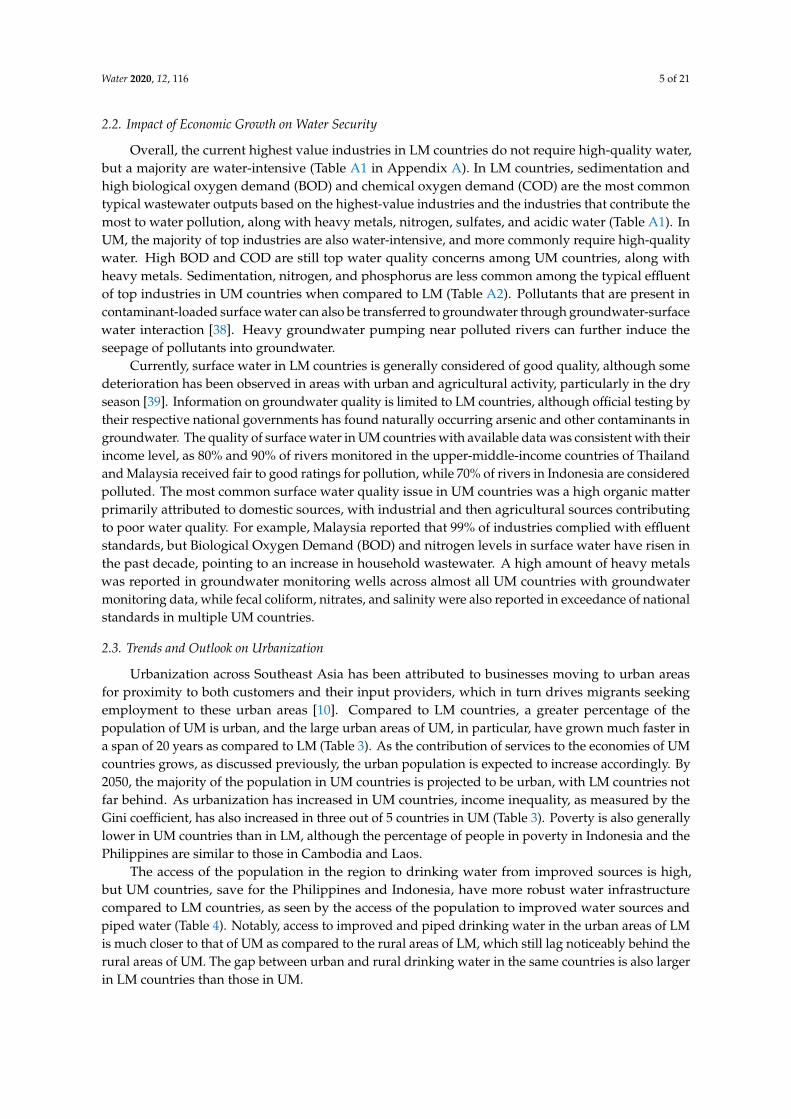
GDP of UM countries declined while that of services increased. The extractive industries of timber andmining are high-value industries in both Lao PDR and Myanmar, whereas in UM countries, althoughextractive industries still play a role, their economies are more diversified in terms of the type of goodsthat are produced (Table 2).
Similarly, the service economies of UM countries are more diversified than in LM, with the notableinclusion of financial services. Tourism, including hotels and restaurants, is a major service industryacross Southeast Asia that is expanding rapidly in LM countries, with tourist arrivals growing by148–297% during the period of 2007–2016, while in UM countries the percentage growth rates of touristarrivals range from 32–141% for the same time period [25]. Similar to the industrial sector, tourism ismuch more established in UM countries as compared to LM, considered as a major service industry inthree out of the five countries of UM (Table 2). The average annual tourist arrivals for UM are over17 million, more than four times the average of LM, which is 4 million.
Table 2. Largest industry and services areas of the countries included in this study.
Country Industry a Services
LM
Cambodia Garments, Construction, Rice milling, Fishing, Wood andwood products, Rubber, Cement
Trade, Transport and Communications, RealEstate and Business b
Lao PDR Mining (copper, tin, gold, gypsum); Timber, Electricpower, Agricultural processing, Rubber, Construction Wholesale and Retail, Tourism c
MyanmarAgricultural processing; Wood and wood products;
Mining (copper, tin, tungsten, iron); Cement,Construction materials, Pharmaceuticals
Wholesale and retail, information andcommunication d
UM
Indonesia Petroleum and natural gas, Textiles, Automotive,Electrical appliances, Apparel, Footwear
Trade, hotels, and restaurants,transportation and communication,
financial services e
MalaysiaRubber and oil palm processing and manufacturing,
Petroleum and natural gas, Light manufacturing,Agriculture processing, Logging, Pharmaceuticals
Real estate, Financial services,Telecommunications f
Philippines
Semiconductors and electronics assembly, Food andbeverage manufacturing, Construction,
Electric/gas/water supply, Chemical products,Radio/television/communications Equipment
and apparatus
Trade and repair of goods, Real estate,Financial intermediation g
ThailandTextiles and garments, Agricultural processing,
Beverages, Tobacco, Cement, Light manufacturing suchas jewelry and electric appliances
Tourism, Financial Services, Wholesaleand Retail h
Vietnam Food processing, Garments, Shoes, Machine-building;Mining, Coal, Steel
Tourism, Telecommunications, Wholesaleand Retail
a in order of value from highest to lowest [26]; b [27]; c [28]; d [29]; e [30]; f [31]; g [32]; h [4,33].
LM’s economies are forecast to be the fastest-growing in the region in the medium term of2019–2023, with projected average annual GDP growth ranging from 6.9–7.0, while that of the otherfive countries in UM ranges from 3.7 to 6.6 [34]. Labor-intensive manufacturing is expected to progressin Southeast Asia in the medium term due to low labor costs, as well as the manufacturing sectorin China, moving to more high-value output [35]. The continued economic growth will also meanthat Southeast Asian countries will have to continually diversify their production and produce morecomplex goods and services [36]. Although the potential for mining expansion remains high in LMcountries, it is more likely that the future focus of these countries will be on the development of theirmanufacturing and services sectors, which can be integrated with the supply chains of other, moredeveloped Asian countries [37].
Water 2020, 12, 116 5 of 21
2.2. Impact of Economic Growth on Water Security
Overall, the current highest value industries in LM countries do not require high-quality water,but a majority are water-intensive (Table A1 in Appendix A). In LM countries, sedimentation andhigh biological oxygen demand (BOD) and chemical oxygen demand (COD) are the most commontypical wastewater outputs based on the highest-value industries and the industries that contribute themost to water pollution, along with heavy metals, nitrogen, sulfates, and acidic water (Table A1). InUM, the majority of top industries are also water-intensive, and more commonly require high-qualitywater. High BOD and COD are still top water quality concerns among UM countries, along withheavy metals. Sedimentation, nitrogen, and phosphorus are less common among the typical effluentof top industries in UM countries when compared to LM (Table A2). Pollutants that are present incontaminant-loaded surface water can also be transferred to groundwater through groundwater-surfacewater interaction [38]. Heavy groundwater pumping near polluted rivers can further induce theseepage of pollutants into groundwater.
Currently, surface water in LM countries is generally considered of good quality, although somedeterioration has been observed in areas with urban and agricultural activity, particularly in the dryseason [39]. Information on groundwater quality is limited to LM countries, although official testing bytheir respective national governments has found naturally occurring arsenic and other contaminants ingroundwater. The quality of surface water in UM countries with available data was consistent with theirincome level, as 80% and 90% of rivers monitored in the upper-middle-income countries of Thailandand Malaysia received fair to good ratings for pollution, while 70% of rivers in Indonesia are consideredpolluted. The most common surface water quality issue in UM countries was a high organic matterprimarily attributed to domestic sources, with industrial and then agricultural sources contributingto poor water quality. For example, Malaysia reported that 99% of industries complied with effluentstandards, but Biological Oxygen Demand (BOD) and nitrogen levels in surface water have risen inthe past decade, pointing to an increase in household wastewater. A high amount of heavy metalswas reported in groundwater monitoring wells across almost all UM countries with groundwatermonitoring data, while fecal coliform, nitrates, and salinity were also reported in exceedance of nationalstandards in multiple UM countries.
2.3. Trends and Outlook on Urbanization
Urbanization across Southeast Asia has been attributed to businesses moving to urban areasfor proximity to both customers and their input providers, which in turn drives migrants seekingemployment to these urban areas [10]. Compared to LM countries, a greater percentage of thepopulation of UM is urban, and the large urban areas of UM, in particular, have grown much faster ina span of 20 years as compared to LM (Table 3). As the contribution of services to the economies of UMcountries grows, as discussed previously, the urban population is expected to increase accordingly. By2050, the majority of the population in UM countries is projected to be urban, with LM countries notfar behind. As urbanization has increased in UM countries, income inequality, as measured by theGini coefficient, has also increased in three out of 5 countries in UM (Table 3). Poverty is also generallylower in UM countries than in LM, although the percentage of people in poverty in Indonesia and thePhilippines are similar to those in Cambodia and Laos.
The access of the population in the region to drinking water from improved sources is high,but UM countries, save for the Philippines and Indonesia, have more robust water infrastructurecompared to LM countries, as seen by the access of the population to improved water sources andpiped water (Table 4). Notably, access to improved and piped drinking water in the urban areas of LMis much closer to that of UM as compared to the rural areas of LM, which still lag noticeably behind therural areas of UM. The gap between urban and rural drinking water in the same countries is also largerin LM countries than those in UM.

Water 2020, 12, 116 6 of 21
Table 3. Regional trends on urbanization and inequality from 2000 to 2018 [25,35].
Urban Pop (% of Total Pop) Pop. in Urban Areas >1 M (% Total Pop.) Pop. Below Natl Poverty Line (%) Gini Coefficient
2000 2018 2030 2050 2000 2018 2007 2016 2007 2016
LMCAM 18.59 23.39 29.00 41.20 9.45 12.01 30.10 14.00 0.44 0.31LAO 21.98 35.00 42.90 55.70 N/A N/A 27.6 b 23.20 0.37 b 0.38 a
MYA 27.03 30.58 35.00 47.10 14.24 14.28 25.6 c 32.10 N/A N/AUMIND 42.00 55.33 62.80 72.80 12.09 13.38 16.60 10.90 0.36 0.40MAL 61.98 76.04 81.80 87.30 18.01 23.99 3.60 0.40 0.44 0.40PHI 46.14 46.91 50.90 61.80 9.46 12.16 26.30 21.60 0.46 d 0.4 a
THA 31.39 49.95 58.40 69.50 12.76 20.06 20.90 8.60 0.40 0.45 a
VIE 24.37 35.92 44.50 57.30 9.58 16.91 14.80 7.00 0.43 b 0.44a 2015 data, b 2008 data, c 2010 data, d 2011 data.
Table 4. Regional trends in sanitation and water supply from around 2000 to present [39] (All figures refer to population percentages).
YearUrban Rural National
Improved1 Sani. Sewer Improved
2 H2OPipedH2O
ImprovedSani. Sewer Improved
H2OPipedH2O
ImprovedSani. Sewer Improved
H2OPipedH2O
LM
CAM1999 32.8 2.5 66.5 8.8 10.2 0.2 48.6 1.8 16.7 3.8 54.3 6.42016 94.2 51.5 94.6 77.8 69.0 3.4 72.6 17.2 74.2 13.4 77.2 29.8
LAO2000 58.8 1.0 83.3 37.4 12.3 0.0 38.0 6.7 22.5 0.2 48.0 13.52017 94.1 1.3 95.5 88.8 65.0 0.9 72.7 42.9 73.9 * 1.0 * 79.6 * 56.9 *
MYA2001 94.9 10.6 77.9 22.8 77.5 0.6 58.0 5.8 82.2 * 3.3 * 64.0 10.12016 76.9 0.8 93.3 59.1 51.1 0.1 78.6 12.7 58.0 0.3 82.5 25.2
UM
IND2001 67.7 - 90.5 33.6 30.1 - 67.0 6.5 46.3 - 77.2 18.32018 90.3 (2016) 9.5 95.6 13.2 76.7 13.5 82.5 6.8 83.4 11.6 82.9 10.3
MAL2003 98.9 42.2 99.8 96.4 97.1 11.9 98.7 88.0 98.3 * 31.5* 99.4 * 93.4 *2016 - - 99.6 99.1 - - 92.3 84.5 100.0 77.0 95.9 95.9
PHI2000 92.7 7.3 89.8 62.1 71.6 1.8 76.9 31.8 82.0 * 4.3 * 82.9 * 45.8 *2017 93.7 7.0 98.4 31.3 84.2 2.4 94.4 28.0 88.8 4.6 96.2 29.5
THA2000 100.0 - 99.8 89.7 98.6 - 92.4 18.1 98.8 - 94.2 35.52016 99.6 10.8 99.7 85.8 99.6 5.2 98.1 53.3 99.6 7.8 99.0 68.7
VIE2000 86.2 2.9 96.7 50.6 51.4 0.2 73.5 0.8 22.5 0.9 * 79.0 12.62016 96.9 1.4 98.2 77.4 81.7 0.5 87.1 21.4 86.8 0.8 90.7 39.3
* National figures estimated using population data. 1 Improved sanitation refers to “sanitation facilities that hygienically separate human excreta from human contact” and can rangefrom pit latrines with a slab to those with sewer connections. 2 Improved drinking water sources are “those that have the potential to deliver safe water by nature of their design andconstruction, and include: piped water, boreholes or tube wells, protected dug wells, protected springs, rainwater, and packaged or delivered water.”.
Water 2020, 12, 116 7 of 21
Similar to the trend in water access, a greater part of the population of UM countries have accessto improved sanitation sources as compared to LM countries (Table 4). In Cambodia and UM countries,except for Malaysia, septic tanks are the most common type of improved sanitation facility, with around59–89% of the population able to access these [39]. For Myanmar and Laos, improved latrine systemsare the most common, with 64.8 and 57.2% of their population respectively being able to access these.Sewer infrastructure is present only among a minority of the population, even in most UM countries,with the percentage of the population in UM countries with sewer connections being comparable toLM counterparts save for Malaysia.
2.4. Impact of Urbanization on Water Security
Domestic water for drinking in urban areas is most commonly sourced from surface water inLaos, Myanmar, and Malaysia [38]. In contrast, the majority of water users in Cambodia and UMcountries aside from Malaysia depend on groundwater as their primary drinking water source, rangingfrom around 20% in urban and 50% in rural areas in Cambodia to at least 90% in both urban andrural areas in Indonesia [40]. Across the region, groundwater usage is prevalent among domesticusers in rural areas. In LM countries, groundwater usage is rising due to demand from an increasingpopulation, as well as seasonal demand during the summers [38]. The increased use of electrifiedwater pumps for domestic use could also increase groundwater extraction rates [40]. The main qualityissue for domestic groundwater is contamination from wastewater and leakage of on-site sanitationfacilities. Other important quality issues are contamination from pesticides, industrial sources, andsaline intrusion [40]. Some of the population have responded to these issues by tapping deeper levelsof groundwater. Surface water pollution in the region has also been found to impact the groundwaterquality significantly [41].
Less than 15% of the population in UM countries (aside from Malaysia) and Cambodia areconnected to a sewerage system. Even the affluent capital cities of UM countries are not completelycovered by sewerage treatment systems, as for example, only 30% of sewage is treated in Hanoi and50% in Bangkok [42]. Sewage treatment facilities are typically built at a national per capita GDP of$5000, which has not been yet reached by countries in the region other than Thailand and Malaysiabut are now being planned and built in some cities in the regions which have a per capita GDPapproaching $5000 [42]. Septic tanks, which are the predominant form of sanitation facility in most UMcountries and Cambodia, generally require the initiative of private owners to empty, and accordingto surveys in Indonesia and Vietnam, 66 and 75% have never done so [43]. Substandard septic tanksand sanitation facilities lower than the level of septic tanks, such as improved pit latrines, can leachcontaminants such as nitrogen, phosphorus, and disease-causing microbes into groundwater [44].Pollution from household sanitation facilities can even affect the quality of water from wells used bythe same household depending on proximity.
2.5. Trends and Outlook on Climate Change
Precipitation in Southeast Asia is dominated by the presence and absence of monsoons, with mostcountries in the region experiencing a distinct wet monsoon period during the boreal summer monthsof June-October and a dry period during the months of December–April, with May and Novemberas transition months [45,46]. Throughout the 20th and early 21st-century, precipitation trends inSoutheast Asia have indicated an increase in intensity for both dry and wet periods, both low andhigh precipitation events increased in frequency [47]. Extreme wet and dry conditions during the wetmonsoon period have also both increased [47].
The boreal summer months, which see the strongest monsoon activity, also correspond to themonths where tropical cyclones are most active. Out of the Southeast Asian countries, the Philippinesand Vietnam are most affected by cyclones due to these countries’ geographical locations [33], directlyfacing the Pacific Ocean and the South China Sea, respectively. Vietnam receives up to 25% of itsprecipitation from cyclones during the wet season [48], while the Philippines can receive up to 53% [49].

Water 2020, 12, 116 8 of 21
The high frequency of cyclone events in the Philippines and Vietnam affects many people and isestimated to cause the highest total damage out of different hydrometeorological disasters that affectboth countries (Table 5). For the Philippines, in particular, cyclones are, without a doubt, the mostimpactful disaster, as they have the highest value in all four impact criteria considered over the periodof 1998–2018. The high damage potential of cyclones is underscored by Laos and Myanmar, wherealthough less than 10 cyclone disaster events were experienced in these two countries during the lasttwenty years, cyclones still affected the most people and caused the most damage both per event andin total. Counted among the cyclone events in Myanmar is Cyclone Nargis, which is the worst naturaldisaster in Myanmar’s history, and the eighth deadliest cyclone worldwide as of 2009 [50].
Water 2020, 12, 116 9 of 21
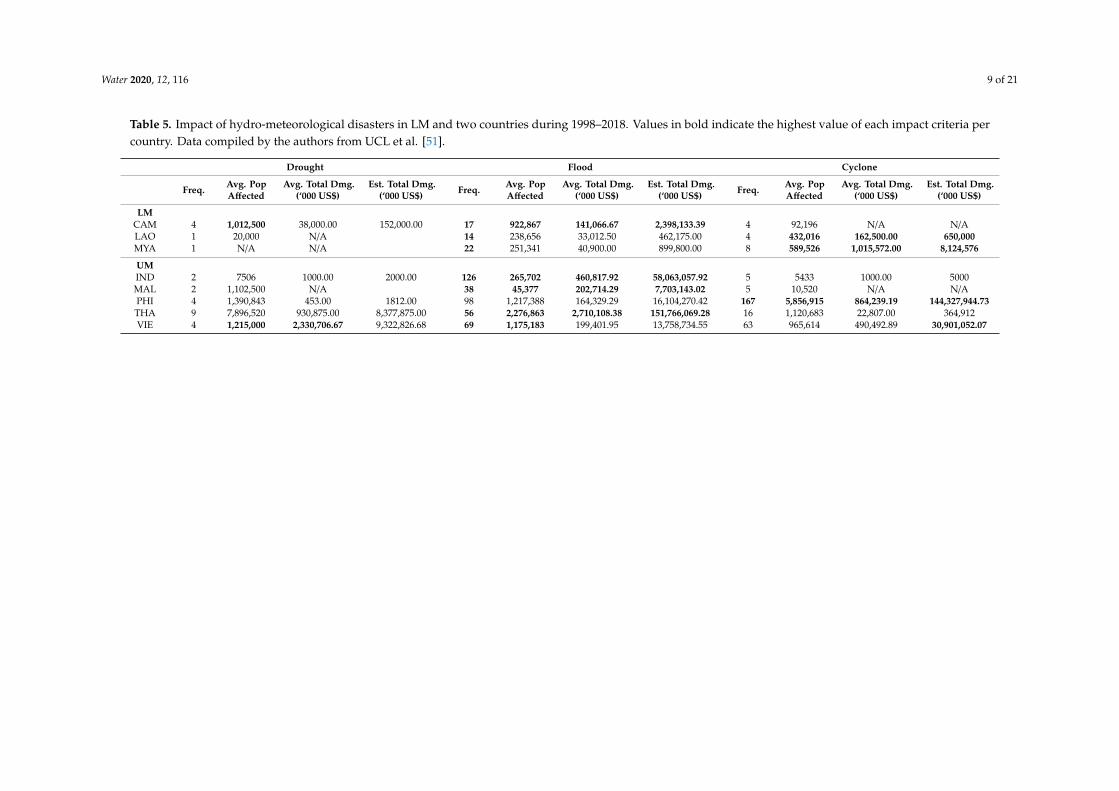
Table 5. Impact of hydro-meteorological disasters in LM and two countries during 1998–2018. Values in bold indicate the highest value of each impact criteria percountry. Data compiled by the authors from UCL et al. [51].
Drought Flood Cyclone
Freq. Avg. PopAffected
Avg. Total Dmg.(‘000 US$)
Est. Total Dmg.(‘000 US$) Freq. Avg. Pop
AffectedAvg. Total Dmg.
(‘000 US$)Est. Total Dmg.
(‘000 US$) Freq. Avg. PopAffected
Avg. Total Dmg.(‘000 US$)
Est. Total Dmg.(‘000 US$)
LMCAM 4 1,012,500 38,000.00 152,000.00 17 922,867 141,066.67 2,398,133.39 4 92,196 N/A N/ALAO 1 20,000 N/A 14 238,656 33,012.50 462,175.00 4 432,016 162,500.00 650,000MYA 1 N/A N/A 22 251,341 40,900.00 899,800.00 8 589,526 1,015,572.00 8,124,576
UMIND 2 7506 1000.00 2000.00 126 265,702 460,817.92 58,063,057.92 5 5433 1000.00 5000MAL 2 1,102,500 N/A 38 45,377 202,714.29 7,703,143.02 5 10,520 N/A N/APHI 4 1,390,843 453.00 1812.00 98 1,217,388 164,329.29 16,104,270.42 167 5,856,915 864,239.19 144,327,944.73THA 9 7,896,520 930,875.00 8,377,875.00 56 2,276,863 2,710,108.38 151,766,069.28 16 1,120,683 22,807.00 364,912VIE 4 1,215,000 2,330,706.67 9,322,826.68 69 1,175,183 199,401.95 13,758,734.55 63 965,614 490,492.89 30,901,052.07
Water 2020, 12, 116 10 of 21
In contrast, floods have the most significant impact in all other countries in the region, as seenin Table 5. Over a span of the last twenty years, flood disaster events have been the most frequentdisaster event in UM countries aside from the Philippines and Vietnam, as well as in Cambodia.In these countries and particularly in Thailand, floods have caused the most economic damage ascompared to the cyclone disaster events that they experienced. Indonesia is also particularly affectedby floods, as it has experienced the highest number of flood disaster events, with each event causingthe second-highest amount of damage across the region. Flood disasters are much more frequent inUM countries rather than in LM countries, but floods are still the most frequently occurring disaster inthe latter group.
Across the region, drought disaster events occur less often than floods or cyclones. Althoughthere is a lack of data regarding the monetary damage caused by drought events, Vietnam, Cambodia,and Thailand are particularly affected by droughts in terms of either population affected or damagecaused. Overall, the economic cost of natural disasters is substantial, ranging from 1 to almost 1% ofGDP lost annually across both groups of countries [34]. Out of the UM countries, those currently mostaffected by natural disasters according to this metric are Vietnam, Thailand, and the Philippines, with1–6% of GDP lost annually [34]. Out of the LM countries, Cambodia is an outlier, losing almost 7%of its GDP annually to disasters, while Myanmar and Lao PDR lose less than 2% [34]. On the whole,UM countries are currently more vulnerable than LM countries to disasters that could be intensifiedwith climate change, especially in terms of exposure, but Laos and Cambodia in LM are still highlyvulnerable to climate change due to their low adaptive capacity [52].
Models indicate that the trend of more intense precipitation events during the wet season coupledwith less intense precipitation during the dry season (as described in the previous section) will continuein the future for most of Southeast Asia [53]. There is significant spatial variation across the region, asprecipitation changes are expected to be negligible in both dry and wet seasons in the LM countriesand Thailand. Similarly, precipitation extremes related to the monsoon in Southeast Asia are alsoexpected to be more intense [54]. However, models are inconclusive regarding future increases ordecreases in the total amount of rain that the monsoon brings. Although it is likely that the frequencyof cyclones will remain the same or decrease slightly, the Intergovernmental Panel on Climate Change(IPCC) has projected that the rainfall associated with the center of cyclones, as well as the wind incyclones, will intensify [54]. Some researchers have then attributed the predicted overall increase inintense precipitation events during wet seasons across the region to stronger cyclones, particularly incoastal Vietnam [53].
Other countries in Southeast Asia will be most affected by increased flooding [55] and streamflowseasonality. Although the mean annual streamflow across the region is not expected to change,models predict that streamflow will decrease during low flow periods and increase during high flowperiods [56]. Thus, countries will be more at risk of droughts during dry seasons and floods duringwet seasons. Taking the projected streamflow and changes in the precipitation together, the total waterquantity in Southeast Asia is not expected to change drastically due to climate change, but the wholeregion will experience increased variability in the wet and dry seasons.
2.6. Impact of Climate Change on Water Security
Climate change is projected to affect water quality in Southeast Asia through an increase inwater temperatures, a decrease in streamflow during low-flow periods, and an increase in risk fromsalinization due to storm surges and sea-level rise. The temperatures of inland water bodies inthe region are expected to increase by 5 to 2.0 C by the end of this century [56]. Increasing watertemperatures will result in more ideal conditions for the growth of algae and bacteria, decreasingthe quality of water for all uses [57]. A decrease in streamflow during low flow periods will alsodecrease the dilution of pollutants, resulting in increased effluent loads, including heavy metals andagricultural byproducts. The intensification of disasters due to climate change is will likely aggravatethe existing salinization of groundwater in coastal areas in the area through stronger storm surges
Water 2020, 12, 116 11 of 21
caused by stronger cyclones [58]. A long-term effect of climate change on water quality in coastal areasis sea-level rise, which would again increase the salinity of groundwater reserves in coastal areas [54].With worsening water quality due to an increase in water temperatures and a decrease in streamflow,users in all sectors will thus have to invest additional resources in water treatment for portability andto ensure that the temperature is suitable for commercial and industrial processes.
More pronounced seasonality of precipitation and streamflow across the region will result inwater stress in terms of quantity during the dry season. A decrease of access to aboveground watersources will drive more users to tap groundwater, which has already been extracted extensively inmajor cities in Southeast Asia [59]. There would be increased demand for groundwater, especiallyduring the dry summer season, and would particularly increase across currently developing cities.Access to water could also be affected due to damage to water infrastructure, first during the moreintense wet season due to increased damage to water transportation networks because of strongercyclones and increased flood risk [60]. Second, the damage sustained by water supply and storagenetworks during the more intense wet season could also limit water access during the dry season dueto the need for repair and rehabilitation.
3. Discussion
3.1. UM: Focus on the Impact of Disasters on Water Security in Urban Areas
3.1.1. Immediate Impacts of Disasters on Water Security
A key point of focus of future water security in UM countries will be the impact of disasterson water resources, an area that not has been properly considered in disaster planning [61]. Goingforward, the effect of flooding on water quality will have an increasingly greater impact on the watersecurity of UM cities. Floods, the most common disaster event across UM, can carry pollutants,including agricultural and industrial chemicals, directly into both water sources and groundwateraccess points such as wells [62]. In urban areas, floods can damage sanitation infrastructure, which cancause the overflow of raw sewage, and therefore, further contamination of drinking water [63]. Septictanks, the use of which is prevalent among UM countries, do not seem to be a major contributor togroundwater contamination during normal flood events [64], but overflow has been observed duringstrong floods [65]. Existing industrial areas in UM that are located near urban areas could be possiblesources of chemical contaminants as floods occur, and floodwaters wash through industrial areas andcarry contaminants to rivers and into groundwater supplies. However, surface water quality in thiscontext is only temporarily decreased by floods, as the quality of rivers contaminated by floodwaterthat has washed over pollutant-heavy floodplains returns to normal after around 30–40 h [66]. Ingrowing UM cities that will experience more intense floods, disaster planning for the aftermath offloods should consider the immediate reduction of water quality, particularly as a result of damage tosanitation infrastructure.
3.1.2. Long-Term Impacts of Disasters on Water Security and Development
The combination of environmental and economic change will modify the context in which UMcountries will address external shocks and stressors. As UM countries continue to transition towardsa service-oriented economy, more people in rural areas will be drawn towards major cities, manyof which are located in coastal areas. In these growing major cities, higher-intensity floods candecrease water quality for a longer period of time by damaging water treatment or access infrastructure.Prolonged flood events can also delay the start of infrastructure rehabilitation and repair. High-velocityflash floods can damage every part of the water supply systems, such as intakes, reservoirs, pumpingequipment, and electrical installations [63]. With more intense floods, there is a larger chance ofa long-term decrease in water quality through infrastructure damage. As a result, the expansion ofpiped water access in the cities of UM could be delayed, which will be more crucial as urbanization

Water 2020, 12, 116 12 of 21
grows to respond to the rise of services. The slow expansion could particularly be seen in fringeareas where population growth is faster than in the urban center [67]. Out of all UM countries, thePhilippines and Indonesia could be the most affected by delayed expansion, as the majority of theurban population in these two countries does not have access to piped water.
Floodwater and stormwater management should be important areas of focus for UM areas,particularly in urban areas, in order to avert the effects of disasters on water quality. Aside from themanagement of the actual floodwaters, the protection of drinking water access points and infrastructurefrom floods should be important parts of long-term urban water planning. For the private sector,financing climate change adaptation measures is considered a hurdle that is more likely to overcome ifthey can offset the costs to consumers or they receive subsidies for the costs of adaptation [68]. If theindustrial sector is not able to prepare for more intense floods and does sustain repeated damage totheir water storage and access infrastructure, economic development in that sector could be slowedas a high quality and quantity of water is needed to sustain many UM industries. Disruption in theproduction of goods could also affect the retail service sector, which relies on a regular schedule ofproduction throughout the supply chain [68].
3.2. UM: Additional Effect of Cyclones on the Philippines and Vietnam
Out of the UM countries, the Philippines and Vietnam will be the least water-secure as they arevulnerable to both frequent floods and cyclones, both of which are projected to increase in intensity.Destructive cyclones can lower water quality for a longer time as strong winds and torrential rain addto the damage potential of floods explained in the previous paragraph. For example, excessive coliformwas still observed in groundwater months after an extremely strong typhoon hit the Philippines, and itspresence was attributed mainly to the destruction of sanitation facilities [69]. Strong winds can damageboth aboveground buildings housing water supply equipment and belowground infrastructure, suchas water pipes through tree uprooting. Storm surges from cyclones have been shown to result in thesalinization of both surface water and coastal aquifers, and in some cases, models predict that it mighttake years before infiltrating rainfall flushes infiltrated saltwater to surrounding water bodies [70,71].Major metropolitan areas in the Philippines and Vietnam that are located on coastlines alreadyexperience salinization due to massive groundwater pumping [72,73]. With the increasing intensityof cyclones coupled with increasing migration to large coastal cities due to perceived employmentopportunities in the services sector, the Philippines and Vietnam will have to deal with increasedsalinization from storm surges and an increased chance of human waste contamination due to sanitationinfrastructure damage. This is in addition to the dynamic of decreasing water quality as a result ofmore intense floods present in all UM countries.
3.3. UM: Water Quantity Most Important during Dry Seasons
During dry seasons, water quantity issues will be paramount over water quality concerns for theUM. As the majority of the countries in the UM mostly depend on groundwater [38], water users shouldnot be overly affected by drops in water quality due to streamflow decreases during the dry season.Quantity issues, on the other hand, will surface in the dry seasons due to decreased precipitation andincreasing domestic water demand. Surface water users in this group will be beset by water quantityissues in the dry season and water quality during the wet season. Floodwater and stormwater projects,aside from protecting current water resources, should also promote water treatment, reuse, and storagein preparation for the dry seasons.
3.4. LM: Overall Less Water Secure than UM, Water Quality More Important than Quantity in the Short-Term
Water security in LM will be lowest during dry seasons due to water quality and quantity pressurefrom the combination of climate change, economic development, and urbanization, coupled with highusage of surface water. Many extractive industries are still among the highest-value industries in LM,and industry effluent regulations are not yet as stringent in these countries as in UM countries. Surface
Water 2020, 12, 116 13 of 21
water is utilized by around 90% of water users in Laos and Myanmar, as well as by the industry inCambodia [38]. Thus, these users will be increasingly susceptible to the negative effects of industrialeffluent as the industry becomes a bigger part of these countries’ economies. In addition to a decreasein water quality due to an increasing industry effluent, climate change will also reduce water qualityduring the dry season through decreasing streamflow and higher water temperatures. Groundwaterusage is projected to rise in LM due to a growing demand from the domestic and industrial sector,and especially during the dry season [38]. In addition to growing demand, decreasing water supplyduring dry seasons could further encourage the usage of groundwater. Increasing groundwater usagecould introduce additional quality issues. First, pumping groundwater near polluted rivers couldinduce seepage of contaminants into groundwater. For example, massive groundwater pumpingnear Hanoi has increased the level of arsenic in the aquifer through drawing in river water, whichhas arsenic-loaded sediment [74]. Second, household groundwater wells could be contaminated byleakage of effluent from pit latrines and septic tanks, which are the most common forms of sanitationin LM, depending on proximity. Although the water in LM is considered abundant at present [38], LMwater withdrawals are expected to increase in the future due to rising household income and industrialexpansion. As agriculture is still a major part of the economy of LM countries, water use may drop inthe near-term as their economies start to transition towards services and industry. However, in thelong term, it is predicted that water quantity stress will be felt primarily due to industrial and domesticwater use rather than irrigation [75]. In the short-term, water quality rather than quantity issues couldbe more pressing for LM countries to address, as quantity shortages during the dry season can be filledthrough increasing groundwater usage.
Even though LM has less exposure to disaster events than UM, LM can still be affected byinfrequent, high-damage disaster events, particularly cyclones in the case of Laos and Myanmar. Asdiscussed in the previous section, cyclones can damage water infrastructure, and so have the potentialto affect water security both immediately and for longer durations of time depending on the speed ofrepair of the infrastructure. Water infrastructure should, therefore, be constructed to withstand greatdamage, and urban water planning should include the effects of these disasters, as they are projectedto intensify. In this case, damage to water infrastructure is sustained during these events, rehabilitationand repair could take longer in LM compared to UM countries due to their lower adaptive capacity.
As quality is the most important issue for LM, sanitation programs and regulation of industrialeffluent should be emphasized in the near term, as well as continuing to improve water access andquality. High-quality water is required for the diversification of economies if LM is to follow thefootsteps of UM, and similarly, UM industries are still water-intensive. Not addressing quality andquantity issues, especially during the dry season and not disaster-proofing water supply and sanitationinfrastructure, could, therefore, slow LM’s transition to the more diverse economies and bigger urbanareas of the UM countries.
4. Conclusions
Southeast Asia is one of the world’s most economically dynamic regions, as well as, one of theregions that are most vulnerable to the effects of climate change. The fast-growing cities in SoutheastAsia have to simultaneously address different levels of water challenges, such as increasing access todrinking water and sanitation and planning for increased flooding, at lower income levels as comparedto the experience of cities in the global North [59]. This paper uses the double exposure framework toreveal unequal water security outcomes as a result of multiple pressures, as well as changes in contextas a result of these pressures. The region-wide scope of this paper adds to previous work on doubleexposures in urban Southeast Asia conducted at smaller scales [16–18]. In this paper, water qualityemerges as the most important future water security concern for the whole region. Specifically, (1) moreintense disasters, especially flooding, have the potential to decrease water quality in the UM countriesof Indonesia, the Philippines, Vietnam, Malaysia, and Thailand immediately after the event, as well asfor a longer period of time through infrastructure damage; (2) in UM, the Philippines and Vietnam
Water 2020, 12, 116 14 of 21
will have the lowest future water security as they are both more vulnerable to cyclones, which havehigher damage potential for water supply and sanitation infrastructure damage compared to otherUM countries; and (3) in the LM countries of Cambodia, Myanmar, and Lao PDR, water quality will bethe more important water security challenge in the short-term as opposed to water quantity due tolarge growth in industry and high surface water usage. Although less exposed to disaster events thanUM, LM will still have lower future water security compared to UM as they have to build capacity toaddress water quantity and quality challenges, particularly in the dry season. Having to address thesechallenges may result in a long time of transition for LM countries to the more diversified economiesand better water and sanitation access of UM. The importance of water quality in ensuring watersecurity across Southeast Asia suggests that it should be a focus of future water-related developmentprojects conducted in the region at all levels. The results of this review further suggest that building therobustness of water infrastructure to disaster events and planning for sanitation to cover expandingurban areas will be crucial to ensure future water security in terms of water quality across the region.These two actions will be salient for the sustainable development of both the region’s emerging citiesand its established mega metropolitan areas.
Author Contributions: Conceptualization—T.E.L. and A.P.K.; investigation—T.E.L.; writing—original draftpreparation—T.E.L.; writing—review and editing—A.P.K. All authors have read and agreed to the publishedversion of the manuscript.
Funding: This research received no external funding.
Conflicts of Interest: The authors declare no conflict of interest.
Appendix A
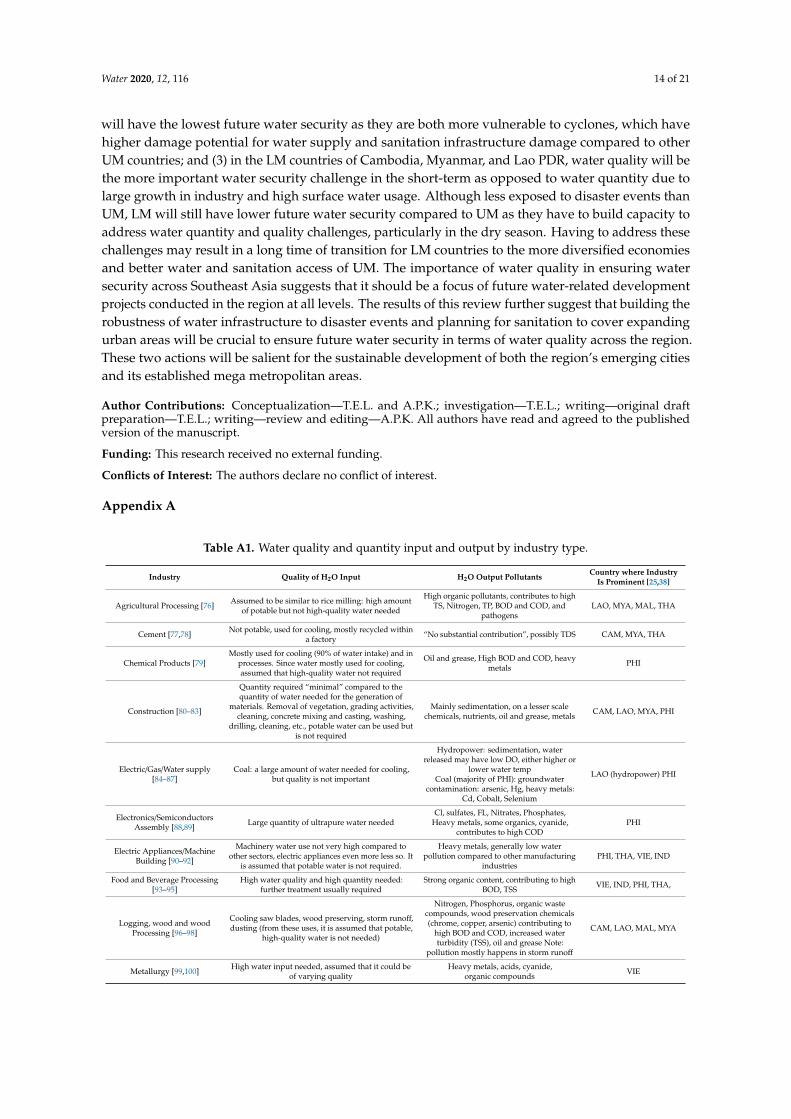
Table A1. Water quality and quantity input and output by industry type.
Industry Quality of H2O Input H2O Output Pollutants Country where IndustryIs Prominent [25,38]
Agricultural Processing [76] Assumed to be similar to rice milling: high amountof potable but not high-quality water needed
High organic pollutants, contributes to highTS, Nitrogen, TP, BOD and COD, and
pathogensLAO, MYA, MAL, THA
Cement [77,78] Not potable, used for cooling, mostly recycled withina factory “No substantial contribution”, possibly TDS CAM, MYA, THA
Chemical Products [79]Mostly used for cooling (90% of water intake) and in
processes. Since water mostly used for cooling,assumed that high-quality water not required
Oil and grease, High BOD and COD, heavymetals PHI
Construction [80–83]
Quantity required “minimal” compared to thequantity of water needed for the generation of
materials. Removal of vegetation, grading activities,cleaning, concrete mixing and casting, washing,
drilling, cleaning, etc., potable water can be used butis not required
Mainly sedimentation, on a lesser scalechemicals, nutrients, oil and grease, metals CAM, LAO, MYA, PHI
Electric/Gas/Water supply[84–87]
Coal: a large amount of water needed for cooling,but quality is not important
Hydropower: sedimentation, waterreleased may have low DO, either higher or
lower water tempCoal (majority of PHI): groundwater
contamination: arsenic, Hg, heavy metals:Cd, Cobalt, Selenium
LAO (hydropower) PHI
Electronics/SemiconductorsAssembly [88,89] Large quantity of ultrapure water needed
Cl, sulfates, FL, Nitrates, Phosphates,Heavy metals, some organics, cyanide,
contributes to high CODPHI
Electric Appliances/MachineBuilding [90–92]
Machinery water use not very high compared toother sectors, electric appliances even more less so. It
is assumed that potable water is not required.
Heavy metals, generally low waterpollution compared to other manufacturing
industriesPHI, THA, VIE, IND
Food and Beverage Processing[93–95]
High water quality and high quantity needed:further treatment usually required
Strong organic content, contributing to highBOD, TSS VIE, IND, PHI, THA,
Logging, wood and woodProcessing [96–98]
Cooling saw blades, wood preserving, storm runoff,dusting (from these uses, it is assumed that potable,
high-quality water is not needed)
Nitrogen, Phosphorus, organic wastecompounds, wood preservation chemicals(chrome, copper, arsenic) contributing to
high BOD and COD, increased waterturbidity (TSS), oil and grease Note:
pollution mostly happens in storm runoff
CAM, LAO, MAL, MYA
Metallurgy [99,100] High water input needed, assumed that it could beof varying quality
Heavy metals, acids, cyanide,organic compounds VIE

Water 2020, 12, 116 15 of 21
Table A1. Cont.
Industry Quality of H2O Input H2O Output Pollutants Country where IndustryIs Prominent [25,38]
Mining [101–103] High water input needed, used in mining and oreprocessing, can be of varying quality Sedimentation, heavy metals, acidic water LAO, MYA, THA, VIE
Paper Processing [104–106]Large amount of water needed (pulping, bleaching,and washing), drinking water-quality only needed
for some processes, freshwater can be used otherwise
VOCs, Chlorinated organic compounds,Sulfur compounds, Suspended solids,
nitrogen, and phosphorus, contributes tohigh BOD and COD.
VIE
Pharmaceuticals [107] High-quality water needed for extraction,purification, and washing
Contributes to high BOD and COD, TOC,NH3, TDS, Cl, sulfate, other anions MAL, MYA
Petrochemical [108–111]Water intensive, used for distillation, liquid
extraction, washing, and cooling, can use waterdirectly from freshwater sources
SS, organic compounds (hydrocarbons),phenols, grease, H2S, NH3, CN−,
contributes to high BOD andCOD, hardness
IND, MAL
Rice Milling [77]Large amount of water input needed (parboiling,
washing, steaming). From these uses, it is assumedthat potable but not high-quality water is needed
BOD, COD, TSS, nitrogen (nitrates, TKN) CAM
Rubber [112–115]Large amount of water input needed (mainly usedfor washing), groundwater can be used treated by
sedimentation and filtering
Organic pollution (ex. acetic acid andformic acids, contributing to high BOD and
COD), high nitrogen (ammonia), highsulfate
CAM, LAO, MAL
Textiles/Apparel [116–118] Large amount of water input neededUntreated dye, heavy metals (ex. Pb, Hg,
Zn), organic pollution, sulfates, contributesto high BOD, COD, some TDS
CAM, IND, THA, VIE
Steel [100,119]Water input-intensive, used in furnaces, cooling,washing, and product isolation. From these uses,assumed that high-quality water is not needed.
Oil and grease, high BOD and COD,NH3-N, organic compounds, TDS, heavy
metals, cyanide, acids,VIE
Vehicles [120–123] Used for washing and coloring, use freshwater thatis further processed in the plant itself
High BOD, COD, heavy metals, oil andgrease, organic and inorganic
pollutants (phosphate)IND
Table A2. Summary of water quality and quantity requirements and output by highest value and mostpolluting industries per country using data from Table A1.
Country Water Quality Water Quantity
LM
CAM
Input: High-quality water is not needed for any main industry; potable ornon-potable water can be used.
Output: Sedimentation is most common quality output concern, along withhigh organic pollution (BOD and COD). Lesser scale: nitrogen, sulfates,
heavy metals.
High amount of water needed in3/5 top industries.
LAO
Input: High-quality water is not needed for any main industry; potable ornon-potable water can be used with some processing.
Output: Sedimentation is the most common quality output concern, alongwith high organic pollution (BOD and COD). Lesser scale: nitrogen, sulfates,
phosphates, heavy metals, acidic water, oil and grease.
High amount of water needed in3/5 top industries.
MYA
Input: High-quality water only needed for pharmaceutical industries, forothers potable or non-potable water can be used with some processing.
Output: Sedimentation is most common quality output concern, along withhigh organic pollution (BOD and COD) and nitrogen. Lesser scale: sulfates,
phosphates, heavy metals, acidic water, oil and grease.
High amount of water needed in2/5 top industries.
UM
IND
Input: High-quality water needed for only 1/5 industries, the rest can drawfreshwater from sources and process in the plant.
Output: Organic compounds contributing to high BOD and COD, heavymetals; Lesser scale: sedimentation.
4/5 industries are water-intensive
MAL
Input: High-quality water needed for only 1/5 industries, the rest can drawfreshwater from sources and process in the plant.
Output: Organic compounds contributing to high BOD and COD, Nitrogen,Sulfates Lesser scale: phosphorus, sedimentation.
3/5 industries are water-intensive
PHIInput: 2/6 top industries require high-quality water
Output: Heavy metals, Lesser scale: BOD and COD, sedimentation, oil andgrease
4/6 require high quantity of water
VIEInput: Only one requires high-quality water
Output: Heavy metals, BOD and COD, Sedimentation, Lesser scale: cyanide,acids, nitrogen, phosphorus, sulfates
Almost all industries arewater-intensive
Water 2020, 12, 116 16 of 21
References
1. HV, V.; Thompson, F.; Tonby, O. Understanding ASEAN: Seven Things You Need to Know|McKinsey.Available online: https://www.mckinsey.com/industries/public-sector/our-insights/understanding-asean-seven-things-you-need-to-know (accessed on 22 August 2019).
2. ESCAP-UNISDR. Reducing Vulnerability and Exposure to Disasters 2012: The Asia-Pacific Disaster Report;ESCAP-UNSDIR: Bangkok, Thailand, 2012.
3. Xinhua Cambodia’s Income Targets Are “Very Ambitious”: World Bank Experts. Available online: http://www.xinhuanet.com/english/2018-11/28/c_137637372.htm (accessed on 21 August 2019).
4. Office of the National Economic and Social Development Board. The Twelfth National Economic and SocialDevelopment Plan (2017–2021); Office of the Prime Minister: Bangkok, Thailand, 2017.
5. UN Water. Water Security & the Global Water Agenda. The UN-Water Analytical Brief ; United Nations University:Hamilton, Canada, 2013; ISBN 9788578110796.
6. Asian Development Bank. The Economics of Climate Change in Southeast Asia: A Regional Review; AsianDevelopment Bank: Manila, Philippines, 2009.
7. Biswas, A.K.; Seetharam, K.E. Achieving Water Security for Asia. Int. J. Water Resour. Dev. 2008, 24, 145–176.[CrossRef]
8. Biggs, E.M.; Boruff, B.; Bruce, E.; Duncan, J.M.A.; Haworth, B.J.; Duce, S.; Horsley, J.; Curnow, J.; Neef, A.;Mcneill, K.; et al. Environmental Livelihood Security in Southeast Asia and Oceania A Water-Energy-Food-LivelihoodsNexus Approach for Spatially Assessing Change; International Water Management Institute: Colombo, SriLanka, 2014.
9. Asian Development Bank. Asian Water Development Outlook 2016: Strengthening Water Security in Asia and thePacific; Asian Development Bank: Manila, Philippines, 2016.
10. S. Rajatnaram School of International Studies. Water Security Insights for An Urbanizing Southeast Asia; Centrefor Non-Traditional Security Studies: Singapore, 2016.
11. Leichenko, R.; O’Brien, K. Environmental Change and Globalization Double Exposures; Oxford University Press:New York, NY, USA, 2008; ISBN 9780195177312.
12. Hjerpe, M.; Glaas, E. Evolving local climate adaptation strategies: Incorporating influences of socio–economicstress. Mitig. Adapt. Strateg. Glob. Chang. 2012, 17, 471–486. [CrossRef]
13. Okpara, U.T.; Stringer, L.C.; Dougill, A.J. Using a novel climate–water conflict vulnerability index to capturedouble exposures in Lake Chad. Reg. Environ. Chang. 2017, 17, 351–366. [CrossRef]
14. Hughes, S.; Pincetl, S.; Boone, C. Triple exposure: Regulatory, climatic, and political drivers of watermanagement changes in the city of Los Angeles. Cities 2013, 32, 51–59. [CrossRef]
15. Lele, S.; Srinivasan, V.; Thomas, B.K.; Jamwal, P. Adapting to climate change in rapidly urbanizing riverbasins: Insights from a multiple-concerns, multiple-stressors, and multi-level approach. Water Int. 2018, 43,281–304. [CrossRef]
16. Mason, L.R. Seasonal Water Insecurity in Urban Philippines: Examining the Role of Gender, Resources, and Context;Washington University in St. Louis: Washington, DC, USA, 2013.
17. Bennett, N.J.; Dearden, P.; Peredo, A.M. Vulnerability to multiple stressors in coastal communities: A studyof the Andaman coast of Thailand. Clim. Dev. 2015, 7, 124–141. [CrossRef]
18. Herbeck, J.; Flitner, M. Infrastructuring coastal futures: Key trajectories in Southeast Asian megacities.J. Geogr. Soc. Berlin 2019, 150, 118–130.
19. World Bank. World Bank Country and Lending Groups–World Bank Data Help Desk. Availableonline: https://datahelpdesk.worldbank.org/knowledgebase/articles/906519-world-bank-country-and-lending-groups (accessed on 15 November 2019).
20. Ly, S. Cambodia Is Now a Lower-Middle Income Economy: What Does This Mean? Availableonline: https://blogs.worldbank.org/eastasiapacific/cambodia-is-now-a-lower-middle-income-economy-what-does-this-mean (accessed on 20 August 2019).
21. World Bank. Lao PDR Now a Lower-Middle Income Economy. Available online: https://www.worldbank.org/en/news/press-release/2011/08/17/lao-pdr-now-lower-middle-income-economy (accessed on20 August 2019).
Water 2020, 12, 116 17 of 21
22. Reuters Bangladesh, Kenya, Myanmar move up Income Ranks-World Bank-Reuters. Availableonline: https://www.reuters.com/article/worldbank-income-upgrades/bangladesh-kenya-myanmar-move-up-income-ranks-world-bank-idUSL8N0ZI3SP20150702 (accessed on 20 August 2019).
23. United Nations. International Standard Industrial Classification of All Economic Activities (ISIC), Rev. 4;United Nations: New York, NY, USA, 2008.
24. World Bank. World Development Indicators. Available online: http://wdi.worldbank.org/table/4.2# (accessedon 8 December 2019).
25. ASEAN. ASEAN Statistical Yearbook 2018; ASEAN Secretariat: Jakarta, Indonesia, 2018; ISBN 9786025798283.26. Central Intelligence Agency The World Factbook 2019. Available online: https://www.cia.gov/library/
publications/resources/the-world-factbook/index.html (accessed on 23 August 2019).27. Ngov, P.; Ngin, C. Cambodia’ s Economy and Its Services Sector in Global Value Chains: Cambodia’s Economy and
Its Services Sector in Global Value Chains; ERIA: Jakarta, Indonesia, 2019.28. World Bank Group. Lao PDR Economic Monitor: Maintining Economic Stability; World Bank: Vientiane,
Laos, 2019.29. World Bank Group. Myanmar Economic Monitor June 2019; World Bank Group: Washington DC, WA,
USA, 2019.30. World Bank Group. Indonesia Economic Quarterly: Oceans of Opportunity; World Bank: Jakarta, Indonesia, 2019.31. Malaysian Investment Development Authority Investment Data (Services Sector). Available online: https:
//www.mida.gov.my/home/investment-data-(services-sector)/posts/ (accessed on 21 August 2019).32. Mitra, R.M. Leveraging Service Sector Growth in the Philippines; ADB: Manila, Philippines, 2013; Volume 366.33. NordeaTrade Thailand: Economic and Political Overview. Available online: https://www.nordeatrade.com/
fi/explore-new-market/thailand/economical-context (accessed on 21 August 2019).34. OECD. Economic Outlook for Southeast Asia, China and India 2019; OECD Publishing: Paris, France, 2018.35. United Nations. 2019 World Economic Situation and Prospects Report; United Nations: New York, NY, USA,
2019; ISBN 9789211091809.36. Humphreys, D. In search of a new China: Mineral demand in South and Southeast Asia. Miner. Econ. 2018,
31, 103–112. [CrossRef]37. Sophocleous, M. Interactions between groundwater and surface water: The state of the science. Hydrogeology
2002, 10, 52–67. [CrossRef]38. WEPA. Outlook on Water Environmental Management in Asia; WEPA: Tokyo, Japan, 2018.39. UNICEF; WHO. Progress on Household Drinking water, Sanitation and Hygiene 2000–2017. Special Focus on
Inequalities; UNICEF: New York, NY, USA; WHO: New York, NY, USA, 2019.40. Carrard, N.; Foster, T.; Willetts, J. Groundwater as a Source of Drinking Water in Southeast Asia and
the Pacific: A Multi-Country Review of Current Reliance and Resource Concerns. Water 2019, 11, 1605.[CrossRef]
41. Jalilov, S.-M. Sustainable Urban Water Environments in Southeast Asia: Addressing the Pollution of UrbanWaterbodies in Indonesia, the Philippines, and Viet Nam; United Nations University: Tokyo, Japan, 2016.
42. Hanada, Y. Southeast Asia looks for outside help to flush sewage problem. Nikkei Asian Rev. 2019.Available online: https://asia.nikkei.com/Spotlight/Environment/Southeast-Asia-looks-for-outside-help-to-flush-sewage-problems2context (accessed on 24 August 2019).
43. WSP. Improving On-site Sanitation and Connections to Sewers in Southeast Asia: Insights from Indonesia andVietnam; World Bank: Washington, DC, USA, 2015.
44. Lerner, D.N.; Harris, B. The relationship between land use and groundwater resources and quality. Land UsePolicy 2009, 26S, S265–S273. [CrossRef]
45. Chang, C.-P.; Wang, Z.; McBride, J.; Liu, C.-H.; Chang, C.-P.; Wang, Z.; McBride, J.; Liu, C.-H. Annual Cycleof Southeast Asia—Maritime Continent Rainfall and the Asymmetric Monsoon Transition. J. Clim. 2005, 18,287–301. [CrossRef]
46. Kikuchi, K.; Wang, B.; Kajikawa, Y. Bimodal representation of the tropical intraseasonal oscillation. Clim.Dyn. 2012, 38, 1989–2000. [CrossRef]
47. Chang, C.-H. Preparedness and storm hazards in a global warming world: Lessons from Southeast Asia.Nat. Hazards 2011, 56, 667–679. [CrossRef]
48. Nguyen-Thi, H.A.; Matsumoto, J.; Ngo-Duc, T.; Endo, N. A climatological study of tropical cyclone rainfallin Vietnam. Sci. Online Lett. Atmos. 2012, 8, 41–44. [CrossRef]
Water 2020, 12, 116 18 of 21
49. Kubota, H.; Wang, B. How Much Do Tropical Cyclones Affect Seasonal and Interannual Rainfall Variabilityover the Western North Pacific? J. Clim. 2009, 22, 5495–5510. [CrossRef]
50. Fritz, H.M.; Blount, C.D.; Thwin, S.; Thu, M.K.; Chan, N. Cyclone Nargis storm surge in Myanmar. Nat. Geosci.2009, 2, 448–449. [CrossRef]
51. Université Catholique de Louvain (UCL); CRED; Guha-Sapir, D. EM-DAT: The Emergency Events Database.Available online: www.emdat.be (accessed on 20 August 2019).
52. Anshory Yusuf, A.; Francisco, H. Climate Change Vulnerability Mapping for Southeast Asia; EEPSEA:Singapore, 2009.
53. Chotamonsak, C.; Salathé, E.P.; Kreasuwan, J.; Chantara, S.; Siriwitayakorn, K. Projected climate changeover Southeast Asia simulated using a WRF regional climate model. Atmos. Sci. Lett. 2011, 12, 213–219.[CrossRef]
54. Hijioka, Y.; Lin, E.; Pereira, J.J.; Corlett, R.T.; Cui, X.; Insarov, G.E.; Lasco, R.D.; Lindgren, E.; Surjan, A. Asia;Cambridge University Press: Cambridge, UK, 2014.
55. Hirabayashi, Y.; Mahendran, R.; Koirala, S.; Konoshima, L.; Yamazaki, D.; Watanabe, S.; Kim, H.; Kanae, S.Global flood risk under climate change. Nat. Clim. Chang. 2013, 3, 816–821. [CrossRef]
56. Van Vliet, M.T.; Franssen, W.H.; Yearsley, J.R.; Ludwig, F.; Haddeland, I.; Lettenamier, D.P.; Kabat, P. Globalriver discharge and water temperature under climate change. Glob. Environ. Chang. 2013, 23, 450–464.[CrossRef]
57. Van Vliet, M.T.H.; Zwolsman, J.J.G. Impact of summer droughts on the water quality of the Meuse river.J. Hydrol. 2008, 353, 1–17. [CrossRef]
58. Hoque, M.A.; D Scheelbeek, P.F.; Vineis, P.; Khan, A.E.; Ahmed, K.M.; Butler, A.P.; Hoque mhoque, M.A.Drinking water vulnerability to climate change and alternatives for adaptation in coastal South and SouthEast Asia. Clim. Chang. 2016, 136, 247–263. [CrossRef] [PubMed]
59. Marcotullio, P.J. Urban water-related environmental transitions in Southeast Asia. Sustain. Sci. 2007, 2, 27–54.[CrossRef]
60. Freeman, P.; Warner, K. Vulnerability of Infrastructure to Climate Variability: How Does This Affect InfrastructureLending Policies? World Bank: Washington, DC, USA, 2001.
61. Gopalakrishnan, C. Water and disasters: A review and analysis of policy aspects. Int. J. Water Resour. Dev.2013, 29, 250–271. [CrossRef]
62. McCann, D.G.; Moore, A.; Walker, M.-E. The water/health nexus in Disaster Medicine. II: Water contaminationin disasters. Curr. Opin. Environ. Sustain. 2011, 3, 486–490. [CrossRef]
63. Few, R.; Ahern, M.; Matthies, F.; Kovats, S. Floods, Health and Climate Change: A Strategic Review; TyndallCentre: Norwich, UK, 2004.
64. Phanuwan, C.; Takizawa, S.; Oguma, K.; Katayama, H.; Yunika, A.; Ohgaki, S. Monitoring of human entericviruses and coliform bacteria in waters after urban flood in Jakarta, Indonesia. Water Sci. Technol. 2006, 54,203–210. [CrossRef]
65. Ramachandraiah, C. Coping with urban flooding: A study of the 2009 kurnool floods, India. Environ. Urban.2011, 23, 431–446. [CrossRef]
66. Lyubimova, T.; Lepikhin, A.; Parshakova, Y.; Tiunov, A. The risk of river pollution due to washout fromcontaminated floodplain water bodies during periods of high magnitude floods. J. Hydrol. 2016, 534, 579–589.[CrossRef]
67. Marcotullio, P.J. Asian urban sustainability in the era of globalization. Habitat Int. 2001, 25, 577–598.[CrossRef]
68. Agrawala, S.; Carraro, M.; Kingsmill, N.; Lanzi, E.; Prudent-richard, G. Private Sector Engagement in Adaptationto Climate Change; OECD Publishing: Paris, France, 2011.
69. Magtibay, B.; Anarna, M.; Fernando, A. Assessment of drinking water post-Haiyan. West. Pacific Surveill.Response J. 2015, 6, 48–52. [CrossRef]
70. Hossain, J.; Salehin, M.; Mourin, M.M. Impact of Storm Surge Flooding on Groundwater Salinity in thePolder Protected and Non-Polder Area of Coastal Aquifer in Bangladesh. In Proceedings of the InternationalConference on Disaster Risk Mitigation, At BUET, Dhaka, Bangladesh, 23–24 September 2017.
71. Xiao, H.; Wang, D.; Medeiros, S.; Bilskie, M.; Hagen, S.; Hall, C. Exploration of the effects of storm surgeon the extent of saltwater intrusion into the surficial aquifer in coastal east-central Florida (USA). Sci. TotalEnviron. 2019, 648, 1002–1017. [CrossRef] [PubMed]
Water 2020, 12, 116 19 of 21
72. David, C.C.; Inocencio, A.B.; Clemente, R.S.; Abracosa, R.P.; Tabios, G.Q. Metro Manila and Metro CebuGroundwater Assessment; National Center for Biotechnology Information: Makati City, Philippines, 2001.
73. Ngo, M.T.; Lee, J.M.; Lee, H.A.; Woo, N.C. The sustainability risk of Ho Chi Minh City, Vietnam, due tosaltwater intrusion. Geosci. J. 2015, 19, 547–560. [CrossRef]
74. Benner, S.; Polizzotto, M.; Kocar, B.; Ganguly, S.; Phan, K.; Ouch, K.; Sampson, M.; Fendor, S. Groundwaterflow in an arsenic-contaminated aquifer, Mekong Delta, Cambodia. Appl. Geochem. 2008, 23, 3072–3087.[CrossRef]
75. Alcamo, J.; Florke, M.; Marker, M. Future long-term changes in global water resources driven bysocio-economic and climatic changes. Hydrol. Sci. J. 2007, 52, 247–275. [CrossRef]
76. Alayu, E.; Yirgu, Z. Advanced technologies for the treatment of wastewaters from agro-processing industriesand cogeneration of by-products: A case of slaughterhouse, dairy and beverage industries. Int. J. Environ.Sci. Technol. 2018, 15, 1581–1596. [CrossRef]
77. Choudhary, M.P.; Gupta, D. Assessing Environmental Impacts of a Cement Industry during its OperationPhase. Int. J. Res. Sci. Innov. 2017, 4, 65–68.
78. Sharma, K.; Jain, U.; Singhal, A. Treatment of Waste Generated From Cement Industry and Their Treatment-AReview; BITS Pilani: Pilani, India, 2013.
79. Ellis, M.; Dillich, S.; Margolis, N. Industrial Water Use and Its Energy Implications; ACEEE: Tarrytown, NY,USA, 2001.
80. Bardhan, S. Assessment of water resource consumption in building construction in India. WIT Trans. Ecol.Environ. 2011, 144, 93–100.
81. Rahman, N.N.N.A.; Esa, N. Managing Construction Development Risks to the Environment. In SustainableLiving with Environmental Risks; Springer Japan: Tokyo, Japan, 2014; pp. 193–202.
82. McCormack, M.; Treloar, G.J.; Palmowski, L.; Crawford, R. Modelling direct and indirect water requirementsof construction. Build. Res. Inf. 2007, 35, 156–162. [CrossRef]
83. Ooshaksaraie, L.; Basri, N.E.A.B. An Expert System Applied in Construction Water Quality Monitoring.Am. J. Environ. Sci. 2011, 7, 75–81. [CrossRef]
84. Milman, O. Most US Coal Plants Are Contaminating Groundwater with Toxins, AnalysisFinds|Environment|The Guardian. Available online: https://www.theguardian.com/environment/2019/
mar/04/us-coal-plants-contaminating-groundwater-toxins-analysis (accessed on 25 August 2019).85. Renöfält, B.M.; Jansson, R.; Nilsson, C. Effects of hydropower generation and opportunities for environmental
flow management in Swedish riverine ecosystems. Freshw. Biol. 2010, 55, 49–67. [CrossRef]86. Associated Press U.S. Utilities Find Water Pollution at Coal-Burning Power Plants–CBS News. Available
online: https://www.cbsnews.com/news/u-s-utilities-find-water-pollution-at-coal-burning-power-plants/(accessed on 25 August 2019).
87. Schleifer, L.; Luo, T. Power Plants Use Water, But We Have No Idea How Much|World Resources Institute.Available online: https://www.wri.org/blog/2018/01/power-plants-use-water-we-have-no-idea-how-much(accessed on 25 August 2019).
88. Tu, W.; Lee, Y. Ineffective environmental laws in regulating electronic manufacturing pollution: Examiningwater pollution disputes in Taiwan. In Proceedings of the 2009 IEEE International Symposium on SustainableSystems and Technology, Phoenix, AZ, USA, 18–20 May 2009; pp. 1–6.
89. Abdel Wahaab, R.; Alseroury, F.A. Wastewater treatment: A case study of electronics manufacturing industry.Int. J. Environ. Sci. Technol. 2019, 16, 47–58. [CrossRef]
90. Chai, J.C.H. Trade and environment: Evidence from China’s manufacturing sector. Sustain. Dev. 2002, 10,25–35. [CrossRef]
91. Dong, H.; Geng, Y.; Sarkis, J.; Fujita, T.; Okadera, T.; Xue, B. Regional water footprint evaluation in China:A case of Liaoning. Sci. Total Environ. 2013, 442, 215–224. [CrossRef] [PubMed]
92. Rashmi, V.; Pratima, D. Heavy metal water pollution-A case study. Recent Res. Sci. Technol. 2013, 5, 98–99.93. Gilde, L.C. Measures taken against water pollution in the food processing industry. Pure Appl. Chem. 1972,
29, 143–162. [CrossRef] [PubMed]94. Herndon, L. Managing Water Impacts of NC Food Processing-Environmental Finance Blog. Available online:
http://efc.web.unc.edu/2016/02/23/food-processing/ (accessed on 25 August 2019).95. Valta, K.; Kosanovic, T.; Malamis, D.; Moustakas, K.; Loizidou, M. Overview of water usage and wastewater
management in the food and beverage industry. Desalin. Water Treat. 2015, 53, 3335–3347. [CrossRef]
Water 2020, 12, 116 20 of 21
96. EPA (Environmental Protection Agency Office of Water). Industrial Stormwater Fact Sheet Series Sector A:Timber Products; EPA: Washington, DC, USA, 2006.
97. Hedmark, Å.; Scholz, M. Review of environmental effects and treatment of runoff from storage and handlingof wood. Bioresour. Technol. 2008, 99, 5997–6009. [CrossRef]
98. National Institute of Water and Atmospheric Research Impacts of Wood Processing. Availableonline: https://niwa.co.nz/our-science/freshwater/tools/kaitiaki_tools/land-use/foresry-processing/impacts-of-forest-processing (accessed on 25 August 2019).
99. Statistics Canada Industrial Water Usage. Available online: https://www150.statcan.gc.ca/n1/pub/16-401-x/
2012001/part-partie1-eng.htm (accessed on 25 August 2019).100. Wu, P.; Jiang, L.Y.; He, Z.; Song, Y. Treatment of metallurgical industry wastewater for organic contaminant
removal in China: Status, challenges, and perspectives. Environ. Sci. Water Res. Technol. 2017, 3, 1015–1031.[CrossRef]
101. Koumany, S. Water Quality and Monitoring in Lao PDR: The Case Study of Nam Ngum River Basin. InProceedings of the 3rd WEPA Forum on Environmental Governance in Asia, Ministry of Environment Japan,Bangkok, Thailand, 14–15 March 2007; pp. 129–131.
102. Prosser, I.; Wolf, L.; Littleboy, A. Water in mining and industry. In Water: Science and Solutions for Australia;Commonwealth Scientific and Industrial Research Organisation: Canberra, Australia, 2011; pp. 135–146.
103. Ugya, A.Y.; Ajibade, F.O. Ajibade TF Water Pollution Resulting From Mining Activity: An Overview. InProceedings of the 2018 Annual Conference of the School of Engineering & Engineering Technology (SEET),The Federal University of Technology, Akure, Nigeria, 17–19 July 2018.
104. Gavrilescu, D.; Puitel, A.C.; Dutuc, G.; Craciun, G. Environmental impact of pulp and paper mills. Environ.Eng. Manag. J. 2012, 11, 81–85. [CrossRef]
105. Ince, B.K.; Cetecioglu, Z.; Ince, O. Pollution Prevention in the Pulp and Paper Industries. In EnvironmentalManagement in Practice; Broniewicz, E., Ed.; IntechOpen: Rijeka, Croatia, 2011; pp. 223–246.
106. Jung, H.; Kappen, J. Water in the paper industry: Current situation and future options. Prof. Papermak. 2014,11, 11–13.
107. Gadipelly, C.; Pérez-González, A.; Yadav, G.D.; Ortiz, I.; Ibáñez, R.; Rathod, V.K.; Marathe, K.V. PharmaceuticalIndustry Wastewater: Review of the Technologies for Water Treatment and Reuse. Ind. Eng. Chem. Res. 2014,53, 11571–11592. [CrossRef]
108. Jacobs Consultancy. Water Consumption in US Petroleum Refineries Final Report; Jacobs Consultancy: Chicago,IL, USA, 2016.
109. Girardi, A. Wastewater treatment and reuse in the oil & petrochem industry—A case study. In Proceedings ofthe Wastewater and Biosolids Treatment and Reuse: Bridging Modeling and Experimental Studies, Otranto, Italy, 8–14June 2014; Santoro, D., Ed.; ECI Symposium Series; Trojan Technologies and Western University: London,ON, Canada, 2014.
110. Hansen, É.; Rodrigues, M.A.S.; Aragão, M.E.; de Aquim, P.M. Water and wastewater minimization ina petrochemical industry through mathematical programming. J. Clean. Prod. 2018, 172, 1814–1822.[CrossRef]
111. Sivarajasekar, N.; Balasubramani, K. A short account on petrochemical industry effluent treatment. Int. J.Petrochemical Sci. Eng. 2018, 3. [CrossRef]
112. Mohammadi, M.; Man, H.; Hassan, M.; Yee, P. African Journal of Biotechnology. Acad. J. 2002, 9, 1–11.113. Tanikawa, D. Commentary on Appropriate Wastewater Treatment System for a Natural Rubber Processing
Factory. J. Microb. Biochem. Technol. 2017, 9, 159–161.114. Leong, S.T.; Muttamara, S.; Laortanakul, P. Reutilization of wastewater in a rubber-based processing factory:
A case study in Southern Thailand. Resour. Conserv. Recycl. 2003, 37, 159–172. [CrossRef]115. Musikavong, C.; Gheewala, S.H. Water scarcity footprint of products from cooperative and large rubber
sheet factories in southern Thailand. J. Clean. Prod. 2016, 134, 574–582. [CrossRef]116. Bashar, A.K. Textile Manufacturing Process, Pollution and Pollution Control; Jahangirnagar University: Dhaka,
Bangladesh, 2012.117. Sakamoto, M.; Ahmed, T.; Begum, S.; Huq, H. Water Pollution and the Textile Industry in Bangladesh:
Flawed Corporate Practices or Restrictive Opportunities? Sustainability 2019, 11, 1951. [CrossRef]118. Tüfekci, N.; Sivri, N.; Toroz, I. Pollutants of Textile Industry Wastewater and Assessment of its Discharge
Limits by Water Quality Standards. Turkish J. Fish. Aquat. Sci. 2007, 7, 97–103.
Water 2020, 12, 116 21 of 21
119. Das, P.; Mondal, G.C.; Singh, S.; Singh, A.K.; Prasad, B.; Singh, K.K. Effluent Treatment Technologies in theIron and Steel Industry—A State of the Art Review. Water Environ. Res. 2018, 90, 395–408. [CrossRef]
120. Gandhirajan, M.; Amarnath, G.; Kavitha, P.; Bhagavath, R. Characterisation and Treatment of AutomotiveIndustry Wastewater. J. Ind. Pollut. Control 2008, 24, 9–14.
121. Isaiah, D. Water, Water, Everywhere in Vehicle Manufacturing|Automotive World. Available online:https://www.automotiveworld.com/articles/water-water-everywhere-vehicle-manufacturing/ (accessed on15 November 2019).
122. Mirbagheri, S. Optimization of Motor Vehicle Industries Wastewater Treatment Methods with the Aim ofHeavy Metals Removal and Water Reuse in Pilot Scale. Iran. J. Environ. Health Sci. Eng. 2006, 3, 289–295.
123. Toyota Motor Corporation. Environmental Report 2018; Toyota Motor Corporation: Toyota, Japan, 2018.
© 2019 by the authors. Licensee MDPI, Basel, Switzerland. This article is an open accessarticle distributed under the terms and conditions of the Creative Commons Attribution(CC BY) license (http://creativecommons.org/licenses/by/4.0/).