Southeast Asia Energy Outlook 2022 - NET
144
Southeast Asia Energy Outlook 2022
-
Upload
khangminh22 -
Category
Documents
-
view
0 -
download
0
Transcript of Southeast Asia Energy Outlook 2022 - NET
Southeast Asia Energy Outlook 2022

The IEA examines the full spectrum of energy issues including oil, gas and coal supply and demand, renewable energy technologies, electricity markets, energy efficiency, access to energy, demand side management and much more. Through its work, the IEA advocates policies that will enhance the reliability, affordability and sustainability of energy in its 31 member countries, 10 association countries and beyond.
Please note that this publication is subject to specific restrictions that limit its use and distribution. The terms and conditions are available online at www.iea.org/t&c/
This publication and any map included herein are without prejudice to the status of or sovereignty over any territory, to the delimitation of international frontiers and boundaries and to the name of any territory, city or area.
Source: IEA. All rights reserved. International Energy Agency Website: www.iea.org
IEA member countries: Australia Austria Belgium Canada Czech Republic Denmark Estonia Finland France Germany Greece Hungary Ireland Italy Japan Korea LithuaniaLuxembourg Mexico Netherlands New Zealand Norway Poland Portugal Slovak Republic
Spain Sweden Switzerland Turkey United Kingdom United States
IEA association countries:
INTERNATIONAL ENERGY AGENCY
ArgentinaBrazilChinaEgyptIndiaIndonesiaMoroccoSingaporeSouth AfricaThailand

Southeast Asia Energy Outlook 2022
PAGE | 1
Foreword
Foreword
This fifth edition of the Southeast Asia Energy Outlook underscores the close relationship that the International Energy Agency (IEA) enjoys with the countries of the Association of Southeast Asian Nations (ASEAN).
This work is the first region-focused energy outlook to be published by the IEA since the onset of the Covid-19 pandemic and the 26th Conference of the Parties in Glasgow, where participants reaffirmed their commitments to tackle climate change. The challenges facing energy policy makers – to provide clean, secure and affordable energy to all – have been made even more urgent by Russia’s invasion of Ukraine. This report highlights how countries in Southeast Asia can respond to the current energy crisis in ways that improve their energy security and also advance worldwide efforts to mitigate climate change.
The IEA and ASEAN began formal cooperation in energy-related activities in 2011. In 2019, the IEA was named a “key strategic partner” to ASEAN in recognition of its extensive support in all aspects of Southeast Asia’s energy priorities under the ASEAN Plan of Action on Energy Cooperation. At last year’s ASEAN Energy
Ministers Meeting, we commemorated ten years of excellent IEA-ASEAN collaboration. As I have long said, Southeast Asia is an emerging heavyweight in global energy. As such, supporting the region in tackling key energy challenges will continue to be a central part of the IEA’s mission, both by working with individual countries and at the ASEAN level. Indeed, the findings and insights contained in this report have been underpinned by and are a reflection of the strength of our partnerships with all of the countries in Southeast Asia.
This report was a collaborative effort across the IEA under the outstanding direction of Tim Gould and the World Energy Outlook team. I take this opportunity to thank everyone, inside and outside of the IEA, whose support and expertise helped make it possible.
Dr. Fatih Birol
Executive Director
International Energy Agency
.

Southeast Asia Energy Outlook 2022
PAGE | 2
Table of contents
Table of Contents
Key findings ..................................................................................................... 4 Energy in Southeast Asia ............................................................................. 20
Today’s energy trends.................................................................................. 21 Factors shaping the energy outlook ............................................................. 34
Southeast Asia’s Energy Prospects ............................................................ 47 Scenarios to 2050 ........................................................................................ 48 Implications .................................................................................................. 84
Southeast Asia’s Energy Perspectives ....................................................... 91 Investment for clean energy transitions ....................................................... 92 Low emissions fuels in Southeast Asia’s transition ................................... 103 The role of flexibility in boosting power sector decarbonisation ................ 114 Critical minerals in Southeast Asia ............................................................ 125
Annex ............................................................................................................ 137

Southeast Asia Energy Outlook 2022
PAGE | 3
Introduction
Introduction
The Southeast Asia Energy Outlook 2022 is the fifth edition of this World Energy Outlook Special Report. Building on its important partnership with Southeast Asia, the International Energy Agency (IEA) has published these studies on a regular basis since 2013. The studies offer insightful prospects for the ten member countries of the Association of Southeast Asian Nations (ASEAN) – Brunei Darussalam, Cambodia, Indonesia, Lao People’s Democratic Republic (Lao PDR), Malaysia, Myanmar, the Philippines, Singapore, Thailand and Viet Nam.
Since the last edition of this report, the energy prospects for Southeast Asia have been affected by the Covid-19 pandemic, new energy and climate policy commitments and, most recently, high and volatile prices exacerbated by the Russian Federation’s (hereafter, “Russia”) invasion of Ukraine. Covid-19 led to a major economic shock for countries in Southeast Asia and the economic recovery now risks being slowed by higher energy prices. In the run up to the UN Climate Change Conference (COP26) in November 2021, several governments in Southeast Asia announced ambitious targets for reaching neutrality and curbing reliance on coal-fired power.
Against this backdrop of new uncertainties and ambitions, this IEA report explores possible trajectories for Southeast Asia’s energy sector, differentiated primarily by the policies pursued by governments across the region. It relies on the scenarios included in the latest edition of World Energy Outlook, namely:
The Stated Policies Scenario (STEPS), which reflects the countries’ current policy settings based on a sector-by-sector assessment of the specific policies that are in place or have been announced.
The Sustainable Development Scenario (SDS), which delivers on the Paris Agreement goal to limit the temperature to “well below 2°C”, alongside the goals on energy access and air pollution. This scenario is consistent with Southeast Asia’s current announced climate aspirations.
The Net Zero Emissions by 2050 Scenario (NZE Scenario), which sets out a pathway for the energy sector to achieve net zero CO2 emissions in 2050. It also achieves universal access to modern energy by 2030 and reduces energy-related air pollution significantly. The NZE Scenario provides a global benchmark against which changes at the regional level can be assessed. The NZE Scenario would limit the rise in global average temperatures to 1.5°C (with a 50% probability).
After a scene-setting discussion in the first chapter, the second chapter describes scenario projections across all fuels and technologies. The third chapter analyses four key areas in depth: investment for the clean energy transition, power sector decarbonisation focusing on system flexibility, low-carbon fuels, and the supply and demand of critical minerals.

Southeast Asia Energy Outlook 2022
PAGE | 4
Key findings
Key findings

Southeast Asia Energy Outlook 2022
PAGE | 5
Key findings
Southeast Asia has developed rapidly over the past two decades and the region is a major engine of global economic growth, but there are strong country-by-country variations
Total primary energy supply by country, by fuel, in Southeast Asia, 2000-2020
IEA. All rights reserved.
Note: EJ = exajoule; 2020e = estimated values for 2020.
5
10
15
20
25
30
2000 2005 2010 2015 2020
EJ
Total primary energy supply by fuel
Renewables Traditional use of biomassNatural gas OilCoal
2000 2005 2010 2015 2020
Total primary energy supply by country
Lao PDR Brunei Cambodia MyanmarSingapore Philippines Malaysia Viet NamThailand Indonesia
e

Southeast Asia Energy Outlook 2022
PAGE | 6
Key findings
Southeast Asia’s policy choices will have huge implications for its future energy mix
Energy demand trends in Southeast Asia by scenario, 2020-2050
IEA. All rights reserved.
0
2.5
5
7.5
10
2020 2030 2040 2050
mb/
d
STEPS SDS
Oil demand
100
200
300
400
2020 2030 2040 2050
bcm
Natural gas demand
150
300
450
600
2020 2030 2040 2050m
tce
Coal demand
700
1 400
2 100
2 800
2020 2030 2040 2050
TWh
Renewables in power

Southeast Asia Energy Outlook 2022
PAGE | 7
Key findings
With today’s policies, energy demand, fossil fuel imports and emissions are set to increase; the region would also fall short on its target to provide access to clean cooking for all by 2030
Key energy indicators in Southeast Asia in the Stated Policies and Sustainable Development scenarios, 2020-2050
IEA. All rights reserved.
Note: Fossil fuel imports are net imports of coal, oil and natural gas.
0.0
1.5
3.0
2020 2030 2050
STEPS SDS
CO2 emissions
Gt C
O2
0
15
30
2020 2030 2050
EJ
Fossil fuel net imports
0%
50%
100%
2020 2030 2050
Share of population with access to clean cooking
30
60
2020 2030 2050
EJ
Primary energy demand

Southeast Asia Energy Outlook 2022
PAGE | 8
Key findings
Governments can introduce policies and measures to boost energy security and affordability, reduce emissions and ensure energy access for all
Energy demand in Southeast Asia has increased on average by around 3% a year over the past two decades, and this trend continues to 2030 under today’s policy settings in the STEPS. Southeast Asian countries are in different stages of their development, but almost all of their economies have more than doubled in size since 2000. The Covid-19 pandemic disrupted these trends but economic growth is set to return: the region’s economy expands in all our scenarios by 5% a year on average until 2030 before slowing to an average of 3% between 2030 and 2050.
Three-quarters of the increase in energy demand to 2030 in the STEPS is met by fossil fuels, leading to a near 35% increase in CO2 emissions. Energy access has been improving in Southeast Asia in recent years: around 95% of households today have electricity and 70% have clean cooking solutions such as liquefied petroleum gas and improved cook stoves. However, these shares remain very low in Cambodia and Myanmar, and the recent surge in commodity prices threatens to set back progress. In the STEPS, universal access to electricity is achieved around 2030, but even by 2050, more than 100 million people in the region do not have access to clean cooking. The region also sees a steady worsening in its energy trade balance as fossil fuel demand outpaces local production.
Governments across Southeast Asia have set out long-term plans for a more secure and sustainable future. For example, six Southeast Asian countries have already announced net zero emissions and carbon neutrality targets. The SDS maps out a way to achieve these goals in full, and also sees enhanced efforts to achieve universal access to energy in 2030. Fossil fuel subsidies are phased out, efficiency improvements temper the growth in overall demand, and there are concerted efforts to boost clean energy technology deployment in power generation and end-use sectors. For example, in the SDS, 21 GW of renewable capacity are added on average each year to 2030 (triple the level of recent years) and nearly 25% of the cars sold in the region by 2030 are electric. These efforts also help reduce the region’s fossil fuel import bill. Delivering electricity and clean cooking access to all by 2030 is achieved with an investment of USD 2.8 billion a year (about 2% of average annual energy sector investment in the region to 2030).
Each country has its own pathway, and the range and diversity of countries and situations in Southeast Asia mean that delivering on these interrelated goals will be a challenge. Intraregional co-operation and international support will be critical, especially to boost innovation and support the development of related infrastructure.

Southeast Asia Energy Outlook 2022
PAGE | 9
Key findings
The region’s fuel import needs and energy security vulnerabilities will rise sharply in the decades to come without a strong effort to accelerate transitions
Crude oil and natural gas trade to Southeast Asia by scenario and origin (for STEPS), 2020-2050
IEA. All rights reserved.
2
4
6
8
2020 2030 2050
milli
on b
arre
ls p
er d
ay
Crude oil
40
80
120
160
2020 2030 2050bi
llion
cubi
c m
etre
s
Natural gas
Total SDS Middle East Africa North America Central and South AmericaRussia Australia Other
STEPS (by origin)

Southeast Asia Energy Outlook 2022
PAGE | 10
Key findings
Russia’s invasion of Ukraine highlights the importance of mechanisms to safeguard the region’s security of supply, alongside policies to reduce energy security risks over time
Seaborne crude oil trade to Southeast Asia Oil stockpiles required by companies and refineries from around the world, 2020 operating in Southeast Asia
IEA. All rights reserved.
Note: “Mandatory operational oil stockpiles” in the table are as of March 2019 and exclude LPG. Source: IEA analysis; IEEJ (2020).
OtherTotal 2.6 mb/d
Country Mandatory operational oil stockpiles
Brunei 31 days for refineries
Cambodia 30 days for companies importing oil
Indonesia 14 days (crude oil) and 23 days (oil products) by the national oil company
Lao PDR 21 days for companies importing oil and 10 days for distributers
Malaysia 30 days by the national oil company
Myanmar 6 days for oil companies
Philippines 30 days for refineries (crude) and 15 days (oil products) for companies importing oil
Singapore 90 days (oil products) for power companies
Thailand 21.5 days (oil crude) and 3.5 days (oil products) for refineries and traders
Viet Nam 10 days (oil crude) and 40 days (oil products) for oil companies

Southeast Asia Energy Outlook 2022
PAGE | 11
Key findings
Well-managed energy transitions will shield Southeast Asia from the impacts of volatile international markets, but energy security during transitions does not come for free
Russia’s invasion of Ukraine has had profound consequences for energy markets, leading to high and volatile prices for fossil fuels and greater near-term competition for non-Russian supplies. The market turbulence has shone a spotlight on the energy security vulnerabilities of Southeast Asian countries and their mechanisms in place to weather supply disruptions.
The region has been an aggregate oil importer since the mid-1990s and high oil prices put significant strains on consumers and the broader economy. In 2020, the region imported around 2.6 mb/d of oil (Thailand and the Philippines accounted for 40% of total oil imports to the region), mainly from the Middle East and Africa. In the STEPS, oil imports continue to rise to 4.6 mb/d in 2030 and 6.2 mb/d in 2050. Based on today’s policies, the region becomes a net natural gas importer by 2025, importing more than 130 bcm per year by 2050. However, the 2021 price increases – further accentuated by the invasion of Ukraine – may have long-term repercussions for the role of natural gas in the region, by changing perceptions on affordability and policy attitudes towards investments in gas import infrastructure.
Accelerating clean energy transitions is the key way to reduce today’s energy security vulnerabilities. In the SDS, for example, both oil and
gas imports in 2050 are 50% lower than in the STEPS. This occurs because of the enhanced efficiency measures that are deployed in the SDS.
Targeted investments in energy security remain critical throughout energy transitions. Electricity demand rises rapidly in all our scenarios, as does output from variable renewables (wind and solar PV). Ensuring electricity security under these circumstances requires large-scale investments in networks, demand side management, digitalisation, enhanced cyber resilience as well as inter-regional planning. Even as the region takes policy steps to move away from oil, oil stockpiles remain an important mechanism to protect against supply disruptions. There are a number of mandatory operational oil stockpile regimes for companies operating in Southeast Asia. These are generally equivalent to fewer than 40 days of oil use (and in some cases as few as 6 days). Many countries in Southeast Asia have studied or discussed establishing strategic reserves, and a reserve in Viet Nam has already started operation. International cooperation can also play a role by helping to build oil-sharing arrangements with neighbouring countries.

Southeast Asia Energy Outlook 2022
PAGE | 12
Key findings
Southeast Asia must attract much higher levels of energy sector investment to accelerate its clean energy transition and meet the rising demand for energy services
Average annual energy investment in Southeast Asia, 2016-2030 Share of Southeast Asia in the global market, 2016-2030
IEA. All rights reserved.
Note: Fossil fuels w/o CCUS = power generation from fossil fuels without carbon capture, utilisation and storage.
0%
2%
4%
6%
8%
10%
2016-20 2026-30
Power investment
2016-20 2026-30
End-use
EV sales
Grids
Batteries
Solar & wind
Renewables
AC stock
25%
50%
75%
200 100%
50
100
150
STEPS SDS
2016-20 2026-30
Billi
on U
SD
Renewables for end-use
EVs
Efficiency
PoSewrieers10
Networks
Fossil fuels w/o CCUS
Other low-carbon
Solar and wind
uSeelsries11
Low emissions fuels
Fossil fuels
Share of clean energy
F
End-use

Southeast Asia Energy Outlook 2022
PAGE | 13
Key findings
Energy investment: attracting finance requires upgrading clean energy policy and regulatory frameworks and addressing a wide range of financial hurdles across the sectors
Southeast Asia faces the twin challenges of increasing total investment in the energy sector while increasing the share of this investment going to clean energy technologies. Between 2016 and 2020, annual average energy investment in Southeast Asia was around USD 70 billion, of which around 40% went to clean energy technologies – mostly solar PV, wind and grids. Energy investment in the STEPS reaches an annual average of USD 130 billion by 2030 and in the SDS it reaches USD 190 billion.
Improving regulatory and financing frameworks would help Southeast Asia reduce the costs of clean energy projects. For example, the levelised cost of energy (LCOE) of solar PV in Indonesia could be around 40% lower if its investment and financing risks were comparable to advanced economies. Boosting investment in clean energy technologies requires strengthening clean energy policy and regulatory frameworks and addressing a wide range of financial hurdles.
Well-designed frameworks – including clear policy targets, independent regulation, least-cost system planning and cost recovery tariffs – are crucial to attract investors. There has been progress on policy and regulation in many parts of Southeast Asia, including more ambitious climate targets announced by Indonesia, Malaysia, Thailand and Viet Nam, updated expansion plans for renewables, and changes in power purchasing agreements (PPAs). However, uncertainties remain in many countries over remuneration
mechanisms and tariff levels for renewable output, which affect risk perceptions and the cost of capital for clean energy projects. Commitments and policies to phase out unabated coal plants and deploy low-carbon fuels would send important long-term signals to investors.
Cross-cutting issues such as unpredictable regulatory frameworks, restrictions on foreign direct investment and currency risks all hamper investment flows. Many countries have shallow financial and capital markets, and domestic banks have limited experience in financing clean energy assets. Long-term, low-cost debt is often not available and access to international private capital can be a challenge. Sustainable debt issuance by countries in Southeast Asia comprises around 3% of the global total, less than half the region’s share of global GDP (more than 80% of sustainable debt is issued in advanced economies).
International development finance has a key role to play in catalysing private funds, especially for projects at early stages of development, new technologies (e.g. CCUS, or carbon capture, utilisation and storage), and technologies with specific risks (e.g. exploration risk in geothermal). Improving access to finance would enhance investment by households and small-and-medium enterprises (e.g. establishing credit ratings for end-users and bundling small transactions).

Southeast Asia Energy Outlook 2022
PAGE | 14
Key findings
Low emissions fuels: a key part of transitions in Southeast Asia…
Total demand for unabated fossil fuels, and low-emission and abated fossil fuels in Southeast Asia in the SDS, 2000-2050
IEA. All rights reserved.
Note: Low emissions fuels include modern solid, liquid and gaseous bioenergy, low-carbon hydrogen and hydrogen-based fuels such as ammonia or synthetic hydrocarbons. Abated fossil fuels include inputs to industry or power generation where the resulting CO2 emissions from fuel combustion are captured, utilised and/or stored. Hydrogen production involving the use of CCUS is included in the hydrogen category. PJ = petajoule.
2 000
4 000
6 000
8 000
10 000
12 000
2000 2010 2020 2030 2040 2050
PJ
Low-carbon and abated fuels Low-carbon and abated fuelsUnabated fossil fuels Unabated fossil fuels
Fuels demand for end-use and power generation
End-use Power generation
2000 2020 Buildings Transport Industry Power 2050
Modern bioenergy Hydrogen and hydrogen-based CCUS
Changes of low-carbon and abated fuels
Southeast Asia Energy Outlook 2022
PAGE | 15
Key findings
…as the region is well-placed to tap into significant resources of bioenergy and hydrogen as well as CO2 storage potential
Southeast Asia’s energy transition depends primarily on the rollout of renewables, improvements in efficiency and the electrification of end uses; together, these close well over 50% of the emissions gap between the STEPS and SDS in 2050. There is also a significant role for low emissions fuels, such as modern bioenergy, hydrogen, hydrogen-based fuels, and CCUS. Including natural gas – when it replaces coal and oil – low emissions fuels close 30% of the emissions gap between the STEPS and SDS in 2050.
Modern forms of bioenergy can displace fossil fuels in transport, industry, clean cooking and power generation. Several countries in Southeast Asia have robust mandates to blend transport biofuels and policies to support co-firing, biogas and biomethane, as well as modern cookstoves. To ensure the environmental benefits of bioenergy, feedstocks need to be sustainable, and avoid competition with food production and negative impacts on biodiversity.
Low-carbon hydrogen and hydrogen-based fuels such as ammonia and synthetic hydrocarbons can help reduce emissions from long-distance transport and heavy industry. Co-firing ammonia in thermal power generation can also help provide a dispatchable low-carbon generation fuel. Brunei Darussalam has started exporting small quantities of hydrogen to Japan, while Indonesia, Malaysia, the Philippines and Thailand are piloting green hydrogen and fuel cell systems for power provision. Malaysia and Indonesia are conducting
feasibility studies to co-fire ammonia in coal power plants, and there are plans to do so in Singapore, Thailand and Viet Nam.
CCUS can reduce CO2 emissions from the production of low-carbon hydrogen from natural gas and during fuel production or combustion. At least seven large-scale CCUS projects are in planning in Southeast Asia, including several linked to enhanced oil recovery and natural gas processing with offshore storage.
In the SDS, the share of low emissions and abated fuels reaches 50% of total liquid, solid and gaseous fuel demand by 2050. Investment in these fuels averages around USD 10 billion per year to 2050, around half of the level of today’s investments in fossil fuels.
Several regulatory hurdles and market risks must be addressed in order to scale up the deployment of low-carbon fuels in Southeast Asia. Even with higher fossil fuel prices, affordability remains a concern and several low emissions technologies and fuels are not yet mature or cost competitive. International collaboration and support are crucial to encourage investment and mitigate financial risks. Indonesia and Malaysia are cooperating with Japan to develop hydrogen, ammonia and CCUS supply chains. Similar initiatives are underway in Thailand and Singapore. Some major oil and gas players, such as Petronas, Pertamina and PTT have formulated plans to invest in hydrogen supply chains and carbon capture projects, often in partnership with international oil companies.

Southeast Asia Energy Outlook 2022
PAGE | 16
Key findings
Power flexibility: growing deployment of wind and solar will require a more flexible power system – this must be a higher priority for governments and regulators
Power generation and shares of variable renewables in Southeast Asia, SDS, 2020-2050
IEA. All rights reserved.
Note: Other includes coal with CCUS, nuclear and marine energy.
0%
15%
30%
45%
60%
800
1 600
2 400
3 200
2020 2030 2040 2050
TWh
Wind
Solar PV
Geothermal
Bioenergy
Hydro
Ammonia
Oil
Unabated natural gas
Unabated coal
blank
SDS
STEPS
Variable renewables share(right axis)
Power generation, SDSOther

Southeast Asia Energy Outlook 2022
PAGE | 17
Key findings
Power flexibility: less rigid contracts for power generation and fuel supply can play a vital role, alongside strengthened and more integrated regional grids
Electricity demand is set to grow rapidly in the coming decades in Southeast Asia and an increasing share will be met by variable renewable sources. In the SDS, for example, the generation share of variable renewables increases from 2% in 2020 to 18% in 2030. The need for flexibility outpaces electricity demand growth.
Coal and gas-fired power plants are the region’s main sources of electricity today but they can also play key roles in providing flexibility. Achieving this role change requires changing existing contracts. There is a heavy reliance on physical PPAs in Southeast Asia, especially in vertically integrated power systems such as Indonesia and Thailand, where many plants were financed with physical PPAs with large capacity payments and/or take-or-pay obligations. If assets or entities have a contract that ensures operators a minimum daily load, the assets have no incentives to act flexibly.
Most of these PPA contracts extend beyond 2030. In Thailand, for example, minimum-take capacity in all contracts decreases by only 10% to 2030. Without any changes, it will not be easy to repurpose existing assets to offer flexibility, even as the share of variable
renewable capacity increases. Further policy efforts to increase the flexibility of PPAs and fuel contracts are needed, for example through voluntary auctions.
The IEA analysed contractual flexibility issues in Thailand and found that cost savings from shifting towards more flexible PPAs and fuel contracts could be significantly greater than the savings from investing in technical flexibility resources. Designing contracts with sufficient flexibility leaves headroom for lower operational-cost variable renewables, and technical assets that provide critical system services to participate in the market, resulting in overall cost savings.
Regional integration and multilateral power trading can also help increase power system flexibility in Southeast Asia. This would expand balancing areas, allowing for efficient resource sharing, particularly for renewable resources. ASEAN has a major programme devoted to developing multilateral power trade – the ASEAN Power Grid (APG) – encompassing both building physical infrastructure and creating markets for multilateral power trade.

Southeast Asia Energy Outlook 2022
PAGE | 18
Key findings
Global demand for critical minerals in clean energy technologies is set to grow rapidly, providing a big opportunity for Southeast Asia to make the most of its large mineral resources
Potential revenue from selected minerals in Southeast Asia, SDS, 2020-2050
IEA. All rights reserved.
Note: Revenue is potential value of metal products made from mined output in Southeast Asia. We used 2021 average prices for prices in 2030 and 2050.
20
40
60
80
100
2020 2030 2050 2050With current market share
(15%)Higher market share
(25%)
Billio
n U
SD (2
020)
Total
Rare earth elements
Tin
Copper
Nickel

Southeast Asia Energy Outlook 2022
PAGE | 19
Key findings
Critical mineral resources can be successfully and sustainably exploited by enhancing capacity building across the region and attracting investment in a wide range of projects
Southeast Asia is set to play a major role in clean energy supply chains, both as a consumer of low-carbon technologies and as a key supplier of critical minerals. Today, Indonesia and the Philippines are the two largest nickel producers in the world; Indonesia and Myanmar are the second and third largest tin producers; Myanmar accounts for 13% of global rare earth elements production; and Southeast Asia provides 6% of global bauxite production.
The mining sector has historically been an important contributor to government revenues, GDP and employment in Southeast Asia. Yet investment in mineral exploration has declined in recent years: the region’s share of the global mineral exploration budget has halved since 2012. This trend will need to be reversed if Southeast Asia is to realise its potential in the critical minerals sector, and offset likely future declines in coal mining jobs.
Investment in processing and manufacturing to develop critical-mineral based industries can help extract additional value from Southeast Asia’s natural resources. Malaysia and Viet Nam are the world’s second and third largest manufacturers of solar PV modules. Thailand is the 11th largest vehicle manufacturer in the world and could also become a key hub for the manufacturing of EVs. Indonesia is implementing policies to attract mid to downstream battery
industries. If the region can develop domestic value chains for multiple industries, the revenue from the production of nickel, tin, copper and rare earth elements in Southeast Asia could grow by almost 2.5-times to nearly USD 60 billion by 2050 in the SDS.
Ensuring high environmental, social and governance (ESG) standards is crucial for the region as consumers and investors increasingly demand that manufacturers use minerals that are sustainably and responsibly produced. For example, high-pressure acid leaching (HPAL) projects are expected to supply battery-grade nickel products in this region, but these projects need to resolve concerns over their high levels of emissions and water consumption. In the downstream sector, encouraging recycling is key: secondary production of aluminium accounts for just 2.5% of total refined consumption in the region, compared with 25% globally.
Enhancing capacity building efforts across the region is central to ensure the sustainable development of mining industries and to attract investment in a wide range of projects. This includes technical capacity building (e.g. geological surveys, reserve estimation, sustainable mining practices) and institutional capacity building (e.g. regular ESG assessments) for sound governance and transparent regulations.

Southeast Asia Energy Outlook 2022
PAGE | 20
Energy in Southeast Asia
Energy in Southeast Asia

Southeast Asia Energy Outlook 2022
PAGE | 21
Energy in Southeast Asia
Today’s energy trends

Southeast Asia Energy Outlook 2022
PAGE | 22
Energy in Southeast Asia
Countries in Southeast Asia have developed their economies and expanded energy use rapidly over the past two decades, but there are strong country-by-country variations
GDP and energy demand per capita in Southeast Asia in 2000 and 2019
IEA. All rights reserved.
Note: OECD = Organisation for Economic Co-operation and Development, PPP = purchasing power parity.
100 200 300 400 500
WorldOECD
Southeast AsiaMyanmarCambodia
PhilippinesLao PDR
IndonesiaViet NamThailandMalaysia
SingaporeBrunei Darussalam
PJ
Energy demand per capita
20 40 60 80 100
WorldOECD
Southeast AsiaCambodiaMyanmar
Lao PDRPhilippines
Viet NamIndonesia
ThailandMalaysia
Brunei DarussalamSingapore
Thousand USD (2019, PPP)
2000
2019
GDP per capita

Southeast Asia Energy Outlook 2022
PAGE | 23
Energy in Southeast Asia
Southeast Asia is a major engine of global economic growth and energy demand
Southeast Asia’s growing population and economy put its energy sector outlook firmly in the global spotlight. Its population has expanded by around 10% over the past 10 years and today there are around 660 million people across the region. Southeast Asia’s economy grew by around 4.2% on average each year between 2010 and 2019.
Each of the 10 countries in ASEAN is distinctive in terms of its stage of development, industrial output, politics, history and geography. For example, energy demand per capita in Myanmar or Cambodia is about one quarter of the world average, while in Singapore it is about three times larger than the world average. Increases in manufacturing have been the driving force behind the economic development in Thailand and Malaysia, while the Philippines has seen much more growth in its service industry. Energy policy priorities also differ from country to country, with different approaches to securing new energy supplies to meet expanding energy demand, achieving climate goals and ensuring access to affordable, reliable and modern energy for all. Nonetheless, a common denominator is a commitment to regional cooperation as a way to secure future prosperity and security.
Much has changed since our last regional energy outlook was published in 2019. In many countries, the level of policy ambition for energy has stepped up considerably. Southeast Asia has been hit
hard by the pandemic, resulting in a 4% fall in GDP and a 3% drop in energy demand in 2020 (followed by a smaller rebound in 2021). The major rise in oil and gas prices in the second half of 2021, intensified by Russia’s invasion of Ukraine in early 2022, has underscored risks to energy security and affordability and the region’s rising reliance on imported oil.
Increased vulnerability to climate change is also a serious threat to countries in Southeast Asia. Typhoons and floods are predicted to become increasingly violent and frequent. The Intergovernmental Panel on Climate Change (IPCC) highlights that Southeast Asia is one of the planet’s most vulnerable regions to climate change.
This chapter explores the current energy landscape in Southeast Asia. Total primary energy demand in the region has increased rapidly over the past two decades, with large increases in coal, oil and natural gas use, as well as in renewable energy use. Industry has seen the largest level of growth of any sector, fuelled mainly by the cement and iron and steel sectors; power generation has almost tripled since 2000, with the largest increase coming from coal-fired power plants. In buildings, the traditional use of biomass has been displaced, mainly by electricity, as a result of economic development and urbanisation.

Southeast Asia Energy Outlook 2022
PAGE | 24
Energy in Southeast Asia
Coal has accounted for the largest share of the growth in total energy supply since 2000
Total energy supply by fuel in Southeast Asia, 2000-2020
IEA. All rights reserved.
0
5
10
15
20
25
30
35
2000 2010 2019 2020
EJ
Modern renewables
Traditional use of biomass
Natural gas
Oil
Coal

Southeast Asia Energy Outlook 2022
PAGE | 25
Energy in Southeast Asia
The energy story in Southeast Asia varies widely by country, depending on resource endowments, the structure of the economy and policies
Total energy supply by fuel, by country in Southeast Asia, 2019
IEA. All rights reserved.
Notes: Shares of total energy supply includes power generation for electricity trading across borders. Renewables include traditional use of biomass.
25% 50% 75% 100%
3 6 9 12EJ
Coal
Oil
Natural gas
Renewables
Total energy supply(top axis)
Indonesia
Thailand
Malaysia
Viet Nam
Philippines
Singapore
Myanmar
Cambodia
Lao People'sDemocratic Republic
Brunei Darussalam

Southeast Asia Energy Outlook 2022
PAGE | 26
Energy in Southeast Asia
Since 2000, fossil fuel use has grown rapidly, modern renewables have more than doubled, and the traditional use of biomass for cooking and heating has dropped by more than 50%
As the economy and population of Southeast Asia have grown, total energy supply expanded by around 80% between 2000 and 2020, even though demand fell temporarily in 2020 due to the Covid-19 pandemic.
Fossil fuels made up more than 90% of the growth in energy demand. Coal demand alone expanded by a factor of six, and its share of total energy supply increased from 8% to 26% between 2000 and 2020.
Oil demand has increased by more than 40% since 2000, though its share of total energy supply dropped from 40% to 32%. Most of the increase in oil use stemmed from an increase in passenger car ownership (which went from 27 vehicles per 1 000 inhabitants in 2000 to 59 per 1 000 in 2020) and truck freight activity, offset slightly by a fall in oil-fired power generation. Power generation comprised 12% of oil demand in 2000, but fell to less than 3% in 2020 (oil provides less than 2% of total power generation in Southeast Asia today, down from nearly 20% in 2000).
Natural gas consumption rose by more than 80% between 2000 and 2020, and has maintained around a 20% share of the total energy mix. The electricity and industry sectors collectively account for 70% of natural gas use today.
The energy supplied by modern renewable forms of energy more than doubled between 2000 and 2020. Solar PV and wind have increased rapidly in recent years, but modern bioenergy, geothermal energy and hydropower still comprise more than 98% of total modern renewable energy in Southeast Asia today. Geothermal resources are mainly located in Indonesia and the Philippines; Cambodia, Lao PDR and Myanmar have continued to develop domestic resources of hydropower, taking advantage of their hilly terrains and high precipitation.
The traditional use of biomass as a cooking fuel has decreased continuously over the past 20 years and total use halved over this period. This resulted from firm policy action to boost access to electricity and to shift to alternative, clean cooking fuels: the share of people with access to electricity increased by more than 35 percentage points in the last two decades, to reach 95% in 2020.
Overall regional trends mask some very different situations at the national level in individual countries. The share of fossil fuels, and reliance on coal, ranges widely across the region; in manufacturing economies such as Thailand and Malaysia the share of fossil fuels tends to be higher, while it is lower in economies that remain more reliant on agriculture such as Myanmar and Lao PDR.

Southeast Asia Energy Outlook 2022
PAGE | 27
Energy in Southeast Asia
The industry and transport sectors have led the growth in final energy consumption
Change in final energy consumption by fuel in selected end-use sectors in Southeast Asia between 2000 and 2020
IEA. All rights reserved.
- 2
- 1
0
1
2
3
4
5
Industry Transport Buildings Agriculture
EJ Natural gas
Oil
Coal
Electricity
Liquid biofuels
Traditional use ofbiomass
Other

Southeast Asia Energy Outlook 2022
PAGE | 28
Energy in Southeast Asia
Power generation has almost tripled over the past two decades, driven by a sixfold increase in coal-fired generation, which accounted for more than 40% of total generation in 2020
Power generation mix and shares by fuel in Southeast Asia, 2000-2020
IEA. All rights reserved.
250
500
750
1 000
1 250
2000 2010 2020
TWh Other
renewablesHydropower
Gas
Oil
Coal
Power generation mix
20%
40%
60%
80%
100%
2000 2020
Share

Southeast Asia Energy Outlook 2022
PAGE | 29
Energy in Southeast Asia
Industrialisation, motorisation and urbanisation have been the key drivers of increased fossil fuel use and electricity consumption
Final energy consumption has increased by around 70% over the past two decades, with the industry and transport sectors accounting for the vast majority of this growth. In buildings, increased use of electricity has accompanied a decline in the traditional use of biomass.
The industry sector saw the largest increase in energy use of any sector, with rapid expansion in many of the energy intensive industries over the past 20 years. This includes a near-quadrupling of steel production, including large increases in stainless steel production, given the large quantities of domestic nickel resources in the region (see chapter on energy perspectives). Coal use across the industry sector expanded more than fourfold between 2000 and 2020. Expansions in lighter industries, such as car assembly plants and garment factories, contributed to the 75% overall increase in electricity demand in the industry sector.
In transport, oil demand increased 80% between 2000 and 2020, due to a rapid increase in the stock of passenger cars and trucks, which quadrupled over this period, as well as two/three-wheelers. There has been some increase in locally-produced biofuels – Indonesia and Malaysia are the largest palm oil producing countries in the world –
but oil products still account for more than 90% of total fuel use in transport (see chapter on energy perspectives).
The buildings sector has seen the largest increase in electricity consumption of any sector. Southeast Asia’s population has become increasingly urbanised (the number of people living in cities has grown by around 70% since 2000), and there has been a large increase in air conditioner and appliance use. For example, the ownership of refrigerators has more than doubled in the last two decades (see next pages).
Total power generation has almost tripled over the past two decades. Coal-fired power generation expanded by a factor of six, and it made up more than 40% of total generation in 2020. Generation from gas-fired power plants has more than doubled (although its share of overall electricity generation has fallen marginally), oil generation has dropped by 80% and its share in the electricity mix has plummeted. The largest share of renewable electricity generation is from hydropower; wind and solar PV have increased rapidly in recent years, but renewables still comprised less than 10% of overall generation in 2020.

Southeast Asia Energy Outlook 2022
PAGE | 30
Energy in Southeast Asia
Covid-19 hit Southeast Asia’s economy hard and caused major disruptions to the energy sector
Key indicators for energy demand, emissions and mobility in Southeast Asia
IEA. All rights reserved.
Notes: TES = total energy supply. EMDE = emerging markets and developing economies. The Mobility Indicator of Southeast Asia is a measure of changes in the number of visits and length of stay compared with levels in early 2020. It was calculated for Malaysia, Thailand, Indonesia and the Philippines based on Google LCC (2021). Source: IEA (2021), Oil Market Report - December 2021.
- 8% - 6% - 4% - 2% 0% 2% 4%
GDP
TES
Oil
Coal
Natural gas
Renewables
Electricity
CO₂
Change relative to 2019
Change in key indicators for energy demand and emissions, 2020
2020 Southeast Asia 2020 EMDE except China
Mobility indicator of Southeast Asia
40
55
70
85
100
115
130
Jan Apr Jul Oct Jan
Inde
x (1
00=t
he fi
rst q
uart
er o
f 202
0)
2020 2021

Southeast Asia Energy Outlook 2022
PAGE | 31
Energy in Southeast Asia
Oil, natural gas and electricity use fell in Southeast Asia in 2020 due to the Covid-19 pandemic, but the use of coal and renewables increased
Southeast Asian countries have been strongly impacted by the Covid-19 pandemic. The region managed to escape the worst of the pandemic in 2020, though preventative public health policies (such as lockdowns) severely affected economic activity. The Delta variant had a major impact on the region in the summer of 2021. The reported number of deaths from Covid-19 reached almost 3 000 per day in August 2021 (compared to the peak of less than 300 per day during 2020), and the number of excess deaths is estimated to be around triple this figure. Severe restrictions were again implemented in 2021, significantly affecting manufacturing factories on which this region’s economy relies. Many factories stopped operations, causing disruptions within the region and for global supply chains. Southeast Asia’s GDP fell by 4% in 2020, and recovered by only around 3% in 2021.
The economic disruption naturally impacted energy demand, and total energy supply declined by about 3% in 2020. Oil was the most affected: in total, oil use fell by around 6.5% in 2020. Natural gas demand fell by around 5% in 2020, mainly as a result of curtailed activity in industry. Electricity demand also declined (by 1.8%), again as a result of curtailed industrial activity, though the drop in electricity use was moderated by resilient demand in residential buildings during the region’s lockdowns.
As in other parts of the world, the contribution from renewable energy was resilient through the pandemic, growing by more than 3% in 2020 (although this growth rate was half the 7.5% annual growth seen on average over the previous five years). Policy support – and deadlines for the expiry of this support – have underpinned a major renewables investment boom for solar and wind in Viet Nam in recent years. Viet Nam has led the region’s renewable capacity growth, and the level of renewable capacity added in 2020 was double the level of 2019.
In contrast to many other parts of the world, coal demand also increased by around 1% in 2020 in Southeast Asia, mainly as a result of increased coal use in the power sector. Along with China, Viet Nam was one of only two large coal demand countries to register an increase in coal use in 2020. Overall global coal consumption fell by around 4% in 2020.
In 2021, as the Delta variant swept across the region, mobility indicators from July to October were even lower than in 2020. Nonetheless, mobility rebounded strongly after October and annual energy demand in 2021 is estimated to have increased across the board, with annual oil use increasing by 4.5%, natural gas by 4% and coal by 4%. However, Covid-19 variants still cast a shadow of uncertainty over the region.

Southeast Asia Energy Outlook 2022
PAGE | 32
Energy in Southeast Asia
Fuel prices have risen strongly since the onset of Covid-19. A number of planned policy changes have been delayed or cancelled, and some subsidies have been increased
Retail prices of oil products in selected countries, 2020-2022 Road-transport policy reactions to commodity price surge
IEA. All rights reserved. Notes: For Thailand, prices are weighted average monthly prices of ULG 95 and HSD B7 in Bangkok. For the Philippines, prices are common prices of RON 95 gasoline and diesel in the first week of each month in Manila. For Malaysia and Singapore, prices are for RON93-96. For Viet Nam, prices are for RON below 93. Source: IEA (2022), Energy Prices; Thailand, Ministry of Energy, 2022 and Philippines, Department of Energy, 2022.
50
70
90
110
130
1 2 3 4 5 6 7 8 9 101112 1 2 3 4 5 6 7 8 9 101112 1 2
2020 2021 2022
Janu
ary
2020
= 1
00
Thailand (gasoline) Thailand (diesel)Philippines (gasoline) Philippines (diesel)Malaysia (gasoline) Singapore (gasoline)Viet Nam (gasoline)
Country Policy
Indonesia
• In December 2021, the government cancelled plans to end the sale of some lower grades of gasoline products (RON 88 and RON 90) that are currently subsidised; these products are mainly consumed by the most vulnerable households in rural areas.
Thailand
• In November 2021, faced with increased prices for crude oil and palm oil, the government decided to continue only a 7% blend of biodiesel in diesel (B7) and to suspend 10% (B10) and 20% (B20) biodiesel blends.
• In February 2022, the government announced that it would temporarily replace B7 with a 5% biodiesel (B5) blend to deal with further increases in commodity prices.
Malaysia • In January 2022, the government announced that
retail prices of gasoline and diesel would remain unchanged through use of its subsidy scheme.

Southeast Asia Energy Outlook 2022
PAGE | 33
Energy in Southeast Asia
High fuel prices cast a shadow over affordability, energy access and clean energy transitions
The surge in global commodity prices since mid-2021 has had a major impact on countries in Southeast Asia. Benchmark crude oil prices exceeded USD 100 per barrel in March 2022, the highest price level in more than a decade. The initial rise in prices stems from the strong rebound in the global economy since the Covid-19 pandemic, low levels of investments in new sources of production in recent years, planned and unplanned outages of key fuel infrastructure and artificial tightness caused by policies of some major producer economies. These strains were then intensified by Russia’s invasion of Ukraine.
In the Philippines, diesel retail prices dropped nearly 40% from January to May 2020 but have since increased steadily: diesel prices in February 2022 were almost double the level in May 2020. Higher prices challenge energy affordability, with important implications for practical policies and politics. In Thailand, for example, truck drivers protested about high diesel prices and blocked a major thoroughfare in Bangkok in February 2022.
Rising fuel prices cast a shadow over recent progress in energy access. Energy access in Southeast Asia has been improving for decades but the pandemic and economic crisis reversed some of the
progress in 2020; current high fuel prices could further reverse or slow this (see next chapter).
High fossil fuel prices can promote energy efficiency measures and the deployment of renewable energy technologies. But they can also mean higher subsidies and fiscal burdens – most nations in Southeast Asia are oil importers and subsidise fuel use – which can reduce governments’ capacity to promote clean energy policies. Fossil fuel subsidy reforms are ongoing in some parts of this region but subsidy levels are set to rise because of the large increase in fossil fuel prices (see next chapter).
A number of planned policy changes have been delayed or cancelled as a result of the increase in prices. For example, the Indonesian government cancelled its plans to end the sales of lower grade (and more emissions-intensive) gasoline products that are generally consumed by the most vulnerable people in rural areas. In Thailand, faced with price surges in crude oil and palm oil, the government suspended policies to promote products with high levels of biodiesel blending (B7, B10 and B20) and temporarily introduced a lower B5 grade to control retail prices.
Southeast Asia Energy Outlook 2022
PAGE | 34
Energy in Southeast Asia
Factors shaping the energy outlook

Southeast Asia Energy Outlook 2022
PAGE | 35
Energy in Southeast Asia
Steady economic growth has brought about a large expansion in consumer spending
GDP growth in Southeast Asia and consumer spending per capita for selected countries, 2000-2019 Real GDP growth assumptions
IEA. All rights reserved.
Note: GDP in 2019 USD PPP. Sources: United Nations Statistics Division (2021); IEA analysis.
1%
2%
3%
4%
5%
6%
7%
8%
1 000
2 000
3 000
4 000
5 000
6 000
7 000
8 000
2000 2002 2004 2006 2008 2010 2012 2014 2016 2018
Cons
umer
spen
ding
per
capi
ta, U
SD (2
019)
Indonesia Malaysia Philippines Thailand GDP growth of Southeast Asia
Compound average annual growth rate
2010-20 4.2%
2020-30 4.9%
2030-50 3.2%
2020-50 3.8%

Southeast Asia Energy Outlook 2022
PAGE | 36
Energy in Southeast Asia
Vehicle and appliance ownership trends have been reshaping energy use
Motorisation indicators and estimated ownership rates for appliances in Southeast Asia, 2000-2020
IEA. All rights reserved.
100
200
300
400
2000 2005 2010 2015 2020
Inde
x=10
0, 2
000
Number of vehicles Paved road length
10
20
30
40
50
60
2000 2005 2010 2015 2020
Ow
ners
hip
per 1
00 p
opul
atio
nAir conditioning units Refrigerators

Southeast Asia Energy Outlook 2022
PAGE | 37
Energy in Southeast Asia
The pace of economic growth, alongside structural and demographic changes, will play a key role in determining the energy landscape of Southeast Asia
The expansion of energy demand in Southeast Asia over the past two decades has been driven by strong economic growth (even if trends were disrupted by the Covid-19 pandemic). The countries in the region are in different stages of economic development, but almost all have more than doubled the size of their economy since 2000. Consumer spending per capita has grown even faster: in Indonesia, it expanded nearly 20-fold between 2000 and 2019.
Economic growth has been accompanied by major changes in societies across the region, notably the forces of urbanisation and motorisation, which have had strong influences on patterns of energy use. In 2000, about 40% of the population in Southeast Asia lived in urban areas; by 2018, this share had risen to more than 50%. Home appliance ownership has increased sharply: the number of air conditioning units has tripled, and the number of refrigerators has increased by 150%. Given the tropical climate, increases in the availability and use of air conditioning units are important indicators of a higher quality of life (although ownership levels remain relatively low in most countries), and have also pushed up electricity demand.
In terms of motorisation, the number of vehicles on the road and the length of paved road has tripled over the past 20 years. Indonesia became the 11th largest vehicle market globally in 2019. There has been large levels of inward foreign investment directed towards the automotive industry, which also helped to encourage this process. Thailand is today the 11th largest car producing country in the world and the second largest pick-up truck market after the United States.
Energy access in Southeast Asia has improved significantly over the past 20 years. The share of population with electricity has risen from 60% in 2000 to 95% in 2020. The share of those with access to clean cooking increased from 23% to almost 70% between 2000 and 2020.
Commodity prices in this work, which follow those in the WEO-2021, are generally lower than at present. For example the oil price in the STEPS ranges between USD 60-90 per barrel. Russia’s invasion of Ukraine will have an uncertain impact on long-term price levels as supply restrictions and efforts to reduce exports from Russia could be offset by slower economic growth and permanent demand destruction from higher near-term prices. We will incorporate these factors in the future analyses.
In our scenarios, we assume that the economies of Southeast Asia will continue to grow and mature. Annual average real GDP growth is 4.9% between 2020 to 2030 and 3.2% between 2030 to 2050. We hold this assumption constant across the different scenarios examined. However, the way to meet rising demand for energy services differs substantially by scenario, primarily because of variations in policy settings – notably the strength of the region’s push to limit the environmental impact of energy use while also ensuring secure and affordable energy supply. The Sustainable Development Scenario (SDS) assumes CO2 prices of USD 35 in 2040 and USD 95 in 2050 for Southeast Asia. Other modelling assumptions are explained in the WEO-2021.

Southeast Asia Energy Outlook 2022
PAGE | 38
Energy in Southeast Asia
Pathways after the Glasgow Pact signed at COP26 in November 2021
Share of total energy supply covered by Sequencing of CO2 emissions reductions in Southeast Asia carbon neutrality targets in Southeast Asia in the Sustained Development Scenario vs global emissions reductions in the NZE Scenario
IEA. All rights reserved.
Notes: Thailand, Viet Nam, Malaysia and Lao PDR have targets to achieve net zero emissions or carbon neutrality by 2050; Singapore has a target to reach net zero emissions beyond 2050; Indonesia has a target to reach net zero emissions in 2060. Brunei and Cambodia have mentioned net zero emissions or carbon neutrality by 2050 but do not have targets. The Philippines and Myanmar have not made any net zero announcements. Targets include both detailed plans (e.g. Nationally Determined Contributions [NDCs] and long-term strategies) and statements by government officials (e.g. at COP26).
20%
40%
60%
80%
100%
Carbon neutrality target, Southeast Asia
by 2050
by 2060
No target
beyond 2050
20%
40%
60%
80%
100%
SDS, Southeast Asia NZE, Global
by 2040
by 2050
towards2060 and beyond
by 2030
by 2040
by 2050

Southeast Asia Energy Outlook 2022
PAGE | 39
Energy in Southeast Asia
The strength of emissions reduction targets, as well as efforts to ensure their implementation, are crucial variables for the future, both within and outside Southeast Asia
The fuels and technologies used to meet expected growth in demand for energy services in Southeast Asia vary across our scenarios. These choices are shaped in turn by the policies that are introduced in countries across the region to support sustainable, secure and affordable energy.
There has been a dramatic shift in long-term policy ambition in Southeast Asia since our last regional Outlook in 2019. Countries responsible for around half of the CO2 emissions in the region have pledged to achieve net zero emissions by 2050 (some of these pledges contain important caveats and conditions about the support required to achieve of these goals). Indonesia, which accounts for about 35% of the region’s energy-related CO2 emissions, has announced a target to achieve net zero emissions by 2060 or sooner.
In aggregate, these ambitions for the region are broadly consistent with the pathway laid out in the IEA’s Sustainable Development Scenario (SDS). The SDS is a “well below 2°C” pathway that represents a gateway to achieving the outcomes targeted by the Paris Agreement. In this scenario, advanced economies reach net zero emissions around 2050, China’s emissions fall to net zero around 2060 and global net zero emissions are reached before 2070. Emissions in Southeast Asia decline by around 60% between 2020 and 2050. This scenario also meets key energy-related United
Nations Sustainable Development Goals (SDGs), in particular achieving universal access to electricity and clean cooking facilities by 2030, and achieving a substantial reduction in air pollution.
This scenario is very ambitious, requiring a wholesale transformation of the region’s energy system over the coming decades. However, it is not fully aligned with the goal of a fully net zero global energy system by mid-century. As noted already, this global goal is modelled in our Net Zero Emissions by 2050 scenario (NZE Scenario), which provides vital benchmarks and milestones for this report and for global progress towards a 1.5°C stabilisation in rising global average temperatures.
Commitments and pledges are of course not enough on their own – implementation is key. In the Stated Policies Scenario (STEPS), we do not take it for granted that governments reach their aspirational targets, but take instead a granular sector-by-sector look at the existing energy policies and measures and those under development, including the institutional and financial constraints that can affect how these policies are realised in practice.
There remains a large gap between the regional trends in the STEPS and our ambitious normative scenarios. This report takes a close look at what it would take for governments to close this gap, and the implications of doing so.

Southeast Asia Energy Outlook 2022
PAGE | 40
Energy in Southeast Asia
International co-operation is pivotal for clean energy transitions
Global CO2 emissions in the IEA Net Zero Emissions by 2050 (NZE) Scenario and the Low International Co-operation Case, 2010-2090
IEA. All rights reserved.
Source: IEA (2021).
10
20
30
40
2010 2020 2030 2040 2050 2060 2070 2080 2090
Gt C
O₂
NZE
Low International Co-operation Case

Southeast Asia Energy Outlook 2022
PAGE | 41
Energy in Southeast Asia
International co-operation will be crucial both to mitigate and adapt to climate change in Southeast Asia
For countries across Southeast Asia, achieving net zero emissions will rely on support to ensure the deployment of key technologies and infrastructure. This was explicitly referenced at the COP26 in November 2021 by the Prime Minister of Viet Nam, who indicated that emissions reductions would rely on “the cooperation and support of the international community, especially from the developed countries, in terms of finance and technology”.
The international context for achieving net zero emissions is a vital determinant of the speed and effectiveness of energy transitions. Scenarios that achieve net zero emissions, such as the SDS and the NZE Scenario, rely on a collaborative international environment. Far-reaching efforts to improve the domestic environment for clean energy investment in emerging and developing economies are accompanied by strong international efforts to accelerate inflows of capital and access to technology. Given the range and diversity of countries and situations in Southeast Asia, intraregional cooperation also plays an important role in the SDS and NZE Scenario.
If this collaborative environment is missing, then transitions will be slower and more expensive. In the NZE Scenario report, a “low international co-operation case” examined this risk in detail. In this alternative case, technologies that rely on international trade and
competitiveness, that have large or capital-intensive demonstration programmes, or that require support to create market pull and standardisation to ensure inter-operability are deployed more slowly than in the NZE Scenario (with a delay of 5-10 years in advanced economies and 10-15 years in emerging market and developing countries).
Global emissions reductions between 2020 and 2050 in the low international co-operation case are about half of the rate in the NZE Scenario. Heavy industry is particularly affected, and it comprises around 40% of remaining emissions in 2050.
Support for resilience and adaptation will also be critical to countries in Southeast Asia. This region is seen as one of the most vulnerable to climate change, and three countries in the region are ranked in the top ten of the most at-risk countries from it. It has been estimated that Southeast Asia is at risk of losing over 35% of its GDP in key sectors such as agriculture, tourism and fishing by 2050. The Glasgow Climate Pact urges countries to “provide enhanced support, including through financial resources, technology transfer and capacity-building, to assist developing country Parties with respect to both mitigation and adaptation”.

Southeast Asia Energy Outlook 2022
PAGE | 42
Energy in Southeast Asia
Selected energy policies in Southeast Asian countries
The STEPS is our assessment of today’s policy landscape, including the impact of existing and announced policy measures and targets. There are also collective targets agreed at the regional level in the ASEAN context, notably the ASEAN Plan of Action for Energy Cooperation (APAEC).
Country Sector Policies and targets
Brunei Darussalam
Efficiency Reduce total energy consumption by 63% from business-as-usual (BAU) levels by 2035. 60% EV share of total annual vehicle sales by 2035.
Renewables Achieve 30% of electricity generation from renewables by 2035.
Climate change Reduce CO2 emissions from morning peak-hour vehicle use by 40% from the BAU level by 2035. Moving towards net zero by 2050.
Cambodia
Energy access At least 70% of households connected to the national grid by 2030.
Efficiency By 2035 and relative to BAU, cut energy consumption by 20% (1 million tonnes of oil equivalent [toe]) and reduce emissions by 3 MtCO2.
Renewables In an accelerated scenario, total installed capacity by 2030 at 55% hydro, 6.5% biomass and 3.5% solar PV.
Climate change Reduce GHG emissions 27% from baseline emissions by 2030 with international support. Aspirational official emissions reduction scenario reaching net-negative by 2030. A scenario outlines a vision of a carbon neutral economy by 2050.
IEA. All rights reserved.

Southeast Asia Energy Outlook 2022
PAGE | 43
Energy in Southeast Asia
Selected energy policies in Southeast Asian countries (continued)
Country Sector Policies and targets
Indonesia
Energy access Achieve 100% electrification by the end of 2024.
Efficiency Reduce energy intensity by 1% per year to 2025.
Renewables Increase share of “new and renewable energy” in primary energy supply to reach 23% by 2025 and 31% by 2050. 52% share of renewables in electricity capacity additions from 2021 to 2030.
Fossil fuels Consider accelerating phase out of coal in the 2040s conditional on international funding. *
Climate change Reduce GHG emissions 41% by 2030 from the BAU levels with international support. Set up the long-term strategy to reach net zero emissions by 2060 or sooner.
Lao PDR
Energy access Achieve electrification rate of 98% by 2025.
Efficiency Reduce final energy consumption by 10% from the BAU level.
Renewables 30% share of renewables in total primary energy consumption by 2025.
Climate change Conditional GHG emissions reduction target to reach net zero in 2050.
* Though announced by government officials at COP26 or other opportunities, these statements were not yet formulated in detailed plans such as NDCs or long-term strategies as of April 2022.
IEA. All rights reserved.

Southeast Asia Energy Outlook 2022
PAGE | 44
Energy in Southeast Asia
Selected energy policies in Southeast Asian countries (continued)
Country Sector Policies and targets
Malaysia
Efficiency Promote energy efficiency in the industry and buildings sectors with methods of standard setting, labelling, energy audits and building design.
Renewables 31% share of renewables installed capacity by 2025.
Fossil fuels No new coal-fired power plants.*
Transport Have 9 000 AC charging points and 1 000 DC charging points installed by 2025.
Climate change Reduce GHG intensity of GDP by 35% by 2030 from the 2005 level, increase to 45% reduction with enhanced international support. Carbon neutrality by 2050 *
Myanmar
Energy access Achieve electrification rate of 100% by 2030.
Efficiency Reduce primary energy demand by 8% by 2030 from the 2005 level.
Renewables 20% share of renewables installed capacity by 2025.
* Though announced by government officials at COP26 or other opportunities, these statements were not yet formulated in detailed plans such as NDCs or long-term strategies as of April 2022.
IEA. All rights reserved.

Southeast Asia Energy Outlook 2022
PAGE | 45
Energy in Southeast Asia
Selected energy policies in Southeast Asian countries (continued)
Country Sector Policies and targets
Philippines
Energy access Achieve 100% electrification by 2022.
Efficiency Reduce energy intensity 40% by 2030 from 2010 level. Decrease energy consumption by 1.6% per year by 2030 from baseline forecasts. Reduce energy intensity and total energy consumption by 24% relative to the BAU level by 2040.
Renewables 15 GW renewables installed capacity by 2030.
Fossil fuels No new coal-fired power plants beyond those already approved.
Climate change Reduce GHG emissions by 70% from the BAU level by 2030 with the condition of international support.
Singapore
Efficiency Improve energy intensity by 35% by 2030 from the 2005 levels.
Renewables 2 GW solar PV installed capacity by 2030.
Fossil fuels Phase out unabated coal generation by 2050.*
Climate change
Reduce GHG emissions by 16% below the BAU level by 2020, stabilise emissions with the aim to peak around 2030. Peak emissions at no higher than 65 MtCO2e around 2030. Halve emissions from their peak to 33 MtCO2e by 2050, with a view to achieving net zero emissions as soon as viable in the second half of the century.
* Though announced by government officials at COP26 or other opportunities, these statements were not yet formulated in detailed plans such as NDCs or long-term strategies as of April 2022.
IEA. All rights reserved.

Southeast Asia Energy Outlook 2022
PAGE | 46
Energy in Southeast Asia
Selected energy policies in Southeast Asian countries (continued)
Country Sector Policies and targets
Thailand
Efficiency Reduce energy intensity by 30% by 2036 from the 2010 level.
Renewables Increase share of renewables to 30% in total final energy consumption by 2037; increase share of renewables-based power to 36% in capacity and to 20% in generation by 2037. Increase share of renewables in transport fuel consumption to 25% by 2036.
Transport Increase to 1.2 million electric vehicles and 690 charging stations by 2036.
Climate change
Reduce GHG emissions by 20% from the BAU level by 2030, increase to 25% with enhanced international support. Aim to reach carbon neutrality in 2050 and net zero GHG emissions by 2065. Reach net zero GHG emissions in 2050 with support of technology transfer/cooperation and availability of financing.*
Viet Nam
Renewables Targets on renewables share in TPES of 15–20% in 2030 and 25–30% in 2050. 31-38 GW solar PV and wind installed capacity by 2030. 4 GW offshore wind installed capacity by 2030, 36 GW by 2045.
Fossil fuels Phase-out of coal-fired power generation by 2040s.* Plan 31% share of coal installed capacity by 2030.
Climate change
Reduce GHG emissions by 9% by 2030 and by 27% from the BAU level with international support. Targets for GHG reductions from energy use: 15% by 2030 and 20% by 2045 from the BAU level. Make use of domestic resources, along with international cooperation, to achieve net zero emissions by 2050.*
* Though announced by government officials at COP26 or other opportunities, these statements were not yet formulated in detailed plans such as NDCs or long-term strategies as of April 2022.IEA. All rights reserved.

Southeast Asia Energy Outlook 2022
PAGE | 47
Energy prospects
Southeast Asia’s Energy Prospects

Southeast Asia Energy Outlook 2022
PAGE | 48
Energy prospects
Scenarios to 2050

Southeast Asia Energy Outlook 2022
PAGE | 49
Energy prospects
Future energy mix: the outlook for Southeast Asia depends critically on the strength of climate policies. In the SDS, renewables grow to two-thirds of total energy supply by 2050
Total energy supply and CO2 emissions, 2010-2050
IEA. All rights reserved.
1
2
3
20
40
60
2010 2015 2020 2025 2030 2035 2040 2045 2050
Gt C
O₂
EJ
Stated Policies Scenario (STEPS)
Renewables Traditional use of biomass Nuclear Natural gas Oil Coal CO₂ emissions
1
2
3
20
40
60
2010 2015 2020 2025 2030 2035 2040 2045 2050
Gt C
O₂
EJ
Sustainable Development Scenario (SDS)

Southeast Asia Energy Outlook 2022
PAGE | 50
Energy prospects
Changes in the energy mix: the outlook for fossil fuels varies by time period and scenario, but the main uncertainty for renewables is how fast they grow
Change in total energy supply by fuel, 2020-2030 (left) and 2030-2050 (right)
IEA. All rights reserved.
.
- 10 0 10 20
Coal
Oil
Natural gas
Nuclear
Traditional biomass
Renewables
Other
EJSTEPS SDS
Change in total energy supply by fuel, 2020-30
- 10 0 10 20
Coal
Oil
Natural gas
Nuclear
Traditional biomass
Renewables
Other
EJ
Change in total energy supply by fuel, 2030-50

Southeast Asia Energy Outlook 2022
PAGE | 51
Energy prospects
Improvements in energy efficiency and the deployment of renewables are the two critical levers to move Southeast Asia to a sustainable energy future
In the STEPS, energy demand grows by just over 3% on average per year to 2030, slightly lower than the 3.3% annual average increase seen in the decade before Covid-19. Growth moderates further after 2030 but it does not reach a plateau even by 2050.
This trajectory reflects the direction in which Southeast Asia’s energy system is heading, based on our assessment of the sector-by-sector policies that have been implemented or announced by governments. There is a significant degree of continuity with past trends. Although renewables grow rapidly, fossil fuels meet most of the growth in demand. While growth in coal, oil and natural gas slows over time, consumption of each of these fuels remains on a rising trend all the way through to mid-century. The total share of fossil fuels in the energy mix remains above 70% in 2050, only slightly lower than the 77% seen today.
The outcomes in the STEPS reflect the fact that long-term decarbonisation targets have not yet been translated into detailed policies for their realisation. This is understandable to a degree, given that the aspirational targets are new. But the STEPS trajectory also underlines the importance for policy makers to grapple with the near-term changes that will be essential to put the region’s energy sector on a different course.
In the SDS, the region’s total energy supply grows more slowly to 2030, by around 2.2% per year before reaching a plateau in the 2040s. The difference in energy demand between the two scenarios is more than 10 EJ in 2050, equivalent to the current total energy supply in Indonesia.
The difference in outcomes does not mean a reduction in the energy services available to the population of Southeast Asia. In practice, modern energy is available more readily and quickly to all in this scenario than in the STEPS. Lower demand is a reflection of much greater efficiency. This includes the inherent efficiency gains associated with energy transitions, as less energy is lost via thermal electricity generation, and electric motors replace ones reliant on combustion. It also includes policy-driven improvements in end-use equipment, such as air conditioners and other appliances.
In terms of the energy mix in the SDS, there are near-term increases in oil and natural gas demand to 2030, but these are reversed thereafter. Coal demand soon peaks and falls back to the level of 2018 by 2030. The share of fossil fuels in the energy mix declines to around one-third in 2050 (in the NZE Scenario, the share of fossil fuels decreases to around one-third by 2040).

Southeast Asia Energy Outlook 2022
PAGE | 52
Energy prospects
Final energy consumption: all end-use sectors see increases in both the STEPS and SDS, but efficiency improvements and fuel switching shape future trends
Total final energy consumption by sector and scenario, 2020 and 2050
IEA. All rights reserved.
Note: Hydrogen includes low-carbon gaseous hydrogen and hydrogen-based fuels such as ammonia and synthetic hydrocarbons. Transport excludes international bunkers. Other renewables heat includes concentrating solar power and geothermal.
4
8
12
16
2020 STEPS SDS 2020 STEPS SDS 2020 STEPS SDS
EJ
Coal Oil Natural gas Electricity Bioenergy Other renewables heat Traditional use of biomass Hydrogen
Industry Transport Buildings
2050 2050 2050

Southeast Asia Energy Outlook 2022
PAGE | 53
Energy prospects
Electricity use rises strongly in all scenarios: in the SDS, bioenergy and hydrogen expand their roles in meeting demand, especially after 2030
Change in total final energy consumption by fuel and scenario
IEA. All rights reserved.
Note: Hydrogen includes low-carbon gaseous hydrogen and hydrogen-based fuels such as ammonia and synthetic hydrocarbons.
- 6 - 3 0 3 6
EJ
2020-30
2030-50
Stated Policies Scenario
Coal
Oil
Natural gas
Electricity
Bioenergy andother renewables heat
Traditional use of biomass
Hydrogen
- 6 - 3 0 3 6
EJ
Sustainable Development Scenario
2030-2050

Southeast Asia Energy Outlook 2022
PAGE | 54
Energy prospects
With today’s policy settings, oil use for transport and electricity demand for buildings constitute the main additions to final consumption
In the STEPS, total final consumption in Southeast Asia increases by 40% to 2030 (an increase from 19 EJ in 2020 to 27 EJ in 2030) and by 80% in 2050 (35 EJ). Energy consumption for transport sees the largest increase among end-use sectors, more than doubling to 2050, given increasing demand for mobility, especially for two/three-wheelers and passenger cars. Policy and infrastructure support for the electrification of mobility is limited, and oil retains its dominance in the transport sector in this scenario. There is an increase in the use of biofuels through to 2050 (reaching 0.4 mb/d in 2050) but oil consumption for all types of road transport rises from 2.2 mb/d today to 4 mb/d in 2050. Rising demand for air travel leads to a sixfold increase in jet fuel consumption.
In industry, energy consumption rises by nearly 40% in 2030 and by 80% in 2050, driven mainly by the region’s growing light manufacturing sector (e.g. automobiles) as well as increased production of iron, steel and chemicals. Natural gas and electricity serve most of the demand growth. In buildings, rising household incomes translate into higher appliance ownership and demand for cooling, driving up energy demand by 15% in 2030 and 60% in 2050. Almost all of this increase is met by electricity, while the traditional use of bioenergy drops by half up to 2050, given improved energy access.
In the SDS, stronger efforts to promote efficiency in energy end-use limit total final energy consumption to 24 EJ in 2030 and 25 EJ in
2050. In transport, energy consumption is limited to 7 EJ in 2030, and the rise of EVs after 2030 and their higher efficiency means that overall energy consumption in 2050 for all forms of transport is marginally lower than in 2030. By 2050, more than 90% of new car sales and around 10% of trucks are electric (in the NZE Scenario, already by 2035 there are no new sales of internal combustion engine [ICE] cars or two/three-wheelers, and 50% of heavy truck sales are electric). Biofuel consumption is around 20% higher in 2050 than in the STEPS, and hydrogen makes significant inroads in the sector, providing 4% of demand for the sector in 2050.
In industry, coal-to-gas and oil-to-gas switching plays an important role in reducing emissions from the sector to 2030. Higher recycling rates and more stringent efficiency standards for equipment halve the energy intensity of industry from today’s levels (as a ratio of gross value added) by 2050, supported by a structural change of the economy towards less energy-intensive light industries. Energy demand in 2050 is around 20% lower than in the STEPS. In buildings, more stringent energy performance standards, particularly for cooling equipment, are the key lever to limit energy consumption and emissions; by 2050, energy use in buildings is about a third lower in the SDS than in the STEPS. Coupled with the phasing out of traditional use of bioenergy in cooking, the rapid growth of electricity boosts its share in the buildings sector’s final energy consumption to 70% in 2030 from just above 40% today.

Southeast Asia Energy Outlook 2022
PAGE | 55
Energy prospects
CO2 emissions: in the STEPS, emissions grow steadily to mid-century, while a trajectory consistent with the region’s declared ambitions would see a peak before 2030
CO2 emissions in Southeast Asia in the Stated Policies Scenario and Sustainable Development Scenario, 2010-2050
IEA. All rights reserved.
500
1 000
1 500
2 000
2 500
3 000
2010 2015 2020 2025 2030 2035 2040 2045 2050
Mt C
O₂
Historical
Additionsin STEPS
SDS
SDS9%
Additions in STEPS
6%
Remaining global carbon budget for
1.5 °C85%
Cumulative CO2 emissions in Southeast Asia to 2050 and the remaining global carbon budget for 1.5 °C

Southeast Asia Energy Outlook 2022
PAGE | 56
Energy prospects
Southeast Asia is still a long way off the pathway consistent with its clean energy ambitions
Emissions of CO2 from the energy sector have increased steadily in Southeast Asia in recent years. Indeed, the pace of emissions growth has been higher than previously projected in our Outlook, despite the impact of the Covid-19 pandemic on energy use and emissions (see next pages).
In the STEPS, emissions increase by slightly over 50 Mt CO2 each year to 2035. This maintains the average annual increase seen over the last ten years. The growth in emissions moderates slightly after 2035 as energy demand growth slows and as renewables provide an increasingly large share of the overall increase in energy demand, but there is no peak in emissions before 2050.
Cumulative CO2 emissions between 2020 and 2050 in Southeast Asia total just under 75 Gt CO2 in the STEPS. Southeast Asia has relatively limited responsibility for historical energy-related emissions, accounting for 3% of the total over the past half century. Projected emissions to 2050 in the STEPS are equivalent to around 15% of the remaining global CO2 budget that is consistent with limiting the average temperature rise to 1.5 °C (with a probability of 50%); in 2050, Southeast Asia comprises around 8% of the world’s population and global GDP.
In the SDS, there is a major decoupling between emissions levels and economic and population growth. As the region’s economy
recovers from the disruption of Covid-19, CO2 emissions peak in the late 2020s, and then fall consistently, registering a 30% decline from 2020 levels by 2040 and a 60% decline from 2020 levels by 2050. Between 2040 and 2050, emissions fall by an average of 11 Mt each year. Cumulative emissions between 2020 and 2050 in the SDS are just under 45 Gt CO2, around 40% lower than in the STEPS (in the NZE Scenario, at a global level, cumulative CO2 emissions between 2020 and 2050 are about 60% lower than the STEPS).
These emissions reductions are led initially by the power sector, thanks to large-scale deployment of low-emissions generation, led by solar PV and wind. Renewable sources provide more than 40% of electricity by 2030, up from less than 25% today. After 2030, decarbonisation is accelerated by electrification of the demand sectors – notably via EVs that account for well over 80% of the passenger car stock in 2050, as well as further deployment of renewables and phasing down of unabated coal plants. Emissions are reduced in hard-to-abate sectors, such as heavy industries and long-distance transportation, via improvements in energy efficiency and then by the rollout of low-carbon fuels and CCUS, though these take time to gain momentum: the share of hydrogen in industrial energy consumption is still about 1% even in 2050.

Southeast Asia Energy Outlook 2022
PAGE | 57
Energy prospects
A perspective of 2030 through a different lens: how do our latest projections compare with the 2017 Southeast Asia Energy Outlook?
Selected energy and emissions indicators in 2030 from the 2017 and 2022 Southeast Asia Energy Outlooks
IEA. All rights reserved.
Note: SAEO2017 = New Policies Scenario from the Southeast Asia Energy Outlook 2017. SAEO2022 = Stated Policies Scenario from the Southeast Asia Energy Outlook 2022.
3
6
9
12
SAEO2017
SAEO2022
SAEO2017
SAEO2022
SAEO2017
SAEO2022
EJ
Coal OilNatural gas ElectricityTraditional use of biomass HydrogenBioenergy and renewable heat
Total final energy consumption by sector, by fuel
Industry Transport Buildings
400
800
1 200
1 600
SAEO2017
SAEO2022
TWh
Geothermal Bioenergy WindSolar PV Hydro OilGas Coal
Power generation by technology
0.5
1.0
1.5
2.0
SAEO2017
SAEO2022
Gt C
O₂
CO₂ emissions

Southeast Asia Energy Outlook 2022
PAGE | 58
Energy prospects
Five years on: comparing the SAEO-2017 with the SAEO-2022
Since the publication of our first Southeast Asia Energy Outlook in 2013, projections for the region have been revised on a regular basis, given changes in economic growth, energy access, policy preferences, commodity prices and the latest technology cost data. Comparing projections in the STEPS from this year’s Outlook with those from the New Policies Scenario in the 2017 Outlook highlights the longer-term implications of changes over the past five years (both scenarios are based on prevailing policy settings).
One of the largest changes is related to the traditional use of biomass, which in 2030 is around 60% lower in this year’s Outlook than in the 2017 Outlook. There has been strong policy progress in this area, including for example, Indonesia’s new subsidy programme that facilitates access by low-income communities to clean cooking fuels.
In the power sector, lower technology costs and enhanced policy support for key renewable technologies are also reflected in higher projections for solar PV and wind: output from these sources in 2030 is more than double the projections made in the 2017 Outlook. The overall picture for demand and the generation mix is otherwise quite similar, with a continued large role for coal in meeting regional demand.
Economic growth between 2016 and 2030 is around 20% lower in this year’s Outlook than in the 2017 Outlook, mainly because of the impacts stemming from the Covid-19 crisis. However, fossil fuel demand is still higher in a number of sectors, most notably in industry and transport mainly because of a large reduction in annual efficiency improvements. For example, projected coal use in industry in 2030 is around 50% higher than in the 2017 Outlook, largely due to higher demand by the cement industry.
In the transport sector, oil demand in 2030 is 12% higher in this year’s Outlook than in the 2017 Outlook. This year’s projections include a much higher share of EVs and higher biofuel demand. However, we also project a significantly larger vehicle fleet by 2030 mainly supported by the recent trends in the vehicles market, and without an increase in the strength of fuel efficiency standards, this leads to higher overall oil demand.
CO2 emissions in 2030 are around one-third higher in this year’s Outlook compared with the 2017 Outlook. The countries of Southeast Asia have taken longer to formulate and implement consistent policies to limit the environmental impact of their energy use than was envisaged five years ago. This highlights the importance of policies that can curb energy demand, fossil fuel use and emissions even as the region industrialises and its vehicle fleet grows.

Southeast Asia Energy Outlook 2022
PAGE | 59
Energy prospects
Universal energy access: major improvements in recent years stalled due to the pandemic. A sharp acceleration is needed to achieve universal access by 2030
Energy access in Southeast Asia in the Stated Policies Scenario and Sustainable Development Scenario
IEA. All rights reserved.
Note: ICS = Improved cook stove. Renewables here means that renewable electricity is provided by grids, minigrids or stand-alone systems.
25%
50%
75%
100%
Electricity Clean cooking
Grid
Minigrid
Stand alone
Renewables
ICS
Biogas
Electric
LPG
Share of people gaining access by technology by 2030
25%
50%
75%
100%
2000 2010 2020 2030
STEPS SDS
Electricity
Share of population with electricity/clean cooking
Clean cooking
Electricity
Clean cooking

Southeast Asia Energy Outlook 2022
PAGE | 60
Energy prospects
Access to electricity for most of Southeast Asia is within reach, but access to clean cooking fuels remains a key challenge
Updated IEA estimates suggest that 5% of the population in Southeast Asia (around 33 million people) do not have access to electricity today. The number of people without access fell by 50 million people between 2015 and 2019, but progress stalled in 2020 and 2021. The pandemic slowed the growth in new connections and weakened the ability of households to pay for electricity.
Despite the setbacks of the pandemic, most countries in Southeast Asia achieve near universal access to electricity by 2030 in the STEPS; this requires connecting just over 3 million people every year. Nonetheless, there would still be 1.3 million people, mostly in rural settlements in remote areas in Cambodia and Myanmar, who do not have access to reliable and affordable electricity by 2030.
The SDS offers a pathway to deliver electricity to all by 2030. About 45% of households gain access to electricity with a grid connection, while mini‐grids provide access to around 30% and stand‐alone systems provide the remaining 25% of new connections. Over 55% of stand-alone systems and around 40% of grid solutions deployed between now and 2030 use electricity generated by renewables. The most appropriate route depends on local resource availability and factors such as population density and distance from the existing grid. Where grid extension is very expensive or where there is high reliance on costly diesel-based options, falling costs for renewables are opening new doors for cost-effective access. After 2030, grids expand to connect most customers using off‐grid solutions ; this
emphasises the importance of interoperability for the off‐grid and mini‐grid systems built today. Only the most remote users do not have a grid connection by 2050. Achieving full access to electricity in Southeast Asia in 2030 requires an annual investment of over USD 2.4 billion a year; the stated policies are on track to meet just over 90% of this total.
Access to clean cooking has improved in Southeast Asia over the past decade, with the share of the population using clean fuels and technologies rising from 45% in 2010 to nearly 70% in 2019. As with electricity, the pandemic set back progress, with the number of people lacking access rising by one million in the past two years.
To reach full access to clean cooking by 2030, more than 23 million people each year need to gain access, meaning double the pace of new connections recorded prior to the pandemic. This does not happen in the STEPS, in which some 170 million people in the region cook with the traditional use of biomass, coal or kerosene in 2030.
In the SDS, universal access to clean cooking is achieved by 2030. In total around 200 million people gain access via liquefied petroleum gas (LPG) or improved biomass stoves, while biogas or electric stoves provide for the remaining 15 million people. Around USD 360 million annual spending through to 2030 is required to achieve this. The policies stated by the governments deliver less than a quarter of this investment, even though it is less than 0.2% of total energy investment to 2030 in Southeast Asia in the SDS.

Southeast Asia Energy Outlook 2022
PAGE | 61
Energy prospects
Fossil fuel subsidies: in the absence of major reforms, these subsidies are set to increase alongside higher oil and gas prices, bringing significant fiscal risks
Fossil fuel subsidies in Southeast Asia and oil prices, 2010-2020
IEA. All rights reserved.
20
40
60
80
100
120
140
10
20
30
40
50
60
70
2010 2012 2014 2016 2018 2020 2030 2050
USD
per
bar
rel (
2020
)
Billio
n U
SD (2
020)
Electricity
Coal
Gas
Oil
Historical
Fossil fuel subsidies
IEA crude oil price(right axis)
subsidy reforms
high crude prices

Southeast Asia Energy Outlook 2022
PAGE | 62
Energy prospects
Reforming fossil fuel subsidies can go hand-in-hand with providing clean and affordable energy access for all
The countries of Southeast Asia have made some progress in phasing out fossil fuels subsidies, but this process is far from complete. Seeing it through is essential to spur more sustainable consumption and investment decisions. Moreover, the structure of fossil fuel subsidies in many parts of the region means that benefits accrue mainly to wealthier segments of the population (who use more of the subsidised fuel) rather than to the poorest. At COP26 in November 2022, the Glasgow Climate Pact reaffirmed the goal to accelerate efforts towards “the phase-out of inefficient fossil fuel subsidies”.
The IEA has been measuring fossil fuel subsidies in a systematic way for more than a decade. In Southeast Asia, these subsidies were estimated to average USD 32 billion in total between 2010 and 2020. Most of the largest changes in the level of subsidies over this period were associated with changes in international fossil fuel prices. For example, the total level of fossil fuel subsidies in 2020 was the lowest since 2010, but this was due to the very low crude prices in 2020, and with the strong rebound in crude oil prices in 2021 and 2022, subsidies are also likely to soar.
There have been some reforms in parts of Southeast Asia. Subsidies for cooking fuels in Indonesia have been undergoing reforms since 2007 through a step-by-step process. In 2007, the government
implemented a programme to switch the use of cooking fuels away from kerosene towards less-polluting LPG by reducing the subsidies for kerosene and increasing the subsidies for LPG. This programme reduced kerosene consumption by more than 90% over the following decade; nearly 12.5 million households started to use LPG. Nonetheless, more than 55 million households still continue to use firewood for cooking and in 2020 the government formulated a new policy to replace the LPG subsidy with targeted assistance for poor and vulnerable groups. This programme includes providing a direct transfer to the accounts of eligible households, micro businesses, fishers and farmers. This proposed reform is expected to reduce poverty and inequality directly, enhance energy access and increase government budget savings by IDR 20.7 trillion (USD 1.44 billion).
In the STEPS, despite the implementation of stated reforms on fossil fuel subsidies, the increase in crude prices and greater fuel consumption means that fossil fuel subsidies would rise back towards the levels seen in the 2010s. In the SDS, there are greater efforts to reform inefficient fossil fuel subsidies and, combined with lower crude prices, this results in a much lower level of subsidies. The reduction in fossil fuel subsidies between the two scenarios is significantly greater than the additional investment needed to achieve universal access to affordable energy by 2030.

Southeast Asia Energy Outlook 2022
PAGE | 63
Energy prospects
Energy efficiency: considerable untapped potential for improvements across Southeast Asia
IEA. All rights reserved.
Note: TPED = total primary energy demand. SDS final energy consumption already accounts for efficiency savings.
25
50
75
100
125
150
2020 2025 2030 2035 2040 2045 2050
Inde
x (2
020=
100)
STEPS SDS
Indicators of energy demand, 2020-2050
Energy demand per capita
Energy intensity (TPED/GDP)
-3 0 3 6 9
202020302050
202020302050
202020302050
202020302050
EJ
Final energy consumption and avoided energy use through energy efficiency in the Sustainable Development Scenario
2020
SDS
Additionalsavingsin SDS comparedto STEPS
Avoided demand by efficiency savings
Road transport
Heavy industry
Light industry
BuildingsFinal energyconsumption

Southeast Asia Energy Outlook 2022
PAGE | 64
Energy prospects
Improving the efficiency of end uses – particularly for cooling and the light industry sector – is a key element of the transition
The countries of Southeast Asia have collectively endorsed ambitious targets that seek to boost the rate of improvements in energy efficiency.
In the STEPS, the energy intensity of GDP in Southeast Asia falls by an average of 1.7% each year between 2020 and 2050. The stated energy efficiency policies and measures keep energy consumption around 10% lower in 2030 and around 12% lower in 2050, compared to a trajectory without these measures. Most of the energy savings occur in the light industry and road transport sectors. Yet, despite these improvements, Southeast Asia’s total primary energy demand per capita grows by more than 50% over the period to 2050.
There still remains untapped potential to reduce energy demand further through efficiency. In the SDS, greater efforts to improve energy efficiency mean that energy intensity falls by 2.6% per year on average to 2050. This is about 50% greater than the average rate of the previous decade, and significantly reduces the cost and difficulty of reducing emissions from energy demand. However, it is still short of the 3% average annual decrease achieved in the NZE Scenario.
In buildings, energy efficiency measures save around one EJ (15% of demand) in the SDS relative to the STEPS in 2030. This reflects stronger buildings regulations for new and existing buildings, as well
as more stringent minimum energy performance standards (MEPS) for appliances and particularly for cooling equipment.
In transport, the average fuel economy of both heavy trucks and passenger cars is around 10% better in 2030 in the SDS than in the STEPS, avoiding in total around one EJ (0.5 mb/d) of fuel consumption. Strengthened fuel economy standards, a larger uptake of electric vehicles and stricter regulation of ICE sales all play a role in the SDS. Industry, particularly the light industry sector, has potential for additional efficiency gains in the SDS, reflecting the current lack of policies and measures to support efficiency improvements in the sector. Energy efficiency measures such as the electrification of low‐temperature heat through heat pumps and the introduction of more stringent standards for boilers, electric motor systems and other industrial equipment as well as a more efficient use of heavy industry materials help to cut industrial energy demand by almost 10% in the SDS relative to the STEPS in 2050.
Stronger frameworks for monitoring and evaluation will be key to assessing the status and impact of policies. A renewed focus on realising the full potential of energy efficiency not only is a pillar of sustainable energy use but also eases energy security concerns by reducing imports, while keeping consumer energy bills in check, and delivering employment opportunities.

Southeast Asia Energy Outlook 2022
PAGE | 65
Energy prospects
Regulations, actions and incentives to support efficiency improvements and emissions reductions in buildings in Southeast Asia
Status of key existing policy instruments (left) and a proposed policy package (right) to improve energy efficiency in buildings
Note: “Mandatory” status presumes that there is regulation in place that enforces energy efficiency requirements of the building energy code or certification; “Mandatory for all buildings” means that there are mandatory requirements for both residential and non-residential buildings; “Mandatory for certain building types” means that such requirements apply to a specified group of buildings, e.g. buildings owned by the government or buildings with the floor area larger than a certain threshold.
Building Energy Codes and Building Standards
Product standards Procurement regulations Regulations on materials
Framework regulations
Certification Labelling Disclosure & benchmarking Training programmes
Education programmes Awareness raising Digital tools and data
Financial incentives Non-financial incentives Tariff policies
• Minimum energy and thermal performance requirements, requirements for renewable energy systems installation or utilisation, covering all building types, new and existing buildings.
• Mandatory minimum energy performance standards (MEPS) for all types of appliances and building systems that are progressively and regularly updated, etc.
• Certification of energy and carbon performance for new and existing buildings; Mandatory rating labels, disclosure and benchmarking schemes for new and existing buildings based on energy and carbon performance;
• Mandatory labelling for appliances based on their energy efficiency;• Training on integrated policy portfolios and solutions for net zero carbon
buildings; Accreditation systems for professionals; Awareness raising programmes for consumers on benefits of net zero carbon buildings.
• Grants, preferential loans, tax rebates, tied to energy and carbon performance levels of new or renovated buildings, building materials, systems, appliances, reflective energy pricing, etc.
Regulation
Information
Incentives
Status of building energy codes and certification in ASEAN
Labelling for appliances

Southeast Asia Energy Outlook 2022
PAGE | 66
Energy prospects
Well-designed policies are key to making the buildings sector more energy efficient
Effective policies play a pivotal role in improving energy efficiency in buildings. While the level of implementation varies among countries, governments have been introducing relevant policy actions – e.g. Singapore has been enforcing a mandatory building energy code for residential and non-residential buildings for almost a decade.
As for building energy codes and standards, there remains a lack of mandatory energy efficiency requirements across the region. Governments often introduce such policies either on a voluntary basis or for specific building types, with the intention of allowing the industry to adapt and with the vision to expand the scope and increase the stringency of requirements in the future. The market for green building certification is growing across the region, with several national and international certification and rating programmes currently in use.
There are ongoing efforts within Southeast Asia to harmonise MEPS for appliances and equipment, which could further enable energy efficiency improvements in the buildings sector. As space cooling is one of the fastest growing sectors, MEPS in this sector are particularly important. Most countries in the region have already introduced mandatory MEPS for air-conditioners, but it is important that these MEPS are regularly updated to increase the stringency of their requirements and to ensure that they are supported by other policies, like labelling.
To support policy makers in developing and enforcing energy efficiency policies in buildings, the IEA in collaboration with the ASEAN Secretariat, Energy Efficiency Subsector and Conservation Network and the ASEAN Centre for Energy, published in 2022 the Roadmap for Energy-Efficient Buildings and Construction and the Roadmap towards Sustainable and Energy-Efficient Space Cooling. These Roadmaps outline milestones for the short-, mid- and long-term, and provide key components for a policy package for net zero carbon buildings (NZC) and cooling. The IEA is also analysing the opportunities for digitalisation to enhance the buildings sector’s energy efficiency and demand side flexibility in Southeast Asia.
Some countries have already embarked on a journey towards NZC buildings. In November 2021, the Malaysia GBC Carbon Score (MCS) initiative was launched, providing a comprehensive assessment protocol to measure operational and embodied GHG emissions associated with new and existing buildings. At the regional level, a new Zero Energy Building category was added to the ASEAN Energy Awards that provides a platform for raising awareness on energy efficient best-practices and private sector engagement. Such actions can give the market important signals to accelerate decarbonisation of the built environment, which are essential for the region to get on track for the SDS.

Southeast Asia Energy Outlook 2022
PAGE | 67
Energy prospects
Electricity demand: electricity grows in importance in all scenarios, more than doubling its levels in both the STEPS and SDS…
Drivers of change in electricity demand (left chart) and total electricity demand and its share in TFC (right chart) in the Stated Policies and Sustainable Development Scenarios, 2020-2050
IEA. All rights reserved.
Note: TFC = total final consumption.
-1 000
- 500
0
500
1 000
1 500
STEPS SDS STEPS SDS STEPS SDS STEPS SDS
TWh
Activity Access Electrification Efficiency Net change
Hydrogenproduction
TransportIndustryBuldings
10%
20%
30%
40%
750
1 500
2 250
3 000
2020 2050STEPS
2050SDS
TWh
Industry TransportBuildings Hydrogen productionOther Share of electricity in
TFC (right axis)

Southeast Asia Energy Outlook 2022
PAGE | 68
Energy prospects
...but the underlying drivers of electricity demand growth differ by scenario
In both scenarios, the demand for electricity in Southeast Asia grows at a rate of 3% per year, with electricity capturing over a quarter of total final consumption by the year 2050. It will continue to grow rapidly, by nearly 260% in STEPS and 280% in SDS by the year 2050. While demand growth under both scenarios is within the same order of magnitude, the drivers are quite different. Increased demand from the buildings and industry sectors underpins demand growth in the STEPS. Increased appliance ownership and uptake of ACs are the main factors behind the rise in demand in buildings. Together with higher industrial activity, they add over 400 TWh to today’s electricity demand by the year 2050.
In the SDS, these drivers are joined by increased electrification of end-use sectors, notably for transport. However, improved energy efficiency offsets a large portion of that growth. In the SDS, overall demand grows by over 1 500 TWh by 2050, an amount greater than today’s electricity demand in India. Industrial demand accounts for 35% of that demand growth, followed by transport and buildings with 29% each.
In the SDS, the buildings sector accounts for about 350 TWh of overall demand growth. This increase would have been much higher without energy efficiency improvements that avoid around 70% of the potential rise. A combination of reformed building standards, information measures and direct funding are a pre-requisite towards
achieving those savings and reducing household bills and carbon footprints.
Electrification of the transport and industry sectors is a profoundly important trend in the SDS. The share of electricity in TFC doubles in comparison to today’s levels and reaches 37% in the SDS (in the NZE Scenario, the global share of electricity expands to almost 50% by 2050). The electrification of transport leads to an increase of 490 TWh in electricity demand – an amount almost equal to current electricity demand in Brazil. Electric vehicles reach nearly 50% of total vehicle sales by 2030 and almost 95% by 2050. In the industrial sector, electrification in the SDS adds another 330 TWh by 2050, led by the iron and steel industries in which electricity demand triples from current levels. Hydrogen demand,lthough modest compared to what it is in other parts of the world, adds another 100 TWh by 2050 in the SDS.
Smart electrification of end-use sectors and the uptake of hydrogen in the SDS present new opportunities to contribute to the stability and reliability of the electricity system, with demand response contributing to nearly a quarter of the flexibility in high demand hours by the year 2050.

Southeast Asia Energy Outlook 2022
PAGE | 69
Energy prospects
Electricity supply: meeting rising demand while bringing down emissions will require a major additional push to deploy a range of renewable technologies
Electricity generation and emissions in the Stated Policies Scenario and Sustainable Development Scenario, 2010-2050
IEA. All rights reserved.
Note: “Other low emissions” includes nuclear, CCUS and other forms of renewables.
750
1 500
2 250
3 000
2010 2020 2030 2040 2050
TWh
Unabated coal Unabated natural gas Oil Ammonia Hydro Bioenergy
Geothermal Solar PV Wind Other low emissions Emissions (right axis)
Stated Policies Scenario
250
500
750
1 000
2010 2020 2030 2040 2050
Mt C
O2
Sustainable Development Scenario

Southeast Asia Energy Outlook 2022
PAGE | 70
Energy prospects
A secure low emissions transformation of the power sector is a first-order challenge and responsibility for the region’s policy makers
Demand growth and a steep rise in coal use have led to a tripling of electricity emissions in Southeast Asia over the last two decades. The power sector now accounts for more than 40% of the region’s energy-related emissions. Trajectories for generation and emissions vary substantially across the STEPS and SDS. In the STEPS, emissions more than double by 2050 as unabated fossil fuel generation keeps growing. Conversely, in the SDS, emissions peak as early as 2024, coincident with the peak of unabated coal-fired generation. By 2050, emissions fall by over 50% as the share of unabated fossil fuels in generation falls to 5%.
Unabated fossil fuels currently account for three-quarters of total generation, the majority coming from coal. Moving to 2050 in the STEPS, this share falls to 60%, split nearly evenly between coal and natural gas. Unabated coal-fired generation continues to increase until the end of the 2040s, with some replacement of subcritical coal plants with high-efficiency designs such as ultra-supercritical and integrated gasification combined cycle (IGCC).
Coal-fired power is coming under increasing pressure in the long term, with decisions to move ahead with new plants drying up, and financing becoming more difficult to obtain. In the run-up to COP26, the countries of Southeast Asia, including Indonesia and the Philippines, announced that no new unabated coal-fired power plants will receive a green light beyond those already approved, and Viet
Nam has signalled its intention to phase out unabated coal by 2050. However, even if few new plants are added to the mix, there are still nearly 90 GW of existing coal-fired plants, many of which are still relatively new and which would, under typical circumstances, have substantial operating lifetimes ahead of them. Currently, there is about 18 GW of coal-fired power under construction and the existing fleet has an average age of about ten years.
In the SDS, unabated coal-fired generation peaks before 2025 at a level of 500 TWh, and is gradually phased out by 2050 (in the NZE Scenario, unabated coal-fired generation is phased out globally by 2040). Of the current 87 GW of coal capacity, over 26 GW retires earlier in the SDS than in the STEPS; the modalities that can underpin unabated coal phase-out, including financing and social aspects, are critical and will be considered in detail in forthcoming IEA analysis. Alongside early retirements, some capacity is re-purposed to provide flexibility or is retrofitted to bring down coal emissions while maintaining electricity security. High potential options include co-firing using ammonia and retrofitting plants with CCUS – the two reach an installed capacity of about 50GW by 2050 in the SDS – equivalent to today’s hydropower capacity in the region. Where coal plants are retired, there are opportunities to take advantage of existing grid connections to deploy lower-emissions sources of electricity generation.

Southeast Asia Energy Outlook 2022
PAGE | 71
Energy prospects
Rapid deployment of renewables, alongside some coal-to-gas switching, kick-starts the transition away from coal-fired electricity
The countries of Southeast Asia benefit from a diverse range of renewable electricity options, including hydropower, wind, solar PV, bioenergy and geothermal. Renewables currently account for nearly a quarter of total generation, the majority coming from hydropower. In the STEPS, the share of renewables steadily rises until it reaches nearly 40% by 2050. In the SDS, additional efforts are needed to accelerate the deployment of renewables, which collectively reach 85% of electricity generation by 2050 (in the NZE Scenario, renewables account for nearly 90% of global electricity generation in 2050). To achieve a level of 85% in 2050, countries need to deploy 1 100 GW of renewable capacity in the next 30 years – this is equivalent to the total renewable capacity of China and India combined today. The countries of Southeast Asia have set renewable generation or capacity targets, aspiring to achieve 35% renewable electricity capacity by 2025. This target is met ahead of schedule in the SDS, but is met a few years later with the current market and policy settings.
The amount of solar PV and wind generation varies within the region, with some countries like Thailand and Viet Nam benefitting from the scope to deploy utility scale installations. Most countries, however, rely more on distributed resources. This is due to the combination of land and population density constraints, and renewables support/incentive structure. In recent years, efforts have been made
to boost solar PV and wind deployment through strong policy support such as feed-in tariffs (FiTs) and open tenders (for example, the Large Scale Solar [LSS] competitive bidding programme in Malaysia). Extending the scale of support mechanisms such as competitive auctions and FiTs, the governments could help boost solar PV and wind uptake. In the STEPS, solar PV and wind increase their share in total generation from 2% in 2020 to 8% in 2030 and 19% in 2050. This level requires over 10 GW deployed every year on average, of which three-quarters is solar PV.
Alongside rapid deployment of renewables, natural gas plays an important role in enabling the switch away from coal. In 2020, natural gas accounted for nearly a third of the total electricity generation in Southeast Asia. In the STEPS, the share of natural gas stays broadly constant to 2050, but with generation levels that more than double in parallel with electricity demand. In the SDS, natural gas replaces coal as the largest source of electricity in the mid-2020s, but its share of the total begins to decrease by the mid-2030s. Thereafter, gas-fired generation levels decline with capacity factors falling from their 50% peak in the mid-2030s to about 10% by 2050 – leading to its share of generation falling to 5%. This signals the changing role of gas from bulk generation to supporting the integration of variable renewables through the provision of different system services to support electricity security.

Southeast Asia Energy Outlook 2022
PAGE | 72
Energy prospects
Electrical capacity more than triples by 2050, with renewables accounting for the bulk of new capacity in all scenarios, and almost all of the new capacity in the SDS
Change in electricity capacity in the Stated Policies Scenario and Sustainable Development Scenario, 2020 to 2050
IEA. All rights reserved.
Note: “Other low emissions” includes nuclear, CCUS and other forms of renewables.
300
600
900
1 200
1 500
2020 2050STEPS
2020 2050SDS
GW
Unabated coal Unabated natural gas Oil Ammonia Hydro Geothermal Solar PV Wind Batteries Other low emissions

Southeast Asia Energy Outlook 2022
PAGE | 73
Energy prospects
The integration of variable renewables requires a variety of low-emissions solutions and is pivotal for a reliable and orderly transition
In the SDS, the share of wind and solar PV in electricity generation reaches 18% in 2030 and 44% in 2050. More than 25 GW of solar PV and wind capacity is added on average every year to 2050 – this is similar to total capacity that has been installed to date in the region. Annual solar PV capacity additions exceed 20 GW in the mid-2030s, compared with 12 GW in 2020, mostly led by a surge in Viet Nam as a result of the expected expiry of an existing FiT scheme. Wind generation, due to its different generation pattern, complements solar PV and makes up a fifth of electricity generation by 2050 in the SDS. The north-eastern part of the region has a strong resource potential, with Viet Nam spearheading wind deployment with plans to reach 36 GW of offshore wind capacity by 2045. The implications of operating systems with high shares of variable renewables are discussed in the next chapter.
Hydropower remains the largest source of renewable electricity in both the STEPS and SDS to 2050. In 2020, hydropower generated 15% of electricity in the region, with 6 GW of new capacity added, mostly in Lao PDR that has export contracts in place to neighbouring regions. Additional projects and ambitious targets for the next decade further increase hydropower, largely financed through China’s Belt and Road Initiative. However, the share of hydropower generation falls to 12% by 2050 in the STEPS as electricity demand growth is larger. In the SDS, hydropower gathers momentum with its share rising to 26% by 2050. Such an increase requires a nearly fivefold
increase in hydropower capacity by 2050. Other energy sources such as geothermal and bioenergy are abundant in parts of Southeast Asia but their deployment has been slower. The share of geothermal and bioenergy generation is currently at about 6% and increases to about 8% by 2050 in the STEPS and 16% in the SDS. Stronger policy support to those sources would be required to further tap their potential, as well as controlling social and environmental impacts.
The countries of Southeast Asia are well placed to integrate large shares of variable renewables due to rich hydro resource potential. However, geography and network bottlenecks require supplemental low emissions solutions, as well as a supporting regulatory framework. In the SDS, 54 GW of coal plants co-fired with ammonia or retrofitted with CCUS provide reserve and stability services. Storage, networks and demand response are also key to tap more of the variable renewables’ potential. In the SDS, 45 GW of battery storage capacity is in operation by 2050, which alongside tripling the length of the electricity network, provides the conditions necessary to integrate large shares of variable renewables. Enhanced interconnectivity between the countries enables them to take advantage of the diverse renewables dispersed across the region and brings substantial benefits as explored in next the chapter. In addition, demand response could provide up to a quarter of flexibility needs, helping to shift demand to periods when the output of variable renewables is high and away from it when it is low.

Southeast Asia Energy Outlook 2022
PAGE | 74
Energy prospects
Oil: consumption grows robustly over the next decade, but there is a major divergence between the scenarios after 2030
Changes in oil demand by sector and product, 2020-2050
-3
-2
-1
0
1
2
STEPS SDS STEPS SDS
mb/
d
Road transport Other transport PetrochemicalsOther industry Buildings PowerOther
By sector
2020-30 2030-50STEPS SDS STEPS SDS
LPG/Methane Naphtha GasolineDiesel Kerosene Fuel oilOthers
By product
2020-30 2030-50
IEA. All rights reserved.
Note: Other includes agriculture, energy sector own use and non-energy uses apart from petrochemical feedstock.

Southeast Asia Energy Outlook 2022
PAGE | 75
Energy prospects
In the SDS, stronger fuel economy standards, the uptake of electric vehicles and policies to tackle plastic waste bend the oil demand curve down after 2030
While recent high crude oil prices have cast a shadow of uncertainty, the global market is stabilised in the STEPS and oil demand in Southeast Asia continues to grow rapidly to 2030. Oil use rises by 40% to 6.6 mb/d by 2030 – a rate of increase that is exceeded only by India and Africa – primarily due to transport demand. A combination of rapidly growing conventional vehicle sales across all vehicle types (passenger cars, trucks, two/three-wheelers) and relatively limited penetration of electric car sales (around 6% in 2030) makes road transport the largest contributor to oil demand growth. The lack of widespread fuel efficiency standards for vehicles also poses upward pressure on oil demand. Rising demand for petrochemical feedstock is another major force – especially for naphtha – as the region’s steam cracking facilities are mostly configured to process this product.
In the SDS, oil demand continues to increase by 20% through to 2030, but stronger fuel efficiency standards, electrification and expanded mass transit infrastructure begin to dampen oil demand growth after that. Sales of electric cars begin to outpace the sale of conventional cars from around 2030. The share of electric cars in the number of cars on the road reaches 75% by 2050 and this cuts oil demand that year by 0.8 mb/d (including electric two/three-wheelers).
The average fuel economy of road vehicles in 2050 is around half the level in the STEPS, curbing demand by an additional 0.5 mb/d in 2050.
There is also a growing role for electric trucks (initially for light-duty segments) and buses. In the SDS, one in three trucks sold in the region in 2050 is electric (in the NZE Scenario, half of heavy truck sales globally are electric in 2035). The improvement in fuel efficiency and the uptake of biofuels also play a major role in displacing oil use in trucks. As a result, road transport becomes a major factor in putting the overall oil demand trajectory on a downward path, with demand declining by 1.7 mb/d between 2030 and 2050.
Oil demand for petrochemicals stays flat after 2030 in the SDS, helped by effective and widespread plastic collection and recycling policies. It is estimated that some 75% of the material value of plastics is being lost today, resulting in USD 6 billion of wasted economic opportunities every year. The region also suffers from large quantities of plastic waste ending up in the ocean. In 2021, countries in Southeast Asia adopted a joint action plan to phase out single-use plastics and harmonise policies on recycling and packaging standards. The implementation of these plans reins in the growth of oil demand for petrochemicals in this scenario.

Southeast Asia Energy Outlook 2022
PAGE | 76
Energy prospects
A structural decline in oil production puts the region on track for a sharp increase in oil imports
Oil production and imports, 2015-2050
IEA. All rights reserved.
Note: Import dependency = net oil imports divided by demand including international bunkers.
50%
60%
70%
80%
90%
100%
0.5
1.0
1.5
2.0
2.5
2015 2020 STEPS SDS STEPS SDS
mb/
d
Indonesia Brunei MalaysiaThailand Viet Nam OthersImport dependency
Oil production and import dependency
2030 2050- 10
- 8
- 6
- 4
- 2
2015 2020 STEPS SDS STEPS SDS
mb/
dOil products Crude oil
Oil net trade by type
2030 2050
(right axis)

Southeast Asia Energy Outlook 2022
PAGE | 77
Energy prospects
Efforts to promote fuel efficiency, electrification and plastic recycling can help moderate the pace of growing import dependency
Oil production in Southeast Asia has been on the decline since 2000 and continues to decline by a third to 1.4 mb/d by 2030 in the STEPS. Alongside supply chain and staffing disruptions associated with the pandemic, a major drop in sanctioned crude oil volumes since the mid-2010s weighs on production levels, further pressured by high decline rates at mature fields. In Indonesia, though a few projects have been sanctioned in recent years, they are not sufficient to stem the declines from major producing fields such as Duri and Minas. Malaysia faces a similar outlook as output from its large fields such as the Gumusut-Kakap begins to slide and new projects are not sufficient to compensate for the decline. The two countries nevertheless remain the top producers in the region, accounting for more than two-thirds of the output over the projection period. In the SDS, the weakened environment for new investment and the slowing pace of demand growth accelerate the output declines. As a result, oil production falls considerably from over 2 mb/d today to 0.4 mb/d by 2050.
Growing oil demand and structural production declines put the region’s oil imports on a continued growth trajectory. In the STEPS, the region’s import requirements double to 7 mb/d by 2030, raising import dependency from around 60% today to over 80%. The reliance
on imports remains similarly high in the SDS though the absolute import volumes are smaller and start to decline after 2030.
Today, Southeast Asia is a net importer of oil products as the region’s refining capacity additions have not kept up with the pace of demand growth. In both STEPS and SDS, refinery runs grow at one of the fastest rates in the world over the period to 2030, supported by several planned capacity additions such as the 280 kb/d expansion project in Brunei Darussalam. While helping to constrain an increase in product import volumes, this raises the need for crude oil imports, a large part of which is likely to come from the Middle East, via major chokepoints such as the Straits of Hormuz and Malacca, raising concerns around energy security.
With domestic upstream prospects uncertain, demand-side actions become the key to alleviate import dependence: these include a push for electric mobility, efficiency and recycling. These measures, as reflected in the SDS, reduce the absolute amount of oil import bills USD 80 billion by 2030 and more than USD 200 billion by 2050 compared to the STEPS. While this helps make the region’s economy less vulnerable to global oil-supply disruptions, security concerns do not vanish even in this scenario, and a broad and sustained approach to fuel security is required.

Southeast Asia Energy Outlook 2022
PAGE | 78
Energy prospects
Natural gas: uncertainty over the long-term trajectory has been exacerbated by today’s market turbulence
Natural gas demand change with breakdown by country and sector
IEA. All rights reserved.
Note: Other includes transport, agriculture and other non-energy use and other energy sector (i.e. use of energy by transformation industries and losses).
-150
-100
-50
0
50
100
150
2000-10
2010-20
STEPS SDS STEPS SDS
bcm
By country
Other Indonesia Viet Nam Thailand Malaysia
2020-30 2030-502000-10
2010-20
STEPS SDS STEPS SDS
By sector
Other Power Buildings Industry
2020-30 2030-50
Southeast Asia Energy Outlook 2022
PAGE | 79
Energy prospects
A mixed picture for gas demand, whether looking back or looking forward
Natural gas has seen mixed fortunes in Southeast Asia over the past two decades. From 2000 to 2010, gas satisfied one-third of total energy demand growth in the region, on par with the share taken by coal. Since 2010, however, coal has gained the upper hand, eclipsing gas as the dominant means of generating electricity in 2017, and satisfying 40% of the region’s industrial energy demand from 2010 to 2020, compared with 15% for natural gas.
Slowing gas demand growth – particularly since 2014 – has been a consequence of plateauing domestic production and the weakened competitiveness versus coal and renewables in the power sector. The Covid-19 pandemic caused a 4.5% decline in demand in the region in 2020, compared to a less than 2% drop globally.
Indonesia and Thailand led the growth in demand from 2000 to 2010, accounting for over 50% of the increase. This was underpinned by strong production growth in these two countries (which also represented around 50% of the region’s output growth). The picture changed after 2010 when domestic production in Indonesia declined by around 30%, accompanying a 10% decline in consumption to 2020. In Thailand, production declined by about 10%, but gas demand kept increasing, albeit at a slower pace.
The rapid rise in natural gas prices since the end of 2021 – accentuated by Russia’s invasion of Ukraine in February 2022 – has shaken confidence in the ability of countries to import gas at
affordable prices. Yet, if global gas balances stabilise, there are reasons to expect renewed growth in gas use in Southeast Asia. Gas use increases by 40% between 2020 and 2030 in both the STEPS and SDS, similar to the pace of growth seen in the 2000s. Industry and power generation cover more than 80% of the growth. There remain significant opportunities to use natural gas in place of oil and biomass as a source of process heat in light industry and manufacturing. The high level of projected growth in electricity demand underpins a 4% annual increase in gas use in power between 2020 and 2030 in the STEPS, faster than the rate of growth in coal use. In the SDS, the growth rate of gas use for electricity is only marginally lower, as the potential decline in gas due to the acceleration of renewables is offset by a faster reduction in coal consumption.
In the STEPS, gas demand continues to increase after 2030, almost doubling today’s levels by 2050, with the power and industrial sectors still representing the lion’s share of the gas growth. By contrast, the SDS sees a peak in gas demand before 2040 and a steady decline thereafter. A gas-to-renewables switch in the power sector covers more than 25% of the reduction in emissions from natural gas between the STEPS and SDS from 2030 to 2050. In the industry sector, growing activity is offset by efficiency improvements, resulting in a slight decline between 2030 and 2050.

Southeast Asia Energy Outlook 2022
PAGE | 80
Energy prospects
Southeast Asia is on the cusp of becoming a net importer of natural gas
Natural gas demand and production and net natural gas trade
IEA. All rights reserved.
Note: In the chart on the right side, positive values are production and negative values are demand; for net trade, positive values are exported volumes and negative values are imported volumes.
100
200
300
400
2010 2015 2020 2025 2030 2035 2040 2045 2050
bcm
Demand Production
STEPS
SDS
-400
-200
0
200
400
2020 STEPS SDS STEPS SDSbc
m Other
Viet Nam
Thailand
Malaysia
Indonesia
Net trade
2030 2050Pr
oduc
tion
Dem
and

Southeast Asia Energy Outlook 2022
PAGE | 81
Energy prospects
Near-term growth in the region’s natural gas output falls short of rising demand, increasing the call on LNG markets
Natural gas production is projected to remain broadly flat in both scenarios between 2020 and 2030, in a range between 190-210 bcm. In the STEPS, production grows by almost 50 bcm between 2030 and 2050. Indonesia accounts for most of the growth in the STEPS as new resource developments broadly keep pace with demand. Malaysia also adds to the regional balance, but Thailand’s gas output is reduced by more than 75%, down to 6 bcm, in 2050. In the SDS, weaker gas prices and declining demand accelerate production decreases across all Southeast Asian countries, and production ends up 94 bcm lower in 2050 compared to 2020 levels.
Southeast Asia as a whole is projected to become a net gas importer by 2025 in both the STEPS and the SDS (five years earlier than projected in the Southeast Asia Energy Outlook 2019). With limited prospects for pipeline interconnections (and with Indonesia recently announcing a halt to pipeline exports to Singapore), LNG is likely to become the dominant source to meet gas demand growth. In the STEPS, LNG imports expand from 13 bcm in 2020 to 128 bcm by 2050. This is a major turnaround for a region that has been home to some of the major LNG exporting countries – Malaysia, Indonesia and Brunei – which together have accounted for more than 10% of the total volume of global LNG exports.
The turn towards imports has however proven challenging. Southeast Asia has LNG import terminal projects, of which capacity is 50 million
tonnes per annum (mtpa) in total. Many are to be commissioned in order to compensate for the depletion of domestic gas fields (as in Myanmar and Thailand) or as a first foray into global gas markets (as in the case of Viet Nam and the Philippines). However, several projects have been shelved or delayed, largely due to permitting and regulatory hurdles or difficult market conditions. In places such as the Philippines or Viet Nam, LNG ambitions hinge on navigating the complex commercial and financial structures needed to underpin LNG-to-power projects. In addition, buyers are likely to face tough competition in the LNG market with Europe, which is looking to rapidly phase out Russian gas imports, and Northeast Asia, which has been traditionally willing to pay a premium and sign longer-term contracts to ensure the availability of imports (see chapter on energy perspectives).
The projections in the STEPS and SDS rely on a reversion to gas prices ranging between 7 and 10 USD per million British thermal units (USD/MBtu) over the next decade. As such, there are downside risks to demand if the natural gas prices seen in 2021 and to date in 2022 are sustained over a longer period (e.g. Indonesian consumers pay regulated gas prices in the order of 3-6 USD/MBtu). In the STEPS, the net trade balance for gas is expected to decline from a USD 10 billion surplus in 2020 to a deficit of USD 10 billion by 2030, eventually ballooning to a USD 32 billion deficit by 2050. In the SDS, import bills after 2030 begin to plateau at an average value of USD 7 billion.

Southeast Asia Energy Outlook 2022
PAGE | 82
Energy prospects
Coal: contrasting positions between Indonesia, the world’s largest exporter of thermal coal, and import-reliant Viet Nam, Malaysia, Thailand and the Philippines
Coal demand, production and net trade between 2020 and 2050 in the Stated Policies Scenario and Sustained Development Scenario
IEA. All rights reserved.
Stated Policies Scenario Sustainable Development Scenario
- 600
- 400
- 200
0
200
400
600
2020
mtc
e
Indonesia Viet Nam Other ASEAN countries net trade (excl. Indonesia) Indonesia's net trade
2030 2040 20502030 2040 2050
Historical
Dem
and
Prod
uctio
n

Southeast Asia Energy Outlook 2022
PAGE | 83
Energy prospects
Coal: how fast will the policy headwinds blow?
Coal has grown in importance across Southeast Asia over the past decade but faces an increasingly uncertain outlook, threatened by growing policy headwinds as governments take on increasingly stringent climate goals, as well as increasingly competitive renewable options in the power sector. Despite the pandemic, coal demand set a new record of 257 million tonnes of coal equivalent (Mtce) in 2020.
In the STEPS, while demand growth slows, coal continues to play an important role in regional energy balances, reaching 340 Mtce in 2030 and 390 Mtce in 2050. In stark contrast, the SDS sees demand decline to 210 Mtce in 2030 and 80 Mtce in 2050. In the power sector, renewables and gas-fired generation replace coal. In the industry sector, demand is reduced by coal-to-gas fuel switching and efficiency improvements.
From a supply-side perspective, nearly 90% of Southeast Asia’s production comes from Indonesia, the third largest coal producer in the world, followed by Viet Nam. About half of the coal produced in Southeast Asia is consumed domestically, with the rest being exported mainly to China and India. Future trends in coal production in this region depend strongly on the outlook for Indonesia.
In the STEPS, production gradually falls over the next decades. Between 2020 and 2050, it decreases by about 40 Mtce from 480 Mtce, reflecting recent efforts by China and India to further reduce
coal imports. Domestic policies naturally affect the region’s exports, e.g. efforts by Indonesia in early 2022 to prioritise domestic deliveries over exports. In the SDS, production plunges to 150 Mtce in 2050, a production drop eight times larger than in the STEPS.
Dwindling export opportunities mean that Indonesia’s coal net trade balance deteriorates over the coming decades, with associated revenues declining from about USD 23 billion in 2020 to about USD 16 billion in 2050 in the STEPS. In the SDS, revenues fall by another USD 9 billion in 2050.
Countries relying on coal to satisfy their growing energy needs have to reconcile long-term sustainable objectives with short-term energy security and affordability goals, while addressing the social consequences of change. The recent wave of net zero pledges and announcements of “no new coal” and “no more funding for overseas coal projects” clearly point towards a declining future for coal. The task for governments is to ensure that the energy services provided by unabated coal – including not only power but also key industrial outputs like cement, iron and steel – are met affordably, reliably and securely in other ways. This means scaling up alternative fuels and technologies, demand-side measures and efforts to curb emissions via CCUS and co-firing with ammonia. This topic will be examined further in future IEA analyses.

Southeast Asia Energy Outlook 2022
PAGE | 84
Energy prospects
Implications

Southeast Asia Energy Outlook 2022
PAGE | 85
Energy prospects
Energy imports: Southeast Asia faces huge payments and energy security challenges from rising fossil fuel imports, led by oil
Fossil fuel trade balance in Southeast Asia, by scenario, 2000-2050
IEA. All rights reserved.
-400
-300
-200
-100
0
100
2000 2005 2010 2015 2020 2025 2030 2035 2040 2045 2050
Billio
n U
SD (2
020) Oil
Coal
Gas
STEPS
SDS
Historical
Import bill (STEPS)
Total net trade

Southeast Asia Energy Outlook 2022
PAGE | 86
Energy prospects
Energy security concerns reinforce the case for rapid energy transitions
Russia’s invasion of Ukraine has been a strong reminder of the importance of energy security. In the STEPS, rapidly growing fuel demands raise concerns about increasing the dependency on imports which could render the economy more vulnerable to fuel supply disruptions outside the region. In the SDS, import dependency is reduced, but this does not guarantee immunity from energy security hazards, including the risk of investment imbalances or bottlenecks in the availability of critical minerals (see next chapter).
In the early 2000s, Southeast Asia was a net exporter of fossil fuels, but the cost of rising oil imports now more than offsets the revenue from exports of coal and gas. The average import bill over the past decade has stood at about USD 43 billion or 1.7% of GDP. In the STEPS, this vulnerability is exacerbated by rising imports, especially of oil. The energy import bill rises to about USD 190 billion by 2030, which is equivalent to almost 4% of the region’s GDP (and this assumes that oil and natural gas prices drop significantly from the very high levels seen in 2021 and so far in 2022). The import bill
continues to rise after 2030, albeit at a slightly slower pace, but exceeds USD 300 billion by 2050. In the SDS, the import bill is considerably smaller, peaking at the beginning of the 2030s below USD 120 billion and declining to USD 80 billion in 2050.
The expansion of imports is not accompanied by a diversification in the sources of supply. Given the low costs of oil production in the Middle East and relative proximity to the Southeast Asian market, the Middle East reinforces its position as the predominant supplier to importers in this region – not only in STEPS but also in SDS. This means Southeast Asia is exposed to even larger risks arising from physical or geopolitical events in the Middle East or accidents near trade chokepoints.
Considering the dynamically growing economies in Southeast Asia, securing reliable energy supply chains is a critical issue for the region’s prosperity: energy security must be considered as a high priority whichever scenario the region is in.

Southeast Asia Energy Outlook 2022
PAGE | 87
Energy prospects
CO2 emissions: much stronger policy action will be essential to put the region on track for carbon neutrality
CO2 emissions with intensity and share of electricity in selected sectors, Sustainable Development Scenario, 2020-2050
IEA. All rights reserved.
Note: CO2 intensity = the amount of CO2 emitted per unit of electricity generated (kWh) (power sector) or energy consumed (MJ) (industry and road transport sector). CO2 intensities in road transport and industry do not include CO2 emissions released from the electricity consumed in these sectors.
25
50
75
100
125
20%
40%
60%
80%
100%
2020 2030 2050D
eman
d sh
are
of e
lect
ricity
Road transport IndustryRoad transport IndustryPower generation
CO2 intensity(Right axis)
Electricity share
CO2 intensity and share of electricity in selected sectors, SDS
CO
2in
tens
ity (y
ear 2
020
= 10
0)
0
500
1 000
1 500
2 000
2020 2030 2050
Coal power generation Gas power generation Other (power)
Road transport Industry Other (non-power)
Power emissions
Non-power emissions
Mt C
O2
CO2 emissions from selected sectors, SDS

Southeast Asia Energy Outlook 2022
PAGE | 88
Energy prospects
The power sector has to lead emissions reductions, but the harder task is to bring down emissions from all parts of the transport and industry sectors
In Southeast Asia, 40% of the emissions in 2020 came from power generation, followed by industry (29%) and road transport (18%). As the industry sector consumes 40% of electricity, this sector accounts for more than 40% of total emissions if indirect power emissions are included. The SDS shows a pathway for these sectors to reduce the emissions in the decades to come, while the NZE Scenario provides a global framing for ambitious policy actions.
In the power sector, coal-fired plants alone account for 30% of total energy-related emissions in this region, followed by gas-fired plants (10%). In the industry sector, the largest direct sources are coal use in the cement industry (7% of all energy-related emissions) and oil use for manufacturing (3%). In the road transport sector, emissions from passenger vehicles and two/three-wheelers account for 7% and 3% of total emissions, respectively. Heavy-duty trucks account for 6%. Other sectors include fossil fuel use in buildings, navigation and aviation.
In the 2020s, a key indicator of progress is the CO2 emissions intensity of power generation. With rising deployment of renewables, the emissions intensity of electricity generation falls by 40% to 2030 in the SDS. However, the absolute amount of emissions falls by only 10% as demand increases substantially during the same period. For non-power emissions, there is a 16% improvement to 2030 in the emissions intensity of industrial energy use, driven by efficiency
improvements and coal-to-gas switching, but a slower pace in transport.
An accelerating pace of transition from 2030 onwards is seen first and foremost in the power sector, as unabated coal-fired plants are retired, repurposed or retrofitted and gas-fired plants change their role from bulk generation to supporting the integration of renewables. As a result, the emissions intensity of power generation in 2050 falls by more than 95% compared with today, and power accounts for only 10% of total CO2 emissions in 2050. Clean electricity helps to bring down industry and road transport emissions as well, underpinned by electrification of industrial processes and a share of EVs in the passenger vehicle stock that approaches 90% by mid-century.
Some sectors are difficult to electrify and these account for a rising share of total emissions; in 2050, direct emissions from industry account for half of total emissions in the region. The iron and steel industry becomes the single largest emissions source in industry, accounting for 7% of total emissions. Heavy-duty trucks account for 55% of the emissions from road transport, equivalent to 14% of total emissions. Alongside clean electricity, low carbon fuels, including the use of bioenergy, hydrogen and hydrogen-based fuels, are key in attaining the full and far-reaching decarbonisation of Southeast Asia (see next chapter).

Southeast Asia Energy Outlook 2022
PAGE | 89
Energy prospects
Air quality: a vital co-benefit of strong climate action
Change in air pollutant emissions from combustion activities by fuel and scenario in Southeast Asia relative to 2020
IEA. All rights reserved.
-100%
-75%
-50%
-25%
0%
25%
50%
75%
STEPS SDS STEPS SDS STEPS SDS STEPS SDS STEPS SDS STEPS SDS
Bioenergy
Gas
Oil
Coal
2030 2050 2030 2050 2030 2050
Sulphur dioxide Nitrogen oxides PM2.5

Southeast Asia Energy Outlook 2022
PAGE | 90
Energy prospects
Combustion of coal for power generation and of oil for transport, as well as the continued use of biomass for cooking are major sources of air pollution in Southeast Asia
Several countries in Southeast Asia have established air quality standards that comply with World Health Organization guidelines. Yet enforcement is limited and the recommended concentration limits are often exceeded. In 2020, Southeast Asia experienced around 450 000 premature deaths associated with the adverse effects of air pollution, with significant economic costs.
In the STEPS, the strong position of fossil fuels in the energy mix and relatively weak pollution controls lead to a strong rise in emissions of two major air pollutants, sulphur dioxide (SO2) and nitrogen oxides (NOX). SO2 emissions increase by 13% to 2030 due to expanding coal use in power generation and the sparse deployment of sulphur removal technologies. Emissions of NOX also increase by almost 30% over the period, resulting from the increases in oil use in transport. Fine particulate matter (PM2.5) emissions fall by 12% by 2030, reflecting reductions in the traditional use of solid biomass as cooking fuel. But the damaging effects of the reliance on solid biomass remain acute in some countries, especially in Lao PDR, Myanmar and Cambodia.
Affordability is a significant issue: solid biomass is often free, except for the time spent gathering it, while even the cheapest improved cookstoves can cost a poor household several weeks of income. The pandemic further diminished the ability of many to pay for modern
fuels and to travel to liquefied petroleum gas (LPG) refilling stations during lockdowns, and more time spent at home increased exposure to air pollution and the associated health risks.
As a consequence, the STEPS sees the numbers of premature deaths from indoor and ambient air pollution in Southeast Asia rising to more than half a million per year by 2030. Air pollution also leads to multiple serious diseases, placing an extra burden on healthcare systems dealing with the Covid-19 pandemic.
In the SDS, despite a modest rise in energy demand, rapid cuts in all major air pollutants are achieved. SO2 emissions are halved by 2030 compared with 2020, and NOX emissions are down by 15%. Reduced coal in electricity generation is the single largest contributor to the reduction in SO2 emissions, while electrification of road transport reduces NOX emissions the most. The largest improvement can be seen in PM2.5 emissions, which are reduced by two-thirds in the SDS, brought about by a variety of technologies that end the harmful use of solid fuels for cooking and reduce greenhouse gas (GHG) emissions and other climate-forcing agents (e.g. black carbon). This dramatically improves human health prospects; premature deaths linked to outdoor and household air pollution together are reduced by half compared to the situation in the STEPS.

Southeast Asia Energy Outlook 2022
PAGE | 91
Energy Perspectives
Southeast Asia’s Energy Perspectives

Southeast Asia Energy Outlook 2022
PAGE | 92
Energy Perspectives
Investment for clean energy transitions

Southeast Asia Energy Outlook 2022
PAGE | 93
Energy Perspectives
Annual clean energy investment has never exceeded USD 30 billion but must rise by a factor of five this decade to get on track for the SDS
Clean energy investment in Southeast Asia (left) and energy investment by region as a share of GDP (right), 2015-2030
IEA. All rights reserved.
Notes: STEPS = Stated Policies Scenario; SDS = Sustainable Development Scenario. Low emissions fuels include modern solid, liquid and gaseous bioenergy, low-carbon hydrogen and hydrogen-based fuels that do not emit any CO2 from fossil fuels directly when used and also emit very little when being produced. Clean electricity includes low-carbon generation, power infrastructure grids and batteries. MENA = Middle East and North Africa; 2026-30 shows annual averages. “Share of clean” = clean energy investment as a share of total energy investment. Investment is measured as ongoing capital spending in energy supply capacity (fuel production and clean electricity) and incremental capital spending above a baseline for energy end-use and efficiency sectors (in buildings, transport and industry). The scope and methodology for tracking energy investments are available in the methodology document.
0%
20%
40%
60%
80%
100%
30
60
90
120
150
2015
2016
2017
2018
2019
2020
2021
E
2026
-30
2026
-30
STEPS SDS
Billi
on U
SD (2
020)
LowemissionfuelsEfficiencyand end-use
CleanElectricity
Share ofclean (rightaxis)
2%
4%
6%
8%
2016 2018 2020 2026-30SDS
India Southeast Asia
MENA Sub-Saharan Africa
Eurasia

Southeast Asia Energy Outlook 2022
PAGE | 94
Energy Perspectives
Clean energy investment levels remain well below the region’s potential and its needs, across power, efficiency and end use
Clean energy investment in Southeast Asia – in power, efficiency and end use, and low-emission fuels – was estimated at USD 27 billion in 2021, similar to 2015 levels . The amounts spent on clean energy in 2021 comprised just over 40% of total energy investment, a higher share than in 2015 (when it was around one third). This increase was mainly a result of a steady decline in oil and gas supply investment, on the back of lower oil prices since 2014, amplified by recent demand-side uncertainties around the Covid-19 pandemic.
Investment in clean power and grids made up around 80% of clean energy investment over the 2015-2021 period. Transmission and distribution networks represented more than half of the clean electricity spending in 2015, though this balance has shifted in recent years as investment in low-carbon generation has increased. Viet Nam, for example, mobilised substantial capital for the renewable power sector, with around 6 GW of renewable projects (mostly solar PV) deployed in 2019 and more than 10 GW in 2020. Still, spending on low-carbon generation has trended downwards since a peak in 2018 (aided by lower technology costs).
Investing in energy efficiency and end-use assets has accounted for around one-fifth of total clean energy spending and less than 10% of the total energy investment in the region, despite some increases in recent years.
Recent levels of investment in clean energy in Southeast Asia are far short of the requirements of all our scenarios. In the Stated Policies Scenario (STEPS), there is a near threefold increase in investment by the late 2020s up to an annual average of USD 80 billion. The Sustained Development Scenario (SDS) requires a steeper rise, to more than five times current levels, with annual average spending of more than USD 150 billion by the late 2020s. The majority of this spending in the SDS goes to clean electricity, though efficiency and end use comprise increasing shares, driven by rising urbanisation and the need for more efficient buildings, cooling appliances and transport alternatives. The stock of air conditioners in Southeast Asia increases from 332 million units today to 450 million by 2030 in the SDS, adding 48 TWh or 7% per year between 2021 and 2030 for energy consumption. EVs account for 1% of passenger cars sold today, but 22% by 2030 in the SDS. Investment in low-emission fuels remains low, though it starts picking up in the SDS.
Investment in all forms of energy in Southeast Asia increases as a share of GDP, though this increase is less than is seen in a number of other regions. For example, energy investment in Southeast Asia in the SDS is around 4% of GDP by the late 2020s, compared with 5% in India, and 6% in Africa and the Middle East. A major challenge for the region will be to meet its domestic energy needs by scaling up clean investments rather than a focus on investments in fossil fuels.

Southeast Asia Energy Outlook 2022
PAGE | 95
Energy Perspectives
Investment in renewable power in Southeast Asia is low compared with other regions: capital costs are relatively high given uncertainties about remuneration
Average annual investment spending, 2016-2020 (left) and capital costs of utility-scale solar PV and onshore wind in selected emerging economies (right)
IEA. All rights reserved.
Notes: Fossil fuels = Fossil fuel-based generation without CCUS. Source: IEA analysis based on S&P Global Platts (2021).
30
60
90
120
150
Advancedeconomies
China LatinAmerica
SoutheastAsia
India Sub-SaharanAfrica
Billi
on U
SD (2
020)
Wind Solar PV Hydro Other renewables Fossil fuels
2016 2020
Onshore windIndonesia
Brazil
South Africa
China
India 500
1 000
1 500
2 000
2 500
2016 2020
USD
/kW
Solar PV

Southeast Asia Energy Outlook 2022
PAGE | 96
Energy Perspectives
For every dollar invested in renewable power in Southeast Asia in recent years, another was invested in unabated fossil fuel generation
Around three quarters of Southeast Asia’s electricity generation today comes from unabated fossil fuels, mainly coal. Average annual spending in renewables over the 2016-2020 period was USD 12 billion, a level similar to India’s and half of the level in Latin America. Together with India, Southeast Asia had the highest ratio of fossil fuel-to-renewable power investment. For every dollar invested in renewable power capacity in Southeast Asia, another dollar was invested in unabated fossil fuels, compared with USD 0.5 in Sub-Saharan Africa, USD 0.3 in China and USD 0.2 in Latin America.
Average annual investment in solar PV and wind amounted to USD 7 billion. This is higher only than the level in sub-Saharan Africa, and the majority was mobilised in just one country (Viet Nam). The modular and scalable nature of solar PV and wind should mean they are reliable and cost-effective solutions for Southeast Asia, which includes a unique mix of islands, peninsulas and pockets of densely populated areas, separated by uplands and mountainous areas. Average annual investment in renewable power in Southeast Asia in the SDS is almost USD 50 billion by 2026-30. Of this, almost USD 30 billion goes to solar PV and wind electricity, four times more than current levels. In recent years, there have been equal levels of investment in renewable power and fossil fuel power; between 2026 and 2030 in the SDS, investment in renewable power is nearly 25 times higher than investment in fossil fuel power.
Wind and solar PV have experienced major cost reductions over the last decade, but costs remain relatively high in Southeast Asia, mainly due to unclear and slow moving policies which have hampered long-term predictability for investors. Capital costs for utility-scale solar PV and wind in Indonesia, for example, are higher than in South Africa or Brazil, and much higher than in China or India. In response, Regulation 4/2020, adopted in Indonesia in early 2020, introduced changes such as priority dispatching for renewables and replaced the need to develop renewable projects on a build, own, operate and transfer (BOOT) basis for a BOO scheme (the transfer requirement created difficulties for developers to own land and access financing). Nonetheless, there are still uncertainties about the remuneration mechanism and the tariff level for renewables, affecting revenue risk perceptions and the cost of capital of these technologies. If financing conditions in Indonesia fell to the average level in advanced economies today, the levelised cost of electricity (LCOE) of solar PV would be around 40% lower.
In the SDS, the increase in electricity demand and penetration of intermittent renewable energy sources mean transmission and distribution investment triples (reaching USD 33 billion in the late 2020s). The rapid deployment of solar PV in recent years in Viet Nam means that there is a need for more network investment to assist the balancing of electricity demand and supply and to improve system flexibility.

Southeast Asia Energy Outlook 2022
PAGE | 97
Energy Perspectives
Clean energy investments today rely heavily on public sources of finance but over 70% of spending needs in the SDS must come from private capital
Sources of finance for clean energy investment, 2016-2030 (left) and investment by source of finance in the SDS by technology (right) in Southeast Asia
IEA. All rights reserved.
Note: SOE = State-owned enterprises.
50
100
150
200
2016-20 2026-30 2026-30
STEPS SDS
Billi
on U
SD (2
020)
Public (SOE spending)Public (financial institution spending)Private
50% 100%
Low-carbon fuels
Transport
Industry
Buildings
Grids and storage
Low-carbon power

Southeast Asia Energy Outlook 2022
PAGE | 98
Energy Perspectives
Mobilising this capital will depend on how countries address both cross-cutting and sector-specific issues
Around half of the energy investment in Southeast Asia in recent years came from public sources of finance (including both publicly-owned financial organisations and state-owned enterprises). State-owned enterprises play a key role in many regulated markets such as electricity networks (although there are some exceptions, such as in the Philippines where there is a private concession) and in the development and utilisation of fossil fuel assets. Some clean energy sectors have been less reliant on public sources, and private sector finance was crucial to the rapid rollout of renewable projects in Thailand and Viet Nam in recent years. Private capital accounted for almost 60% of the spending in low-carbon power in Southeast Asia over the 2016-2020 period, compared with almost 45% for fossil fuel generation plants. This level of private finance is far below the level in advanced economies, where the average share of private finance in low-carbon generation was almost 90% over the same period.
The underlying business models of clean energy assets, and their ability to raise private capital, vary widely. Renewable power has been largely developed through long-term contracts, as well as project finance structures in the case of solar PV and wind. In contrast, efficient cooling appliances and EVs tend to be financed by households, which generally have lower credit capacity and rating (especially in developing countries). The smaller size of end-use transactions is also less appealing to the banking sector given the
high transaction costs. Investments in buildings is typically made on the balance sheet of the developer or the tenant, mostly using equity.
Financing future energy investments in Southeast Asia will require that private capital plays a stronger role. By the late 2020s, the share of private capital in clean energy spending is 65% in the STEPS and 75% in the SDS. Mobilising this capital will depend on addressing cross-cutting issues and issues that are specifically affecting the energy sector.
Cross-cutting issues include developing robust investment frameworks to provide certainty for investors through improving the general rule of law and contract sanctity, the operation of markets, and country-level energy strategies. Despite progress over the last two decades, most countries in Southeast Asia rank in the lower half of worldwide governance indicators such as political stability, rule of law and governments’ effectiveness. While government debt-to-GDP levels in many Southeast Asia countries are lower than in most countries in Latin America or sub-Saharan Africa, as well as general macroeconomic performance, access to long-term finance can still be a challenge given the relatively low levels of government revenues and private credit in most countries in the region. Expansion of capital markets could be very important in Indonesia and Viet Nam, for example. Sector-specific factors are discussed in more detail below.

Southeast Asia Energy Outlook 2022
PAGE | 99
Energy Perspectives
Despite some recent progress, persistent risks continue to slow the scale-up of investment in energy, especially in clean energy
Main changes to policy ambitions since 2019 and key investment priorities and risks in selected countries in Southeast Asia
IEA. All rights reserved.
Market Main changes in sector policy ambitions since 2019 Outlook
Investment PrioritiesPower sectorsustainability
Project bankability
Financing and cost of capital
Integratedapproaches
IndonesiaPlanning for NZE by 2060. More renewable power in
long-term plan, though coal still represents almost 65% of generation by 2030.
Malaysia Government announced goal to become carbon neutral by 2050 and stop building new coal-fired plants.
Philippines Long-term strategy not updated.
SingaporeLong-term strategy not updated, though a 2030 Green Plan was published in early 2021 to expand a range of
clean energy initiatives.
ThailandAnnounced intention to develop plan for NZE by 2065.
Updated power expansion plan has reduced dependency on coal in favour of natural gas.
Viet NamNZE by 2050 target announced at COP26. Substantial
capital is mobilised to renewable power, especially solar, while coal capacity is still planned to expand by 2030.
Cambodia Long-term strategy not updated, though no new coal power plants to be developed (beyond committed ones).
Low risk/supportive factor for investmentPotential risk factor/barrier for investment High potential risk factor/barrier for investment
Improvements since SEAO 2019Regressions since SEAO 2019No changes since SEAO 2019

Southeast Asia Energy Outlook 2022
PAGE | 100
Energy Perspectives
Ambitious announcements on clean energy in 2021 are a positive signal, but financial system sustainability and project bankability need further work…
Clear strategies and policies are key to creating long-term signals for investment in energy and there was progress on this front in a number of countries in Southeast Asia in 2021. For example, as set out in Chapter 1, Viet Nam committed to achieve net zero emissions by 2050, Indonesia has a target to achieve net zero emissions by 2060, and Thailand announced its intention to achieve carbon neutrality by 2050 and net zero emissions by 2065. Viet Nam and Indonesia pledged to phase out coal by the 2040s – conditional on obtaining additional international financial and technical assistance – as did the Philippines that also signed the Global Coal to Clean Power Transition Statement (albeit with conditions). These pledges need firmer ground and implementation plans, but provide positive signals for clean energy markets.
Issues around the financial sustainability of the energy sector remain a large bottleneck for investment, and the economic consequences of the Covid-19 pandemic have worsened the situation. Power utilities in particular have been affected by lower demand and reduced payment capability by consumers. Take-or-pay contracts meant costs remained high while revenues dropped. Given most payments to fossil fuel suppliers and IPPs use US dollars, the reduction in demand and currency depreciation resulted in a loss for Indonesia’s State Electricity Utility PLN of IDR 12.2 trillion (USD 890 million) between January and September 2021 (compared with a profit of IDR 10.8 trillion over the same period in 2019. Electricity
tariffs have been frozen since 2017, and government discounts to certain consumer groups have added to the pressure on PLN’s finances.
Regulatory frameworks for planning and pricing continue to be weak. Independent regulation, least-cost system planning and cost recovery tariffs are rare in most countries. The de jure regulatory frameworks are well-designed, but putting them in practice – like determining electricity tariffs – has been challenging. A regulatory framework index by the World Bank shows 25 percentage points of divergence between the de jure and perceived scores of Viet Nam.
There has been some progress on regulation, like changes to Ministerial regulation 4/2020 in Indonesia and efforts to boost clean energy deployment in Viet Nam, though project bankability is still a major issue. Viet Nam introduced a favourable feed in tariff (FiT) scheme, combined with currency indexation and government guarantees to mitigate risks such as inflation or non-performance of off-take. Most of the rapid recent deployment of solar PV and wind capacity in Viet Nam was financed by domestic and regional financiers. Attracting more international capital, in Viet Nam and elsewhere, will depend on reducing the risks associated with permitting, land acquisition, curtailment protection or international arbitration in PPAs. Transitioning to competitive auction-based systems could also boost private finance levels while also supporting price reductions.
Southeast Asia Energy Outlook 2022
PAGE | 101
Energy Perspectives
…alongside dedicated financial instruments and support from development finance institutions
Domestic financing has been more important in a number of countries in Southeast Asia than in many other emerging market and developing economies. Singapore, Thailand and Malaysia have access to finance that is above the global average (based on a composite indicator of the share of private bank credit to GDP and the share of stock market capitalisation to GDP (IEA, 2021)). These countries also have a relatively developed corporate bond market.
Access to international private capital is harder to obtain elsewhere. There is limited availability of long-term debt, which can be useful to match finance with the lifetime of long-term clean energy projects such as renewable projects or building investments. The average duration of a loan in Southeast Asia is just over six years, though longer duration loans can be obtained for projects with PPAs.
Sustainable debt issuance – an instrument that can attract new sources of finance to clean assets – has been on the rise globally, but has been heavily concentrated in advanced economies. Issuance by countries in Southeast Asia comprises around 3% of the global total, though various countries are increasing efforts to grow the availability of sustainable finance. For example, Indonesia released its sustainable finance taxonomy in 2022, the financial sector regulator in Malaysia is discussing a green taxonomy draft, and various banks have been developing their own frameworks, notably in Singapore and Thailand.
The more effective use of international and development finance would catalyse private investment, especially in nascent clean energy sectors and riskier countries. In the Philippines, InfraCo Asia, a Singapore-based company of the Private Infrastructure Development Group (PIDG), is providing USD 8 million in early-stage equity to a 35 MW solar PV and storage mini-grid project that will electrify 200 000 households. Once the connection of the first 4 000 households is completed, InfraCo Asia will sell the project to another party who will then provide equity and debt to support the remainder of the project. In Indonesia, concessional loans from the US International Development Finance Corporation and the Asian Development Bank (ADB) helped to mobilise commercial debt and support from private sponsors to enable the development of the country’s first two utility-scale wind farms (totalling 140 MW). The ADB, together with Indonesia and the Philippines, is working on an Energy Transition Mechanism, a platform to accelerate the retirement of unabated coal power using blended finance, and to support investment in renewables through a market-based approach.
SMEs and households still struggle to access debt to finance small-scale projects. Mechanisms to establish credit ratings for end users and bundle small transactions could boost investment in energy efficiency and electrification. Bulk procurement programmes – with financial and technical support from development banks – could help aggregate demand and bring down costs for households.

Southeast Asia Energy Outlook 2022
PAGE | 102
Energy Perspectives
Four priorities to unlock investment in Southeast Asia
Clean energy investment in Southeast Asia increases by a factor of five in the SDS by the late 2020s. This requires major efforts from private and public actors in four priority areas:
Addressing cross-cutting investment issues. These issues include restrictions on foreign direct investment and currency convertibility, risks of currency devaluations or high inflation, and low capabilities and financial depth of domestic banks or capital markets. These extend beyond the control of energy policy makers but need to be incorporated in the efforts to fight climate change as they drive risk perceptions and affect financing costs.
Improving the policy and regulatory frameworks to enable wide-scale financing of clean electricity and efficiency and end-use sectors. Better living standards and economic development in Southeast Asia will be powered by more electricity. The amount of capital mobilised for these sectors depends on policy and regulatory conditions, including clear renewable targets and bankable PPAs in clean power that clearly define the returns for investors and financiers. Well-enforced performance standards are critical in end-use sectors. Improving these conditions is key to accelerating private funds but also to optimising the use of local governments’ limited public funds.
Ensuring an effective use of international development finance to catalyse private funds. Blended capital (using concessional funds to attract private capital) is needed to mobilise private funds in the region, especially for sectors in the early stages of development (e.g. solar PV in countries with little deployment), new technologies (e.g. offshore wind, low-carbon hydrogen, ammonia and CCUS), and to address specific risks (e.g. exploration risks in the case of geothermal power). Development finance is also critical in the riskier countries of the region. International institutions can provide technical assistance to improve investment frameworks and design financial instruments, particularly guarantees.
Implementing unabated coal phase-outs and preparing the ground for investment in low-carbon fuels. Reducing emissions from the existing coal fleet requires strong policy support. Plants may be retrofitted (e.g. co-fired with low emissions fuels), repurposed (e.g. for system adequacy) or retired. Regulatory changes will need to go hand-in-hand with financial solutions and deal with labour impacts. Deployment of low-carbon fuels is at a very early stage (see next section of this chapter), and attention to the required technical skills, partnerships and business models is essential to scaling them up.

Southeast Asia Energy Outlook 2022
PAGE | 103
Energy Perspectives
Low emissions fuels in Southeast Asia’s transition

Southeast Asia Energy Outlook 2022
PAGE | 104
Energy Perspectives
The role of natural gas in emissions reduction efforts is not straightforward, and changes over time
Changes in natural gas demand and their effect on emissions in Southeast Asia in the Sustainable Development Scenario, 2000-2050
IEA. All rights reserved.
Note: NG = natural gas. Activity variables reflect underlying drivers of energy service demand, such as population increases or economic growth. Low-carbon and renewable forms of energy include wind, solar, geothermal, hydrogen and hydrogen-based fuels, bioenergy and electricity.
-3 000
-2 000
-1 000
0
1 000
2 000
3 000
2000-10 2010-20 2020-30 2030-40 2040-50
PJ
Power Industry Energy sector own use Other Net change
Change in natural gas demand
- 150
- 100
- 50
0
50
100
150
2000-10 2010-20 2020-30 2030-40 2040-50
Mt C
O2
Activity variables NG to renewables/low-carbonRenewables/low-carbon to NG Improved efficiency of NGCoal/oil to NG NG to coal/oilNet change
Effect of changes in natural gas demand on CO₂ emissions
Increased gas demand Reduced gas demand

Southeast Asia Energy Outlook 2022
PAGE | 105
Energy Perspectives
Tapping into Southeast Asia’s potential for coal-to-natural gas switching can yield benefits for emissions, but its potential is not easy to realise
Natural gas occupies a difficult space in Southeast Asia’s energy transition. It results in lower CO2 emissions and air pollutants than coal or oil, meaning it can avoid emissions and improve air quality when substituting for these fuels. But the emissions reductions from fuel switching in the region have been modest, and can be easily reversed. Substituting gas for coal and oil avoided around 20 Mt CO2 emissions in 2010 compared to 2000, yet switching from natural gas back to coal between 2010 and 2020 meant that emissions were nearly 40 Mt CO2 higher in 2020 than in 2010.
Most of the increase in natural gas consumption since 2010 stems from increases in energy service demand from economic and population growth, rather than from fuel switching. Overall, natural gas has been responsible for 16% of the total growth in energy-related CO2 emissions in Southeast Asia since 2010, and has met 20% of total energy demand growth.
From a detailed assessment of existing gas and coal-fired power plants in the region and taking into account plant capacities, utilisation profiles, efficiencies and location factors, it is technically possible for one-third of coal-fired power output to be substituted by existing gas-fired power capacity (which totals around 100 GW and currently runs at a 45% annual load factor). Maximising this potential could avoid around 120 Mt CO2, equivalent to 22% of emissions from coal-fired power plants in Southeast Asia. The majority of this
potential lies in Indonesia, Thailand and Malaysia. Based on average coal and gas prices over the period 2016-2020, a CO2 price in the range of USD 40-60/t CO2 would be needed to incentivise this switch. The prospect of higher gas prices, as the region moves towards net importing status, can challenge the economic case for switching: applying the record spot gas prices seen in 2021 would raise the required CO2 price to more than USD 150/t CO2. There are also contractual restrictions as power plants operate on bilateral PPAs that are not easy to change (see section on power system flexibility).
In the SDS, unabated coal phase-out policies and restrictions on finance for new unabated coal projects give a boost to gas: demand grows by 70 bcm between 2020 and 2030, helping to fill the gap left by coal which declines by 18%. Around one- third of total energy demand growth in the SDS over this period is met by gas, a level higher than the STEPS (where both gas and coal each account for 20% of total growth). In the SDS, around 15 bcm of the additional natural gas demand in 2030 is attributable to coal substitution, resulting in around 25 Mt CO2 of avoided emissions.
In the SDS, the window for coal-to-gas switching to bring positive emissions outcomes closes by 2030, after which renewables and low emissions fuels such as hydrogen and bioenergy start displacing natural gas (in addition to remaining coal) while wider efficiency improvements dampen any further increases in natural gas demand.

Southeast Asia Energy Outlook 2022
PAGE | 106
Energy Perspectives
Natural gas grows strongly in both the STEPS and SDS to 2030, though pathways begin to diverge thereafter…
LNG and gas-fired power generation capacity in Southeast Asia in the Sustainable Development Scenario and Stated Policies Scenario, 2020-2050
IEA. All rights reserved.
Note: Mtpa = million tons per annum.
50
100
150
200
250
2020 2030 2050 2020 2030 2050 2020 2030 2050
Liquefaction (Mtpa) Regasification (Mtpa) Power plants (GW)
SDS
Under construction
Operational
STEPS

Southeast Asia Energy Outlook 2022
PAGE | 107
Energy Perspectives
…adding to the challenges of developing long-lived, capital-intensive gas infrastructure
Natural gas demand increases by 40% between 2020 and 2030 in the STEPS and SDS and virtually all of this is met by imports. In many parts of the region, including in the Philippines, Cambodia and parts of Indonesia, there is little pipeline infrastructure to deliver gas to smaller industrial, commercial and residential consumers. There are around 15 000 km of gas transmission pipelines across Southeast Asia today and a further 6 000 km have been proposed or are under construction. In the STEPS and SDS, LNG regasification terminal capacity grows from 32 Mtpa in 2021 to more than 100 Mtpa by 2030.
Around USD 120 billion is spent on gas infrastructure (including maintaining liquefaction and building new regasification capacity and transmission and distribution networks) from 2020 to 2030 in the STEPS and SDS. This implies a lower near-term risk of stranded capital in the event of accelerated climate ambition. While such infrastructure is capital-intensive with operational lifetimes typically exceeding 30 years, payback periods are often shorter, typically around 8-12 years.
Trends diverge after 2030: in the STEPS, natural gas demand grows steadily to 2050 while in the SDS, demand peaks in 2035 and is 15% below 2020 levels by 2050. Between 2030 and 2050, cumulative investment in gas infrastructure in the STEPS is USD 200 billion, while it is less than USD 80 billion in the SDS. Capital committed in the late 2020s may therefore be at risk if climate policy signals are misread, especially if long development lead times mean new projects are commissioned at a time when demand starts to fall back.
A detailed assessment of LNG regasification projects in the region shows that net present values are, on average, around 30% lower in the SDS than in the STEPS. This adds to other challenges standing in the way of developing new LNG import capacity, including credit, currency and commodity price risk. Many project sponsors in Southeast Asia have low credit ratings, which can make access to project finance difficult for capital-intensive LNG projects (see previous chapter).
Gas infrastructure is important for ensuring security of electricity supply in the SDS: 70 GW of new gas-fired generation capacity is commissioned between 2030 and 2050, even as the share of gas in the power generation mix falls from 35% to 5%. The region will have to source adequate volumes of flexible gas supplies to meet this demand while meeting a minimum level of baseload requirements from industrial consumers that continue to rely on gas as a feedstock in 2050.
There are ways for investors and governments to overcome investment hurdles and adapt to changing asset utilisation profiles. Floating storage and regasification units (FSRU) are cheaper and quicker to build than land-based terminals and can be flexibly redirected to areas in need of short-term gas supply. While commercial arrangements can be complex, projects are being developed in Indonesia, Myanmar and Viet Nam.

Southeast Asia Energy Outlook 2022
PAGE | 108
Energy Perspectives
A low emissions energy system still needs solid, liquid and gaseous fuels, but with much lower emissions intensities
Changes in the emissions intensity and demand for solid, liquid and gaseous fuels in Southeast Asia in the Sustainable Development Scenario, 2020-2050
IEA. All rights reserved.
Note: Other includes reduction in CO2 emissions from oil, gas and coal supply, and growth in the use of non-combustion uses of fossil fuels. Solid fuels include coal, modern solid bioenergy, traditional use of biomass and industrial and municipal wastes. Liquid fuels includes oil, liquid biofuels (expressed in energy-equivalent volumes of gasoline and diesel), synthetic oil and ammonia. Gaseous fuels include natural gas, biogas, biomethane, hydrogen and synthetic methane.
3
6
9
12
15
20%
40%
60%
80%
100%
2020 2030 2050 2020 2030 2050 2020 2030 2050
EJ
Methane reductions Other Use of CCUS Modern bioenergy Hydrogen Demand (right axis)
Solid fuels Liquid fuels Gaseous fuels

Southeast Asia Energy Outlook 2022
PAGE | 109
Energy Perspectives
Robust incentives and international collaboration are needed to support the large-scale uptake of advanced bioenergy, hydrogen and carbon capture, as well as methane avoidance
Even as electricity provides a growing share of energy consumption, fuels still make up half of total energy demand in 2050 in the SDS. But this depends on a major reduction in their emissions intensity.
The emissions intensity of solid fuels in Southeast Asia today is 0.27 tCO2/MWh and this falls by 80% to 2050 in the SDS. This is mainly due to the decline in unabated coal consumption, accompanied by a large uptake of modern solid bioenergy in power generation and industry. The emissions intensity of liquids is around 0.20 tCO2/MWh today and this drops by 40% to 2050, due to a fourfold increase in transport biofuel production that occurs alongside the drop in oil demand. Finally, the fuel intensity of gases today is 0.17 tCO2/MWh, which falls by 45% to 2050. There is a 1 000 PJ rise in production of biogases and a 400 PJ rise in low-carbon hydrogen.
Avoiding methane emissions helps to provide large near-term reductions in the emissions intensity of fuels in the SDS. In 2020, fossil fuel operations in the region emitted about 110 Mt CO2-eq of methane, double the amount of emissions from all of the region’s buildings. Several major emitters in Southeast Asia have joined the Global Methane Pledge, including Indonesia (which accounts for around half of the region’s estimated energy-related methane emissions), that commits them to contribute to a 30% reduction in global methane emissions (from all anthropogenic sources) by 2030. Over half of energy-related methane emissions in Southeast Asia come from coal mines. Declining coal consumption accounts for the
bulk of the reductions in the SDS, but this is complemented by efforts to capture and use coal mine methane from subsurface mining.
There is significant potential to capture CO2 that is otherwise vented to the atmosphere during gas production; Malaysia and Indonesia in particular are pursuing efforts to this end. The region also has industrial clusters well suited to capture projects, and there is large potential for CO2 storage capacity in depleted oil and gas reservoirs. In the early phase of deployment, international collaboration and financial support are essential, examples being the creation of the Asia CCUS Network in 2021 and the activities of multilateral development banks such as the ADB. In the SDS, the focus of investment in CCUS turns from upstream oil and gas towards addressing emissions in industry and power generation, including those associated with coal use. Investment in carbon capture averages USD 2.5 billion each year between 2030 and 2050. By 2050, around 230 Mt CO2 are captured each year, equivalent to 40% of remaining CO2 emissions.
Low-carbon hydrogen helps to reduce emissions associated with liquid and gaseous fuels, especially after 2030, as the region takes advantage of anticipated cost reductions from technological learning effects in the SDS. The use of ammonia for co-firing in power generation forms the largest share of low-carbon hydrogen use in the region by 2050. Hydrogen begins to play a significant role in the transport sector: by 2050, around 10% of road transport vehicle sales (primarily bus fleets) are hydrogen fuel cells.

Southeast Asia Energy Outlook 2022
PAGE | 110
Energy Perspectives
The growth in bioenergy should be accompanied by a shift towards sustainable feedstocks and modern production pathways, which avoid negative effects on biodiversity and human health…
Bioenergy demand in Southeast Asia in the Sustainable Development Scenario, 2010-2050
IEA. All rights reserved.
Note: “Modern solid bioenergy” refers to the use of solid bioenergy in improved cook stoves and the use by modern technologies of processed biomass such as pellets. Conventional biofuels are fuels produced from food crop feedstocks, including sugar cane ethanol, starch-based ethanol, fatty acid methyl ester (FAME), straight vegetable oil (SVO) and hydrotreated vegetable oil (HVO) produced from palm, rapeseed or soybean oil. Advanced biofuels are produced from non-food crop feedstocks. Biogas is a mixture of methane, CO2 and small quantities of other gases produced by anaerobic digestion of organic matter, i.e. in an oxygen-free environment. Biomethane is a near-pure source of methane produced either by “upgrading” biogas or through the gasification of solid biomass.
200
400
600
800
1 000
2010 2020 2030 2040 2050
Liquid bioenergy
Conventional biofuelsAdvanced biofuels
1 000
2 000
3 000
4 000
5 000
2010 2020 2030 2040 2050
PJ
Solid bioenergy
Traditional use of solid biomassModern solid biomass
200
400
600
800
1 000
2010 2020 2030 2040 2050
Gaseous bioenergy
Biogas Biomethane

Southeast Asia Energy Outlook 2022
PAGE | 111
Energy Perspectives
… but transitioning to sustainable bioenergy is not straightforward
Southeast Asia has significant quantities of sustainable feedstocks – such as agricultural residues or municipal waste – that can be used for energy. Modern solid bioenergy is already significant and there is nearly 20 GW of co-firing potential across the region. Indonesia is the world’s third-largest biofuels producer, producing 8.1 billion litres of biodiesel each year (of which 500 million litres is exported); Malaysia produces 1.5 billion litres and exports 500 million litres. Malaysia is targeting a 20% biodiesel blending rate in 2022 while Indonesia has a 30% mandate; many other countries in the region have ambitious targets for transport biofuels. The share of biofuels in road transport fuel in Southeast Asia is 7%, 50% higher than the global average, though recent high commodity prices could set back progress.
In the SDS, modern bioenergy provides 15% of total final consumption in 2050, double the level in 2020. In parallel, the use of traditional biomass falls to zero in 2030. Power generation use of solid modern bioenergy grows from 40 TWh in 2020 to 200 TWh by 2050. Although its share of total power generation remains modest, the use of bioenergy – in combined heat and power (CHP) plants and co-firing units – provides a stable source of renewable electricity. By 2030, biofuels make up 15% of total liquid fuel transport demand.
Bioenergy targets need to be carefully weighed against the sustainability of feedstocks. Nearly all biofuel production in Malaysia and Indonesia is derived from palm oil feedstocks. These have a high level of oil output per hectare of land use, but their use is controversial due to their role in reducing biodiversity and causing deforestation when land is made available for palm oil cultivation. They can also result in additional emissions from indirect land use change, and palm
oil fuels can compete with oil use for cooking. In April 2022, Indonesia suspended palm oil exports to protect domestic consumers from surging prices for cooking oil.
There have been ongoing efforts to develop consistent and harmonised certification schemes that accurately reflect the lifecycle impacts of biofuels. However, establishing the sustainability of bioenergy feedstocks is complex. Even feedstocks classified as “waste”, such as used cooking oil, can have unintended effects on biodiversity, e.g. when its use as an animal feed is displaced by virgin oil. To achieve the scale needed in the SDS, incentives are needed that encourage industry and agriculture to develop sustainable bioenergy supply chains based on full lifecycle emissions assessments (e.g. through robust certification schemes, performance-based subsidies, targeted tax breaks, inclusion in sustainable finance frameworks or low-emissions fuel standards).
In the SDS, there is a rapid shift towards sustainable feedstocks which avoid competition with food production and have minimal adverse effects on land use or biodiversity. There is a shift from palm oil-derived biofuels in favour of wastes, which progressively become cheaper to produce. By 2050, around 70% of transport biofuels in the region are “advanced”, relying on non-food feedstocks such as agricultural waste or used cooking oil. Methane recovery from the wastewater resulting from palm oil processing is also used to produce biogas, along with other sustainable feedstocks such as crop residues and municipal solid waste. Biogas production grows more than tenfold to reach 1 100 PJ by 2050, tapping into a total sustainable potential of around 3 EJ.

Southeast Asia Energy Outlook 2022
PAGE | 112
Energy Perspectives
A large share of emissions reductions in Southeast Asia requires investment in technologies and fuels that do not immediately deliver zero emissions energy…
CO2 emissions reductions in the Sustainable Development Scenario relative to the Stated Policies Scenario, 2015-2030 (left) and average annual energy investment by emissions reduction potential, 2022-2030 (right)
IEA. All rights reserved.
Note: “Transition” refers to investments leading to incremental emissions reductions over time. “Contingent” refers to investments that enable emissions reductions only with changes elsewhere in the energy system. “Low emissions” refers to investments which immediately provide zero or near-zero emissions. “Unabated fossil fuels” only include investments in supply and in the power sector, such as coal mines and unabated coal-fired power plants, excluding ones in end-use sectors. Other includes material efficiency improvement, behaviour changes and retirement of existing fossil fuel assets
0
500
1000
1500
2000
2500
2015 2020 2025 2030
Mt C
O₂
Low emissionsContingent and transition
SDS
STEPS
Other
20
40
60
80
Supply Power End-use Supply Power End-use
Billio
n U
SDLow emissions Contingent Transition Unabated fossil fuels
STEPS SDS

Southeast Asia Energy Outlook 2022
PAGE | 113
Energy Perspectives
…underscoring the importance of efforts to develop sustainable financing frameworks that can support deep emissions reductions in fossil fuel supply chains and energy-intensive sectors
In the SDS, around USD 180 billion is spent per year on energy supply, power and end use over the period from 2022-2030, about 30% more than in the STEPS. Most of this comes from private sources but is catalysed by governments, encouraging a huge shift in capital spending away from unabated fossil fuels towards solar PV and wind, bioenergy, hydrogen and CCUS. These fuels and technologies provide zero or very low emissions regardless of how the energy system evolves. Around 60% of the emissions reductions that are achieved in the SDS compared to the STEPS over the period to 2030 come from investment in zero or near zero emissions energy.
The remainder of emissions reductions are the result of investments in fuels, technologies and infrastructure that do not immediately deliver zero emissions energy or energy services. Such investments either lay the groundwork for incremental emissions reductions over time (defined here as transition investment), or only reduce emissions if changes occur elsewhere in the system (contingent investment). Transition investment includes spending on improved efficiency of fossil fuel technologies, gas supply and infrastructure that enables fuel switching from coal and oil, co-firing with low-emissions fuels, or projects aimed at reducing emissions from upstream operations. Contingent investments include electrifying end uses or investing in electricity networks or storage technologies, where the emissions benefits depend on the availability of low-carbon electricity.
Overall, transitional and contingent measures reduce emissions by around 1.4 Gt CO2, cumulatively, over the period between 2021 and
2030 in the SDS compared to the STEPS. Both scenarios have a similar overall level of investment in supply to 2030, but in the SDS there is a major reallocation of capital away from fossil fuels towards low-emissions fuels and transitional investments. In the power sector, repurposing coal plants to run less frequently helps to avoid around 800 Mt CO2 to 2030 (while CCUS makes inroads after 2030). In energy-intensive industries, material and energy efficiency improvements avoid 200 Mt CO2 over the same period, and pave the way for additional savings out to 2050.
The scale of investments required in transitional and contingent activities – around USD 70 billion per year over the next decade, or 40% of total spending on energy – underscores the importance of designing sustainable financial frameworks and taxonomies that do not preclude investments in emissions-intensive sectors out of hand. Recently, 18 commercial banks announced an initiative to create guidelines that recognises the importance of financing investment in transition technologies. However, a careful balance needs to be struck: while investments in fossil fuel infrastructure can lead to greater efficiency, reduced methane or CO2 emissions or reductions in air pollution, they can also prolong asset lifetimes or otherwise justify “business as usual” activities. Properly accounting for the full lifecycle emissions and the interlinkages between such activities is a crucial first step to designing robust financial frameworks that avoid further emissions lock-in.

Southeast Asia Energy Outlook 2022
PAGE | 114
Energy Perspectives
The role of flexibility in boosting power sector decarbonisation

Southeast Asia Energy Outlook 2022
PAGE | 115
Energy Perspectives
Power system flexibility is a key enabler of clean energy transitions
The building blocks of system flexibility
IEA. All rights reserved.
Technical flexibility
• Power plant flexibility (ramp rates, minimum stable level, startup time)
• Electricity grids • Storage • Demand response
(end uses including EVs) • Digitalisation
Contractual/Institutional flexibility
• Without take or pay obligations
(PPAs, fuel contracts and cross-border power trade)
• Curtailment conditions
• Ancillary services
Modern operational practices
• Forecasting requirements • Close to real time
scheduling and dispatch • Sizing of operating reserves • Coordinating dispatch
across balancing areas
Power System Flexibility

Southeast Asia Energy Outlook 2022
PAGE | 116
Energy Perspectives
To integrate a growing share of variable renewables, it is critical to maintain flexibility through technical, contractual and modern operational practices.
The power system of Southeast Asia today is dominated by baseload fossil fuel generation technologies. In many cases, generation is provided under rigid contractual arrangements subject to PPAs and fuel supply contracts. An increasing proportion of electricity generation is set to be provided by variable renewable energy (VRE) and installed renewable capacity will need to increase from 30% of total capacity in 2020 to 50% by 2025 for the region to achieve its renewables targets. In the SDS, VRE (wind and solar PV) provides 18% of electricity generation in 2030 (up from around 2.5% in 2020). To integrate a growing share of variable renewable electricity against the backdrop of rising electricity demand, it is critical to maintain the reliability, flexibility and security of electricity grids. Flexibility is required across a wide range of timescales from very short term (sub-seconds to seconds), short term (minutes to hours), medium term (days to months) and long term (seasons to years). Ensuring this flexibility requires a variety of approaches.
1 “Conventional power plants” refer to coal, natural gas, nuclear, hydropower and bioenergy power plants.
Prominent technical flexibility resources include power plants (both conventional1 and variable renewables); electricity grids (including cross-border interconnectors); energy storage and distributed energy resources (including demand response and electric vehicles). It is likely that flexibility needs for the medium term (weeks to months) can be met by utilising existing assets, particularly power plants and grid assets, by introducing new operational practices and changing the way they operate, supplemented by investments in network infrastructure and storage options including demand response.
Contractual structures and institutions also play a key role in unlocking flexibility since they facilitate the optimal dispatch of power plants in the system, though having a flexible contractual structure is not an easy task due to the long-term nature of the contract. Southeast Asia has a variety of different power sector structures: Singapore and the Philippines have liberalised markets with retail competition and system operations that are unbundled from generation; Thailand and Indonesia have vertically integrated

Southeast Asia Energy Outlook 2022
PAGE | 117
Energy Perspectives
structures with state-owned utilities that are responsible for both generation and grid operation; and Viet Nam is currently transitioning towards a wholesale electricity market. For Indonesia and Thailand, electric utilities also act as the single buyer, purchasing bulk electricity from independent power producers (IPPs) under PPAs and fuel supply contracts. Liberalised markets and unbundling can often provide additional flexibility for power systems, but there are also other contractual options to promote it for countries in this region that do not have markets.
Commercial flexibility, which is provided by underlying contractual structures and institutions in the power sector, plays a crucial role to
facilitate the optimal use of the technical flexibility resources. For example, PPAs could be adapted to better reflect the technical flexibility of power plants such as ramp rates, minimum stable operating levels and start-up times in providing system services.
Modern system operation practices provide another mechanism to foster the more flexible use of technical assets, particularly power plants and grids. This includes real-time monitoring and dispatch, forecasting and system services (i.e. ancillary services), which help address the technical and economic concerns relating to a high share of VRE.

Southeast Asia Energy Outlook 2022
PAGE | 118
Energy Perspectives
Fossil fuels are the main source of technical flexibility in the countries of Southeast Asia, but low-carbon technologies and storage are set to play an increasing role
Share of generation technologies in providing energy, peak demand and system services in Indonesia, 2019 and 2030
IEA. All rights reserved
Note: The data are based on the Java-Bali and Sumatra systems. Ramping flexibility is based on hourly ramp capabilities of the fleet to meet hourly variation of supply and demand during the top 100 hours. Inertia is the capability of the system provided by kinetic energy stored in rotational mass to keep the system stable if there is a shortfall in power. Demand response is not included despite its having the potential flexibility.
0% 20% 40% 60% 80% 100%
Coal Gas Hydro Geothermal Oil Bioenergy & other renewables Variable renewables Storage
Ramping flexibility
Peak capacity / adequacy
Energy
Inertia
2019 2030 SDS
0% 20% 40% 60% 80% 100%

Southeast Asia Energy Outlook 2022
PAGE | 119
Energy Perspectives
Southeast Asia has a large and relatively young fleet of coal- and gas-fired power plants. Minimum take generation and renewables will exceed peak demand to 2030 in many countries.
Capacity-weighted average age in 2021 and in 2030 of power plants in Southeast Asia (left) and minimum take obligations in a case of a 15% share of variable renewables in 2030 peak demand for Thailand during 2020-2030 (right)
IEA. All rights reserved.
Note: Assumes that the technical lifespans of coal and gas plants are 40 years and 30 years, respectively. Others (right figure) include coal- and gas-fired generation. Minimum take generation is the minimum quantity of generation to be purchased to secure revenue streams for the generator. Source: IEA (2021), The Role of Low-Carbon Fuels in the Clean Energy Transitions of the Power Sector; IEA (2021), Thailand Power System Flexibility Study.
10 000
20 000
30 000
40 000
50 000
60 000
2020 2022 2024 2026 2028 2030Pr
ojec
ted
capa
city
and
dem
and
(MW
)Others @ 65% minimum take Others @ 45% minimum takeCo-gen @ 100% minimum take Hydro @ 55.6% capacityRenewables @ maximum Peak demand
5 10 15 20
Gas CCGT
Gas GT
Gas Steam
Coal Ultrasupercritical
Coal Supercritical
Coal IGCC
Coal Subcritical
Years
2030 2021

Southeast Asia Energy Outlook 2022
PAGE | 120
Energy Perspectives
There are many technical options available to provide power system flexibility, but boosting contractual flexibility is needed to make the best use of technical flexibility resources
Power generation capacity in Southeast Asia increases significantly in the coming decades in both the STEPS and SDS, and the bulk of generation capacity additions comes from VRE sources. This new capacity will require increasing levels of flexibility. In Southeast Asia, coal and gas thermal power plants currently provide the major source of electricity generation and flexibility. Many of these assets are relatively young: for example, the current average age of the coal plants in Thailand and Indonesia is between 5 and 10 years.
Southeast Asia also has a very diverse range of renewable energy resource potential that could provide low-carbon sources of flexibility, including bioenergy, hydropower, geothermal and a potential for ocean energy. Batteries can also be deployed to boost the flexibility of countries’ power systems.
In Southeast Asia, there is a heavy reliance on physical PPAs, 2 especially in the vertically integrated power systems such as Indonesia and Thailand. Many of the existing coal- and gas-fired power plants in the region were financed with physical PPAs with large capacity payments and/or minimum take provisions, which are subject to take-or-pay obligations. Physical PPAs have historically
2 In many countries in Southeast Asia, physical PPAs are long-term contracts (typically 20+ years) between electric utilities and a generator for the delivery of electricity and other services to the grid
been an efficient way to incentivise investment in regions dominated by coal- and gas-fired power generation and that have seen rapid growth in electricity demand (as experienced in Southeast Asia during the 1990s). However, if dispatchable assets or entities have a contract that ensures operators a minimum load each day, then the assets have no incentives to act flexibly. The merit order is effectively changed in these power systems, making it more financially attractive for system operators to run baseload generation and curtail renewables.
Adapting contractual structures is important but this needs to be carried out carefully to avoid negatively impacting investor confidence. One option is to hold auctions for lowering guaranteed minimum production levels. Plants willing to operate on these terms at the lowest cost would be selected for restructuring; this would be voluntary and based on competitive bidding to allow generators to provide flexibility to the system.
with agreed prices consisting of capacity and energy payments. Physical PPAs often agree on a minimum quantity of generation to be purchased to secure revenue streams for the generator.

Southeast Asia Energy Outlook 2022
PAGE | 121
Energy Perspectives
In Thailand, the potential cost savings from flexible PPAs and fuel supply contracts are significantly greater than possible savings from flexible power plants and storage options
Operational cost savings from flexible fuel supply contracts in Thailand in 2030
IEA. All rights reserved.
Note: VOM cost = variable operations and maintenance cost. Source: IEA (2021), Thailand Power System Flexibility Study.
10
20
30
40
50
60
Flexible power plants and storage Flexible contracts
Mill
ion
USD VOM cost
Start-up andshutdowncost
Ramp cost
Fuel cost

Southeast Asia Energy Outlook 2022
PAGE | 122
Energy Perspectives
Adapting minimum-take obligations in PPAs and fuel supply contracts can help to make the most of technical flexibility options
To analyse the effect of contractual flexibility issues in Southeast Asia, the IEA conducted the Thailand Power System Flexibility Study, which shows that contractual inflexibility is the greatest barrier to running a cleaner power system at an affordable cost since it prevents the use of otherwise available and cost-optimal resources in the system. For example, there are minimum-take obligations in the physical PPAs between EGAT (the system operator in Thailand) and private power producers.
In a scenario with a high share of VRE (15% in 2030) and high wind and solar PV production during peak demand, the combination of minimum take generation and renewable production always exceeds peak demand in all years to 2030. The inflexibility of PPAs prevents the adjustment of this high level of minimum-take obligations, meaning that renewables would likely need to be curtailed to ensure power system adequacy.
An additional factor impacting technical flexibility options is presented by fuel supply contracts as many existing fuel contracts in Southeast Asia have strict minimum take-or-pay obligations. This means that coal- and natural gas-fired power plants have very low marginal costs as the fuel is effectively a sunk cost. Even if the generation asset is incentivised to provide system services, it may be more economical
to continue to provide baseload generation. Fuel supply contracts can hinder flexibility even if the PPA structure has appropriate incentives for the producers to provide flexibility.
The cost savings from shifting towards more flexible PPAs and fuel supply contracts could be significantly greater than the savings from investing in technical flexibility resources. Designing fuel supply and power purchase contracts with sufficient flexibility leaves headroom for lower-cost energy sources such as VRE and technical assets that provide critical system services to participate in the market, resulting in overall cost savings.
Portfolio approaches for fuel supply can also be implemented to increase flexibility in a cost-effective way. These approaches mix less-flexible long-term contracts that hedge against price fluctuations with more flexible shorter-term contracts. For example, while flexible gas contracts may be more expensive than contracts with stringent take-or-pay conditions, the overall system cost can be reduced with a mixture of contract types to provide flexibility. A portfolio procurement strategy can optimise fuel supply contracts with respect to cost, risk and flexibility. It is therefore important to evaluate the cost effectiveness of approaches at the system level rather than individual fuel supply contracts.

Southeast Asia Energy Outlook 2022
PAGE | 123
Energy Perspectives
Cross-border interconnections and trade in Southeast Asia are developing
Electricity interconnections and trading partners in Southeast Asia and beyond Country Interconnection(s) with… Trade Flows Domestic Market Structure
Brunei Darussalam None None Vertically integrated
Cambodia Lao PDR, Thailand, Viet Nam Exports to Thailand Imports from Lao PDR, Thailand and Viet Nam
Vertically integrated
Indonesia Malaysia (from West Kalimantan)* Exports mainly to Malaysia Vertically integrated
Lao PDR Cambodia, Myanmar**,Thailand and Viet Nam Exports to Cambodia, Malaysia (via Thailand), Thailand and Viet Nam Vertically integrated
Malaysia Indonesia (to West Kalimantan)*, Singapore*, Thailand
Imports from Lao PDR (via Thailand), Thailand Exports to Singapore using existing interconnector previously used for non-financial exchanges
Vertically integrated
Myanmar Lao PDR**, Thailand** Vertically integrated Philippines None Restructured market
Singapore Malaysia*
Bidirectional, non-financial exchange with Malaysia Imports from Malaysia (pending) and Lao PDR under LTMS-PIP
Restructured market
Thailand Cambodia, Lao PDR, Malaysia, Myanmar**
Import from Cambodia and Lao PDR Wheeling between Lao PDR and Malaysia
Vertically integrated
Viet Nam Cambodia, Lao PDR Export to Cambodia Import from Lao PDR
Transitioning from vertically integrated to restructured market
* Used primarily for security and back up. ** Distribution level connection servicing rural areas. Note: All vertically integrated markets allow for independent power producer generation, but state-owned enterprises remain single buyers.

Southeast Asia Energy Outlook 2022
PAGE | 124
Energy Perspectives
Multilateral trade arrangements for cross-border power trade can also boost flexibility
Power system flexibility can also be boosted in Southeast Asia through multilateral power trading. This can allow for efficient resource sharing, particularly for renewable resources. For example, the hydropower resources in Lao PDR could provide flexibility to Viet Nam and Thailand via exports, and Viet Nam could in turn export power produced during times of high solar PV output to Lao PDR to minimise curtailment. On Borneo, integration between Malaysia, Indonesia and Brunei Darussalam can be highly complementary given the high level of hydro resources in Indonesia's Kalimantan, which could also be exported to other regions through interconnectors and cross-border trade. A more dynamic setup for multilateral power trade will increase flexibility in the region and facilitate the integration of VRE and reduce overall system costs.
Institutional setups and contractual structures must be adapted to facilitate multilateral cross-border power trade. There are a number of fixed long-term bilateral transfer agreements which can limit flexibility as they are not designed to differentiate imports and exports on a daily or hourly basis. More flexible inter-regional market models could be introduced, with elements such as continuous data sharing across borders and frameworks to ensure ease of trade (to avoid prolonged contract negotiations to change transfer schedules).
Southeast Asia has a major programme of work devoted to developing multilateral power trade – the ASEAN Power Grid (APG) – which encompasses both building physical infrastructure
and creating markets to allow for its efficient utilisation. Under the APG, the ASEAN Interconnection Masterplan Study III has been developed to provide a comprehensive update on cross-border interconnections with a high penetration of VRE. The IEA has also published a study outlining the key steps for Southeast Asia to boost multilateral power trade.
Recent developments and plans of inter-regional grids The Lao-Thailand-Malaysia-Singapore Power Integration Project (LTMS-PIP) was jointly agreed in 2014 to study the technical viability of cross-border power trade of up to 100 MW through existing interconnections. In 2020, the ASEAN Ministers on Energy Meeting announced that they would initiate the project in 2022. This was viewed as a significant step towards realising the APG.
Beyond the LTMS-PIP, Singapore announced that it plans to import up to 4 GW of electricity by 2035 which would form about 30% of total supply. This new supply is expected to be delivered via new interconnectors and supply projects. There are also plans for the Australia-Asia PowerLink project to be operational from 2028; this would be the first intercontinental power grid connecting Australia to Singapore. Such projects will boost grid interconnectivity and potentially pave the way for setting up market mechanisms for multilateral power trade in the future.

Southeast Asia Energy Outlook 2022
PAGE | 125
Energy Perspectives
Critical minerals in Southeast Asia

Southeast Asia Energy Outlook 2022
PAGE | 126
Energy Perspectives
Accelerated clean energy transitions in Southeast Asia could create huge market opportunities for key clean energy technologies
Estimated market size for selected clean energy technologies in Southeast Asia
IEA. All rights reserved.
Note: Market share estimates are the product of anticipated average market prices and sales of tradeable units of the core technologies: solar PV modules, wind turbines, lithium-ion batteries (for EVs and grid storage), electrolysers and fuel cells. This differs from investment or spending estimates that include, for example, installation costs.
10
20
30
40
50
60
2020 2030 2050 2030 2050
Billi
on U
SD (2
020) Fuel cells
Electrolysers
Batteries
Offshore wind
Onshore wind
Solar PV
SDSSTEPS

Southeast Asia Energy Outlook 2022
PAGE | 127
Energy Perspectives
Southeast Asia is poised to play a major role in clean energy supply chains, both as a consumer of low-carbon technologies and as a key supplier of critical minerals
Accelerating energy transitions in Southeast Asia requires a significant scale-up in the deployment of clean energy technologies. In the SDS, new electric vehicle sales grow from a low base today to nearly 20 million in 2050 (including seven million electric cars), accounting for over 90% of new vehicle sales. Solar PV and wind account for nearly two-thirds of annual power capacity additions by 2050 in the SDS and around 6.5 GW of battery storage is added in 2050 – more than all battery storage additions globally in 2020.
As a result, Southeast Asia is set to emerge as a major market for clean energy technologies. In the SDS, the combined market for wind turbines, solar panels, lithium-ion batteries, electrolysers and fuel cells represents a cumulative market opportunity to 2050 worth over USD 800 billion.
The strong growth in clean energy technologies globally provides huge opportunities for Southeast Asia to capture additional value in supply chains. Malaysia and Viet Nam are already the world’s second and third largest manufacturers of solar PV modules, and in aggregate accounted for one-fifth of global shipments in 2020. The growth in Viet Nam has been especially fast since 2015, when its share was less than 1%.
Indonesia and the Philippines have large nickel resources and they are aiming to develop integrated battery and EV supply chains. In
September 2021, construction began on Indonesia’s first EV battery plant worth USD 1.1 billion. In January 2022, the Indonesian government signed a memorandum of understanding with several companies to support EV battery manufacturing in the country. Thailand, the biggest vehicle manufacturer in the region – and 11th largest in the world – could also become a key hub for the manufacturing of EVs. In February 2022, the Thai government approved a package of incentives to promote a shift to EVs and boost domestic EV production to 30% of all cars produced by 2030.
The region holds considerable potential as a reliable supplier of critical minerals. However, helping to meet the growing global demand for these minerals in the SDS presents a major challenge. Southeast Asia holds large amounts of mineral reserves for key energy transition minerals such as bauxite, nickel, tin and rare earth elements. The region also produces cobalt, manganese, graphite, silicon, copper, bauxite and alumina. The region is already a key participant in the supply and processing of some of these, and its importance in global markets is set to grow.
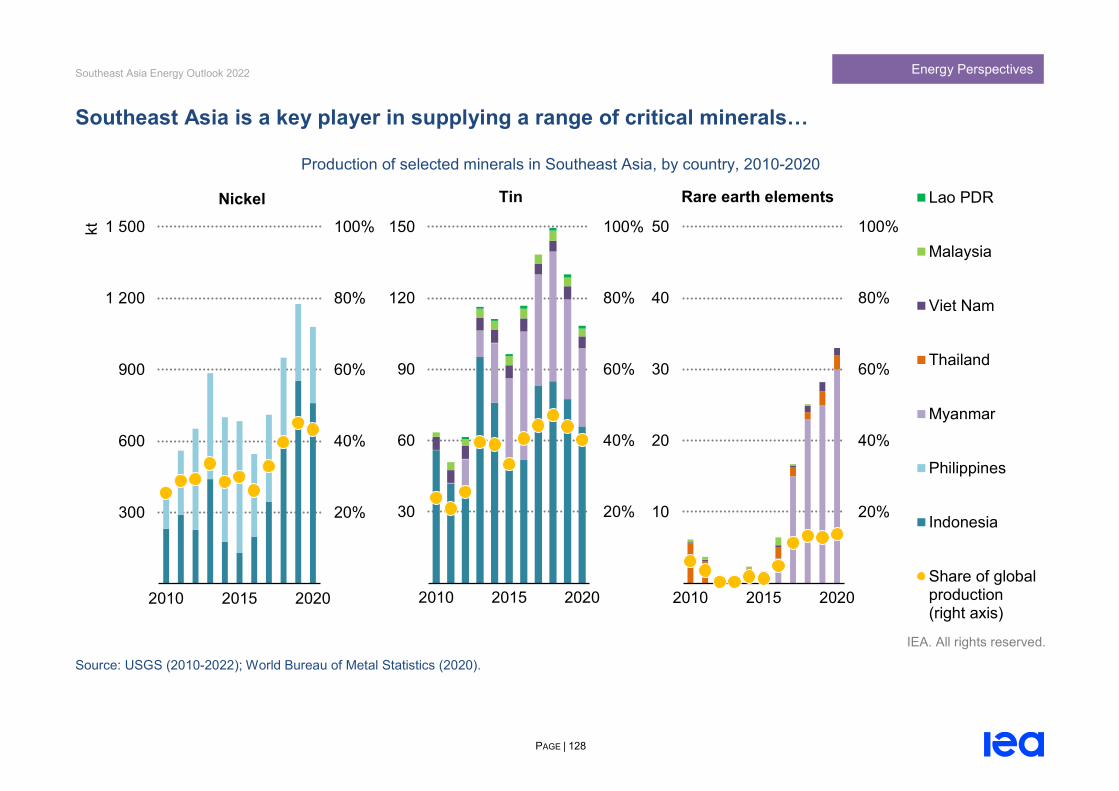
Southeast Asia Energy Outlook 2022
PAGE | 128
Energy Perspectives
Southeast Asia is a key player in supplying a range of critical minerals…
Production of selected minerals in Southeast Asia, by country, 2010-2020
IEA. All rights reserved.
Source: USGS (2010-2022); World Bureau of Metal Statistics (2020).
20%
40%
60%
80%
100%
300
600
900
1 200
1 500
2010 2015 2020
kt
Lao PDR
Malaysia
Viet Nam
Thailand
Myanmar
Philippines
Indonesia
Share of globalproduction(right axis)
Nickel
20%
40%
60%
80%
100%
30
60
90
120
150
2010 2015 2020
Tin
20%
40%
60%
80%
100%
10
20
30
40
50
2010 2015 2020
Rare earth elements

Southeast Asia Energy Outlook 2022
PAGE | 129
Energy Perspectives
...especially in the production of nickel, tin and rare earth elements
Nickel Nickel is an important mineral for lithium-ion batteries, geothermal power and electrolysers. As high-nickel cathodes constitute a growing share in battery chemistries, nickel demand for clean energy technologies is set to expand rapidly, growing by 20 times from 2020 to 2040 in the SDS. Indonesia and the Philippines are the two largest nickel producers in the world. Their share of global production has risen considerably since 2010, from 25% to around 50% in 2021. This share is set to expand further in the coming years, as they are responsible for around 70% of global production growth over the period to 2025.
Indonesia alone accounts for around half of the total growth globally, so nickel supply chains are likely to be significantly affected by policy developments and other events in Indonesia. On 1 January 2020, the government of Indonesia implemented a ban on nickel ore exports, two years ahead of initial plans, as it intended to nurture a downstream industry. Nickel ore exports to China dropped by nearly 90% in 2020, forcing Chinese refiners to find new sources of ore supply from the Philippines and New Caledonia, and to seek investment opportunities in Indonesia. Chinese companies invested and committed some USD 30 billion in the Indonesian nickel supply chain, with Tshingshan’s investments in the Morowali and Weda Bay industrial parks being the most prominent examples.
In Indonesia, the successful commissioning of planned high-pressure acid leaching (HPAL) projects, which are capable of producing high-grade nickel from its vast laterite resources, will have a significant impact on the near-term global supplies of nickel. The Philippines is also trying to tap its large resources by lifting a ban on new developments. Major challenges for the two countries are to develop their resources in a sustainable manner, given their high carbon-intensity of electricity and many issues around tailings disposal and land-use and biodiversity impacts. Addressing these concerns will be crucial to positioning the region as a reliable and responsible supplier of nickel.
Tin Tin is used for soldering in a wide range of electronic components, including those in clean energy technologies. Indonesia and Myanmar are the second and third largest tin producers in the world after China, and Southeast Asia as a whole accounts for around 35% of global production and a third of all reserves.
Tin demand is expected to surge on the back of growing clean energy deployment, but there are limited new projects planned, which raises concerns around potential market tightening in the years ahead. Indonesia is considering stopping tin exports in 2024, following bauxite and copper ore,and this would pose additional challenges.

Southeast Asia Energy Outlook 2022
PAGE | 130
Energy Perspectives
Rare earth elements Rare earth elements are used in certain types of EV motors and wind turbines. They are one of the most geographically concentrated minerals in terms of extraction and processing, with China representing 60% of global mining operations. Nonetheless, production in Myanmar has grown rapidly since the mid-2010s. Today it accounts for 13% of global production and is the world’s third largest producer behind China and the United States. Myanmar is a particularly important producer of heavy rare earths such as dysprosium, and supplied about half of China’s heavy rare earth concentrates in 2020. On 1 February 2021, the coup d’état in Myanmar that brought down the elected government and imposed military rule triggered concerns of potential supply disruptions. Viet Nam and Thailand are reported to have large resources, but there has not yet been major progress in converting resources into production.
Separation and refining operations for rare earth elements are heavily concentrated in China (90% market share in 2020); the only large non-Chinese facility in operation today is the Lynas Advanced Materials Plant in Malaysia.
Other critical minerals Cobalt, manganese and graphite are important minerals for EV batteries. The Philippines is the fourth largest cobalt producer in the world, accounting for around 3% of global production. Myanmar and Malaysia are the tenth and twelfth largest manganese producers,
together accounting for just over 3% of global production. Viet Nam accounts for 0.5% of global graphite production.
Silicon is a key mineral in the production of solar PV panels, and is also increasingly used in EV battery anodes to increase energy density. Malaysia is the world’s ninth largest producer of silicon, accounting for 1% of global production in 2021.
Copper and aluminium are widely used in all clean energy technologies, including solar PV modules, wind turbines, EVs and electricity networks. Indonesia, Myanmar and the Philippines are the major copper producing countries in the region, collectively accounting for around 4% of global production. Aluminium metal is most commonly produced from alumina, which is in turn produced from bauxite. Southeast Asia accounts for 6% of global bauxite production and 22% of global reserves.

Southeast Asia Energy Outlook 2022
PAGE | 131
Energy Perspectives
Investment in the exploration and development of critical minerals in the region has declined in recent years...
Southeast Asia mineral exploration budget, 2000-2021
IEA. All rights reserved.
Source: S&P Global Intelligence (2022).
1%
2%
3%
4%
5%
200
400
600
800
1 000
2000 2005 2010 2015 2020
USD
mill
ion
Exploration budget
Global share (right axis)

Southeast Asia Energy Outlook 2022
PAGE | 132
Energy Perspectives
…hampered in part by limited geological information and lack of technical capacity
The mining sector has historically been an important contributor to government revenues, GDP and employment in Southeast Asia. In Indonesia, for example, the sector accounts for around 2.5% of government revenues, 5% of GDP and provides over 1.4 million jobs.
Investment in mining and minerals development in the region have declined in recent years and the region’s share of global exploration spending has halved since 2012. A lack of exploration investment could threaten the long-term future of minerals production in the region. Foreign direct investment (FDI) in mining has also declined from an average of 6% of total FDI between 2012 and 2015 to just 1.4% in 2020.
The ASEAN Minerals Cooperation Action Plan (AMCAP-III) Phase 2: 2021-2025 identified several priority areas to promote investment in mineral exploration in the region. These include “developing new strategies and effective tools for collecting and processing data for the ASEAN minerals information system to drive investments and sustainable development” and “building human, institutional and technical capacities”.
High quality geological data and resource mapping are key decision-making tools to encourage greater investment in minerals development. Governments in the region face a range of challenges in improving geological surveys, including budget constraints, a lack
of IT and technical resources and capacity as well as coordination issues with local government authorities and mining companies.
Governments can work to improve their national geological surveys in a number of ways, including increasing budget allocations, facilitating technical capacity building and training, and providing guidance and assistance to local governments. They could also consider leveraging digital technologies such as remote sensing and machine learning techniques. These efforts can be complemented by regional and international cooperation, such as working to improve the quality and accessibility of the ASEAN minerals information system.
Capacity building efforts can target specific technical needs and fields, such as geology, mining engineering and environmental science, or regulatory and administrative skills of government levels at different levels, including local and subnational governments. Regional and international cooperation as well as public-private sector partnerships can complement domestic capacity building initiatives. Capacity building can have positive, long-term effects across all parts of mineral development, including by improving the quality and access to geological data, facilitating investment in exploration and ensuring sustainable production and governance.

Southeast Asia Energy Outlook 2022
PAGE | 133
Energy Perspectives
The region needs to address environmental, social and governance concerns
Southeast Asia is already a key supplier of several of the critical minerals needed for clean energy transitions. However, as consumers and investors increasingly demand that manufacturers source minerals that are sustainably and responsibly produced, the region must improve its environmental performance and governance systems to position itself as a reliable supplier in the coming years.
Environmental concerns There is a wide range of environmental issues associated with mining in the region, including GHG emissions levels, impacts on local air quality, water use, water quality, biodiversity and land-use, as well as handling of mining waste.
Coal accounts for around 40% of power generation in the region, resulting in a grid with very high emissions intensities for GHG emissions and local air pollutants. Power is required for a variety of mineral development activities, including energy-intensive operations such as smelters and projects employing HPAL (see box).
Mining and processing activities also use large volumes of water. For example, producing one kilogram of nickel from limonite type laterites through HPAL uses over 300 litres of water directly and 1 400 litres indirectly. Water pollution is also a serious concern, with rivers near operating and abandoned mines contaminated by heavy metals.
Battery-grade nickel production from HPAL Indonesia and the Philippines are rich in laterite resources, which are typically used as a feedstock to produce lower-purity Class 2 products for stainless steel. Battery cathodes require higher-purity Class 1 products, typically produced from sulphide ores. Hydrometallurgical processes such as HPAL can use laterite resources to produce Class 1 nickel.
HPAL faces several challenges such as high capital costs, a track record of cost overruns and delays, and major environmental risks. HPAL can emit twice as many GHGs and use five times more water than nickel production from high-grade sulphide deposits. HPAL generates an acidic slurry which must be neutralised and properly contained, but land-based tailing dams in the region are subject to high precipitation and seismic activity, posing a contamination risk to nearby waterbodies. Deep-sea tailings placement is being considered, but this raises concerns for marine ecosystems.
Improvements to HPAL or alternative processing technologies to reduce costs and environmental risks could help Indonesia and the Philippines maximise the benefits from their nickel resources.

Southeast Asia Energy Outlook 2022
PAGE | 134
Energy Perspectives
Nickel deposits in Indonesia and the Philippines are typically mined using open-cut methods, since laterite ores are formed near the surface and located horizontally in the soil. These deposits cover vast areas, and are often located beneath rainforests with rich biodiversity and carbon absorption. In 2021, the Philippines lifted a nine-year ban on new mines as well as a four-year ban on new open-pit mines, raising concerns for land use and water quality impacts.
Social and governance concerns Social and governance concerns stemming from mining in the region also need to be addressed. These range from adverse impacts on livelihoods and forced community displacement to poor safety standards and corruption.
Mining activities in the region have been linked to reduced fish resources, negatively impacting livelihoods in coastal communities through the disposal of sediments, wastewater with high temperatures and effluents with toxic substances, affecting coral reefs and limiting the productivity of nearshore areas. Mining activities can degrade air quality for communities (mostly due to mining dust or coal dust), cause more frequent floods due to sediment build-up, and pollute drinking water sources.
Additional concerns include human rights abuses, poor working conditions and safety standards as well as corruption. Corruption at different levels of government in the region has been well documented. Indonesia Corruption Watch indicates that many mining
companies are owned by those with close affiliations with politicians and top government officials. Women, particularly in rural and indigenous communities, face displacement and violence, as well as exclusion from employment and consultative processes.
International assessments of governance in extractive sectors in Southeast Asia show a mixed picture. The 2017 Resources Governance Index assessed the mining sectors of several countries in the region: Indonesia (68, Satisfactory) the Philippines (58, Weak), Lao PDR (38, Poor), Cambodia (30, Poor), Myanmar (27, Failing). The Extractive Industries Transparency Initiative (EITI) assesses countries on their progress towards meeting the good governance standards. They found that the Philippines is making “satisfactory progress” as of 2018, while Indonesia is making “meaningful progress” as of 2017. Myanmar was temporarily suspended in 2021.
Myanmar’s military coup in February 2021 has not only sparked concern regarding mineral supplies, but also broader concerns around the implications of illegal mining activities. Illegal rare earth mining poses health and environmental risks to neighbouring communities and ecosystems, while poor governance and corruption could see profits funding armed conflict.

Southeast Asia Energy Outlook 2022
PAGE | 135
Energy Perspectives
Southeast Asia’s metal recycling rates remain among the lowest in the world
Recycling input rates for aluminium and copper in selected regions
IEA. All rights reserved.
Note: Share of secondary production in total refined product consumption. Source: World Bureau of Metal Statistics (2020), World Metal Statistics Yearbook.
20%
40%
60%
80%
100%
NorthAmerica
Europe Globalaverage
China SoutheastAsia
Aluminium
20%
40%
60%
80%
100%
Europe China Globalaverage
NorthAmerica
SoutheastAsia
Copper
Lessthan 1%

Southeast Asia Energy Outlook 2022
PAGE | 136
Energy Perspectives
Priorities for Southeast Asia to realise its full potential as a reliable supplier of critical minerals
Address environmental, social and governance concerns Mitigating the wide range of environmental and social impacts from mining requires a comprehensive approach and concerted action from government and industry. Policies are needed to encourage the displacement of unabated coal-fired power with low-carbon sources to help reduce the emissions intensity of mineral production and processing. Industry should conduct robust environmental impact assessments to identify and implement measures to mitigate impacts during and after mining, such as restoration and rehabilitation activities to mitigate water pollution impacts on surrounding ecosystems and communities.
As a first step in improving governance and transparency, other governments in the region with extractive industries are encouraged to join Indonesia and the Philippines to become “implementing countries” of the EITI. Implementing countries of the EITI undergo regular assessments of progress and adhere to specific reporting requirements.
Develop and scaleup recycling Recycling and other circular economy practices relieve pressure on primary supply and significantly reduce the adverse environmental and social impacts associated with minerals extraction and processing. For bulk metals, recycling practices are well established
globally, but recycling input rates for some metals in the region are well below the global average. Secondary production of aluminium accounts for just 2.5% of total refined consumption in the region, compared with 25% globally. Copper recycling is almost non-existent.
Recycling processes and infrastructure are still in the early stages of development for many energy transition minerals such as battery metals and rare earth elements. The first battery recycling plant in the region was opened in Singapore in 2021, capable of processing 5 000 tonnes of batteries per year. With EV sales, especially two/three-wheelers, growing rapidly in the region, additional recycling plants will be needed in the coming decades to extract critical minerals from spent batteries. In addition to facilitating the construction of new battery recycling plants, national and local governments should work together to build the necessary supporting infrastructure to collect spent batteries and harmonise regulations.
Enhance capacity building Enhancing capacity building efforts across the region is central to ensuring the sustainable production and governance of mining activities. This includes technical capacity building (e.g. geological surveys, reserve estimation, sustainable mining practices) as well as institutional capacity building for sound governance and transparent regulations.

Southeast Asia Energy Outlook 2022
PAGE | 137
Annex
Annex

Southeast Asia Energy Outlook 2022
PAGE | 138
Acknowledgements
Acknowledgements
This report was prepared by the World Energy Outlook (WEO) team in the Directorate of Sustainability, Technology and Outlooks (STO), in co‐operation with other directorates of the International Energy Agency (IEA). Toru Muta co‐ordinated the work and was the lead author, and he designed and directed the report together with Tim Gould, Chief Energy Economist and Head of Division for Energy Supply and Investment Outlooks, and Christophe McGlade, Head of the Energy Supply Unit.
The other principal authors and contributors from across the agency were: Lucila Arboleya Sarazola (lead on investment), Charlene Bisch (modelling), Musa Erdogan (modelling), Shai Hassid (power), Pablo Hevia-Koch (power flexibility), Craig Hart (power flexibility), Jérôme Hilaire (fuel supply), George Kamiya (critical minerals), Tae-Yoon Kim (critical minerals, oil), Vanessa Koh (power flexibility, country policies), Randi Kristiansen (power flexibility), Laura Maiolo (natural gas), Lia Newman (economy and subsidies), Ksenia Petrichenko (efficiency), Ryszard Pospiech (modelling and data management), Rebecca Schulz (oil), Leonie Staas (demand, efficiency and access), Peerapat Vithayasrichareon (power flexibility) and Peter Zeniewski (low-carbon fuels, gas). Marina dos Santos and Eleni Tsoukala provided essential support.
The report relied on the scenario modelling and support from across the entire WEO team, in particular from Stéphanie Bouckaert,
Timothy Goodson, Inchan Hwang, Pawel Olejarnik, Thomas Spencer and Brent Wanner, as well as valuable guidance from Laura Cozzi, Chief Energy Modeller and Head of Division for Energy Demand Outlooks.
The report benefitted greatly from contributions from other experts within the IEA: Yuya Akizuki, Christophe Barret, Alexandre Bizeul, Xiushan Chen, Chiara Delmastro, Carlos Fernandez Alvarez, Araceli Fernandez Pales, Carl Greenfield, Akos Losz, Samantha Mcculloch, Ermi Miao, Gergely Molnar, Hidenori Moriya, Takashi Nomura, Amalia Pizarro, Uwe Remme, Melanie Slade, Jacob Teter and Tiffany Vass. Kieran Clarke, the IEA’s programme manager for Southeast Asia, and Nathaniel Lewis-George provided support and advice throughout. Elspeth Thomson carried editorial responsibility.
Mary Warlick (Deputy Executive Director of the IEA and Acting Director of STO) provided support and guidance throughout the project. Valuable comments and feedback were provided by senior management and other colleagues within the IEA, in particular Keisuke Sadamori, Toril Bosoni, Peter Fraser, Timur Gül, Cesar Alejandro Hernandez, Tom Howes, Brian Motherway, Roberta Quadrelli and Masatoshi Sugiura.
Thanks go to the IEA’s Communications and Digital Office for their help in producing the report, particularly to Jad Mouawad, Astrid

Southeast Asia Energy Outlook 2022
PAGE | 139
Acknowledgements
Dumond, Gregory Viscusi, Jethro Mullen, Taline Shahinian, Therese Walsh and Allison Leacu.
The IEA would like to thank ASEAN member countries and the ASEAN Secretariat for their co-operation and support with numerous aspects of this analysis. The work could not have been undertaken without the support and co-operation provided by many government bodies, organisations and companies worldwide; we would like to
express particular gratitude in this respect for funding and other support from the Ministry of Economy, Trade and Industry of Japan. The analysis on power flexibility was made possible through the Clean Energy Transitions in Emerging Economies programme, which has received funding from the European Union’s Horizon 2020 research and innovation programme under grant agreement No. 952363.
Many high-level government representatives and experts from outside of the IEA provided input and reviewed preliminary drafts of the report. Their comments and suggestions were of great value. They include:
Rabiah Al Adawiyah T.Hussein ASEAN Secretariat (ASEC) Venkatachalam Anbumozhi Economic Research Institute for
ASEAN and East Asia (ERIA) Jun Arima The University of Tokyo Scott Bartos United States Agency for International
Development (USAID), United States Harmeet Bawa Hitachi Energy Mick Buffier Glencore Anna Dan Ministry of Foreign Affairs, Japan Muhammad Ery Wijaya Climate Policy Initiative (CPI) Bert Fabian United Nations, Environment
Programme (UNEP) Marie Gail de Sagon ASEAN Secretariat (ASEC)
Masazumi Hirono Tokyo Gas Masashi Hoshino Ministry of Economy, Trade and
Industry (METI), Japan Shigeru Kimura Economic Research Institute for ASEAN
and East Asia (ERIA) Agnes Koh Energy Market Authority (EMA),
Singapore Ken Koyama The Institute of Energy and Economics,
Japan (IEEJ) Nathan Lee National Renewable Energy Laboratory
(NREL) David Lutman The UK-led Friends of Indonesia
Renewable Energy (FIRE) Dialogues, United Kingdom
Yuji Matsuo The Institute of Energy and Economics, Japan (IIEJ)
David Morgado Asian Development Bank (ADB) Lamberto Dai Pra’ Enel

Southeast Asia Energy Outlook 2022
PAGE | 140
Acknowledgements
Mentari Pujantoro Agora Energiewende Lourdes Sanchez International Institute for Sustainable
Development (IISD) Hans-Wilhelm Schiffer RWTH Aachen University Elvira Di Sibio Eni Tharinya Supasa Agora Energiewende Cecilia Tam Organisation for Economic Co-operation
and Development (OECD) Pradeep Tharakan Asian Development Bank (ADB) Ruengsak Thitiratsak Petroleum Institute of Thailand (PTIT) Fabby Tumiwa Institute for Essential Services Reform
(IESR) Nicholas Wagner International Renewable Energy Agency
(IRENA) Matthew Wittenstein United Nations Economic and Social
Commission for Asia and the Pacific (ESCAP)
Kelvin Wong DBS Bank Peter Wood Shell plc Akira Yabumoto J-power Zulfikar Yurnaidi ASEAN Centre for Energy (ACE)

This publication reflects the views of the IEA Secretariat but does not necessarily reflect those of individual IEA member countries. The IEA makes no representation or warranty, express or implied, in respect of the publication’s contents (including its completeness or accuracy) and shall not be responsible for any use of, or reliance on, the publication. Unless otherwise indicated, all material presented in figures and tables is derived from IEA data and analysis.
This publication and any map included herein are without prejudice to the status of or sovereignty over any territory, to the delimitation of international frontiers and boundaries and to the name of any territory, city or area.
IEA. All rights reserved.
IEA Publications International Energy Agency
Website: www.iea.org
Contact information: www.iea.org/about/contact
Typeset in France by IEA - May 2022
Cover design: IEA - Photo credits: © Gettyimages