The crystal chemistry of martensite in NiTiHf shape memory alloys
9
This article appeared in a journal published by Elsevier. The attached copy is furnished to the author for internal non-commercial research and education use, including for instruction at the authors institution and sharing with colleagues. Other uses, including reproduction and distribution, or selling or licensing copies, or posting to personal, institutional or third party websites are prohibited. In most cases authors are permitted to post their version of the article (e.g. in Word or Tex form) to their personal website or institutional repository. Authors requiring further information regarding Elsevier’s archiving and manuscript policies are encouraged to visit: http://www.elsevier.com/copyright
Transcript of The crystal chemistry of martensite in NiTiHf shape memory alloys

This article appeared in a journal published by Elsevier. The attachedcopy is furnished to the author for internal non-commercial researchand education use, including for instruction at the authors institution
and sharing with colleagues.
Other uses, including reproduction and distribution, or selling orlicensing copies, or posting to personal, institutional or third party
websites are prohibited.
In most cases authors are permitted to post their version of thearticle (e.g. in Word or Tex form) to their personal website orinstitutional repository. Authors requiring further information
regarding Elsevier’s archiving and manuscript policies areencouraged to visit:
http://www.elsevier.com/copyright

Author's personal copy
The crystal chemistry of martensite in NiTiHf shape memory alloys
Mehrdad Zarinejad a, Yong Liu a,*, Timothy J. White b
a School of Mechanical and Aerospace Engineering, Nanyang Technological University, Nanyang Avenue, Singapore 639798b School of Materials Science and Engineering, Nanyang Technological University, Nanyang Avenue, Singapore 639798
a r t i c l e i n f o
Article history:Received 18 January 2008Received in revised form 1 April 2008Accepted 1 April 2008Available online 22 May 2008
Keywords:A. Intermetallics, miscellaneousB. Crystal chemistry of intermetallicsD. Martensitic structureF. DiffractionD. Site occupancy
a b s t r a c t
The crystal structure of martensite in NiTiHf shape memory alloys of compositional formulas Ni50Ti50
�xHfx, Ti50Ni50�xHfx, and Ni(100�x)/2Ti(100�x)/2Hfx (5� x� 20) were studied. The monoclinic lattice pa-rameters and angle were changed by introduction of larger Hf atoms into the NiTi crystal. The changeswere related not only to larger atomic radius of Hf but also to its effect on bond lengths. At the same Hfcontent, Ti-rich alloys exhibited larger cell volumes than Ni-rich alloys. The equiatomic alloys showedsmaller unit cell volumes than the other two groups possibly due to more isotropic bonding. Valenceelectron per atom (ev/a) and valence electron concentration (ev/et) of the alloys were found to influencethe atomic bond lengths and unit cell dimensions. From the crystal structure refinement, Hf site pref-erence and occupancy were determined. The similar tendency of Hf towards occupancy in Ni and Ti sites,results in its preference for available sites in the structure.
� 2008 Elsevier Ltd. All rights reserved.
1. Introduction
In NiTi shape memory alloys an important aim is to elevate themartensitic transformation temperature in order to satisfy the hightemperature applications of the shape memory effect, and additionof Pt, Pd, Zr or Hf to NiTi is especially effective [1–10]. Among thepotential high temperature shape memory alloys (SMAs) thosebelonging to the ternary NiTiHf alloys are attractive due to theirgood thermal stability and low cost. Apart from the work of Potapov[11], most of the recent studies on NiTiHf SMAs have been related toprocessing, shape memory behavior, microstructure evolution andcompositional modification by copper addition [9–16]. Moreover,these investigations have been focused on Ni-rich alloys in whichHf is replaced for Ti. Consequently, the interaction of ternary ele-ments such as Hf in the structure of NiTi, which promotes thechange of transformation temperatures, hysteresis, and shapememory behavior in this group of SMAs requires further exami-nation. The shape memory effect in these alloys is influenced by thecharacteristics of the crystallographic transformation of austeniteto martensite. The role of Hf addition in modifying the martensitecrystal structure is presently unclear. The crystallochemicalaccommodation behavior of Hf is also of paramount importance forclarification of the mechanisms by which it alters the shapememory transformation characteristics of NiTi. Fortuitously, theconsiderable differences in atomic numbers Hf (Z¼ 72) with Ti
(Z¼ 22) and Ni (Z¼ 28) results in well separated X-ray scatteringfactors, which underpin the determination of Hf site preference inNiTi alloys. In the present work the crystal chemistry of Ni-rich, Ti-rich and equiatomic NiTi shape memory alloys containing Hf (5–20atomic percent (at%)) are studied by quantitative X-ray diffractionand the partitioning of Hf over the crystallographic sites in alloysare determined.
2. Crystallographic relationships
The parent phase of all NiTi-based alloys, austenite, has a cubicB2 (ordered body centered cubic) structure. Depending on com-position and thermomechanical treatment, the B2 phase trans-forms to its ground-state martensite B190 by one of the threetransformation paths: B2 (Pm-3m)–B190 (P21/m), B2 (Pm-3m)–B19(Pmmb)–B190 (P21/m) or B2 (Pm-3m)–R (P3)–B190 (P21/m) [17]. B190
has a monoclinic crystal structure of P21/m space group. The mar-tensitic transformation of B2–B190 is basically a group–subgroupsymmetry change. In NiTiHf alloys the direct transformation of B2–B190 takes place [13]. In the present work B190 crystal structure isused as the starting model for the refinement of the crystal struc-ture of martensite in NiTiHf alloys.
3. Experimental methods
NiTiHf shape memory alloys containing 5–20 at% Hf were pre-pared in 25 g batches by combining high purity (MaTecK, 99.97%)Ti, Ni, and (MaTecK, 99.9%) Hf pellets in stoichiometric amounts,and arc melting under argon atmosphere in an Emund Buhler
* Corresponding author. Tel./fax: þ65 6790 4951.E-mail address: [email protected] (Y. Liu).
Contents lists available at ScienceDirect
Intermetallics
journal homepage: www.elsevier .com/locate/ intermet
0966-9795/$ – see front matter � 2008 Elsevier Ltd. All rights reserved.doi:10.1016/j.intermet.2008.04.004
Intermetallics 16 (2008) 876–883

Author's personal copy
miniarc melting system. The resulting disc-shaped precursors ofapproximately 3 cm diameter were initially homogenized at 950 �Cfor 8 h in a high-vacuum furnace (1.8� 10�5 Pa). The specimenswere solution treated for a second time at 950 �C for 1 h followedby water quenching to ambient temperature.
For semi-quantitative analysis of elements energy dispersivespectroscopy (EDS) was carried out on four different regions of thespecimens polished to a mirror-finish surface. A JEOL JSM-5600LNscanning electron microscope (SEM), operated at the acceleratingvoltage of 15 keV, was used. The chemical compositions for Ni andTi were within 0.05–0.14 at% and for Hf within 0.10–0.22 at% of thenominal values of the alloys.
X-ray diffraction was used to analyze the crystal structures ofthe polycrystalline alloys. Patterns were collected using Cu Ka ra-diation by scanning in the 2q range of 10–120� at intervals of 0.02�
with a dwelling time of 4 s. Crystal structure analysis was con-ducted using the fundamental parameter Rietveld procedure asimplemented in TOPAS (version 3) [18]. A Rietveld refinementinvolves fitting of the full experimental diffraction pattern withcalculated profiles and background. All the parameters that definea diffraction pattern are parameterized in such a way that they canbe changed in a recurrent process to minimize the weightedsquared difference between the experimental data (Yi) and thetheoretically predicted value (Yical) at each angular position,according to Eq. (1):X
i
wi Yi � Yicalð Þ2 (1)
where i varies from 1 to the number of observation and wi¼ 1/Yi isthe reciprocal of the variance associated to the ith observation. Thecrystallographic model of monoclinic (P21/m) B190 NiTi martensiteand (Pm-3m) B2 austenite were used as starting models for therefinements (Table 1 [19]). For each refinement, the followingparameters were varied: the background parameter, scale factor,cell parameters, zero point correction, Lorenzien crystal size, iso-tropic thermal parameters, site occupancy factors, and atom sitecoordinates. The strain factors and preferred orientation parame-ters were not refined. Fig. 1 illustrates a typical refined diffractionprofile of the alloys. The diffraction peaks correspond to B190 NiTimartensite. No evidence of precipitates is observed in the diffrac-tion profiles. The refinements resulted in good fits to the experi-mental data and Bragg reliability factor (Rb) values from 3.4% to 5.1%were obtained. The structure analysis was carried out following thestandard method of least-squares for observed reflections. Here Rb
is defined by Eq. (2):
Rb ¼P
Fo � Fcð ÞPFo
(2)
where Fo and Fc are observed and calculated structure factors,respectively. The crystallite size of the specimens was in the range25–35 nm.
The martensitic transformation temperatures of select alloyswere determined using a TA 2920 differential scanning calorimeter
(DSC). The rate of temperature change during measurements was10 �C/min.
4. Results
4.1. Trends in unit cell constants
Austenite was present only in low amounts (less than 5 volumepercent) in the specimens containing 5 at% Hf and therefore, wasincluded in the refinement of these specimens. The focus of thisstudy is on the martensite crystal structure changes, thus onlymartensite structure is presented.
Fig. 2 illustrates a schematic of the unit cell of NiTi B190 mar-tensite. The unit cell volumes of the NiTiHf alloys expand with in-creasing Hf content in Ni-rich, Ti-rich and equiatomic NiTi alloys(Fig. 3a). At constant Hf content, Ti-rich alloys are dilated with re-spect to Ni-rich alloys and the equiatomic alloys have the smallestvolumes. Expansion with increasing Hf is almost linear, althoughthe rate is slightly higher in Ti-rich alloys. At Hf concentrationsbelow 10 at%, Ti-rich and Ni-rich alloys have similar cell volumes;whereas above this concentration the differences become moresignificant. The origin of the changes in volume is clear when therelative changes in lattice parameters are considered. The variationof ‘c’ and ‘a’ lattice parameters with hafnium content in all thealloys is similar, increasing linearly with Hf concentration (Fig. 3band c). At low Hf concentration the alloys show small differences in‘a’ lattice parameter, but considerable extension in the ‘c’ cell edge.The ‘a’ lattice expansion becomes more significant as the Hf contentof the alloys increases (Fig. 3c). Behavior of the ‘b’ cell edge is morecomplex (Fig. 3d), decreasing in Ni-rich alloys, but increasing lin-early in Ti-rich alloys with Hf content with the latter showingsmaller ‘b’ parameters compared to the former at Hf contents�15 at%. In equiatomic alloys ‘b’ lattice parameter expands lesssignificantly and stabilizes around 4.10 Å.
The monoclinic angle (b) becomes more obtuse with increasingHf content (Fig. 4). In equiatomic alloys, the rate of change is small(less than 1 degree over 15 at% difference in Hf content), comparedto the Ni-rich and Ti-rich alloys (more than 2 degrees over the samecompositional range). The change is most pronounced at Hfconcentrations above 10% in all alloys. At constant Hf compositions,Ti-rich alloys crystallize with slightly larger b angles compared toNi-rich alloys (Fig. 4).
4.2. Atomic site displacements
In binary NiTi, the atoms are in general parameters of Ni (0.04,0.25, 0.67), and Ti (0.42, 0.25, 0.22) in the B190 crystal structure [19].The change of these atomic parameters for Ti and Ni in x, y, and zdirections as a result of increasing Hf concentration of the latticeare reported in Table 2.
The change in x-parameter of Ni in equiatomic alloys is small,but becomes slightly more significant in Ni-rich and Ti-rich alloyswhen the Hf concentration is 20 at% (Table 2). The trend of thedisplacement along x-axis in all three groups of the alloys is similar.The Ni displacement along y-axis is relatively very small in allalloys. The z-parameter of Ni sites in equiatomic alloys remainsalmost constant whereas it increases for Ni-rich and Ti-rich alloys(Table 2).
The displacement of Ti sites (0.42) along x-axis with increasingHf is shown in Table 2. At 20 at% Hf, in equiatomic alloys, theamount of displacement is less than that observed in Ni-rich and Ti-rich alloys. The y-parameter of Ti sites in all alloys remains almostconstant or changes slightly. In all the alloys the Ti z-parameterincreases in a similar fashion by increasing Hf content.
Schematic projections of the crystal structures of binaryNi50Ti50, equiatomic, Ni-rich, and Ti-rich alloys containing 15 at% Hf
Table 1Crystallographic data of the monoclinic NiTi model [19]
Phase(space group)
Lattice parameters (Å) andmonoclinic angle
Atomic parameters
x y z
B190 (P21/m) a¼ 2.898 Ni 0.04 0.25 0.67b¼ 4.108 Ti 0.42 0.25 0.22c¼ 4.646b¼ 97.78�
B2 (Pm-3m) a¼ 3.015 Ni 0 0 0Ti 0.5 0.5 0.5
M. Zarinejad et al. / Intermetallics 16 (2008) 876–883 877

Author's personal copy
along y-axis, are illustrated in Fig. 5. The typical relative averagepositions of Ni site (dark) and Ti site (light) along ‘a’ and ‘c’ latticeparameters with respect to the binary alloy have been indicated. Ingeneral it appears that the displacement of Ni is greater than Tiespecially along z-axis, and site positions experience smaller shiftsin equiatomic alloys.
4.3. Hafnium partitioning
The refined Hf site preference and fractional occupancies in themonoclinic B190 crystal structures of the alloys are presented inTable 3. In Ni-rich specimens Hf shows an exclusive preference forthe Ti sites when Hf content of the alloy �15 at%, although at the
highest Hf content (Ni50Ti30Hf20) approximately 1/5 of the Ni isreplaced. In Ti-rich specimens, Hf replaces only Ni sites at Hf con-centration of 10 at%, however, above this some Hf occupies the Tisites. By increasing the nominal Hf content of the alloy the frac-tional occupancy of Hf in Ni site increases; whereas the corre-sponding occupancy in Ti site does not increase. The refinementresults show that in equiatomic alloys, Hf occupies both sites ap-proximately equally with increasing Hf content. The total Hf at%,calculated based on the fractional occupancies of Ti and Ni sites arenear the nominal values in all the alloys. Determination of Hf sitepreference and occupancy in specimens containing only 5 at% Hfwas inconclusive due to insufficient electron difference contrast.For Ti-rich and equiatomic alloys containing 20 at% Hf, therefinements could not converge to reliable, reproducible valuesprobably due to higher Rb values (Table 3).
5. Discussion
The Rietveld refinements suggest that the B190 (P21/m) mono-clinic crystal structure can be used to refine the martensite struc-ture of NiTiHf alloys for 5�Hf at%�20. Simulated X-ray diffractionpatterns showed Rb values of 3.4% to 5.1%. The fits for Ni(100�x)/
2Ti(100�x)/2Hfx equiatomic alloys are slightly less accurate (higher Rb
values) which can be indicative of departure from P21/m spacegroup especially at Hf content of 15 and 20 at%. For samples con-taining 10 at% or more of Hf, the presence of only a monoclinicstructure with no evidence of secondary phases confirms a singlephase solid solution.
5.1. Valence electrons, bond lengths and lattice dimensions
Increasing Hf concentration in the B190 structure dilates the unitcell by expansion of the ‘a’ and ‘c’ lattice parameters and openingthe monoclinic angle b (Figs. 3 and 4). The ‘b’ cell edge behaves ina contrary fashion in Ni-rich alloys, but expands in Ti-rich alloysand to a lesser extent in the equiatomic alloys.
The arrangement of atoms and unit cell volume of an in-termetallic crystal is controlled by bond lengths which in turn aredictated by both the size of the atoms and the valence electrons ofthe material [20]. The volume dependence of intermetallic unit celldimensions on the size of the constituent atoms has been thesubject of several studies in recent years [20–27]. These efforts haveaimed to correlate the cell volume with the size, binding energy,and atomic radii of the constituent atoms. However, the complexinteraction of the electronic structure of metals in different atomicenvironments, especially transition metals where d–d and s–d or-bital behavior are not clearly understood, no general correlationshave been found. The number of valence electron contributions to
4030 7060502010
Co
un
ts
5000
4000
3000
2000
1000
0
2Th Degrees
11010090806050
Structure 100.00 %
Fig. 1. Rietveld refinement of room temperature diffraction profile of Ni45Ti45Hf10 indicating the difference curve and martensite peak positions.
Fig. 2. Schematic of the unit cell of NiTi B190 martensite structure. Atoms are shown indark (Ni) and light (Ti) colors.
M. Zarinejad et al. / Intermetallics 16 (2008) 876–883878

Author's personal copy
the atomic environment (sþ d electrons), total electrons, hybrid-ization and even electronegativity can be important factors thatmay have determining roles on bond length and unit cell size [20–27]. Preferential partitioning of Hf to the Ni sites results in a greaterexpansion in crystal lattice compared to substitution for Ti, espe-cially at higher Hf concentrations. This can be attributed to a largerdifference in atomic radius of Hf (1.58 Å) and Ni (1.29 Å) comparedto that of Hf and Ti (1.45 Å). While, based on this size effect, at
constant Hf, for equiatomic alloys, unit cell volumes of larger thanNi-rich and smaller than Ti-rich alloys are expected, lesser expan-sions observed in equiatomic alloys may reflect near equimolarpartitioning of Hf over the Ni and Ti sites that leads to an enhancedpacking density. In order to clarify why the equiatomic alloys showa slightly smaller volume, an analysis of valence electrons and thebond lengths of the atoms of the alloys is useful.
The valence electrons are electrons in the outermost principalquantum level of an atom. For transition metals the valence elec-trons are usually considered as the number of d and s electrons foran atom. In equiatomic NiTi alloy, the electronic configurations of Ti
0 5 10 15 20 2550
52
54
56
58
60
62
64 Ni(100-x)/2Ti(100-x)/2HfxNi50-xTi50HfxNi50Ti50-xHfx
Un
it cell vo
lu
me (Å
3)
Hf (at%)
0 5 10 15 20 254.50
4.60
4.70
4.80
4.90
5.00
c-lattice p
aram
eter (Å
)
Hf (at%)
Ni(100-x)/2Ti(100-x)/2HfxNi50-xTi50HfxNi50Ti50-xHfx
0 5 10 15 20 25
2.80
2.90
3.00
3.10
3.20 Ni(100-x)/2Ti(100-x)/2HfxNi50-xTi50HfxNi50Ti50-xHfx
a-lattice p
aram
eter (Å
)
Hf (at%)
0 5 10 15 20 253.90
4.00
4.10
4.20
4.30Ni(100-x)/2Ti(100-x)/2HfxNi50-xTi50HfxNi50Ti50-xHfx
b-lattice p
aram
eter (Å
)
Hf (at%)
a b
c d
Fig. 3. Variations of (a) unit cell volume, (b) ‘c’ lattice parameter (c) ‘a’ lattice parameter and (d) ‘b’ lattice parameter with Hf content of NiTiHf alloys.
0 5 10 15 20 2597.0
97.5
98.0
98.5
99.0
99.5
100.0
100.5
101.0
(º)
Hf (at%)
Ni(100-x)/2Ti(100-x)/2HfxNi50-xTi50HfxNi50Ti50-xHfx
Fig. 4. Hf content dependence of monoclinic angle of the crystal structure of B190
martensite.
Table 2Refined atomic parameters (x, y, z) of Ni and Ti sites in Ni-rich, Ti-rich and equia-tomic NiTiHf alloys
Alloy Composition Atomic parameter(Ni)
Atomic parameter(Ti)
X Y z x y z
Binary Ni50Ti50 1.04 0.250 0.67 0.42 0.250 0.22Ni-rich Ni50Ti45Hf5 0.98 0.246 0.69 0.47 0.246 0.15
Ni50Ti40Hf10 1.00 0.236 0.71 0.50 0.244 0.18Ni50Ti35Hf15 1.01 0.239 0.74 0.55 0.240 0.22Ni50Ti30Hf20 1.05 0.241 0.77 0.57 0.235 0.26
Ti-rich Ti50Ni45Hf5 0.96 0.244 0.71 0.48 0.234 0.16Ti50Ni40Hf10 0.98 0.238 0.75 0.52 0.237 0.20Ti50Ni35Hf15 1.04 0.232 0.80 0.56 0.244 0.26Ti50Ni30Hf20 1.08 0.231 0.84 0.58 0.247 0.29
Equiatomic Ni47.5Ti47.5Hf5 0.97 0.239 0.69 0.48 0.231 0.15Ni45Ti45Hf10 0.99 0.237 0.69 0.49 0.228 0.18Ni42.5Ti42.5Hf15 1.00 0.234 0.69 0.48 0.226 0.21Ni40Ti40Hf20 0.99 0.231 0.68 0.46 0.229 0.23
M. Zarinejad et al. / Intermetallics 16 (2008) 876–883 879

Author's personal copy
and Ni, are, Ti: 1s22s22p63s23p64s23d2, Ni: 1s22s22p63s23p64s23d8,and the number of valence electrons, (ev), of these elements areeTi
v ¼ 4, eNiv ¼ 10. The valence electrons per atom of ternary NiTiHf
alloys can be calculated based on the atomic fraction of the ele-ments in the alloy as by Eq. (3):
ev
a¼ fNie
Niv þ fTie
Tiv þ fHf eHf
v (3)
where fNi, fTi, and fHf represent the atomic fractions of elements inthe alloy for Ni, Ti and Hf, and eNi
v , eTiv , and eHf
v are the correspondingnumber of valence electrons of Ni, Ti and Hf, respectively. Since Tiand Hf (5d26s2) have identical number of valence electrons, thereplacement of Hf for Ti in the alloys does not affect electron ratio ofthe Ni-rich alloys; whereas substitution of Hf for Ni reduces the
valence electron concentration in Ti-rich and equiatomic alloys to<7 depending on the Hf content. Fig. 6 shows the change of averagerefined bond lengths of atomic sites (Ni–Ni, Ti–Ti, and Ni–Ti), asa function of valence electrons per atom of the alloys for Ti-rich, Ni-rich, and equiatomic alloys. These lengths are the average of lengthsof Ni site and Ti site with six nearest neighbors, extracted from thestructure refinement. The average length of Ni–Ni site bonds in-creases in all the alloys with increasing Hf content (Fig. 6a). Theincrease of bond length occurs as a result of incorporation of largerHf into the site in Ni-rich alloys. No change in the number of va-lence electrons per atom is resulted. In the case of Ti-rich andequiatomic alloys the increase of bond is the result of larger size ofthe Hf, influenced by the reduction of the valence electrons peratom. The corresponding Ni–Ni bond length averages in Ti-rich, andNi-rich alloys are larger than equiatomic alloys (Fig. 6a). The Ti–Tisite average bond length increased in Ni-rich and Ti-rich alloys withincreasing Hf, however, with comparatively smaller changes thanNi–Ni bonds (Fig. 6b). In equiatomic alloys Ti–Ti bond length re-mains almost constant. The Ni–Ni and Ti–Ti bond lengths changesfollow the variations observed for ‘a’ and ‘c’ lattice dimensionalexpansion (Fig. 3). By increasing the Hf content, the Ni–Ti bondlength remains almost constant for equiatomic alloys, slightlyreduces or remains constant for Ni-rich alloys, and increases mar-ginally for Ti-rich alloys. It seems that incorporation of Hf, mainlyaffects the Ni–Ni and Ti–Ti bond lengths.
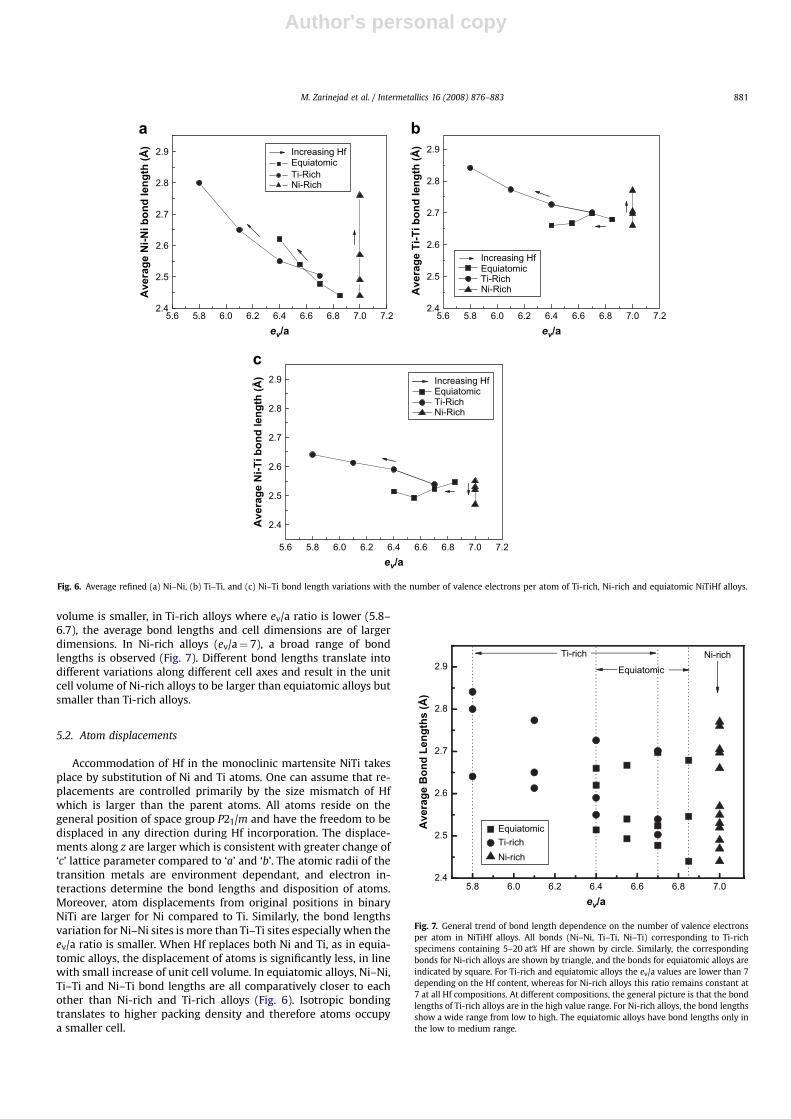
A general look at the variation of all the average bond lengths asa function of ev/a shows an interesting trend as is illustrated inFig. 7. The average bond lengths decrease with increasing electronper atom ratio in the ev/a range of 5.8 to near 7. At ev/a¼ 7 (Ni-richgroup), however, where s and d orbitals are completely filleda broader range of the bond lengths is observed. In the equiatomicalloys with an ev/a ratio of 6.7–6.925, the average bond lengths arein the medium to lower range of the graph therefore the unit cell
a b
Ti/Hf
Ni/Hf
Ti/Hf
Ni/Hf
c d
Ti
Ni/Hf
Ti/Hf
Ni
Ti/Hf
Ni
Fig. 5. Schematic projection of the crystal structure of (a) binary Ni50Ti50, (b) Ni42.5Ti42.5Hf15, (c) Ni50Ti35Hf15, and (d) Ni35Ti50Hf15 along C010D direction, comparing the typicalrelative average positions of Ni site (dark) and Ti site (light) along ‘a’ and ‘c’ lattice parameters with respect to the binary alloy.
Table 3Site preference and occupancy of Hf in Ni-rich, Ti-rich and equiatomic NiTiHf alloys
Alloy Composition Preferredsite
Fractionalsiteoccupancy
RefinedHf(at%)
Rb
(%)
Ti Ni
Ni-rich Ni50Ti45Hf5 – – – – 3.4Ni50Ti40Hf10 Ti 0.24 0 12 3.5Ni50Ti35Hf15 Ti 0.36 0 18 4.4Ni50Ti30Hf20 Ti 0.41 0.10 26 4.0
Ti-rich Ti50Ni45Hf5 Ni – – – 3.5Ti50Ni40Hf10 Ni 0 0.17 8.5 3.8Ti50Ni35Hf15 Ni 0.09 0.33 20 4.1Ti50Ni30Hf20 Ni – – – 5.1
Equiatomic Ni47.5Ti47.5Hf5 – – – – 3.0Ni45Ti45Hf10 Ti, Ni 0.14 0.11 12.5 3.4Ni42.5Ti42.5Hf15 Ti, Ni 0.21 0.25 23 4.2Ni40Ti40Hf20 Ti, Ni – – – 5.1
M. Zarinejad et al. / Intermetallics 16 (2008) 876–883880
Author's personal copy
volume is smaller, in Ti-rich alloys where ev/a ratio is lower (5.8–6.7), the average bond lengths and cell dimensions are of largerdimensions. In Ni-rich alloys (ev/a¼ 7), a broad range of bondlengths is observed (Fig. 7). Different bond lengths translate intodifferent variations along different cell axes and result in the unitcell volume of Ni-rich alloys to be larger than equiatomic alloys butsmaller than Ti-rich alloys.
5.2. Atom displacements
Accommodation of Hf in the monoclinic martensite NiTi takesplace by substitution of Ni and Ti atoms. One can assume that re-placements are controlled primarily by the size mismatch of Hfwhich is larger than the parent atoms. All atoms reside on thegeneral position of space group P21/m and have the freedom to bedisplaced in any direction during Hf incorporation. The displace-ments along z are larger which is consistent with greater change of‘c’ lattice parameter compared to ‘a’ and ‘b’. The atomic radii of thetransition metals are environment dependant, and electron in-teractions determine the bond lengths and disposition of atoms.Moreover, atom displacements from original positions in binaryNiTi are larger for Ni compared to Ti. Similarly, the bond lengthsvariation for Ni–Ni sites is more than Ti–Ti sites especially when theev/a ratio is smaller. When Hf replaces both Ni and Ti, as in equia-tomic alloys, the displacement of atoms is significantly less, in linewith small increase of unit cell volume. In equiatomic alloys, Ni–Ni,Ti–Ti and Ni–Ti bond lengths are all comparatively closer to eachother than Ni-rich and Ti-rich alloys (Fig. 6). Isotropic bondingtranslates to higher packing density and therefore atoms occupya smaller cell.
5.6 5.8 6.0 6.2 6.4 6.6 6.8 7.0 7.22.4
2.5
2.6
2.7
2.8
2.9EquiatomicTi-RichNi-Rich
Averag
e N
i-N
i b
on
d len
gth
(Å
)
ev/a
Increasing Hf
a
5.6 5.8 6.0 6.2 6.4 6.6 6.8 7.0 7.22.4
2.5
2.6
2.7
2.8
2.9
EquiatomicTi-RichNi-Rich
Averag
e T
i-T
i b
on
d len
gth
(Å
)
ev/a
Increasing Hf
b
5.6 5.8 6.0 6.2 6.4 6.6 6.8 7.0 7.2
2.4
2.5
2.6
2.7
2.8
2.9
Averag
e N
i-T
i b
on
d len
gth
(Å
)
ev/a
EquiatomicTi-RichNi-Rich
Increasing Hf
c
Fig. 6. Average refined (a) Ni–Ni, (b) Ti–Ti, and (c) Ni–Ti bond length variations with the number of valence electrons per atom of Ti-rich, Ni-rich and equiatomic NiTiHf alloys.
5.8 6.0 6.2 6.4 6.6 6.8 7.02.4
2.5
2.6
2.7
2.8
2.9
EquiatomicTi-richNi-rich
ev/a
Ti-rich
EquiatomicNi-rich
Averag
e B
on
d L
en
gth
s (Å
)
Fig. 7. General trend of bond length dependence on the number of valence electronsper atom in NiTiHf alloys. All bonds (Ni–Ni, Ti–Ti, Ni–Ti) corresponding to Ti-richspecimens containing 5–20 at% Hf are shown by circle. Similarly, the correspondingbonds for Ni-rich alloys are shown by triangle, and the bonds for equiatomic alloys areindicated by square. For Ti-rich and equiatomic alloys the ev/a values are lower than 7depending on the Hf content, whereas for Ni-rich alloys this ratio remains constant at7 at all Hf compositions. At different compositions, the general picture is that the bondlengths of Ti-rich alloys are in the high value range. For Ni-rich alloys, the bond lengthsshow a wide range from low to high. The equiatomic alloys have bond lengths only inthe low to medium range.
M. Zarinejad et al. / Intermetallics 16 (2008) 876–883 881

Author's personal copy
5.3. Hafnium site preference
From the refined Hf site occupancy results (Table 3) it can beconcluded that Hf prefers to occupy the available sites in NiTimonoclinic structure as its tendency towards the Ni and Ti sites atequally available sites (equiatomic alloys) is almost similar. Bozzoloet al. have reported the absolute site preference of elements in NiTi,PdTi, and PtTi systems based on atomistic modeling [28,29]. In NiTithe atomistic modeling predicts an energy gap of 6.21 and 4.26 eVfor substitution of Hf in Ni and Ti sites, respectively [28]. Based onthis criterion, the tendency of Hf for Ni and Ti is near each otherwith more inclination towards Ni sites. In the present work we haveexperimentally shown that Hf preference of Ni and Ti sites arealmost similar.
5.4. Transformation temperature
The martensite start temperatures (Ms) of selected NiTiHf alloysare reported in Table 4. As discussed, the addition of Hf to NiTistructure results in changes of bond lengths, lattice parameters andunit cell volumes. It may also result in reduction of the number ofvalence electrons of the alloys (in equiatomic and Ti-rich alloys).These two variations cause the valence electron density (VED), thenumber of valence electrons per unit cell of the crystal, to change.The average ratio of valence electrons, cv, over total electrons of thealloy (average number of valence electrons divided by averageatomic number of the alloy) [30] also changes. The authors haverecently shown that the valence electron density and valenceelectron concentration (cv) variations follow a similar trend in NiTi-based shape memory alloys [30]. The values of this parameter forthe alloys are reported in Table 4. By increasing the Hf content ofthe alloy, cv is decreased. There is an established relationship be-tween bulk moduli of the alloys and their valence electron densityor concentration. By increasing the VED or cv, the bulk and shearmoduli increases [30,31]. Hence increasing Hf content in Ni-richalloys which is accompanied by unit cell expansion (Fig. 3) andreduction of cv (Table 4) results in the elastic moduli of NiTi crystalto decrease and shear to occur at higher temperatures. The netresult is the elevation of the martensitic transformation tempera-ture (Table 4). For the purpose of comparison, the Ms of specimenscontaining 15 at% Hf, in Ni-rich, equiatomic and Ti-rich conditionare reported (Table 4). The difference in Ms in these alloys is simi-larly related to their slight difference in cv. The lower the cv thehigher the transformation temperature. A more comprehensiveunderstanding of the dependence of martensitic transformationtemperature on valence electron concentration (density) in NiTi-based shape memory alloys have recently been introduced by theauthors [30].
6. Conclusions
Based on the crystal structure refinement of Ni50Ti50�xHfx,Ti50N50�xHfx, and Ni(100�x)/2Ti(100�x)/2Hfx (5� x� 20) the followingconclusions are drawn:
1. As a result of Hf addition to NiTi structure, the ‘a’ and ‘c’ latticeparameters, monoclinic angle (b), and unit cell volumeincrease; whereas ‘b’ contracts in Ni-rich alloys and expands inTi-rich and equiatomic alloys. This may be related to differentatom bond attractions at ev/a s 7 (Ti-rich and equiatomicalloys), and ev/a¼ 7 (Ni-rich alloys) which can influence bondlength along ‘b’ lattice.
2. The average Ni–Ni, Ti–Ti and Ni–Ti site bond lengths in NiTiHfalloys decrease by increasing the valence electrons per atomratio (ev/a) of the alloy when ev/a s 7 (Ti-rich and equiatomicalloys). At ev/a¼ 7 (Ni-rich alloys), increasing Hf content resultsin expansion of Ni–Ni and Ti–Ti site bonds and contraction ofNi–Ti site bonds.
3. Unit cell variations are influenced not only by the atomic radiusof Hf but also by changes to the electronic structure of the alloy.In the present study it was found that at constant Hf contentthe unit cell volume could be ranked as Ti-rich>Ni-rich> equiatomic alloys.
4. The partitioning of Hf across the Ni and Ti sites is similar in NiTimartensite structure.
References
[1] Firstov G, Van Humbeeck J, Koval YN. High temperature shape memory alloysproblems and prospects. J Intel Mater Syst Str 2006;17:1041–9.
[2] Hsieh SF, Wu SK. Room temperature phases observed in Ti53�xNi47Zrx high-temperature shape memory alloys. J Alloys Compd 1998;266:276–82.
[3] Suzuki Y, Xu Y, Morito S, Otsuka K, Mitsoe K. Effects of boron additions onmicrostructure and mechanical properties of Ti–Pd–Ni high temperatureshape memory alloys. Mater Lett 1998;36:85–94.
[4] Panuranga MK, Shin DD, Carman GP. Shape memory behavior of hightemperature Ti–Ni–Pt thin films. Thin Solid Films 2006;515:1938–41.
[5] Xu Y, Shimizu S, Suzuki Y, Otsuka K, Ueki T, Mitose K. Recovery andrecrystallization processes in Ti–Pd–Ni high-temperature shape memoryalloys. Acta Mater 1997;45:1503.
[6] Cai W, Otsuka K, Asai M. Martensite aging effect in Ti–Pd and Ti–Pd–Ni hightemperature shape memory alloys. Mater Trans JIM 1999;40:895–8.
[7] Hsieh SF, Wu SK. A study on lattice parameters of martensite in Ti50.5–Ni49.5–Zrx shape memory alloys. J Alloys Compd 1998;270:237–41.
[8] Cesari E, Ochin P, Portier R, Kolomystsev V, Koval Y, Pasko A, et al. Structureand properties of Ti–Ni–Zr and Ti–Ni–Hf melt-spun ribbons. Mater Sci Eng A1999;273–275:738–44.
[9] Meng XL, Cai W, Chen F, Zhao LC. Effect of aging on martensite transfomationand microstructure in Ni-rich TiNiHf shape memory alloy. Scripta Mater 2006;54:1599–604.
[10] Kockar B, Karaman I, Kim JI, Chumlyakov Y. A method to enhance cyclicreversibility of NiTiHf high temperature shape memory alloys. Scripta Mater2006;54:2203–8.
[11] Potapov PL, Shelyakov AV, Gulyaev AA, Svistunova EL, Mateveena NM,Hodgson D. Effect of Hf on the structure of Ni–Ti martensitic alloys. Mater Lett1997;32:247–50.
[12] Chastaing K, Vermaut P, Ochin P, Segui C, Laval JY, Portier R. Effect of Cu andHf additions on martensitic transformation. Mater Sci Eng A 2006;438–440:661–5.
[13] Thoma PE, Boehm JJ. Effect of composition on the amount of second phase andtransformation temperatures of NixTi90�xHf10 shape memory alloys. Mater SciEng A 1999;273–275:385–9.
[14] Meng XL, Tong YX, Lau KT, Cai W, Zhou LM, Zhao LC. Effect of Cu addition onphase transformation of Ti–Ni–Hf high-temperature shape memory alloys.Mater Lett 2002;57:452–6.
[15] Besseghini S, Villa E, Tuissi A. Ni–Ti–Hf shape memory alloy: effect of agingand thermal cycling. Mater Sci Eng A 1999;273–275:390–4.
[16] Meng XL, Cai W, Zheng YF, Zhao LC. Phase transformation and precipitation inaged Ti–Ni–Hf high-temperature shape memory alloys. Mater Sci Eng A 2006;430–440:666–70.
[17] Otsuka K, Ren X. The physical metallurgy of Ni–Ti-based shape memory alloys.Prog Mater Sci 2005;50:511–678.
[18] Cheary RW, Coelho A. A fundamental parameters approach to X-ray lineprofile fitting. J Appl Crystallogr 1992;25:109–21.
[19] Kudoh Y, Tokonami M, Miyazaki S, Otsuka K. Crystal structure of themartensite in Ti-49.2 at% Ni alloy analyzed by the single crystal X-raydiffraction method. Acta Metall 1985;33:2049.
[20] Simon A. Intermetallic compounds and the use of atomic radii in theirdescription. Angew Chem Int Ed 1983;22:95–113.
[21] Bhatia ML, Cahn RW. Lattice parameter and volume changes on disordering.Intermetallics 2005;13:474–83.
[22] Cahn RW. Lattice parameter changes on disordering. Intermetallics 1999;7:1089–94.
Table 4Transformation temperatures and valence electron concentration of selected NiTiHfalloys
Alloy Ms ev/a cv
NiTi 59 7.00 0.280Ni50Ti40Hf10 120 7.00 0.233Ni50Ti35Hf15 200 7.00 0.215Ni42.5Ti42.5Hf15 215 6.55 0.204Ni35Ti50Hf15 235 6.10 0.193
M. Zarinejad et al. / Intermetallics 16 (2008) 876–883882

Author's personal copy
[23] Bhatia ML, Singh AK, Nandy TK. Volume size factor and lattice parameter incubic intermetallics with the B2 structure. Intermetallics 1997;6:141–6.
[24] Weber HJ. Bond volumes in crystals and glasses and a study of the germinateanomaly. J Non-Cryst Solids 1999;243:220–32.
[25] Bakonyi I. Atomic volumes and local structure of metallic glasses. Acta Mater2005;53:2509–20.
[26] Coreno-Alonso O. Unit cell volume of intermetallic compounds calculatedusing volume size factor. Intermetallics 2006;14:475–82.
[27] Mekhrabov AO,Akdeniz MV. Effectof ternaryalloyingelements additiononatomicordering characteristics of Fe–Al intermetallics. Acta Mater 1999;47:2067–75.
[28] Bozzolo G, Noebe RD, Mosca HO. Site preference to ternary alloying additionsto NiTi. J Alloys Compd 2005;389:80–94.
[29] Bozzolo G, Mosca HO, Noebe RD. Phase structure and site preference behaviorof ternary alloying additions to PdTi and PtTi shape memory alloys.Intermetallics 2007;15:901–11.
[30] Zarinejad M, Liu Y. Dependence of transformation temperatures of NiTi-basedshape memory alloys on the number and concentration of valence electrons.Adv Funct Mater, in press.
[31] Gilman J. Electronic basis of the strength of materials. Cambridge UK:Cambridge University Press; 2003.
M. Zarinejad et al. / Intermetallics 16 (2008) 876–883 883