Thermal history effects of Cu–Al–Ni shape memory alloys powder particles compared with single...
8
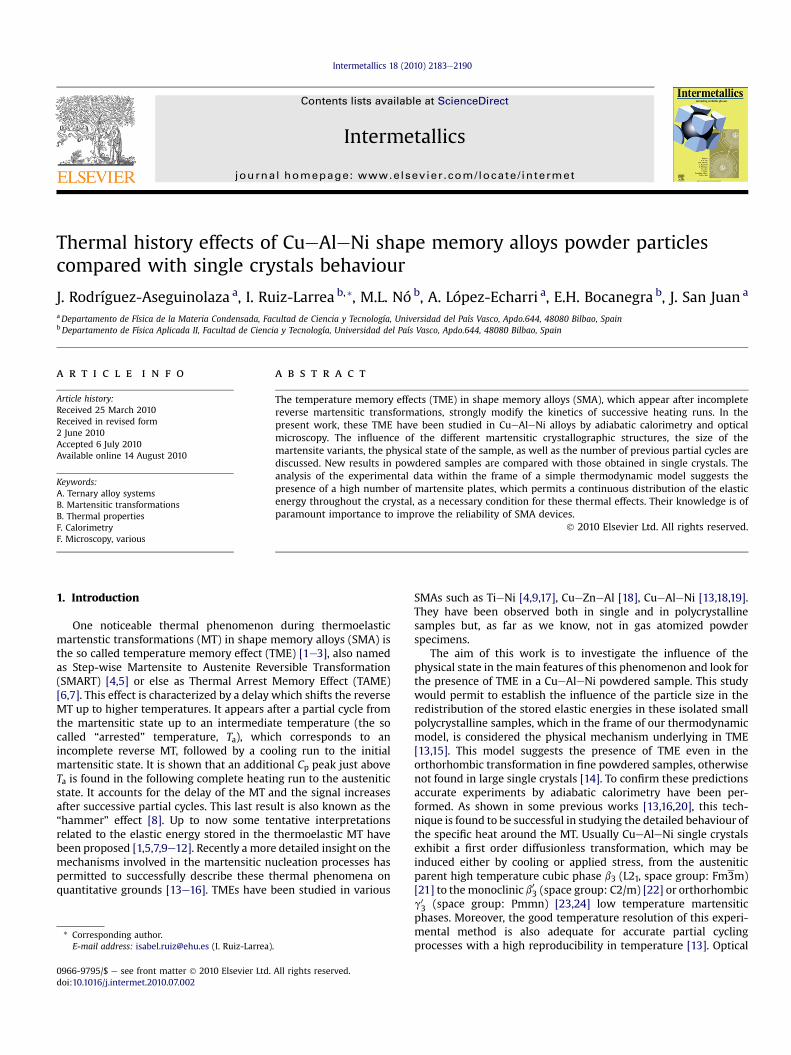
Thermal history effects of CueAleNi shape memory alloys powder particles compared with single crystals behaviour J. Rodríguez-Aseguinolaza a , I. Ruiz-Larrea b, * , M.L. Nó b , A. López-Echarri a , E.H. Bocanegra b , J. San Juan a a Departamento de Física de la Materia Condensada, Facultad de Ciencia y Tecnología, Universidad del País Vasco, Apdo.644, 48080 Bilbao, Spain b Departamento de Física Aplicada II, Facultad de Ciencia y Tecnología, Universidad del País Vasco, Apdo.644, 48080 Bilbao, Spain article info Article history: Received 25 March 2010 Received in revised form 2 June 2010 Accepted 6 July 2010 Available online 14 August 2010 Keywords: A. Ternary alloy systems B. Martensitic transformations B. Thermal properties F. Calorimetry F. Microscopy, various abstract The temperature memory effects (TME) in shape memory alloys (SMA), which appear after incomplete reverse martensitic transformations, strongly modify the kinetics of successive heating runs. In the present work, these TME have been studied in CueAleNi alloys by adiabatic calorimetry and optical microscopy. The influence of the different martensitic crystallographic structures, the size of the martensite variants, the physical state of the sample, as well as the number of previous partial cycles are discussed. New results in powdered samples are compared with those obtained in single crystals. The analysis of the experimental data within the frame of a simple thermodynamic model suggests the presence of a high number of martensite plates, which permits a continuous distribution of the elastic energy throughout the crystal, as a necessary condition for these thermal effects. Their knowledge is of paramount importance to improve the reliability of SMA devices. Ó 2010 Elsevier Ltd. All rights reserved. 1. Introduction One noticeable thermal phenomenon during thermoelastic martenstic transformations (MT) in shape memory alloys (SMA) is the so called temperature memory effect (TME) [1e3], also named as Step-wise Martensite to Austenite Reversible Transformation (SMART) [4,5] or else as Thermal Arrest Memory Effect (TAME) [6,7]. This effect is characterized by a delay which shifts the reverse MT up to higher temperatures. It appears after a partial cycle from the martensitic state up to an intermediate temperature (the so called “arrested” temperature, T a ), which corresponds to an incomplete reverse MT, followed by a cooling run to the initial martensitic state. It is shown that an additional C p peak just above T a is found in the following complete heating run to the austenitic state. It accounts for the delay of the MT and the signal increases after successive partial cycles. This last result is also known as the “hammer” effect [8]. Up to now some tentative interpretations related to the elastic energy stored in the thermoelastic MT have been proposed [1,5,7,9e12]. Recently a more detailed insight on the mechanisms involved in the martensitic nucleation processes has permitted to successfully describe these thermal phenomena on quantitative grounds [13e16]. TMEs have been studied in various SMAs such as TieNi [4,9,17], CueZneAl [18], CueAleNi [13,18,19]. They have been observed both in single and in polycrystalline samples but, as far as we know, not in gas atomized powder specimens. The aim of this work is to investigate the influence of the physical state in the main features of this phenomenon and look for the presence of TME in a CueAleNi powdered sample. This study would permit to establish the influence of the particle size in the redistribution of the stored elastic energies in these isolated small polycrystalline samples, which in the frame of our thermodynamic model, is considered the physical mechanism underlying in TME [13,15]. This model suggests the presence of TME even in the orthorhombic transformation in fine powdered samples, otherwise not found in large single crystals [14]. To confirm these predictions accurate experiments by adiabatic calorimetry have been per- formed. As shown in some previous works [13,16,20], this tech- nique is found to be successful in studying the detailed behaviour of the specific heat around the MT. Usually CueAleNi single crystals exhibit a first order diffusionless transformation, which may be induced either by cooling or applied stress, from the austenitic parent high temperature cubic phase b 3 (L2 1 , space group: Fm 3m) [21] to the monoclinic b 0 3 (space group: C2/m) [22] or orthorhombic g 0 3 (space group: Pmmn) [23,24] low temperature martensitic phases. Moreover, the good temperature resolution of this experi- mental method is also adequate for accurate partial cycling processes with a high reproducibility in temperature [13]. Optical * Corresponding author. E-mail address: [email protected] (I. Ruiz-Larrea). Contents lists available at ScienceDirect Intermetallics journal homepage: www.elsevier.com/locate/intermet 0966-9795/$ e see front matter Ó 2010 Elsevier Ltd. All rights reserved. doi:10.1016/j.intermet.2010.07.002 Intermetallics 18 (2010) 2183e2190
-
Upload
independent -
Category
Documents
-
view
0 -
download
0
Transcript of Thermal history effects of Cu–Al–Ni shape memory alloys powder particles compared with single...
lable at ScienceDirect
Intermetallics 18 (2010) 2183e2190
Contents lists avai
Intermetallics
journal homepage: www.elsevier .com/locate/ intermet
Thermal history effects of CueAleNi shape memory alloys powder particlescompared with single crystals behaviour
J. Rodríguez-Aseguinolaza a, I. Ruiz-Larrea b,*, M.L. Nó b, A. López-Echarri a, E.H. Bocanegra b, J. San Juan a
aDepartamento de Física de la Materia Condensada, Facultad de Ciencia y Tecnología, Universidad del País Vasco, Apdo.644, 48080 Bilbao, SpainbDepartamento de Física Aplicada II, Facultad de Ciencia y Tecnología, Universidad del País Vasco, Apdo.644, 48080 Bilbao, Spain
a r t i c l e i n f o
Article history:Received 25 March 2010Received in revised form2 June 2010Accepted 6 July 2010Available online 14 August 2010
Keywords:A. Ternary alloy systemsB. Martensitic transformationsB. Thermal propertiesF. CalorimetryF. Microscopy, various
* Corresponding author.E-mail address: [email protected] (I. Ruiz-Larrea)
0966-9795/$ e see front matter � 2010 Elsevier Ltd.doi:10.1016/j.intermet.2010.07.002
a b s t r a c t
The temperature memory effects (TME) in shape memory alloys (SMA), which appear after incompletereverse martensitic transformations, strongly modify the kinetics of successive heating runs. In thepresent work, these TME have been studied in CueAleNi alloys by adiabatic calorimetry and opticalmicroscopy. The influence of the different martensitic crystallographic structures, the size of themartensite variants, the physical state of the sample, as well as the number of previous partial cycles arediscussed. New results in powdered samples are compared with those obtained in single crystals. Theanalysis of the experimental data within the frame of a simple thermodynamic model suggests thepresence of a high number of martensite plates, which permits a continuous distribution of the elasticenergy throughout the crystal, as a necessary condition for these thermal effects. Their knowledge is ofparamount importance to improve the reliability of SMA devices.
� 2010 Elsevier Ltd. All rights reserved.
1. Introduction
One noticeable thermal phenomenon during thermoelasticmartenstic transformations (MT) in shape memory alloys (SMA) isthe so called temperature memory effect (TME) [1e3], also namedas Step-wise Martensite to Austenite Reversible Transformation(SMART) [4,5] or else as Thermal Arrest Memory Effect (TAME)[6,7]. This effect is characterized by a delay which shifts the reverseMT up to higher temperatures. It appears after a partial cycle fromthe martensitic state up to an intermediate temperature (the socalled “arrested” temperature, Ta), which corresponds to anincomplete reverse MT, followed by a cooling run to the initialmartensitic state. It is shown that an additional Cp peak just aboveTa is found in the following complete heating run to the austeniticstate. It accounts for the delay of the MT and the signal increasesafter successive partial cycles. This last result is also known as the“hammer” effect [8]. Up to now some tentative interpretationsrelated to the elastic energy stored in the thermoelastic MT havebeen proposed [1,5,7,9e12]. Recently a more detailed insight on themechanisms involved in the martensitic nucleation processes haspermitted to successfully describe these thermal phenomena onquantitative grounds [13e16]. TMEs have been studied in various
.
All rights reserved.
SMAs such as TieNi [4,9,17], CueZneAl [18], CueAleNi [13,18,19].They have been observed both in single and in polycrystallinesamples but, as far as we know, not in gas atomized powderspecimens.
The aim of this work is to investigate the influence of thephysical state in themain features of this phenomenon and look forthe presence of TME in a CueAleNi powdered sample. This studywould permit to establish the influence of the particle size in theredistribution of the stored elastic energies in these isolated smallpolycrystalline samples, which in the frame of our thermodynamicmodel, is considered the physical mechanism underlying in TME[13,15]. This model suggests the presence of TME even in theorthorhombic transformation in fine powdered samples, otherwisenot found in large single crystals [14]. To confirm these predictionsaccurate experiments by adiabatic calorimetry have been per-formed. As shown in some previous works [13,16,20], this tech-nique is found to be successful in studying the detailed behaviour ofthe specific heat around the MT. Usually CueAleNi single crystalsexhibit a first order diffusionless transformation, which may beinduced either by cooling or applied stress, from the austeniticparent high temperature cubic phase b3 (L21, space group: Fm3m)[21] to the monoclinic b03 (space group: C2/m) [22] or orthorhombicg03 (space group: Pmmn) [23,24] low temperature martensiticphases. Moreover, the good temperature resolution of this experi-mental method is also adequate for accurate partial cyclingprocesses with a high reproducibility in temperature [13]. Optical
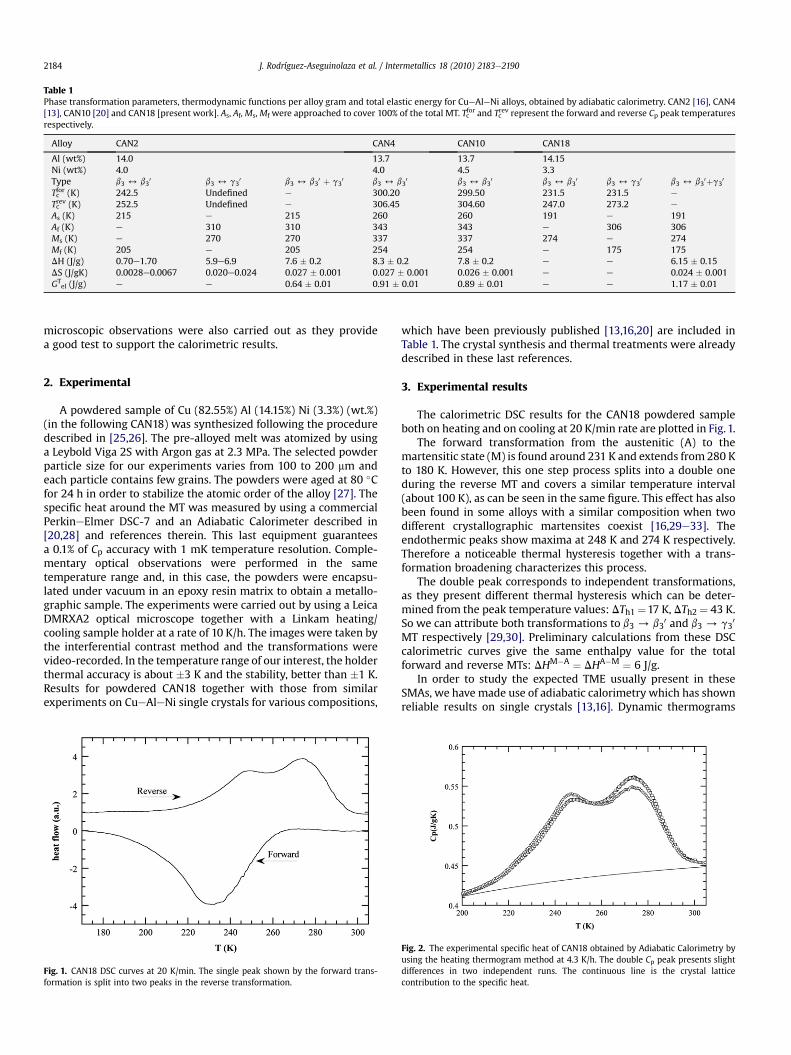
Table 1Phase transformation parameters, thermodynamic functions per alloy gram and total elastic energy for CueAleNi alloys, obtained by adiabatic calorimetry. CAN2 [16], CAN4[13], CAN10 [20] and CAN18 [present work]. As, Af,Ms,Mf were approached to cover 100% of the total MT. Tcfor and Tc
rev represent the forward and reverse Cp peak temperaturesrespectively.
Alloy CAN2 CAN4 CAN10 CAN18
Al (wt%) 14.0 13.7 13.7 14.15Ni (wt%) 4.0 4.0 4.5 3.3Type b3 4 b3
0 b3 4 g30 b3 4 b3
0 þ g30 b3 4 b3
0 b3 4 b30 b3 4 b3
0 b3 4 g30 b3 4 b3
0þg30
Tcfor (K) 242.5 Undefined e 300.20 299.50 231.5 231.5 e
Tcrev (K) 252.5 Undefined e 306.45 304.60 247.0 273.2 e
As (K) 215 e 215 260 260 191 e 191Af (K) e 310 310 343 343 e 306 306Ms (K) e 270 270 337 337 274 e 274Mf (K) 205 e 205 254 254 e 175 175DH (J/g) 0.70e1.70 5.9e6.9 7.6 � 0.2 8.3 � 0.2 7.8 � 0.2 e e 6.15 � 0.15DS (J/gK) 0.0028e0.0067 0.020e0.024 0.027 � 0.001 0.027 � 0.001 0.026 � 0.001 e e 0.024 � 0.001GT
el (J/g) e e 0.64 � 0.01 0.91 � 0.01 0.89 � 0.01 e e 1.17 � 0.01
J. Rodríguez-Aseguinolaza et al. / Intermetallics 18 (2010) 2183e21902184
microscopic observations were also carried out as they providea good test to support the calorimetric results.
2. Experimental
A powdered sample of Cu (82.55%) Al (14.15%) Ni (3.3%) (wt.%)(in the following CAN18) was synthesized following the proceduredescribed in [25,26]. The pre-alloyed melt was atomized by usinga Leybold Viga 2S with Argon gas at 2.3 MPa. The selected powderparticle size for our experiments varies from 100 to 200 mm andeach particle contains few grains. The powders were aged at 80 �Cfor 24 h in order to stabilize the atomic order of the alloy [27]. Thespecific heat around the MT was measured by using a commercialPerkineElmer DSC-7 and an Adiabatic Calorimeter described in[20,28] and references therein. This last equipment guaranteesa 0.1% of Cp accuracy with 1 mK temperature resolution. Comple-mentary optical observations were performed in the sametemperature range and, in this case, the powders were encapsu-lated under vacuum in an epoxy resin matrix to obtain a metallo-graphic sample. The experiments were carried out by using a LeicaDMRXA2 optical microscope together with a Linkam heating/cooling sample holder at a rate of 10 K/h. The images were taken bythe interferential contrast method and the transformations werevideo-recorded. In the temperature range of our interest, the holderthermal accuracy is about �3 K and the stability, better than �1 K.Results for powdered CAN18 together with those from similarexperiments on CueAleNi single crystals for various compositions,
Fig. 1. CAN18 DSC curves at 20 K/min. The single peak shown by the forward trans-formation is split into two peaks in the reverse transformation.
which have been previously published [13,16,20] are included inTable 1. The crystal synthesis and thermal treatments were alreadydescribed in these last references.
3. Experimental results
The calorimetric DSC results for the CAN18 powdered sampleboth on heating and on cooling at 20 K/min rate are plotted in Fig. 1.
The forward transformation from the austenitic (A) to themartensitic state (M) is found around 231 K and extends from 280 Kto 180 K. However, this one step process splits into a double oneduring the reverse MT and covers a similar temperature interval(about 100 K), as can be seen in the same figure. This effect has alsobeen found in some alloys with a similar composition when twodifferent crystallographic martensites coexist [16,29e33]. Theendothermic peaks show maxima at 248 K and 274 K respectively.Therefore a noticeable thermal hysteresis together with a trans-formation broadening characterizes this process.
The double peak corresponds to independent transformations,as they present different thermal hysteresis which can be deter-mined from the peak temperature values: DTh1 ¼17 K, DTh2 ¼ 43 K.So we can attribute both transformations to b3 / b3
0 and b3 / g30
MT respectively [29,30]. Preliminary calculations from these DSCcalorimetric curves give the same enthalpy value for the totalforward and reverse MTs: DHM�A ¼ DHA�M ¼ 6 J/g.
In order to study the expected TME usually present in theseSMAs, we have made use of adiabatic calorimetry which has shownreliable results on single crystals [13,16]. Dynamic thermograms
Fig. 2. The experimental specific heat of CAN18 obtained by Adiabatic Calorimetry byusing the heating thermogram method at 4.3 K/h. The double Cp peak presents slightdifferences in two independent runs. The continuous line is the crystal latticecontribution to the specific heat.
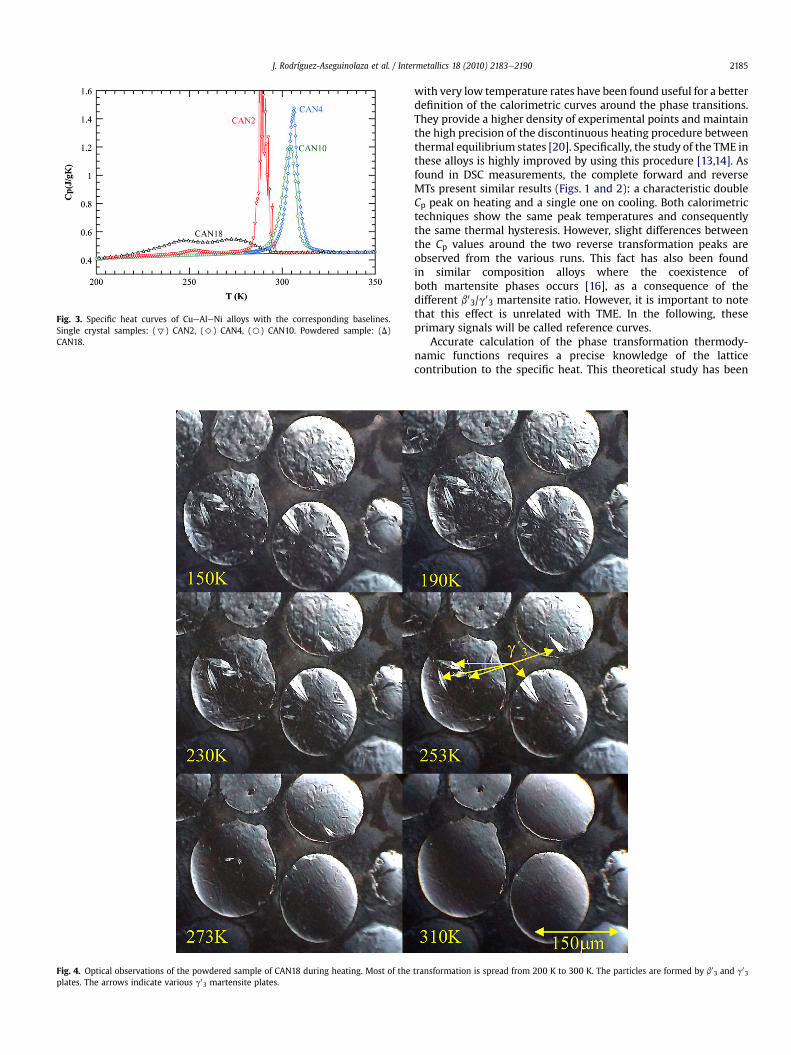
Fig. 3. Specific heat curves of CueAleNi alloys with the corresponding baselines.Single crystal samples: (7) CAN2, (>) CAN4, (B) CAN10. Powdered sample: (D)CAN18.
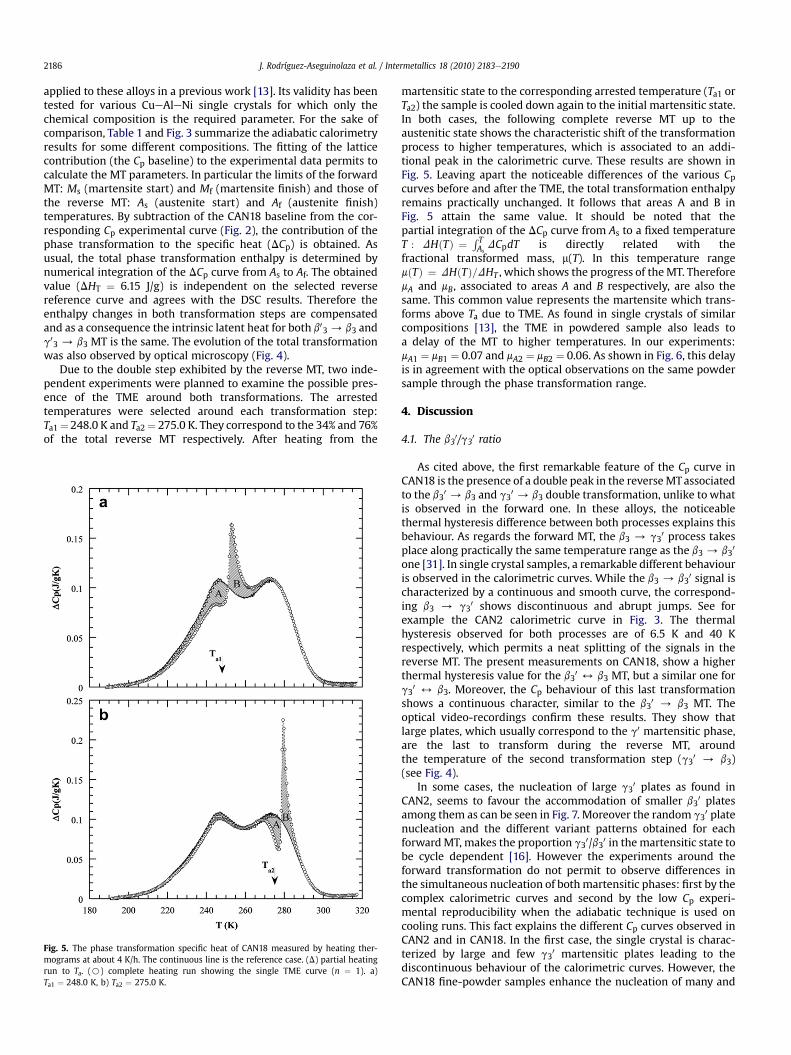
Fig. 4. Optical observations of the powdered sample of CAN18 during heating. Most of theplates. The arrows indicate various g0
3 martensite plates.
J. Rodríguez-Aseguinolaza et al. / Intermetallics 18 (2010) 2183e2190 2185
with very low temperature rates have been found useful for a betterdefinition of the calorimetric curves around the phase transitions.They provide a higher density of experimental points and maintainthe high precision of the discontinuous heating procedure betweenthermal equilibrium states [20]. Specifically, the study of the TME inthese alloys is highly improved by using this procedure [13,14]. Asfound in DSC measurements, the complete forward and reverseMTs present similar results (Figs. 1 and 2): a characteristic doubleCp peak on heating and a single one on cooling. Both calorimetrictechniques show the same peak temperatures and consequentlythe same thermal hysteresis. However, slight differences betweenthe Cp values around the two reverse transformation peaks areobserved from the various runs. This fact has also been foundin similar composition alloys where the coexistence ofboth martensite phases occurs [16], as a consequence of thedifferent b03/g0
3 martensite ratio. However, it is important to notethat this effect is unrelated with TME. In the following, theseprimary signals will be called reference curves.
Accurate calculation of the phase transformation thermody-namic functions requires a precise knowledge of the latticecontribution to the specific heat. This theoretical study has been
transformation is spread from 200 K to 300 K. The particles are formed by b03 and g03
J. Rodríguez-Aseguinolaza et al. / Intermetallics 18 (2010) 2183e21902186
applied to these alloys in a previous work [13]. Its validity has beentested for various CueAleNi single crystals for which only thechemical composition is the required parameter. For the sake ofcomparison, Table 1 and Fig. 3 summarize the adiabatic calorimetryresults for some different compositions. The fitting of the latticecontribution (the Cp baseline) to the experimental data permits tocalculate the MT parameters. In particular the limits of the forwardMT: Ms (martensite start) and Mf (martensite finish) and those ofthe reverse MT: As (austenite start) and Af (austenite finish)temperatures. By subtraction of the CAN18 baseline from the cor-responding Cp experimental curve (Fig. 2), the contribution of thephase transformation to the specific heat (DCp) is obtained. Asusual, the total phase transformation enthalpy is determined bynumerical integration of the DCp curve from As to Af. The obtainedvalue (DHT ¼ 6.15 J/g) is independent on the selected reversereference curve and agrees with the DSC results. Therefore theenthalpy changes in both transformation steps are compensatedand as a consequence the intrinsic latent heat for both b03 / b3 andg0
3 / b3 MT is the same. The evolution of the total transformationwas also observed by optical microscopy (Fig. 4).
Due to the double step exhibited by the reverse MT, two inde-pendent experiments were planned to examine the possible pres-ence of the TME around both transformations. The arrestedtemperatures were selected around each transformation step:Ta1¼248.0 K and Ta2¼ 275.0 K. They correspond to the 34% and 76%of the total reverse MT respectively. After heating from the
Fig. 5. The phase transformation specific heat of CAN18 measured by heating ther-mograms at about 4 K/h. The continuous line is the reference case. (D) partial heatingrun to Ta. (B) complete heating run showing the single TME curve (n ¼ 1). a)Ta1 ¼ 248.0 K, b) Ta2 ¼ 275.0 K.
martensitic state to the corresponding arrested temperature (Ta1 orTa2) the sample is cooled down again to the initial martensitic state.In both cases, the following complete reverse MT up to theaustenitic state shows the characteristic shift of the transformationprocess to higher temperatures, which is associated to an addi-tional peak in the calorimetric curve. These results are shown inFig. 5. Leaving apart the noticeable differences of the various Cpcurves before and after the TME, the total transformation enthalpyremains practically unchanged. It follows that areas A and B inFig. 5 attain the same value. It should be noted that thepartial integration of the DCp curve from As to a fixed temperatureT : DHðTÞ ¼ R T
AsDCpdT is directly related with the
fractional transformed mass, m(T). In this temperature rangemðTÞ ¼ DHðTÞ=DHT , which shows the progress of theMT. ThereforemA and mB, associated to areas A and B respectively, are also thesame. This common value represents the martensite which trans-forms above Ta due to TME. As found in single crystals of similarcompositions [13], the TME in powdered sample also leads toa delay of the MT to higher temperatures. In our experiments:mA1 ¼ mB1 ¼ 0.07 and mA2 ¼ mB2 ¼ 0.06. As shown in Fig. 6, this delayis in agreement with the optical observations on the same powdersample through the phase transformation range.
4. Discussion
4.1. The b30/g3
0 ratio
As cited above, the first remarkable feature of the Cp curve inCAN18 is the presence of a double peak in the reverseMTassociatedto the b30 / b3 and g3
0 / b3 double transformation, unlike to whatis observed in the forward one. In these alloys, the noticeablethermal hysteresis difference between both processes explains thisbehaviour. As regards the forward MT, the b3 / g3
0 process takesplace along practically the same temperature range as the b3 / b3
0
one [31]. In single crystal samples, a remarkable different behaviouris observed in the calorimetric curves. While the b3 / b3
0 signal ischaracterized by a continuous and smooth curve, the correspond-ing b3 / g3
0 shows discontinuous and abrupt jumps. See forexample the CAN2 calorimetric curve in Fig. 3. The thermalhysteresis observed for both processes are of 6.5 K and 40 Krespectively, which permits a neat splitting of the signals in thereverse MT. The present measurements on CAN18, show a higherthermal hysteresis value for the b3
0 4 b3 MT, but a similar one forg3
0 4 b3. Moreover, the Cp behaviour of this last transformationshows a continuous character, similar to the b3
0 / b3 MT. Theoptical video-recordings confirm these results. They show thatlarge plates, which usually correspond to the g0 martensitic phase,are the last to transform during the reverse MT, aroundthe temperature of the second transformation step (g30 / b3)(see Fig. 4).
In some cases, the nucleation of large g30 plates as found in
CAN2, seems to favour the accommodation of smaller b30 plates
among them as can be seen in Fig. 7. Moreover the random g30 plate
nucleation and the different variant patterns obtained for eachforwardMT, makes the proportion g3
0/b30 in the martensitic state tobe cycle dependent [16]. However the experiments around theforward transformation do not permit to observe differences inthe simultaneous nucleation of bothmartensitic phases: first by thecomplex calorimetric curves and second by the low Cp experi-mental reproducibility when the adiabatic technique is used oncooling runs. This fact explains the different Cp curves observed inCAN2 and in CAN18. In the first case, the single crystal is charac-terized by large and few g3
0 martensitic plates leading to thediscontinuous behaviour of the calorimetric curves. However, theCAN18 fine-powder samples enhance the nucleation of many and

Fig. 6. Transformation delay of CAN18 powdered sample due to the TME observed by optical microscopy. The shown grains are mostly formed by g03 plates. The arrows indicate
martensite plates which transform into austenite in the first heating run to Ta ¼ 240 K, but remain at this temperature in the second heating run.
J. Rodríguez-Aseguinolaza et al. / Intermetallics 18 (2010) 2183e2190 2187
small sized g30 plates. This explains the continuous and smooth
temperature dependence of the specific heat in CAN18.Additional differences in the behaviour of CAN18 also appear
when it is compared with CAN2 single crystal. As cited above, therelative amounts between b3
0 and g30 in CAN2 are found to signif-
icantly depend on the thermal cycle, which leads to very differentcalorimetric curves [16]. This means that both phases can nucleatein the same crystal region. Indeed, in this crystal, up to 14% of thesample mass can indistinctly nucleate into b3
0 or to g30 phase [16].
As regards the calorimetric results for CAN18, only much slighterdifferences are found (Fig. 2). In this case only a 4% mass is inter-changed, which means that the underlying nucleation processesleading to b3
0 and g30 phases seem to be more uncoupled than in
single crystal samples.This fact can be explained by the different physical state of this
powdered sample when compared with the single crystal. CAN18 isconstituted by very small multigrain particles that impede thenucleation of large g3
0 plates, usually found in CAN2 [16]. Asa consequence b3
0 and g30 plate sizes should be similar as shown by
the optical experiments (Fig. 4). Therefore, the nucleation processesin CAN2 and CAN18 are expected to be quite different. Up to nowthe random character of the very first nucleation stage is wellestablished, but the subsequent process is governed by determin-istic rules. In the case of the CAN2 single crystal, the initial
distribution of the large sized g30 plates depends on the particular
forward transformation. These quite different precursor states,which determine the progressive nucleation and the accommoda-tion of the remaining g3
0 and b30 plates, could explain the high
variability of the b30/g3
0 ratio in the final martensitic state. On theother hand, the small sized g3
0 plates in the powdered CAN18 makethe precursor states very much similar for each transformation,which strongly limits the b3
0/g30 ratio variability. In this case, thehigh number of plates involved approaches this ratio to a constantvalue due to the statistical average.
4.2. The elastic energy of the martensite plates
The thermodynamic model described in [14], has been founduseful to explain the main characteristics of the MT in these alloys.Within this frame, the phase equilibrium temperature of everyindividual martensite plate (T*
0) only depends on its stored elasticenergy Gel. By using the lattice contribution to the specific heat, thetemperature dependence of the Gibbs energy for both the austen-itic and the martensitic phases in all these crystals can be obtained.This permits to establish a quasielinear relation (inverselyproportional) between the elastic energy of each plate Gel and itstransformation temperature. Therefore plates with lower Gel,transform at higher temperatures. The range of Gel values is quite
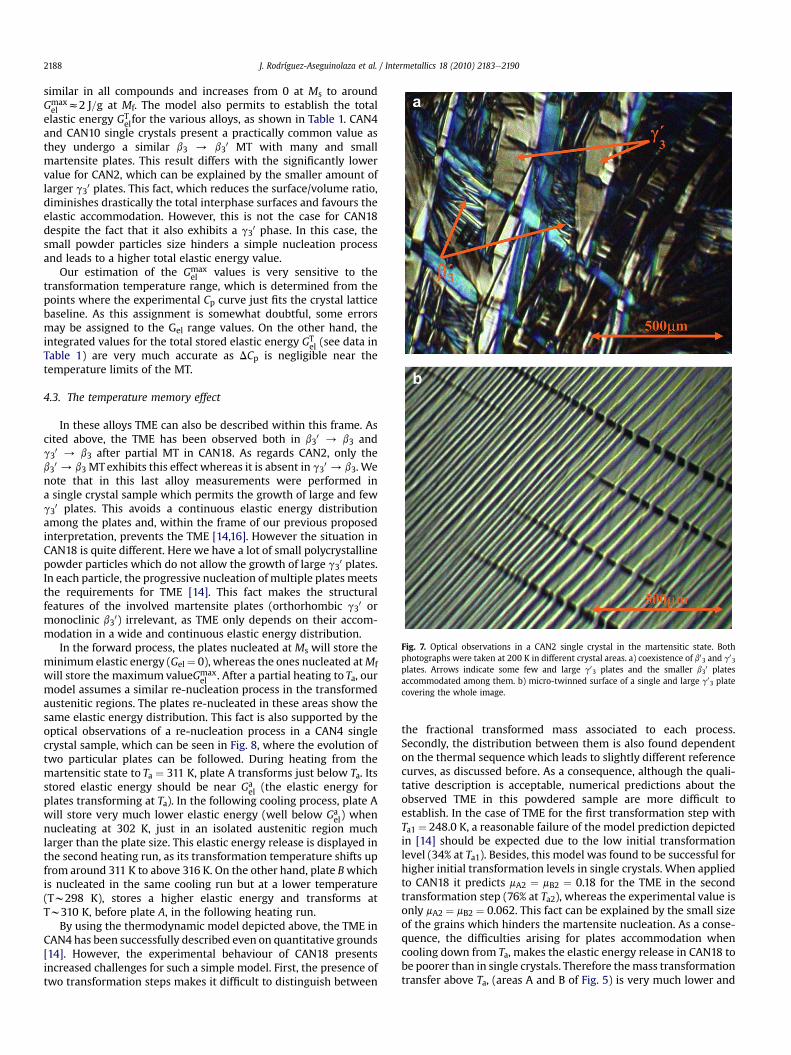
Fig. 7. Optical observations in a CAN2 single crystal in the martensitic state. Bothphotographs were taken at 200 K in different crystal areas. a) coexistence of b03 and g0
3
plates. Arrows indicate some few and large g03 plates and the smaller b30 plates
accommodated among them. b) micro-twinned surface of a single and large g03 plate
covering the whole image.
J. Rodríguez-Aseguinolaza et al. / Intermetallics 18 (2010) 2183e21902188
similar in all compounds and increases from 0 at Ms to aroundGmaxel z2 J=g at Mf. The model also permits to establish the total
elastic energy GTelfor the various alloys, as shown in Table 1. CAN4
and CAN10 single crystals present a practically common value asthey undergo a similar b3 / b3
0 MT with many and smallmartensite plates. This result differs with the significantly lowervalue for CAN2, which can be explained by the smaller amount oflarger g30 plates. This fact, which reduces the surface/volume ratio,diminishes drastically the total interphase surfaces and favours theelastic accommodation. However, this is not the case for CAN18despite the fact that it also exhibits a g3
0 phase. In this case, thesmall powder particles size hinders a simple nucleation processand leads to a higher total elastic energy value.
Our estimation of the Gmaxel values is very sensitive to the
transformation temperature range, which is determined from thepoints where the experimental Cp curve just fits the crystal latticebaseline. As this assignment is somewhat doubtful, some errorsmay be assigned to the Gel range values. On the other hand, theintegrated values for the total stored elastic energy GT
el (see data inTable 1) are very much accurate as DCp is negligible near thetemperature limits of the MT.
4.3. The temperature memory effect
In these alloys TME can also be described within this frame. Ascited above, the TME has been observed both in b3
0 / b3 andg3
0 / b3 after partial MT in CAN18. As regards CAN2, only theb3
0 / b3 MTexhibits this effect whereas it is absent in g30 / b3. We
note that in this last alloy measurements were performed ina single crystal sample which permits the growth of large and fewg3
0 plates. This avoids a continuous elastic energy distributionamong the plates and, within the frame of our previous proposedinterpretation, prevents the TME [14,16]. However the situation inCAN18 is quite different. Here we have a lot of small polycrystallinepowder particles which do not allow the growth of large g3
0 plates.In each particle, the progressive nucleation of multiple plates meetsthe requirements for TME [14]. This fact makes the structuralfeatures of the involved martensite plates (orthorhombic g3
0 ormonoclinic b3
0) irrelevant, as TME only depends on their accom-modation in a wide and continuous elastic energy distribution.
In the forward process, the plates nucleated at Ms will store theminimum elastic energy (Gel¼ 0), whereas the ones nucleated atMfwill store the maximum valueGmax
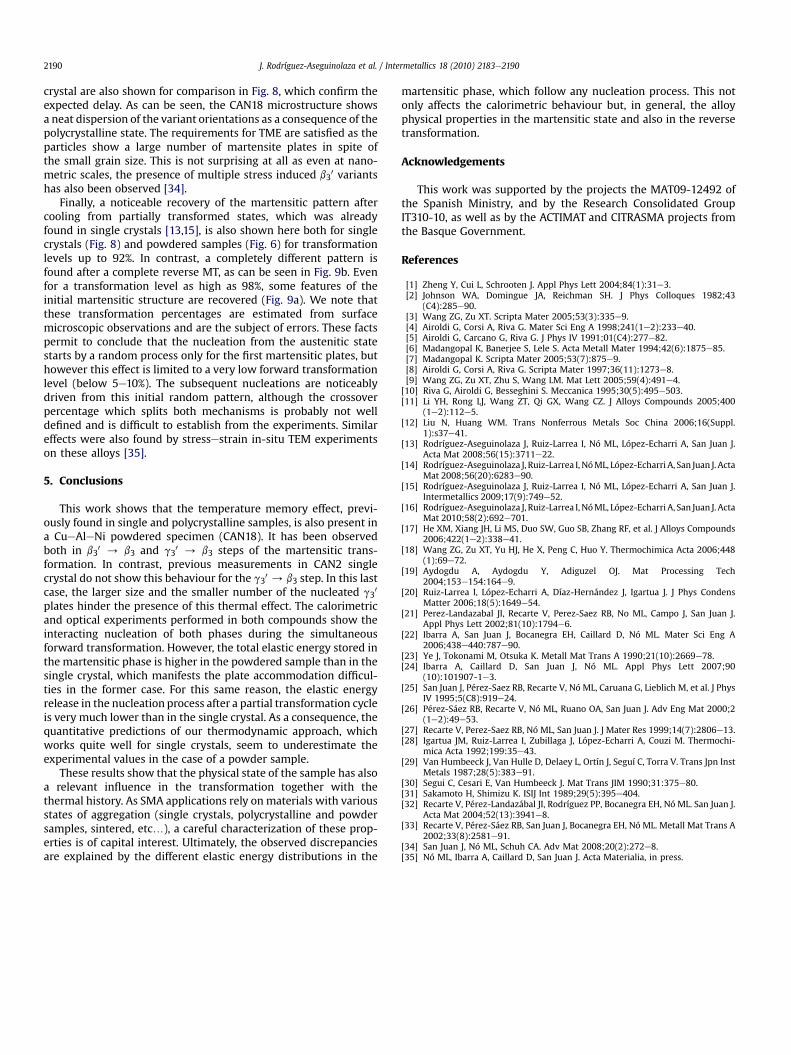
el . After a partial heating to Ta, ourmodel assumes a similar re-nucleation process in the transformedaustenitic regions. The plates re-nucleated in these areas show thesame elastic energy distribution. This fact is also supported by theoptical observations of a re-nucleation process in a CAN4 singlecrystal sample, which can be seen in Fig. 8, where the evolution oftwo particular plates can be followed. During heating from themartensitic state to Ta ¼ 311 K, plate A transforms just below Ta. Itsstored elastic energy should be near Ga
el (the elastic energy forplates transforming at Ta). In the following cooling process, plate Awill store very much lower elastic energy (well below Ga
el) whennucleating at 302 K, just in an isolated austenitic region muchlarger than the plate size. This elastic energy release is displayed inthe second heating run, as its transformation temperature shifts upfrom around 311 K to above 316 K. On the other hand, plate Bwhichis nucleated in the same cooling run but at a lower temperature(Tw298 K), stores a higher elastic energy and transforms atTw310 K, before plate A, in the following heating run.
By using the thermodynamic model depicted above, the TME inCAN4 has been successfully described even on quantitative grounds[14]. However, the experimental behaviour of CAN18 presentsincreased challenges for such a simple model. First, the presence oftwo transformation steps makes it difficult to distinguish between
the fractional transformed mass associated to each process.Secondly, the distribution between them is also found dependenton the thermal sequence which leads to slightly different referencecurves, as discussed before. As a consequence, although the quali-tative description is acceptable, numerical predictions about theobserved TME in this powdered sample are more difficult toestablish. In the case of TME for the first transformation step withTa1 ¼ 248.0 K, a reasonable failure of the model prediction depictedin [14] should be expected due to the low initial transformationlevel (34% at Ta1). Besides, this model was found to be successful forhigher initial transformation levels in single crystals. When appliedto CAN18 it predicts mA2 ¼ mB2 ¼ 0.18 for the TME in the secondtransformation step (76% at Ta2), whereas the experimental value isonly mA2 ¼ mB2 ¼ 0.062. This fact can be explained by the small sizeof the grains which hinders the martensite nucleation. As a conse-quence, the difficulties arising for plates accommodation whencooling down from Ta, makes the elastic energy release in CAN18 tobe poorer than in single crystals. Therefore themass transformationtransfer above Ta, (areas A and B of Fig. 5) is very much lower and
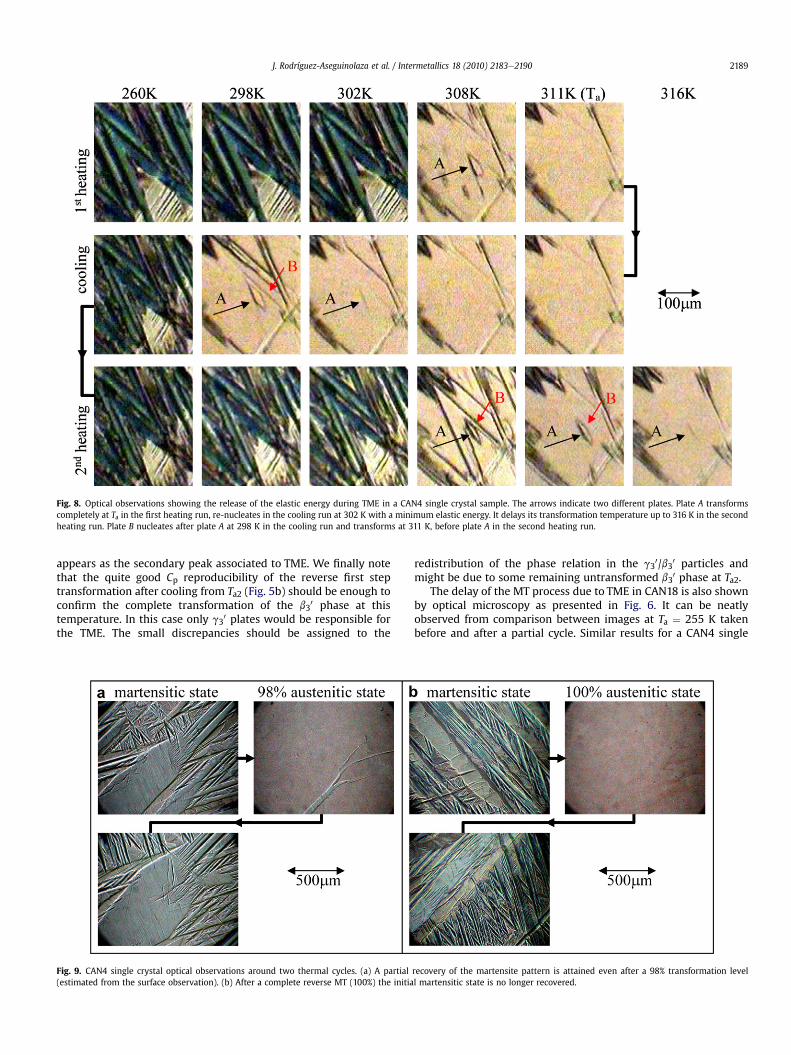
Fig. 8. Optical observations showing the release of the elastic energy during TME in a CAN4 single crystal sample. The arrows indicate two different plates. Plate A transformscompletely at Ta in the first heating run, re-nucleates in the cooling run at 302 K with a minimum elastic energy. It delays its transformation temperature up to 316 K in the secondheating run. Plate B nucleates after plate A at 298 K in the cooling run and transforms at 311 K, before plate A in the second heating run.
J. Rodríguez-Aseguinolaza et al. / Intermetallics 18 (2010) 2183e2190 2189
appears as the secondary peak associated to TME. We finally notethat the quite good Cp reproducibility of the reverse first steptransformation after cooling from Ta2 (Fig. 5b) should be enough toconfirm the complete transformation of the b3
0 phase at thistemperature. In this case only g3
0 plates would be responsible forthe TME. The small discrepancies should be assigned to the
Fig. 9. CAN4 single crystal optical observations around two thermal cycles. (a) A partial(estimated from the surface observation). (b) After a complete reverse MT (100%) the initia
redistribution of the phase relation in the g30/b30 particles and
might be due to some remaining untransformed b30 phase at Ta2.
The delay of the MT process due to TME in CAN18 is also shownby optical microscopy as presented in Fig. 6. It can be neatlyobserved from comparison between images at Ta ¼ 255 K takenbefore and after a partial cycle. Similar results for a CAN4 single
recovery of the martensite pattern is attained even after a 98% transformation levell martensitic state is no longer recovered.
J. Rodríguez-Aseguinolaza et al. / Intermetallics 18 (2010) 2183e21902190
crystal are also shown for comparison in Fig. 8, which confirm theexpected delay. As can be seen, the CAN18 microstructure showsa neat dispersion of the variant orientations as a consequence of thepolycrystalline state. The requirements for TME are satisfied as theparticles show a large number of martensite plates in spite ofthe small grain size. This is not surprising at all as even at nano-metric scales, the presence of multiple stress induced b3
0 variantshas also been observed [34].
Finally, a noticeable recovery of the martensitic pattern aftercooling from partially transformed states, which was alreadyfound in single crystals [13,15], is also shown here both for singlecrystals (Fig. 8) and powdered samples (Fig. 6) for transformationlevels up to 92%. In contrast, a completely different pattern isfound after a complete reverse MT, as can be seen in Fig. 9b. Evenfor a transformation level as high as 98%, some features of theinitial martensitic structure are recovered (Fig. 9a). We note thatthese transformation percentages are estimated from surfacemicroscopic observations and are the subject of errors. These factspermit to conclude that the nucleation from the austenitic statestarts by a random process only for the first martensitic plates, buthowever this effect is limited to a very low forward transformationlevel (below 5e10%). The subsequent nucleations are noticeablydriven from this initial random pattern, although the crossoverpercentage which splits both mechanisms is probably not welldefined and is difficult to establish from the experiments. Similareffects were also found by stressestrain in-situ TEM experimentson these alloys [35].
5. Conclusions
This work shows that the temperature memory effect, previ-ously found in single and polycrystalline samples, is also present ina CueAleNi powdered specimen (CAN18). It has been observedboth in b3
0 / b3 and g30 / b3 steps of the martensitic trans-
formation. In contrast, previous measurements in CAN2 singlecrystal do not show this behaviour for the g3
0 / b3 step. In this lastcase, the larger size and the smaller number of the nucleated g3
0
plates hinder the presence of this thermal effect. The calorimetricand optical experiments performed in both compounds show theinteracting nucleation of both phases during the simultaneousforward transformation. However, the total elastic energy stored inthe martensitic phase is higher in the powdered sample than in thesingle crystal, which manifests the plate accommodation difficul-ties in the former case. For this same reason, the elastic energyrelease in the nucleation process after a partial transformation cycleis very much lower than in the single crystal. As a consequence, thequantitative predictions of our thermodynamic approach, whichworks quite well for single crystals, seem to underestimate theexperimental values in the case of a powder sample.
These results show that the physical state of the sample has alsoa relevant influence in the transformation together with thethermal history. As SMA applications rely on materials with variousstates of aggregation (single crystals, polycrystalline and powdersamples, sintered, etc.), a careful characterization of these prop-erties is of capital interest. Ultimately, the observed discrepanciesare explained by the different elastic energy distributions in the
martensitic phase, which follow any nucleation process. This notonly affects the calorimetric behaviour but, in general, the alloyphysical properties in the martensitic state and also in the reversetransformation.
Acknowledgements
This work was supported by the projects the MAT09-12492 ofthe Spanish Ministry, and by the Research Consolidated GroupIT310-10, as well as by the ACTIMAT and CITRASMA projects fromthe Basque Government.
References
[1] Zheng Y, Cui L, Schrooten J. Appl Phys Lett 2004;84(1):31e3.[2] Johnson WA, Domingue JA, Reichman SH. J Phys Colloques 1982;43
(C4):285e90.[3] Wang ZG, Zu XT. Scripta Mater 2005;53(3):335e9.[4] Airoldi G, Corsi A, Riva G. Mater Sci Eng A 1998;241(1e2):233e40.[5] Airoldi G, Carcano G, Riva G. J Phys IV 1991;01(C4):277e82.[6] Madangopal K, Banerjee S, Lele S. Acta Metall Mater 1994;42(6):1875e85.[7] Madangopal K. Scripta Mater 2005;53(7):875e9.[8] Airoldi G, Corsi A, Riva G. Scripta Mater 1997;36(11):1273e8.[9] Wang ZG, Zu XT, Zhu S, Wang LM. Mat Lett 2005;59(4):491e4.
[10] Riva G, Airoldi G, Besseghini S. Meccanica 1995;30(5):495e503.[11] Li YH, Rong LJ, Wang ZT, Qi GX, Wang CZ. J Alloys Compounds 2005;400
(1e2):112e5.[12] Liu N, Huang WM. Trans Nonferrous Metals Soc China 2006;16(Suppl.
1):s37e41.[13] Rodríguez-Aseguinolaza J, Ruiz-Larrea I, Nó ML, López-Echarri A, San Juan J.
Acta Mat 2008;56(15):3711e22.[14] Rodríguez-Aseguinolaza J, Ruiz-Larrea I, NóML, López-Echarri A, San Juan J. Acta
Mat 2008;56(20):6283e90.[15] Rodríguez-Aseguinolaza J, Ruiz-Larrea I, Nó ML, López-Echarri A, San Juan J.
Intermetallics 2009;17(9):749e52.[16] Rodríguez-Aseguinolaza J, Ruiz-Larrea I, NóML, López-Echarri A, San Juan J. Acta
Mat 2010;58(2):692e701.[17] He XM, Xiang JH, Li MS, Duo SW, Guo SB, Zhang RF, et al. J Alloys Compounds
2006;422(1e2):338e41.[18] Wang ZG, Zu XT, Yu HJ, He X, Peng C, Huo Y. Thermochimica Acta 2006;448
(1):69e72.[19] Aydogdu A, Aydogdu Y, Adiguzel OJ. Mat Processing Tech
2004;153e154:164e9.[20] Ruiz-Larrea I, López-Echarri A, Díaz-Hernández J, Igartua J. J Phys Condens
Matter 2006;18(5):1649e54.[21] Perez-Landazabal JI, Recarte V, Perez-Saez RB, No ML, Campo J, San Juan J.
Appl Phys Lett 2002;81(10):1794e6.[22] Ibarra A, San Juan J, Bocanegra EH, Caillard D, Nó ML. Mater Sci Eng A
2006;438e440:787e90.[23] Ye J, Tokonami M, Otsuka K. Metall Mat Trans A 1990;21(10):2669e78.[24] Ibarra A, Caillard D, San Juan J, Nó ML. Appl Phys Lett 2007;90
(10):101907-1e3.[25] San Juan J, Pérez-Saez RB, Recarte V, Nó ML, Caruana G, Lieblich M, et al. J Phys
IV 1995;5(C8):919e24.[26] Pérez-Sáez RB, Recarte V, Nó ML, Ruano OA, San Juan J. Adv Eng Mat 2000;2
(1e2):49e53.[27] Recarte V, Perez-Saez RB, Nó ML, San Juan J. J Mater Res 1999;14(7):2806e13.[28] Igartua JM, Ruiz-Larrea I, Zubillaga J, López-Echarri A, Couzi M. Thermochi-
mica Acta 1992;199:35e43.[29] Van Humbeeck J, Van Hulle D, Delaey L, Ortín J, Seguí C, Torra V. Trans Jpn Inst
Metals 1987;28(5):383e91.[30] Segui C, Cesari E, Van Humbeeck J. Mat Trans JIM 1990;31:375e80.[31] Sakamoto H, Shimizu K. ISIJ Int 1989;29(5):395e404.[32] Recarte V, Pérez-Landazábal JI, Rodríguez PP, Bocanegra EH, Nó ML. San Juan J.
Acta Mat 2004;52(13):3941e8.[33] Recarte V, Pérez-Sáez RB, San Juan J, Bocanegra EH, Nó ML. Metall Mat Trans A
2002;33(8):2581e91.[34] San Juan J, Nó ML, Schuh CA. Adv Mat 2008;20(2):272e8.[35] Nó ML, Ibarra A, Caillard D, San Juan J. Acta Materialia, in press.