The Creation of Virtual Duty Cycles for the Assessment of ...
35
The Creation of Virtual Duty Cycles for the Assessment of Transmission Durability Using CarMaker to Perform Virtual Road Load Data Collection Changan UK R&D Centre | 12.10.2020 Dr. Andrew Lockyer PhD, MRes, MEng, CEng, MIMechE Principal CAE Engineer Driveline & Integration
-
Upload
khangminh22 -
Category
Documents
-
view
2 -
download
0
Transcript of The Creation of Virtual Duty Cycles for the Assessment of ...
The Creation of Virtual Duty Cycles for the Assessmentof Transmission Durability
Using CarMaker to Perform Virtual Road Load Data Collection
Changan UK R&D Centre | 12.10.2020
Dr. Andrew Lockyer PhD, MRes, MEng, CEng, MIMechE Principal CAE EngineerDriveline & Integration
Model Creation
1. Introduction to Changan
2. Overview of the Project
3.
4. Results
5. Conclusions and Further Work

Model Creation
1. Introduction to Changan
2. Overview of the Project
3.
4. Results
5. Conclusions and Further Work
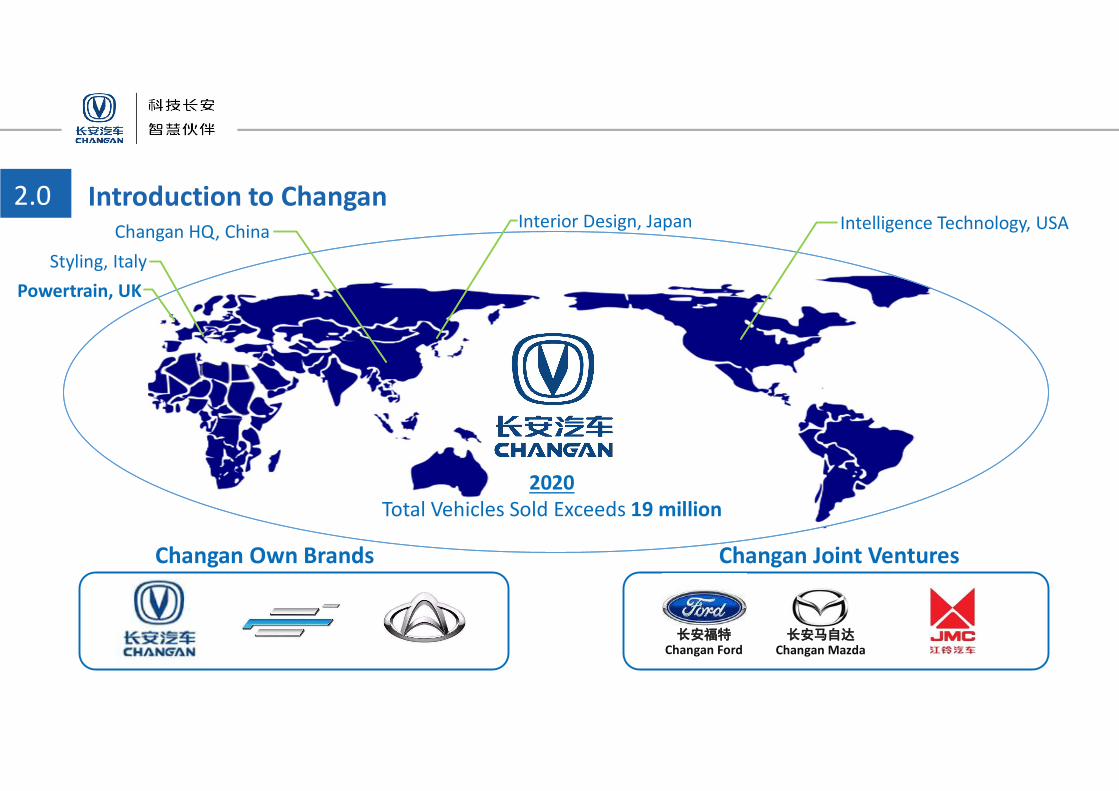
Intelligence Technology, USAChangan HQ, China
Powertrain, UKStyling, Italy
Interior Design, Japan
2020Total Vehicles Sold Exceeds 19 million
Changan Own Brands Changan Joint Ventures
2.0 Introduction to Changan
长安马自达Changan Mazda
长安福特Changan Ford

1.0 Introduction to Changan• Changan UK R&D Centre Limited (CAUK) was set up in June 2010 to become a World Class
powertrain R&D centre.
5
• CAUK is dedicated to designing and developing the next generation powertrains for Changan'snext generation vehicles.
• Key successes for CAUK are:- A new fleet of high performance, high efficiency engines.- Development of in-house control software.- Strategy road-map.- First in-house designed Dual Clutch Transmission (DCT), DF727.
Model Creation
1. Introduction to Changan
2. Overview of the Project
3.
4. Results
5. Conclusions and Further Work
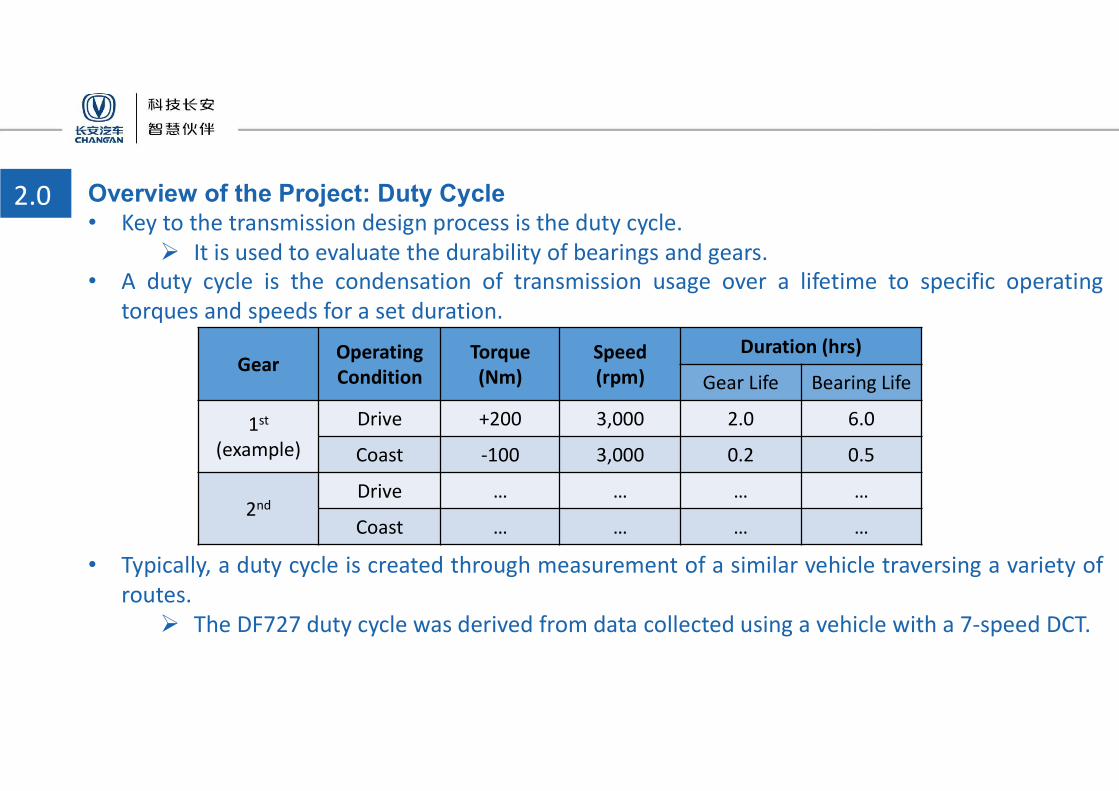
2.0 Overview of the Project: Duty Cycle• Key to the transmission design process is the duty cycle.
It is used to evaluate the durability of bearings and gears.
7
Gear Operating Condition
Torque (Nm)
Speed (rpm)
Duration (hrs)
Gear Life Bearing Life
1st
(example)Drive +200 3,000 2.0 6.0
Coast -100 3,000 0.2 0.5
2ndDrive … … … …
Coast … … … …
• A duty cycle is the condensation of transmission usage over a lifetime to specific operatingtorques and speeds for a set duration.
• Typically, a duty cycle is created through measurement of a similar vehicle traversing a variety ofroutes.
The DF727 duty cycle was derived from data collected using a vehicle with a 7-speed DCT.

2.0 Overview of the Project: Duty Cycle
8
Road Load CollectionDisadvantages associated instrumented vehicle approach:• Cost → Purchase of vehicle & equipment.• Time → Multiple routes & drivers.• Design Limitations → Feasibility of testing similar transmissions.
Road Load Collection
Generate Duty Cycle
Gearbox Analysis
Mature Transmission Design
Layout Analysis & Decision
Standard Transmission Design Workflow
Refine Design
Gearbox Analysis
Design Iterations & Optimisation
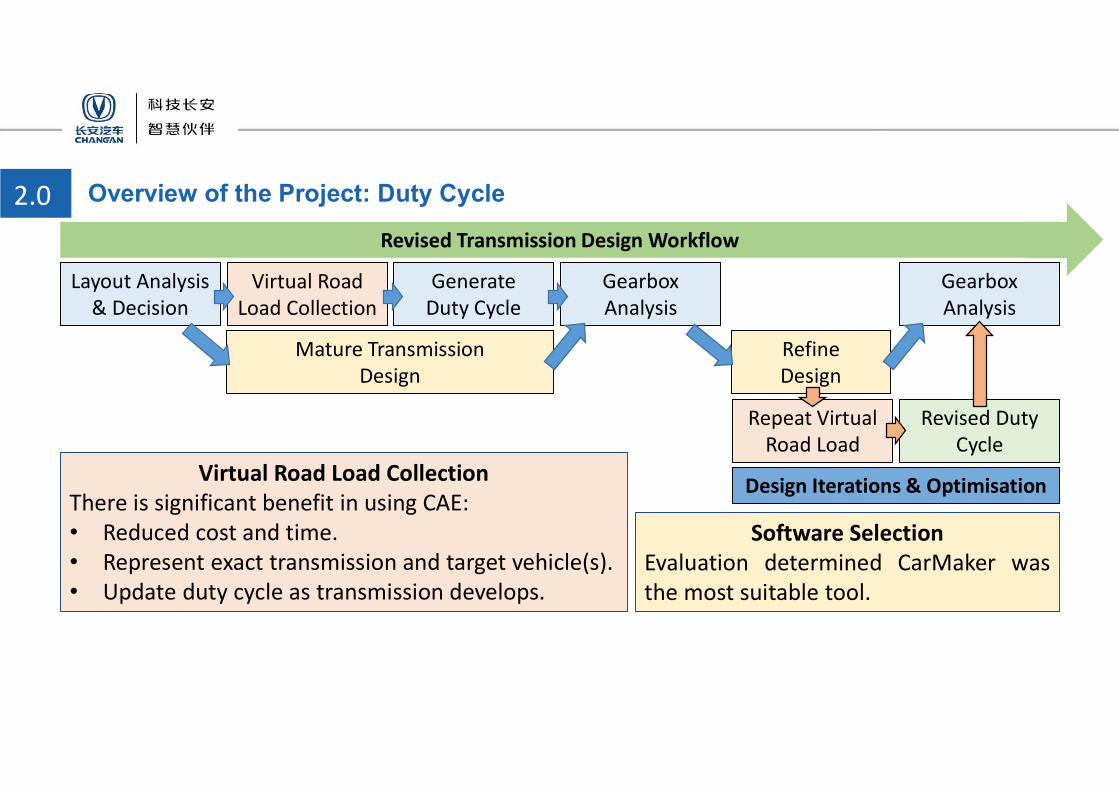
2.0 Overview of the Project: Duty Cycle
9
Repeat Virtual Road Load
Virtual Road Load Collection
Generate Duty Cycle
Gearbox Analysis
Mature Transmission Design
Layout Analysis & Decision
Revised Transmission Design Workflow
Refine Design
Gearbox Analysis
Design Iterations & Optimisation
Revised Duty Cycle
Virtual Road Load CollectionThere is significant benefit in using CAE:• Reduced cost and time.• Represent exact transmission and target vehicle(s).• Update duty cycle as transmission develops.
Software SelectionEvaluation determined CarMaker wasthe most suitable tool.

2.0• AIM: to demonstrate the validity of using CarMaker:
DF727 road load measurement exercise was virtually replicated.
10
Overview of the Project: Duty Cycle Correlation Exercise
Replicate Test Routes
Vehicle Parameters
Vehicle Model
CarMaker Model
Driver Model
Route Traffic
Simulate Full Vehicle Traversing Route
Post Process to Extract Transmission Usage

Model Creation
1. Introduction to Changan
2. Overview of the Project
3.
4. Results
5. Conclusions and Further Work
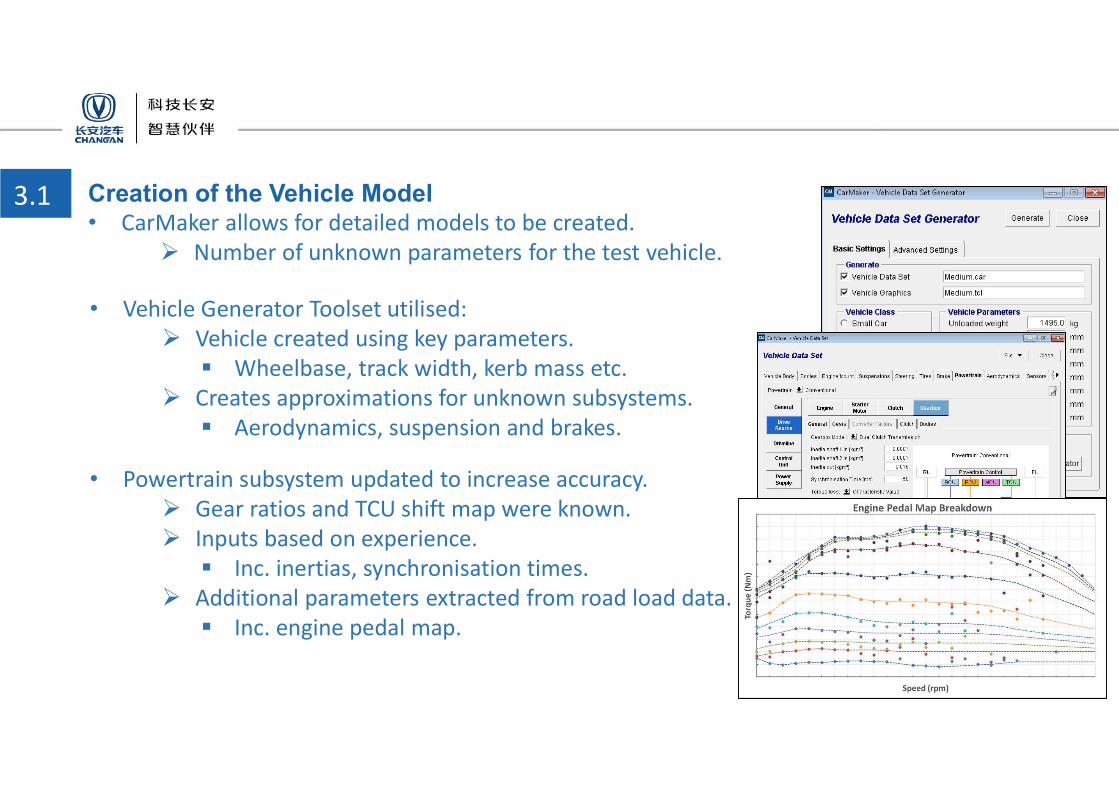
3.1 Creation of the Vehicle Model• CarMaker allows for detailed models to be created.
Number of unknown parameters for the test vehicle.
12
• Vehicle Generator Toolset utilised: Vehicle created using key parameters.
Wheelbase, track width, kerb mass etc. Creates approximations for unknown subsystems.
Aerodynamics, suspension and brakes.
• Powertrain subsystem updated to increase accuracy. Gear ratios and TCU shift map were known. Inputs based on experience.
Inc. inertias, synchronisation times. Additional parameters extracted from road load data.
Inc. engine pedal map.
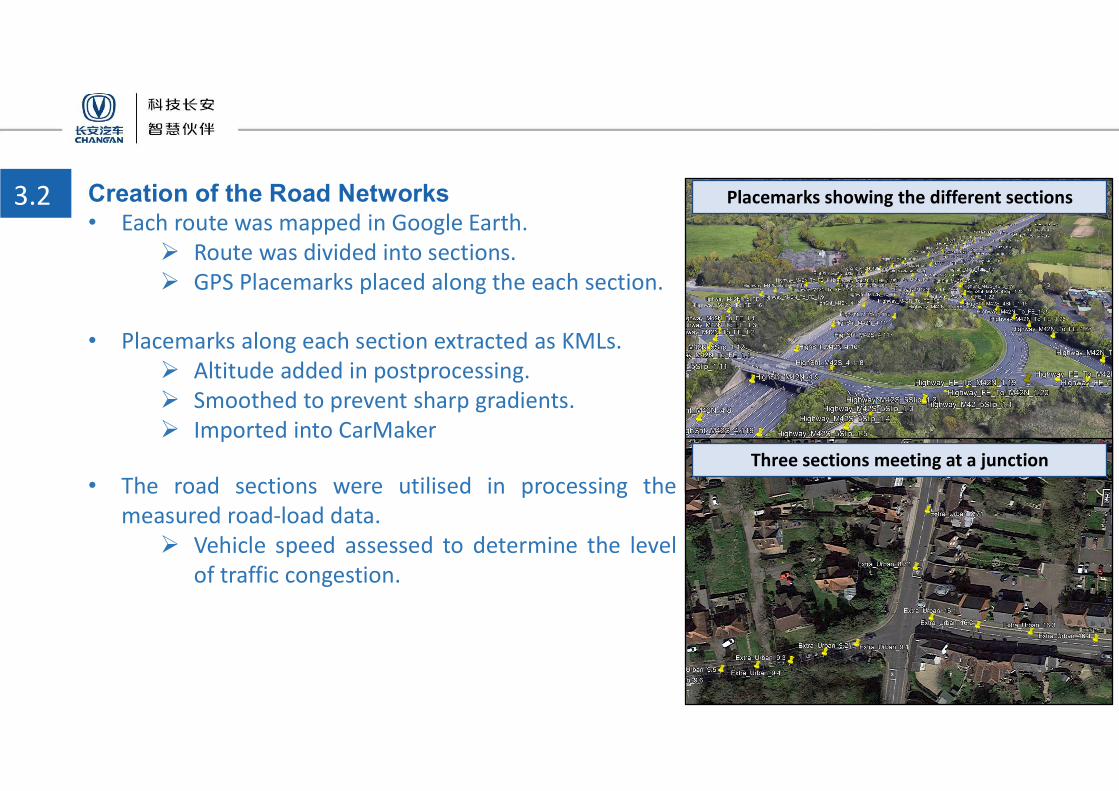
3.2 Creation of the Road Networks• Each route was mapped in Google Earth.
Route was divided into sections. GPS Placemarks placed along the each section.
13
Placemarks showing the different sections
Three sections meeting at a junction
• Placemarks along each section extracted as KMLs. Altitude added in postprocessing. Smoothed to prevent sharp gradients. Imported into CarMaker
• The road sections were utilised in processing themeasured road-load data.
Vehicle speed assessed to determine the levelof traffic congestion.
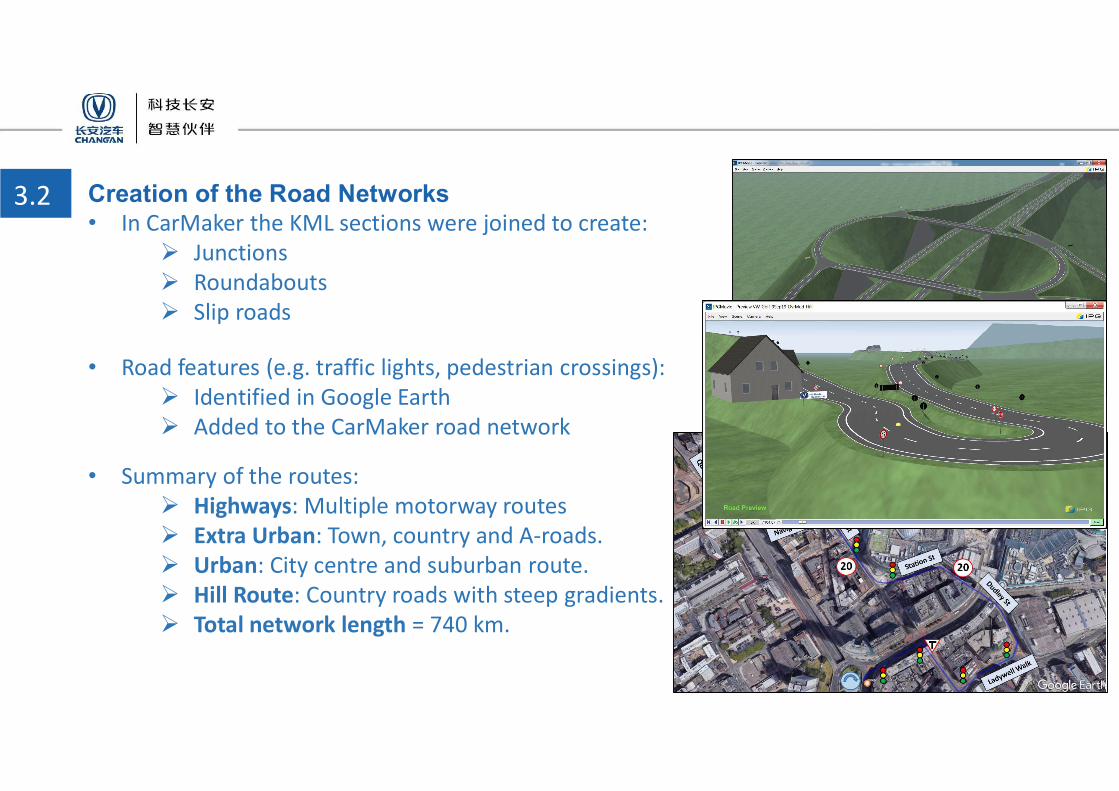
3.2 Creation of the Road Networks• In CarMaker the KML sections were joined to create:
Junctions Roundabouts Slip roads
14
• Road features (e.g. traffic lights, pedestrian crossings): Identified in Google Earth Added to the CarMaker road network
• Summary of the routes: Highways: Multiple motorway routes Extra Urban: Town, country and A-roads. Urban: City centre and suburban route. Hill Route: Country roads with steep gradients. Total network length = 740 km.
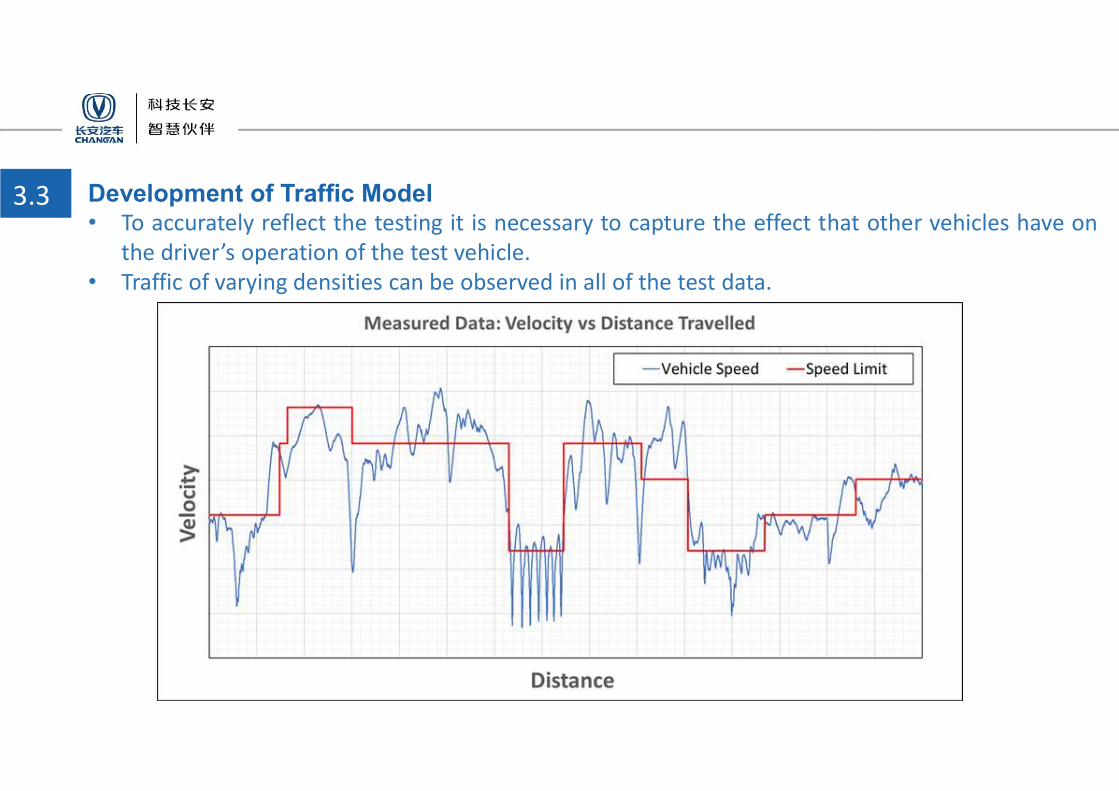
3.3 Development of Traffic Model• To accurately reflect the testing it is necessary to capture the effect that other vehicles have on
the driver’s operation of the test vehicle.• Traffic of varying densities can be observed in all of the test data.
15

3.3 Development of Traffic Model• To accurately reflect the testing it is necessary to include the effect that other vehicles have on
the driver’s operation of the test vehicle.• Traffic of varying densities can be observed in all of the test data.• Number of options to represent traffic:
16
Traffic Approach Imposed Velocity Profile Variable Speed Limits AI Vehicles
Adv.
• Simple Implementation utilising test data
• Speed limits capture transient traffic behaviour.
• Limits do not impose velocity profile on the vehicle, but the constraints in which to operate.
• Introduces realistic, randomised behaviour.
Dis.
• Limited applicability as imposed velocity profile is specific to test vehicle.
• Increased complexity added to road file.
• Multiple road files required to represent different traffic conditions.
• Increased complexity with added variables.
• Significant workload for the length of the routes.
• Focus on the project is the powertrain, not ADAS.

3.3 Development of Traffic Model• Preliminary Analysis of the measured data found common trends for the variation in vehicle
velocity during periods of traffic. The vehicle speed oscillates about an average below the speed limit. The average, amplitude and wavelength indicate the traffic density.
17
• Additional road load collection was performed to gain further understanding: Variety of routes traversed at different times and days. Speed, GPS and distance travelled recorded. Driver observations recorded to help interpretation of the data.
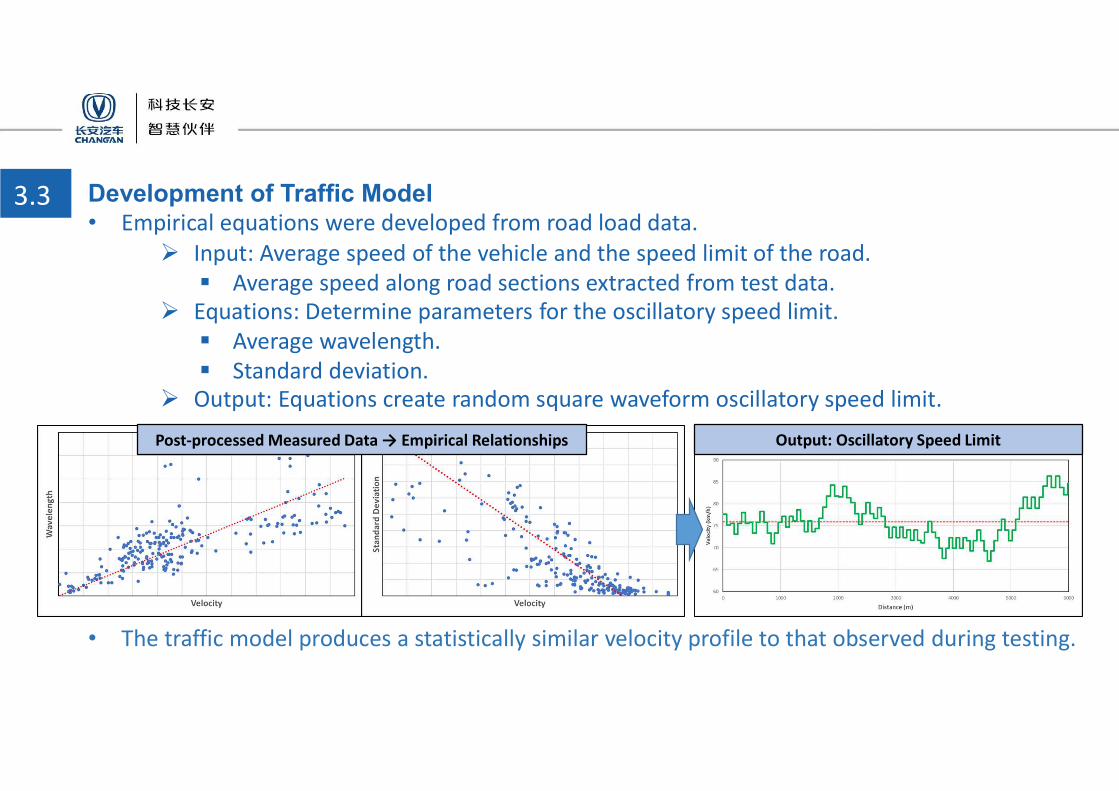
3.3 Development of Traffic Model• Empirical equations were developed from road load data.
18
Post-processed Measured Data → Empirical Rela onships
Input: Average speed of the vehicle and the speed limit of the road. Average speed along road sections extracted from test data.
Equations: Determine parameters for the oscillatory speed limit. Average wavelength. Standard deviation.
Output: Equations create random square waveform oscillatory speed limit.
• The traffic model produces a statistically similar velocity profile to that observed during testing.
Output: Oscillatory Speed Limit
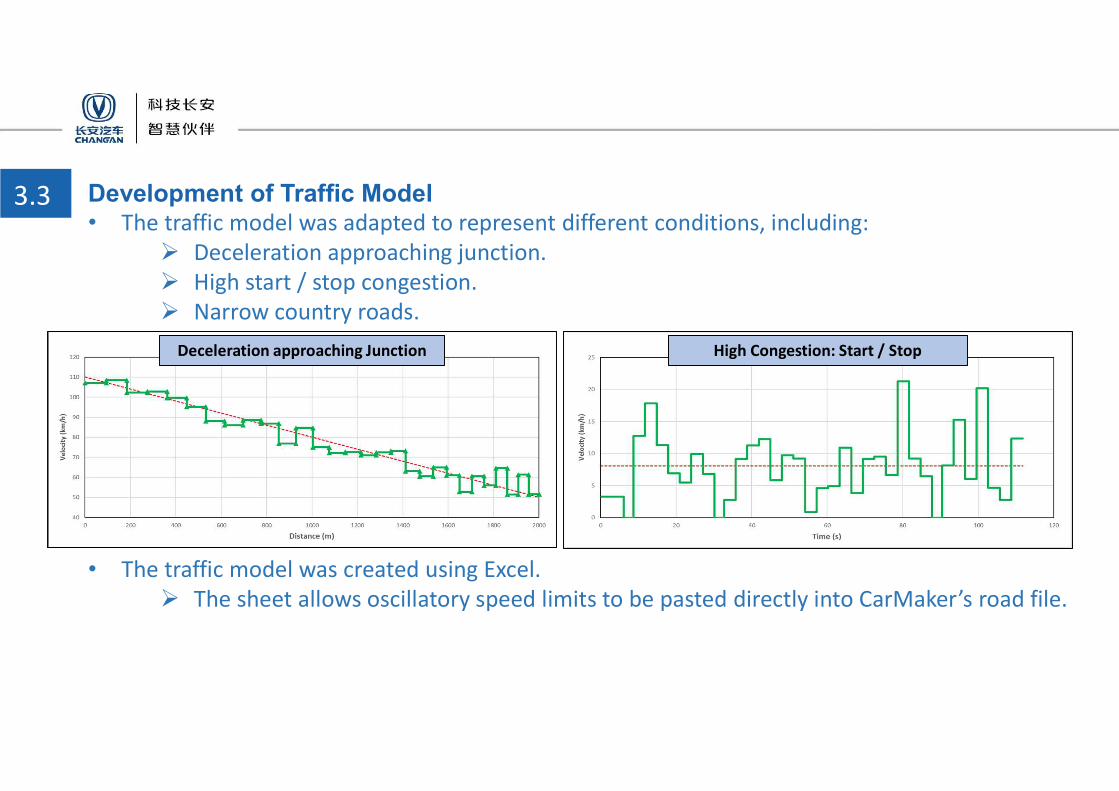
3.3 Development of Traffic Model• The traffic model was adapted to represent different conditions, including:
Deceleration approaching junction. High start / stop congestion. Narrow country roads.
19
Deceleration approaching Junction High Congestion: Start / Stop
• The traffic model was created using Excel. The sheet allows oscillatory speed limits to be pasted directly into CarMaker’s road file.

3.4 Parameterisation of the Driver Model• For the road load testing a ‘normal’ driving style was adopted by the drivers.
Aim was to replicate this behaviour using CarMaker’s virtual driver.
20
• The test data was used to characterise the parameters for the driver: Establish vehicle acceleration limits.
Parameterise longitudinal acceleration with vehicle speed. Time taken applying / switching between pedals.
• Initial comparison with test data led to further refinement: Driver adaption parameter introduced. Adjustment to driver presets.

Model Creation
1. Introduction to Changan
2. Overview of the Project
3.
4. Results
5. Conclusions and Further Work
4.0 Results• To assess the validity of the CAE approach the results were assessed in two stages.
22
• CarMaker Output: Comparison with measured data. Breakdown in velocity distribution Distance travelled in each gear. Torque distribution in each gear.
• Gear and Bearing Durability: Comparison with duty cycle derived from measured data. Duty cycle compiled from virtual data. Durability predicted using gearbox analysis software.
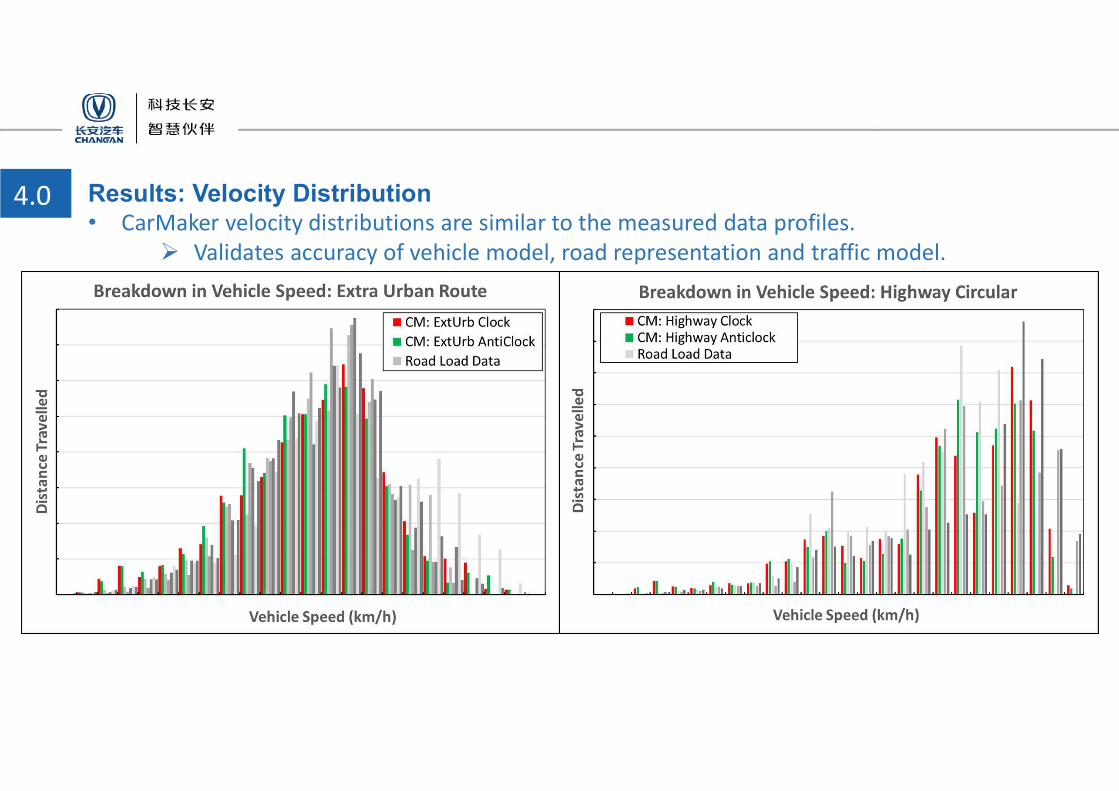
4.0 Results: Velocity Distribution• CarMaker velocity distributions are similar to the measured data profiles.
Validates accuracy of vehicle model, road representation and traffic model.
23

4.0 Results: Velocity Distribution and Time Spent in Each Gear• Distance travelled in each gear is consistent with measured data.
Further confidence in modelling approach.
24

4.0 Duty Cycle Comparison• Extracted torque distributions in good agreement with measured data.
25
• To create the duty cycle the torque distribution for each route is post-processed.1. Each Route: Stress factors are calculated at each torque level and combined.2. Determine equivalent duty for a single positive and negative torque condition.
Based on a mix of the assessed routes scaled to cover the lifetime of the transmission.
Pos.Neg.
Pos.Neg.
Torque distribution in 7th GearTorque Distribution for All Gears
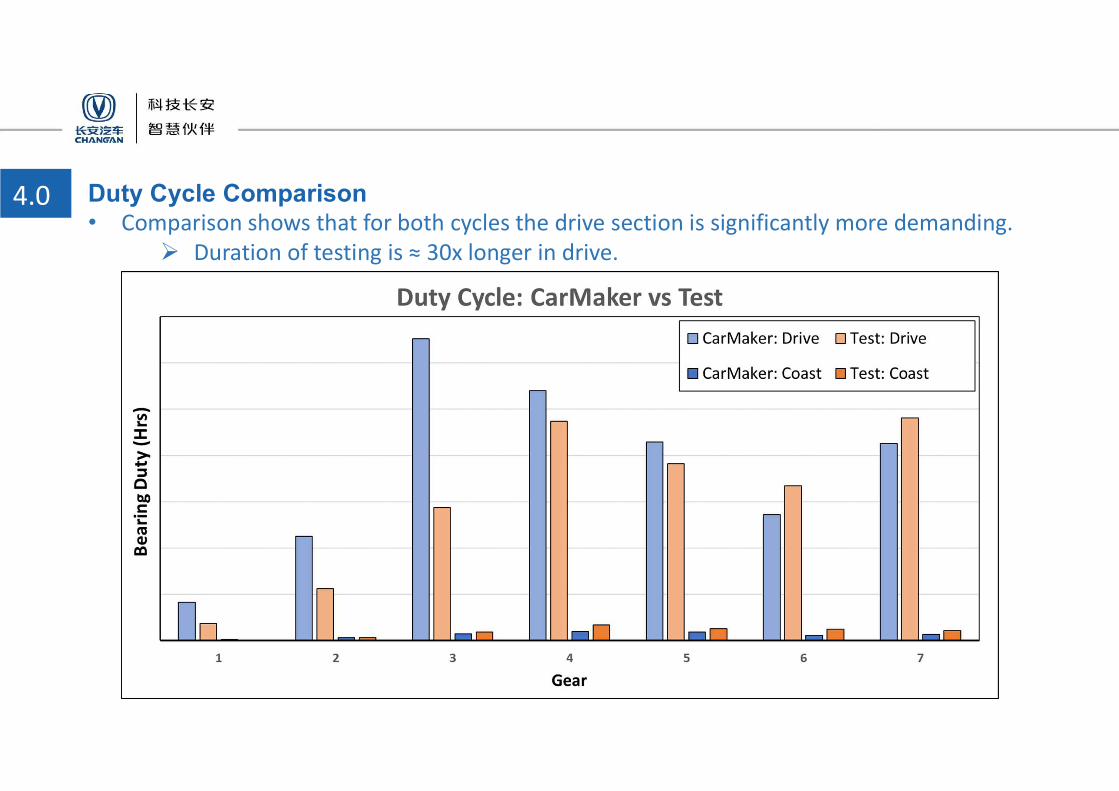
4.0 Duty Cycle Comparison• Comparison shows that for both cycles the drive section is significantly more demanding.
Duration of testing is ≈ 30x longer in drive.
26

4.0 Duty Cycle Comparison: Drive• CarMaker predicts a noticeably higher duty in 1st to 3rd gears.
Attributed to virtual driver being more aggressive than the ‘normal’ driver during testing.
27
Virtual driver:- Applies higher torque
during launch- Higher torque demand
during acceleration resultsin kickdown into lowergears (noticeably 3rd).
Good correlation in higher gears.

4.0 Duty Cycle Comparison: Drive• CarMaker predicts a noticeably higher duty in 1st to 3rd gears.
Attributed to virtual driver being more aggressive than the ‘normal’ driver during testing.
28
Refinement to the Drivermodel.- Less time at higher torque.- Reduced duty in lower gears.
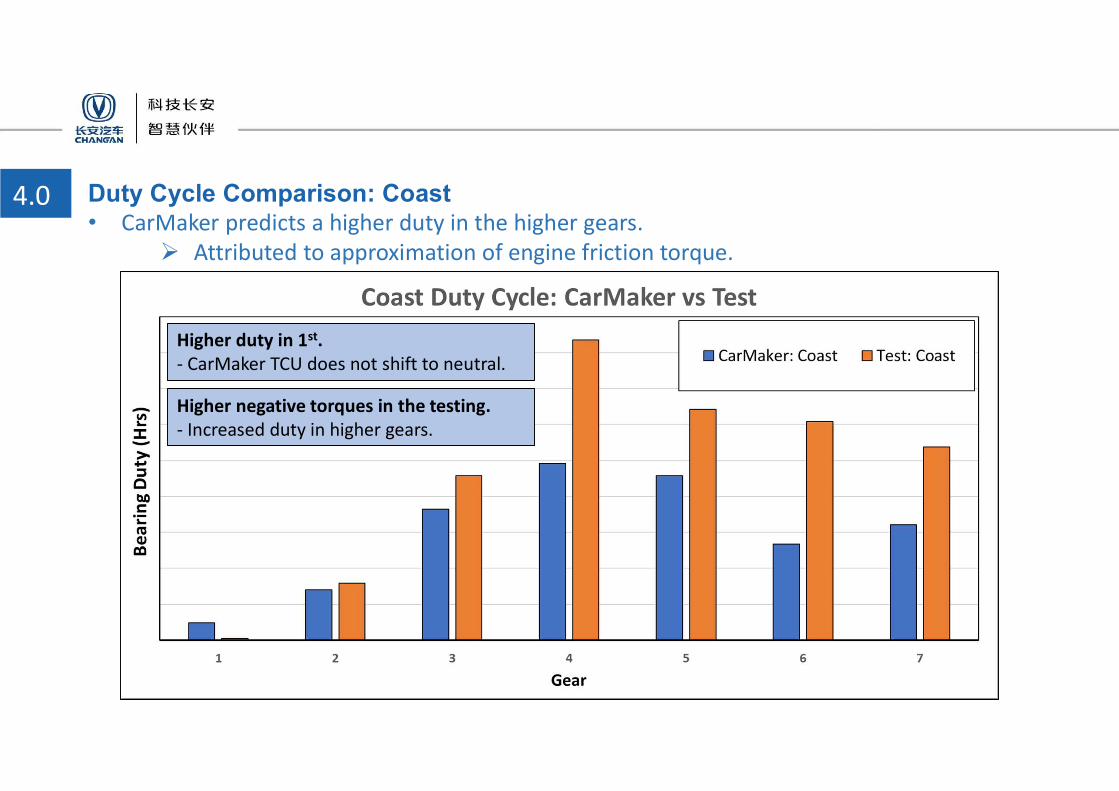
4.0 Duty Cycle Comparison: Coast• CarMaker predicts a higher duty in the higher gears.
Attributed to approximation of engine friction torque.
29
Higher duty in 1st.- CarMaker TCU does not shift to neutral.
Higher negative torques in the testing.- Increased duty in higher gears.
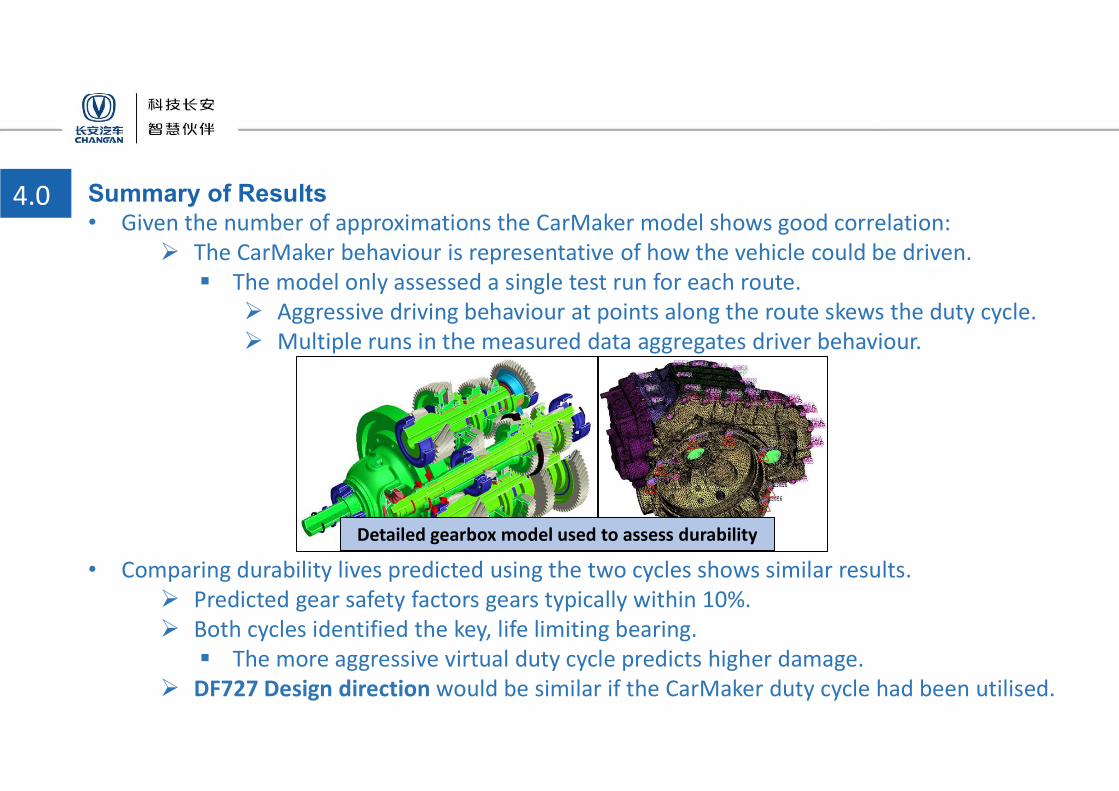
4.0 Summary of Results• Given the number of approximations the CarMaker model shows good correlation:
The CarMaker behaviour is representative of how the vehicle could be driven. The model only assessed a single test run for each route.
Aggressive driving behaviour at points along the route skews the duty cycle. Multiple runs in the measured data aggregates driver behaviour.
30
Detailed gearbox model used to assess durability
• Comparing durability lives predicted using the two cycles shows similar results. Predicted gear safety factors gears typically within 10%. Both cycles identified the key, life limiting bearing.
The more aggressive virtual duty cycle predicts higher damage. DF727 Design direction would be similar if the CarMaker duty cycle had been utilised.
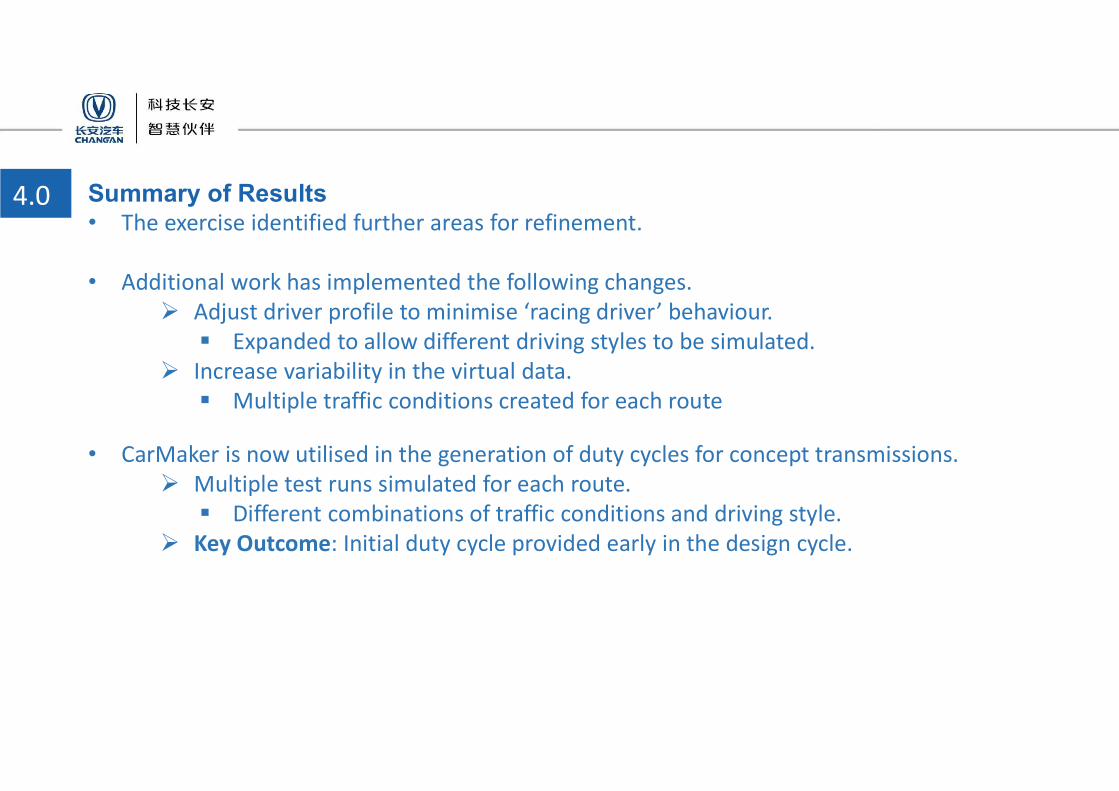
4.0 Summary of Results• The exercise identified further areas for refinement.
• Additional work has implemented the following changes. Adjust driver profile to minimise ‘racing driver’ behaviour.
Expanded to allow different driving styles to be simulated. Increase variability in the virtual data.
Multiple traffic conditions created for each route
31
• CarMaker is now utilised in the generation of duty cycles for concept transmissions. Multiple test runs simulated for each route.
Different combinations of traffic conditions and driving style. Key Outcome: Initial duty cycle provided early in the design cycle.
Model Creation
1. Introduction to Changan
2. Overview of the Project
3.
4. Results
5. Conclusions and Further Work

5.0 Conclusion• CarMaker has been utilised to create a virtual representation of a vehicle traversing a variety of
road networks, with different traffic conditions. The outputs from the model have been used to create a duty cycle.
33
• The level of correlation with measured data validates the approach. Multiple unknowns effectively approximated using ‘Vehicle Generator’. Representation of traffic captures influence of congestion on vehicle response. Agreement in durability calculations.
• Benefits of the tool demonstrated. Model runs 30 times faster than real time increasing flexibility and utilisation. Greater range of routes can be considered.
Derive future duty cycles from Chinese routes. Potential to expand functionality beyond duty cycle generation.
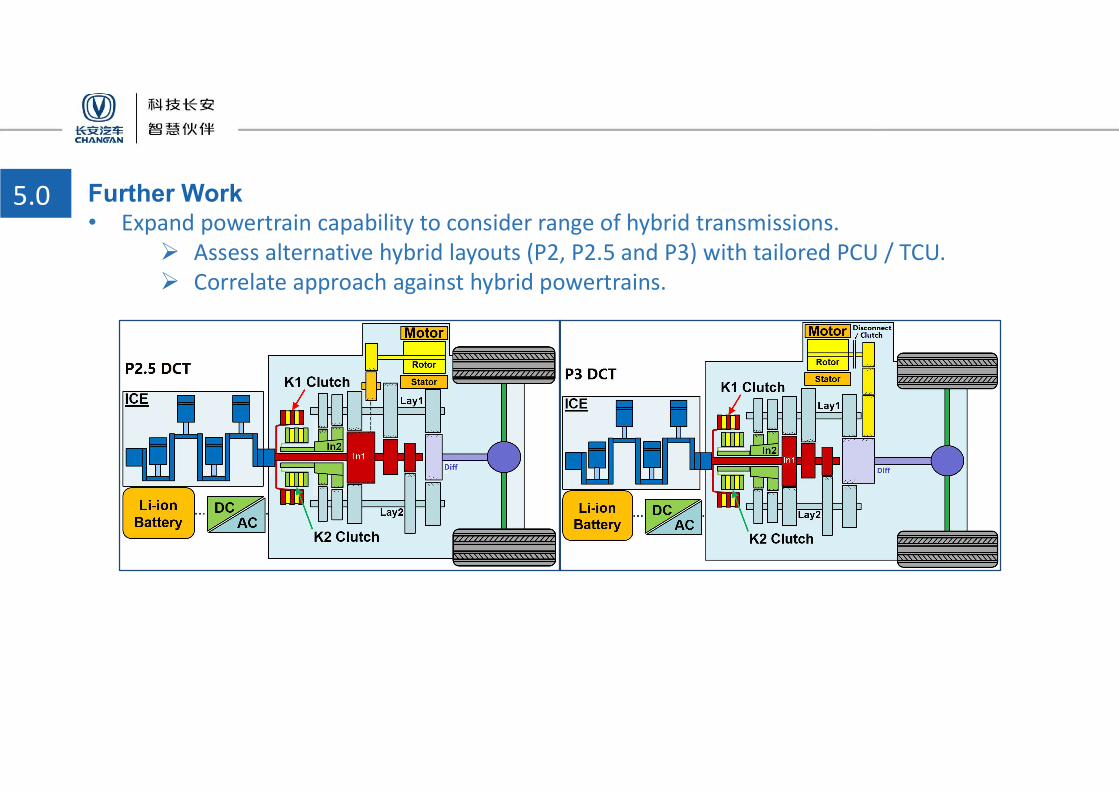
5.0 Further Work• Expand powertrain capability to consider range of hybrid transmissions.
Assess alternative hybrid layouts (P2, P2.5 and P3) with tailored PCU / TCU. Correlate approach against hybrid powertrains.
34