The Countryside in Figures - 2 0 1 9 - Philippine Statistics ...
220
i The Countryside in Figures: Guimaras, 2019 Edition 2 0 1 9 The Countryside in Figures Provincial Government of Guimaras Provincial Planning and Development Office Philippine Statistics Authority Provincial Statistical Office
-
Upload
khangminh22 -
Category
Documents
-
view
2 -
download
0
Transcript of The Countryside in Figures - 2 0 1 9 - Philippine Statistics ...

i
The Countryside in Figures: Guimaras, 2019 Edition
2019
The Countryside in Figures
Provincial Government of Guimaras Provincial Planning and Development Office
Philippine Statistics Authority Provincial Statistical Office

ii
The Countryside in Figures: Guimaras, 2019 Edition
2019
The Countryside in Figures
Provincial Government of Guimaras Provincial Planning and Development Office
Philippine Statistics Authority Provincial Statistical Office

iii
The Countryside in Figures: Guimaras, 2019 Edition
The Countryside in Figures: Guimaras, 2019 Edition is a publication prepared by the
Guimaras Provincial Statistical Office
of the Philippine Statistics Authority (PSA)
in collaboration with the Provincial Statistics Committee (PSC)
For subscription and inquiries, please contact us at the:
PHILIPPINE STATISTICS AUTHORITY (PSA) – GUIMARAS PROVINCE
2nd floor Galanto Building New Site, San Miguel
Jordan, Guimaras 5045
or at:
Telefax No. (033) 331-28-44
E-Mail Address: [email protected]
The PSA reserves its exclusive right to reproduce all publications in whatever form. The recipient of complimentary copies has no right to reproduce the publication/data, recopy, lend or repackage them to other parties for
commercial purposes without the written permission from the PSA. Should the recipient wish to show some
portions of the data in his/her report/article/document, the title of the publication and the PSA as publisher should always be cited.

iv
The Countryside in Figures: Guimaras, 2019 Edition
PHILIPPINE STATISTICS AUTHORITY Guimaras Provincial Statistical Office
CLAIRE DENNIS S. MAPA Ph., D
National Statistician and Civil Registrar General
MARLENE Y. ALVIAR Chief Statistical Specialist/OIC- Regional Director
NELIDA B. LOSARE
Provincial Statistics Officer
STATISTICAL OPERATION ADMINISTRATIVE/ CIVIL REGISTRATION STAFF
VICENTE G. GEONANGA MARY JOY G. VILLEGAS GRACE C. BUENASALBAS Supervising Statistical Specialist Assistant Statistician/Disbursement Officer Designate Registration Officer II RONEY E. GENANDA IAN JANICK G. GOMEZ HERNELL S. GALVEZ Statistical Analyst Admin Aide VI Admin Clerk/ Statistical
NOELLE MAE M. LIM ORLIE E. ESPINOSA FRIZ KEITH A. GALLENTES Admin Aide/Statistical Admin Aide Clerk/Public Information Officer Utility
CHARLES ANGELO G. TAMAGOS ADOLFO E. ESTILLORO JR. Admin Aide Clerk I/Statistical Driver
As of October 30, 2019

v
The Countryside in Figures: Guimaras, 2019 Edition
FOREWORD
In line with our commitment to deliver relevant, reliable and more disaggregated statistics to our clients and stakeholders, and serve as an access for integrated sharing and dissemination of statistics in the countryside, the Philippine Statistics Authority Guimaras Provincial Statistical Office has come up with the publication “The Countryside in Figures: Guimaras, 2019 Edition.”
Patterned from the national version, it contained relevant statistics/indicators comparing the performance of the five (5) municipalities of the province of Guimaras. It is a useful statistical portfolio for local planners, investors, and other groups interested of Guimaras as a venue for investment and development.
This publication presents statistical indicators at the provincial and municipal levels such as general information; governance; income and expenditures; labor and employment; environment and natural resources; agriculture and agrarian reform ; industry; vital, health and nutrition statistics; education; infrastructure; transportation and communication; tourism; energy; money and banking; and public order, safety and justice.
We look forward that this publication will help the need for a more extensive statistics beneficial in planning, decision making and policy setting towards more effective local governance and inclusive growth. Moreover, we hope that “The Countryside in Figures: Guimaras, 2019 Edition will continue to increase the awareness of the local government units and the public in general, on the significance of statistics.
The PSA acknowledges the support of various data sources, the assistance of the Provincial Statistics Committee (PSC) members for the data inputs to this publication and above all the funding support of the Provincial Government of Guimaras that makes the printing/reproduction of this publication possible.
NELIDA B. LOSARE
Provincial Statistics Office

vi
The Countryside in Figures: Guimaras, 2019 Edition
Acknowledgement
Provincial Planning and Development Office
Provincial Environment and Natural Resources Office
Provincial Tourism Office
Provincial Fire Marshal
Guimaras Police Provincial Office
Department of the Interior and Local Government
Provincial Health Office
Department of Education– Schools Division of Guimaras
Commission on Election Provincial Office
Department of Budget and Management—Region VI
Bureau of Local Government Finance—Region VI

vii
The Countryside in Figures: Guimaras, 2019 Edition
About PSA
The Philippine Statistics Authority was created in September
12, 2013 when Republic Act 10625, otherwise known as the
“Philippine Statistical Act of 2013” was approved. R.A. 10625
abolished the National Statistics Office (NSO), National Statistical
Coordination Board (NSCB), Bureau of Agricultural Statistics (BAS)
and Bureau of Labor and
Employment Statistics (BLES); pooling its employees to comprise
the PSA.
The PSA shall primarily be responsible for the implementation of
the objectives and provisions of R.A. 10625.
It shall plan, develop, prescribe, disseminate and enforce policies,
rules and regulations and coordinate government-wide programs
governing the production of official statistics, general-purpose
statistics, and civil registration services.
It shall primarily be responsible for all national censuses and
surveys, sectoral statistics, consolidation of selected
administrative recording systems and compilation of national
accounts.
VISION
Solid responsive world-class authority on quality statistics and civil
registration.
MISSION
Deliver relevant, reliable statistics and civil registration services for
equitable development towards improved quality of life for all.
CORPORATE PERSONALITY
Adaptability Open to changes
Transparency No hidden agenda
Integrity Strong inside out
viii
The Countryside in Figures: Guimaras, 2019 Edition
TABLE OF CONTENTS
PSA– Guimaras Organizational Structure iv
Foreword v
Acknowledgement vi
About PSA vii
Table of Contents viii-xiii
Map of the Philippines Identifying the Location of Region VI– Western Visayas xiv
Map of Western Visayas Identifying the Location of Guimaras Province xv
Map of Guimaras Province xvi
Brief History of Guimaras Province and its Municipalities xvii-xxii
CHAPTER 1. GENERAL INFORMATION
Geographical Location 02
Topography and Slope 03-04
Income Classification 05
Urban –Rural Barangays 06-12
CHAPTER 2. POPULATION AND DEMOGRAPHY
Total Population 14-15
Household Population 16-18
Population Density 19
Sex Ratio 20-22
Median Age 23
Age–Sex Pyramid 24
Dependency Ratio 25
Voting Population 26-30
Marital Status 31-32
Highest Grade Completed 33-34
School Attendance 35-37
Literacy Rate 38-39
Religious Affiliation 40-42
Major Occupation 43-44
Overseas Workers 45-46

ix
The Countryside in Figures: Guimaras, 2019 Edition
TABLE OF CONTENTS
CHAPTER 3. POVERTY AND INCOME
Annual Per Capita Poverty Threshold , Poverty Incidence of Families and Magnitude of Poor Families 49
Annual Per Capita Poverty Threshold, Poverty Incidence among Population and Poor Population’s Magnitude 49
Annual Per Capita Food Threshold, and Subsistence of Families : Guimaras 2012 and 2015 50
Annual Per Capita Food Threshold, and Subsistence of Population by Province: 2012 and 2015 50
Income Gap, Poverty Gap, and Severity of Poverty : Guimaras 2012 and 2015 50
Consumer Price Index, Inflation Rate and Purchasing Power of Peso for all Income Households Guimaras 51
CHAPTER 4. GOVERNANCE, PUBLIC ORDER & SAFETY
Congressional and Provincial Government Officials 54-59
Crime Incidents, By Type of Offense 61
Crime Volume, Crime Solved and Crime Solution Efficiency 62
Index Crime Volume 63
Total Crime Volume 64
Total Number of Policemen and Ratio to Population by Municipality 65
Number of BFP Personnel, Fire Trucks, Fire Stations, and Radio Communications 66 Origin/Causes and Motives of Fire Incidents 67 Number of Fire Incidents 68-69 Causes of Fire 70 Nature of Fire, Mortality, Injuries and Fire Damages 71 Total Fire Damages 72 Total Collection of Fire Code Fees 73 Inspected Business Operation 74 Business Processing Licensing Office Collections 75 CHAPTER 5. PUBLIC ADMINISTRATION
Total Income, Tax Revenues, Non– Tax Revenues and External Sources 78-79
Total Expenditures 80-81
Total Income of Guimaras by Municipality 82-83
Internal Revenue Allotment Share 84
Comparison of Allocation to Local Government Units 85

x
The Countryside in Figures: Guimaras, 2019 Edition
TABLE OF CONTENTS
CHAPTER 6. EDUCATION
Guimaras Total Enrolment 88
Number of Nationally– Funded Non Teaching and Teaching Position Assigned in Government Elementary Schools 89
Performance Indicators Public Junior and Senior High Schools 90
Number of Nationally– Funded Non Teaching and Teaching Position Assigned in Government Junior High and Senior High School 91
Performance Indicators for Public Junior High & Senior High Schools 92
Total Enrolment in Public Elementary Schools 93
Total Enrolment in Public Junior High Schools 94
Total Enrolment in Public Senior High Schools 95-96
CHAPTER 7. BANKING AND FINANCE
Number of Banks in Guimaras 99
Number of ATMs in Guimaras 100
Distribution of Deposit Liabilities 101
Distribution of Loans and Receivables 102
CHAPTER 8. VITAL, HEALTH &NUTRITIONAL STATISTICS Guimaras Health Profile 105
Ratio of Public Health Personnel 106
Health Indices 107
Vital Health Indices 108
Top Leading Causes of Morbidity 109
Top Leading Causes of Mortality 110
Top Leading Causes of Infant Mortality 111
Top Leading Causes of Neonatal Deaths 112
Top Leading Causes of Maternal Deaths 113
Top Leading Causes of Child Mortality 113
Maternal Care 114
Deliveries Attended by Skilled Health Professional 115
Facility-based Deliveries 115
Proportion of Fully Immunized Children 116
Proportion of Infants Exclusively Breastfeed Until Six Month s 116
Family Planning 117

xi
The Countryside in Figures: Guimaras, 2019 Edition
TABLE OF CONTENTS
CHAPTER 8. VITAL, HEALTH &NUTRITIONAL STATISTICS Rate of Teenage Pregnancy 118
Percentage of teenage pregnancy 118
Dental Care 119
Nutrition 120
TB Program 120
HIV and AID Cases in Municipalities of Guimaras 121
Number of Animal Bites Guimaras 122
CHAPTER 9. LABOR AND EMPLOYMENT Establishments and Workers Affected by Shutdown and Retrenchment 124
CHAPTER 10. ENVIRONMENT AND NATURAL RESOURCES Volume and Value of Mineral Commodity in Guimaras 126
Volume and Value of Non-Metallic 126
Limestone Quarry 127
Commercial Sand and Gravel 128-129
Number of Environmental Compliance Certificate (ECC) Issued 130
Climatological Data 131
List of Disposal Facilities 132
Guimaras Coastal Water Sampling Station and Water Classification 133
Water Quality Standards 134-135
Water Quality Monitoring Result 136
Dissolved Oxygen Results 137
Oil and Grease Results 138
Fecal Coliform Results 139
CHAPTER 11. AGRICULTURE AND AGRARIAN REFORM
Volume of Production of Other Crops 141-142
Volume of Production of Selected Fruits in Guimaras 143-144
Volume of Production of Selected Vegetables in Guimaras 145-146
Palay and Corn Production in Guimaras 147
Palay and Corn Area Harvested in Guimaras 148
Chicken and Duck Inventory 149

xii
The Countryside in Figures: Guimaras, 2019 Edition
TABLE OF CONTENTS
CHAPTER 11. AGRICULTURE AND AGRARIAN REFORM
Poultry and Eggs Volume of Production 150
Livestock Inventory 151
Animals Slaughtered 152
Livestock Volume of Production 153
Volume of Fisheries Production 154
Value of Fisheries Production 155
Number of Agrarian Reform Beneficiaries in the ARCs Lease-holders in Guimaras 156
Number of Agrarian Reform Beneficiaries in the ARCs who are EPC/CLOA/LHC holders 156
CHAPTER 12. INDUSTRY Value of Investment Generated ( in Million) and Number of Establishments 158
Guimaras Private Building Construction Value 158
Guimaras Investments and Number of Firms registered 159
CHAPTER 13. INFRASTRUCTURE Length of Provincial Roads 161-162
Inventory of Provincial Bridges 163
CHAPTER 14. TRANSPORTATION AND COMMUNICATION Number of Motor Vehicles Registered by Type 165
Number of Licenses and Permits Issued by Classification and by Sex 166
Guimaras Revenue Collections 167
Number of Post Offices 168
CHAPTER 15. ENERGY Energy Sales, Average Selling Rate and Net Revenue 170
Status of Energization 170
GUIMELCO’S Rate Schedule 171
Historical Average Rate 171
Status of Energization by Municipality 172-174
CHAPTER 15. TOURISM Top 10 Tourist Spots and Points of the Province 177-181
Number of Tourist Arrivals and Receipts 182
Number of Tourist Arrivals by Municipality, 182
Number of Visitors by Municipality 183

xiii
The Countryside in Figures: Guimaras, 2019 Edition
TABLE OF CONTENTS
CHAPTER 15. TOURISM Number of Tourist Attractions 183
Number of Accommodation Facilities 184
Tourist Arrival from Accommodation Establishments (Domestic & Foreign) 184
ANNEXES
Provincial Department Heads 186
Heads of National Agencies 187-188
Heads of Civil Society Organizations People Organizations 189
Municipal Department Heads 190-194
Provincial Statistics Committee Composition 195
.

xiv
The Countryside in Figures: Guimaras, 2019 Edition
MAP OF THE PHILLIPINES IDENTIFYING THE LOCATION OF
REGION 6- WESTERN VISAYAS

xv
The Countryside in Figures: Guimaras, 2019 Edition
MAP OF WESTERN VISAYAS IDENTIFYING
THE PROVINCE OF GUIMARAS
GUIMARAS
xvi
The Countryside in Figures: Guimaras, 2019 Edition
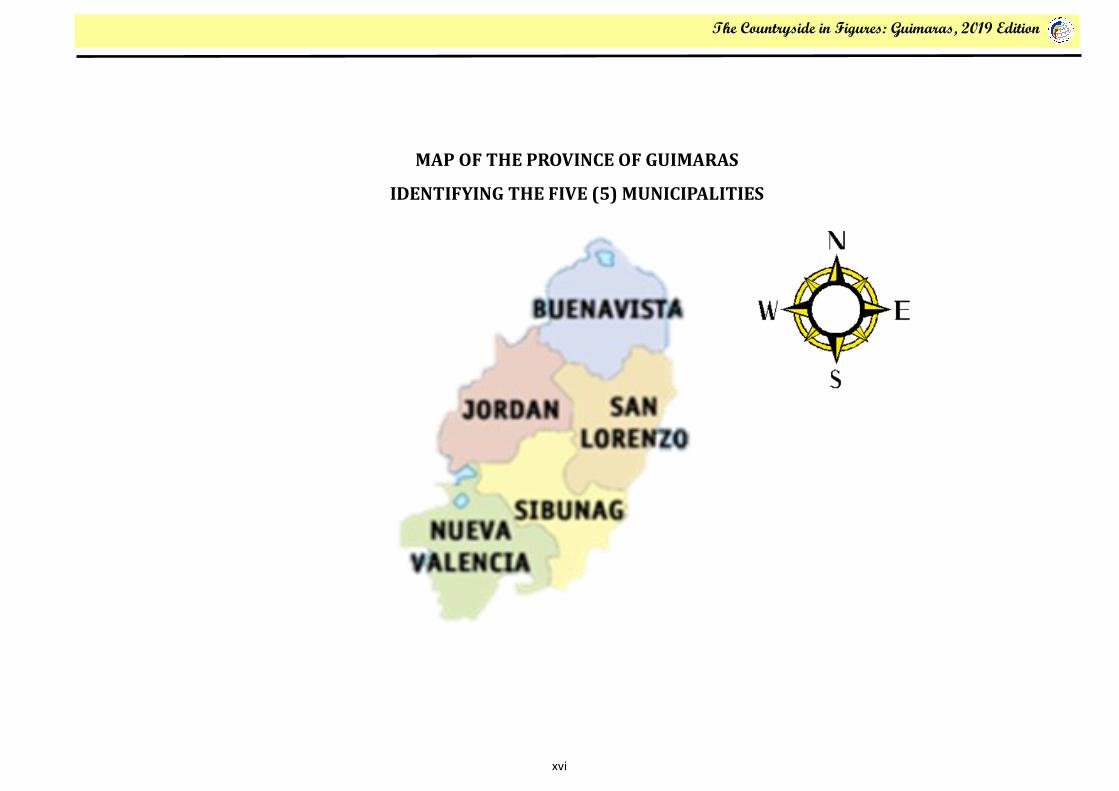
MAP OF THE PROVINCE OF GUIMARAS
IDENTIFYING THE FIVE (5) MUNICIPALITIES

xvii
The Countryside in Figures: Guimaras, 2019 Edition
BRIEF HISTORY OF THE PROVINCE OF GUIMARAS AND ITS MUNICIPALITIES
It was Gonzalo Ronquillo de Pen alosa, a Spanish leader, who established the Spanish settlement in Guimaras for the purpose of the Christianization of the
natives of the island. He and his subordinates organized the pueblicitos or villages of Nayup, with San Pedro Apostol as the patron saint, and Igang, with Sta. Ana
as the patroness.
In 1742, the island fell under the jurisdiction of Dumangas until 1751 when the Augustinian Order was replaced by the Jesuits, after which the Dominicans
took over Guimaras. By 1755, it was organized into a regular parish. When the population increased considerably, the island was given its municipal status with
a seat of government at Tilad (Buenavista). In 1908, during the American period, the Guimarasnons were given the democracy to elect their municipal
president.
One great American left an indelible mark in the island. Douglas McArthur, fresh graduate from West Point as a Second Lieutenant at the age of 23, came
to Iloilo as the head of the company of Corps of Engineers. They constructed roads and the Sto. Rosario Wharf, presently named McArthur's Wharf, which are
still in use today.
Guimaras formerly known as Himal-us and was first gained its status as a sub-province of Iloilo by virtue of R.A. 4667,
which was enacted by Congress on June 18, 1966. It was proclaimed as a regular and full-fledged province on May 22, 1992
after a plebiscite was conducted to ratify the approval of its conversion pursuant to Section 462 of R.A. 7160.
Shortly after Guimaras acquired its provincial status, President Fidel V. Ramos appointed
Emily Relucio-Lopez as its first Governor.
The Province of Guimaras was first made up of 3 municipalities (Jordan, Buenavista and
Nueva Valencia). In 1995, by virtue of Republic Act No. 7896 and Republic Act No. 7897, the
Municipalities of Sibunag and San Lorenzo were created respectively in the Province of
Guimaras. The two new municipalities officially acquired their municipal status after the May 8,
1995 plebiscite held simultaneously with the local election.
Mayor Ernesto L. Gedalanga was the first appointed Mayor of the Municipality of Sibunag
and Mayor Arsenio Zambarrano was also appointed as the Mayor of San Lorenzo. The temporary
seat of government of the Municipality of Sibunag is at Brgy. Sabang while the temporary seat of
Government of the Municipality of San Lorenzo is at Brgy. M. Chavez.

xviii
The Countryside in Figures: Guimaras, 2019 Edition
BRIEF HISTORY OF BUENAVISTA MUNICIPALITY
Amidst the aquatic scenery of Western Visayas standing firm, full of vigor and radiance is the Island Province of Guimaras where farms of one of the U.S.
Certified sweetest mangoes in the world can be found.
At the heart of the province, there is an enchanting beauty of nature awaiting you. Buena! Vista! Exclaimed by the first Spanish Governor who came in the
island. Thus, the place named Buenavista, which means “Good View” or “ Beautiful” as it is rich in natural resources, beauty spots and historical spots such as
beaches, mango plantation, rice farms, limes, limestones, caves and mountain resorts, Enchanted Rock, McArthur’s Headquarters, McArthur’s Wharf and Camp
Jossman.
The beautiful Town of Buenavista or “Good View” town is one of the five municipalities that comprise the Island Province of Guimaras. It is the oldest
among the municipalities, hence, it is called the “mother town”. Formerly, it was named as “Tabuk” (across), “Himal-us” (revenge) or “Tilad”.
The history of the town started as early as 1581 when a small settlement governed by Spaniards led by Gonzalo de Pen alosa was constructed atop the
hilly area of Barangay Old Poblacion overlooking the Guimaras Strait. Pen alosa was amazed by the fine forest timber, limestones deposits that abound the place
with excellent hunting and fishing grounds. Obviously, this town
is rich in natural resources and beauty spots.
Presently, Buenavista is composed of 36 barangays with
its new Town Hall is located in Barangay New Poblacion and the
Municipal Government started July, 1913 is administered by
Mayor Eugenio Gallo Reyes. In his administration, faster delivery
of services to the public is noticeable such as improvement in
Municipal Hall, port, market, roads and many more
infrastructures, which lead to a well-developed beautiful Town
of Buenavista.
xix
The Countryside in Figures: Guimaras, 2019 Edition
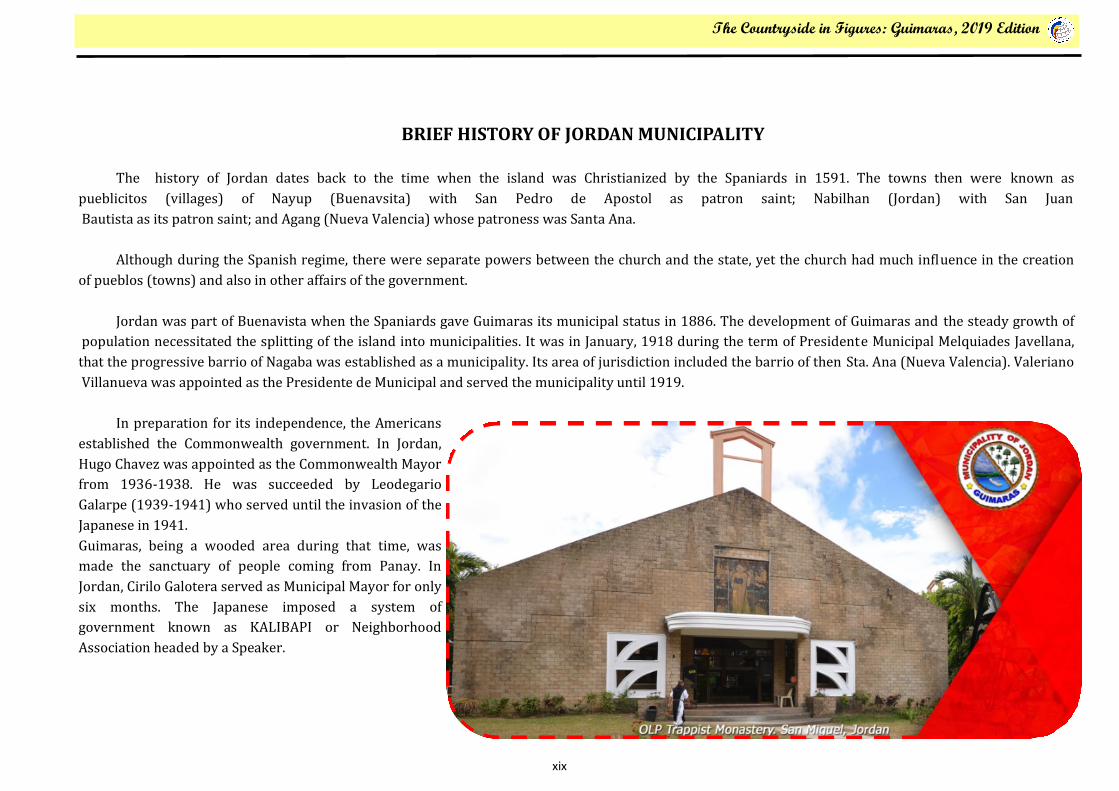
BRIEF HISTORY OF JORDAN MUNICIPALITY
The history of Jordan dates back to the time when the island was Christianized by the Spaniards in 1591. The towns then were known as
pueblicitos (villages) of Nayup (Buenavsita) with San Pedro de Apostol as patron saint; Nabilhan (Jordan) with San Juan
Bautista as its patron saint; and Agang (Nueva Valencia) whose patroness was Santa Ana.
Although during the Spanish regime, there were separate powers between the church and the state, yet the church had much influence in the creation
of pueblos (towns) and also in other affairs of the government.
Jordan was part of Buenavista when the Spaniards gave Guimaras its municipal status in 1886. The development of Guimaras and the steady growth of
population necessitated the splitting of the island into municipalities. It was in January, 1918 during the term of Presidente Municipal Melquiades Javellana,
that the progressive barrio of Nagaba was established as a municipality. Its area of jurisdiction included the barrio of then Sta. Ana (Nueva Valencia). Valeriano
Villanueva was appointed as the Presidente de Municipal and served the municipality until 1919.
In preparation for its independence, the Americans
established the Commonwealth government. In Jordan,
Hugo Chavez was appointed as the Commonwealth Mayor
from 1936-1938. He was succeeded by Leodegario
Galarpe (1939-1941) who served until the invasion of the
Japanese in 1941.
Guimaras, being a wooded area during that time, was
made the sanctuary of people coming from Panay. In
Jordan, Cirilo Galotera served as Municipal Mayor for only
six months. The Japanese imposed a system of
government known as KALIBAPI or Neighborhood
Association headed by a Speaker.

xx
The Countryside in Figures: Guimaras, 2019 Edition
BRIEF HISTORY OF NUEVA VALENCIA MUNICIPALITY
The history of Nueva Valencia, just like that of other towns in the island of Guimaras, dates back to the time when Himal -us (Guimaras) was Christianized
by the Spaniards in 1591.
The towns were known as pueblicitos (villages) of Nayup (Buenavista with San Pedro Apostol as patron saint; Nabilhan (Jordan) with San Juan Bautista as
its patron saint; and Agang (Valencia) whose patroness was Santa Ana. Although during the Spanish regime there were separate powers between the church
and the state, yet the church had much influence in the creation of pueblos (towns) and establishment of parishes. It was also mentioned in the “History of
Panay” by Regalado and Franco, that in Panay, the towns included under the jurisdiction of Ogtong (Oton) were the three towns in the Island of Himal-us,
namely Nayup, Nabilhan and Agang. In 1742, the island fell under the jurisdiction of Dumangas until 1751 when the Jesuits took over from the Augustinian
Order. In 1768, the Dominicans had spiritual jurisdiction over Guimaras until 1775 when it was organized into a regular parish with Iloilo.
With the coming of the Spaniards, trade and commerce also flourished as Spain opened markets to foreign countries. There was a “galleon trade” between
Manila and Acapulco. Iloilo at that time was known as the “Fort of the Southern Archipelago.” Just like at present, the sea route from Manila to Panay passed the
western portion of Guimaras, through the Iloilo Strait and docked at Fort San Pedro. The Spaniards saw the need of a lighthouse to guide the incoming and
outgoing vessels especially during dark nights and when typhoon occurred. The suitable place for a lighthouse was in Himal-us (Guimaras).
The group, with some engineers, landed in Puyu which at that time, the landing point of vessels. They went on foot until they reached a place which is now
Sitio Guisi. Such place was ideal for a lighthouse since it could be seen far away from the sea. The Spaniards named the place as Punta Santa Ana in honor of the
patroness of typhoon. A lighthouse was constructed which operates until today.
The Spaniards had come to like the place of Santa Ana which extended from the
lighthouse to Sitio Puyu. Eventually, population increased and the Spanish authority
created Santa Ana as a town and named it Valencia after a town in Spain which
patroness was Santa Ana. The first appointed “alcalde mayor” was Don Manuel
Segovia. The municipal building called “Casa Real” was constructed and was located
adjacent to the site of now Nueva Valencia National High School. Later, the seat of the
municipal government was transferred to Barrio Igang when the Casa Real was razed
by fire due to an unknown cause. Igang then became the Poblacion and the whole
town was named Nueva Valencia or “New Valencia”. Valencia became a barrio named
Santa Ana.

xxi
The Countryside in Figures: Guimaras, 2019 Edition
BRIEF HISTORY OF SAN LORENZO MUNICIPALITY
San Lorenzo, officially the Municipality of San Lorenzo, is a 5th class municipality in the
province of Guimaras, Philippines. According to the 2015 census, it has a population of 26,112
people. San Lorenzo was created by virtue of Republic Act No. 7897 on February 20, 1995. It is
known for its wind farms.

xxii
The Countryside in Figures: Guimaras, 2019 Edition
BRIEF HISTORY OF SIBUNAG MUNICIPALITY
Sibunag is one of the two new municipalities created in the province of Guimaras through RA 7896. Such creation was validated with COMELEC
Resolution en banc after the plebiscite conducted during the May 1995 election.
Situated Southeast of Guimaras Island facing Negros and is separated from that island by Guimaras Strait. It is composed of fourteen (14) barangays
where the twelve (12) barangays were from the mother Municipality of Jordan and two (2) barangays were from Nueva Valencia. Sabang, San Isidro, Sebaste,
Alegria, and Bubog are the coastal barangays while Maabay, Dasal, Ayangan, Ravina, Millan, Tanglad, Oracon and Concordia are the inland barangays and
Inampulogan, which is an island barangay. It has a total population of 17,773 scattered among 14 barangays and a total land area approximately 147.40 square
kilometer occupying 21% of the total land area of the whole province.
Mythical Origin
Even before it was created as separate Local Government Unit, Sibunag is named after its main river, abounds with spellbinding folktales and legends.
The tragic story of Guima and Aras (popularized by Guimaras writer, Romeo G. Garganera) happened in the shores of Sibunag as the ill-fated lovers desperately
crossed the stormy sea to Baglas, now Negros, to escape the wrath of an angry father.
Legend also says that Sibunag, son of a deity and a mortal was stolen
when only a baby. He was cared for and raised by a fairy. His numerous and
amazing adventures and romance found niche in the hearts of folklore writers.
Sibunag river remains even today, not only the main source of gravel and
sand supply of the province but also an important waterway from the mainland
Guimaras to the island waters where the longest river in Guimaras could be
seen with its tributaries originate from the springs of the three mountains of
Dinalman, Bontoc and Tigbi, strategically located in Barangay Millan. By mouth
of Sibunag River are wide areas of fishponds. Along its shorelines to Alegria
and San Isidro are sources of bangus fry, bulgans, talakitok, mayamaya, kanlay,
crustaceans especially the kamuntaha, lobsters, prawns and seashells.

1
The Countryside in Figures: Guimaras, 2019 Edition
CHAPTER 1. GENERAL INFORMATION

2
The Countryside in Figures: Guimaras, 2019 Edition GENERAL INFORMATION
I. GEOGRAPHICAL LOCATION
Guimaras dubbed as the “Mango Country of the Philippines,” is one of the
six (6) provinces that comprise Western
Visayas, Region VI as also called. As an island province, it is located
southeast of Panay Island and northwest of Negros Island and bounded by Iloilo
Strait in the northwest, Guimaras strait in the northeast, and Panay Gulf in the
south. Guimaras is the smallest of the six (6) provinces of
Western Visayas both in terms of land area (604.57sq km) and population size
174,613 (as of 2015 Census).
The island is part of the Metro Iloilo-Guimaras, one of the twelve
metropolitan areas of the Philippines. The province consists primarily of
Guimaras Island, and also includes Inampulugan, Guiwanon (or Guiuanon), Pano-
bolon, Natunga, Nadulao, and many minor surrounding islands. Geologist have
concluded that the island once formed one landmass with Panay.
The province is composed of five municipalities, namely: Jordan, the pro-
vincial capital; Buenavista; Nueva Valencia; and the newly created
Sibunag and San Lorenzo. Guimaras occupies about 3% of the region's total land
area. Jordan which is the capital town comprises 21 percent or almost the same
area with that of Buenavista; while Nueva Valencia has the largest, 137 sq km or
23 percent, Sibunag has 20 percent and San Lorenzo gets the smallest, 93 sq km
or 15 percent of the province’s land area.
Moreover, Guimaras, is accessible by air and sea from Manila and other
destination via Iloilo City. From Iloilo Wharf, it can be reached by a 20- minute
motorboat or Roll-On-Roll-Off trip (RORO) facility from Lapuz, Iloilo City. Other
alternative routes to Guimaras are: via an hour trip of RORO from
Pulupandan, Negros Occidental to Sebaste Port in Sibunag, and of
pumpboats from Pulupandan and Valladolid, Negros Occidental to
Tumanda, Cabano in San Lorenzo.
Map of Guimaras

3
The Countryside in Figures: Guimaras, 2019 Edition GENERAL INFORMATION
II. TOPOGRAPHY AND SLOPE
A simplified topographic contour map indicates that the great part
of islands land area is above 100 masl. By comparing the topographic
features from the 1956 topographic maps with the present situation, it
could be concluded that the island topography has not been altered much
by man-made activities.
The island’s topography shows quite steep slopes on the western
side of island with plateaus and peaks above 200 m in the central portion.
A large part or 69% of the total land area is within the 0-18% slope,
19.73% is above 18-30% slope, 9.42% is above 30-50% slope and 1.74
percent is above 50% slope.
Slope Map of Guimaras
4
The Countryside in Figures: Guimaras, 2019 Edition GENERAL INFORMATION
II. TOPOGRAPHY AND SLOPE
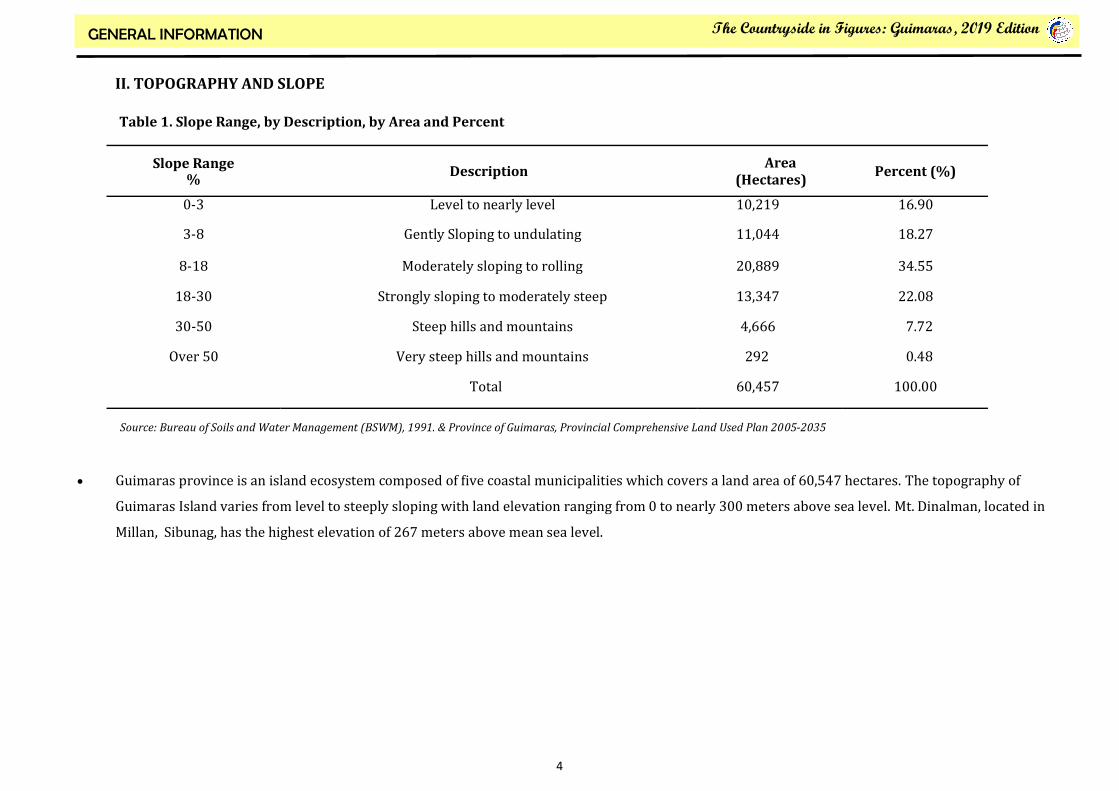
Guimaras province is an island ecosystem composed of five coastal municipalities which covers a land area of 60,547 hectares. The topography of
Guimaras Island varies from level to steeply sloping with land elevation ranging from 0 to nearly 300 meters above sea level. Mt. Dinalman, located in
Millan, Sibunag, has the highest elevation of 267 meters above mean sea level.
Source: Bureau of Soils and Water Management (BSWM), 1991. & Province of Guimaras, Provincial Comprehensive Land Used Plan 2005-2035
Table 1. Slope Range, by Description, by Area and Percent
Slope Range %
Description Area
(Hectares) Percent (%)
0-3 Level to nearly level 10,219 16.90
3-8 Gently Sloping to undulating 11,044 18.27
8-18 Moderately sloping to rolling 20,889 34.55
18-30 Strongly sloping to moderately steep 13,347 22.08
30-50 Steep hills and mountains 4,666 7.72
Over 50 Very steep hills and mountains 292 0.48
Total 60,457 100.00

5
The Countryside in Figures: Guimaras, 2019 Edition GENERAL INFORMATION
III. INCOME CLASSIFICATION
The municipalities are categorized into income classes as basis for taxation, determination of administrative and statutory aids,
financial grants and other forms of assistance to local governments.
The basis of the classification depends on the average annual income actually realized during the past four years preceding the
classification.
The Province of Guimaras and its municipalities in accordance with the latest reclassification of Department of Finance, Department
Order No. 23-08.
Based on the 2009 reclassification of the LGU’s income class by the Bureau of Local Government Finance (BLGF) of the Dept. of Finance (DOF), the
province is still classified as fourth class. In 2009, Buenavista was reclassified as a second class municipality, while Jordan and
Nueva Valencia as third class, and Sibunag as fourth. On the other hand, San Lorenzo remains fifth class based on the 1995
reclassification.
Municipality Income Class Number of Barangays Population
(2015 Census)
Guimaras 4th 98 174,613
Buenavista 2nd 36 50,437
Jordan (Capital ) 3rd 14 36,096
Nueva Valencia 3rd 22 39,810
SanLorenzo 5th 12 26,112
Sibunag 4th 14 22,158
Sources: Philippine Statistics Authority 2015 Census of Population and Housing
Table 2. Income Classification, Number of Barangays and Number of Population based on 2015 Census, by Municipality Province of
Guimaras

6
The Countryside in Figures: Guimaras, 2019 Edition GENERAL INFORMATION
IV. URBAN-RURAL BARANGAYS
In the Philippines, an area is considered urban if it falls under the following categories:
1. In their entirety, all municipal jurisdictions which, whether designated chartered cities, provincial capital or not, have a population density of at
least 1,000 persons per square kilometer: all barangays;
2. Poblaciones or central districts of municipalities and cities which have a population density of at least 500 per sons square kilometer;
3. Poblaciones or central districts not included in (1) and (2) regardless of the population size which have the following:
street pattern or network of streets in either parallel or right angel orientation;
at least six establishments (commercial, manufacturing, recreational and/or personal services);
at least three of the following:
a town hall, church or chapel with religious service at least once a month;
a public plaza, park or cemetery;
a market place, or building, where trading activities are carried on at least once a week;
a public building, like a school, hospital, puericulture and health center or library.
4. Barangays having at least 1,000 inhabitants which meet the conditions set forth in (3) above and where the occupation of the inhabitants is
predominantly non-farming or fishing.
In 2015, there were 98 barangays in Guimaras Province . Of this number, 26 or about 21.31 percent are classified as urban areas. The
remaining 72 barangays were considered rural areas. Jordan Municipality, the municipal capital, has 5 urban barangays, Buenavista has 7 urban
barangays, Nueva Valencia has 6 barangays which are considered urban , likewise, San Lorenzo and Sibunag has 4 urban barangays each.

7
The Countryside in Figures: Guimaras, 2019 Edition GENERAL INFORMATION
IV. URBAN-RURAL BARANGAYS
Table 3. Urban-Rural Classification of Barangays with Number of Population in the Municipality of Buenavista: 2015
Municipality Barangay Urban– rural Classification Total Population
Buenavista Agsanayan Rural 1,761
Avila Rural 2,398
Bacjao (Calumingan) Rural 707
Banban Rural 1,106
Cansilayan Rural 1,231
Dagsa-an Rural 1,149
Daragan Rural 1,473
East Valencia Rural 2,451
Getulio Rural 2,500
Mabini Rural 1,258
Magsaysay Rural 558
Mclain Urban 1,480
Montpiller Rural 850
Navalas Rural 1,342
Nazaret Rural 1,331
New Poblacion (Calingao) Urban 3,570
Old Poblacion Urban 1,234
Pin a Rural 1,932
Sources: Philippine Statistics Authority 2015 Census of Population and Housing

8
The Countryside in Figures: Guimaras, 2019 Edition GENERAL INFORMATION
IV. URBAN-RURAL BARANGAYS Table 3 — Concluded
Municipality Barangay Urban– rural Classification Total Population
Buenavista Rizal Urban 1,015
Salvacion Urban 3,685
San Fernando Rural 446
San Isidro Rural 1,346
San Miguel Rural 624
San Nicolas Rural 1,227
San Pedro Rural 723
San Roque Rural 1,671
Sto. Rosario Urban 2,571
Sawang Rural 339
Supang Rural 1,424
Tacay Rural 790
Taminla Rural 981
Tanag Rural 600
Tastasan Rural 1,354
Tinadtaran Rural 1,491
Umilig Rural 761
Zaldivar Rural 1,126
Sources: Philippine Statistics Authority 2015 Census of Population and Housing

9
The Countryside in Figures: Guimaras, 2019 Edition GENERAL INFORMATION
IV. URBAN-RURAL BARANGAYS
Table 4. Urban-Rural Classification of Barangays with Number of Population in the Municipality of Jordan: 2015
Municipality Barangay Urban– Rural Classification Total Population
Jordan Alaguisoc Urban 2,615
Balcon Maravilla Rural 1,644
Balcon Melliza Rural 1,424
Bugnay Rural 2,036
Buluangan Rural 812
Espinosa Rural 1,454
Hoskyn Urban 2,161
Lawi Rural 1,484
Morobuan Rural 2,587
Poblacion Rural 3,738
Rizal Urban 2,519
San Miguel Urban 6,771
Sinapsapan Rural 1,646
Sta Teresa Urban 5,208
Sources: Philippine Statistics Authority 2015 Census of Population and Housing

10
The Countryside in Figures: Guimaras, 2019 Edition GENERAL INFORMATION
IV. URBAN-RURAL BARANGAYS
Table 5. Urban-Rural Classification of Barangays with Number of Population in the Municipality of Nueva Valencia: 2015
Municipality Barangay Urban– Rural Classification Total Population
Nueva Valencia Cabalagnan Urban 1,849
Calaya Urban 3,172
Canhawan Rural 793
Concordia Sur Urban 2,455
Dolores Rural 1,946
Guiwanon Rural 1,745
Igang Urban 1,781
Igdarapdap Rural 859
La Paz Rural 1,921
Lanipe Rural 2,969
Lucmayan Rural 2,192
Magamay Rural 1,043
Napagdong Rural 1,534
Oracon Sur Rural 1,837
Pandaraonan Rural 1,346
Panobolon Rural 1,053
Poblacion Urban 3,493
Salvacion Urban 2,584
San Atonio Rural 1,649
San Roque Rural 1,731
Santo Domingo Rural 895
Tando Rural 963
Sources: Philippine Statistics Authority 2015 Census of Population and Housing

11
The Countryside in Figures: Guimaras, 2019 Edition GENERAL INFORMATION
IV. URBAN-RURAL BARANGAYS
Table 6. Urban-Rural Classification of Barangays with Number of Population in the Municipality of San Lorenzo: 2015
Municipality Barangay Urban– Rural Classification Total Population
San Lorenzo Aguilar Rural 1,868
Cabano Urban 4,917
Cabungahan Rural 1,341
Constancia Rural 3,416
Gaban Rural 2,253
Igcawayan Rural 1,246
M. Chavez Urban 2,803
San Enrique ( Lebas) Urban 2,051
Sapal Rural 1,547
Sebario Rural 1,603
Suclaran Urban 1,934
Tamburong Rural 1,133
Sources: Philippine Statistics Authority 2015 Census of Population and Housing

12
The Countryside in Figures: Guimaras, 2019 Edition GENERAL INFORMATION
IV. URBAN-RURAL BARANGAYS
Table 7. Urban-Rural Classification of Barangays with Number of Population in the Municipality of Sibunag: 2015
Municipality Barangay Urban– Rural Classification Total Population
Sibunag Alegria Urban 1,846
Ayangan Rural 1,654
Bubog Rural 738
Concordia Norte Urban 945
Dasal Urban 1,856
Inampologan Rural 215
Maabay Urban 2,394
Millan Rural 1,867
Oracon Norte Rural 1,065
Ravina Rural 2,034
Sabang Rural 2,047
San Isidro Rural 2,131
Sebaste Rural 2,362
Tanglad Rural 1,004
Sources: Philippine Statistics Authority 2015 Census of Population and Housing

13
The Countryside in Figures: Guimaras, 2019 Edition
CHAPTER 2. POPULATION & DEMOGRAPHY

14
The Countryside in Figures: Guimaras, 2019 Edition POPULATION AND DEMOGRAPHY
I. TOTAL POPULATION
Guimaras province has a total population of 174,613 persons as of 1 August 2015. The figure is 11,670 persons more than its total population in
2010 with 162,943 persons.
The increase in the total population count from 2010 to 2015 translated to an average annual population growth rate (PGR) of 1.33 percent, while
its population growth rate between the census years 2000 and 2010 was at 1.42 percent.
Census Year Census Reference Date Population
2000 1-May– 2000 141,450
2010 1-May– 2010 162,943
2015 1-August- 2015 174,613
Table 8. Guimaras Total Population : 2000-2015
Sources: Philippine Statistics Authority Censuses : 2000,2010 &2015
Reference Period Annual Population Growth Rate (in percent)
2010-2015 1.33
2000-2010 1.42
Table 9. Guimaras Annual Population Growth Rate : 2000-2015
Sources: Philippine Statistics Authority Censuses : 2000,2010 &2015

15
The Countryside in Figures: Guimaras, 2019 Edition POPULATION AND DEMOGRAPHY
I. TOTAL POPULATION
Among the five municipalities comprising the province of Guimaras, Buenavista was the most populous with a population size of 50,437 that
makes up 28.9 percent of the total provincial population.
The municipality of Nueva Valencia came in second with 39,810 contributing 22.8 percent share, followed by Jordan, the provincial capital, with
36,096 individuals accounted at 20.7 percent, and the municipality of San Lorenzo with 26,112 persons or 15.0 percent of Guimaras’ total
population.
The least populated municipality was Sibunag with 22,158 individuals chipping in 12.7 percent share to the total population of the province. It is
the fastest growing municipality in terms of population at 2.40 percent population growth rate in 2010-2015, while Jordan got the least
population growth rate of 0.70 percent.
Table 10. Total Population of Guimaras Province by Municipality, Annual Population Growth Rate: 2000, 2010, 2015
Municipality Total Population Annual Population Growth Rate ( in Percent)
1-May-2000 1– May –2010 1-August-2015 2000-2010 2010-2015
Buenavista 41,717 46,703 50,437 1.13 1.47
Jordan (Capital) 28,745 34,791 36,096 1.93 0.70
Nueva Valencia 30,716 37,852 39,810 1.62 0.97
San Lorenzo 20,168 24,032 26,112 1.77 1.59
Sibunag 20,104 19,565 22,158 1.68 2.40
Source: Philippine Statistics Authority, 2000, 2010, and 2015 Censuses
16
The Countryside in Figures: Guimaras, 2019 Edition POPULATION AND DEMOGRAPHY
II. HOUSEHOLD POPULATION
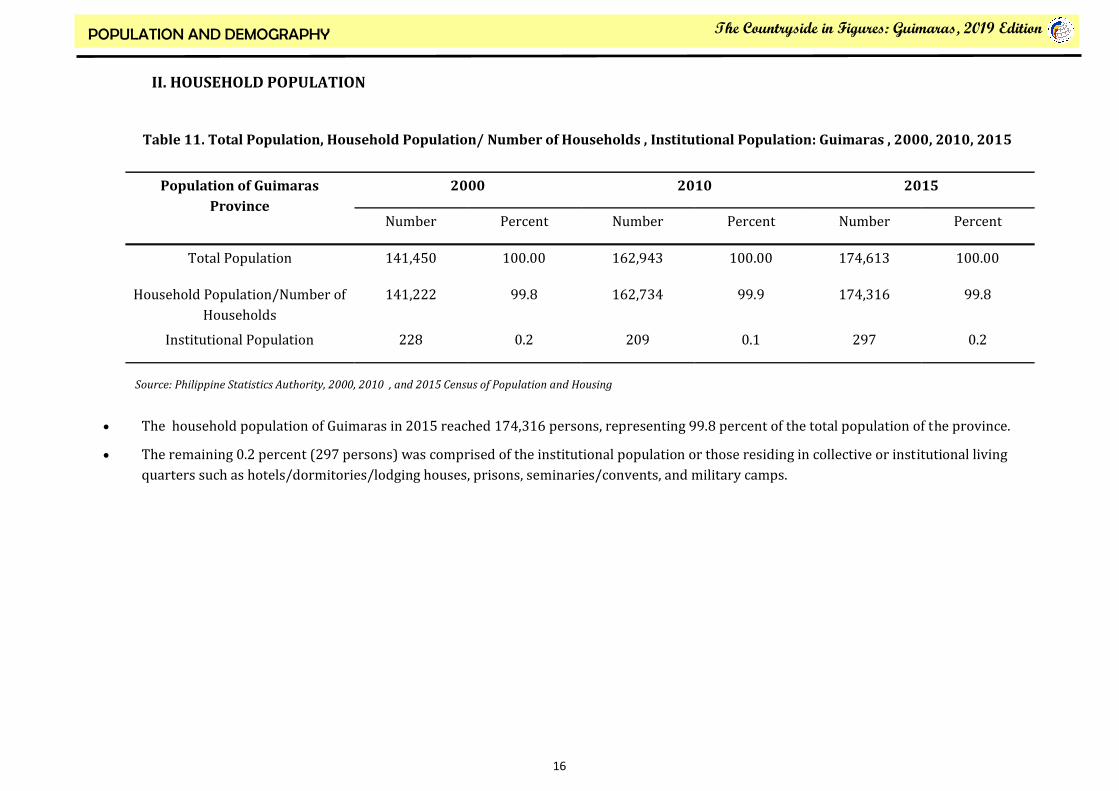
The household population of Guimaras in 2015 reached 174,316 persons, representing 99.8 percent of the total population of the province.
The remaining 0.2 percent (297 persons) was comprised of the institutional population or those residing in collective or institutional living
quarters such as hotels/dormitories/lodging houses, prisons, seminaries/convents, and military camps.
Table 11. Total Population, Household Population/ Number of Households , Institutional Population: Guimaras , 2000, 2010, 2015
Source: Philippine Statistics Authority, 2000, 2010 , and 2015 Census of Population and Housing
2000 2010 2015 Population of Guimaras
Province Number Percent Number Percent Number Percent
Total Population 141,450 100.00 162,943 100.00 174,613 100.00
Household Population/Number of
Households
141,222 99.8 162,734 99.9 174,316 99.8
Institutional Population 228 0.2 209 0.1 297 0.2

17
The Countryside in Figures: Guimaras, 2019 Edition POPULATION AND DEMOGRAPHY
II. HOUSEHOLD POPULATION
Guimaras’ total number of households
in 2015 was recorded at 40,575, higher by
5,113 households compared to 35,462 in
2010 and by 13, 110 compared to 27,465 in
2000.
Figure 3 also revealed that the
Average Household Size (AHS)
dropped to 4.3 in 2015 from 5.1 in
year 2010.
Table 12. Total Population, Number of Households and Average Household Size: Guimaras, 2000,2010 and 2015
Source: Philippine Statistics Authority, 2000 ,2010 , and 2015 Census of Population and Housing
Census Years Total Population Number of Households Average Household
size
2000 141,222 27,465 4.6
2010 162,734 35,462 5.1
2015 174,316 40,575 4.3
Source: Philippine Statistics Authority, 2000 ,2010 , and 2015 Census of Population and Housing
Figure 1. Household Population, Number of Households and Average Household Size: Guimaras, 2000, 2010 and 2015

18
The Countryside in Figures: Guimaras, 2019 Edition POPULATION AND DEMOGRAPHY
II. HOUSEHOLD POPULATION
Among the 5 municipalities, Buenavista registered the highest number of households in 2015 with 12,115, followed by Nueva Valencia and Jordan
with 9,173 and 8,311, respectively. The municipality of Sibunag posted the least number of households with 4,981.
The Province of Guimaras and its municipalities has an average household size (AHS) of 4 persons per household, lower than in 2000 census with
an average of 5 persons per household.
Source: Philippine Statistics Authority, 2000 ,2010 , and 2015 Census of Population and Housing
Municipality Household Population Average Household size Total Number of Households
2000 2010 2015 2000 2010 2015 2000 2010 2015
Guimaras 141,222 162,734 174,316 27,465 35,462 40,575 5.1 4.6 4.3
Buenavista 41,662 46,643 50,392 8,373 10,444 12,115 4.98 4.5 4.2
Jordan (Capital) 28,610 34,676 35,889 5,397
7,357 8,311 5.30 4.7 4.3
Nueva Valencia 30,716 37,822 39,776 6,043
8,176 9,173 5.08 4.6 4.3
San Lorenzo 20,156 24,032 26,104 3,809
5,211 5,995 5.29 4.6 4.4
Sibunag 20,078 19,561 22,155 3,843 4,274 4,981 5.22 4.6 4.4
Table 13. Household Population, Number of Households and Average Household Size by Municipality: Guimaras , 2000, 2010, 2015

19
The Countryside in Figures: Guimaras, 2019 Edition POPULATION AND DEMOGRAPHY
III. POPULATION DENSITY
Guimaras is sparsely populated; only about 288 persons on the average occupied per sq. km. of the land area in 2015. The population density in
2015 is 18 persons higher than the population density computed in 2010 and 54 persons higher compared with the figure in 2000.
In 2015, the municipality of Buenavista is quite densely populated with 393 persons/sq. km. followed by Nueva Valencia (290), Jordan (286), and
San Lorenzo (280). The municipality of Sibunag is the least densely populated with 184 persons per sq. km.
Source: Philippine Statistics Authority, 2000 ,2010 , and 2015 Census of Population and Housing,
Province/ Municipality
Total population Land Area
(square kilometres)
Population Density
(persons per square
kilometre)
2000 2010 2015 2000 2010 2015
Guimaras 141,450 162,943 174,613 611.87 234 270 288
Buenavista 41,717 46,703 50,437 115.6 325 364 393
Jordan (Capital) 28,745 34,791 36,096 126.11 228 276 286
Nueva Valencia 30,716 37,852 39,810 137.12 250 276 290
San Lorenzo 20,168 24,032 26,112 106.23 217 258 280
Sibunag 20,104 19,565 22,158 126.81 138 163 184
Table 14. Total Population, Land Area, Population Density, by Municipality: Guimaras , 2000-2015

20
The Countryside in Figures: Guimaras, 2019 Edition POPULATION AND DEMOGRAPHY
IV. SEX RATIO
Males accounted for 51.3 percent of the total population of Guimaras in 2015, while females comprised the remaining 48.7 percent. These figures
resulted in a sex ratio of 106 males for every 100 females. The same sex ratio was recorded in 2010.
MALES
106
PER FEMALES
100
Figure 2. Total Population in Percent by Gender: Guimaras 2015
Figure 3. Sex Ratio of Total Population by Gender: Guimaras 2015
Source: Philippine Statistics Authority, 2000 ,2010 , and 2015 Census
of Population and Housing
Source: Philippine Statistics Authority, 2000 ,2010 , and 2015 Census
of Population and Housing,

21
The Countryside in Figures: Guimaras, 2019 Edition POPULATION AND DEMOGRAPHY
IV. SEX RATIO
Table 15 shows that males outnumbered females in all five municipalities in Guimaras in all ages. Buenavista got the highest number of males with
25,635 men followed by the municipalities of Nueva Valencia with 20,507 men and Jordan with 18,462 men.
The lowest split was noticed in the municipalities of San Lorenzo and Sibunag with 13,550 and 11,490 men, respectively.
Province/Municipality Both Sexes Male Female
GUIMARAS 174,613 89,644 84,969
BUENAVISTA 50,437 25,635 24,802
JORDAN (CAPITAL) 36,096 18,462 17,634
NUEVA VALENCIA 39,810 20,507 19,303
SAN LORENZO 26,112 13,550 12,562
SIBUNAG 22,158 11,490 10,668
Source: Philippine Statistics Authority, 2015 Census of Population and Housing
Table 15. Total Population by Sex, and by Municipality : 2015

22
The Countryside in Figures: Guimaras, 2019 Edition POPULATION AND DEMOGRAPHY
IV. SEX RATIO
Table 16 shows that males outnumbered females in all five municipalities in Guimaras in all ages.
Buenavista got the highest male household population with 25,600 males followed by the municipalities of Nueva Valencia with 20,479 and Jordan
with 18,271 males. The lowest split was noticed in the municipalities of San Lorenzo and Sibunag with 13,542 and 11,487 males, respectively.
Province/ Municipality Both Sexes Male Female
GUIMARAS 174,316 89,379 84,937
BUENAVISTA 50,392 25,600 24,792
JORDAN (CAPITAL) 35,889 18,271 17,618
NUEVA VALENCIA 39,776 20,479 19,297
SAN LORENZO 26,104 13,542 12,562
SIBUNAG 22,155 11,487 10,668
Source: Philippine Statistics Authority, 2015 Census of Population and Housing
Table 16. Household Population by Sex, by Municipality Guimaras: 2015
23
The Countryside in Figures: Guimaras, 2019 Edition POPULATION AND DEMOGRAPHY
V. MEDIAN AGE
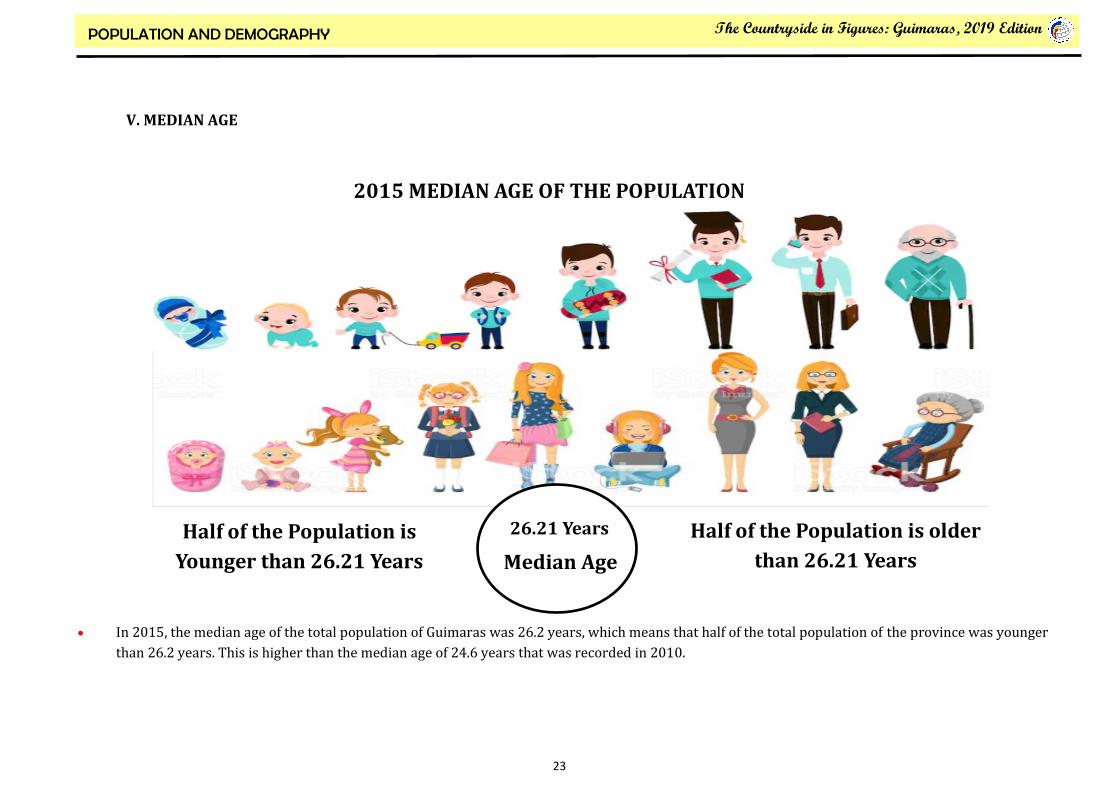
In 2015, the median age of the total population of Guimaras was 26.2 years, which means that half of the total population of the province was younger
than 26.2 years. This is higher than the median age of 24.6 years that was recorded in 2010.
Median Age
Half of the Population is older
than 26.21 Years
Half of the Population is
Younger than 26.21 Years
2015 MEDIAN AGE OF THE POPULATION
26.21 Years

24
The Countryside in Figures: Guimaras, 2019 Edition POPULATION AND DEMOGRAPHY
VI. AGE-SEX PYRAMID
The age-sex distribution of the population showed that 29.3 percent of the total population was under 15 years old. Children aged 0.4 years and 5 to 9
years (10.0 percent each) comprised the largest age groups, followed by those in the age groups 10 to 14 years and 15 to 19 years (9.4 percent each).
Males outnumbered females in the age groups 0 to 64 years. On the other hand, there were more females than males in the older age groups (65 years and
over).
80 years and over
75 - 79
70 - 74
65 - 69
60 - 64
55 - 59
50 - 54 45 - 49
40 - 44
35 - 39
30 - 34
25 - 29 20 - 24 15 - 19
10 - 14
5 - 9
1 - 4
Under 1
MALE FEMALE
AGE GROUP
Source: Philippine Statistics Authority, 2015 Census of Population and Housing
Figure 4. Age-Sex Population Pyramid, Guimaras: 2015

25
The Countryside in Figures: Guimaras, 2019 Edition POPULATION AND DEMOGRAPHY
VII. DEPENDENCY RATIO
Of the total population, 64.1 percent belonged to the working age population (15 to 64 years). Children below 15 years of age comprised 29.3 percent,
while older persons (65 years and over) accounted for 6.6 percent.
The overall dependency ratio was 56, which indicates that for every 100 working-age population, there were about 56 dependents (46 young dependents
and 10 old dependents). This ratio is lower than the dependency ratio in 2010, which was recorded at 60 dependents per 100 working– age population
(50) young dependents and 10 old dependents).
Source: Philippine Statistics Authority, 2015 Census of Population and Housing
Figure 5. Dependency Ratio 2010 &2015
26
The Countryside in Figures: Guimaras, 2019 Edition POPULATION AND DEMOGRAPHY
VIII. VOTING POPULATION
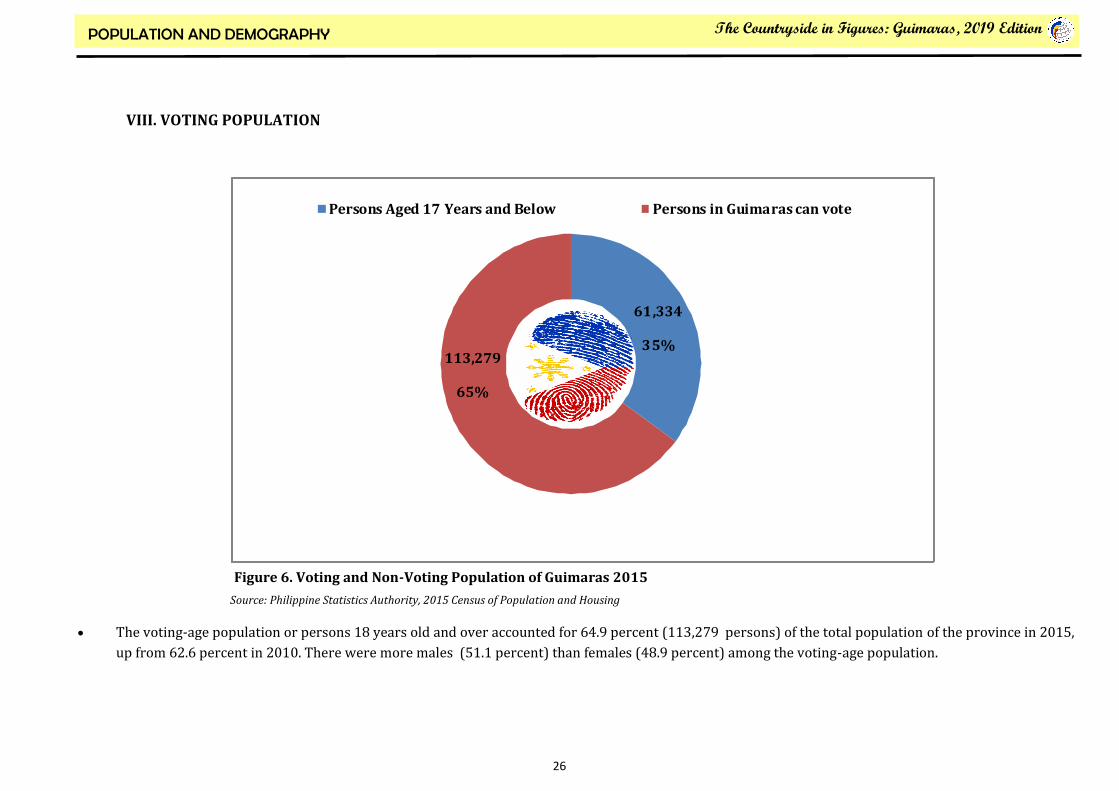
The voting-age population or persons 18 years old and over accounted for 64.9 percent (113,279 persons) of the total population of the province in 2015,
up from 62.6 percent in 2010. There were more males (51.1 percent) than females (48.9 percent) among the voting-age population.
Source: Philippine Statistics Authority, 2015 Census of Population and Housing
61,334
35% 113,279
65%
Persons Aged 17 Years and Below Persons in Guimaras can vote
Figure 6. Voting and Non-Voting Population of Guimaras 2015

27
The Countryside in Figures: Guimaras, 2019 Edition POPULATION AND DEMOGRAPHY
VIII. VOTING POPULATION
Out of 41, 789 registered voters in Guimaras province, only 70.03 percent or 29,264 actually voted in the 2018 elections.
The municipality of Buenavista has the highest number of registered voters recorded at 11, 758 and the municipality with the highest number
of voters who cast their votes in the 2018 elections with 8, 375 voters.
The municipality of San Lorenzo has the highest voters turnout at 72.78 percent.
Municipality Total No. of Registered Voters Total No. of Those Who
Actually Voted Voters Turnout (%)
Buenavista 11,758 8,375 71.23%
Jordan (Capital) 8,488 5,838 68.78%
Nueva Valencia 9,552 6,399 66.99%
San Lorenzo 6,511 4,739 72.78%
Sibunag 5,480 3913 71.41%
Total 41,789 29,264 70.03%
Table 17. SK Election Turnout by Municipality: May 14, 2018
Source: Commission on Elections-Guimaras

28
The Countryside in Figures: Guimaras, 2019 Edition POPULATION AND DEMOGRAPHY
VIII. VOTING POPULATION
There were 114, 042 voters who actually cast their votes among the 152, 801 registered voters in the May 2018 Barangay and SK Elections, translating to a 74.63 percent turnout in the 744 precincts over 98 barangays in the May 2018 Elections.
The municipality of San Lorenzo has the highest voters turnout at 78.42 percent on the last May 2018 Barangay and SK Elections, while
Buenavista has the least at 73.11 percent.
Municipality Total No. of
Barangays No. of Precinct
Total No. of Registered
Voters
Total No. of Registered Voters who
actually Voted
Voters
Turnout (%)
Male Female Total Male Female Total Total
Buenavista 36 226 21,840 22,428 44,268 15,942 16,424 32,366 73.11%
Jordan (Capital) 14 126 15,121 16,319 31,440 11,144 12,197 23,341 74.24%
Nueva Valencia 22 196 17,367 17,497 34,864 12,568 13,212 25,780 73.94%
San Lorenzo 12 112 11,629 11,345 22,947 9,167 8,829 17,996 78.42%
Sibunag 14 84 34,108 9,585 19,255 7,308 7,291 14,559 75.61%
Total 98 744 75,627 77,174 152,801 56,129 57,953 114,042 74.63%
Table 18. Number of Registered Voters, Actually Voted and Voters Turnout (SK & Barangay Election) by Sex by Municipality: May 14, 2018
Elections
Source: Commission on Elections-Guimaras

29
The Countryside in Figures: Guimaras, 2019 Edition POPULATION AND DEMOGRAPHY
VIII. VOTING POPULATION
Out of 111, 012 registered voters, 84, 818 actually voted in the 2018 barangay elections equivalent to a 76.94 percent voters turnout.
The municipality of Buenavista has the highest number of voters with 32, 510 registered voters.
Sibunag has the least number of voters at 10,686.
San Lorenzo recorded the highest voters turnout at 80.53 percent.
Buenavista posted the least voters turnout at 73.79 percent.
Municipality Total No. of Registered Voters Total No. of Those Who Actually
Voted Voters Turnout (%)
Buenavista 32,510 23,991 73.79 %
Jordan (Capital) 22,952 17,503 76.26 %
Nueva Valencia 25,312 19,381 76.57 %
San Lorenzo 16,463 13,257 80.53 %
Sibunag 13,775 10,686 77.57 %
Total 111,012 84,818 76.94 %
Table 19. Barangay Elections Turnout by Municipality: May 14, 2018 Elections
Source: Commission on Elections-Guimaras

30
The Countryside in Figures: Guimaras, 2019 Edition POPULATION AND DEMOGRAPHY
VIII. VOTING POPULATION
Figure 7. Comparative Number of Registered Voters and Registered Voters Who Actually Voted by Municipality: 2018
Total Number of Registered Voters Total Number of Registered Voters Who Actually Voted
44, 268
32, 366 31, 440
23, 341
34, 864
25, 780 22, 947
17, 996 19, 255
14, 559
Buenavista Sibunag San Lorenzo Nueva Valencia Jordan
Sources: Commission on Elections-Guimaras

31
The Countryside in Figures: Guimaras, 2019 Edition POPULATION AND DEMOGRAPHY
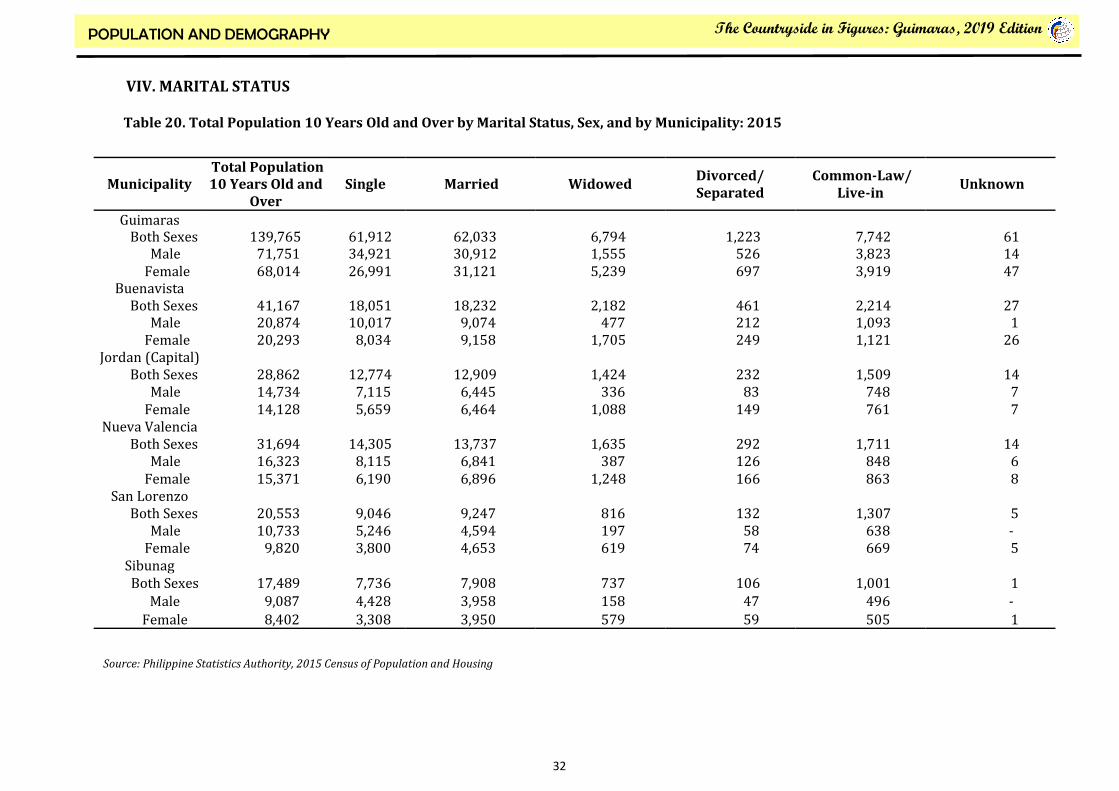
VIV. MARITAL STATUS
Of the 139,765 total population aged 10 years and over, 44.38 percent were married while 44.30 percent were never married. Single population comprised 44.30 percent of the regional total population. Among the never-married persons, 56.4 percent were male while 43.60 percent were female. In contrast, females outnumbered males in the rest of the categories. See table 20. Among the 5 municipalities, Buenavista recorded the highest number of never-married persons (29.16%), widowed (32.12%); common law/live-in (28.60%); and divorced/separated persons (37.69%).Sibunag municipality had the least share in all categories.
Source: Philippine Statistics Authority, 2015 Census of Population and Housing
Figure 8. Guimaras Marital Status :2015
32
The Countryside in Figures: Guimaras, 2019 Edition POPULATION AND DEMOGRAPHY
Municipality Total Population 10 Years Old and
Over Single Married Widowed
Divorced/Separated
Common-Law/ Live-in
Unknown
Guimaras Both Sexes 139,765 61,912 62,033 6,794 1,223 7,742 61
Male 71,751 34,921 30,912 1,555 526 3,823 14 Female 68,014 26,991 31,121 5,239 697 3,919 47 Buenavista
Both Sexes 41,167 18,051 18,232 2,182 461 2,214 27 Male 20,874 10,017 9,074 477 212 1,093 1
Female 20,293 8,034 9,158 1,705 249 1,121 26 Jordan (Capital) Both Sexes 28,862 12,774 12,909 1,424 232 1,509 14
Male 14,734 7,115 6,445 336 83 748 7 Female 14,128 5,659 6,464 1,088 149 761 7 Nueva Valencia Both Sexes 31,694 14,305 13,737 1,635 292 1,711 14
Male 16,323 8,115 6,841 387 126 848 6 Female 15,371 6,190 6,896 1,248 166 863 8 San Lorenzo
Both Sexes 20,553 9,046 9,247 816 132 1,307 5 Male 10,733 5,246 4,594 197 58 638 -
Female 9,820 3,800 4,653 619 74 669 5 Sibunag Both Sexes 17,489 7,736 7,908 737 106 1,001 1
Male 9,087 4,428 3,958 158 47 496 -
Female 8,402 3,308 3,950 579 59 505 1
Source: Philippine Statistics Authority, 2015 Census of Population and Housing
VIV. MARITAL STATUS
Table 20. Total Population 10 Years Old and Over by Marital Status, Sex, and by Municipality: 2015

33
The Countryside in Figures: Guimaras, 2019 Edition POPULATION AND DEMOGRAPHY
Source: Philippine Statistics Authority, 2015 Census of Population and Housing
XX. HIGHEST GRADE COMPLETED
Of the 157,219 total population aged five years and over, 33.3 percent had attended or completed elementary education, 37.5 percent had reached or
finished high school, 9.2 percent was college undergraduate, and 11.2 percent was baccalaureate/college graduate.
Among those with baccalaureate/college degree, females (55.2 percent) outnumbered the males (44.8 percent). Similarly, more females (66.8 percent)
than males (33.2 percent) pursued post baccalaureate courses.
Figure 9. Population Aged 5 Years Old and Over by Highest Grade/Year Completed: 2015 Guimaras

34
The Countryside in Figures: Guimaras, 2019 Edition POPULATION AND DEMOGRAPHY
Source: Philippine Statistics Authority, 2015 Census of Population and Housing
XX. HIGHEST GRADE COMPLETED
Table 21. Population Aged 5 Years Old and Over by Highest Grade/Year Completed, by Sex: 2015 Guimaras
Highest Grade/Year Completed, Both Sexes Male Female
Total 157,219 80,684 76,535
No Grade Completed 2,983 1,547 1,436
Pre-School 4,529 2,294 2,235
Special Education 28 14 14
Elementary 52,361 28,736 23,625
1st - 4th Grade 25,153 14,192 10,961
5th - 6th Grade 9,584 5,319 4,265
Graduate 17,624 9,225 8,399
High School 58,901 30,666 28,235
Undergraduate 23,182 13,165 10,017
Graduate 35,719 17,501 18,218
Post-Secondary 6,075 2,928 3,147
Undergraduate 138 69 69
Graduate 5,937 2,859 3,078
College Undergraduate 14,510 6,536 7,974
Academic Degree Holder 17,620 7,894 9,726
Post Baccalaureate 187 62 125
Not Stated 25 7 18

35
The Countryside in Figures: Guimaras, 2019 Edition POPULATION AND DEMOGRAPHY
XI. SCHOOL ATTENDANCE
Of the 66,257 household population aged 5 to 24 years old, 69.6 percent attended school during School Year (SY) 2015-2016, higher than
the school attendance rate of 67.5 percent in SY 2009-2010. By sex, the school attendance rate in 2015 was higher among females (70.6
percent) than among males (68.7 percent). The same trend was observed in 2010.
69.6 % School Attendance Rate
66,257 Household Population
5 to 24 Years Old
46,115 Household Population 5 to 24 Years Old Who Were Currently Attending School

36
The Countryside in Figures: Guimaras, 2019 Edition POPULATION AND DEMOGRAPHY
XI. SCHOOL ATTENDANCE
Table 22. Household Population 5 to 24 Years Old Who were Currently Attending School by Age Group, Sex, and Municipality: 2015
Age Group/Municipality
Household Population 5 to 24 Years Old
Household Population 5 to 24 Years Old Who Were Currently Attending School
Both Sexes Male Female Both Sexes Male Female
GUIMARAS
Total 66,257 34,199 32,058 46,115 23,492 22,623
5 - 9 17,452 8,931 8,521 17,029 8,709 8,320
10 - 14 16,374 8,496 7,878 15,900 8,185 7,715
15 - 19 16,471 8,614 7,857 10,839 5,396 5,443
20 - 24 15,960 8,158 7,802 2,347 1,202 1,145
BUENAVISTA
Total 18,188 9,370 8,818 12,953 6,584 6,369
5 - 9 4,755 2,438 2,317 4,649 2,386 2,263
10 - 14 4,465 2,295 2,170 4,347 2,221 2,126
15 - 19 4,500 2,332 2,168 3,228 1,599 1,629
20 - 24 4,468 2,305 2,163 729 378 351
JORDAN (CAPITAL)
Total 13,717 7,032 6,685 9,551 4,891 4,660
5 - 9 3,475 1,784 1,691 3,397 1,744 1,653
10 - 14 3,365 1,758 1,607 3,267 1,692 1,575
15 - 19 3,548 1,851 1,697 2,360 1,184 1,176
20 - 24 3,329 1,639 1,690 527 271 256
Source: Philippine Statistics Authority, 2015 Census of Population and Housing

37
The Countryside in Figures: Guimaras, 2019 Edition POPULATION AND DEMOGRAPHY
XI. SCHOOL ATTENDANCE
Table 22. (Continued)
Age Group/ Municipality
Household Population 5 to 24 Years Old
Household Population 5 to 24 Years Old Who Were Currently Attending School
Both Sexes Male Female Both Sexes Male Female
NUEVA VALENCIA Total 15,409 7,954 7,455 10,741 5,469 5,272 5 - 9 4,146 2,123 2,023 4,066 2,076 1,990
10 - 14 3,918 2,014 1,904 3,804 1,939 1,865 15 - 19 3,718 1,968 1,750 2,359 1,209 1,150 20 - 24 3,627 1,849 1,778 512 245 267
SAN LORENZO Total 10,236 5,321 4,915 7,020 3,560 3,460 5 - 9 2,769 1,393 1,376 2,702 1,366 1,336
10 - 14 2,558 1,341 1,217 2,461 1,274 1,187 15 - 19 2,536 1,322 1,214 1,532 748 784 20 - 24 2,373 1,265 1,108 325 172 153
SIBUNAG Total 8,707 4,522 4,185 5,850 2,988 2,862 5 - 9 2,307 1,193 1,114 2,215 1,137 1,078
10 - 14 2,068 1,088 980 2,021 1,059 962 15 - 19 2,169 1,141 1,028 1,360 656 704 20 - 24 2,163 1,100 1,063 254 136 118
Source: Philippine Statistics Authority, 2015 Census of Population and Housing

38
The Countryside in Figures: Guimaras, 2019 Edition POPULATION AND DEMOGRAPHY
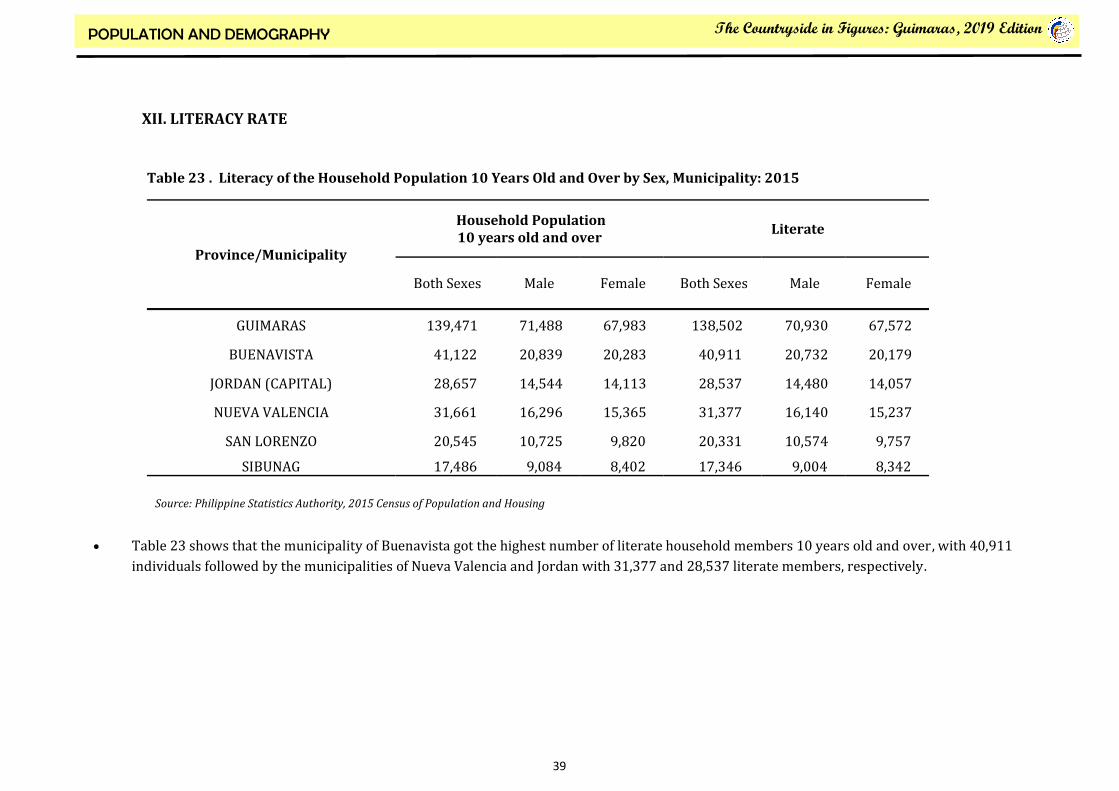
XII. LITERACY RATE
A person is considered literate if he/she is able to read and write a simple message in any language or dialect.
Almost 99.3 percent among the 139,471 household population aged 10 years and over of Guimaras province were literate. This is higher than the
97.8 percent literacy rate recorded in 2010.
Literacy rate in 2015 was slightly higher among females (99.4 percent) than among males (99.2 percent). The same trend was observed in 2010.
2015
SIMPLE LITERACY
RATE
99.3%
39
The Countryside in Figures: Guimaras, 2019 Edition POPULATION AND DEMOGRAPHY
XII. LITERACY RATE
Table 23 shows that the municipality of Buenavista got the highest number of literate household members 10 years old and over, with 40,911
individuals followed by the municipalities of Nueva Valencia and Jordan with 31,377 and 28,537 literate members, respectively.
Table 23 . Literacy of the Household Population 10 Years Old and Over by Sex, Municipality: 2015
Province/Municipality
Household Population 10 years old and over
Literate
Both Sexes Male Female Both Sexes Male Female
GUIMARAS 139,471 71,488 67,983 138,502 70,930 67,572
BUENAVISTA 41,122 20,839 20,283 40,911 20,732 20,179
JORDAN (CAPITAL) 28,657 14,544 14,113 28,537 14,480 14,057
NUEVA VALENCIA 31,661 16,296 15,365 31,377 16,140 15,237
SAN LORENZO 20,545 10,725 9,820 20,331 10,574 9,757
SIBUNAG 17,486 9,084 8,402 17,346 9,004 8,342
Source: Philippine Statistics Authority, 2015 Census of Population and Housing

40
The Countryside in Figures: Guimaras, 2019 Edition POPULATION AND DEMOGRAPHY
XIII. RELIGIOUS AFFILIATION
More than three fifths (76.5 percent or 133,656 persons) of the total population of the province in 2015 reported Roman Catholic as
their religious affiliation. The corresponding figure in 2010 was 76.1 percent (or 123,956 persons).
The next largest religious affiliation in the province was the Aglipay, comprising 14.1 percent of the total population. It was
followed by those who were affiliated with the Association of Fundamental Baptist Churches in the Philippines, with 1.6 percent
share.
76.5 % Roman Catholic
14.1 % Aglipay 1.6 %
Association of Fundamental Baptist Churches in the Philippines

41
The Countryside in Figures: Guimaras, 2019 Edition POPULATION AND DEMOGRAPHY
XIII. RELIGIOUS AFFILIATION
Religious Affiliation Both Sexes Male Female
GUIMARAS Total 174,613 89,644 84,969
Aglipay 24,536 12,674 11,862
Association of Baptist Churches in Luzon, Visayas, and Mindanao 2 0 2
Association of Fundamental Baptist Churches in the Philippines 2,879 1,367 1,512
Bible Baptist Church 791 379 412
Bread of Life Ministries 17 4 13
Buddhist 4 2 2
Cathedral of Praise , Incorporated 10 5 5
Church of Christ 32 16 16
Church of Jesus Christ of the Latter Day Saints 261 130 131
Convention of the Philippine Baptist Church 105 53 52
Crusaders of the Divine Church of Christ , Incorporated 11 7 4
Door of Faith 119 50 69
Evangelical Christian Outreach Foundation 3 2 1
Evangelicals (Philippine Council of Evangelical Churches) 2,591 1,279 1,312
Faith Tabernacle Church (Living Rock Ministries) 53 30 23
Iglesia ni Cristo 1,480 762 718
Iglesia sa Dios Espiritu Santo , Incorporated 1 0 1
Table 24. Total Population by Religious Affiliation and Sex: Guimaras2015
Source: Philippine Statistics Authority, 2015 Census of Population and Housing

42
The Countryside in Figures: Guimaras, 2019 Edition POPULATION AND DEMOGRAPHY
XIII. RELIGIOUS AFFILIATION
Religious Affiliation Both Sexes Male Female
Islam 87 42 45
Jehovah’s Witness 861 426 435
Jesus is Lord Church 52 26 26 Miracle Revival Church of the Philippines 52 27 25 National Council of Churches in the Philippines 703 392 311 Philippine Ecumenical Christian Church 2 1 1 Philippine Grace Gospel 7 4 3 Philippine Independent Catholic Church 1 0 1
Roman Catholic, including Catholic Charismatic 133,656 68,886 64,770 Seventh Day Adventist 1,751 858 893
Things to Come 1 0 1
United Church of Christ in the Philippines 89 44 45
United Pentecostal Church (Philippines) , Incorporated 59 32 27 Victory Chapel Christian Fellowship 24 13 11
Other Baptists 3,721 1,808 1,913
Other Protestants 496 241 255 Other Religious Affiliations 85 42 43
Tribal Religions 52 28 24
None 16 12 4
Not Reported 3 2 1
Table 24. (Continued)
Source: Philippine Statistics Authority, 2015 Census of Population and Housing

43
The Countryside in Figures: Guimaras, 2019 Edition POPULATION AND DEMOGRAPHY
XIV. MAJOR OCCUPATION
In 2015, the province had 123,097 household population aged 15 years and over. Of this total, three in every five persons (61.1 percent) were
engaged in gainful activity during the 12 months preceding the census. Males with a gainful activity during the last 12 months reference period
comprised 68.2 percent, while females accounted for the remaining 31.8 percent.
By major occupation group, workers engaged in elementary occupations comprised the largest group (26.8 percent of all persons with gainful
activity). Skilled agricultural, forestry, and fishery workers came in next (20.8 percent), followed by service and sales workers (14.0 percent).
H O U S E H O L D P O P U L A T I O N 15 YEARS OVER 75,214
WERE ENGAGED IN GAINFUL ACTIVTY
TOP 3
M A J O R OCCUPATIONS
Elementary Occupations (26.8%)
Skilled agricultural, forestry, and fishery workers
Sales workers
(20.8%)
( 14.0%)

44
The Countryside in Figures: Guimaras, 2019 Edition POPULATION AND DEMOGRAPHY
XIV. MAJOR OCCUPATION
Source: Philippine Statistics Authority, 2015 Census of Population and Housing
Table 25. Gainful Workers 15 Years Old and Over by Major Occupation Group, Sex, Guimaras: 2015
Sex, Major Occupation and Group Both Sexes Male Female
Both Sexes 75,214 51,328 23,886
Managers 3,784 1,578 2,206
Professionals 3,536 864 2,672
Technicians and Associate Professionals 2,573 1,454 1,119
Clerical Support Workers 3,134 979 2,155
Service and Sales Workers 10,567 4,804 5,763
Skilled Agricultural Forestry and Fishery Workers 15,670 14,323 1,347
Craft and Related Trades Workers 6,727 6,032 695
Plant and Machine Operators and Assemblers 8,900 8,781 119
Elementary Occupations 20,193 12,415 7,778
Armed Forces Occupations 84 81 3
Other Occupation Not Elsewhere Classified - - -
Not Reported 46 17 29

45
The Countryside in Figures: Guimaras, 2019 Edition POPULATION AND DEMOGRAPHY
XV. OVERSEAS WORKERS
Of the 123,097 household population 15 years old and over, 6,802 persons or 5.5 percent were overseas workers. Male overseas workers outnumbered
their female counterparts as they comprised 52.0 percent of all the overseas workers from this province. Overseas workers aged 25 to 29 years made
up the largest age group, comprising 21.8 percent of the total overseas workers, followed by those in the age groups 30 to 34 years (21.0 percent), 45
years and over (18.0 percent), and 35 to 39 years (17.3 percent).
Source: Philippine Statistics Authority, 2015 Census of Population and Housing
79 634
1,483
1,431
1,180
769
1,226
Below 20
20 - 24
25 - 29
30 - 34
35 - 39
40 - 44
45 and over
OVERSEAS
WORKERS
15 YEARS
AND OVER
6,802
Figure 10. Guimaras Total Overseas Workers by Age Group: 2015

46
The Countryside in Figures: Guimaras, 2019 Edition POPULATION AND DEMOGRAPHY
XV. OVERSEAS WORKERS
Source: Philippine Statistics Authority, 2015 Census of Population and Housing
Table 26. Overseas Workers 15 Years Old and Over by Highest Grade/Year Completed, by Sex: Guimaras 2015
Highest Grade/Year Completed and Sex Total Overseas Workers
Both Sexes Male Female
Both Sexes 6,802 3,537 3,265
No Grade Completed 2 1 1
Pre-School - - -
Special Education - - -
Elementary 121 48 73
1st - 4th Grade 38 20 18
5th - 6th Grade 15 5 10
Graduate 68 23 45
High School 1,744 530 1,214
Undergraduate 204 82 122
Graduate 1,540 448 1,092
Post-Secondary 752 333 419
Undergraduate 5 2 3
Graduate 747 331 416
College Undergraduate 822 234 588
Academic Degree Holder 3,358 2,390 968
Post Baccalaureate 3 1 2
Not Stated - - -

47
The Countryside in Figures: Guimaras, 2019 Edition
CHAPTER 3. POVERTY AND INCOME

48
The Countryside in Figures: Guimaras, 2019 Edition POVERTY AND INCOME
Poverty incidence among Guimarasnon in 2018 was estimated at 9.3 percent, higher than its 2015 level recorded at 5.2 percent. On the other
hand, subsistence incidence among Guimaras population, or the proportion of Guimaras population whose incomes fall below the food threshold, was
estimated at 0.9 percent in 2018, higher than its 2015 level at 0.0 percent. Subsistence incidence among Guimaras population is often
referred to as the proportion of the population in extreme or subsistence poverty.
Food threshold is the minimum income required to meet the basic food needs and satisfy the nutritional requirements set by the Food and
Nutrition Research Institute (FNRI) to ensure that one remains economically and socially productive. It is used to measure extreme or subsistence
poverty. Poverty threshold is a similar concept, expanded to include basic non-food needs such as clothing, housing, transportation, health, and
education expenses.
In 2018, a family of five needed at least PhP7,814.17, on average, every month to meet the family’s basic food needs and at least
PhP10,772.92, on average, every month to meet both basic food and non-food needs. These amounts represent the monthly food threshold and monthly
poverty threshold, respectively.
PSA also releases statistics on poverty among families in which it serves as a crucial social indicator that guides policy makers in their efforts to
alleviate poverty. Likewise, the income gap measures the average income required by the poor in order to get out of poverty, expressed relative to the
poverty threshold. The poverty gap refers to the income shortfall (expressed in proportion to the poverty threshold) of families with income below the
poverty threshold, divided by the total number of families. The severity of poverty is the total of the squared income shortfall (expressed in proportion
to the poverty threshold) of families with income below the poverty threshold, divided by the total number of families. This is a poverty measure that is
sensitive to income distribution among the poor.
In 2018 on average an additional monthly income of PhP1,053.33, than the monthly income in 2015, is needed by a poor family with five
members in order to move out of poverty.

49
The Countryside in Figures: Guimaras, 2019 Edition POVERTY AND INCOME
The annual per capita poverty threshold in Guimaras increased from PhP23,327 in 2015 to PhP25,855 in 2018. This means that an individual needs PhP2,528 more in 2018 than in 2015 to meet basic food and non-food needs.
Annual per capita poverty threshold showed an increasing trend in three periods 2012, 2015, and 2018.
Poverty incidence among families increased from 4.8 percent in 2015 to 6.6 percent in 2018.
Similarly, magnitude of poor families also increased from 1.6 thousand in 2015 to 2.9 thousand in 2018, translating to almost 1.3 thousand families considered as poor.
Persons with incomes above the poverty thresholds are considered non-poor, which means that individuals in Guimaras with incomes above PhP25,855 can provide his/her basic food and non-food needs.
Poverty incidence among population increased from 5.2 percent in 2015 to 9.3 percent in 2018; that is, more individuals in the province are considered poor in 2018 than in 2015.
Likewise, magnitude of poor population also increased from 8.2 thousand in 2015 to 16.8 thousand in 2018.
Source: Full Year 2018 Official Poverty Statistics of the Philippines
Table 27. Annual Per Capita Poverty Threshold, Poverty Incidence, and Magnitude of Poor Families, Guimaras: 2012,
2015 & 2018
Table 28. Annual Per Capita Poverty Threshold, Poverty Incidence, and Magnitude of Poor Population, Guimaras:
2012, 2015 & 2018
Source: Full Year 2018 Official Poverty Statistics of the Philippines
Indicator 2012 2015 2018
Annual Per Capita Poverty Threshold (in PhP) 18,926 23,327 25,855
Poverty Incidence among Families (%) 16.9 4.8 6.6
Magnitude of Poor Families (in thousands) 6.3 1.6 2.9
Indicator 2012 2015 2018
Annual Per Capita Poverty Threshold (in PhP) 18,926 23,327 25,855
Poverty Incidence among Population (%) 25.2 5.2 9.3
Magnitude of Poor Population (in thousands) 40.0 8.2 16.8
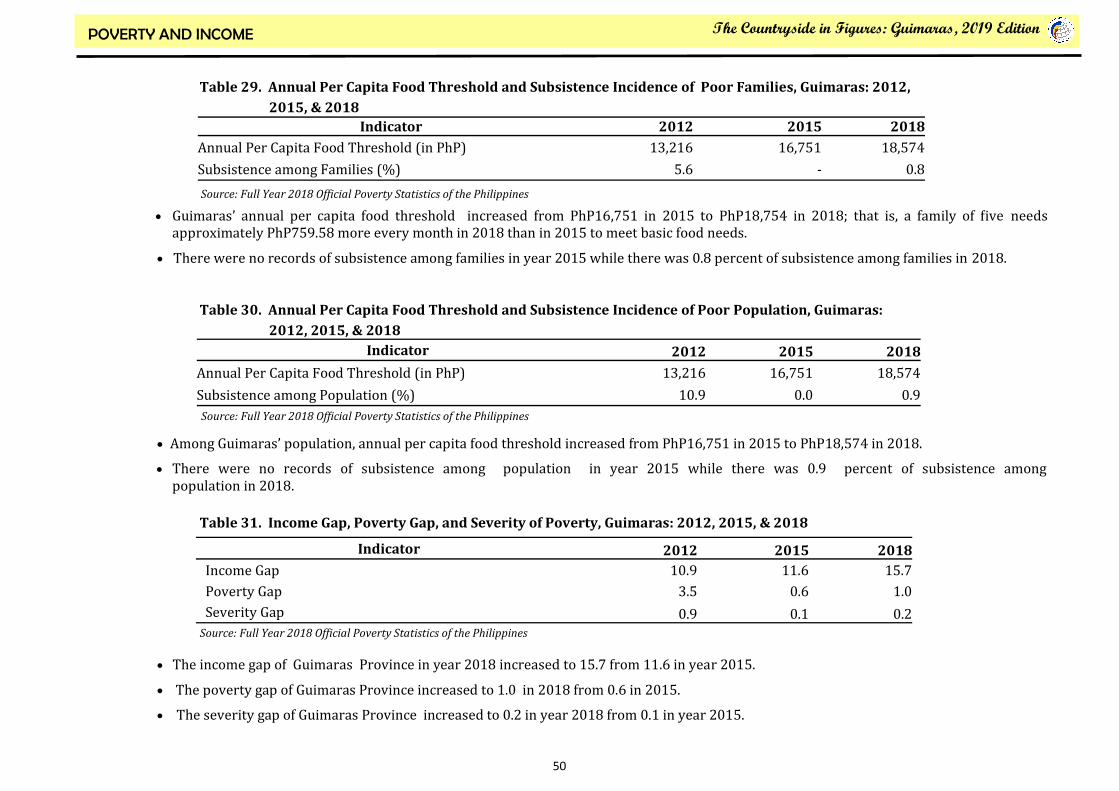
50
The Countryside in Figures: Guimaras, 2019 Edition POVERTY AND INCOME
Guimaras’ annual per capita food threshold increased from PhP16,751 in 2015 to PhP18,754 in 2018; that is, a family of five needs approximately PhP759.58 more every month in 2018 than in 2015 to meet basic food needs.
There were no records of subsistence among families in year 2015 while there was 0.8 percent of subsistence among families in 2018.
Among Guimaras’ population, annual per capita food threshold increased from PhP16,751 in 2015 to PhP18,574 in 2018.
There were no records of subsistence among population in year 2015 while there was 0.9 percent of subsistence among population in 2018.
Table 29. Annual Per Capita Food Threshold and Subsistence Incidence of Poor Families, Guimaras: 2012,
2015, & 2018
Source: Full Year 2018 Official Poverty Statistics of the Philippines
Table 30. Annual Per Capita Food Threshold and Subsistence Incidence of Poor Population, Guimaras:
2012, 2015, & 2018
Source: Full Year 2018 Official Poverty Statistics of the Philippines
Table 31. Income Gap, Poverty Gap, and Severity of Poverty, Guimaras: 2012, 2015, & 2018
Source: Full Year 2018 Official Poverty Statistics of the Philippines
The income gap of Guimaras Province in year 2018 increased to 15.7 from 11.6 in year 2015.
The poverty gap of Guimaras Province increased to 1.0 in 2018 from 0.6 in 2015.
The severity gap of Guimaras Province increased to 0.2 in year 2018 from 0.1 in year 2015.
Indicator 2012 2015 2018
Annual Per Capita Food Threshold (in PhP) 13,216 16,751 18,574
Subsistence among Families (%) 5.6 - 0.8
Indicator 2012 2015 2018
Annual Per Capita Food Threshold (in PhP) 13,216 16,751 18,574
Subsistence among Population (%) 10.9 0.0 0.9
Indicator 2012 2015 2018
Income Gap 10.9 11.6 15.7
Poverty Gap 3.5 0.6 1.0
Severity Gap 0.9 0.1 0.2
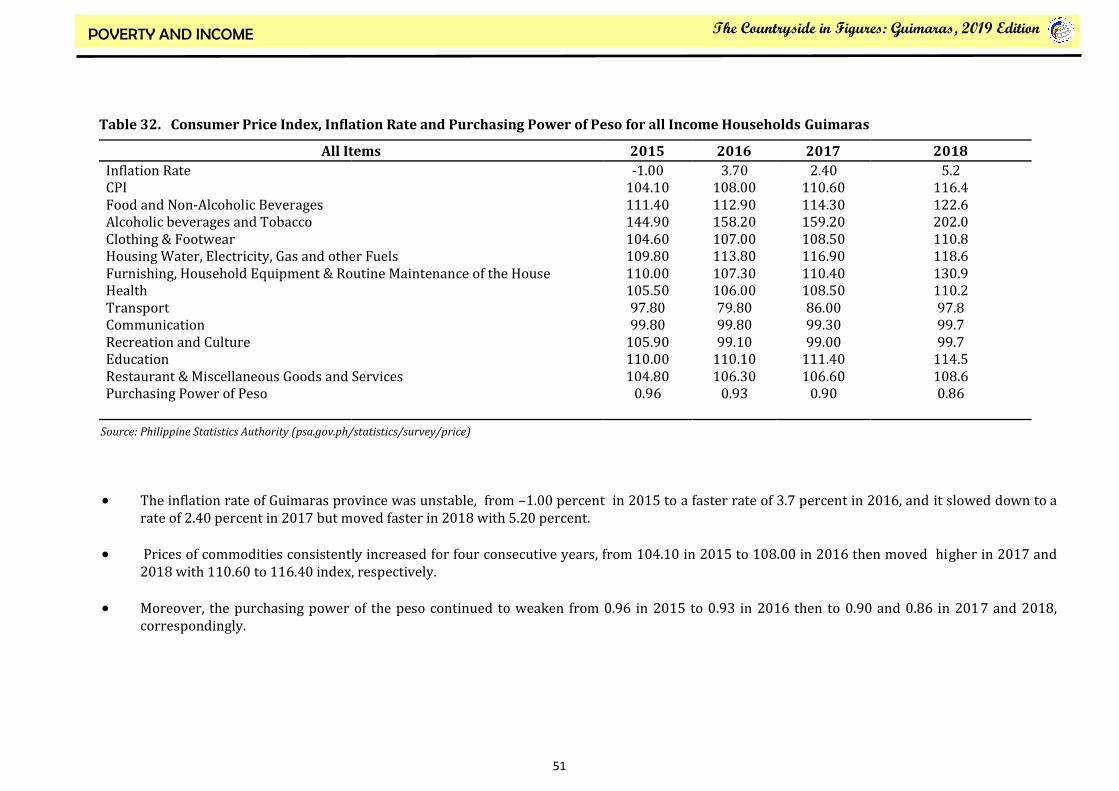
51
The Countryside in Figures: Guimaras, 2019 Edition POVERTY AND INCOME
The inflation rate of Guimaras province was unstable, from –1.00 percent in 2015 to a faster rate of 3.7 percent in 2016, and it slowed down to a
rate of 2.40 percent in 2017 but moved faster in 2018 with 5.20 percent.
Prices of commodities consistently increased for four consecutive years, from 104.10 in 2015 to 108.00 in 2016 then moved higher in 2017 and 2018 with 110.60 to 116.40 index, respectively.
Moreover, the purchasing power of the peso continued to weaken from 0.96 in 2015 to 0.93 in 2016 then to 0.90 and 0.86 in 2017 and 2018, correspondingly.
All Items 2015 2016 2017 2018
Inflation Rate CPI Food and Non-Alcoholic Beverages Alcoholic beverages and Tobacco Clothing & Footwear Housing Water, Electricity, Gas and other Fuels Furnishing, Household Equipment & Routine Maintenance of the House Health Transport Communication Recreation and Culture Education Restaurant & Miscellaneous Goods and Services Purchasing Power of Peso
-1.00 104.10 111.40 144.90 104.60 109.80 110.00 105.50 97.80 99.80 105.90 110.00 104.80 0.96
3.70 108.00 112.90 158.20 107.00 113.80 107.30 106.00 79.80 99.80 99.10 110.10 106.30 0.93
2.40 110.60 114.30 159.20 108.50 116.90 110.40 108.50 86.00 99.30 99.00 111.40 106.60 0.90
5.2 116.4 122.6 202.0 110.8 118.6 130.9 110.2 97.8 99.7 99.7 114.5 108.6 0.86
Source: Philippine Statistics Authority (psa.gov.ph/statistics/survey/price)
Table 32. Consumer Price Index, Inflation Rate and Purchasing Power of Peso for all Income Households Guimaras

52
The Countryside in Figures: Guimaras, 2019 Edition
CHAPTER 4. GOVERNANCE, PUBLIC ORDER
& SAFETY

53
The Countryside in Figures: Guimaras, 2019 Edition GOVERNANCE , PUBLIC ORDER &SAFETY
I. POLITY
As provided in the Republic Act 7160, otherwise known as the Local Government Code of 1991, the Provincial Government of Guimaras is run by a
Provincial Governor, a Vice Governor, eight (8) members of the Sangguniang Panlalawigan who are elected for a term of three years, and three (3) ex-officio
members of the Sanggunian. They cannot serve the province for more than three (3) consecutive terms in the same position.
The eight (8) regular members of the Sangguniang Panlalawigan are elected per district, four (4) members each in the two districts of the province.
There is one (1) congressman who is also elected and represents the province in the national lawmaking body.
On the other hand, the Municipal Government is run by a Mayor, a Vice Mayor and eight (8) members of the Sangguniang Bayan who can serve for a
term of three (3) years, and an ex-officio member. The municipal government officials cannot hold the same position for more than three (3) consecutive
terms.
In accordance to the pertinent sections of the Rules and Regulations Implementing R.A. No. 8371 or Indigenous Peoples’ Rights Act of 1997 (IPRA Law),
which calls for the mandatory representation of IPs in legislative councils, the Provincial Government has ensured that the provisions of the said law is fully
observed.

54
The Countryside in Figures: Guimaras, 2019 Edition GOVERNANCE , PUBLIC ORDER &SAFETY
Table 33. Congressional and Provincial Government Officials: Province of Guimaras, 2019
Name Year Elected/ Appointed Position Designation Province/ Municipality
Ma. Lucile L. Nava 2019 Congresswoman Guimaras
Samuel T. Gumarin 2019 Governor
John Edward G. Gando 2019 Vice Governor
Cyril C. Beltran 2019 District I Sangguniang Panlalawigan
Member
Aurelio G. Tionado 2019 District I Sangguniang Panlalawigan
Member
Rex G. Fernandez 2019 District I Sangguniang Panlalawigan
Member
Raymond H. Gavilen o 2019 District I Sangguniang Panlalawigan
Member
David G. Gano 2019 District II Sangguniang Panlalawigan
Member
Luben G. Vilches 2019 District II Sangguniang Panlalawigan
Member
Diosdado G. Gonzaga 2019 District II Sangguniang Panlalawigan
Member
Josefina G. de la Cruz 2019 District II Sangguniang Panlalawigan
Marilou S. Denumpa 2019 ABC President
Karren Kaye A. Gadnanan 2019 SK Federation President
Glicerio G. Edang 2019 Provincial Councillors League President
Source: Department of the Interior and Local Government
I. POLITY

55
The Countryside in Figures: Guimaras, 2019 Edition GOVERNANCE , PUBLIC ORDER &SAFETY
Table 33. (continued)
Province/ Municipality Name Year Elected/ Appointed Position Designation
Jordan Ruben B. Corpuz 2019 Mayor
Ma. Shiela G. Gange 2019 Vice Mayor
Jose B. Duran 2019 Sangguniang Bayan Member
Hernane D. Galvez Jr. 2019 Sangguniang Bayan Member
Arsenio P. Gaitan 2019 Sangguniang Bayan Member
Grace Gaitan 2019 Sangguniang Bayan Member
Lyn Grace G. Palomo 2019 Sangguniang Bayan Member
Cecila L. Herrera 2019 Sangguniang Bayan Member
Eros E. Elevecione 2019 Sangguniang Bayan Member
Paquit G. Gange 2019 Sangguniang Bayan Member
Source: Department of the Interior and Local Government
I. POLITY

56
The Countryside in Figures: Guimaras, 2019 Edition GOVERNANCE , PUBLIC ORDER &SAFETY
Table 33. (continued)
Province/ Municipality Name Year Elected/ Appointed Position Designation
Buenavista Eugenio G. Reyes 2019 Mayor
Cecile C. Gumarin 2019 Vice Mayor
Arthur A. Cartel Jr. 2019 Sangguniang Bayan Member
Raquel A. Sambas 2019 Sangguniang Bayan Member
Perfecto T. Haban a Jr. 2019 Sangguniang Bayan Member
Edgar G. Gallo 2019 Sangguniang Bayan Member
Paul C. Esmaya 2019 Sangguniang Bayan Member
Cheryl F. Fernandez 2019 Sangguniang Bayan Member
Ronnie L. Ferrer 2019 Sangguniang Bayan Member
Carlito D. Gatinao 2019 Sangguniang Bayan Member
Source: Department of the Interior and Local Government
I. POLITY

57
The Countryside in Figures: Guimaras, 2019 Edition GOVERNANCE , PUBLIC ORDER &SAFETY
Table 33. (continued)
Province/ Municipality Name Year Elected/ Appointed Position Designation
Nueva Valencia Emmanuel D. Galila 2019 Mayor
Atty. Paul Vincent G.de la Cruz 2019 Vice Mayor
Antonio D. Delumpa 2019 Sangguniang Bayan Member
Manilyn G. Edang 2019 Sangguniang Bayan Member
Willo M. Gabaton 2019 Sangguniang Bayan Member
Susana G. Gallentes 2019 Sangguniang Bayan Member
Jason E. Javier 2019 Sangguniang Bayan Member
Felix G. Nava 2019 Sangguniang Bayan Member
Felix G. Servando 2019 Sangguniang Bayan Member
Cecile E. Ortiz 2019 Sangguniang Bayan Member
Source: Department of the Interior and Local Government
I. POLITY

58
The Countryside in Figures: Guimaras, 2019 Edition GOVERNANCE , PUBLIC ORDER &SAFETY
Table 33. (continued)
Province/ Municipality Name Year Elected/ Appointed Position Designation
San Lorenzo Ninfa G. Gajo 2019 Mayor
Constantino T. Cordero Jr. 2019 Vice Mayor
Ariel C. Zambarrano 2019 Sangguniang Bayan Member
Jimmy O. Gajo 2019 Sangguniang Bayan Member
John G. Garganera 2019 Sangguniang Bayan Member
Peter T. Tanaleon 2019 Sangguniang Bayan Member
Ercedita M. Espago 2019 Sangguniang Bayan Member
Noel G. Tacadao 2019 Sangguniang Bayan Member
Lino R. Galea 2019 Sangguniang Bayan Member
Jimmy G. Gallego 2019 Sangguniang Bayan Member
Source: Department of the Interior and Local Government
I. POLITY

59
The Countryside in Figures: Guimaras, 2019 Edition GOVERNANCE , PUBLIC ORDER &SAFETY
Table 33. (continued)
Province/ Municipality Name Year Elected/ Appointed Position Designation
Sibunag Annabelle V. Samaniego 2019 Mayor
Mervin V. Infante 2019 Vice Mayor
Luvynne Gale V. Vilches 2019 Sangguniang Bayan Member
Reynaldo G. Segovia 2019 Sangguniang Bayan Member
Jenith G. Canja 2019 Sangguniang Bayan Member
Bernardo J. Solis Jr. 2019 Sangguniang Bayan Member
Rolly F. Gamarcha 2019 Sangguniang Bayan Member
Rolando G. Gamilong Jr. 2019 Sangguniang Bayan Member
Fred C. Gamayo 2019 Sangguniang Bayan Member
Glicerio G. Edang 2019 Sangguniang Bayan Member
Source: Department of the Interior and Local Government
I. POLITY

60
The Countryside in Figures: Guimaras, 2019 Edition GOVERNANCE , PUBLIC ORDER &SAFETY
II. LAW AND ORDER
Crime incidents in Guimaras Province decreased from 1,708 cases in 2017 to 786 cases in 2018 as reported by the Guimaras Police Provincial Office
(GPPO). These were composed of index crime and non-index crime. Index crime has also decreased from 492 cases in 2017 to 166 cases in 2018 as well as
non-index crime from 1,216 cases to 620 cases in 2017 and 2018 respectively.
The province has six (6) Police Stations, one in every municipality and one (1) as the Provincial Office. A total of 335 PNP personnel have been
manning the entire province with a standard ratio of one (1) police personnel per 598 populations.
The 606th Community Defense Center of the 301st Infantry Brigade of the Philippine Army designated in Guimaras has also complemented with the
PNP troops in maintaining the peace and order condition of the province.
Moreover, the security forces of the province are equipped with high-end equipment, vehicle and communication facilities for an efficient and
effective discharge of their duties and responsibilities. The Provincial Government has allotted certain percentage of its provincial funds for the support to
peace and order programs of the province.
Fire fighting forces in the province are accounted to 71 distributed in the five (5) municipalities. Each municipality has one (1) fire station with one
(1) fire truck and an additional of one (1) fire truck designated in the provincial office with a total of six (6) fire trucks that are always ready whenever
there is an emergency. All municipalities also have one (1) radio communicator each and one (1) in the provincial office with a total of six (6) radio
communicators.

61
The Countryside in Figures: Guimaras, 2019 Edition GOVERNANCE , PUBLIC ORDER &SAFETY
In terms of crime incidents in the province of Guimaras, the Non-Index crime dropped to 620 in 2018 from 1,625 and 1,216 in
years 2016 and 2017, respectively.
Index Crime also decreased its number to 166 in 2018 compared to the preceding years (2016 and 2017).
Table 34. Crime Incidents, By Type of Offense, Guimaras : 2016, 2017 and 2018
Type of Offense Frequency of Occurrence
2016 2017 2018
Non-Index crime 1,625 1,216 620
Index Crime 580 492 166
Physical Injury ... ... 96
Murder ... ... 6
Theft ... ... 30
Rape 10
Homicide 2
Robbery 19
Carnapping/Motornapping 3
TOTAL 2,205 1,708 786
Source: Guimaras Police Provincial Office
II. LAW AND ORDER

62
The Countryside in Figures: Guimaras, 2019 Edition GOVERNANCE , PUBLIC ORDER &SAFETY
The total crime volume recorded from the PNP Blotter Report increased by 705.1 percent in 2018 with 7,866 cases and also rose up to 578.7 percent from 1,159 cases in 2016.
Crime solved showed a decreasing number from 645 in 2016 to 609 and 581 in 2017 and 2018, respectively.
The crime solution efficiency was higher in 2018 at 73.92 percent compared to the previous years.
Indicator 2016 2017 2018
Total Crime Volume
(PNP Blotter Report) 1,159 977 7,866
Crime Solved 645 609 581
Crime Solution Efficiency 56.43% 62.33% 73.92%
Table 35. Crime Volume, Crime Solved and Crime Solution Efficiency : 2016-2018
Source: Guimaras Police Provincial Office
II. LAW AND ORDER

63
The Countryside in Figures: Guimaras, 2019 Edition GOVERNANCE , PUBLIC ORDER &SAFETY
Physical injuries has the highest incidents committed among Crimes Against Person while theft has higher incidents on Crime Against Property recorded in 2018.
The municipality of Jordan has the highest recorded for Physical Injuries and theft among the 5 municipalities.
There are no recorded incident of homicide in the municipalities of Buenavista, Jordan and Sibunag , 1 incident each from Nueva Valencia and San Lorenzo.
Buenavista and Nueva Valencia has the most number of murder cases with 2 and 3, respectively.
There were 10 cases of rape recorded in 2018, 2 from Buenavista, 3 from Jordan, 4 from Nueva Valencia, 1 from San Lorenzo, and 0 from Sibunag.
There were 0motor napping incidents in Buenavista, Nueva Valencia and Sibunag, while there were 2 from Jordan and 1 from San Lorenzo.
Municipality
Crime Against Person Crime Against Property
Murder Homicide Physical Injuries Rape Robbery Theft Motor napping
Buenavista 2 0 34 2 1 3 0
Jordan (Capital) 1 0 39 3 9 20 2
Nueva Valencia 3 1 17 4 4 3 0
San Lorenzo 0 1 5 1 3 3 1
Sibunag 0 0 4 0 2 0 0
TOTAL 7 2 99 10 19 29 3
Table 36. Index Crime Volume By Category and Type by Municipality: 2018
II. LAW AND ORDER
Source: Guimaras Provincial Police Office, PNP

64
The Countryside in Figures: Guimaras, 2019 Edition GOVERNANCE , PUBLIC ORDER &SAFETY
Note: Index crimes as defined by the Philippine National Police (PNP), involve crimes against persons such as murder, homicide, physical injury and rape, and crimes against property such as robbery, theft, car napping/carjacking and cattle rustling. Non-index crimes, on the other hand, are violations of special laws such as illegal logging or local ordinances.
The total crime volume in 2018 was recorded at 786 incidents, 166 were categorized as index crimes while 620 were categorized as non– index
crimes.
In 2018, the municipality of Jordan recorded the highest crime volume with 284 incidents.
The municipality of Buenavista ranked 2nd with the highest crime volume with 224 incidents recorded and Nueva Valencia ranked 3rd with 138 total
incidents in 2018.
The municipality of San Lorenzo and Sibunag recorded the least number of crimes with only 87 and 53 incidents recorded, respectively.
Municipality Crime Volume : 2018
Index Non – Index Total
Buenavista 42 182 224
Jordan (Capital) 71 213 284
Nueva Valencia 32 106 138
San Lorenzo 14 73 87
Sibunag 7 46 53
TOTAL 166 620 786
Table 37 . Total Crime Volume by Type of Crime by Municipality: 2018
II. LAW AND ORDER
Source: Guimaras Provincial Police Office, PNP

65
The Countryside in Figures: Guimaras, 2019 Edition GOVERNANCE , PUBLIC ORDER &SAFETY
The total number of policemen in Guimaras reached 335 in 2018 with a ratio of 1: 598. This means that for every policeman, he/ she is responsible for 598 individuals in the population.
Buenavista Police Station has 53 policemen, 48 of which are PNCO, 4 non– uniformed, and 1 PCO with a ratio of 1:1,065.
Jordan Police Station has 49 policemen, 43 of which are PNCO, 4 non– uniformed, and 2 PCO with a ratio of 1:829
Nueva Valencia Police Station has 40 policemen, 34 of which are PNCO, 4 non– uniformed, and 2 PCO with a ratio of 1:1,144
San Lorenzo Station has 38 policemen, 32 of which are PNCO, 4 non– uniformed, and 2 PCO with a ratio of 1:794
Sibunag Station has 30 policemen, 25 of which are PNCO, 4 non– uniformed, and 1PCO with a ratio of 1:881
Police Office/Station PCO PNCO NUP Total Policeman Population Ratio
Guimaras Police Provincial Office (GPPO)
9 29 13 51 180,671
Guimaras Provincial Mobile Group (GPMG)
1 73 0 74 180,671
Buenavista Police Station 1 48 4 53 52,187 1:1,065
Jordan Police Station 2 43 4 49 32,348 1:829
Nueva Valencia Police Station 2 34 4 40 41,191 1:1,144
San Lorenzo Police Station 2 32 4 38 27,018 1:794
Sibunag Police Station 1 25 4 30 22,297 1:881
Total 18 284 33 335 180,671 1:598
Table 38. Total Number of Policemen and Ratio to Population by Municipality: 2018
II. LAW AND ORDER
Source: Guimaras Provincial Police Office, PNP
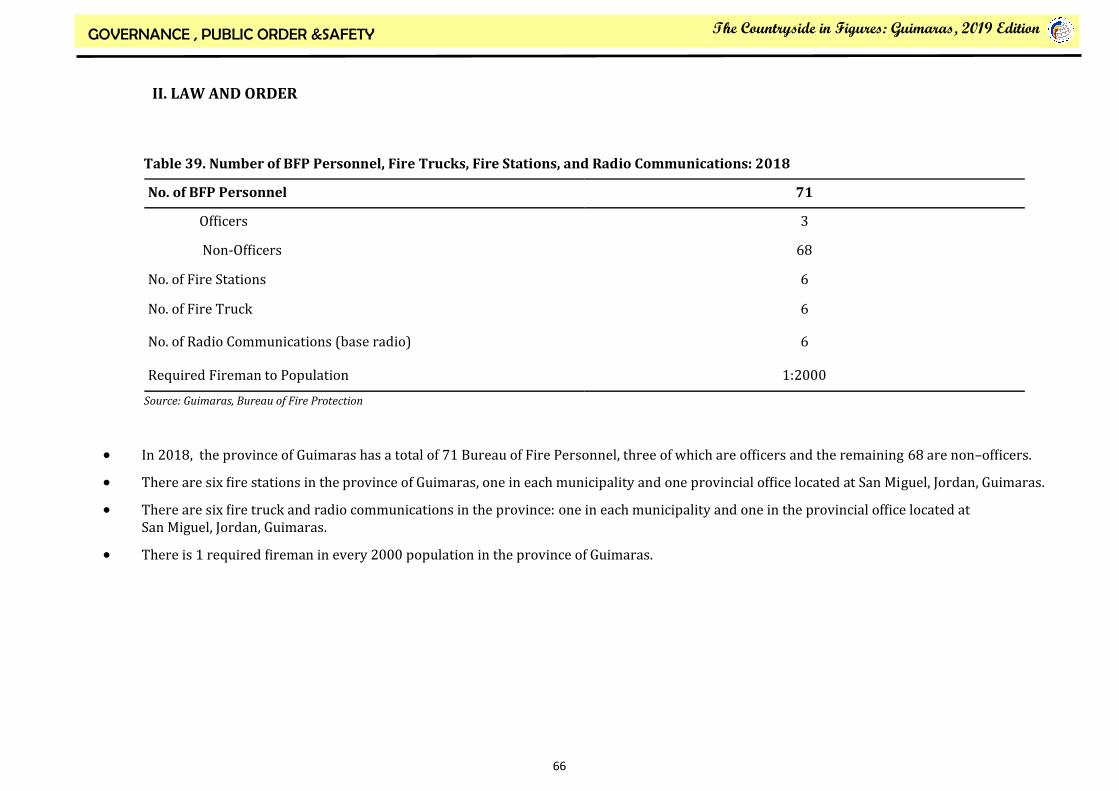
66
The Countryside in Figures: Guimaras, 2019 Edition GOVERNANCE , PUBLIC ORDER &SAFETY
In 2018, the province of Guimaras has a total of 71 Bureau of Fire Personnel, three of which are officers and the remaining 68 are non–officers.
There are six fire stations in the province of Guimaras, one in each municipality and one provincial office located at San Miguel, Jordan, Guimaras.
There are six fire truck and radio communications in the province: one in each municipality and one in the provincial office located at San Miguel, Jordan, Guimaras.
There is 1 required fireman in every 2000 population in the province of Guimaras.
Table 39. Number of BFP Personnel, Fire Trucks, Fire Stations, and Radio Communications: 2018
Source: Guimaras, Bureau of Fire Protection
No. of BFP Personnel 71
Officers 3
Non-Officers 68
No. of Fire Stations 6
No. of Fire Truck 6
No. of Radio Communications (base radio) 6
Required Fireman to Population 1:2000
II. LAW AND ORDER

67
The Countryside in Figures: Guimaras, 2019 Edition GOVERNANCE , PUBLIC ORDER &SAFETY
In 2018, 83 fire occurrences were recorded in Guimaras. The highest was seen in Jordan with 23 occurrences, next is Buenavista with 21 incidents, 14 from Sibunag, 13 from Nueva Valencia, while the least was observed in San Lorenzo with 12 incidents.
Table 40. Origin/Causes and Motives of Fire Incidents by Municipality: 2018
Indicator Buenavista Jordan Nueva Valencia San Lorenzo Sibunag
Origin Causes Electrical connections Electrical appliances Electrical machineries Spontaneous combustion Open flame due to unattended cooking/ stove Open flame due to torch or sulo Open flame due to unattended lighted candle or Gasera PG explosion due to direct contact or static electricity Lighted cigarette butt Chemicals Pyrotechnics Lighted matchstick or lighter Incendiary device/mechanism or ignited flammable liquids Lighting Bomb explosion Under investigation Undetermined Others Total
5 0 0 0 0 0 0 0 3 0 0 0 2 0 0 0 0 2 12
5 0 0 0 0 0 0 0 1 0 0 0 1 0 0 0 0 2 9
1 1 0 1 1 0 0 0 1 0 0 0 0 0 0 0 0 1 6
2 1 0 0 3 0 0 0 0 0 0 0 0 0 0 0 0 0 6
0 0 0 0 0 0 0 0 4 0 0 1 0 0 0 0 0 2 7
Motives Intentional Accidental Under Investigation Total
1 8 0 9
1 13 0 14
0 7 0 7
0 6 0 6
1 6 0 7
II. LAW AND ORDER
Source: Guimaras, Bureau of Fire Protection

68
The Countryside in Figures: Guimaras, 2019 Edition GOVERNANCE , PUBLIC ORDER &SAFETY
In 2018, most of the structural fire incidents recorded in the past three years occurred in Residential buildings accounting for 18 incidences
covering 69.23 percent of the total structural fire occurrence.
Kinds Structural Fire Occurrence 2016 2017 2018
Structural Fire
Residential Industrial/ Factory
Commercial Mercantile Storage Mixed
Business/Government Office Educational
Institutional (Health Care) Institutional (Detention & Correction)
Place of Assembly Electrical Post Miscellaneous
TOTAL
27 1 0 0 0 1 2 0 0 0 3 0 34
25 1 5 1 0 0 1 1 0 0 2 2 38
18 1 2 1 1 2 1 0 0 0
26
Table 41. Number of Fire Incidents by Type of Occupancy, Guimaras: 2016– 2018
II. LAW AND ORDER
Source: Guimaras, Bureau of Fire Protection
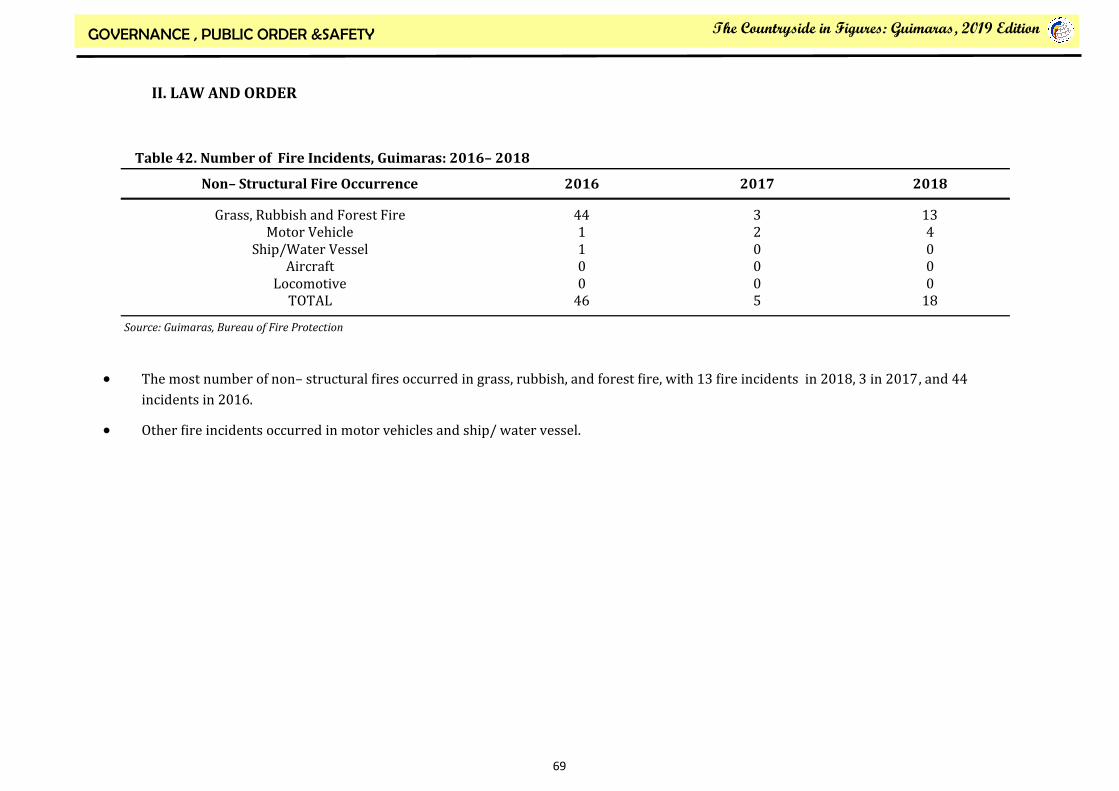
69
The Countryside in Figures: Guimaras, 2019 Edition GOVERNANCE , PUBLIC ORDER &SAFETY
The most number of non– structural fires occurred in grass, rubbish, and forest fire, with 13 fire incidents in 2018, 3 in 2017, and 44
incidents in 2016.
Other fire incidents occurred in motor vehicles and ship/ water vessel.
Non– Structural Fire Occurrence 2016 2017 2018
Grass, Rubbish and Forest Fire Motor Vehicle
Ship/Water Vessel Aircraft
Locomotive TOTAL
44 1 1 0 0 46
3 2 0 0 0 5
13 4 0 0 0 18
Table 42. Number of Fire Incidents, Guimaras: 2016– 2018
II. LAW AND ORDER
Source: Guimaras, Bureau of Fire Protection

70
The Countryside in Figures: Guimaras, 2019 Edition GOVERNANCE , PUBLIC ORDER &SAFETY
The most common cause of fire in 2016 was the lighted cigarette butt, while in 2017 and 2018 it was electrical connections that damaged millions of
pesos of residential and commercial/mercantile.
Causes 2016 2017 2018
Electrical Connection Electrical Appliances Electrical Machinery
Spontaneous Combustion Unattended Cooking/Stove
Open flame due to charcoal making Open Flame Due to torch/solo
Unattended Lighted Candle/Gasera LPG explosion
Lighted Cigarette butt Chemicals
Pyro techniques Lighted match stick/lighter
Incendiary devices/flammable liquid Lighting
Bomb explosion Undetermined
Others TOTAL
9 2 0 0 10 4 0 2 0 32 0 0 3 0 0 0 0 17 79
14 2 0 1 8 0 0 0 0 3 0 0 6 0 1 0 0 4 39
13 2 0 4 3 0 0 1 0 9 0 0 1 3 0 0 0 7 43
Table 43. Causes of Fire, Guimaras :2016-2018
II. LAW AND ORDER
Source: Guimaras, Bureau of Fire Protection

71
The Countryside in Figures: Guimaras, 2019 Edition GOVERNANCE , PUBLIC ORDER &SAFETY
In 2018 the highest fire damage was structural in nature with 25 incidents which covered 58.14 percent of the total causes of fire in the province.
Fire in 2018 claimed no lives, however one civilian was injured . There were no reported death nor injury in 2016 and 2017.
In the past three years, the year 2016 recorded the highest number of fire incidents in Guimaras province.
Indicator 2016 2017 2018
Nature Structural Vehicular/Ship Grass/Forest Others Total
25 1 44 - 70
19 1 3 - 23
25 4 13 1 43
Killed Firefighter Civilian Total
- - -
- - -
0 0 0
Injured Firefighter Civilian Total
- - -
- - -
1
Estimated Damages in (Php)
1,150,505.00
1,558,400.00
5,111,945.00
Table 44. Nature of Fire, Mortality, Injuries and Fire Damages, Guimaras: 2016-2018
II. LAW AND ORDER
Source: Guimaras, Bureau of Fire Protection

72
The Countryside in Figures: Guimaras, 2019 Edition GOVERNANCE , PUBLIC ORDER &SAFETY
The 2018 total amount of damages to property caused by fire dropped by 81.1 percent than its 2017 (27,107,680) level but soared by 243.9 percent from its 2016 (1,487,205.00) level.
The year 2016 recorded the least amount of damages to property
at almost 1.5 million pesos.
2016 2017 2018
1,487,205.00 27,107,680.00 5,111,945.00 Fire damage to property
Table 45. Total Fire Damages, Guimaras: 2016– 2018 (in pesos)
Figure 11. Comparative Fire Damages: 2015—2018
Source: Guimaras, BFP
II. LAW AND ORDER
Source: Guimaras, Bureau of Fire Protection

73
The Countryside in Figures: Guimaras, 2019 Edition GOVERNANCE , PUBLIC ORDER &SAFETY
Table 46. Total Collection of Fire Code Fees by Municipality: January-July 2019
The total collection of Fire Code fees was recorded at 921,211.00 pesos in January –July of 2019.
The municipality of Jordan collected the highest Fire Code fees among the five municipalities reaching at 371,643.00 pesos.
Buenavista ranked 2nd with 244, 111.00 pesos, Nueva Valencia ranked 3rd with 173,618.00 pesos fire codes collections and the lowest
split was seen in Sibunag and San Lorenzo with 78,500.00 and 53,339.00 collections, respectively.
Table 46. Total Collection of Fire Code Fees by Municipality: January-July 2019
Municipality Collection of Fire Code Fees (in Php) As of January-July 2019
Buenavista 244,111.00
Jordan (Capital) 371,643.00
Nueva Valencia 173,618.00
San Lorenzo 53,339.00
Sibunag 78,500.00
TOTAL 921,211.00
II. LAW AND ORDER
Source: Guimaras, BFP

74
The Countryside in Figures: Guimaras, 2019 Edition GOVERNANCE , PUBLIC ORDER &SAFETY
Source: Bureau of Fire Protection
The total inspected businesses from January –July 2019 reached at 3,728.
The highest inspected businesses was observed in the municipality of Buenavista reaching 1,170, next is Jordan with 1,041 operations
and 3rd is the municipality of Nueva Valencia with 836 operations.
Sibunag and San Lorenzo got the lowest split of 359 and 322 operations, respectively.
Table 47. Inspected Business Operation: Municipality: January-July 2019
Municipality Inspected Business Operation As of January- July 2019
Buenavista 1,170
Jordan (Capital) 1,041
Nueva Valencia 836
San Lorenzo 322
Sibunag 359
TOTAL 3,728
II. LAW AND ORDER

75
The Countryside in Figures: Guimaras, 2019 Edition GOVERNANCE , PUBLIC ORDER &SAFETY
The total business processing licensing collections from January –July 2019 reached at 6,772.
The highest inspected businesses was observed in the municipality of Buenavista reaching at 2,125, next is Jordan with 1,975
operations and 3rd is the municipality of Nueva Valencia with 1,507 operations.
Sibunag and San Lorenzo got the lowest split of 613 and 436 operations, respectively.
Table 48. Business Processing Licensing Office Collections : Municipality: January-July 2019
Municipality Business Processing Licensing Office As of January-July 2019
Buenavista 2,125
Jordan (Capital) 1975
Nueva Valencia 1,507
San Lorenzo 436
Sibunag 613
TOTAL 6,772
II. LAW AND ORDER
Source: Guimaras, BFP

76
The Countryside in Figures: Guimaras, 2019 Edition
CHAPTER 5. PUBLIC ADMINISTRATION

77
The Countryside in Figures: Guimaras, 2019 Edition PUBLIC ADMINISTRATION
Statistics on public administration pertain to the implementation of the different mandates of government institutions, management of
government resources and other operations performed by the Philippine government in providing public services. These functions are anchored in the
Constitution and other enabling acts which laid the foundation of democratic governance in the country. These thrusts are further articulated and
translated into the plans/programs/policies contained in the Medium Term Development Plan based on a mix of resources and institutional capacities
and a chain of societal concerns.
This chapter presents updated data on resources , revenues and expenditure of Guimaras Province.

78
The Countryside in Figures: Guimaras, 2019 Edition PUBLIC ADMINISTRATION
The total income of the province increased by 15.5 percent in 2018, from almost 764 million in 2017 to 881 million pesos in 2018, also higher by
19.4 percent than the 2016 total income of 738 million pesos.
The tax revenues collection in 2018 recovered 42.8 million pesos from its 34.5 million pesos tax revenues in 2017, but the figure is still far away
from its 16.6 million pesos in 2016.
The total non-tax revenues decreased from 2016 to 2017 at nearly 4.5 million, however it increased in 2018 by 21.9 percent and 14.9 percent
from 73 million pesos in 2017 and 78 million pesos in 2016.
The total income from external sources increased by 14.2 percent in 2018 from 654 million figure in 2017, also higher by 16.4 from its 2016 exter-
nal sources of 642 million pesos.
Indicator Guimaras Income : 2016 –2018
2016 2017 2018
Total Income (in Php)
Total Tax Revenues (in Php)
Total Non-Tax Revenues (in Php)
External Sources
737,671,761.52
16,695,037.38
78,276,073.14
642,700,651.00
763,042,761.81
34,522,155.72
73,782,010.79
654,738,173.30
881,068,282.21
42,868,036.37
89,908,564.18
748,291,681.66
Source: Bureau of Local Government Finance
Table 49. Total Income, Tax Revenues, Non– Tax Revenues and External Sources, Guimaras: 2016-2018
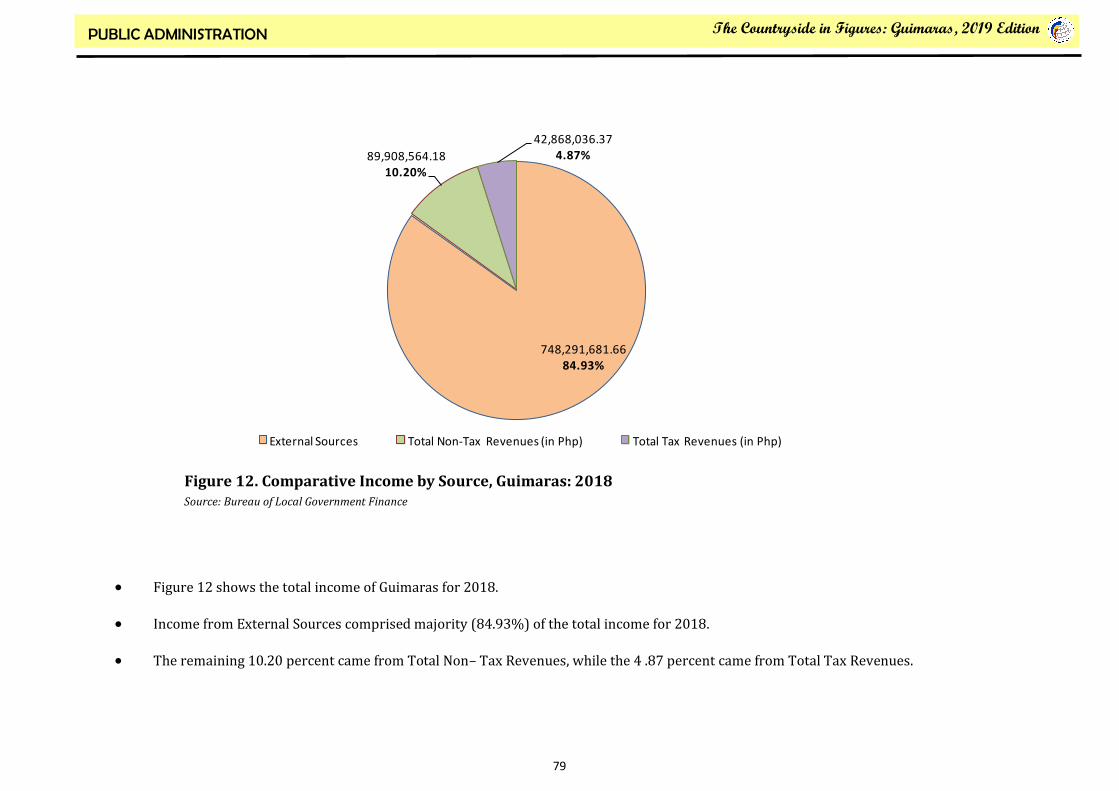
79
The Countryside in Figures: Guimaras, 2019 Edition PUBLIC ADMINISTRATION
Figure 12 shows the total income of Guimaras for 2018.
Income from External Sources comprised majority (84.93%) of the total income for 2018.
The remaining 10.20 percent came from Total Non– Tax Revenues, while the 4 .87 percent came from Total Tax Revenues.
Figure 12. Comparative Income by Source, Guimaras: 2018 Source: Bureau of Local Government Finance
748,291,681.6684.93%
89,908,564.1810.20%
42,868,036.374.87%
External Sources Total Non-Tax Revenues (in Php) Total Tax Revenues (in Php)

80
The Countryside in Figures: Guimaras, 2019 Edition PUBLIC ADMINISTRATION
The total expenditures in 2018 reached at 542.4 million pesos lower than the two previous years expenditures.
Guimaras spent the most on General Public Services for three consecutive years (2016–2018) which accounted 48.73 percent of the total
expenditures in 2018.
The province spent the least on Debt Service (FE) (Interest Expense & Other Charges) at an average of 0.0002 percent in 2018.
Indicators (in Php)
2016
2017
2018
Total Expenditure
General Public Services
Expenditures on Health, Nutrition & Population Control
Expenditures on Social Services & Welfare
Expenditures on Education, Culture & Sports/ Manpower Development
Expenditures on Economic Services
Debt Service (FE) (Interest Expense & Other Charges)
615,551,166.21
348,648,816.48
31,690,607.43
13,483,299.91
7,310,039.39
214,418,403.00
- - -
575,887,900.43
323,899,215.47
39,171,096.63
15,027,191.30
8,300,069.44
189,490,327.59
- - -
542,445,657.97
264,325,927.23
44,340,788.20
16,038,490.05
5,834,665.01
211,792,432.67
113,356.81
Source: Bureau of Local Government Finance
Table 50. Total Expenditures by Type (2016 - 2018)

81
The Countryside in Figures: Guimaras, 2019 Edition PUBLIC ADMINISTRATION
Figure13. Total Expenditures, Guimaras: 2018
Guimaras spent the most on General Public Services with 48.73 percent of the total annual expenditure for 2018.
On the other hand, expenditure on Debt Service (FE) (Interest Expense & Other Charges) is the least with only a proportion of 0.02 percent of the total
annual expenditures for 2018.
Source: Bureau of Local Government Finance
48.73%
39.04%
8.17%
2.96%1.08%
0.02%
General Public Services
Expenditures on Economic Services
Expenditures on Health, Nutrition & Population Control
Expenditures on Social Services & Welfare
Expenditures on Education, Culture & Sports/ Manpower Development
Debt Service (FE) (Interest Expense & Other Charges)

82
The Countryside in Figures: Guimaras, 2019 Edition PUBLIC ADMINISTRATION
Source: Bureau of Local Government Finance
The municipality of Buenavista and Nueva Valencia topped among the five municipalities of Guimaras by income in 2017.
The municipality of Buenavista obtained an income of Php224, 826, 413.64, while Nueva Valencia has a total income of Php183, 178, 036.99.
The municipality of Sibunag has the lowest income with Php116, 603, 821.76.
Municipality
Total Income of Guimaras Province by Municipality: 2015-2017(in Php)
2015 2016 2017
Buenavista 139, 350, 899.22 159, 008, 522.76 224, 826, 413.64
Jordan (Capital) 136, 123, 522.44 135, 884, 960.85 173, 766, 755.40
Nueva Valencia 123, 587, 135.79 145, 354, 845.26 183, 178, 036.99
San Lorenzo 124, 675, 749.58 141, 949, 617.74 162, 076, 772.88
Sibunag 98, 744, 864.77 110, 907, 509.28 116, 603, 821.76
Table 51. Total Income of Guimaras by Municipality (2015- 2017)
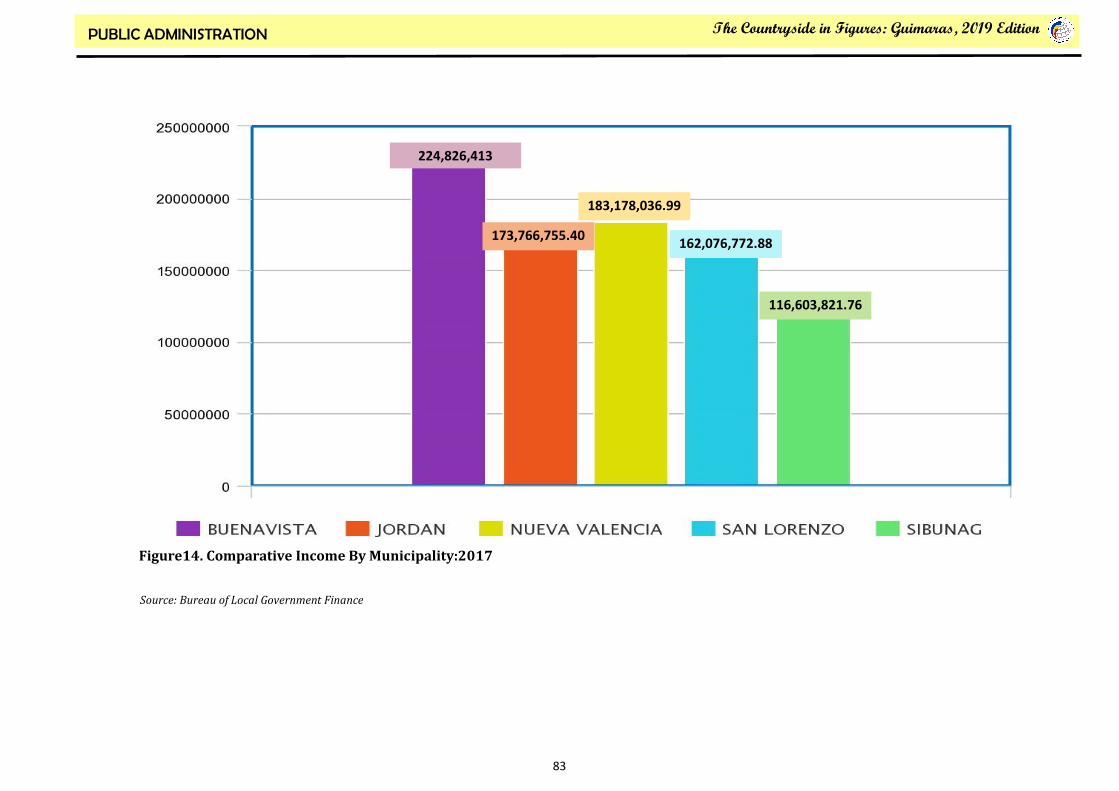
83
The Countryside in Figures: Guimaras, 2019 Edition PUBLIC ADMINISTRATION
Source: Bureau of Local Government Finance
224,826,413
173,766,755.40
183,178,036.99
162,076,772.88
116,603,821.76
Figure14. Comparative Income By Municipality:2017

84
The Countryside in Figures: Guimaras, 2019 Edition PUBLIC ADMINISTRATION
Guimaras’ internal revenue allotment share of Php613.7 million in 2019 is the highest for the past 9 years.
The internal revenue allotment share showed erratic trend since 2010 to 2013, but from then, it consistently increased to year 2016 by not less than 40M per year , then it dropped to 468.5M and once again continuously rise up to 613.7 in 2019.
2010 2011 2012 2013 2014 2015 2016 2017 2018 2019
285.7
310.8
296.1
327.1
369.5
421.5
461.5
468.5
557.6
613.7
Table 52. Internal Revenue Allotment (IRA) Share ( in million pesos), Guimaras, 2010-2019
Source: 2017 Philippine Statistical Yearbook, Department of Budget and Management (DBM)
Source: 2017 Philippine Statistical Yearbook, Department of Budget and Management (DBM)
Figure 15. Internal Revenue Allotment Share, Guimaras: 2010-2019 (in million pesos)

85
The Countryside in Figures: Guimaras, 2019 Edition PUBLIC ADMINISTRATION
Of the total allocation to LGU, the province share was 44.05 percent in 2019 accounting for 613.75 million pesos, while the five municipalities divided
the 39.69 percent (553.04 million pesos), and the remaining 16.26 percent of allocation was shared to 98 barangays with a total of 226.55 million
pesos.
Guimaras 2017 2018 2019
Province 519.43 557.60 613.75
Municipalities 468.48 502.59 553.04
Barangays 191.66 205.65 226.55
TOTAL 1,179.55 1,265.83 1,393.33
Table 53. Comparison of Allocation to Local Government Units 2017-2019 (In Million Pesos)
Source: Department of Budget and Management (DBM)
Figure 16. Comparison of Allocation to Local Government Units 2017-2019 (In Million Pesos)
Source: Department of Budget and Management (DBM)
In 2019, Guimaras Province has a
total of 1.39 billion pesos of
allocation higher than the 2018 and
2017 allocation with 1.27 billion
and 1.18 billion pesos, respectively.

86
The Countryside in Figures: Guimaras, 2019 Edition
CHAPTER 6. EDUCATION

87
The Countryside in Figures: Guimaras, 2019 Edition EDUCATION
Education is the fundamental link to national progress. It is the key to liberate people from poverty and enable them to fully utilize their human
faculties to contribute most effectively to the economic and social development of society . As embodied in the Philippine Constitution, the State shall
protect and promote the right of all citizens to quality education at all levels and shall take appropriate steps to make such education accessible to all.
Thus, the government recognizes education as one of the most essential social services that have to be adequately provided and improved in order to
achieve the goals of human development and people empowerment.
This chapter presents updated data on education statuses of Guimaras Province.

88
The Countryside in Figures: Guimaras, 2019 Edition EDUCATION
.
School Level 2015-2016 2016-2017 2017-2018 2018-2019
Total Male Female Total Male Female Total Male Female Total Male Female
Elementary 25,271 13,225 12,046 24,473 12,738 11,735 24,491 12,787 11,704 23,986 12, 338 11,648
Junior High
School 11,829 6,071 5,758 11,518 5,800 5,718 12,238 6,261 5,977 13,268 6,795 6,473
Senior High
School ... ... ... ... ... ... 3, 726 1,841 1, 865 4,378 2,193 2,184
Figure17. Guimaras Total Enrolment by Sex and School Level, 2017-2019
Males dominated females in both
elementary and junior high schools enrolment in
four school years from 2015-2019.
Senior high school started only in S.Y. 2017-2018.
Female enrolees in 2018-2019 accounted 48.79
percent and the remaining 51.21 percent were male
enrolees.
Source: Department of Education. Schools Division of Guimaras
Source: Department of Education. Schools Division of Guimaras
Male2017- 2018
Female Male2018- 2019
Female
12787 11704 12338
11648
6261 5977
6795 6473
1841 1865 2193 2184
Elementary Junior High School Senior High School
Table 54. Guimaras Total Enrolment AY 2015-2019

89
The Countryside in Figures: Guimaras, 2019 Edition EDUCATION
There were 1,064 Nationally– Funded Non Teaching and Teaching positions assigned in Government Elementary Schools for SY 2018– 2019.
Females outnumbered males in all positions in School Year 2018-2019.
2017-2018 2018-2019
Positions Male Female Total Male Female Total
Elem. School Principal 8 29 37 7 30 37
Head Teacher 2 38 40 2 38 40
SPED Teacher 0 5 5 0 6 6
ALS Teacher 3 6 9 5 11 16
Master Teachers 5 82 87 4 83 87
Teachers 47 723 770 48 791 839
Kindergarten Teachers 0 39 39 0 39 39
Total 65 922 987 66 998 1,064
Source: Department of Education. Schools Division of Guimaras
Table 55. Number of Nationally– Funded Non Teaching and Teaching Position Assigned in Government Elementary Schools, Guimaras: SY 2017– 2018 & 2018-2019

90
The Countryside in Figures: Guimaras, 2019 Edition EDUCATION
Graduation rate for public secondary schools in SY 2015 - 2016 and SY 2016 - 2017 is lower than in SY 2014 – 2015. No data available for SY 2017-2018 graduation rate.
School Year Gross Enrolment Ratio
(access)
Net Enrolment
Ratio (access)
Cohort Survival Rate (efficiency)
Completion Rate
(efficiency)
Graduation Rate (efficiency)
Promotion Rate (efficiency)
2014-2015 81.22% 62.81% 83.75% 82.49% 99.02% 97.21%
2015-2016 79.62% 69.29% 84.07% 83.33% 96.38% 94.55%
2016-2017 ... ... 84.37% 82.16% 96.38% 96.38%
2017-2018 166.30% 131.29% 92.83% 91.59% NOA 96.89%
Table 56. Performance Indicators Public Junior and Senior High Schools, Guimaras: SY 2014-2015 to SY 2017-2018
Source: Department of Education. Schools Division of Guimaras

91
The Countryside in Figures: Guimaras, 2019 Edition EDUCATION
There were 23.23 percent more Non-Teaching and Teaching positions in S.Y. 2018-2019 than in S.Y. 2017-2018. Females holding positions outnumbered males in all positions in S.Y. 2017-2018 and S.Y. 2018-2019.
Additionally, there was a 16.98 percent increase in the number of Junior High School positions and 44.23 percent increase in the number of Senior High School positions from S.Y. 2017-2018 to S.Y. 2018-2019.
For SHS, there was a 115.38 percent increase in the number of Non-Teaching positions in S.Y. 2018-2019 compared to S.Y. 2017-2018. In S.Y. 2018-2019, SHS teachers increased by 37.23 percent compared to the last school year.
For JHS, there was an increase of 73.68 percent in the number of Head Teachers for S.Y. 2018-2019, while the number of Master Teachers and Principals remained the same.
2018-2019 2017-2018
Positions Male Female Total Male Female Total
Grade
7-10 (JHS)
Master Teachers 5 28 33 5 28 33
Teachers 81 344 425 93 406 499
Principal 3 13 16 3 13 16
Head Teacher 2 17 19 7 26 33
Non– Teaching 5 26 31 6 26 32
Grade
11-12 (SHS)
Master Teachers 0 6 6 0 9 9
Teachers 25 112 137 21 167 188
Non– Teaching 4 9 13 5 23 28
Total 125 555 680 140 698 838
Table 57. Number of Nationally– Funded Non Teaching and Teaching Position Assigned in Government Junior High and Senior High
School, Guimaras: SY 2017-2018 & 2018-2019
Source: Department of Education. Schools Division of Guimaras
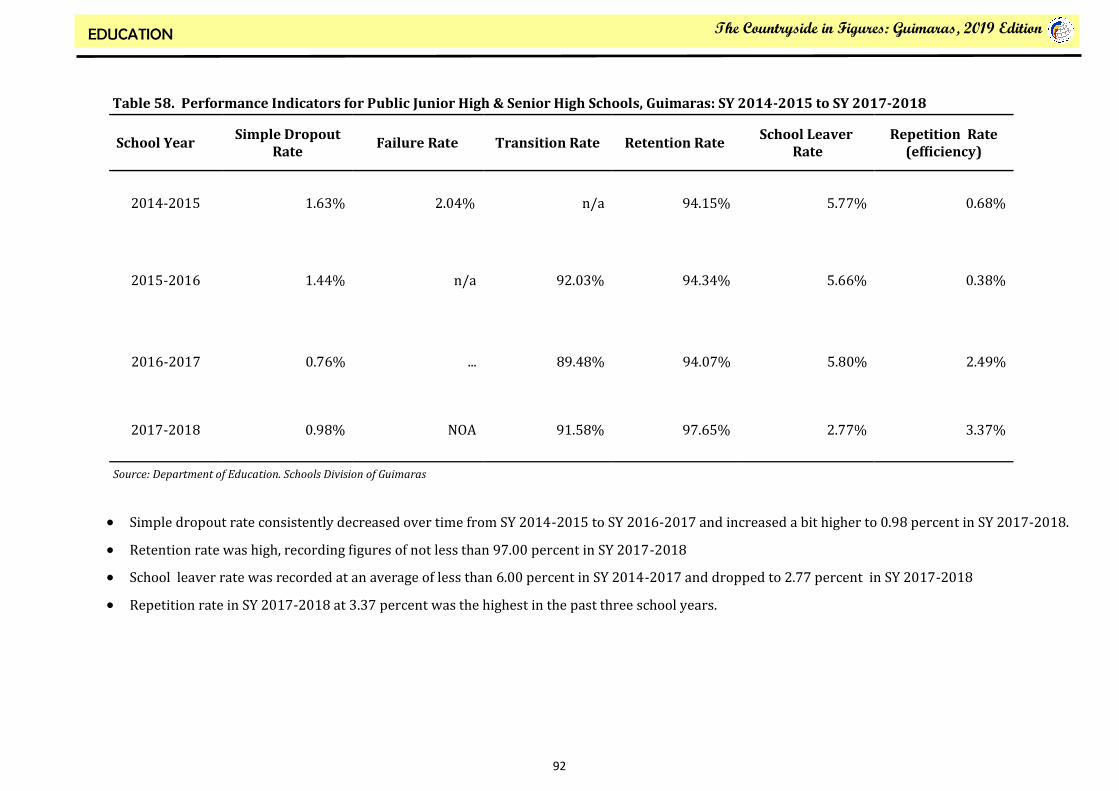
92
The Countryside in Figures: Guimaras, 2019 Edition EDUCATION
Simple dropout rate consistently decreased over time from SY 2014-2015 to SY 2016-2017 and increased a bit higher to 0.98 percent in SY 2017-2018.
Retention rate was high, recording figures of not less than 97.00 percent in SY 2017-2018 School leaver rate was recorded at an average of less than 6.00 percent in SY 2014-2017 and dropped to 2.77 percent in SY 2017-2018 Repetition rate in SY 2017-2018 at 3.37 percent was the highest in the past three school years.
School Year Simple Dropout
Rate Failure Rate Transition Rate Retention Rate
School Leaver Rate
Repetition Rate (efficiency)
2014-2015 1.63% 2.04% n/a 94.15% 5.77% 0.68%
2015-2016 1.44% n/a 92.03% 94.34% 5.66% 0.38%
2016-2017 0.76% ... 89.48% 94.07% 5.80% 2.49%
2017-2018 0.98% NOA 91.58% 97.65% 2.77% 3.37%
Table 58. Performance Indicators for Public Junior High & Senior High Schools, Guimaras: SY 2014-2015 to SY 2017-2018
Source: Department of Education. Schools Division of Guimaras

93
The Countryside in Figures: Guimaras, 2019 Edition EDUCATION
Guimaras enrolment in public elementary schools decreased in SY 2018-2019 with 24,383 students from 24, 491 students in SY 2017-2018. Buenavista has the highest number of
enrolees with 6,313 students in SY 2018-2019 (3, 227 males and 3, 086 females).
Sibunag has the least number of
enrolees with 2, 991 in SY 2018-2019 students (1, 577 males and 1, 414 females).
Male students outnumbered female
students in SY 2018-2019 (12,587 males, 11,796 females).
2017-2018 2018-2019
Municipality Total Male Female Total Male Female
Buenavista 6449 3345 3104 6,313 3,227 3,086
Jordan 5230 2702 2528 5,250 2,715 2,535
Nueva Valencia 6027 3171 2856 5,930 3,066 2,864
San Lorenzo 3856 1995 1861 3,899 2,002 1,897
Sibunag 2929 1574 1355 2,991 1,577 1,414
Table 59. Total Enrolment in Public Elementary Schools by Sex by Municipality: SY 2017– 2018 & 2018-2019
Source: Department of Education. Schools Division of Guimaras
Figure 18. Comparative Total Enrolment in Public Elementary Schools by Sex by Municipality: SY 2017– 2019
Source: Department of Education. Schools Division of Guimaras
Male enrolees dominated
females, this is true in all of the
municipalities in the province for
SY 2017-2018 to SY 2018-2019.

94
The Countryside in Figures: Guimaras, 2019 Edition EDUCATION
Buenavista has the highest number of enrolees with 3,867 in SY 2018-2019 students (1, 994 males and 1, 867 females). There were more male students than
female students in Junior High School in SY 2018-2019.
There were 13,274 enrolees in Junior High
School in public schools in Guimaras province for SY 2018-2019, higher by 8.5 percent from 12,238 enrolees in SY 2017-2018.
2017-2018 2018-2019
Municipality Total Male Female Total Male Female
Buenavista 3601 1837 1764 3,867 1,994 1,867
Jordan 2603 1295 1308 2,800 1,399 1,401
Nueva Valencia 3176 1650 1526 3,824 1,957 1,867
San Lorenzo 1667 845 822 1,669 857 812
Sibunag 1191 634 557 1,114 588 526
Table 60. Total Enrolment in Public Junior High Schools by Sex by Municipality: SY 2017-2018 & SY 2018-2019
Source: Department of Education. Schools Division of Guimaras
Figure 19. Comparative Total Enrolment in Public Junior High Schools by Sex by Municipality: SY 2017– 2019
Source: Department of Education. Schools Division of Guimaras
Male enrolees dominated females, this
is true in all of the municipalities in
the province in SY 2018-2019,
except for the municipality of Jordan.

95
The Countryside in Figures: Guimaras, 2019 Edition EDUCATION
The public senior high schools of Guimaras reported a total of 4,470 enrolees in SY 2018-2019, higher by 20.6 percent in SY 2017-2018 with a total of 3,706 enrolees.
In SY 2018-2019, the municipality of Buenavista got the highest number of enrolees with a total of 1,269, while the least number of enrolees was recorded in the municipality of Sibunag with only 354 enrolees.
2017-2018 2018-2019
Municipality Total Male Female Total Male Female
Buenavista 815 405 410 1,269 628 641
Jordan 905 418 487 1,045 499 546
Nueva Valencia 1, 024 511 513 1,165 598 567
San Lorenzo 764 390 374 637 319 318
Sibunag 198 117 81 354 179 157
Table 61. Total Enrolment in Public Senior High Schools by Sex by Municipality: SY 2017– 2018 & 2018-2019
Source: Department of Education. Schools Division of Guimaras
Figure 20. Comparative Total Enrolment in Public Senior High Schools by Sex by Municipality: SY 2017– 2019
Source: Department of Education. Schools Division of Guimaras
Male enrolees dominated females, this is true
in all of the municipalities in the province for
the SY 2018-2019, except for the municipa-
lities of Buenavista and Nueva Valencia.

96
The Countryside in Figures: Guimaras, 2019 Edition EDUCATION
Out of eight academic tracks offered for senior high schools in the
Philippines, only four are offered here in Guimaras namely
Accountancy, Business, and Management (ABM), Humanities and Social Sciences (HUMSS), Science, Technology, Engineering, and Mathematics (STEM), General Academic Strand (GAS), and Tech-nical–Vocational Livelihood strand.
There were 3,231 senior high school students enrolled for the school year 2018-2019.
TVL has the highest number of enrolees with 1,373, followed by GAS having 1, 310 students and HUMSS has the least enrolees with 122 students.
Municipality ABM HUMSS STEM GAS MARITIME TVL SPORTS ARTS TOTAL
Buenavista 55 0 57 577 0 357 0 0 1,046
Jordan 45 122 73 146 0 360 0 0 746
Nueva Valencia 26 0 76 355 0 337 0 0 794
San Lorenzo 0 0 49 223 0 82 0 0 354
Sibunag 20 0 25 9 0 237 0 0 291
TOTAL 146 122 280 1,310 0 1,373 0 0 3,231
Table 62. Total Enrolment in Public Senior High Schools by Track by Municipality: SY 2018-2019
Source: Department of Education. Schools Division of Guimaras
Figure 21. Distribution of Enrolment in Public Senior High Schools by Track: SY 2018– 2019
Source: Department of Education. Schools Division of Guimaras
TVL accounted for the largest share at 42.49 percent of the total
enrolees, followed by GAS accounting 40.54 percent of the total
enrolment in senior high school.

97
The Countryside in Figures: Guimaras, 2019 Edition
CHAPTER 7. BANKING AND FINANCE

98
The Countryside in Figures: Guimaras, 2019 Edition BANKING AND FINANCE
The pivotal role played by financial institutions in providing scarce resources in developing countries like the Philippines cannot be overemphasized.
Financial statistics relating to institutions, e.g., demand savings and time deposits, outstanding loans and investments are of primary importance in
determining sound policies conducive to economic development and serve as bases for the monetary authorities and the banking credit institutions to readily
respond to monetary problems, needs and requirements of the economy. Financial institution data also give insights to the contribution of the sector to the
government’s task of nation building.
This chapter presents updated data on banking and finance statuses of Guimaras Province.

99
The Countryside in Figures: Guimaras, 2019 Edition BANKING AND FINANCE
Source: Bangko Sentral Ng Pilipinas
Figure 22. Number of Banks in Guimaras: 2018
Banks in Guimaras Province are classified into three types: Universal and Commercial Banks, Thrift Banks and Rural and Cooperative
Banks.
Guimaras has six Universal and Commercial Banks, two Thrift Banks, and one Rural and Cooperative Bank .
There are no existing banks in the municipalities of Buenavista and San Lorenzo .
Jordan has 4 Universal and Commercial Banks, 2 Thrift Banks, and 1 Rural and Cooperative Bank.
Nueva Valencia and Sibunag has only 1 bank each (Universal and Commercial Banks).

100
The Countryside in Figures: Guimaras, 2019 Edition BANKING AND FINANCE
Source: Bangko Sentral Ng Pilipinas
Figure 23. Number of ATMs in Guimaras: 2018
There are 8 ATMs in the province, 5 on-sites and 3 off-sites.
Nueva Valencia, San Lorenzo and Sibunag have no existing ATMs.
There are 3 ATMs in Buenavista (2 off-sites and 1 on-site) and 5 in Jordan (4 on-sites and 1 off-site).

101
The Countryside in Figures: Guimaras, 2019 Edition BANKING AND FINANCE
Source: Bangko Sentral Ng Pilipinas
Figure 24. Distribution of Deposit Liabilities (in million pesos): Guimaras 2018
Guimaras Province has a total of 1,812 million pesos of deposits liabilities (1,276 million from demand, 524 million from savings and
12 million from time deposits).
Buenavista, Nueva Valencia and San Lorenzo has no distribution of deposits liabilities.
Jordan has a total of 1,808 million pesos of deposits (1,276 million from demand, 520 million from savings, and 12 million from time
deposits).

102
The Countryside in Figures: Guimaras, 2019 Edition BANKING AND FINANCE
Source: Bangko Sentral Ng Pilipinas
Figure 25. Distribution of Loans and Receivables –Others, Net (in million pesos) : Guimaras 2018
Guimaras Province has a total of 291.08 million pesos of loans and receivables.
Buenavista, Nueva Valencia, and San Lorenzo has no distribution of loans and receivables.
Jordan has a total of 282.02 million pesos of loans and receivables.

103
The Countryside in Figures: Guimaras, 2019 Edition
CHAPTER 8. VITAL, HEALTH & NUTRITION STATISTICS

104
The Countryside in Figures: Guimaras, 2019 Edition VITAL, HEALTH & NUTRITION STATISTICS
Health statistics include both empirical data and estimates related to health, such as mortality, morbidity, risk factors, health service coverage, and
health systems. The production and dissemination of health statistics play a key role in advocacy for health issues, monitoring and evaluation of health
programmes and provision of technical assistance to countries.
This chapter presents the vital, health and nutrition statistics of Guimaras province.

105
The Countryside in Figures: Guimaras, 2019 Edition VITAL, HEALTH & NUTRITION STATISTICS
Health Profile
2018
No. of Barangay Health Stations
85
No. of Hospitals
1 ( Level – 1 )
No. of Infirmaries
2
No. of Rural Health Units
5
No. of Public-Private Mix DOTS Clinic
1 (PHO)
No. of Social Hygiene Clinic
1 (PHO)
No. of RHU with 3-in-1 Philhealth Accreditation and License to Operate (PCB, TB DOTS & MCP/NCP)
3 (Buenavista RHU, Nueva Valencia RHU, Sibunag RHU)
No. of RHU with PCB & TB DOTS Philhealth Accreditation and License to Operate
2 (Jordan RHU, San Lorenzo RHU)
No. of Birthing Facilities
5
Animal Bite Treatment Center
1 (DCGNPH)
Municipal Nutrition Center
1 (Jordan)
Barangay Nutrition Centers
13 (Jordan)
Barangay Health Workers (BHW)
655
Barangay Nutrition Scholars (BNS)
97
Source: PHO, Guimaras
Table 63. Guimaras Health Profile 2018

106
The Countryside in Figures: Guimaras, 2019 Edition VITAL, HEALTH & NUTRITION STATISTICS
Health Personnel
2018
2017
Doctor to Population Ratio (1: 20,000)
1: 22,680
1: 22,813
Dentist to Population Ratio (1: 50,000)
1: 60,480
1: 60, 834
Nurse to Population Ratio (1: 20,000)
1: 16,495
1: 22,813
Midwife to Population Ratio (1: 5,000)
1: 2,668
1: 2,852
Sanitary Inspector to Population Ratio (1:20,000)
1: 36,288 1: 36,500
Source: PHO, Guimaras
Table 64. Ratio of Public Health Personnel, Guimaras, 2017 & 2018
In 2018, Guimaras has 1 doctor to every 22,680 persons, lower compared to 2017 with 22,813 patients to every doctor.
In 2018, Guimaras has 1 dentist to every 60,480 persons, lower compared to 2017 with 60,834 patients to every dentist.
Moroeover, Guimaras has 1 nurse to every 16,495 persons in 2018, lower compared to 2017 with 22,813 patients to every nurse.
The ratio of midwife to persons is 1 midwife to every 2,668 persons in 2018, lower compared to 2017 with 2,852 patients to every
dentist.
As to sanitary inspector, Guimaras has a ratio of 1 sanitary inspector for every 36,288 persons in 2018, lower compared to 2017
with 36,500 patients to every sanitary inspector .

107
The Countryside in Figures: Guimaras, 2019 Edition VITAL, HEALTH & NUTRITION STATISTICS
Table 65. Health Indices, Guimaras: 2017 & 2018
2018 2017
Number
Rate
Number
Rate
Crude Birth Rate (per 1000 pop.)
1,779
9.80
1,684 9.23
Crude Death Rate (per 1000 pop.)
740
4.08
837 4.59
Infant Mortality Rate (per 1000 LB)
17
9.56
17 10.09
Neonatal Deaths (per 1000 LB)
9
5.06
12 7.13
Maternal Mortality Rate (per 100,000 LB)
0
0.00
0 0.00
Prevalence of Overweight and Obese
397
2.18
738 3.62
Low Birth weight among Newborn
178
10.1
252 14.96
Child Mortality Rate (per 1000 LB)
6
3.37
3 1.78
Under-Five Mortality Rate (per 1000 LB)
23
12.93
20 11.88
Fertility Rate (per 1000 MWRA)
43,872
40.55
44,129 38.16
Source: PHO, Guimaras
Crude birth rate increased to 9.80 percent in 2018 from 0.23 percent in 2017.
Crude death rate dropped to 4.08 percent in 2018 than 4.59 percent in 2017.
Infant mortality rate dropped to 9.56 percent in 2018 from 10.09 percent in 2017.
Neonatal deaths rate dropped to 5.06 percent in 2018 from 7.13 percent in 2017.

108
The Countryside in Figures: Guimaras, 2019 Edition VITAL, HEALTH & NUTRITION STATISTICS
Table 66. Vital Health Indices , Guimaras: 2015 - 2018
Target 2015 2016 2017 2018
Crude Birth Rate 11.85 16.44 9.23 9.80
Crude Death Rate 4.10 4.75 4.59 4.08
Neonatal Mortality Rate 10 Deaths per
1,000 LB
(NOH 2016)
8.68 4.11 7.13 5.06
Infant Mortality Rate <17 deaths per
1,000 LB
(NOH 2016)
13.02 6.85 10.09 9.56
Under-Five Mortality Rate <25.5
deaths per 1,000 L
B (NOH 2016)
13.50 8.56 11.88 12.93
Maternal Mortality Rate 0 0.00 34.26 0.00 0.00
Source: PHO, Guimaras
Vital health indices in Guimaras showed an erratic trend from year 2015 to 2018.
No data available on Maternal Mortality rate in years 2015, 2017 and 2018, however there was a 34.26 percent of deaths in 2016.
The least mortality rate in 2018 (except maternal) was recorded in Neonatal.
The highest crude death in 2018 was recorded in Under-Five Mortality at 12.93 percent.
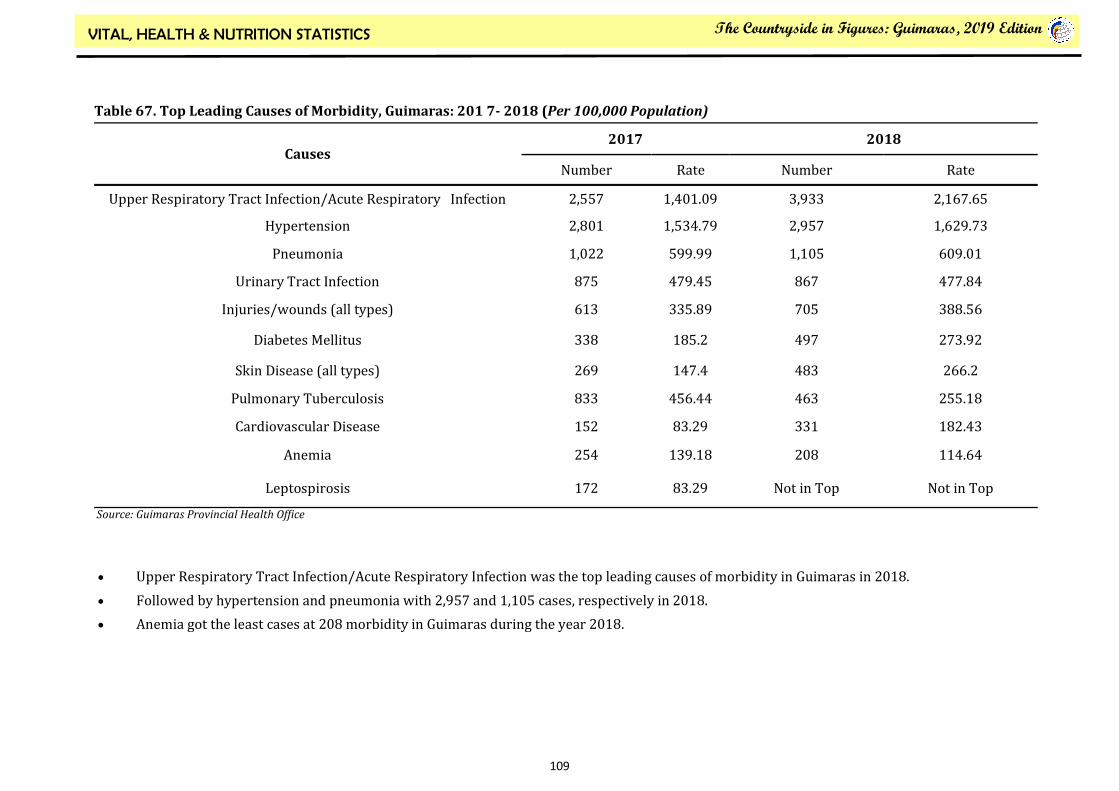
109
The Countryside in Figures: Guimaras, 2019 Edition VITAL, HEALTH & NUTRITION STATISTICS
Table 67. Top Leading Causes of Morbidity, Guimaras: 201 7- 2018 (Per 100,000 Population)
Causes 2017 2018
Number Rate Number Rate
Upper Respiratory Tract Infection/Acute Respiratory Infection 2,557 1,401.09 3,933 2,167.65
Hypertension 2,801 1,534.79 2,957 1,629.73
Pneumonia 1,022 599.99 1,105 609.01
Urinary Tract Infection 875 479.45 867 477.84
Injuries/wounds (all types) 613 335.89 705 388.56
Diabetes Mellitus 338 185.2 497 273.92
Skin Disease (all types) 269 147.4 483 266.2
Pulmonary Tuberculosis 833 456.44 463 255.18
Cardiovascular Disease 152 83.29 331 182.43
Anemia 254 139.18 208 114.64
Leptospirosis 172 83.29 Not in Top Not in Top
Source: Guimaras Provincial Health Office
Upper Respiratory Tract Infection/Acute Respiratory Infection was the top leading causes of morbidity in Guimaras in 2018.
Followed by hypertension and pneumonia with 2,957 and 1,105 cases, respectively in 2018.
Anemia got the least cases at 208 morbidity in Guimaras during the year 2018.
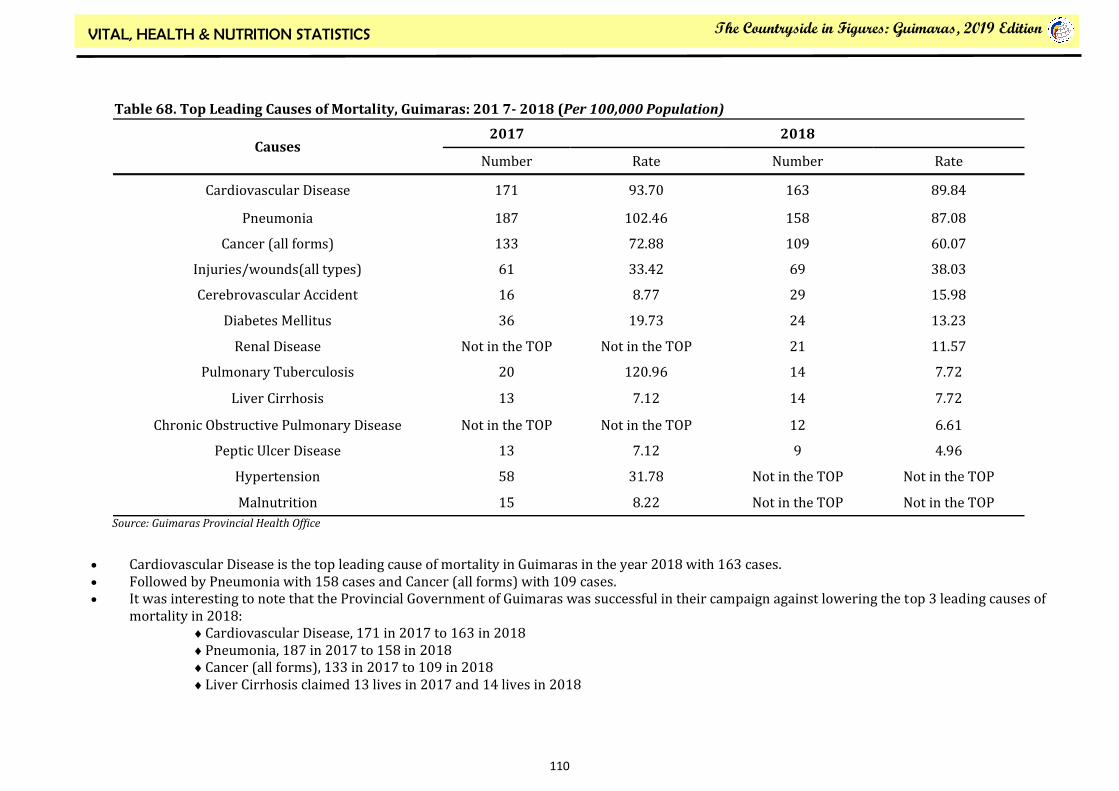
110
The Countryside in Figures: Guimaras, 2019 Edition VITAL, HEALTH & NUTRITION STATISTICS
Table 68. Top Leading Causes of Mortality, Guimaras: 201 7- 2018 (Per 100,000 Population)
2017 Causes
2018
Number Rate Number Rate
Cardiovascular Disease 171 93.70 163 89.84
Pneumonia 187 102.46 158 87.08
Cancer (all forms) 133 72.88 109 60.07
Injuries/wounds(all types) 61 33.42 69 38.03
Cerebrovascular Accident 16 8.77 29 15.98
Diabetes Mellitus 36 19.73 24 13.23
Renal Disease Not in the TOP Not in the TOP 21 11.57
Pulmonary Tuberculosis 20 120.96 14 7.72
Liver Cirrhosis 13 7.12 14 7.72
Chronic Obstructive Pulmonary Disease Not in the TOP Not in the TOP 12 6.61
Peptic Ulcer Disease 13 7.12 9 4.96
Hypertension 58 31.78 Not in the TOP Not in the TOP
Malnutrition 15 8.22 Not in the TOP Not in the TOP
Source: Guimaras Provincial Health Office
Cardiovascular Disease is the top leading cause of mortality in Guimaras in the year 2018 with 163 cases. Followed by Pneumonia with 158 cases and Cancer (all forms) with 109 cases. It was interesting to note that the Provincial Government of Guimaras was successful in their campaign against lowering the top 3 leading causes of
mortality in 2018: Cardiovascular Disease, 171 in 2017 to 163 in 2018 Pneumonia, 187 in 2017 to 158 in 2018 Cancer (all forms), 133 in 2017 to 109 in 2018 Liver Cirrhosis claimed 13 lives in 2017 and 14 lives in 2018

111
The Countryside in Figures: Guimaras, 2019 Edition VITAL, HEALTH & NUTRITION STATISTICS
Table 69. Top Leading Causes of Infant Mortality, Guimaras: 201 7- 2018 (Per 100,000 Live Births)
Causes 2018 2017
Number Rate Number Rate
Prematurity 7 4.16 7 3.39
Hydrocephalus Not in Top Not in Top 2 1.12
Asphyxia Not in Top Not in Top 1 0.56
Anencephaly Not in Top Not in Top 1 0.56
Neonatal Aspiration Not in Top Not in Top 1 0.56
Progressive Familial Cholestitis Not in Top Not in Top 1 0.56
Disseminated Intravascular Coagulopathy 2 1.19 1 0.56
Central Nervous System Infection Not in Top Not in Top 1 0.56
Hirschsprung Disease Not in Top Not in Top 1 0.56
Severe Dehydration Not in Top Not in Top 1 0.56
Cardiovascular Disease (Congenital Heart Diseases) 3 1.78 Not in Top Not in Top
Neonatal Sepsis (Severe Neonatal Pneumonia) 2 1.19 Not in Top Not in Top
Congenital Malformation of the Nose 1 0.59 Not in Top Not in Top
Hemolytic Disease of the Newborn 1 0.59 Not in Top Not in Top
Necrotizing Fasciitis 1 0.59 Not in Top Not in Top
Source: Guimaras Provincial Health Office
Prematurity was the top leading cause of infant mortality in Guimaras during the years 2017 and 2018.
Cardiovascular Disease (Congenital Heart Diseases), Neonatal Sepsis (Severe Neonatal Pneumonia), Congenital Malformation of the Nose, Hemolytic Disease of the Newborn, and Necrotizing Fasciitis were not included among the top leading causes of infant mortality in Guimaras in 2018.
Hydrocephalus, Asphyxia, Anencephaly, Neonatal Aspiration, and Progressive Familial Cholestitis were not among the top Leading Causes of Infant Mortality in 2017 however, it was among the top leading causes in 2018.

112
The Countryside in Figures: Guimaras, 2019 Edition VITAL, HEALTH & NUTRITION STATISTICS
Table 70. Top Leading Causes of Neonatal Deaths, Guimaras: 201 7- 2018 (Per 100,000 Live Births)
Causes 2017 2018
Number Rate Number Rate
Prematurity 6 3.64 5 2.81
Disseminated Intravascular Coagulopathy Not in Top Not in Top 1 0.56
Central Nervous System Infection Not in Top Not in Top 1 0.56
Anecephaly Not in Top Not in Top 1 0.56
Neonatal Aspiration Not in Top Not in Top 1 0.56
Asphyxia Not in Top Not in Top 1 0.56
Hyaline Membrane Disease 2 1.19 Not in Top Not in Top
Congenital Heart Disease 1 0.59 Not in Top Not in Top
Neonatal Sepsis, Severe Neonatal Pneumonia 1 0.59 Not in Top Not in Top
Congenital Malformation of the Nose 1 0.59 Not in Top Not in Top
Hemolytic Disease of the Newborn 1 0.59 Not in Top Not in Top
Source: Guimaras Provincial Health Office
Prematurity is the top leading cause of neonatal deaths in Guimaras in 2017 and 2018 with a slight decrease of 0.83 percentage points.
The top leading causes of neonatal deaths in 2018 include: Disseminated Intravascular Coagulopathy, Central Nervous System Infection, Anecephaly, Neonatal Aspiration, and Asphyxia.
The top leading causes of neonatal deaths in 2017 include: Hyaline Membrane Disease, Congenital Heart Disease, Neonatal Sepsis, Severe Neonatal Pneumonia, Congenital Malformation of the Nose, and Hemolytic Disease of the Newborn.

113
The Countryside in Figures: Guimaras, 2019 Edition VITAL, HEALTH & NUTRITION STATISTICS
Table 71. Top Leading Causes of Maternal Deaths, Guimaras: 201 7- 2018 (Per 100,000 Live Births)
Source: Guimaras Provincial Health Office
Causes
2017 2018
ZERO ZERO
Table 72. Top Leading Causes of Child Mortality, Guimaras: 201 7- 2018 (Per 100,000 Live Births)
Causes
2017 2018
Number Rate Number Rate
Injuries / Wounds (all types) Not in Top Not in Top 2 1.12
Cancer (all forms) 2 1.19 2 1.12 Pneumonia 1 0.59 1 0.56 Asphysia Not in Top Not in Top 1 0.56
Source: Guimaras Provincial Health Office
No cases of maternal deaths recorded in Guimaras province in the years 2017 and 2018.
Injuries/Wounds (all types) and Cancer (all forms) were the top leading causes of child mortality in Guimaras in 2018.
Cancer (all forms) and Pneumonia were the top leading causes of child mortality in Guimaras in the years 2017 and 2018.
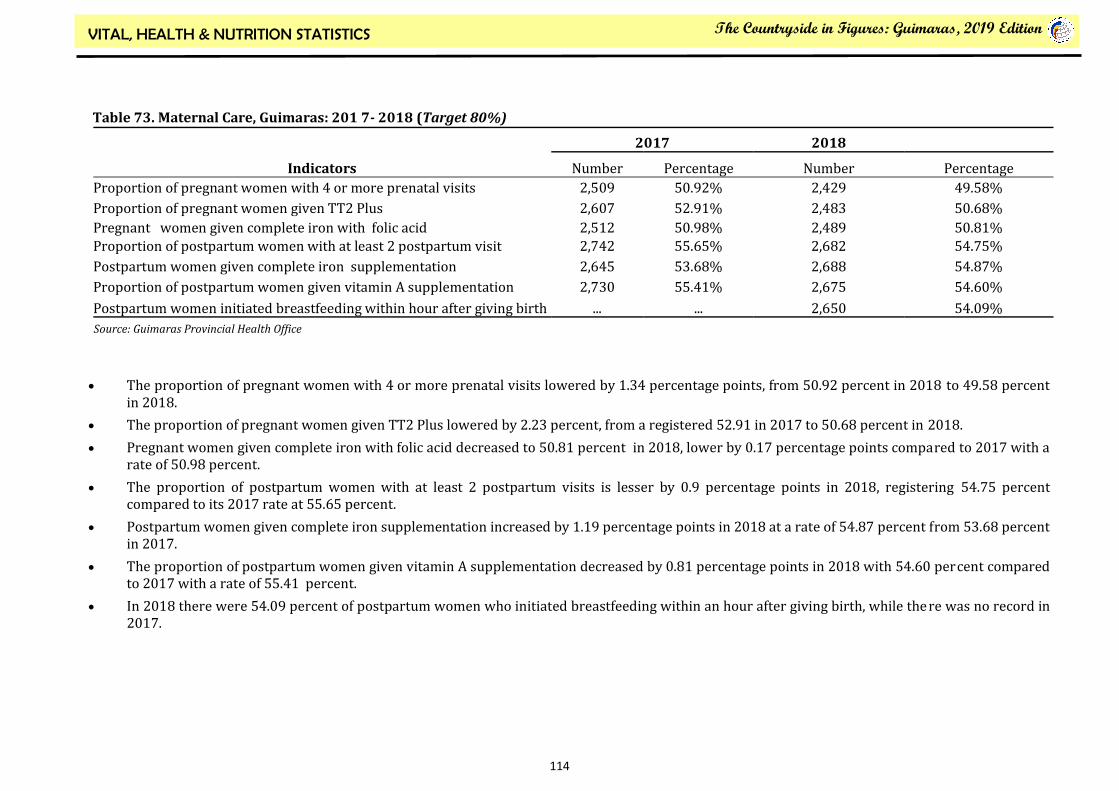
114
The Countryside in Figures: Guimaras, 2019 Edition VITAL, HEALTH & NUTRITION STATISTICS
Table 73. Maternal Care, Guimaras: 201 7- 2018 (Target 80%)
Source: Guimaras Provincial Health Office
Indicators
2017 2018
Number Percentage Number Percentage
Proportion of pregnant women with 4 or more prenatal visits 2,509 50.92% 2,429 49.58%
Proportion of pregnant women given TT2 Plus 2,607 52.91% 2,483 50.68%
Pregnant women given complete iron with folic acid 2,512 50.98% 2,489 50.81%
Proportion of postpartum women with at least 2 postpartum visit 2,742 55.65% 2,682 54.75%
Postpartum women given complete iron supplementation 2,645 53.68% 2,688 54.87%
Proportion of postpartum women given vitamin A supplementation 2,730 55.41% 2,675 54.60%
Postpartum women initiated breastfeeding within hour after giving birth ... ... 2,650 54.09%
The proportion of pregnant women with 4 or more prenatal visits lowered by 1.34 percentage points, from 50.92 percent in 2018 to 49.58 percent in 2018.
The proportion of pregnant women given TT2 Plus lowered by 2.23 percent, from a registered 52.91 in 2017 to 50.68 percent in 2018.
Pregnant women given complete iron with folic acid decreased to 50.81 percent in 2018, lower by 0.17 percentage points compared to 2017 with a rate of 50.98 percent.
The proportion of postpartum women with at least 2 postpartum visits is lesser by 0.9 percentage points in 2018, registering 54.75 percent compared to its 2017 rate at 55.65 percent.
Postpartum women given complete iron supplementation increased by 1.19 percentage points in 2018 at a rate of 54.87 percent from 53.68 percent in 2017.
The proportion of postpartum women given vitamin A supplementation decreased by 0.81 percentage points in 2018 with 54.60 percent compared to 2017 with a rate of 55.41 percent.
In 2018 there were 54.09 percent of postpartum women who initiated breastfeeding within an hour after giving birth, while there was no record in 2017.
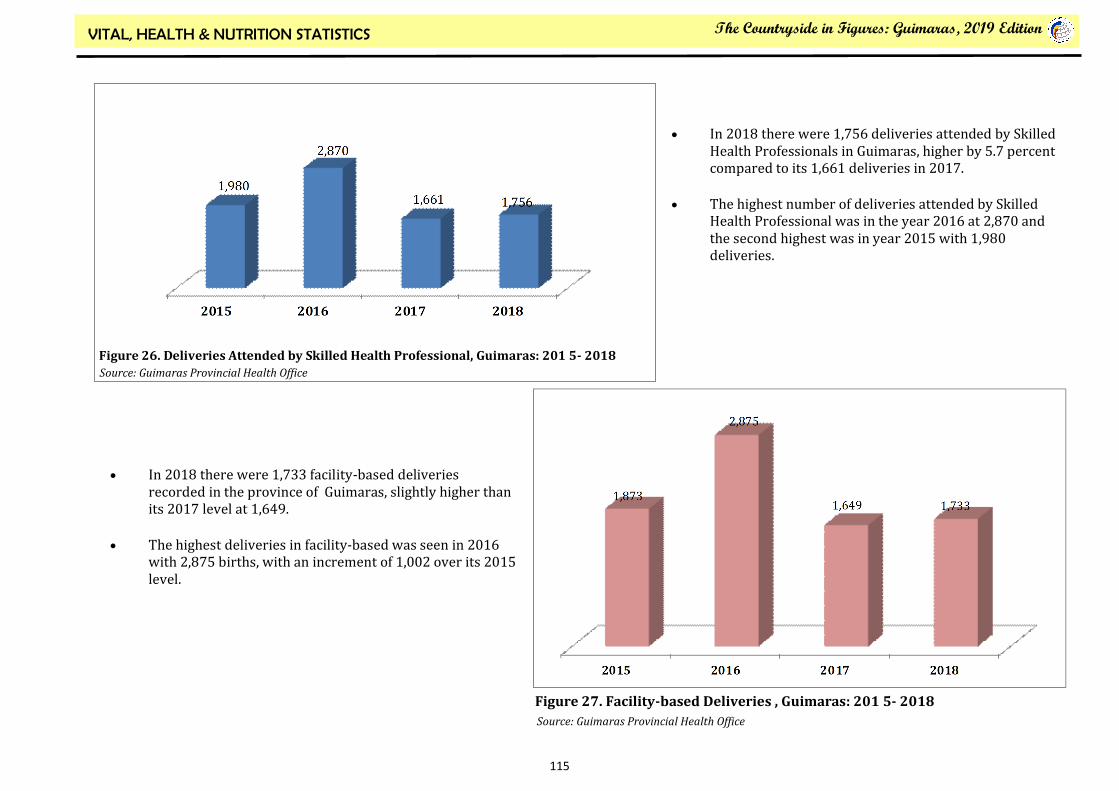
115
The Countryside in Figures: Guimaras, 2019 Edition VITAL, HEALTH & NUTRITION STATISTICS
Source: Guimaras Provincial Health Office
Figure 26. Deliveries Attended by Skilled Health Professional, Guimaras: 201 5- 2018
In 2018 there were 1,756 deliveries attended by Skilled Health Professionals in Guimaras, higher by 5.7 percent compared to its 1,661 deliveries in 2017.
The highest number of deliveries attended by Skilled Health Professional was in the year 2016 at 2,870 and the second highest was in year 2015 with 1,980 deliveries.
Figure 27. Facility-based Deliveries , Guimaras: 201 5- 2018
Source: Guimaras Provincial Health Office
In 2018 there were 1,733 facility-based deliveries recorded in the province of Guimaras, slightly higher than its 2017 level at 1,649.
The highest deliveries in facility-based was seen in 2016 with 2,875 births, with an increment of 1,002 over its 2015 level.

116
The Countryside in Figures: Guimaras, 2019 Edition VITAL, HEALTH & NUTRITION STATISTICS
Figure 28. Proportion of Fully Immunized Children, Guimaras: 2017- 2018
Source: Guimaras Provincial Health Office
In 2018 , 65.63 percent of children were fully immunized in the province of Guimaras .
There were 3,162 recorded fully immunized children in 2017, lower compared to its 2018 figure with 3,215 children.
Figure 29. Proportion of Infants Exclusively Breastfeed until 6th Month (Target 50%), Guimaras: 201 7- 2018
Source: Guimaras Provincial Health Office
The Provincial Health Office of Guimaras succeeded in their targets of having 50% proportion of infants exclusively breastfed until the 6th month in 2018 as they reached 51.50 percent, higher by 1.79 percent over its 2017 level.

117
The Countryside in Figures: Guimaras, 2019 Edition VITAL, HEALTH & NUTRITION STATISTICS
Figure 30. Family Planning (Contraceptive Prevalence Rate Target-65%): Guimaras 2018
Source: Guimaras Provincial Health Office
2018
There were 15,059 couples in the province of Guimaras who engaged in family planning in the year 2018.
The highest family planning users was seen in the municipality of Nueva Valencia with 72.59 percent contraceptive prevalence rate.
Buenavista closely followed with 71.32 percent.
The least users of family planning in 2018 were noticed in the Municipality of Sibunag (58.22%), San Lorenzo (63.27%) and Jordan (64.59%) with contraceptive prevalence rate below the 65.00% target.

118
The Countryside in Figures: Guimaras, 2019 Edition VITAL, HEALTH & NUTRITION STATISTICS
Figure 31. Rate of Teenage pregnancy Per Municipality , 10-19 Y.O.: Guimaras 2018
Source: Guimaras Provincial Health Office
2018
There were 23 in every 100 teenagers in Guimaras who got pregnant at the age of 10-19 years old.
San Lorenzo topped among the municipalities with 30.74 percent teenage pregnancy rate.
Jordan followed with 28.49 percent.
Sibunag recorded the least with the rate of 18.00 percent.
Figure 32. Percentage of Teenage Pregnancy Per Municipality 10-19 Y.O Given Quality Prenatal Services: Guimaras 2018
Source: Guimaras Provincial Health Office
There were 79.63 percent of pregnant teenagers in Guimaras province who availed of quality prenatal services in 2018 .
The municipality of San Lorenzo registered 100.00 percent of pregnant teenagers provided with quality prenatal services.
Sibunag municipality followed with 92.10 percent.
The least percentage of pregnant teenagers provided with quality prenatal services was noticed in the Municipality of Buenavista with 60.71 percent.

119
The Countryside in Figures: Guimaras, 2019 Edition VITAL, HEALTH & NUTRITION STATISTICS
Table 74. Dental Care, Guimaras: 2017- 2018
Source: Guimaras Provincial Health Office
Indicators
2017 2018
Number Percentage Number Percentage
Orally fit children (12-741 mos.old) 701 2.85% 1,250 5.11%
Children 12-71 months old provided with BOHC 8,198 33.28% 11,317 100.00%
Adolescent and Youth (10-24 years old) provided with BOHC 3,683 6.73% 3,064 ...
Pregnant women provided with BOHC 1,249 26.06% 677 13.82%
Older Person 60 years old and above provided with BOHC 637 5.06% 659 5.26%
There were 1,250 orally fit children in the province of Guimaras in 2018, higher by 2.26 percentage points than its 2017 level.
In 2018, 100.00 percent of Children 12-71 months old were provided with B.Oral Health Care (BOHC).
There were 6.73 percent of Adolescent and Youth (10-24 years old) provided with BOHC in 2017, while there was no recorded dental care for adolescents and youth in 2018.
Also, 13.82 percent of pregnant women availed of the BOHC in Guimaras in 2018, lower than the 2017 beneficiaries with 26.06 percent.
Older Person 60 years old and above provided with BOHC reached 5.26 percent in 2018, slightly higher compared to its 2017 record with 5.06
percent.

120
The Countryside in Figures: Guimaras, 2019 Edition VITAL, HEALTH & NUTRITION STATISTICS
Source: Guimaras Provincial Health Office Figure 33. Nutrition Guimaras: 2018
There were 7,912 Children aged 12-59 months old given vitamin A in the province of Guimaras
Children 0-59 months availed of OPT reached at 18,172 in 2018.
Prevalence of wasted and severely wasted children 0-59 months old was at 2.10 percent.
Prevalence of stunted and severely stunted children 0-59 months old in the province was at 8.40 percent.
Prevalence of underweight and severely underweight children 0-59 months reached 212 or 3.12% in 2018.
Figure 34. TB Program, Guimaras: 2018
Source: Guimaras Provincial Health Office
The province of Guimaras conducted 1,484 national voluntary blood service program during 2018.
TB cases detection rate in the province of Guimaras was at 62.18 percent in 2018.

121
The Countryside in Figures: Guimaras, 2019 Edition VITAL, HEALTH & NUTRITION STATISTICS
Figure 35. HIV and AIDS Cases in Municipalities of, Guimaras: 201 7- 2018
Source: Guimaras Provincial Health Office
The province of Guimaras recorded a total of 60 HIV and AIDS cases during 2018, higher by 3.3 percent over its 2017 cases monitored.
Municipality of Jordan posted the highest cases with 25 cases, came second is the Municipality of Buenavista with 21 cases in the year 2018.
Sibunag and San Lorenzo got the same number of HIV and AIDS cases in 2018 with 5 cases each, while Nueva Valencia has 4 cases .

122
The Countryside in Figures: Guimaras, 2019 Edition VITAL, HEALTH & NUTRITION STATISTICS
Figure 36 . Number of Animal Bites Guimaras: 201 6- 2018
Source: Guimaras Provincial Health Office
The province of Guimaras registered 2,597 number of animal bites.
In 2017, there were 2,422 number of animal bites recorded, higher by 15.4 percent compared to 2016 data with 2,049 animal bites.
Figure 37 . Animal Bites Cases per Municipality Guimaras: 201 7- 2018
Source: Guimaras Provincial Health Office
The province of Guimaras got a total of 2,597 cases of animal bites
In three consecutive years, cases escalated every year, from 2,049 cases in 2016 to 2,422 in 2017, recording 15.4 percent higher, and finally reached its peak in 2018 at 2,597 cases.

123
The Countryside in Figures: Guimaras, 2019 Edition
CHAPTER 9. LABOR AND EMPLOYMENT

124
The Countryside in Figures: Guimaras, 2019 Edition ENVIRONMENT & NATURAL RESOURCES
Sources: Department of Labor and Employment Note: * No report on Shutdown or Retrenchment submitted to Guimaras Field Office VI
…. means no data available
For the past four years, there is only one incident of establishment shutdown in the province which was recorded in 2016 with 1 worker affected.
There was no report nor recorded incident of retrenchment for the years 2014, 2015 & 2017.
Number of Establishments and workers affected by Shutdown and Retrenchment, Guimaras, 2014-2017
Year Establishment Workers Affected
Total Shutdown Retrenchment Total Shutdown Retrenchment
2014 *
2015 *
2016 *
2017 *
1
1
...
1
1
…

125
The Countryside in Figures: Guimaras, 2019 Edition
CHAPTER 10. ENVIRONMENT & NATURAL RESOURCES
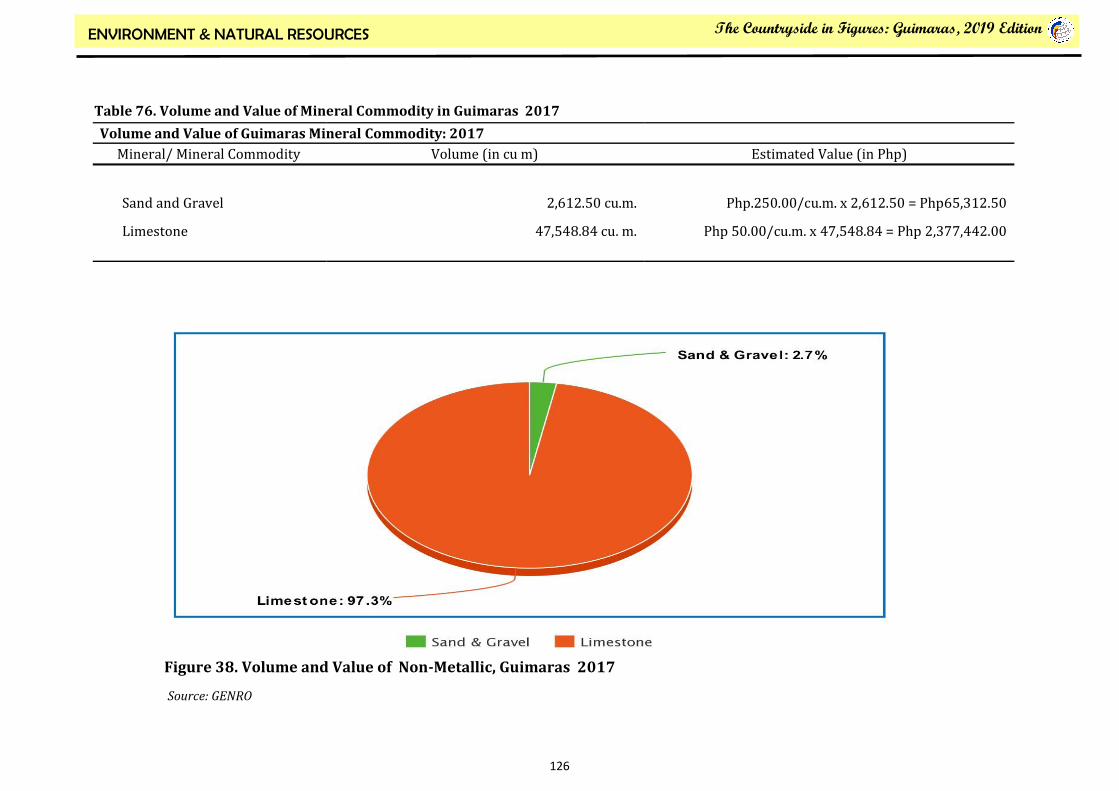
126
The Countryside in Figures: Guimaras, 2019 Edition ENVIRONMENT & NATURAL RESOURCES
Figure 38. Volume and Value of Non-Metallic, Guimaras 2017
Source: GENRO
Volume and Value of Guimaras Mineral Commodity: 2017
Mineral/ Mineral Commodity Volume (in cu m) Estimated Value (in Php)
Sand and Gravel
Limestone
2,612.50 cu.m.
47,548.84 cu. m.
Php.250.00/cu.m. x 2,612.50 = Php65,312.50
Php 50.00/cu.m. x 47,548.84 = Php 2,377,442.00
Table 76. Volume and Value of Mineral Commodity in Guimaras 2017
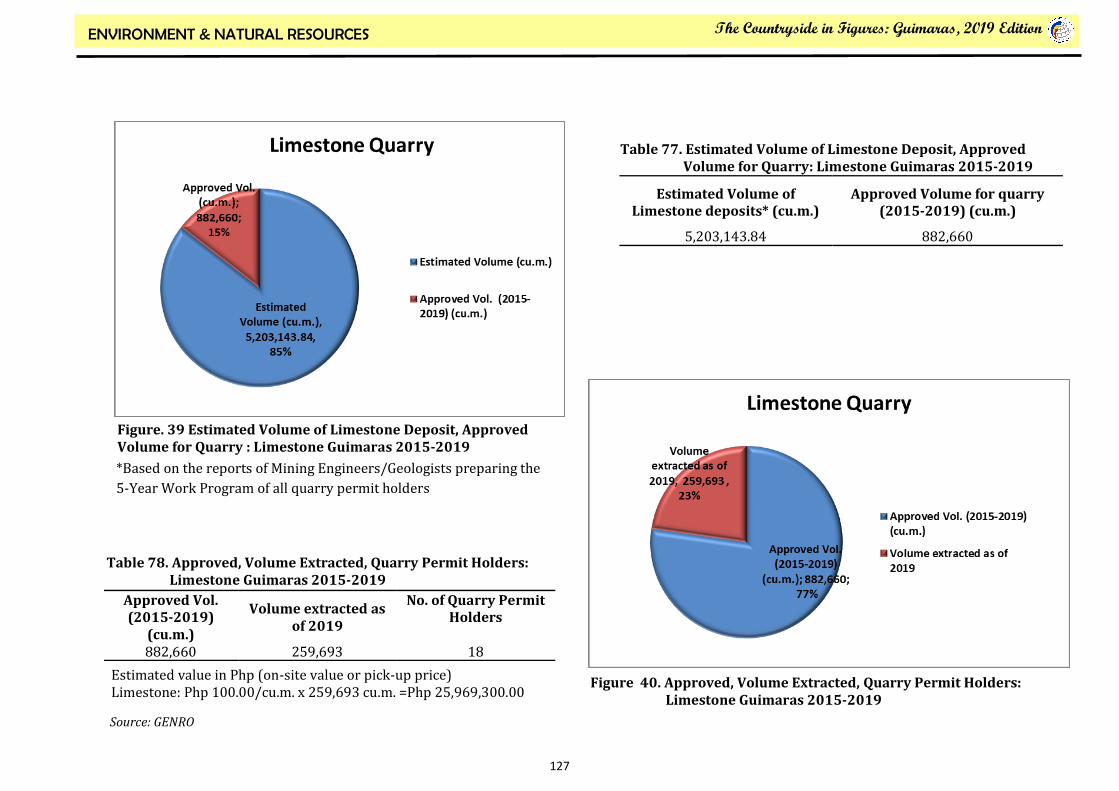
127
The Countryside in Figures: Guimaras, 2019 Edition ENVIRONMENT & NATURAL RESOURCES
Source: GENRO
Figure. 39 Estimated Volume of Limestone Deposit, Approved Volume for Quarry : Limestone Guimaras 2015-2019
Estimated Volume of Limestone deposits* (cu.m.)
Approved Volume for quarry (2015-2019) (cu.m.)
5,203,143.84 882,660
Table 77. Estimated Volume of Limestone Deposit, Approved Volume for Quarry: Limestone Guimaras 2015-2019
*Based on the reports of Mining Engineers/Geologists preparing the
5-Year Work Program of all quarry permit holders
Figure 40. Approved, Volume Extracted, Quarry Permit Holders: Limestone Guimaras 2015-2019
Approved Vol. (2015-2019)
(cu.m.)
Volume extracted as of 2019
No. of Quarry Permit Holders
882,660 259,693 18
Estimated value in Php (on-site value or pick-up price) Limestone: Php 100.00/cu.m. x 259,693 cu.m. =Php 25,969,300.00
Table 78. Approved, Volume Extracted, Quarry Permit Holders: Limestone Guimaras 2015-2019

128
The Countryside in Figures: Guimaras, 2019 Edition ENVIRONMENT & NATURAL RESOURCES
Source: GENRO
Figure41. Approved Volume, Volume Extracted, No. of Permit holders: CSAG Guimaras 2017-2018
Total approved volume 2017-2018
(cu.m.)
Total volume extracted as of
Dec. 2018 (cu.m.)
No. of permit holders
8500 1718 7
Figure 42. Approved Volume, Volume Extracted, No. of Permit holders: CSAG Guimaras 2018-2019
Total approved volume 2018-2019
(cu.m.)
Total volume extractedas of
Dec. 2019 (cu.m.)
No. of permit
holders
5000 758 4
Estimated value in Php (on-site value or pick-up price)
SAG: Php 550.00/cu.m. x 1,718 cu.m. = Php 944,900.00 (2018)
Php 550.00/cu.m. x 758 = Php 416,900.00 (2019)
Table 79. Approved Volume, Volume Extracted, No. of Permit holders: CSAG Guimaras 2017-2018
Table 80. Approved Volume, Volume Extracted, No. of Permit holders: CSAG Guimaras 2018-2019

129
The Countryside in Figures: Guimaras, 2019 Edition ENVIRONMENT & NATURAL RESOURCES
Source: GENRO
Figure 43. Estimated Volume, Approved Volume: CSAG Guimaras 2018-2019
Total Estimated Volume of Applied Areas (cu.m.) (2018-2019) Total approved volume 2018-2019 (cu.m.)
41,000 5,000
Table 81. Estimated Volume, Approved Volume: CSAG Guimaras 2018-2019

130
The Countryside in Figures: Guimaras, 2019 Edition ENVIRONMENT & NATURAL RESOURCES
For five consecutive years, 2017 had the most
number of ECC issuance, which was 9 times high- er
than 2015 and 10 times higher than 2016.
2016 issued the least number of ECCs.
2019 is second on the highest of ECCs issuance,
while 2018 is third on the line.
Table 82. Number of Environmental Compliance Certificate (ECC) Issued by DENR-EMB
Figure 44. Number of Environmental Compliance Certificates Issued: 2015-2019
Source: GENRO
Note: ECC issued to Quarry and CSAG Permits only.
Source: GENRO
2015 2016 2017 2018 2019
2 1 10 7 9

131
The Countryside in Figures: Guimaras, 2019 Edition ENVIRONMENT & NATURAL RESOURCES
Sources: National Mango Research and Development Centrer Note: … means no data available
In 2017, the highest temperature in Guimaras was recorded during the month of May at 30.25 °C, which is 2.05 °C higher than the
average temperature.
The lowest temperature however, was recorded in January at 22.13 °C, which is 6.07 °C lower than the average temperature.
Month
Total
Rainfall
(mm)
No. of
Rainy
Days
Air Temperature (°C ) Water Temperature (°C ) Relative
Humidity
(%)
Evaporation
(total mm &
tenth)
Minimum
Maximum Minimum
Maximum
January 3.68 12.00 22.13 25.87 ... ... 93.83 1.67
February 0.57 4.00 22.15 26.49 … ... 92.34 2.43
March 1.84 5.00 22.93 27.72 … … 89.37 2.61
April 2.56 7.00 24.02 30.00 … … 84.43 4.48
May 5.41 13.00 25.23 30.25 … … 85.59 2.08
June 6.08 13.00 24.70 29.23 … … 87.67 1.98
July 10.15 26.00 23.96 27.17 … … 93.33 0.88
August 14.02 20.00 24.16 28.45 … … 91.06 0.93
September 17.28 19.00 24.07 28.39 … … 91.92 1.25
October 15.86 21.00 23.78 28.24 … … 92.59 0.96
November 47.76 11.00 24.33 28.80 … … 91.15 1.84
December 2.92 16.00 23.42 27.84 … … 91.72 1.74
TOTAL 85.13 167.00 284.88 338.45 … … 1085.00 22.85
AVE. MEAN 7.09 13.92 23.74 28.20 ... ... 90.41 1.90
Table 83. Climatological Data: 2017

132
The Countryside in Figures: Guimaras, 2019 Edition ENVIRONMENT & NATURAL RESOURCES
Source: Guimaras Environment and Natural Resources Office (GENRO)
Note: - means for the establishment of a Sanitary Landfill
Guimaras disposal facility has a total of 15.5 hectares.
Nueva Valencia got the highest area of disposal facility with 5.4has., next is Buenavista with 4.0has, followed by Jordan with 3.5has. The lowest split
were from the municipalities f San Lorenzo and Sibunag with 1.6has and 1ha. disposal areas, respectively.
Table 84. List of existing disposal facility per LGU (2019)
LGU Location Area (ha) Type
Buenavista Sitio Kalalan, Brgy. Pin a 4.0 has. Eco-SWM Park with Residual Containment Area
Jordan Sitio Tanod, Brgy. Bugnay 3.5 has. Eco-SWM Park with Residual Containment Area
Nueva Valencia Sitio Bunlao, Brgy. Sto. Domingo 5.4 has. Eco-SWM Park with Residual Containment Area
San Lorenzo Brgy. Cabungahan 1.6 has. Eco-SWM Park with Residual Containment Area
Sibunag Brgy. Dasal 1 ha. Residual Containment Area

133
The Countryside in Figures: Guimaras, 2019 Edition ENVIRONMENT & NATURAL RESOURCES
Source: Guimaras Environment and Natural Resources (GENRO) Legend: Classification SB– Recreational Water Class I (Contact water Recreation), Tourist Zones (for ecotourism and recreational activities and, Fishery Water Class I (Fish spawning Grounds
Classification SC– Recreation Water Class II (boating etc.), Fishery Water Class II (Commercial and Sustenance Fishing and, Marshy and/or mangrove areas declared as fresh and wildlife sanctuaries.
Table 85. Guimaras Coastal Water Sampling Stations and Water Classification ILOILO STRAIT MONITORING STATIONS
Station No. Location Current Classification Beneficial Usage Recommended Classification
1 Jordan Wharf, Brgy. Rizal, Jordan Class SC Boating and Fishing Class SC 2 Colmenares Beach Resort, Brgy.
Hoskyn, Jordan Class SB Recreational water Class I Class SB
3 Between Puyo Wharf, Nueva Valencia and Lawi, Jordan
Class SB Boating and Fishing Class SB
4 Rico Beach Resort, Brgy. Poblacion, Nueva Valencia
Class SB Recreational water Class I Class SB
5 So. Laktawan, Brgy. Poblacion, Nueva Valencia
Class SB Boating and Fishing Class SB
6 Cabalagnan Wharf, Brgy. Cabalagnan, Nueva Valencia
Class SC Boating and Fishing Class SC
GUIMARAS STRAIT MONITORING STATIONS Station No. Location Current Classification Beneficial Usage Classification
1 Brgy. Igdarapdap, Nueva Valencia Class SB Fishery Water Class III Class SC 2 So. Barasan, Alegria, Sibunag Class SB Boating and Fishing Class SB 3 Suclaran Wharf, Brgy. Suclaran, San Lo-
renzo Class SC Boating and Fishing Class SC
4 Abelardo's Beach Resort, Brgy. East Va-lencia, Buenavista
Class SB Recreational water Class I Class SB
5 Roca Encanatada, Brgy. San Miguel, Buenavista
Class SB Fishery Water Class I Class SB
6 Buenavista Wharf, Brgy. Sto. Rosario, Buenavista
Class SC Boating and Fishing Class SC
7 Pamanculan Fish Sanctuary, So. Guma-wod, Brgy. San Isidro, Sibunag
New Station Protected waters Class SA
8 Brgy. Cabano, San Lorenzo (Cabano Riv-er mouth)
New Station Boating and Fishing Class SC

134
The Countryside in Figures: Guimaras, 2019 Edition ENVIRONMENT & NATURAL RESOURCES
Source: Guimaras Environment and natural Resources (GENRO) Note: - means nil or zero Legend: Dissolve Oxygen (DO) Temperature and pH are within the standard of Class SB and SC waters. Oil and Grease concentration is compliant to Class SC waters. Fecal coliform concentration is non-compliant to the standard.
Table 86. Water Quality Standards Comparative Results (2019 and 2017)
DO (mg/L) Oil & Grease (mg/L) Fecal Coliform (MPN/100 mL)
Iloilo Strait 2017 2019 2017 2019 2017 2019
Jordan Wharf 6.3 6 3.5 2.25 5,031 889
Colmenares Beach Resort 6.25 5.9 1.8 0.75 258 1,029
Between Puyo and Lawi 6.33 5.9 1.5 0.667 623 288
Rico Beach Resort 6.8 5.9 2.3 0 167 86
So. Laktawan, Brgy. Poblacion 6.48 5.7 3.8 2.667 3,404 1,088
Buenavista Wharf 6.9 6.7 1.5 2.5 479 1,353
Guimaras Strait
Brgy. Igdarapdap 6.8 6 6 1 3,372 1,399
So. Barasan, Alegria 7.2 6.9 6.3 1.3 577 212
Suclaran Wharf 7.1 6.2 3 2 1,537 404
Abelardos Beach Resort 7.5 6.6 4.7 3 12 108
Roca Encantada 6.7 6.5 2 3 201 331
Cabalagnan Wharf 7.2 6.2 2.3 0 114 226
Pamanculan Fish Sanctuary 6.8 6.4 4.5 2.8 41 56
Cabano River (mouth) 7.3 6.6 2 1.8 192 5,289

135
The Countryside in Figures: Guimaras, 2019 Edition ENVIRONMENT & NATURAL RESOURCES
Source: Guimaras Environment and Natural Resources (GENRO) Legend: Classification SB– Recreational Water Class I (Contact water Recreation), Tourist Zones (for ecotourism and recreational activities and, Fishery Water Class I (Fish spawning Grounds
Classification SC– Recreation Water Class II (boating etc.), Fishery Water Class II (Commercial and Sustenance Fishing and, Marshy and/or mangrove areas declared as fresh and wildlife sanctuaries.
Dissolve Oxygen (DO) Temperature and pH are within the standard of Class SB and SC waters. Oil and Grease concentration is compliant to Class SC waters. Fecal coliform concentration is non-compliant to the standard.
Table 87. Water Quality Standards of 1990 and 2016
DAO 1900-34 AND DAO 2016-08
Parameters Unit Class SA Class SB Class SC Class SD
1990 2016 1990 2016 1990 2016 1990 2016
Temperature °C 3 °C rise 26-30 3 °C rise 26 – 30 3 °C rise 25 - 31 3 °C rise 25-32
pH 6.5-8.5 7.0-8.5 6.0-8.5 7.0 – 8.5 6.0-8.5 6.5 – 8.5 6.0-9.0 6.0-9.0
Dissolved Oxygen mg/L 5.0 6 5.0 6 5.0 5 2.0 5
Oil and Grease mg/L 1 1 2 2 3 3 5 5
Total Coliform MPN/100 mL 70 1,000 1,000 5,000 5,000 -
Fecal Coliform MPN/100 mL - <1.1 200 100 - 200 - 400

136
The Countryside in Figures: Guimaras, 2019 Edition ENVIRONMENT & NATURAL RESOURCES
Source: Guimaras Environment and Natural Resources (GENRO) Note: - means nil or zero Legend: Classification SB– Recreational Water Class I (Contact water Recreation), Tourist Zones (for ecotourism and recreational activities and, Fishery Water Class I (Fish Spawning Grounds).
Classification SC– Recreation Water Class II (boating etc.), Fishery Water Class II (Commercial and Sustenance Fishing and, Marshy and/or mangrove areas declared as fresh and wildlife sanctuaries.
Dissolve Oxygen (DO) Temperature and pH are within the standard of Class SB and SC waters. Oil and Grease concentration is compliant to Class SC waters. Fecal coliform concentration is non-compliant to the standard.
Municipality Sampling Station Classification Temp.
(⁰C rise) pH
DO
(mg/L)
Oil &
Grease
(mg/L)
Fecal
Coliform
(MPN/100
mL)
Buenavista
Buenavista Wharf., Brgy., Sto. Rosario
Abelardo’s Beach Resort, Brgy., East Valencia
Roca Encantada, Brgy., San Miguel
SC
SB
SB
25-31
26-30
26-30
6.5-8.5
7.0-8.5
7.0-8.5
6.90
7.5
6.7
1.5
4.7
2.0
479.3
12.3
200.7
Jordan
Jordan Wharf, Brgy., Rizal
Colmenares Mountain Beach Resort, Brgy., Hoskyn
SC
SB
25-31
26-30
6.5-8.5
7.0-8.5 6.13
6.25
3.5
1.8
5,031
258
Nueva Valencia
Between Puyo and Lawi,
Rico Beach Resort, Brgy., Poblacion
Sitio Laktawan, Brgy., Publacion\
Brgy., Igdarapdap
Cabalagnan Wharf, Brgy., Cabalagnan
SB
SB
SB
SB
SC
26-30
26-30
26-30
26-30
25.31
7.0-8.5
7.0-8.5
7.0-8.5
7.0-8.5
6.5-8.5
6.33
6.80
6.48
6.8
7.2
1.5
2.3
3.8
6.0
2.3
623
167
3,404
3,372.0
114.0
San Lorenzo
Suclaran Wharf, Brgy., Suclaran
Pamanculan Fish Sanctuary
Cabano mouth of the river
SC
-
-
25-31
-
-
6.5-8.5
-
-
7.1
6.8
7.3
3.0
4.5
2.0
1,536.7
41.3
191.5
Sibunag Sitio, Barasan, Brgy., Alegria
SB
26-30
7.0-8.5
7.2
6.3
576.7
Table 88. Water Quality Monitoring Result: 2016

137
The Countryside in Figures: Guimaras, 2019 Edition ENVIRONMENT & NATURAL RESOURCES
Figure 45. Dissolved Oxygen Annual Comparative Results Iloilo Strait
Source: GENRO
Figure 46. Dissolved Oxygen Annual Comparative Results Guimaras Strait
Source: GENRO

138
The Countryside in Figures: Guimaras, 2019 Edition ENVIRONMENT & NATURAL RESOURCES
Figure 47. Oil and Grease Annual Comparative Results Iloilo Strait
Source: GENRO
Figure 48. Oil and Grease Annual Comparative Results Guimaras Strait
Source: GENRO

139
The Countryside in Figures: Guimaras, 2019 Edition ENVIRONMENT & NATURAL RESOURCES
Figure 50. Fecal Coliform Annual Comparative Results Guimaras Strait
Source: GENRO
Figure 49. Fecal Coliform Annual Comparative Results Iloilo Strait
Source: GENRO

140
The Countryside in Figures: Guimaras, 2019 Edition
CHAPTER 11. AGRICULTURE & AGRARIAN REFORM

141
The Countryside in Figures: Guimaras, 2019 Edition AGRICULTURE & AGRARIAN REFORM
Source: http://openstat.psa.gov.ph
In 2018, the largest crop production of Guimaras is Coconut with 33,974.50 metric tons, revealing an increment of about 10.74 percent over its 2017 level.
Cacao had the largest increase of 267.39 percent in 2018. Chrysanthemum production from 2017 to 2018 decreased by 30.00 percent.
Selected crops production for the past four years showed erratic trend, the lowest production was recorded in 2016 while the highest was in 2018.
Guimaras produced a total of 126,546.80 metric tons of selected crops from 2015 to 2018, with a 10.39 increase on the production from 2017 to 2018.
Volume of Production of Other Crops (in Metric Tons): 2015-2018
Crop 2015 2016 2017 2018
Cacao 2.12 2.23 2.30 8.45
Cashew (ripe fruit with nut) 622.68 567.74 597.01 543.49
Chrysanthemum 0.12 0.11 0.10 0.07
Coconut (with husk) 29,908.58 29,566.85 30,677.29 33,974.50
Coffee (dried berries) 10.24 7.31 6.85 7.40
Coffee Arabica (dried berries) 0.24 0.16 0.14 ..
Coffee Liberica (dried berries) 0.19 0.15 0.13 ..
Coffee Robusta (dried berries) 9.81 7.00 6.58 7.40
Gladiola 0.07 0.08 0.08 0.09
Orchids 1.41 1.35 1.77 2.05
Pili Nut (with shell) 0.12 0.10 0.15 0.17
Roses 0.58 0.37 0.50 0.62
Table 89. Volume of Production of Other Crops in Guimaras: 2015-2018

142
The Countryside in Figures: Guimaras, 2019 Edition AGRICULTURE & AGRARIAN REFORM
Figure 51. Volume of Production of Other Crops (in Metric Tons): 2015-2018
Source: http://openstat.psa.gov.ph
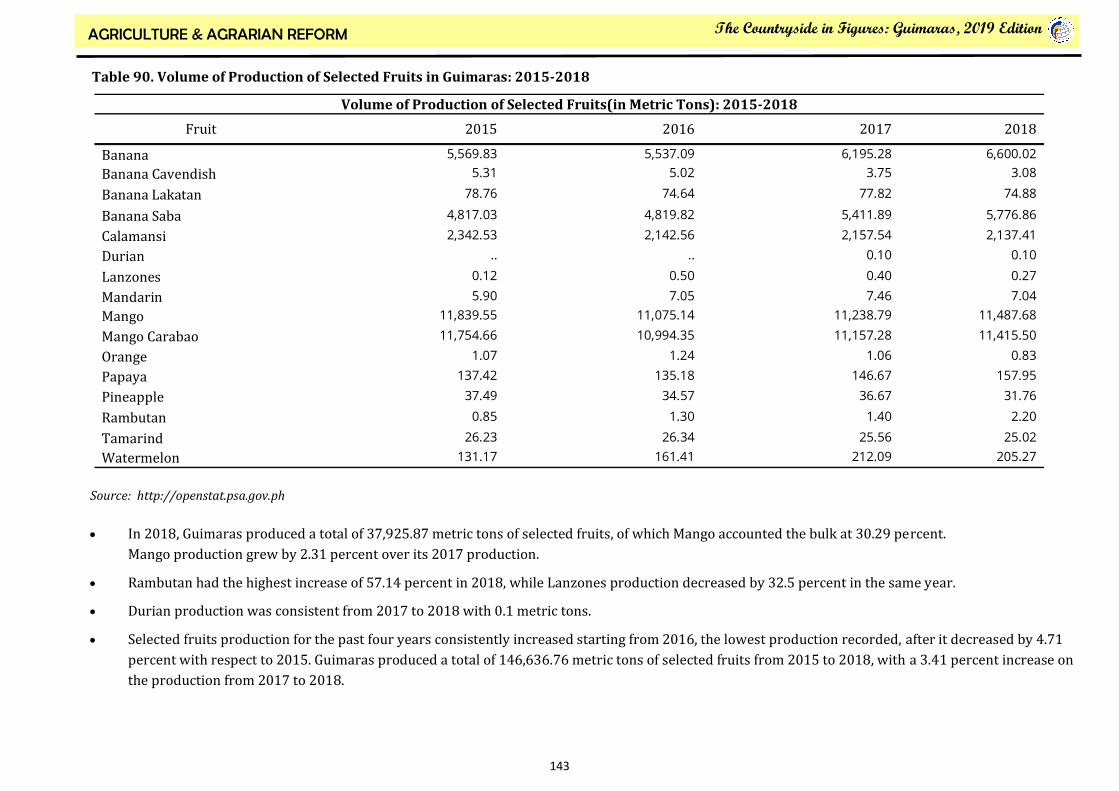
143
The Countryside in Figures: Guimaras, 2019 Edition AGRICULTURE & AGRARIAN REFORM
Source: http://openstat.psa.gov.ph
In 2018, Guimaras produced a total of 37,925.87 metric tons of selected fruits, of which Mango accounted the bulk at 30.29 percent.
Mango production grew by 2.31 percent over its 2017 production.
Rambutan had the highest increase of 57.14 percent in 2018, while Lanzones production decreased by 32.5 percent in the same year.
Durian production was consistent from 2017 to 2018 with 0.1 metric tons.
Selected fruits production for the past four years consistently increased starting from 2016, the lowest production recorded, after it decreased by 4.71
percent with respect to 2015. Guimaras produced a total of 146,636.76 metric tons of selected fruits from 2015 to 2018, with a 3.41 percent increase on
the production from 2017 to 2018.
Volume of Production of Selected Fruits(in Metric Tons): 2015-2018
Fruit 2015 2016 2017 2018
Banana 5,569.83 5,537.09 6,195.28 6,600.02
Banana Cavendish 5.31 5.02 3.75 3.08
Banana Lakatan 78.76 74.64 77.82 74.88
Banana Saba 4,817.03 4,819.82 5,411.89 5,776.86
Calamansi 2,342.53 2,142.56 2,157.54 2,137.41
Durian .. .. 0.10 0.10
Lanzones 0.12 0.50 0.40 0.27
Mandarin 5.90 7.05 7.46 7.04
Mango 11,839.55 11,075.14 11,238.79 11,487.68
Mango Carabao 11,754.66 10,994.35 11,157.28 11,415.50
Orange 1.07 1.24 1.06 0.83
Papaya 137.42 135.18 146.67 157.95
Pineapple 37.49 34.57 36.67 31.76
Rambutan 0.85 1.30 1.40 2.20
Tamarind 26.23 26.34 25.56 25.02
Watermelon 131.17 161.41 212.09 205.27
Table 90. Volume of Production of Selected Fruits in Guimaras: 2015-2018
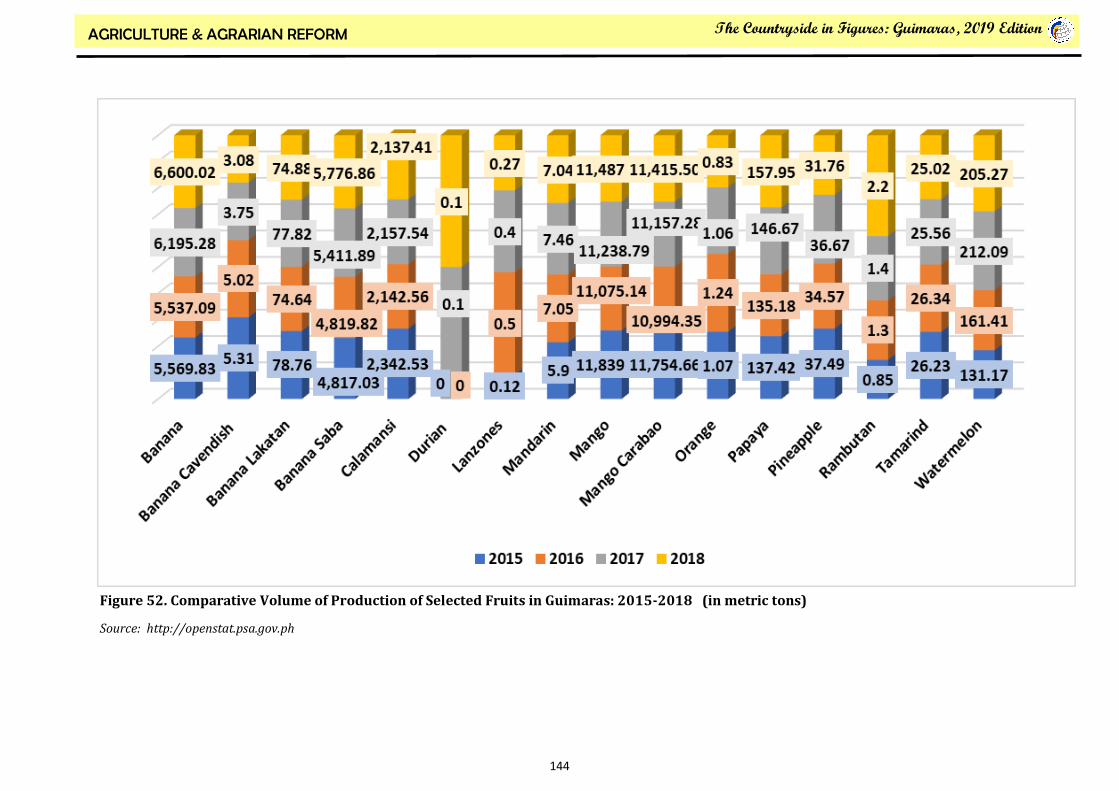
144
The Countryside in Figures: Guimaras, 2019 Edition AGRICULTURE & AGRARIAN REFORM
Figure 52. Comparative Volume of Production of Selected Fruits in Guimaras: 2015-2018 (in metric tons)
Source: http://openstat.psa.gov.ph
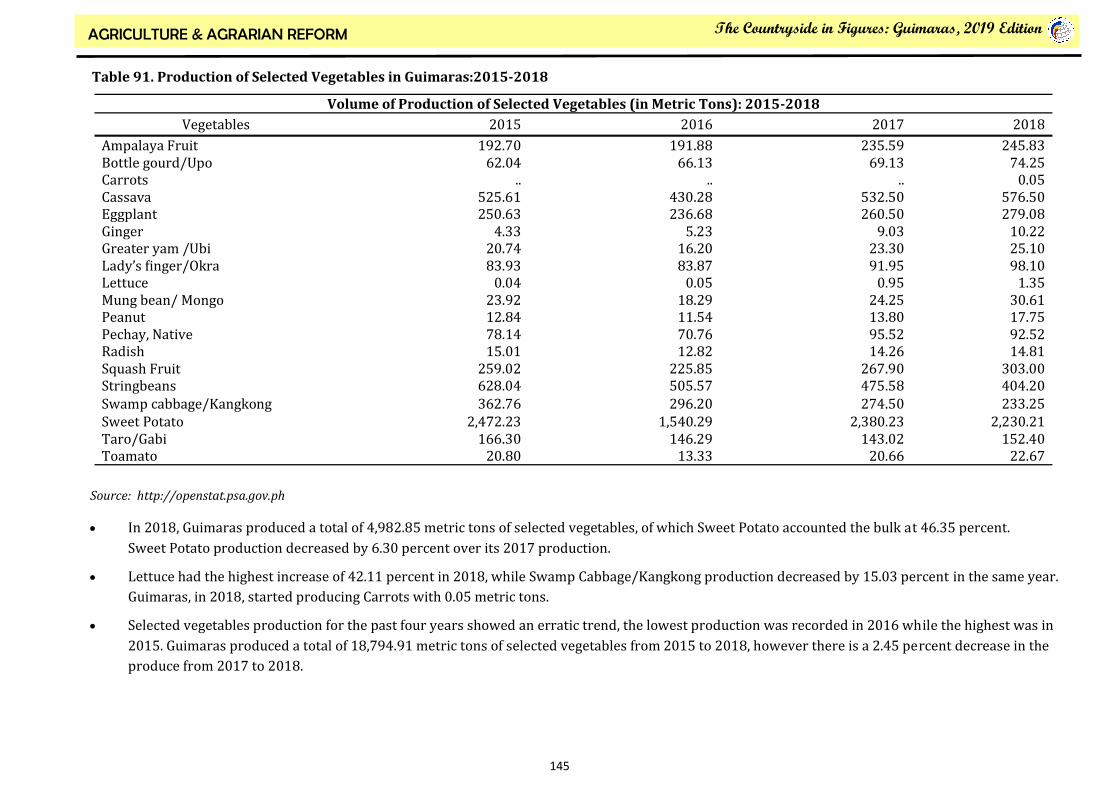
145
The Countryside in Figures: Guimaras, 2019 Edition AGRICULTURE & AGRARIAN REFORM
Source: http://openstat.psa.gov.ph
In 2018, Guimaras produced a total of 4,982.85 metric tons of selected vegetables, of which Sweet Potato accounted the bulk at 46.35 percent.
Sweet Potato production decreased by 6.30 percent over its 2017 production.
Lettuce had the highest increase of 42.11 percent in 2018, while Swamp Cabbage/Kangkong production decreased by 15.03 percent in the same year.
Guimaras, in 2018, started producing Carrots with 0.05 metric tons.
Selected vegetables production for the past four years showed an erratic trend, the lowest production was recorded in 2016 while the highest was in
2015. Guimaras produced a total of 18,794.91 metric tons of selected vegetables from 2015 to 2018, however there is a 2.45 percent decrease in the
produce from 2017 to 2018.
Volume of Production of Selected Vegetables (in Metric Tons): 2015-2018
Vegetables 2015 2016 2017 2018
Ampalaya Fruit 192.70 191.88 235.59 245.83 Bottle gourd/Upo 62.04 66.13 69.13 74.25 Carrots .. .. .. 0.05 Cassava 525.61 430.28 532.50 576.50 Eggplant 250.63 236.68 260.50 279.08 Ginger 4.33 5.23 9.03 10.22 Greater yam /Ubi 20.74 16.20 23.30 25.10 Lady’s finger/Okra 83.93 83.87 91.95 98.10 Lettuce 0.04 0.05 0.95 1.35 Mung bean/ Mongo 23.92 18.29 24.25 30.61 Peanut 12.84 11.54 13.80 17.75 Pechay, Native 78.14 70.76 95.52 92.52 Radish 15.01 12.82 14.26 14.81 Squash Fruit 259.02 225.85 267.90 303.00 Stringbeans 628.04 505.57 475.58 404.20 Swamp cabbage/Kangkong 362.76 296.20 274.50 233.25 Sweet Potato 2,472.23 1,540.29 2,380.23 2,230.21 Taro/Gabi 166.30 146.29 143.02 152.40 Toamato 20.80 13.33 20.66 22.67
Table 91. Production of Selected Vegetables in Guimaras:2015-2018

146
The Countryside in Figures: Guimaras, 2019 Edition AGRICULTURE & AGRARIAN REFORM
Source: Philippine Statistics Authority, RSET 2016
Figure 53. Comparative Volume of Production of Selected Vegetables in Guimaras: 2015-2018 (in metric tons)

147
The Countryside in Figures: Guimaras, 2019 Edition AGRICULTURE & AGRARIAN REFORM
Sources: http://openstat.psa.gov.ph
Palay and corn are among the top major commodities of Guimaras province. The highest Palay production was recorded in 2017 at 55,322 metric tons,
while the biggest drop of 17.34 percent was noted in 2018.
For the past four years Palay production was unstable. It started to recover in 2015 up to 2017 band once again dropped in 2018.
On the other hand, Corn production in 2018 intensified with 2,461 metric tons, revealing a 121.51 percent increment compared to the 1,111 metric tons
produced in 2017. 2018 has the highest Corn production in five years, while 2015 has the lowest with 637 metric tons.
Overall, Guimaras produced 48,189 metric tons of Corn and Palay in the last four years with a significant drop in both Palay and Corn production in
2018.
Palay and Corn Production : 2015-2018 (in MT)
Commodity/ Indicator 2015 2016 2017 2018
Irrigated Palay 10,182.00 9,256.00 12,009.00 11,307.00
Rainfed Palay 29,972.00 33,393.00 43,313.00 34,421.00
Palay 40,154.00 42,649.00 55,322.00 45,728.00
White Corn 425.00 350.70 695.00 752.00
Yellow Corn 212.00 445.75 416.00 1,709.00
Corn 637.00 796.45 1,111.00 2,461.00
Table 92. Palay and Corn Production by Ecosystem/Croptype in Guimaras: 2015-2018

148
The Countryside in Figures: Guimaras, 2019 Edition AGRICULTURE & AGRARIAN REFORM
Source: http://openstat.psa.gov.ph
In 2018, Guimaras harvested 17,019 area of Palay and Corn, of which 95.15 percent is Palay. Area of Palay harvested had an decrease of about 18.48
percent in 2018 compared to 2017, while the area of Corn harvested increased by 57.63 percent.
Irrigated Palay has the lowest decrease of 5.42 percent in 2018, while Rainfed Palay got the highest decreased of 21.28 percent in the same year.
Area of Corn and Palay harvested in the last four years showed a fluctuating trend, the lowest production was recorded in 2016 with 15,754 and the
highest in 2017 with 20,388. Area of Corn and Palay harvested decrease by16.52 percent in 2018.
Palay and Corn Area Harvested : 2015-2018
Commodity/ Indicator 2015 2016 2017 2018
Irrigated Palay 2,938.00 2,808.00 3,507.00 3,317.00
Rainfed Palay 12,593.00 12,569.00 16,357.00 12,876.00
Palay 15,531.00 15,377.00 19,864.00 16,193.00
White Corn 299.00 218.00 372.00 341.00
Yellow Corn 86.00 159.00 152.00 485.00
Corn 385.00 377.00 524.00 826.00
Table 93. Palay and Corn Area Harvested by Ecosystem/Croptype in Guimaras: 2015-2018

149
The Countryside in Figures: Guimaras, 2019 Edition AGRICULTURE & AGRARIAN REFORM
Source: http://openstat.psa.gov.ph
As of January 1, 2019, Guimaras has a total of 486,815 poultry heads composed of chickens and ducks. Of the 472,261 chickens, 92.60 percent are
Native/Improved chickens. The province has 14,554 Backyard ducks.
Layer chickens increased by 5.33 percent in 2019, while Backyard ducks decreased by 2.32 percent in the same year. Chicken and Duck increased by
2.00 percent from 2018 to 2019.
Chicken and Duck Inventory by Type: Guimaras 2015-2019 (Period of January 1)
2015 2016 2017 2018 2019
Chicken
Broiler
Layer
Native/Improved
Duck ( in heads)
Backyard
Commercial
...
26,800
425,048
15,360
...
...
29,450
426,705
13,554
...
...
32,950
418,285
13,647
...
...
33,180
427,580
14,899
...
...
34,947
437,314
14,554
...
Table 94. Chicken and Duck Inventory by Type: Guimaras 2015-2019 (Period of January 1)

150
The Countryside in Figures: Guimaras, 2019 Edition AGRICULTURE & AGRARIAN REFORM
Source: http://openstat.psa.gov.ph
As of 2018, Guimaras has 2,311 Chicken and Duck with 1,197 Chicken Eggs and Duck Eggs. Production of Chicken decreased by 5.0 percent from 2017 to 2018, while, Chicken Eggs increased by 5.9 percent. Duck production, on the other hand, decreased by 36.8 percent from 2017 to 2018; but Duck Eggs increased by 60.00 percent.
Poultry and Eggs: Volume of Production by Poultry Products : Guimaras 2015-2018
2015 2016 2017 2018
Chicken
Chicken Eggs
Duck
Duck Eggs
2,365
1,127
23
7
2,337
1,143
19
9
2,420
1,119
19
10
2,299
1,185
12
16
Table 95. Poultry and Eggs: Volume of Production by Poultry Products : Guimaras 2015-2018

151
The Countryside in Figures: Guimaras, 2019 Edition AGRICULTURE & AGRARIAN REFORM
Source: http://openstat.psa.gov.ph
Guimaras registered a total of 65,945 livestocks in January 1, 2019, of which Swine counts for 25.13 percent of the total. Backyard swine increased by
1.64 percent in 2019 and Commercial swine grew by 103.61 percent in the same year.
Commercial goat had the highest increase in 2019 by 1,294.85 percent more than in 2018, but Backyard goat decreased by 15.31 percent.
Guimaras had a total of 458,240 livestock from 2015 to 2019. Livestock continually decreased starting from 2015 until 2018, but by 2019 livestock
increased by 42.27 percent. However, livestock total in 2019 is still 14.95 percent lower than in 2015.
Table 96. Livestock Inventory by Animal Type, by Farm Type: Guimaras 2015-2019 (Period of January1)
Livestock Inventory by Animal Type, by Farm Type: Guimaras 2015-2019 (Period of January1)
2015 2016 2017 2018 2019
Carabao Backyard 14,362 13,953 13,060 12,041 11,483
Commercial … … … … …
Cattle Backyard 17,347 17,942 16,228 15,254 14,454
Commercial 152 153 160 172 191
Goat Backyard 34,320 27,400 20,214 16,868 14,285
Commercial 109 142 113 97 1,353
Swine Backyard 43,958 39,760 26,657 22,623 22,994
Commercial 2,895 2,886 2,564 582 1,185

152
The Countryside in Figures: Guimaras, 2019 Edition AGRICULTURE & AGRARIAN REFORM
Source: http://openstat.psa.gov.ph
In 2018, Guimaras registered a total of 16,195 livestock slaughtered in slaughterhouses, of which 77.98 percent is Swine. Swine slaughtered decreased
by 6.3 percent over its number in 2017.
Cattle slaughtered in slaughterhouses increased by 13.9 percent from 2017 to 2018, while Carabao slaughtered decreased by 9.4 percent.
Guimaras slaughtered a total of 57,311 livestock from 2015 to 2018, with the 2018 number 2.6 percent lower than in 2017.
Table 97. Livestock Animals Slaughtered in Slaughterhouses by Animal Type: Guimaras 2015-2018
Livestock Animals Slaughtered in Slaughterhouses by Animal Type: Guimaras 2015-2018
2015 2016 2017 2018
Carabao 75 84 64 58
Cattle 2,577 2,834 3,076 3,504
Goat ... 1 5 4
Swine 8,998 9,928 13,474 12,629

153
The Countryside in Figures: Guimaras, 2019 Edition AGRICULTURE & AGRARIAN REFORM
Source: http://openstat.psa.gov.ph
Guimaras produced a total of 6,403 livestock in 2018, 69.45 percent of which are Goat. Compared with 2017, Goat production decreased by 4.21
percent.
Production of livestock in 2018 was 4.5 percent lower than in 2017, with Carabao production decreasing by 32.1 percent.
Volume production of livestock from 2016 to 2018 showed a decreasing trend. Production grew by 1.23 percent in 2016, but dropped in the following
years with an average decrease of 4.77 percent from 2015 to 2018.
Table 98. Livestock Volume of Production by Animal Type: Guimaras 2015-2018
Livestock: Volume of Production by Animal Type: Guimaras 2015-2018
2015 2016 2017 2018
Carabao 426 501 471 320
Cattle 1,416 1,489 1,418 1,441
Goat 4,793 4,729 4,530 4,447
Swine 377 379 289 195

154
The Countryside in Figures: Guimaras, 2019 Edition AGRICULTURE & AGRARIAN REFORM
Source: http://openstat.psa.gov.ph
Fisheries production is mainly composed of Municipal Fisheries and Aquaculture, and the bulk is contributed by the Municipal sector.
The Fisheries sector of Guimaras slightly improved in size from 8, 421 metric tons in 2015 to 8,949.24 metric tons in 2016, which is 6.27 percent high-
er than its total production from the previous year. The improvement was brought by the municipal fisheries sub-sector that went up by 8.14 per-
cent.
In 2017, fisheries production diminished to 8,644.83 metric tons from 8,949.24 metric tons in 2016. The drop was attributed to marine municipal
catch that declined by 14.18 percent, however inland municipal fisheries grew by 73.64 percent from 37.86 metric tons in 2016 to 65.74 metric tons in
2017.
In 2018, fisheries production dropped to 7,783.47 metric tons from 8,644.383 metric tons in 2017. The drop was still due to the decrement of marine
municipal catch which declined by 17.02 percent, however inland municipal fisheries still managed to enhance by 3.91 percent from 65.74 metric tons
in 2017 to 68.31 metric tons in 2018.
Aquaculture constantly increased in four consecutive years. From 2015 fish production, there was a 1.59 percent increment to 2,443.38 metric tons
recorded in 2016, likewise a 23.89 percent growth was seen in the 2017 production of 3,027.19 metric tons, and the trend continued on 2018 with 1.17
percent growth rate.
Subsector
Volume of Fisheries Production by Subsector (in Metric Tons): Guimaras, 2015 - 2018
2015 2016 2017 2018
Fisheries
Municipal
Marine
Inland
Aquaculture
8, 421.21
6, 016.05
5, 983.90
32.15
2, 405.16
8, 949.24
6, 505.86
6, 468.00
37.86
2, 443.38
8, 6443.83
5, 616.64
5, 550.90
65.74
3, 027.19
7,783.47
4,674.28
4,605.97
68.31
3,109.19
Table 99. Volume of Production of Fisheries by Subsector: Guimaras 2015-2018

155
The Countryside in Figures: Guimaras, 2019 Edition AGRICULTURE & AGRARIAN REFORM
Source: http://openstat.psa.gov.ph
In 2018, the value of fish increased by 2.72 percent from 741,077.32 thousand in 2017.
Inland value of fish production increased by 26.61 percent in 2017 compared to its 2018 value; however, Marine production decreased by 1.51 percent
in the same year.
The decrease of Municipal fish value on 2017 and 2018 was due to the dwindled fish value of Marine subsector which posted at 498,737.87 thousand
in 2017 and 491,221.54 thousand in 2018
Only Inland subsector continuously grew its value in five consecutive years. The same with Aquaculture sector which posted an increasing value from
2017-2018 except for the drop of 8.44 percent form in 2016 which posted at 175,32.55 thousand from 191,453.43 thousand in 2015.
Subsector
Value of Fisheries Production by Subsector (in thousand): Guimaras, 2015 - 2018
2015 2016 2017 2018
Fisheries
Municipal
Marine
Inland
Aquaculture
682,693.41
491,239.98
489,160.60
2,079.38
191,453.43
743,697.38
568,394.83
565,439.29
2,955.54
175,302.55
741,077.32
506,389.24
498,737.87
7651.37
234,688.08
761,204.26
500,909.13
491,221.54
9,687.59
260,295.13
Table 100 . Value of Fisheries Production by Subsector: Guimaras 2015-2018
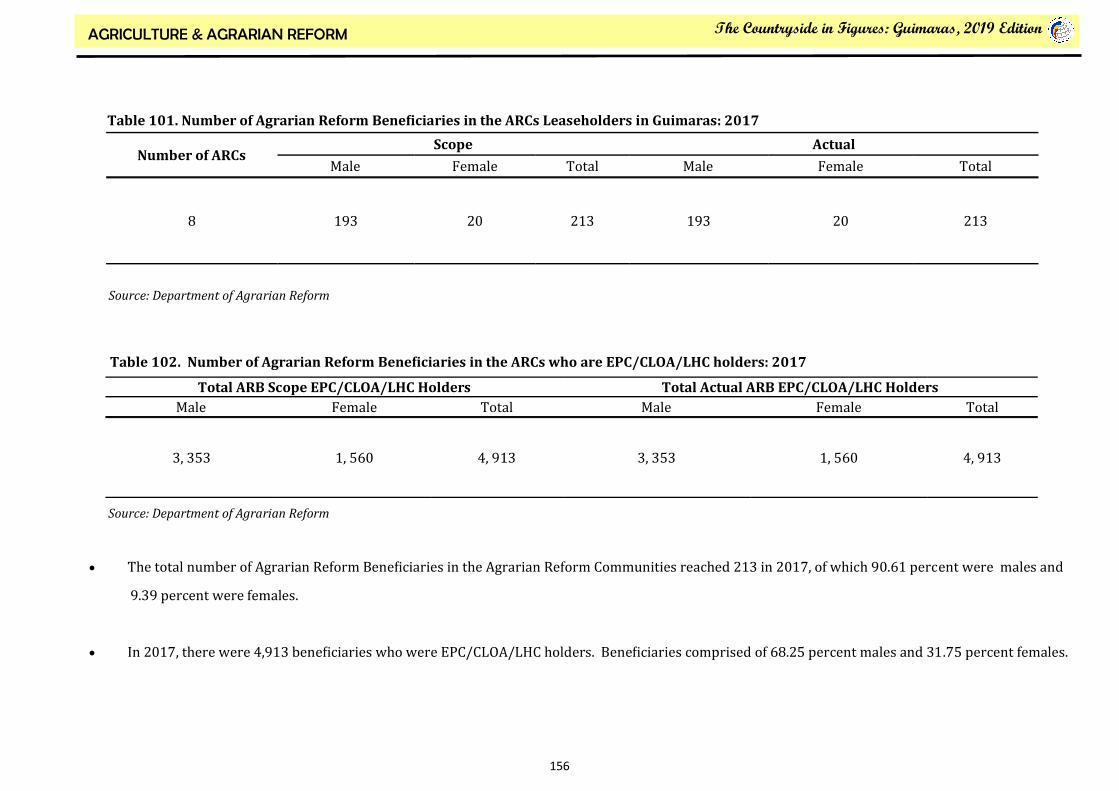
156
The Countryside in Figures: Guimaras, 2019 Edition AGRICULTURE & AGRARIAN REFORM
Source: Department of Agrarian Reform
Source: Department of Agrarian Reform
The total number of Agrarian Reform Beneficiaries in the Agrarian Reform Communities reached 213 in 2017, of which 90.61 percent were males and
9.39 percent were females.
In 2017, there were 4,913 beneficiaries who were EPC/CLOA/LHC holders. Beneficiaries comprised of 68.25 percent males and 31.75 percent females.
Number of ARCs Scope Actual
Male Female Total Male Female Total
8 193 20 213 193 20 213
Total ARB Scope EPC/CLOA/LHC Holders Total Actual ARB EPC/CLOA/LHC Holders
Male Female Total Male Female Total
3, 353 1, 560 4, 913 3, 353 1, 560 4, 913
Table 101. Number of Agrarian Reform Beneficiaries in the ARCs Leaseholders in Guimaras: 2017
Table 102. Number of Agrarian Reform Beneficiaries in the ARCs who are EPC/CLOA/LHC holders: 2017

157
The Countryside in Figures: Guimaras, 2019 Edition
CHAPTER 12. INDUSTRY
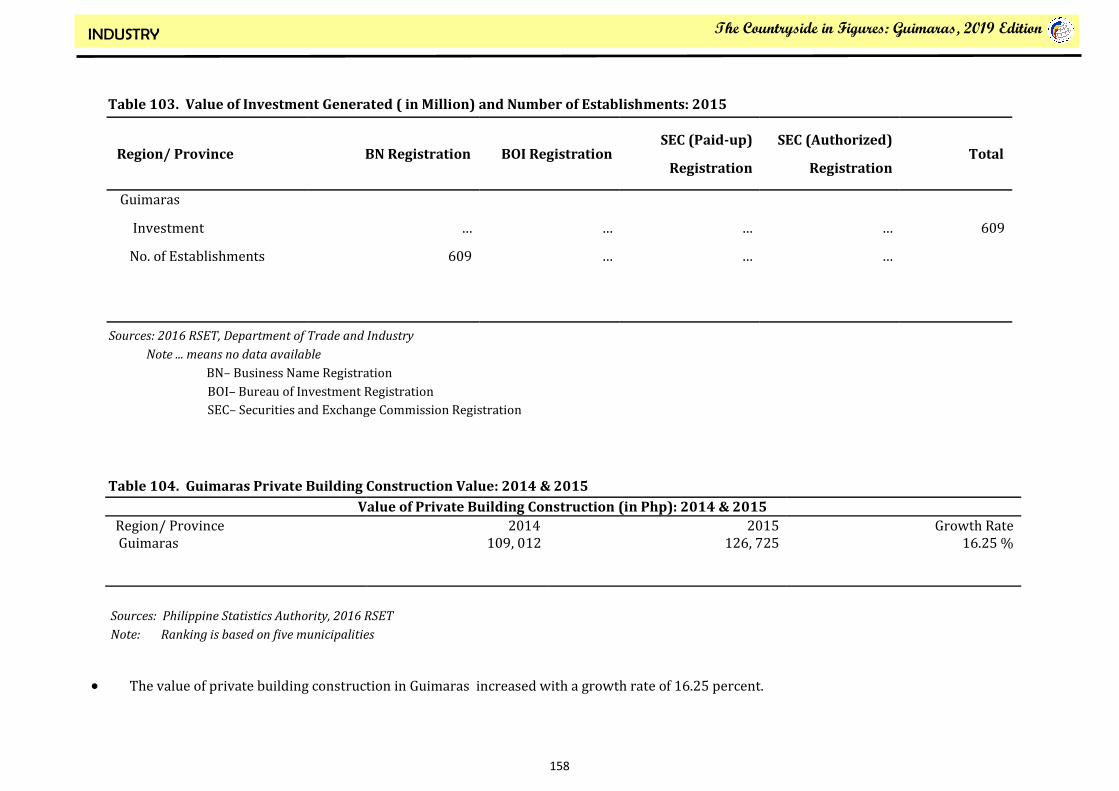
158
The Countryside in Figures: Guimaras, 2019 Edition INDUSTRY
Sources: Philippine Statistics Authority, 2016 RSET
Note: Ranking is based on five municipalities
The value of private building construction in Guimaras increased with a growth rate of 16.25 percent.
Region/ Province BN Registration BOI Registration SEC (Paid-up)
Registration
SEC (Authorized)
Registration Total
Guimaras
Investment
No. of Establishments
…
609
…
…
…
…
…
…
609
Table 103. Value of Investment Generated ( in Million) and Number of Establishments: 2015
Sources: 2016 RSET, Department of Trade and Industry
Note ... means no data available
BN– Business Name Registration
BOI– Bureau of Investment Registration
SEC– Securities and Exchange Commission Registration
Table 104. Guimaras Private Building Construction Value: 2014 & 2015
Value of Private Building Construction (in Php): 2014 & 2015
Region/ Province 2014 2015 Growth Rate Guimaras
109, 012 126, 725 16.25 %

159
The Countryside in Figures: Guimaras, 2019 Edition INDUSTRY
Source: Department of Trade and Industry
The number of original firms registered increased in 2017 with 1, 072 firms and 91 renewal firms registered.
Investments in 2017 significantly increased to Php1, 659, 754, 280 from a recorded Php299, 069, 500 in 2016, translating to 454.97
percent increment.
Investments and Number of Firms Registered: SY 2013-2017
Indicator 2013 2014 2015 2016 2017
Business Name Registration (BNR)
Investment (in Php)
No. of Firms Registered
Original
Renewal
152, 232,
500.00
641
72
136, 521,
702.00
691
69
103, 554, 700.00
...
567
49
299, 069, 500.00
...
502
97
1, 659, 754, 280.00
…
1,072
91
Table 105. Guimaras Investments and Number of Firms Registered

160
The Countryside in Figures: Guimaras, 2019 Edition
CHAPTER 13. INFRASTRUCTURE

161
The Countryside in Figures: Guimaras, 2019 Edition INFRASTRUCTURE
Source: Provincial Engineer’s Office, Province of Guimaras
Provincial roads in Guimaras are made of Concrete, Asphalt, and Gravel.
Roads made of Concrete accounted for 80.35 percent of the total provincial roads with total of 145,234 kilometers of provincial roads made of Concrete.
Only 1,262 kilometers were Asphalt. Part of which were in Calaya– Taras, Sibunag and Magamay– Pandaraonan, Dolores, Suoang– Navalas Provincial
Road Section, Calingao-Tacay Provincial Road Section , and Salvacion-Lanipe– Oracon Provincial Road Section .
Other area of provincial roads were Gravel which accounted for 34,256 killometers, translating to 18.95 percent of the totality.
Location
Length of Provincial Roads (in km) by Type : 1st Semester of 2018
Concrete Total Gravel Asphalt Earth
San Miguel– Sta Teresa– Sinapsapan Provincial Road Section
Sta. Teresa– Lawi Provincial Road Section
Salvacion– Zaldivar– Dagsaan Provincial Road Section
Concordia– Oracon– Botconaway Provincial Road Section
Calaya– Taras– Sibunag Provincial Road Section
Poblacion– Nueva Valencia Wharf Provincial Road Section
Magamay– Pandaraonan– Dolores Provincial Road Section
Lusong –Lapaz Provincial Road Section
Crossing Toring Lanipe Provincial Road
San Isidro-San Roque– Nazareth Provincial Road Section
Pina– Suclaran Provincial Road Section
4,458
4,621
2,908
9,373
3,598
1,130
3,022
2,423
456
4,354
10,674
8,919
6,000
4,453
9,373
5,700
1,130
5,149
2,423
2,806
5,011
10,705
4,461
1,379
1,545
0
1,712
0
1,572
0
2,350
657
31
0
0
0
0
390
0
555
0
0
0
0
0
0
0
0
0
0
0
0
0
0
0
Table 106. Length of Provincial Roads: Guimaras
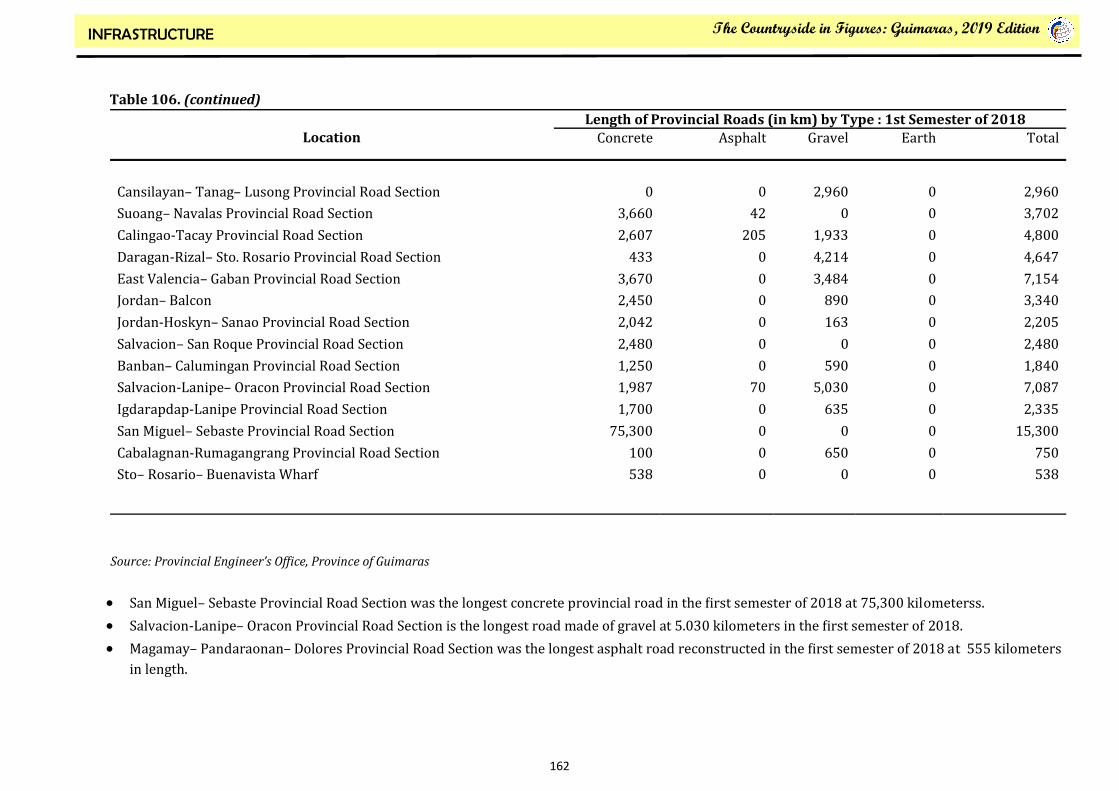
162
The Countryside in Figures: Guimaras, 2019 Edition INFRASTRUCTURE
Source: Provincial Engineer’s Office, Province of Guimaras
San Miguel– Sebaste Provincial Road Section was the longest concrete provincial road in the first semester of 2018 at 75,300 kilometerss.
Salvacion-Lanipe– Oracon Provincial Road Section is the longest road made of gravel at 5.030 kilometers in the first semester of 2018.
Magamay– Pandaraonan– Dolores Provincial Road Section was the longest asphalt road reconstructed in the first semester of 2018 at 555 kilometers
in length.
Table 106. (continued)
Location Length of Provincial Roads (in km) by Type : 1st Semester of 2018
Concrete Total Gravel Asphalt Earth
Cansilayan– Tanag– Lusong Provincial Road Section
Suoang– Navalas Provincial Road Section
Calingao-Tacay Provincial Road Section
Daragan-Rizal– Sto. Rosario Provincial Road Section
East Valencia– Gaban Provincial Road Section
Jordan– Balcon
Jordan-Hoskyn– Sanao Provincial Road Section
Salvacion– San Roque Provincial Road Section
Banban– Calumingan Provincial Road Section
Salvacion-Lanipe– Oracon Provincial Road Section
Igdarapdap-Lanipe Provincial Road Section
San Miguel– Sebaste Provincial Road Section
Cabalagnan-Rumagangrang Provincial Road Section
Sto– Rosario– Buenavista Wharf
0
3,660
2,607
433
3,670
2,450
2,042
2,480
1,250
1,987
1,700
75,300
100
538
2,960
3,702
4,800
4,647
7,154
3,340
2,205
2,480
1,840
7,087
2,335
15,300
750
538
2,960
0
1,933
4,214
3,484
890
163
0
590
5,030
635
0
650
0
0
42
205
0
0
0
0
0
0
70
0
0
0
0
0
0
0
0
0
0
0
0
0
0
0
0
0
0

163
The Countryside in Figures: Guimaras, 2019 Edition INFRASTRUCTURE
Source: Provincial Engineer’s Office, Province of Guimaras
In Guimaras, Hoskyn and Balcon have the longest
bridges of 29.650 meters and 27.650 meters,
respectively as of 2017.
Tacay got the shortest bridge accounted at 10.3
meters of the overall total of bridges in Guimaras
Province.
Inventory of Provincial Bridges: 2017
Name of Bridges Length (m)
Tacay Bridge
Balcon Bridge
Hoskyn bridge
Rizal Bridge
10.300
27.650
29.650
15.400
Table 107. Inventory of Provincial Bridges
Figure 54. Comparative data on the Inventory of Provincial Bridges: 2017

164
The Countryside in Figures: Guimaras, 2019 Edition
CHAPTER 14. TRANSPORTATION AND
COMMUNICATION

165
The Countryside in Figures: Guimaras, 2019 Edition TRANSPORTATION & COMMUNICATION
Number of Motor Vehicles Registered by Type: 2015-2017
Type 2015 2016 2017 2018
Cars
UVs
SUVs
Trucks
Buses
MC/TC
Trailers
Total
132
1,263
137
256
2
3,242
1
5,033
147
1,330
147
266
4
3,284
1
5,179
201
1,479
174
291
244
3,827
1
6,217
231
1,657
235
321
5
5,655
0
8,104
Table 108. Number of Motor Vehicles Registered by Type: Guimaras 2015-2017
Figure 55. Comparative Number of Registered Motor Vehicles, Guimaras: 2015-2018
Source: LTO Guimaras
Motorcycles/ Tricycles were the
most number of motor vehicles
registered in Guimaras province
comprising more than 65.25
percent of the total
motor vehicles registered every
year since 2015 to 2018.
UVs followed with a large gap
accounting to 23.35 percent on
the average.
Trailers shared the least portion
in the overall total of registered
vehicles in Guimaras from 2015-
2018.
Source: LTO Guimaras

166
The Countryside in Figures: Guimaras, 2019 Edition TRANSPORTATION & COMMUNICATION
Source: LTO, Guimaras
The total number of licenses and permits issued since 2015 to 2018 showed an increasing trend: an 80.71 percent increment was noted in 2016,
another 37.25 percent increment in 2017, and 35.95 percent of growth over its last years level.
The number of new issued licenses and permits also increased.
There is a greater ratio of males than females issued with licenses and permits.
More males were issued new and renewed driver’s licenses than females.
Number of Licenses and Permits Issued by Classification Type and by Sex, by Year: 2015-2018
Year Classification
Type
New Renewal Total Continuing
Male Female Male Female Male Female
2015
2016
2017
2018
Professional Non-Professional
Conductors SP
Total
Professional Non-Professional
Conductors SP
Total
Professional Non-Professional
Conductors SP
Total
Professional Non Professional
Conductors SP
Total
0 0 0
1,805 1,805
78 107 0
1,981 2,166
313 413 0
2,807 3,533
876 961 0
3,827 5,124
0 0 0
346 346
4 34 0
453 491
19 148 0
593 760
63 317 0
737 1,117
299 58 0 0
357
1,483 273 0 0
1,756
1,509 295 0 0
1,804
1,664 429 0 0
2,093
7 15 0 0 22
64 95 0 0
159
61 117 0 0
178
62 135 0 0
197
0 0 0 0 0 0 0 0 0 0 0 0 0 0 0 0 0 0 0 0
0 0 0 0 0 0 0 0 0 0 0 0 0 0 0 0 0 0 0 0
2,530
4,572
6,275
8,531
Table 109. Number of Licenses and Permits Issued by Classification and by Sex, Guimaras: 2015-2018

167
The Countryside in Figures: Guimaras, 2019 Edition TRANSPORTATION & COMMUNICATION
Guimaras Revenue Collections : 2015-2018
2015 2016 2017 2018
9,673,214.19 9,967,722 13,456,534.50 18,123,434.61
Table 110. LTO– Guimaras Revenue Collections: 2016-2018
Figure 56. Comparative Revenue Collections, LTO– Guimaras: 2015– 2018 Source: LTO, Guimaras
LTO– Guimaras revenue collections
significantly increased by 34.68 percent in
2018 over its collection in the previous
year.
Source: LTO, Guimaras

168
The Countryside in Figures: Guimaras, 2019 Edition TRANSPORTATION & COMMUNICATION
Source: 2017 Annual Report, NTC
Each municipality in Guimaras province has a single post office and mail carrier.
Number of Post Offices and Mail Carriers by Municipality : 2016 & 2017
Municipality
2016 2017
Post Offices Mail Carriers Post Offices Mail Carriers
Buenavista 1 1 1 1
Jordan (Capital) 1 1 1 1
Nueva Valencia 1 1 1 1
San Lorenzo 1 1 1 1
Sibunag 1 1 1 1
TOTAL 5 5 5 5
Table 111. Number of Post Offices, Guimaras : 2016-2017
169
The Countryside in Figures: Guimaras, 2019 Edition
CHAPTER 15. ENERGY
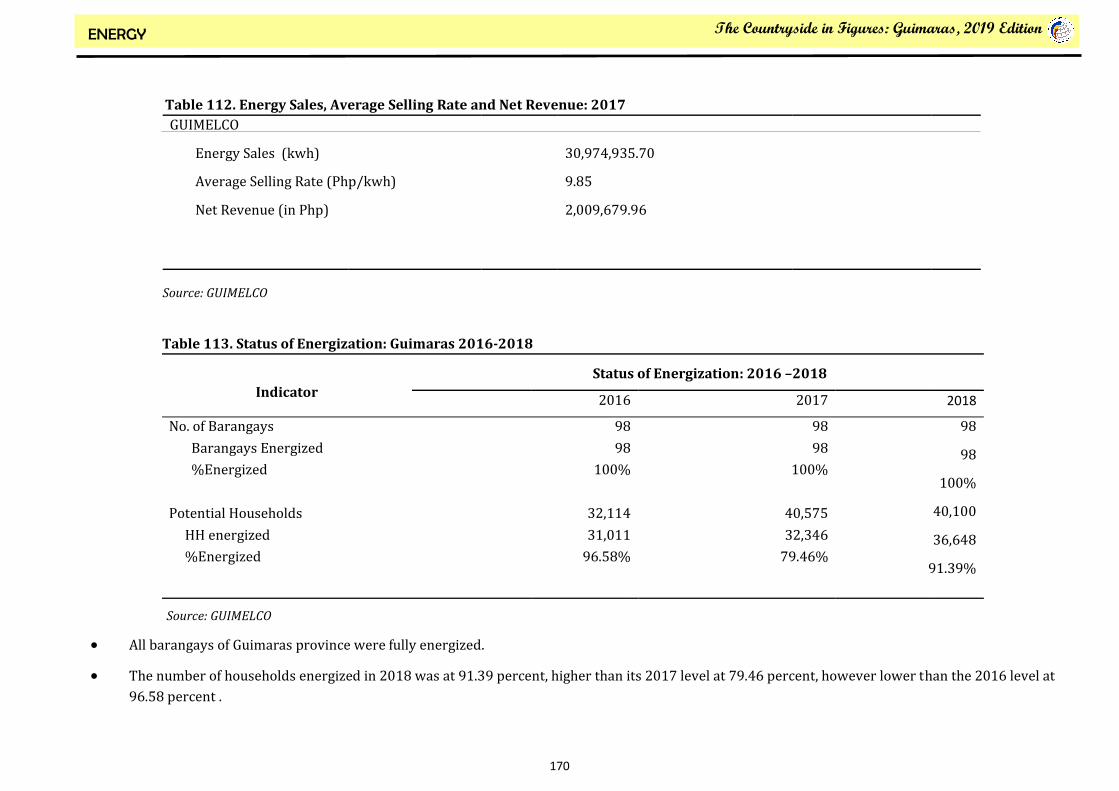
170
The Countryside in Figures: Guimaras, 2019 Edition ENERGY
Source: GUIMELCO Source: GUIMELCO
All barangays of Guimaras province were fully energized.
The number of households energized in 2018 was at 91.39 percent, higher than its 2017 level at 79.46 percent, however lower than the 2016 level at
96.58 percent .
GUIMELCO
Energy Sales (kwh)
Average Selling Rate (Php/kwh)
Net Revenue (in Php)
30,974,935.70
9.85
2,009,679.96
Indicator
Status of Energization: 2016 –2018
2016 2017 2018
No. of Barangays
Barangays Energized
%Energized
Potential Households
HH energized
%Energized
98
98
100%
32,114
31,011
96.58%
98
98
100%
40,575
32,346
79.46%
98
98
100%
40,100
36,648
91.39%
Table 112. Energy Sales, Average Selling Rate and Net Revenue: 2017
Table 113. Status of Energization: Guimaras 2016-2018

171
The Countryside in Figures: Guimaras, 2019 Edition ENERGY
Source: GUIMELCO
Residential buildings or households has a higher rate schedule in 2016 and 2017.
Commercial, Industrial, Streetlights and Public Buildings have the same rate schedules for both years.
GUIMELCO’s rate in 2017 decreased by 7.87 percent from Php12.699/ kwh in 2016 to Php11.0552/ kwh in 2017.
Residential rate was higher by 1.4913 pesos in 2016 and 1.5053 pesos in 2017 than commercial, industrial, street lights, metered, and public building rates.
GUIMELCO gave same rates/ kwh except for residential.
Rate Schedule for GUIMELCO (in Php): 2016-2017 Indicator
2016 2017
Residential Commercial Industrial Street Lights, Metered Public Bldg.
12.6990 11.2077 11.2077 11.2077 11.2077
11.0552 9.5499 9.5499 9.5499 9.5499
Table 114. GUIMELCO’S Rate Schedule (Php/kwh): 2016-2017
As of November 2018 Effective Rate
As of November 2018 Source: GUIMELCO
Table 115. Historical Average Rate (2015-2018)
Year Average Generation Rate Average Effective Rate
RES LV
2015 7.2132 13.4733 12.0487
2016 6.5511 12.6981 11.2077
2017 5.1322 11.0552 9.5499
2018* 4.8079 10.9888 9.6202
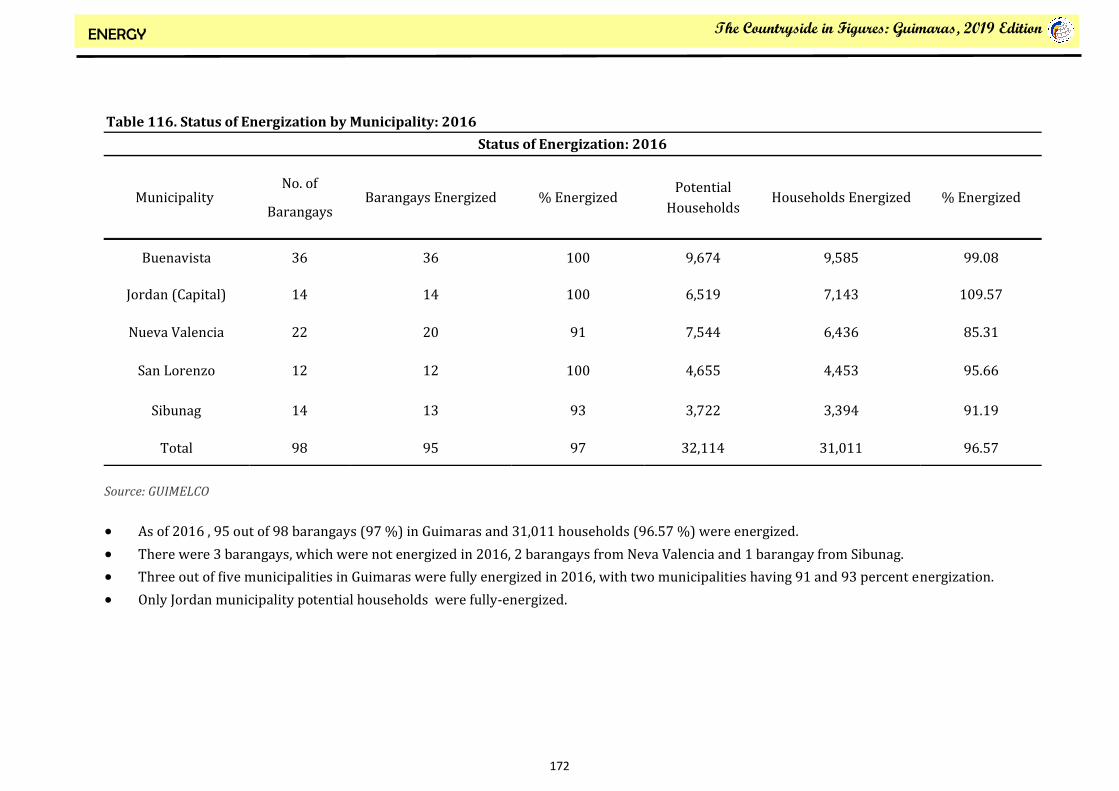
172
The Countryside in Figures: Guimaras, 2019 Edition ENERGY
Source: GUIMELCO
As of 2016 , 95 out of 98 barangays (97 %) in Guimaras and 31,011 households (96.57 %) were energized.
There were 3 barangays, which were not energized in 2016, 2 barangays from Neva Valencia and 1 barangay from Sibunag.
Three out of five municipalities in Guimaras were fully energized in 2016, with two municipalities having 91 and 93 percent energization.
Only Jordan municipality potential households were fully-energized.
Status of Energization: 2016
Municipality No. of
Barangays Barangays Energized % Energized
Potential
Households Households Energized % Energized
Buenavista 36 36 100 9,674 9,585 99.08
Jordan (Capital) 14 14 100 6,519 7,143 109.57
Nueva Valencia 22 20 91 7,544 6,436 85.31
San Lorenzo 12 12 100 4,655 4,453 95.66
Sibunag 14 13 93 3,722 3,394 91.19
Total 98 95 97 32,114 31,011 96.57
Table 116. Status of Energization by Municipality: 2016

173
The Countryside in Figures: Guimaras, 2019 Edition ENERGY
Source: GUIMELCO
In 2017, an additional 4,406 households were energized: 329 from Buenavista, 192 from Jordan, 245 from Nueva Valencia, 305 from San Lorenzo,
and 192 households from Sibunag.
The remaining 3 barangays (2 from Nueva Valencia, 1 from Sibunag) were still not energized in 2017.
Status of Energization:2017
Municipality No. of
Barangays Barangays Energized % Energized Potential Households Households Energized % Energized
Buenavista 36 36 100 12,115 9,914 81.83
Jordan (Capital) 14 14 100 8,311 7,335 88.26
Nueva Valencia 22 20 91 9,173 6,690 72.93
San Lorenzo 12 12 100 5,995 4,758 79.37
Sibunag 14 13 93 4,981 3,545 71.17
Total 98 95 97 40,575 32,242 79.46
Table 117. Status of Energization by Municipality: 2017

174
The Countryside in Figures: Guimaras, 2019 Edition ENERGY
Source: GUIMELCO
In 2018, an additional 4,406 households were energized: 1,025 from Buenavista, 192 from Jordan, 1,562 from Nueva Valencia, 846 from San Lorenzo
and 255 households from Sibunag.
There are still 3 barangays (2 from Nueva Valencia, 1 from Sibunag) that were not energized in 2018.
Status of Energization: 2018
Municipality No. of
Barangays Barangays Energized % Energized
Potential
Households Households Energized % Energized
Buenavista 36 36 100 12,000 10,939 90.29
Jordan (Capital) 14 14 100 8,100 8,053 96.89
Nueva Valencia 22 20 91 9,000 8,252 89.95
San Lorenzo 12 12 100 6000 5,604 93.4
Sibunag 14 13 93 5,000 3,800 76.00
Total 98 95 97 40,100 36,648 91.39
Table 118. Status of Energization by Municipality: 2018

175
The Countryside in Figures: Guimaras, 2019 Edition
CHAPTER 16. TOURISM

176
The Countryside in Figures: Guimaras, 2019 Edition TOURISM
Apart from the recognition given to Guimaras Island as the home of the sweetest mango fruits, Guimaras also boasts itself as one of the popular travel island destinations in the Philippines, particularly among nature lovers and adventure seekers. The island has often attracted attention to itself for its nature’s beauty. It is, without question, one of the safest solo backpacking destinations and most relaxing places to visit in Western Visayas in the Philippines. It is real-ly not overly said when acknowledging Guimaras island as one of the most cloistered, serene, and perfect island destinations in the Philippines. No wonder why tourism in Guimaras have contributed a lot to the advancement of the province’s economy.
This chapter presents the tourist status of Guimaras province.

177
The Countryside in Figures: Guimaras, 2019 Edition TOURISM
Top 10 Tourist Spots and Points of in the Province:
Alubihod Beach is one of the biggest tourist draws in Guimaras because of its white sand beach and peculiar yellow rocks, clean blue sea with gentle waves and good elevation that is excellent for swimming.
Lets you enjoy a wonderful view of the horizon that’s sitting side by side with nearby islands that are filled with lush green plants that are cool to the eyes. It is located in Poblacion, Nueva Valencia , Guimaras.
Guisi Lighthouse was built by the Spanish government in 1894-1896 as part of the master plan for the lighting of the Maritime Coasts of the Philippine Archipelago. The plan was aimed at lighting the Philippine seas and channels to guide ships in and through the most important sea channels to the ports of Manila, Iloilo, and Cebu.
Known as Faro de Punta Luzaran, the lighthouse served as a navigational aid to the fishermen and sailors cruising Panay Gulf. While the original light-house is no longer operational, a new one has been built by the Philippine Coast Guard.
This station is on Guimaras Island, marking the southern entrance to Iloilo. The lighthouse, a 17.5 m (58 ft) octagonal cylindrical tower, was completed in 1896.
It appears similar to the Cabo Bojeador and Cabo Engano lights. The entire light station is in ruins; the lantern is gone from the tower and the roof is gone from the 1-storey stone keeper’s house.
At some time after 1920, the light was replaced by what the current list describes only as 38 ft (11.5m) hourglass-shaped metal tower. (Description: Painted white, focal plane 34 m (111 ft), white flash every 15 seconds, no lantern.)
The lighthouse is listed in the 27 major Spanish Lighthouses of the Philippines (in the order listed by Faros Espanoles de Ultramar). It is located in Guisi, Dolores, Nueva Valencia, Guimaras. © Google Photos

178
The Countryside in Figures: Guimaras, 2019 Edition TOURISM
The Trappist Monastery is located in Bgy. San Miguel, Jordan Town in Guimaras, the Monastery grounds is a peaceful and sacred enclave in Guimaras run by monks of the Cistercian Order of the Strict Observance. These monks fol-low the rule of St. Benedict and are best known for the extreme austerity or strictness that characterizes their discipline.
The monks earn a living by selling souvenir items and processed foods such as jellies, jams, candies, piaya and more, which are sold in a small shop within the monastery grounds.
All the products are from ingredients grown in the Trappist grounds.
Built in 1880, the Navalas Church is the oldest Roman Catholic church and the only existing heritage church in the Island of Guimaras. The architecture of this quaint church is reminiscent of the Jaro Cathedral in Iloilo, which is due to Guimaras being a vista of Jaro during the Spanish period.
The Navalas Church has a charming garden in its front yard and is enclosed by an old stone fence. Standing prominently in front is a watchtower, which served to make early warnings of impending attacks by pirates.
The Navalas Church is located in Brgy Navalas in Buenvista, Guimaras. From Parola, Iloilo City one can have a 15-minute pumpboat ride to McArthur’s Wharf, and from there one can arrange transportation through the Tourist As-sistance Center in the wharf. From McArthur’s Wharf it is another 40-minute ride to Navalas Church.
© Google Photos
© Google Photos
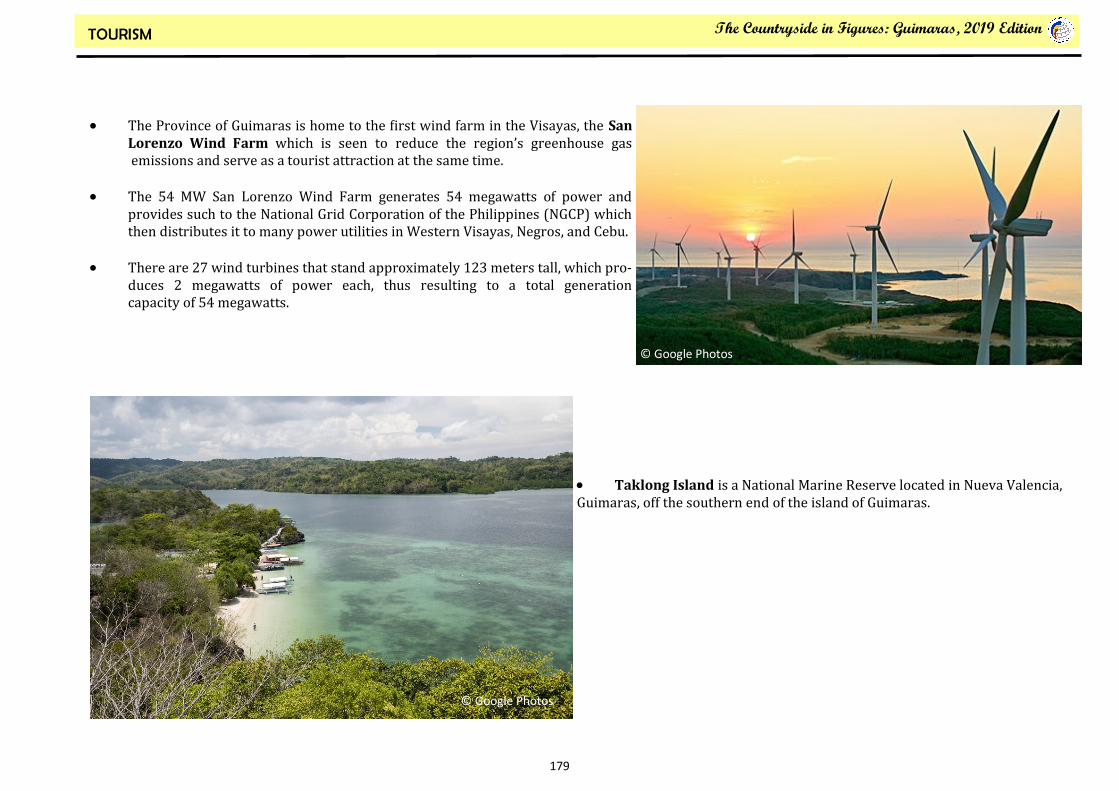
179
The Countryside in Figures: Guimaras, 2019 Edition TOURISM
The Province of Guimaras is home to the first wind farm in the Visayas, the San Lorenzo Wind Farm which is seen to reduce the region’s greenhouse gas emissions and serve as a tourist attraction at the same time.
The 54 MW San Lorenzo Wind Farm generates 54 megawatts of power and provides such to the National Grid Corporation of the Philippines (NGCP) which then distributes it to many power utilities in Western Visayas, Negros, and Cebu.
There are 27 wind turbines that stand approximately 123 meters tall, which pro-duces 2 megawatts of power each, thus resulting to a total generation capacity of 54 megawatts.
Taklong Island is a National Marine Reserve located in Nueva Valencia, Guimaras, off the southern end of the island of Guimaras.
© Google Photos
© Google Photos

180
The Countryside in Figures: Guimaras, 2019 Edition TOURISM
Balaan Bukid (Holy Mountain) is a landmark in Guimaras known for being a
pilgrimage site of Catholic devotees especially during the Holy Week. Alongside the trail to the top are 14 stations called “Way of the Cross,” which depicts significant events in the life of Jesus Christ. Catholics visit Balaan Bukid to be reminded of the suffering Jesus had gone through to save mankind.
It is located in the municipality of Jordan in Guimaras Province, a popular destination for local and foreign pilgrims/visitors during Holy Week.
Besides Holy Mountain’s sacred function, it is also a beautiful nature’s wonder. A mountain provided with a nice dirt road path leading up to a hill with breathtaking view of Iloilo City. Perfect for a small one-day trip for everyone at any time of the year.
One of Guimaras’ famous landmarks is the summer house of the Lopez Clan known as Roca Encantada or “Enchanted Rock” built at the top of a hill.
The house was built in 1910 in honor of Dona Presentacion Hofilena Lopez, declared by the National Heritage Institute as a “heritage house.”
The grand balconies of Roca Encantada offers a picturesque view of the beach front and Iloilo Strait with “La Islas de Siete Picados” not far from its coast.
Roca Encantada is located in Buenavista town, Guimaras, a 15-minute ride to McArthur’s Wharf from Parola, Iloilo City.
© Google Photos
© Google Photos

181
The Countryside in Figures: Guimaras, 2019 Edition TOURISM
SEAFDEC or the Southeast Asian Fisheries Development Center is one of the
tourist destination for Guimaras island hopping tour. The research center is
where they breed and study different species of fishes and other marine life
including the biggest Grouper or Lapu-lapu.
It could be reached by a 20- minute boatride from Alubihod Beach to Igang
Marine Station, Brgy. Igang, Nueva Valencia
The Turtle Island which is known to be the sanctuary of sea turtles or
pawikan is another tourist destination. The island is located just across the Ave
Maria Islet.
Turtle Island may be small in size, but it has a raw appeal that makes it a
charming addition to your itinerary while in Guimaras.
© Google Photos
© Google Photos

182
The Countryside in Figures: Guimaras, 2019 Edition TOURISM
The number of Tourist Arrivals and receipts for Guimaras increased from 2016 to 2017 with a growth rate of 19.63 percent for its number of Tourist
Arrivals and 19.38 percent growth rate for its Tourist Receipts.
The number of Tourist Arrivals and receipts continuously grew from 2017-2018 with a growth rate of 4.11 percent for its number of Tourist arrivals
and 7.38 percent growth rate for its Tourist Receipts.
2016
2017
2018
Tourism Receipts (Tourist) 1,982,415,291.30 2,366,621,784.30 2,531,834,547 Tourist Receipts (same day visitors) 310,586,000.00 446,645,500.00 479,620,000.00 Tourist Arrivals 107,214.00 128,256.00 133,525.00
Table 119. Number of Tourist Arrivals and Receipts, Guimaras: 2016 & 2018
Source: Department of Tourism
Table 120. Number of Tourist Arrivals by Municipality, Guimaras: 2018
Municipality Tourist Arrival Total
Domestic Foreign Jordan 11,549 128 11,677
Nueva Valencia 97,553 6,112 103,665 Sibunag 2,185 676 2,861
Buenavista 6,016 15 6,031 San Lorenzo 8,728 563 9,291
TOTAL 126,031 7,494 133,525
Source: Department of Tourism
Guimaras’ tourist arrivals reached 133,525 in 2018 comprised mostly of Domestic tourists contributing 94.39 percent while Foreign visitors
chipped in 5.61 percent to the total tourist arrivals of the province.
Nueva Valencia is the most visited municipality by both Domestic and Foreign visitors, 77.64 percent of the total tourist arrivals of the
province visited the said municipality.
Sibunag municipality is the least visited by both Domestic and Foreign tourists with 2,861 tourist arrivals in 2018.

183
The Countryside in Figures: Guimaras, 2019 Edition TOURISM
The number of same day visitors in Guimaras province reached 959,240 in 2018, comprised mainly of Domestic visitors which contributed 96.88 percent to the province’s same day visitors, while Foreign same day visitors accounted 3.12 percent.
Jordan municipality is the most visited municipality by both Domestic and Foreign same day visitors, chipping in 42.68 percent to the provincial total.
Nueva Valencia followed with a large gap, contributing 25.31 percent to the provincial total. Domestic same day visitor comprised 95.73 percent while Foreign same day visitor accounted 4.27 percent.
Sibunag municipality is the least visited by both Domestic and Foreign same day visitors.
Table 121. Number of Visitors by Municipality, Guimaras: 2018
Municipality Same Day Visitor Total
Domestic Foreign Jordan 394,100 15,310 409,410
Nueva Valencia 232,419 10,371 242,790 Sibunag 42,593 1,165 43,758
Buenavista 106,729 1,335 108,064 San Lorenzo 153,473 1,745 155,218
TOTAL 929,314 29,926 959,240 Source: Department of Tourism
Table 122. Number of Tourist Attractions, Guimaras: 2018
Type of Attraction Number
Historical and Cultural Attractions Natural Attractions Man Made Attractions Religious Attractions Sports Activities Diving Sites Agri-tourism Sites Festivals
18 29 29 10 2 3 10 22
Sources: Provincial Tourism Office, Guimaras
There were 123 tourist attractions in Guimaras as of 2018, with
18 Historical and Cultural Attractions, 29 each Natural
Attractions, and Man– Made Attractions, 10 Religious Attractions,
2 Sports Attractions, 3 Diving Sites,10 Agri–Tourism Sites, and 22
Festivals.
Most of Guimaras’ tourist attractions are Natural and Man–made
attractions, and also the Festivals in the province attract both
domestic and foreign tourists.
Ten (10) Agri– Tourism sites could be found in the province to
include grape farm in Sibunag, hydroponic culture of vegetables
and mushroom culture also in Sibunag.

184
The Countryside in Figures: Guimaras, 2019 Edition TOURISM
Table 123. Number of Accommodation Facilities, Guimaras: 2017
Accommodation Facilities No. No. of Rooms
Hotels
Tourist Inns
Pension/ Lodging House
Resorts
Recreation Centers
Others
Total
0
6
8
31
0
0
45
0
51
92
350
0
0
493
Source: Provincial Tourism Office, Guimaras
There were 493 rooms available in 45
accommodation facilities in the province of
Guimaras to cater guests visiting the province in
2017.
Resorts have the most number of rooms among
the accommodating facilities with 350 rooms as
of 2017.
Aside from the resorts, there are 6 tourist inns
with 51 rooms, and 8 pension/ lodging houses
with 92 rooms available in the province.
Figure 58. Tourist Arrival from Accommodation Establishments (Domestic & Foreign)
Source: Provincial Tourism Office, Guimaras
The tourist arrival from
accommodation establishments both
domestic and foreign shows an
increasing trend from 2014 to 2018.
The Province of Guimaras is
targeting a total of 153,554 thousand
of tourist arrivals for 2019.

185
The Countryside in Figures: Guimaras, 2019 Edition
ANNEXES

186
The Countryside in Figures: Guimaras, 2019 Edition
PROVINCIAL DEPARTMENT HEADS
Provincial Department Head Designation Address
Jonafe T. Hiponia
Leonard S. Pasiderio
Ronnie D. Morante
Gregory G. Ten oso II
Alejandro D. Araneta, DMD
Jose Melquias D. Gaje, Jr.
Jean L. Patanindagat
Teresita G. Siason
Elena V. Quezon
Engr. Lolita Alilis
Felipe V. Narciso
Dr. NL Cathrel A. Nava
Brenda R. Dajay
Atty. Jeheil C. Cusa
Nolinda G. Ronzales
Shirly T. Gabutin
Liberty N. Ferrer
Ana Marie D. Martir
Dr. Ma. Theresa B. Macainan
Bids and Awards Committee (BAC) Officer
Guimaras Environment and Natural Resources Officer
Provincial Agriculturist
Provincial Accountant
Provincial Administrator
Provincial Assessor
Provincial Budget Officer
Provincial Disaster Risk Reduction and Mngm’t Officer
Provincial Economic and Development Officer
Provincial Engineer
Provincial General Services Officer
Provincial Health Officer
Provincial Human Resource Management and Development Officer
Provincial Legal Officer
Provincial Planning and Development Officer
Provincial Social Welfare and Development Officer
Provincial Tourism Officer
Provincial Treasurer
Provincial Veterinarian
San Miguel, Jordan
-do-
-do-
-do-
-do-
-do-
-do-
-do-
-do-
-do-
-do-
-do-
-do-
-do-
-do-
-do-
-do-
-do-
-do-
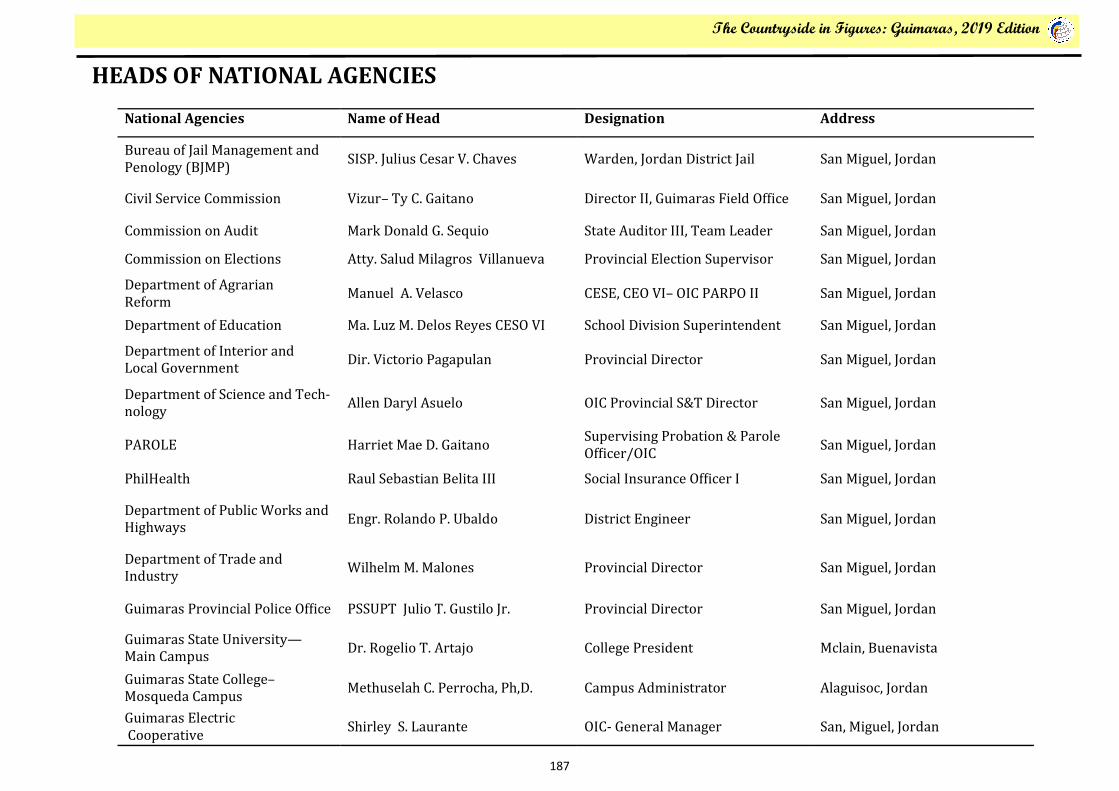
187
The Countryside in Figures: Guimaras, 2019 Edition
HEADS OF NATIONAL AGENCIES
National Agencies Name of Head Designation Address
Bureau of Jail Management and Penology (BJMP)
SISP. Julius Cesar V. Chaves Warden, Jordan District Jail San Miguel, Jordan
Civil Service Commission Vizur– Ty C. Gaitano Director II, Guimaras Field Office San Miguel, Jordan
Commission on Audit Mark Donald G. Sequio State Auditor III, Team Leader San Miguel, Jordan
Commission on Elections Atty. Salud Milagros Villanueva Provincial Election Supervisor San Miguel, Jordan
Department of Agrarian Reform
Manuel A. Velasco CESE, CEO VI– OIC PARPO II San Miguel, Jordan
Department of Education Ma. Luz M. Delos Reyes CESO VI School Division Superintendent San Miguel, Jordan
Department of Interior and Local Government
Dir. Victorio Pagapulan Provincial Director San Miguel, Jordan
Department of Science and Tech-nology
Allen Daryl Asuelo OIC Provincial S&T Director San Miguel, Jordan
PAROLE Harriet Mae D. Gaitano Supervising Probation & Parole Officer/OIC
San Miguel, Jordan
PhilHealth Raul Sebastian Belita III Social Insurance Officer I San Miguel, Jordan
Department of Public Works and Highways
Engr. Rolando P. Ubaldo District Engineer San Miguel, Jordan
Department of Trade and Industry
Wilhelm M. Malones Provincial Director San Miguel, Jordan
Guimaras Provincial Police Office PSSUPT Julio T. Gustilo Jr. Provincial Director San Miguel, Jordan
Guimaras State University—Main Campus
Dr. Rogelio T. Artajo College President Mclain, Buenavista
Guimaras State College– Mosqueda Campus
Methuselah C. Perrocha, Ph,D. Campus Administrator Alaguisoc, Jordan
Guimaras Electric Cooperative
Shirley S. Laurante OIC- General Manager San, Miguel, Jordan

188
The Countryside in Figures: Guimaras, 2019 Edition
HEADS OF NATIONAL AGENCIES
National Agencies Name of Head Designation Address
Army Reserve LTC. Evan M. Bermudo INF (GSC) PA, CDC
Director– 6OG GECDG, ARESCOM
San Miguel. Jordan
Land Transportation Office Ma. Asuncion H. Trespeses Transportation Regulation Officer I San Miguel, Jordan
Municipal Court Trial Court Hon. Clarence G. Zerrudo Presiding Judge San Miguel, Jordan
Regional Trial Court Branch 65 Hon. Rosario Abegail M. Dris– Villanueva
Presiding Judge San Miguel, Jordan
Bureau of Plant Industry/ GNCRDPSC Yondre J. Yonder Officer-in-charge San Miguel, Jordan
Philippine Coconut Authority Joel P. Solis Manager San, Miguel, Jordan
Boy Scout of the Philippines Killeen B. Pen alber Council Scout Executive San, Miguel, Jordan
Philippine Red Cross Adonairan S. Catapia OIC Chapter Administrator San, Miguel, Jordan
Technical Education and Skills Development Authority
Noemely Dolar Provincial Director San, Miguel, Jordan
Land Bank of the Philippines Lina M. Aman Branch Manager San, Miguel, Jordan
Department of Labor and Employment Arlyn Siaotong Provincial Head San, Miguel, Jordan
Department of Environment and Natural Resources
Vicente A. Sardina PENR Officer San, Miguel, Jordan
Philippine Statistics Authority Nelida B. Losare Provincial Statistics Office San, Miguel, Jordan
National Food Authority Elma Anatan Warehouse Supervisor Poblacion, Jordan
National Commission on Indigenous People– Guimaras
Ana N. Burgos Community Development Officer Guimaras Field Office
San, Miguel, Jordan
Bureau of Fisheries and Aquatic Resources Alberto Dalen Officer-in-charge San, Miguel, Jordan
Provincial Agricultural and Fisheries Council Guimaras
Ramon Maran on Chairperson San, Miguel, Jordan
Bureau of Fire—Guimaras F/Supt. Arnold Alba Provincial Fire Marshall San, Miguel, Jordan
Telecommunications Shirly Naget San, Miguel, Jordan

189
The Countryside in Figures: Guimaras, 2019 Edition
HEADS OF CIVIL SOCIETY ORGANIZATIONS PEOPLE ORGANIZATIONS
CSOs/POs Name of Head Designation
Taos Puso Foundation
Boys Scout of the Philippines
Creative Community Foundation
Lopez Group Foundation
Guimaras Volunteer Probation Aides, Inc.
Guimaras Peoples Economic foundation, Inc.
National Auxiliary and Chaplaincy Phil
Guimaras Brotherhood Inc.
Guimaras Mango growers & Producers Development Cooperative
Guimaras Brethen Multi-Purpose Cooperative
Guimaras OFW– Seaman MPC
Nueva Valencia Multi– Purpose Cooperative
National Commission of Indigenous People
Diocese of Guimaras , Iglesia Filipina Independence
Cecila Vilches
Xillen B. Pen alber
Edwin Aran a
Agustin L. Zaragoza
Leonardo B. Dellero
Ana Eva G. Villanueva
Pastor Efren V. Delmo
Johnny G. Galve Sr.
Felipe Z. Gamarcha
Lemon C. Magoliman
Beula Anilao
Edna E. Gabayeron
Emma Barba
RT. Rev. Tito A. Vilches
Representative
Council Scout Executive
Resource Coordinator
Representative
Vice– President
Executive Director
Provincial Director
President
President
Manager
BOD Member
Manager
NCIP Head
Bishop

190
The Countryside in Figures: Guimaras, 2019 Edition
MUNICIPAL DEPARTMENT HEADS
Name of Head Designation
Engr. Juny A. Gallo
Ms. Althea E. Ferrer
Mr. Richard G. Gaboy, CPA
Ms. Lory S. Paredes
Ms. Elma F. Zaldivar
Mr. Alex S. Fernandez
Engr. Gil A. Perrocha
Ms. Jerreza C. Gabito, RSW
Dr. Grace F. Cortez
Mr. Ebenezer G. Haban a
Ms. Alicia Columna
Municipal Planning & Development Officer
Municipal Budget Officer
Municipal Accountant
Municipal Treasurer
Municipal Civil Registrar
Municipal Assessor
Municipal Engineer
Municipal Social Welfare & Development
Municipal Health Officer
Municipal Agriculturist Officer
Municipal Disaster Risk Reduction and Management Council
Municipality of Buenavista

191
The Countryside in Figures: Guimaras, 2019 Edition
MUNICIPAL DEPARTMENT HEADS
Name of Head Designation
Zurinie G. Zaldivar
Marie D. Gaitan
Beverly G. Villano
Josephine G. Tubid
Mary Jane G. Piosca
Herminia G. Galon
Josephine G. Servando
Cynthia D. Gatungay
Sheila D. Gumabong, M.D.
Oliver S. Chavez
Loren Gallarda
Municipal Planning & Development Officer
Municipal Budget Officer
Municipal Accountant
Municipal Treasurer
Municipal Civil Registrar
Municipal Assessor
Municipal Engineer
Municipal Social Welfare & Development
Municipal Health Officer
Municipal Agriculturist Officer
Municipal Disaster Risk Reduction and Management Council
Municipality of Nueva Valencia

192
The Countryside in Figures: Guimaras, 2019 Edition
MUNICIPAL DEPARTMENT HEADS
Name of Head Designation
Engr. Rodolfo G. Gamarcha
Marilyn G. Efondo
Helene G. Geonanga, CPA
Elvira T. Galanto
Jesusa M. Millondaga
Ramon D. Ganancial
Engr. Ma. Rufina G. Galotera
Marilyn G. Gabasa
Dr. Robel T. Gencianeo
Mildred G. Gencianeo
Aida E. Gallos
Municipal Planning & Development Officer
Municipal Budget Officer
Municipal Accountant
Municipal Treasurer
Municipal Civil Registrar
Municipal Assessor
Municipal Engineer
Municipal Social Welfare & Development
Municipal Health Officer
Municipal Agriculturist Officer
Municipal Disaster Risk Reduction and Management Council
Municipality of Jordan
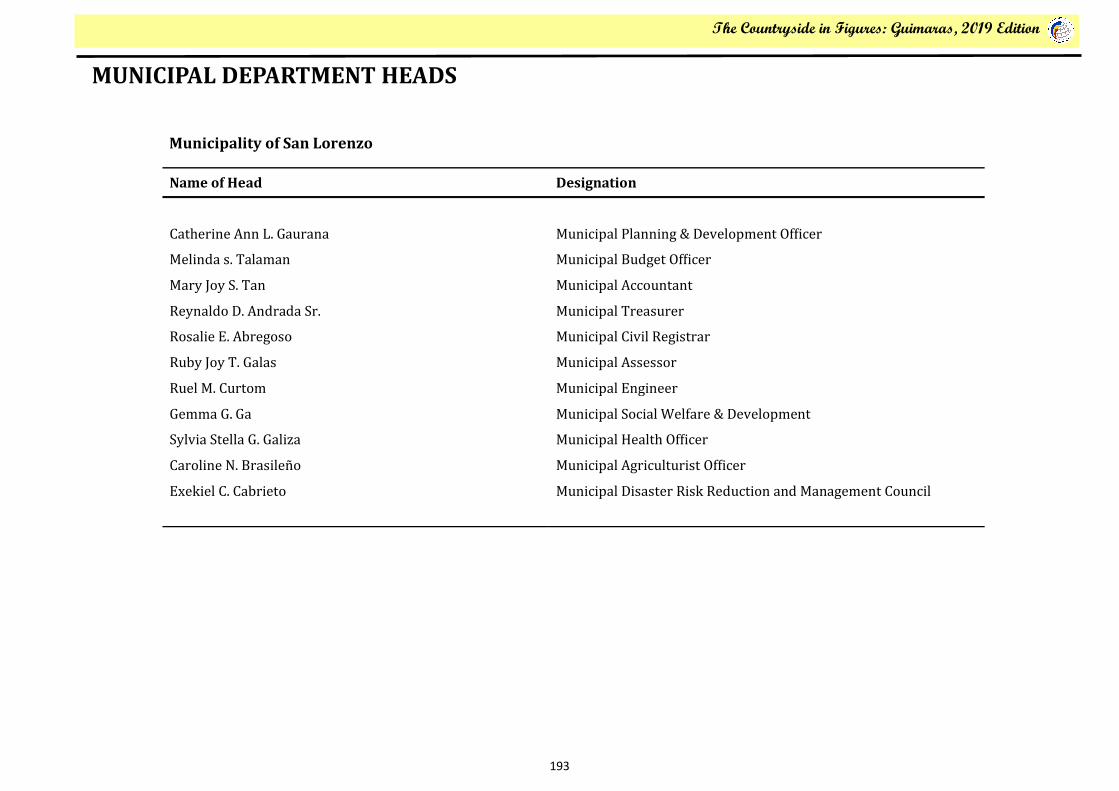
193
The Countryside in Figures: Guimaras, 2019 Edition
MUNICIPAL DEPARTMENT HEADS
Name of Head Designation
Catherine Ann L. Gaurana
Melinda s. Talaman
Mary Joy S. Tan
Reynaldo D. Andrada Sr.
Rosalie E. Abregoso
Ruby Joy T. Galas
Ruel M. Curtom
Gemma G. Ga
Sylvia Stella G. Galiza
Caroline N. Brasilen o
Exekiel C. Cabrieto
Municipal Planning & Development Officer
Municipal Budget Officer
Municipal Accountant
Municipal Treasurer
Municipal Civil Registrar
Municipal Assessor
Municipal Engineer
Municipal Social Welfare & Development
Municipal Health Officer
Municipal Agriculturist Officer
Municipal Disaster Risk Reduction and Management Council
Municipality of San Lorenzo

194
The Countryside in Figures: Guimaras, 2019 Edition
MUNICIPAL DEPARTMENT HEADS
Name of Head Designation
Marilou M. Nieles
Merlinda E. Timbas
Romelyn M. Binas
Felisa C. Barredo
Annabelle G. Barce
Zaldy C. Domalina
Engr. Analin G. Cambonga
Marilin C. Divinagracia
Dr. Burt Jordas
Nory G. Zamora
Mun. Mark Delotindo
Municipal Planning & Development Officer
Municipal Budget Officer
Municipal Accountant
Municipal Treasurer
Municipal Civil Registrar
Municipal Assessor
Municipal Engineer
Municipal Social Welfare & Development
Municipal Health Officer
Municipal Agriculturist Officer
Municipal Disaster Risk Reduction and Management Council
Municipality of Sibunag

195
The Countryside in Figures: Guimaras, 2019 Edition
PROVINCIAL STATISTICS COMMITTEE COMPOSITION
Chairperson : Philippine Statistics Authority (PSA)- Guimaras
PSC Co-Chairperson : Provincial Planning and Development Office (PPDO)
Members : Department of Trade and Industry (DTI)- Guimaras
Department of the Interior and Local Government
Department of Environment and Natural Resources (DENR)- Guimaras
Guimaras Environment and Natural Resources Office
Provincial Budget Office
Provincial Engineering Office
Provincial Social Welfare and Development Office
Provincial Tourism Office
Provincial Health Office
Provincial Office for Agricultural Services
Municipal Planning and Development Office, Buenavista
Municipal Planning and Development Office, Jordan
Municipal Planning and Development Office, Sibunag
Municipal Planning and Development Office, Nueva Valencia
Municipal Planning and Development Office, San Lorenzo
Guimaras State College (GSC)
TAOS Puso Foundation
Lopez Group Foundation
Philippine Statistical Assoc, Inc. Provincial Representative

196
The Countryside in Figures: Guimaras, 2019 Edition
Republic of the Philippines
Philippine Statistics Authority
Provincial Statistics Office - Guimaras
2nd flr. Galanto Bldg. Newsite San Miguel, Jordan, Guimaras
Table Numbers being monitored/ used
(1)
Other data proposed for inclusion
(2)
Remarks
(3)
Dear Data User,
We consider it our duty to do our best in meeting your statistical data needs and
expectations. But we need your help. You can do your share by providing us with your
comments and suggestions to further improve the publication, The Countryside in Figures:
Guimaras, 2018.
Please list in column 1 the table numbers that you use/ monitor. For other data that you
want to be included, please list them under column 2. Write your other comments/ remarks
under column 3.
Thank you for your help.
NELIDA B. LOSARE
Chief Statistical Specialist - PSA Guimaras
Comments and Suggestions Form
SENDER
Name: ____________________________________________
Designation: _______________________________________
Office: ____________________________________________
Address: __________________________________________
Tel. No. __________________ Fax No. __________________
E-mail Address: _____________________________________
Please cut this page and send it thru fax: (033) 331– 2844; mail it to the above address; or e-mail to [email protected]

197
The Countryside in Figures: Guimaras, 2019 Edition
The Countryside in Figures: Guimaras, 2019 Edition
is a publication prepared by the Philippine Statistics Authority: Guimaras in collaboration with the Provincial Statistics Committee
For subscription and inquiries, please contact us at the
Philippine Statistics Authority– Guimaras
2nd Floor Galanto Building. New Site, San Miguel Jordan Guimaras
or at :
Telefax no: (033)331-2844
Email address: [email protected]
URL: http://www.rsso06.psa.gov.ph/psaguimaras

198
The Countryside in Figures: Guimaras, 2019 Edition
The Countryside in Figures: Guimaras, 2018 Edition
is a publication prepared by the Philippine Statistics Authority: Guimaras in collaboration with the Provincial Statistics Committee
For Subscription and inquiries, please contact us at the
Philippine Statistics Authority– Guimaras
2nd Floor Galanto Building. New Site, San Miguel Jordan Guimaras
or at :
Telefax no: (033)331-2844
Email address: [email protected]
URL: http://www.rsso06.psa.gov.ph/psaguimaras