Aviation Facts and Figures - 1957
123
1957 EDITION PRICE $1.0 0 PUBLISHED BY AMERICAN AVIATION PUBLICATIONS
-
Upload
khangminh22 -
Category
Documents
-
view
3 -
download
0
Transcript of Aviation Facts and Figures - 1957

1957 EDITION
PRICE $1.0 0
PUBLISHED BY AMERICAN AVIATION PUBLICATIONS

~----------------~~---------------------
FY 58 Prod Scbed ( 57- 3) inc. FY
f1 57 Program, FY 58 Pr ogram
Bombers 262 Fi ghter s 1381 Cargo 254 FY56 6800 Trainers 453 FY? 4500 ?
total 2350
GAR 16,000
· GM , non-bal 230 r-
Ballistic 85 I
Mise 200
- -""-
...

•
AIRCRAFT INDUSTRIES ASSOCIATION OF AMERICA, INC.
AVIATION FACTS
AND
RUDOLF MODLEY Con s ultant
FIGURES
1957
Compiled by
EDWARD B. HINCKS
Edited b y
BEN S. LEE Direc tor of Publications
Statistical A ss is tant
AVIATION FACTS A ND F I GURES, 1957 CoPYHIG fi'r, 1957 BY
American Aviation Publications • PUBLISHEHS 1001 VERMONT AVEN1JE, N .W. WAS HI NGTO N 5 , D. C .

FOREWORD
Today, superiority in the quality of th e aerial \reapons we now hold poised is a decisive factor in holding the peace for the free world. Co ntinuing superiority is, of course, dependent, in large measure, upon emphasis in resean:h and development. At the same tim e, r esean:h and development programs deal with the future, wh ereas " holding the peace" depends upon our forces in being. So we must a]\\·ays have the proper balance between force in being and research and development programs.
In productive capac ity and in seientific and technical r esources the United States airemft industry is a prime national asset. It could, if need be, produce more a ircr aft, engines, g uided missiles, and their associated electronic systems than the entire Communist coalition. But, such a program would be both shortsighted and dangerous. Instead , our aircraft industry, as all defense manufacturing, is geared to an economy designed to main ta in the strength necessary to deter aggression while continuing to build for our national welfare and to provide eco nom ic and m iIi tary support to the free world.
Generally speaking, the military se rvi ces are spending substantially more for r esearch and developm ent of new aerial weapons than the entire military air services were spending before the Korean vVar. 'roday, th ese services, for each three dollars spent on aircraft production, are spendin g another dollar in r esea rch for future aeronautical superiority.
'While there a re many intangibles to equating the r equirements for insurin g th e peace, both milita ry and administration leaders feel that a proper balance in spending for r esearr h, developm ent
2

and production programs has been reached and that we are somewhere near adequate force-in-being levels under 1J1"csent condit-ions for maintaining national security. So, with no marked change in world conditions in prospect, a leveling off in military aircraft production is to be expected during this, and for the next several, years.
Meanwhile, commercial aircraft production has been steadily increasing as peoples of the free world have come to realize the value of the airplane as a tool of commerce ; for the business of travel- domestically and internationally; and communications generally. Today, the United States aircraft industry has a record backlog for the production of civil transports of all categories including more than $2.5 billion dollars of orders for giant 600-mileper-hour, long-range jet and fast medium-range turboprop transports.
This fifth edition of Aviation Facts and Figures is not a work of original research. It represents a compilation of facts gleaned from hundreds of sources in the world of aviation during the past year which have been considered of importance or interest.
It is hoped that this edition may serve as a standard aviation reference work of value to legislators, administrators and managers in government and industry, writers and editors, analysts and students.
ORVAL R. CooK, GENERAL (USAF-RET.) P1·esident, Aire1·aft Indust1·ies Association May 1957
3

CONTENTS
PHODUCTJO'X AXD FACIL ITIES
MILITARY A \"IAT IOl'\
G u iDED l\IIJ SS ILES
RESEARCH A~D DEVELOP~! E:\'f .
MANPOWER
FINAK CE
GENERAL AV IATIO:\"
HELTCOP'l'ERS
AmL I;-.;Es AXD TRA :\"f;POHTAT iox
U. 8. AXD Fon.E IG :--.r A\'IATIO:\" ExPon·r
PunLT C RELATIONS OI"PICIALS, AlA .
Sou RcEs
I N DEX .
5
22
3~
40
46
59
67
78
83
101
108
115
118
PRODUCTION AND FACILITIES
M ili tary a in: raft p roclu<:t ion , in terms of uni t prod uct ion , h as leYeled off. Por th e firs t t im e sin <:e J 950, <: iYil a ircraft uni t p rocl nd ion in 1956 exceed ed milita r y unit p rod uct ion .
In t erm s of d oll a r YOlnmc, hmn•yr r , m ilita ry pnn·h ases of aeron a u t ic·al prodnds ha H' <·on tin ued to ri sP. Tn 1!);) 6, th e lead ing a i n : t·aft, en gine a nd prop t> li E' r eompa ni t>s sol<l , to t he mili ta r y , a n pstim a tecl 6.6 billi on d oll a rs worth of ait·c raft a nrl par ts a nd alm ost. 1.8 billi on doll ar s of ' ' other ]1r oclncts ' '- mos 1"1 .)· g ni<lt•tl missiles. T otal salrs to mili ta ry a ncl r- ivil consume rs r each ed a n all -tim e post -\Vorld \Var I1 hig h of $9 ,496 ,-000,000. Total sales of th e a ircr aft in dust r.'' d urin g 1956 im:r easecl mor e th an one b illion dolla r s over 1955.
1 n te rms of a irf r a me w eigh t p rod ucecl cl ur·in g 1956, mil i ta r.'· cleliYe t·i es, a l th ough 16.2 p er cent below 1955 leYCls, far exceed ed ciYil a ir f ra me weigh t p rodu cti on . Of t he tota l 111 ,600,000 pound s of a irframe weigh t p rodu ced by t he l . S. a ircr aft in d ust r .' · in 1956, d eliveries t o t h e militar y tot alecl 95.5 million p oun rls while a i rf ra me weigh t deliver ed fo r eiv il u~e a mounted to on ly 16.1 m illion pounds.
In 1956, th e a ircraft incl us tr y p rod n eed 1-l,OOO a ircraft. Of thi s nu mber , 7,200 "·er e built fo r ci,·il u ser s a nd 6,800 were manufactured fo r th e milita r y ser vices. The nati on 's a in ·raf t eng· in P mnnnfacturer s p r oduced an c. t im a t 0d 2-1- ,500 E' ng in r s of all typrs . of whi eh appr oxim at t>ly 1 ~ . 000
wer e built fo r th r mili ta ry a nd 11 ,500 wr t· E' ma nu fa c1'11rrcl fo r r iYil con s um ption.
Tod ay, th e manufact nrr of a ircraft in it sPlf is a c ostl~- op er at ion , n ot coun ting the cost of th e p la ne, t he missile, t h e g reat engines, etc. F or exampl e, for ea ch p ound of to t al a irf r ame weigh t p r odu ced , th e air-
5
l -
G AVI ATION F ACTS AND F I GURES, 1957
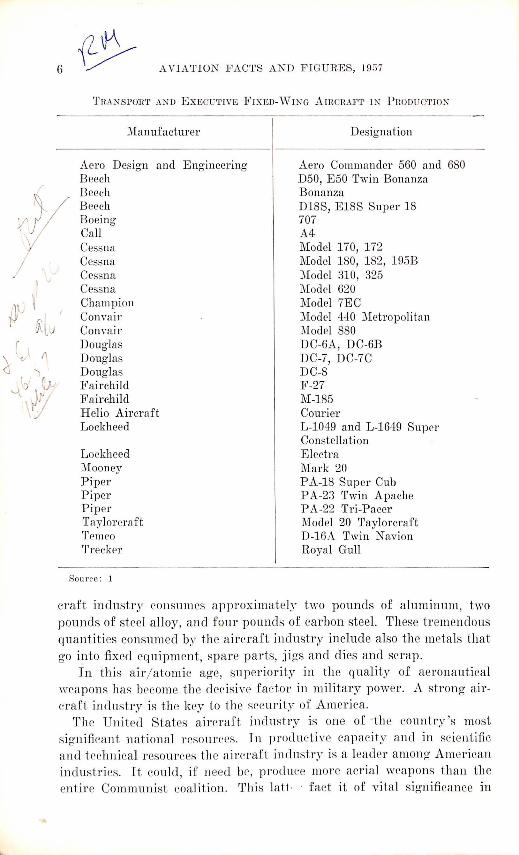
T RA N SPOJl'l' A N D E xECU T I VE F IX ED- W I N G A m CHA.F'l' I :\ P HODUC"l'IO:\
Manufac turer
Aero Design and E ngineering Beech Beech Beech Boeing Call Cessna Cessna Cessna Cessna Champion Conva ir Convair Douglas Douglas Douglas F airchild F airchild Helio Aircraft Lockh eed
Lockheed Mooney Piper Piper P iper Taylorcraft Trmco Trecker
Source : 1
Designation
Aero Commander 560 and 680 D50, E50 Twin Bonanza Bonanza D18S, E18S Super 18 707 A4 Model 170, 172 Model 180, 182, 195B :Model 310, 325 Model 620 Model 7EC Model 440 Metropoli tan Model 880 DC-6A, DC-6B DC-7, DC-7C DC-8 F -27 M-185 Courier L-1049 and L-1649 Super Constellation E lectra Mark 20 P A-18 Super Cub P A-23 Twin Apache P A-22 Tri-Pacer Model 20 Taylorcraft D-16A Twin Navion Royal Gull
craft indust ry consumes approxim a tely t wo pounds of alum inum , two pounds of steel alloy, and four pounds of carbon st eel. Th ese t r emendous quanti t ies consum ed by the a ircraft industry include also the metals that go into fixed equipment, spar e p arts, jigs and dies and scr ap .
In this air'/atomic age, superior ity in the quality of aeronaut ical weapons has become the d er isive farto r· in mili tar y power. A st ron g aircraft industry is the key to t he security of Am erica.
Th e U nited S tates ai rcraft industry is one of the co untry 's most sign ifi can t national r esourcrs. In prod ucti ve capacity and in scient ific a nd t echni cal r esour ces t he a ircraft imlust ry is a leader among Amer ican in dust ri es. It could , if need br, produ l' e more aeri al weapons than th e entire Communist coali t ion . Thi s latf. fact it of v ital significa nce in

PRODUCTION AND FACILITIES
STEEL
ALUMINUM
COPPER
ELECTRIC MOTORS ......-----::::
BEARINGSd PEOPLE
PEOPLE
STEEL
COPPER ____-;/
ELECTRIC MOTORS
BOMBERS
FIGHTERS
CARGO PLANES
COMMERCIAL TRANSPORTS
MISSILES AND ROCKETS
RECIPROCATING ENGINES
~JET ENGINES
~MISSILE POWER PLANTS
PROPELLERS
7

8
Year
1909 1910 1911 1912 1913
1914 1915 1916 1917 1918
1919 1920 1921 1922 1923
1924 1925 1926 1927 1928
1929 1930 1931 1932 1933
AVIATION FACTS AND FIGURES, 1957
U. 8. AIRCRAFT PRODUCTION
-1909 TO DATE
(Number of aircraft)
TOTAL Military
N.A. 1 N.A. -N.A. 11
45 16 43 14
49 15 178 26 411 142
2,148 2,013 14,020 13,991
780 682 328 256 437 389 263 226 743 687
377 317 789 447
1,186 532 1,995 621 4,346 1,219
6,193 677 3,437 747 2,800 812 1,396 593 1,324 466
(Continued on next page)
''I.
Civil
N.A. N.A_ N.A.
29 29
34 152 269 135
29
98 72 48 37 -56
60 342 654
1,374 3,127
5,516 2,690 1,988 ~03
858
relation to the current restive international situation. The scope of Soviet activity in military aviation is continually broadening. They have now the means to inflict widespread destruction upon the United States and they are augmenting this capability with long-range ballistic missiles.
Historically, normal reaction would be to build bigger and better weapons- certainly more of them. To some degree this is what the nation's military leaders have ordered the aircraft industry to do. For some years the numerical strength of our air forces has been steadily increased. With atomic weaponry in g ·at variety, and in megaton

Year
1934 1935 1936 1937 1938
1939 1940 1941 1942 1943
1944 1945 1946 1947 1948
1949 1950 1951 1952 1953 1954 1955 1956
N.A.-Not available. E Estimate.
-
PRODUCTION AND FACILITIES
U. 8. AIRCRAFT PRODUCTION 1909 TO DATE ( cont'd) (Number of aircraft)
TOTAL Military
1,615 437 1,710 459 3,010 1,141 3,773 949 3,623 1,800
5,856 2,195 12,804 6,019 26,277 19,433 47,836 47,836 85,898 85,898
96,318 96,318 49,761 47,714 36,670 1,669 17,717 2,100 9,586 2,284
6,089 2,544 6,520E 3,000E 7,877E 5,400E
12,509E 9,000E 15,134E ll,OOOE 12,389E 9,000E 12,753E S,OOOE 14,005E 6,800E
-Sourres: .'1, l!, ·~ •. 13, 20, 29, 31, 44, 75.
Civil
1,178 1,251 1,869 2,824 1,823
3,661 6,785 6,844 ---
2,047 35,001 15,617 7,302
3,545 -, '· 3,520 I
2,477 3,509 -,
4,134 ' 3,389
\ 4,753 7,205 J
yields, the air power which this nation holds poised is powerful beyond imagination.
But there comes a time in the course of increasing our air power in terms of quantities when our military leaders must make a determination of sufficiency in force levels. Measured in relation to cttrt·ent international conditions, our military and administration leaders believe that this nation is somewhere near adequate strength and that current expenditures in production and those for research and development activities are proper and in balance with one another.
For example, the U. S. Air Force 137-Wing program as conceived in 1953 was a considerably less powerful force than we have today. Many of our :fighter planes can now deliver nuclear bombs that formerly could

f~'~---10 .Y AVIATION FACTS AND FIGURES, 1957
Manufacturer
Aero jet Aero jet Aero jet Aero jet Aero jet Aero jet Aero jet Aircooled Motors Aircooled Motors Aircooled Motors Aircooled Motors Aircooled Motors Aircooled Motors
llison llison llison llison
A A A A c ontinental Continental Continental Continental Continental Continental Continental
ontinental c F F G G G G A A A A A A A A A A A A A
airchild airchild eneral Electric eneral Electric eneral Electric eneral Electric vco Lycoming vco Lycoming vco Lycoming vco Lycoming vco Lycoming vco Lycoming vco Lycoming vco Lycoming vco Lycoming vco Lycoming vco Lycoming veo Lycoming vco Ly<'oming
ENGINES IN PRODUCTION
Designation Type
15KS-1000 Rocket 5KS-4500 Rocket AJ10-24 Rocket 15NS-250 Rocket 2.2KS-11,000 Rocket 2.2KS-33,000 Rocket 40NS-4500 Rocket Franklin 6AG4-185 Piston Franklin 6A4-165 Piston Franklin 6V 4-200 Piston Franklin 6V 4-178 Piston Franklin 6V6-245 Piston Franklin 6A4-150 Piston 501-D13 Turboprop T56 Turboprop J33 Turbojet J71 Turbojet J69 Turbojet 0-470 Piston 0-300 Piston A-65 Piston C-90 Piston C-145 Piston E-185 Piston E-225 Piston J44(FT-101) Turbojet XJ83 Turbojet J79 Turbojet CJ805 Turbojet XJ85 Turbojet T58 Turboprop S0-580 Piston 0-290 Piston 0-34& Piston G0-480 Piston 0-320 Piston GS0-480 Piston V0-435 Piston 0-360 Piston G0-435 Piston 0-235 Piston· 0-435 Piston GS0-580 Piston S0-480 Piston
(Continued on page 11)
Thrust or Horsepower
1000 pounds 4500 pounds
~-----------
250 pounds 11000 pounds 33000 pounds 4500 pounds
185 hp 165 hp 200 hp 178 hp 245 hp 150 hp
3750 eshp 3750 eshp 4600 pounds
10000 pounds 1000 pounds
240 hp 145 hp
65 hp 90 hp
145 hp 205 hp 225 hp
1000 pounds 2000 pounds
10,000 pounds 10,000 pounds
2000 pounds 1000 eshp
400 hp 140 hp 170 hp 270-295 hp 150 hp 340 hp 260 hp 180 hp 240 hp 115 hp 190 hp 400 hp 325 hp

PRODUCTION AND FACILITIES 11
EXGINES IN PRODUCTION
Manufacturer Designation Type Thrust or Horsepower
A vco Lycoming R-1820 Piston 1425-1525 hp A vco ·Lycoming R-1300 Piston 800 hp Avco Lycoming T53 Turboprop 825 eshp A vco Lycoming T55 Turboprop 1670 eshp Pratt and Whitney R-2000 Piston 1450 hp Pratt and Whitney R-2800 Piston 2400 hp Pratt and Whitney J48 Turbojet 7250 pounds Pratt and Whitney T34 Turboprop 5500 eshp Pratt and Whitney .J57 Turbojet 10000 pounds Pratt and Whitney .JT-3 Turbojet 10000 pounds Pratt and Whitney J75 Turbojet 15000 pounds Pratt and Whitney JT-4 Turbojet 15000 pound;; Westinghouse J34 Turbojet 3400 pounds Wright R-1300 Piston 800 hp Wright R-1820 Piston 1425-1525 hp Wright R-3350 Piston 2700 hp Wright R-3350 Turbo Compound 3700 hp Wright J65 Turbojet 7700 pounds
Source: 1.
be carried only by bombers. Fighter interceptors fly faster, higher, farther, and are armed with guided missiles and rockets.
Production Facilities
Despite the fact that in 1950 we were producing less aircraft per month than we were in 1940, the floor space required for aircraft production had increased greatly. By June 1956, approximately 60 million square feet were being used in the manufacture of aircraft as compared to less than 10 million square feet in 1940.
Today, over-all space available for the manufacture of jet :fighters, bombers, guided missiles and civilian aircraft, engines and propellers is approximately 138,400,000 square feet- more than twice that used in 1950, and almost 11 times that required in 1940.
The cost value, before depreciation, of facilities devoted to aircraft and related production by 12 major aircraft companies is approximately one billion two hundred and eighty-two million dollars. About one-third is company-owned facilities, the balance is government-owned.
Since World War II, the aircraft industry has been reinvesting, as rapidly as is possible in keeping with sound business principles, much of its profits into modernization of existing facilities and in brick and mortar for new expanded facilities. Already having spent more than one

12 AVIATION FACTS AND FIGURES, 1957
billion dollars in research and test facilities since World War II, the aircraft industry is now planning to spend another billion for the same purpose in the next five to ten year period.
While some of the industry-financed expansion programs of the past and future have commercial applications, the bulk of the money is being spent primarily in an effort to evolve better military aircraft.
According to a report issued by a Congressional subcommittee, the 12
VALUE OF AIRCRAFT AND PARTS PRODUCED
1914 TO DATE
(Thousands of Dollars)
Year Value or Sales" Value Added by
Manufacture
1914 $ 790 $ 656 1919 14,373 7,246 1921 6,642 4,235 1923 12,945 9,116 1925 12,525 9,655 1927 21,162 13,645 1929 71,153 43,785 1931 40,278 27,177 1933 26,460 18,503 1935 45,347 30,986 1937 149,700 93,144 1939 279,497 183,247 1940 Jul-Dec 370,000 N.A. 1941 1,804,000 N.A. 1942 5,817,000 N.A. 1943 12,514,000 N.A. 1944 16,047,000 N.A. 1945 Jan-Aug 8,279,000 N.A. 1947 1,200,000E 954,575 1948 Apr-Dec 1,158,000 N.~. 1949 \ 1,781,000 1,344,068 1950 2,274,000 1,550,551 1951 3,456,000 2,662,993 1952 6,497,000 4,450,602 1953 8,511,000 5,764,300 1954 8,305,000 6,287,620 195!) 8,470,000 N.A. 1956 9,496,900
I; 18_"> .. N.A .
• 1914-1939: Value of Products 1940-1945: Value of Production at August 1943 Unit Cost. 1947-Date: Sales of Manufacturers of Complete Aircraft, Engines, Propellers, and Parts.
E Estimate. N.A.-Not available. Sources: 17, 18, 19, 22
..
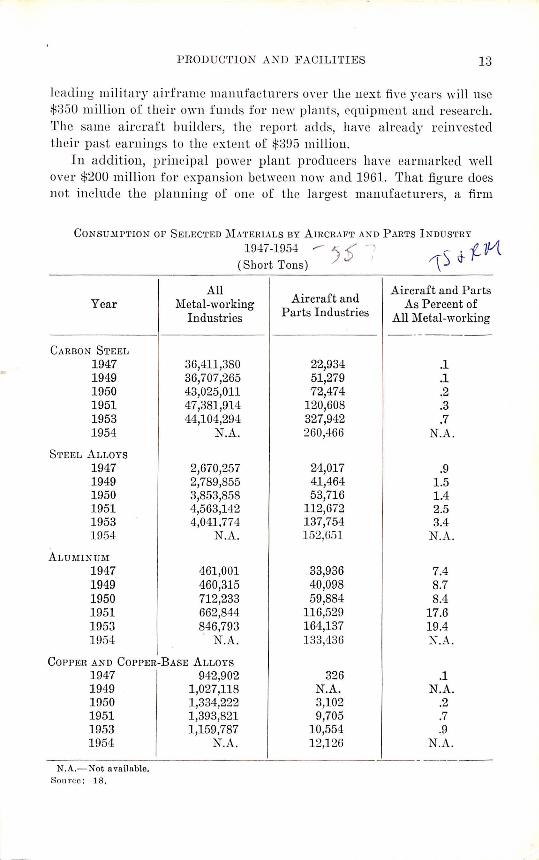
PRODUCTION AND F.-\CILITIES 13
lead ing military a irf rame mauufact urers OYer the uext fiy e yea rs will use $330 million of their o"·n f unds for n e\Y plants, equipmen t and r esearch. 'l'he !;ame a ircr aft builders, the r eport adds, have a lready r eim·ested their past earnings to the extent of $395 milliou .
In addition, principal power plant producers llave ea rmarked well over $200 million for expansion between now and 1961. That figure does not include the planning of one of the largest manufacturers, a firm
CONSUMPTION OF SELECTED i\L'.TERIALS BY AIRCRAFT AND PARTS I NDUSTRY
'\s ~ f-1Vl r- )§ "' (Short Tons)
1947-195-±
.All Aircraft and
Aircraft and Parts Year Metal-working As Percent of
I ndustries Parts Industries .All Metal-working -------- -
CARBON STEEL 1947 36,411,380 22,934 .1 1949 36,707,265 51,279 .1 1950 43,025,011 72,474 .2 1951 47,381,914 120,608 .3 1953 44,104,294 327,942 .7 1954 N.A. 260,466 N.A.
S·mEL ALLOYS 1947 2,670,257 24,017 .9 1949 2,789,855 41,464 1.5 1950 3,853,858 53,716 1.4 1951 <!,563,142 112,672 2.5 1953 4,041,77<! 137,754 3.4 19M N.A. 152,651 N.A.
ALUMINUM 1947 461,001 33,936 7.4 1949 460,315 40,098 8.7 1950 712,233 59,884 8.4 1951 662,844 116,529 17.6 1953 846,793 164,137 19.4 1954 N .A. 133,436 N.A.
COPPER AND COPPER-BASE ALLOYS 1947 942,902 326 .1 1949 1,027,118 N.A. N.A. 1950 1,334,222 3,102 .2 1951 1,393,821 9,705 .7 1953 1,159,787 10,554 .9 1954 N.A. 12,126 N.A .
- ---- -N.A.-Not avnilnble.
SO!l!·ce : l 8.

14 AVIATION FACTS AND FIGURES, 195i
AIRCRAFT ENGINE PRODUCTION,1917 TO DATE
Year
1917-1919 1926 1927 1928 1929
1930 1931 1932 1933 1934
1935 1936 1937 1938 1939
1940 1941 1942 1943 1944
1945 1946 1947 1948 1949
1950 1951 1952 1953 1954 1955 1956
N.A.-Not available. E Estimate.
TOTAL
N.A. N.A. N.A. 3,252 7,378
3,766 3,776 1,898 1,980 2,736
2,965 4,237 6,084 N.A.
11,172
30,167E 64,681E
138,089 227,116 266,911
111,650E 43,407 21,159 N.A N.A.
N.A. N.A.
31,382E 411\147E 27,519E 20,639E 24,501E
Sources: 1, 2, 17, 20, 21, 31, 4.4,
Military
44,453 842
1,397 2,620 1,861
1,841 1,800 1,085
860 688
991 1,804 1,989 N.A. N.A.
22,667 58,181
138,089 227,116 266,911
109,660 2,686 4,808 N.A. N.A.
N.A. N.A.
26,000E 34,500E 22,000E 13,000E 13,000E -
Civil
N.A. N.A. N.A.
632 5,517
1,925 1,976
813 1,120 2,048
1,974 2,433 4,095 3,800E N.A.
7,500E 6,500E ---
2,000E 40,822 16,361 9,032 3,982
4,314 4,680 6,382 6,647 5,519 7,639
11,501

PRODUCTION AND FACILITIES 15
which makes engines, helicopters and propellers and which alone spent $212 million between 1946 and 1956.
The remaining companies in the aircraft industry; i.e., makers of other guided missiles, helicopters, smaller aircraft and components, are scheduled to use another half-billion dollars of company funds for new buildings, machinery and research studies to insure that American air power remains dominant.
The aircraft industry is a multi-billion dollar activity dedicated primarily to the nation's security. If government-provided plants and equipment and government expenditures for research and development
-are added to the industry totals, the aviation manufacturing business is undoubtedly now the industry which does more basic and applied research and utilizes more expensive production machinery than any other. ~~
FLOOR SPACE OF AIRFRAME, ENGINE AND PROPELLER FACILITIES, 1939 TO DATE
(Millions of Square Feet)
Date TOTAL Airframe Engine Propeller -
Jan. 1, 1939 ............ 9.5 7.5 1.7 .3 Jan. 1, 1940 ............ 13.1 9.6 3.0 .5 Jan. 1, 1941. ........... 25.5 17.9 6.5 1.1 Jan. 1943 .............. 117.1 77.5 31.8 5.2 Dec. 1943 .............. 175.0 110.4 54.2 6.8 Dec. 1944 .............. 167.4 103.0 54.9 7.9 1947 (estimate) ......... 54.1 39.0 13.5 1.6 1950 (estimate) ......... 63.5 47.5 14.0 2.0 June 30, 1952 .......... 122.8 82.3 38.4 2.1 June 30. 1953 .......... 135.8 91.1 42.1 2.6 Sept. 30, 1954 ......... 127.5 91.0 33.7 2.8 Dec. 31, 1955 •....•..• 131.3 96.5 32.1 2.7 Dec. 31, 1956 .......... 138.4 101.5 34.1 2.8
Sources: 1, 3, 71.

16 AVIATION FACTS AND FIGURES, 1957
SALES OF 1\fANUFACTURERS OF COMPLETE AIRCRAFT, AIRCRAFT ENGINES,
PROPELLERS AND pARTS 1948 TO DATE
Year
--1948" 1949 950 1
1 1 1 1 1 ]
951 952 953 954 955 .956
To-TAL
--$1,158 1,781 2,274 3,456 6,497 8,511 8,305 8,470 9,496
(Millions of Dollars)
I Aircraft and Parts Aircraft Engines and Parts
To- u.s. To- u.s. Mili- Other Mili- Other TAL TAL tary tary
------------$ 748 $ 626 $122 $ 265 $ 222 $ 43 1,098 927 171 508 461 47 1,416 1,255 161 583 519 64 1,883 1,657 226 879 779 100 3,897 3,442 455 1,609 1,440 169 5,179 4,661 518 2,378 2,189 189 5,226 4,626 600 2,062 1,872 190 5,164 4,605 559 1,933 1,728 205 5,554 4,740 814 2,035 1,718 317
" Total for last three quarters of 1948 only.
Source: 22
. Aircraft Propellers Other
and Parts Prod-ucts
To- u.s. and Mili- Other Serv-
TAL ices tary -- ------
$ 48 $ 36 $12 $ 97 62 50 12 113 75 62 13 200
110 89 21 584 148 122 26 843 203 176 27 751 183 151 32 83 4 134 112 22 1,239 136 101 35 1,771
fi> ~ AIRCRAFT MATERIAL PRICE INDEX
f7- :~·ice Index for metals and hardware commonly used in constructing airframes compared with Wholesale Price Indexes for All Commodities
and for Industrial Commodities, 1947 to Date 1947-1949 = 100
Year All Industrial Aircraft
Commodities Products Material
'•
1947 96.4 95.3 92.4 1948 104.4 103.4 102.5 1949 99.2 101.3 105.2 1950 103.1 105.0 109.2 1951 114.8 115.9 120.9 1952 111.6 113.2 121.7 1953 110.1 114.0 127.1 1954 110.3 114.5 128.6 1955 110.7 117.0 136.3 1956 114.3 122.2 153.9
Source: 1, 67.

Manufacturer
Beech
Beech Boeing Boeing Cessna Cessna Chance Vought Convair Convair Convair
Convair Douglas Douglas Douglas Douglas Douglas Fairchild Grumman Grumman Grumman Grumman Grumman
Lockheed
Lockheed Lockheed Lockheed
Lockheed Martin Martin Martin McDonnell McDonnell McDonnell North American North American North American Northrop Republic
Republic Rtroukoff Tern co
Sourre: 1
PLANES IN PRODUCTION
MILITARY AIRCRAFT
-Type Service Name
Liaison Army Twin Bonanza
Trainer Navy, USAF Mentor Bomber USAF Stratofortress Tanker USAF Stratotanker Trainer USAF -Liaison Army, Marines Bird Dog Fighter Navy Crusader Fighter USAF -Fighter USAF -Transport/ USAF, -Trainer Navy -Bomber USAF Hustler Fighter Navy Skyray Attack Navy Skywarrior Attack Navy Sky hawk Bomber USAF Destroyer Cargo USAF -Cargo USAF Provider Fighter Navy Cougar Fighter Navy Tiger Anti-submarine Navy Tracker Cargo futility Navy Trader Utility USAF, Albatross
Navy,CG Anti-submarine USAF, Super
Navy Constellation Fighter USAF Starfighter Cargo USAF Hercules Trainer USAF, Shooting Star
Navy (Sea Star) Patrol Navy Neptune Minelayer Navy Sea Master Patrol Navy Marlin Bomber USAF ----Fighter Navy Demon Fighter Navy ----Fighter USAF Voodoo Fighter Navy Fury Fighter USAF Super Sabre Trainer Navy ----Trainer USAF ----Fighter USAF Thunder-
streak Fighter USAF Thundercl1ief Transport USAF ----TrainPr Navy ----
I(
~
Designation
L-23B
T-34 B-52 KC-135 T-37 L-19, OE-2 F8U F-102 F-106 T-29, C-131, R4Y B-58 F4D A3D A4D B-66 C-133 C-123B F9F-8 FllF-1 S2F-1 TF-1 SA-16, UF-1
WV-2, EC-121
F-104 C-130 T-33, TV-2, T2V P2V-7 P6M-1 P5M-2 B-57 F3H-2N F4H F-101 FJ-3, FJ-4 F-100 T-28C T-38 F-84F
F-105 C-134 TT-l

AVIATION FACTS AND FIGURES, 1957
ALUl\IINUlii, CoPPER, AND STEEL CONSUMED IN MILITARY PROGRAMS, 1952 (Thousands of Pounds)
(Shipments by Metal Producers to manufacturers for incorporation in selected Department of Defense and Atomic Energy Commission Programs)
Electron-Total ics& AEC Op-
Depart- Commu- erations mentof Guided nication (excludes Defense Aircraft Missiles Equip- Construe-
andAEC A-1 A-2 ment A-7 tion) E-2 Programs Program Program Program Program
ALUMINUM-ALL PROD-UCTS-TOTAL .......... 602,508 370,687 5,616 28,725 4,976
Rolled Rod, Bar, and Structural Shapes .... 127,368 84,563 679 2,702 684
Wire, Other than Conductor .......... 2,418 1,255 5 130 . 36
ACSR and Other Cable . 1,026 29 - - 7
Insulated Wire and Cable, and Bare Wire Conductor ..... 1,175 289 1 13 3
Extruded Shapes, Soft Alloy .......... 18,217 5,683 181 2,135 639
Hard Alloy ......... 69,555 53,979 888 331 485
Tubing, Drawn, Soft Alloy .......... 8,674 2,725 62 1,298 117
Hard Alloy ......... 11,092 3,264 140 196 15 -
Sheet and Plate, Non-heat-treatable .. '-. 97,429 27,162 593 14,317 750
Heat-treatable ....... 229,990 191,661 3,062 5,274 2,239
Foil .................. 2,506 50 1 2,327 1
Powder, Flake, and Paste .............. 33,508 27 4 2 -
-_;>

L
~ ' PRODUCTIO::-l AND FACILI'I'IES
ALU ~ I J::\ U M , CoPPER, AND Sn:EL CoKSUi\IJ;D ~ ~ ::\IJLI'l'ARY Pnoan.AMS, 195:2 Continued
(Thousands of Pounds)
(Shipments by Metal Produeer s to manuf act urers for incorpora tion in selected Department of Def ense and Atomic Energy Commission Programs)
CoPPER AND CoPPER-nASE ALLOY PRODUCTS--TOTAL . .. ... .. .. . .. .. .
Total Department of Defense
and AEC Programs
868,045
Ai rcraft A-1
Program
Guided lVI.issiles
A-2 Program
E lectron-ics &
Communica t ion Equip-
ment A-7 Program
31,901 1,661 58,903
Brass Mill P r oducts-- I~ .L \
Total .. ... . ... ..... .
Unalloyed, Rod . .. ... .... ... .
Sheet ... . . .. . . . .. .
Tube ... .. . ...... .
A lloyed, Rod . . ... . . . . .... .
Sheet ... . . ... .... .
Tube ... . . . .. .. .. .
W ire Mill Products ... .
Fou ndry Products . . .. .
Powder Mill Products . .
655,504
4,633
20,630
20,506
268,611
291,974
49,150
152,082
54,860 - - - - II
5,599
STEEL MILL PRODUCTS-- I TOTAL . . . . . . . . . . . . . . . . 6,264,963
Carbon and Low Alloy . 5,322,754
Full Alloy .. ... ..... .. 849,680
Stainless .. .. .. ... .. ... 92,529
Source : 15. (.) 6 C'V
o l w / tf1.1D
.... ,{?/tff
14~ 594 \ 13,978
1, ~7 \ 47 253
00 ~ 998 --- 90 - - \58 I-288
9,2P6 2\ 3 I 7,535 --- -- I-- - -t-
1,5 9 12) 1/ 3,852 1----+-
1,0£13
11,198
5,944
5
90) --- 1-
1 8
(Short Tons)
285,930 --
103,532 --
128,705 --
53,693 --
1,052
42,596
2,289
40
31,073
27,535
1,467
2,071
AEC Operations (excludes Construction) E-2 Prog ram
3,494
2,220
135
625
450
709
209
92
1,058
78
138
--
--
--
--
I }
·------------
7
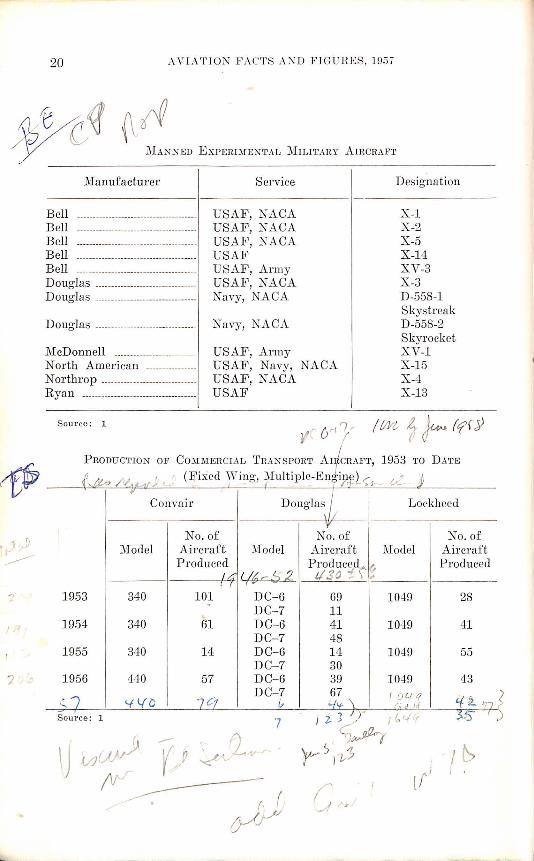
20 AVJA'l'JO l\ J<'ACT S A~D FIGU RES, 1957
Bell Bell Bell Bell Bell
Manufacturer
Douglas --------------------------------Doug !as _____ --------- -----------------
Douglas -------------------------------
McDonnell --------------------------North American _____ __ ________ _ Northrop ------------------------------Ryan ------------------------------------
Service
USAF, NACA USAF, NACA USAF, NACA USAF USAF, Army USAF, NACA Navy, NACA
Navy, NACA
USAF, Arm y USAF, Navy, NACA USAF, NACA USAF
Designation
X -1 X-2 X-5 X-14 XV-3 X-3 D-558-1 Skystreak D-558-2 Skyrocket XV-1 X-15 X -4 X -13
Source : 1 - t'. r( 'I , I tiVt 4 L .. (f f Y t v 1 (1 (j~-
CoMMERcrAL TR ANSPORT Ar/ cRAFT, 1953 'l'O DNrE (F d \ T '[ (,~ N. ~ 4 _:, · . ~, i xe \ ing, iV ultiple-EngipJ: l ,--
C--- j • I - >I- -
PRODUCTION OF
" Douglas,/
1 Convair Lockheed
'Y
No. of No. of No. of Model Aircraft Model Aircraft l\Iodel Aircraft
Produced Produ c~d\1'' P roduced l f c 16 -- ::;_ 2 1/ Jo , "' I I
1953 340 101 DC-6 69 1049 28 DC-7 11
1954 340 61 DC-6 41 1049 41 DC-7 48
1955 340 14 DC-6 14 1049 55 DC-7 30
1956 440 57 DC-6 39 1049 43
·~J DC- 7 67 I OL! '1 '! !_ ''? '-f l( D ·zcz & Y.'t G • 1<1 = ' Source : 1 7

PRODUCTION AND FACILITIES 21
U. 8. AIRFRAME WEIGHT PRODUCTION, 1939 TO DATE
Weight in Millions of Pounds (Excluding Spares) Year -
TOTAL Military Civil - ·
1939 12.5 10.1 2.48
1940 27.8 23 .1 4.7E 1941 86.1 81.4 4.7E 1942 275 .9 275.9 -1943 654.7 654 .7 -
1944 962.4 962.4 -1945 542 .2 540 .5 1.7 1946 38.4 12.9 25.5 1947 29.3 11.4 17.9 1948 35 .3 25.2 10 .1
1949 36.5 29.8 6.7 1950 41.08 35.0 8 6.0 1951 55.08 50.08 5.0 1952 117.38 108.08 9.3 1953 151.'11" 141.08 10.4 1954 140.58 130.08 10.5 1955 124.28 114.08 10.2 1956 111.68 95.58 16.1
> E Estimate. So u rces : 1, . 20, 31, 33, 39 .
; ..:::,

\
MILITARY AVIATION
During the last five years an inventory of air power has been bui lt by the United States aircraft industry and the mil itary services which has been described as the greatest war deterrent the world has ever known. Technological progress in this period has resulted in aircraft superior to those of any nation. Dramatic advances in air power have made inter-hemisph eric warfare a possibility for the fi rst t ime in history. The development of the intermediate and intercontinental ballistic missile is being given top priority.
Spurred by the n eeds established for military purposes, the air craft industry has produced aircraft and missiles with performance undreamed of a few years ago. Nuclear ·weapon ed bombers today fly at transonic speeds and are capable of circling the globe in less t han 46 hours. Superson ic fi ghters and inter ceptors- many of these armed with g·uided miss iles containin g nuclear warheads- are now integral pa r ts of today's Air Force and Naval Air .. Wings. Defense Policy
Qualitative superiority is the guiding pol iey of th is nat ion. Maintaining th is su periority in a ir p0wer , which wi' · deter war, is the mutual goal of the aircraft industry and the mi litary services. To compete quantitat ively with a potential agg ressor is not the intent of this country.
22

MILITARY AVIATION 23
MILITARY PLANE FLIGHTS IN ONE HOUR
1957
Attempting to build more aircraft, to have more nuclear weapons, and to have more people in se rvice t han an aggressor in this era of cold war a nd peacetim e economy would d is rupt our economy and might th reaten nation al bankruptcy. In effect, th e very "·~y of life we are seeking to presen e could be destroyed. The aircraft industry proved during World \~Tar II that it could r each production levels that would out-produ ce all t he other n ations of the world combined.
The introduct ion of n ew equipment and weapons with vastly gr eater combat capabili ty is also having a powerful impact on military strategy, tacti cs, and organization . Th e combat power of our divisions, wings, and warships has incr eased to snch an extent that it is no longer valid to nwasure military ]lO\H'r in terms of the number of such units. Our nuel ear weapons a nd our ab ility to employ them constitute the most effective deterren t to a n attack on th e free nations.
Expenditures by th e Department of Defense for major national securi ty reflect this " guns and butter " policy. Expenditures for the military decreased after the Korean \Va r . For the past several year s they haye r emained r ela tively steady and a re rstimated to remain in the range of $88 billion to $40 billion annn ally in t he coming fi scnl years 1958 throug·h l!JGO. 'fh ese estimates are pred icated on maintaining the present fon:r lcn'ls and deployments. D efense D epartment feels thnt a sudd en s harp incr ease of t he military budget n ot only wou ld be mi sunderstood .

..
24 AVIATION FACTS AND FIGURES, 1957
T OTAL F EDERAL EXPENDI TURES .AND EXPENDITURES FOR :MILI TARY
AIRCRAFT AND RELATED PROCUREMENT
Total Fiscal Federal Year Expendi-
t ures
1922 $ 3,373 1923 3,295 1924 3,049 1925 3,063 1926 3,098
1927 2,974 1928 3,103 1929 3,299 1930 3,440 1931 3,652
1932 4,535 1933 4,623 1934 6,694 1935 6,521 1936 8,493
1937 7,756 1938 6,938 1939 8,966 1940 9,183 1941 13,387
1942 34,187 1943 79,622 1944 95,315 1945 98,703 1946 60,703
1947 39,289 1948 1 33,791 1949 40,057 1950 i 40,156 1951 T 44,633
1952 66,145 1953 73,982 1954 67,772 1955 64,570 1956 66,540 1957E 68,900 1958E 71,807
/
a Includ es Guided Miss il es. E E stimate. Sources : 8, 2 6, 2 7, 46, 75 .
1922 TO DATE
(Dollar Figures in Millions )
T otal Expenditures Percent Military for Aircraft Aircraft Percent E xpendi- and Related of T otal Aircraft
tures Items• Federal of Military
$ 935 $ 6 .2 .6 730 7 .2 1.0 689 10 .3 1.5 717 10 .3 1.4 677 12 .4 1.8
688 14 .5 2.0 732 22 .7 3 .0 791 29 .9 3 .7 839 31 .9 3.7 832 31 .8 3 .7
834 29 .6 3 .5 784 25 .5 3.-z 706 13 .2 1.8 924 23 .4 2.5
1,147 44 .5 3 .8
1 ,185 58 .7 4 .9 1 ,240 67 1.0 5.4 1,368 68 .8 5.0 1,799 205 2.2 11.4 6,252 587 4.4 9.4
22,905 2,915 8.5 12 .7 63,414 10,072 12.6 15.9 75,976 12,828 13.5 16.9 80,537 11 ,521 11.7 14 .3 43,151 1 ,649 2 .7 3 .8
14 ,769 593 1.5 4.0 11,983 703 2.1 5.9 13,988 1,248 3.1 8.9 13,440 1,705 4.2 12.7 20,821 I • ~ 2,536 ~ 5.7 12.2
- f
38,967 )'• ) 5,712 s ll 8.6 14.7 47,565 cJc , () 8,605 1 I 11.6 18.1 ..1
40,336 !./ ' .. 9,247 •7;. ,, 13.6 22.9 35,533 .., ' \
.), ·- 8,794 'j , . v 13.6 24.7
35,791 , . 8,046 •i . 12.1 22.5 36,005 ; ~ 7,861 ~ t , 11.4 21.8 38,031
-. 8,113 11.3 21.3 ; I
lv I

.L/.~~ p /;6'b_ ~.,v-y
'· ~ I r· li i ,1 ~
r II-. ,/ L( ' - .,_ .l .,
.>
\' • j ~~ / ~t .•, 1
. ,:>/~;, -" :;, ;n·b ' \ .-' / ::-s.H" (j, (.!_·
./. v· I MILITARY AVIATION . - ' 25 \
~~ I
f}~(l AIRCRAFT ON HAND
1939 TO DATE
U.S. Air Force
Year Total" Ta cal Trainers
1939 2,546 1,647 - ;·- 138 2,098 1940 3,961 1,760 ~0 2,166 1941 12,297 4,477 5,233 1942 33,304 11,607 / '4,653 11,772 1943 64,232 27,448 10,733 25,588
1944 72,726 41,961 17,060 .! 36,100 1945 44,782 26,077 7,617 29,714 1946 30,035 17,186 6,297 19,301 1947 23,814 13,118 5,714 14,976 1948 20,068 8,888 6,177 14,894
1949 17,222 7,863 5,811 14,015 1950 17,337 7,854 5,961 13,412 1951 19,021 8,135 6,556 13,21::1 ,';,,~·~ 1952 20,436 8,5,01 7,099 13,694 1953 22,278 ~;152 7,502 13,308 ('5 [).
!; t~{) .[QQ·· __ . ;· N.A. N.A . N.A._ ____ -- -13...~~!) A
(._25,10.0 ' ------N:~.c - N.A. --n. 13,191 r.' . 1956 24,600 N.A. N.A. N.A. 13,710/) 1957 24,000E N.A. N.A. /~ N.A.
. N.A.-Not available. • As of December Sl. .-· & As of June SO from 19S5-19S9: as of December S1 from(1940 to 1952: as of June SO from
1958-1955.: as of January 1. 1956. ,, . . . . c- 'l( ?)-. c -/2c/ ttz< E Estimate. ·. 1 ':--- ~.._.... ~ ~· :.. -· Sources: 1, a, 8, 75, 76. -. 7 (.?: "
• :~ ... r .. ~ t .. ~ , {7 .') .»-· .~.- ;;; Y .. ->_ /.1_;:.;·
all over the world but also would require the imposition of some types of controls on the economy.
Currently the aircraft industry is competing in the open market for the engineers, scientists, and technical manpower essential to buildin~ aircraft. Yet the aircraft coming off the production lines are weapon systems far superior to those built under the complete mobilization controls in effect during World War II.
Ten years ago speed was spoken of in miles per hour, and altitudes in terms of feet. Now speed is measured by mach numbers (multiples of the speed of sound). and altitude is measured by miles into the stratosphere. Since World War II, the advances in aircraft perform-
o_ L~ -:'.:A . I
'7 ·::..) 7
' . , /l .. C,- ()._~ .:· -;:... ! r·, /~·,, '. <-·, ., f' r II/;·' jl-t-' '].'t .. ')' .~J~fl,. /),:;_)'j ,',_1:'..:•' ("-·"-/ cr'?

26 AVIATION FACTS AND FIGURES, 1957
ance have tripled speeds, doubled operational altitudes, increased fire power by seven or eight times and have extended range by a factor of two or three.
Aviation Aspects of Defense Spending Expenditures for the procurement of aircraft, missiles and related
items represent about 21 per cent of the total military expenditures. The aircraft portion of these expenditures has decreased during the last few years as force levels haYe been met and guided missiles have come into the inventory. Expt>nditures for the procurement of aircraft are estimated at about $6.74 billion in fiscal 1938, compared to the $6.79 billion estimate for fiscal 1957, $7.15 billion in fiscal 1956, and $8.04 billion in fiscal 1955. Simultaneously expenditures for the procurement of missiles have increased 179 per cent in the last four years from $718 million in fiscal 1955 to an estimated $2.04 billion in fiscal 1938. Guided missiles continue to supplement manned aircraft in the im·entories of the military services as technology progresses to more automatic weapon systems and higher performance.
Force Levels The Defense Department has revealed that the 128-Wing Air Force
strength would be achieved by June 30, 1958 and would be as follows: 45 wings-Strategic Air Command (all bombers or strategic recon
naissance, no fighters) 32 wings-Air Defense Command
NAVAL AVIATION PERSONNEL", 1941 TO DATE
Year Enlisted as of TOTAL Pilots Aviation
June 30 Rates
1941 23,14& 6,300 14,848 1944. 299,968 47,276 228,356 1950 91,298 12,978 76,349 1951 162,214 18,287 139,838 1952 194,730 20,944 168,486 1953 196,813" 22,903 163,673 1054 179,783" 21,316 147,670 1955d 165,243° 21,352 133,424 1956" 204,388 23,740 175,588
I
o Nnvy and Jllnrine. b Pilots as of Aug. 31; others as of October 31. • Includes non-pilots in flying status and formerly designated piJ .. ts. d As of January 1. • As of November 80, 1956. Source: 77
Aviation Ground Officers
2,000 24,336 1,971 4,089 5,300 4,930 4,725 4,R85 5,060
<: '

:III LIT ARY A VI A'riON 27
LENGTHENING RANGE OF MILITARY FLIGHTS
1940
1957
51 wings-Tactical Air Command (including 15 'l'roop Carrier \Nings - heavy, medium and assault and one i\fatador Missi le Wing)
By t he end of fiscal 1958, the Navy plans to haYe 17 Carrier Air Groups, 20 Carrier Anti-Submarine Squadrons, and Three lVIarine Aircraft \¥ings in operation.
'l'h e Army is planning for 19 divisio nal (aircraft) detachments, 32 heli copter companies, and 3 fixed-win~· g roups.
Strategic fighter wings are being eliminated in the Air l~orce, for they are no longer considered n ecessary to su pport the transonic and supersonic bombers. By the end of fi scal 1958, Str ateg ic Air Command is expected to inclu de eight wings of heavy .iet bombers, three wings of heavy piston bombers, and 28 wings of med ium bombers, plus st rategic reconnaissance a ircraft. Th r grratcr mobi li t.r and effect iveness of tactical a ircr aft cou plr ll with thr g ro\\·inp: guid r<l missil r capabiliti rs of the 1\rm.r, permit a. rrd ndinn in t·he 11umbcr of J\it· Forl'C ta ctical wings. The three lVIarine divisions and a ir wings a re now being equipped with a variety of atomi c weapons and are continually improving their capa-

28 AVIATION FACTS AND FIGURES, 1957
APPROPRIATION S AND E XPEN DITURES FOR l\I[ILI'£ARY AVIATION
1899 TO DATE
(Mill ions of Dollars)
U. S. Air Force Naval Aviation Fiscal Year Total Cash Expenditures T otal Cash Expenditurl's
Appropriations Appropriations
1899 $ .05 N.A. $ - N.A. 1909 .03 N .A. - N.A. 1912 .12 N .A. .03 N.A. 1913 .10 N.A. .01 N.A. 1914 .17 N.A. .01 N.A.
1915 .20 N.A. .01 N .A. 1916 .80 N.A. 1.0 N.A. 1917 18.7 . N.A. 3.8 N.A . 1918 735 .0 N.A. 61.5 N .A. 1919 952.il N.A. 220.4 N .A.
1920 28 .1 N .A. 25.7 N.A. 1921 35.1 $ 30.9 20.0 N .A. 1922 25 .6 23 .1 19 .1 $ 14.3 1923 13.1 18 .1 14.8 14.2 1924 12.6 11.0 14.7 14 .3
1925 13 .5 11 .7 15.7 15 .5 1926 15.9 14 .9 18.2 18 .1 1927 15.3 16.8 22.4 22.0 -1928 21.1 19.4 I 20 .3 19.8 1929 28 .9 23.3 32 .3 32 .1
1930 34.9 28 .1 31.6 31.1 1931 38.9 38.7 32.1 31.0 1932 31.9 33.0 31.2 31.7 1933 25.7 22.1 25.4 31.2 1934 31.0 17 .6 29.8 15.5
1935 27 .9 20 .5 32.1 17 .2 1936 45 .6 32.2 40.8 20.5 1937 59.6 41.3 38.9 27.5 1938 58.9 51.1 51.6 59 .8 1939 71.1 83.4 48.2 47 .9
. 1940 186.6 108 .5 111.8 50.8 1941 2,173.6 605.9 453 .0 193.6 1942 23,049.9 2,555.2 6 190.0 993.1 1943 11,317.4 9,392.4 i ~ 58.0 3,966.4
(Conti nued top next page)

)JILI'r ARY AVIATION
A t'l' tW t'R tNl' IONS AN D ExPE N DITURES FOR .MILITARY AviATION
1899 •ro DATE-Continued (Millions of Dolla rs )
U. S. Air Force Naval Aviation
29
Fiscal Year T otal Cash
Appropr ations Expenditures Total Cash
Appropriations E xpenditures
23,656.0 1,610.7
1944 1945 1946 1947
.5 1,200.0
r----1---608~ l .
N.A.-Not a va il E Estimate.
829.8 s
13,087.7 11,357.4
2,519.4 854 .3
4,583 .7 2,539.6
795.0 770.8
906.0
. 588.3 1 ,041.5 3,815 .3 5,266.5 4,873.0
4,490.1 5,166.0 1,065.7
749.1
747 .9
875.1 989.4
1,237 .3 2,205.2 3,061.3
3,235.6 2,554.8 2,836.1 2,571.0 2,710.0
a FY 19 9 Con s tru cti on of Airc r a f t & R clnted Proru rem ~nt n-pprpp inti on ena cted in FY HJ48. Sources : 3 8 , '1.-'6,_,___,7_,.5 ___ -J'-----------
bility for amphibious assault operations. 01·ganization of Wings, Air G1·oups
Air F orce : 'l'he basic organizational unit of the United States Air Force is the ''wing.'' A wing is comprised of a combat group and necessary administrative and ser vice units. The number of airplanes in a wing depends on its mission ; for example, a wing of heavy bombers has 45 planes, a medium bomber wing has 45, a light bomber wing 48, a day fighter wing 75, an all-1\·eather fi ghter squadron 25. 'l'he USAl<' also operates separate sq uadrons fo r r escue, support and in-flight r efueling. There are 20 a ircr aft per in-flight r efu eling squadron. '!'here are 6 to 10 aircr aft p er air r rscne squadron depending on the mission.
Navy : Navy carrier ai r groups usually a re composed of 2 fighte r squadrons; 2 attack sq uadrons; 1 heavy attack squadron or detachment; 4 photo planes; an<l 4 a ircraft early warning ( i\E\V) planes. Sn pt'r

30 AVIATION FACTS AND FIGURES, 1957
if s. PERSONNEL IN THE UNITED STATES AIR FORCE, 1912 TO DATE
As of June 30 TOTAL Officers Aviation Airmen Cadets
1912• 51 12 - 39 1914 122 18 - 104 1916 311 63 - 248 1918b 195,023 20,708 - 174,315 1920 9,050 969 - 8,081
1922 9,642 958 113 8,571 1924 10,547 884 119 9,544 1926 9,674 954 142 8,578 1928 10,549 1,055 280 9,214 1930 13,531 1,499 378 11,654
1932 15,028 1,659 325 13,044 1934 15,861 1,545 318 13,998 1936 17,233 1,593 328 15,312 1938 21,089 2,179 342 18,568 1940 51,165 3,361 1,894 45,910
1941 152,125 10,611 8,627 132,887 1942 764,415 55,956 50,213 658,246 1943 2,197,114 205,874 99,672 1,891,568 1944 2,372,292 333,401 82,647 1,956,244 1945 2,282,259 381,454 16,764 1,884,041
1946 455,515 81,733 7 373,775 1947 305,827 42,745 53 263,029 1948 387,730 48,957 1,338 337,435 1949 419,347 57,851 1,860 359,636 1950 411,277 57,006 2,186 352,085
1951 788,381 107,099 2,476 678,806 1952 973,474 128,401 6,782 838,291 1953 977,593 130,769 9,157 837,667 1954 947,918 129,752 9,072 809,094 1955 959,946 137,149 4,384 818,413 1956 909,958 142,093 3,256° 764,609
---X.A.-Not avai!n.ble. • As of Novemlu•r 1. • AR of Novemhe•· 11. c This category includes a totul of 263 Air For<·e Cadets not shown "n previous years. Soure: 8.

:\IILITARY AVIATION ~ 31
AIRCRAFT ACCEPTED BY THE USAF AND NAVY 1946 TO DATE
-TOTAL USAF Navyo
Airframe Airframe Airframe Weight, Weight, Weight,
Calen- Number Excluding Number Excluding Number Excluding dar of Spares of Spares of Spares
Year Aircraft (1,000's Aircraft (1,000's Aircraft (1,000's of Pounds} of Pounds) of Pounds)
1946 1,409 12,707 650b 7,799b 759 4,908 1947 2,117 11,441 1,197b 5,5866 920 5,855 1948 2,204 24,306 1,055 15,821 1,149 8,485 1949 2,290 29,604 1,475 23,149 815 6,455 1950 2,655 35,941 1,670 26,803 985 9,138 1951 5,521 51,659 4,148b 40,000b 1,373 11,659 1952 9,284 107,422 6,973b 88,ooob 2,311 19,422 1953 10,630 138,396 8,204b 109,908b 2,426 28,488 1954 8,729 130,546 6,507b 104,653b 2,245 25,893 1955 8,ooom 114,000E 6,000E N.A. 2,000E N.A. 1956 6,800E 95,500E ~8QOE N.A. 2,000E N.A.
Y'A ~ l ~.tNot available. E Estimate. a Includes USAF acceptances for Navy, excludes Navy acceptances for USAF and Army. b Includes USAF acceptances for other agencies. The duplication in acceptances accounts
partly for the diffm·ence between this table and the table on page 9. Sources: 8, 49, 75. 'J.(J-(0 #'[ W ~)
t~"-,-- ,/ (
aircraft carriers of the Forrestal Class (60,000 tons) have up to 80 to 120 aircraft. Large Midway Class (55,000 tons) carriers have slightly less. aircraft, while medium size carriers of the Essex Cla<;s (33,000 tons) have a complement of 70 to 80 aircraft. Anti-submarine squadrons attached to light and escort carriers average about 22 aircraft and shore-based patrol squadrons, have a complement of 12 planes each. Marine fighter squadrons are assigned 24 aircraft.
Army: An Army detachment currently has 26 to 28 aircraft per division depending on whether it is infantry or armor and is assigned to a division in liaison, reconnaissance, observation, and courier missions. Helicopter companies are light, medium or heavy depending upon the type of helicopters used. Each company has 21 helicopters. A fixed-wing group has 21 basic I% ton, 11-passenger aircraft and is assigned to field Army level.

32
Fighter. Speed
Range Fire power
Bomber. Speed
Range
Fire power
Bomb load
AVIATION FACTS AND FIGURES, 1957
\VAnPLANE PROGREss SINCE THE SEcOND Wom,n \VAn
1945
P-51 470mph
Over 2,000 miles Six 50-cal. guns in
wings. Can carry ten 5-inch HV AR with zero launchers or two 1,000-lb. bombs.
B-17 285mph /
2,500 es
Tw; ve 50-cal. machine guns
2,800 pounds
1953
F-100 Supersonic. 755.149
mph Over 1,000 miles 20 mm canons
B-47 600 mph class
Over 3,000 miles
20 mm cannons in tail
Over 20,000 pounds
1955
F-106 Supersonic (Mach 1
or above) Range and armament
not disclosed
B-58 Supersonic (Mach 1
or above) Range and armament
not disclosed
--------~--------------~-----------------~--------------Source: 43.
Aircraft Inventory
Total active aircraft inventory, scheduled to be reached at the end of fiscal year 1958, will be 41,219 aircraft: Air Force, 24,398; Army, 5,031; and Navy, 11,790. This compares with an inventory of 42,650 at the end of fiscal year 1957. In this connection, the Air Force will decrease its active inventory by 2,300 units, the Navy hwentory will be down some 600 units, while the Army increases by 1,500 units.
Air Force Planned Obligations fot· Aircraft in Fiscal 1958
Percent of Total Cost Percent of Number Total Number (in Millions) Total Cost
121 697 212 485
--. 1,515
l ')U'J ~__ / ·-
8 $ 999.4 36.4 46 1,167.0 42.5 .14 462.1 16.8 32 118.4 4.3
100 $2,741 I 100.0
I - I " '}' J'
,--~
' I

\ 7
\ . 'l
GUIDED MISSILES
Missiles ha\·e been used by man in combat since the day he first learned to fashion a spear and hurl it at an enemy. Since that day, more than 20,000 years ago, man has devoted countless talents and treasures to improving the warhead, the power system a11d the guidance system. 'l'he intercontinental balli stic missile is a direct descendant of th e spear.
Th e guided missile today is one of the most sophisticated \reapons in the U. S. arsenal. The vast publi c in terest in th e guided missil e and its characte rizat ion as the " ultimate weapon " makes it necessa ry to keep th e defin ition clear. It is not simply a weapon, but rather a category of weapons. Different types of missiles are r equired for specific missions. 'l'he over-all rol e of the missile is to destroy an enemy target automatically and effectively. The target can be as small as an enemy aircraft or missil e, or cover several square miles. The target may be a fix ed one, snch as a city or a troop concentration, or it may be moving
3B

34 AVIATION FACTS AND FIGURES, 1957
UNEXPEXDED FUNDS AVAILABLE FOR THE PROCUREMENT OF GUIDED :MISSILES
AND OF AIRCRAFT, JANUARY 311 1957 (Million Dollars)
Guided Missiles Aircraft '
Defense Department $4,175 $18,560
Air Force ............... 2,360 13,187 Navy .................. 635 5,026 Army .................. 1,180 347
Source: 37
OBLIGATIONS FOR RESEARCH AND DEVELOPMENT ON GUIDED MISSILES
AND ON AIRCRAFT--DEPARTMENT OF DEFENSE
(Million Dollars) ..
Fiscal Guided Aircraft and Year Missiles Related Equipment
1954 $231.4 $269.8 1955 214.0 293.6 1956 280.5 352.2 1957E 346.5 282.1 1958E 331.8 276.2
EEstimate.
Source: 46
at a speed faster than sound miles above the surface of the earth. " The ICBM, for example, is not designed to knock down an enemy air-
craft; a surface-to-air missile for aircraft defense would be of little or no use against a ground target. This means that missiles must be developed for highly specialized missions.
The trend toward missiles has been greatly accelerated in the past three years. The Air Force estimates that in 1954, about 90 per cent of the procurement money went for aircraft and approximately 10 per cent for missiles. In the current budget for fiscal 1958, about 35 per cent of the procurement money will be spent on missiles, and in 1961, the money will be split 50-50 between aircraft and missiles.
A meeting between the President of the United States and the Premier of Great Britain indicates that British units will be equipped with U. S.

GUIDED )IISSILES 35
missiles. The industry anticipates no difficulties in handling this additional demand for American missiles. One leading manufacturer in 1956 doubled the number of personnel engaged in the deYelopment and production of missiles and expects to double it again this year.
This shift in air power emphasis, stemming from an aggressive program of missile research and deYelopment work by the aircraft industry, is haYing profound effects. The newest facilities for aerial weapons were built for the produetion of heaYy bombers. These structures feature high
EXPE:-1DITURES FOR THE PROCUREMENT OF GUIDED MISSILES AND AIRCRAFT (Million Dollars)
Fiscal Year Guided Missiles Aircraft
Ending June 30
1951 $ 21 $2,412 1952 169 4,888 1953 295 7,417 1954 504 8,335 1955 718 8,037 1956 1,168 7,146 1957E 1,506 6,786 1958E 2,039 6,737
E Estimate.
Source: 38
EXPENDITURES FOR THE PROCURElolENT OF GUIDED MISSILES (Million Dollars)
Fiscal Year TOTAL Air Ending DEFENSE Navy
June 30 DEPARTMENT Force
1951 $ 21 $ 16 $ 5 1952 169 66 56 1953 295 81 95 1954 504 176 141 1955 718 305 176 1956 1,168 641 194 1957E 1,506 860 221 1958E 2,039 1,213 264
E Estimate.
Source: 38
Army
$-46
119 187 238 333 425 562
36 AVIATION FACTS AND FIGURES, 1957
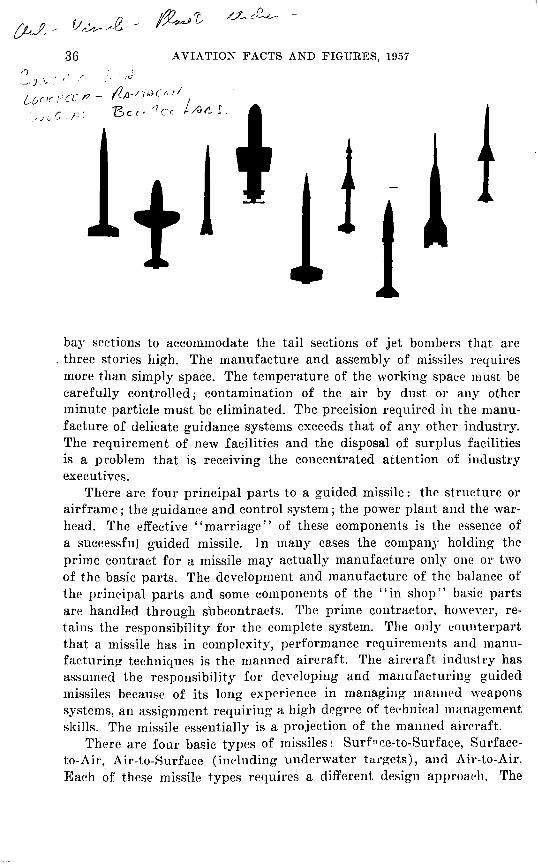
bay sections to accommodate the tail sections of jet bombers that are .. three stories high. The manufacture and assembly of missiles requires
more than simply space. The temperature of the working space must be carefully controlled; contamination of the air by dust or any other minute particle must be eliminated. The precision required in the manufacture of delicate guidance systems exceeds that of any other industry. The requirement of new facilities and the disposal of surplus facilities is a problem that is receiving the concentrated attention of industry executives.
There are four principal parts to a guided missile: the structure or airframe; the guidance and control system; the power plant and the warhead. The effective ''marriage'' of these components is the essence of a successful guided missile. In many cases the company holding the prime contract for a missile may actually manufacture only one or two of the basic parts. The development and manufacture of the balance of the principal parts and some components of the ''in shop'' basic parts are handled through stibcontracts. The prime contractor, however, retains the responsibility for the complete system. The only counterpart that a missile has in complexity, performance requirements and manufacturing techniques is the manned aircraft. The aircraft industry has assumed the responsibility for developing and manufacturing guided missiles because of its long experience in manJlging manned weapons systems, an assignment requiring a high degree of technical management skills. The missile essentially is a projection of the manned aircraft.
There are four basic types of missiles: Surf<~ce-to-Surface, Surfaceto-Air, Air-to-Surface (including underwater turgets), and Air-to-Air. Each of these missile types requires a different design approach. The

I
//
:Missile
Air-to-Air
1 vN1 1'-'\
-~. ,l c, <..
GUIDED liiSSILES
l\IISSILES-0PER.ATION AL
:Manufacturer
Falcon Hughes Sidewinder Philco & GE
37
Service
USAF Navy
Sparrow [~ .:;. Douglas Navy .. l1 ~ 0 {Sperry
Raytheon • J.J, ~ 1~ • GEJ'J•t? .),;;.-:::c"lJ Tv'·- plJ""-''--) An additional air-to-air missile with atomic warhead is operational.
Air-to-Surface Petrel
Surface-to-Air Nike A,jax Nike Hereules Terrier
Surface-to-Surface Corporal Matador Regulus
Fairchild
Western Electric Douglas Convair
Firestone and Gilfillan Martin Chance Vought
ij:onest John ,., / /~a.v&- ~-~-( ......... Jl . ,.'j')A'J, /J'' ' iJ < ., , ,;'!-Doujlas , ·
/,A-- .,.... •• _ ~~'-' .f<.L-V' I IJ,..._-,J' -~ r
ll' I I, •.. ·- '·,
~liSSILES-RESEARCH
Missile
Atlas \.J Bomarc Dart
,. (
/ , , /' • -;_~ - /' I/, , -- v ,;,_.,__.;-
o) AND DEVELOPMENT PROJECTS
Manufacturer
Convair Boeing
Navy
Army A1·my: Navy
Army USAF Navy Army ~ .. ,_ ., '>--~- r' ,· . ,
Service
·HawkJupiter
Aerophysics <;:- S Raytheon Chrysler
USAF USAF Army A1•my Army Army USAF Navy USAF Army USAF USAF Navy USAF USAF
La Crosse ~- .. ~ Navaho • · Polaris 1 ('. 1-> ,~,
Rascal Redstone Snark Talos Tartar· Thor Titan
Martin 1 _ _ • " . (
North American t' •' ' · --~-c"'
Lockheed Bell Chrysler Northrop Bend~x Convair Douglas Martin
T~rget Dron~s: Targl't Dronl's arl' made hy Bel'eh, Radioplanl', Ryan and Temco. All of the above has bl'E>n offil'ially rell'ased.
Source: 40.
r I L> r_./PJ~ • •• I
; I

38 A VIA TI0::\1" FACTS AND FIGURES, l9G7
..---, ,..... ', / \
I \ ( \ I I I I I I I I I I A I
configuration is first determined through wiuJ tunnel tests " ·here actual flight conditions are simulated . The missile designer must then decide on the typ e and size of the power plant. He can choose among the turbojet, r amjet and solid or liquid fuel rocket engines. They all have specifi c advantages and disadvantages that must be carefully ·weighed against th e mission of the missile. The turboj et or air-breathing engine has the capability of lengthy flight duration, but, of course, must operate where air is present. The rocket engin e, which consumes fuel at a tremendous rate, has the advantage of being able to operate without an outside supply of a ir since it carries its own oxidizer. The ramj et, simple in design , and capable of producin g very hi gh thrusts, requires another engine t o get the missile to suffi cient speed before it will operate. An eng ine may a lready be available for application in a missile ; in other cases, an entirely new engine must be developed.
The designer must next select a guidance sy~ m. Some of the types used today ar e based on rada r where the mi ssile is co ntrolled by a radar beam; the infra-red system which is controlled by the heat emanating f rom the target; star tracking in which th e guidance system picks up successiYe pairs of sta rs and figures the missile position; and th e in <>rt ia l gu idance syst em. The inertial system cannot be jammed by

GUIDED MI SSILES 39
outside elect ronic mea:mres. This sy.-tem is bui lt around a. platform stabilized by a. p reci e a r ra ngement of gy roscope. which mainta in the platfo rm as an absolu tely stable fram e of reference. The slightest deviat ion f rom t he pr e-a rranged course of the missile is picked up by sensitive devices and cor rected by a control system.
The problem of reliabili ty is great. The a.Y erage missile contains approximately 300,000 pa rts. Fa ilure of a single part 'Yhich might cost only a f ew cents could mean failure of a mult i-million dollar missile system. And t he miss il e, once it leaves its launching site, must function perf ec tly.
The most Yital ted111ological race that t he Uni ted States is engaged in today is the den lopment of the intercontinental ballist ic missile to opera t ional status. The raee bet" ·een the U. S. and its potential enemies to p rod uce t his weapon is not measured in terms of months or even weeks. Any lead " ·e haYe today stems f rom a contract awarded ten years ago to a n ai rcraft company for a systems study to im·est igate possible app roaches to the deYelopment of a st rategic ballist ic missile. The st udy project was cancell ed because of economy r easons, but during its brief existence, it y ielded basic information concern ing stab ilization, guidance and power plant problems. 'l' his info rmation proved invaluable when t he I CBM pr og-r am was quickly elevated by the National Security Cou ncil to t he top ])l'iority position of all defense projects.

RESEARCH AND DEVELOPMENT
Researeh and developm ent is the foundation upon whieh th e defense policy of qualitative superiority is built. The vast resean:h and development program being carried on jointly by the D epartmen t of Defense and the aircraft industry has the primary function to maintain a technoloaical lead \Yhi ch cannot be challenged. It is now widely r ecognized
0
that qualitative superiority in weapons can outweigh quantitative su-periority in men and materi als. Denlopments in the r esearch centers of th e aircraft industry co ntinue to lea d to new weapon systems and r esult in the g reatest insurance polic~· this country has ever known.
Th e ri se of sr- iPnce and t echnology to th e principal positio n in shaping the outcome of war has oceurred during the last decade . Although many technologiral br-eakthroughs, suc:h as the development of radar, proximity fuses, preeision fire control systems, and finally the atomic bomb, made substantial con tributions to winning World vVar IT , victory was prim arily du P to the vast numbPr of a ircraft and other war machines produced by t hi s country. Consequ r ntly th e largest portion of military exp enditures during the war- years was for production equipment , while research and development expenditures averaged only about $245 million annuall y. vVithout th e rapid mobilization by the U. S . aircraft industry and the fantastic aircraft prodnct ion achi evem ents during th e war, the
40

L
RESEARCH AND DEVELOPMENT 41
guided missile and the jet engine breakthroughs by the aggressor might have altered the course of the war.
The war ended with the general recognition by the experts that new technology in aeronautics (with guided missiles and rocket and jet propulsion systems, electronics, and nucleonics in leading roles) would henceforth be dominant in any all-out war. Although the demobilization of our fighting forces at the end of World War II was almost as rapid as it had been at the end of ·world War I, a generation earlier, a moderately strong program of research and development was maintained. Average annual expenditures by all three military services for research and development from 1945 through 1949 was about $549 million. Many of the present guided missile programs were started during that time. The air/atomic power resulting from this work has been the major factor in maintaining a balance of power in the world and consequently a semblaneP of peace.
Technology has progressed at a tremendous pace during th,e last
.. 2 c-- ) j~ • h · ( ~-<·' -~("J _;.---~ \ , v~-· \ ' r.~ -·
EXPEXDITURES FOR RESEARCH AND "DEVEL PMENT BY THE FEDERAL ~ GovERNMENT AND SELECTED AGENCIES, 1940 TO DATE
(In Millions of Dollars)
Total for all Federal
Agencies
1940-1944 Av. for 5 yrs. 520.4
1945-1949 Av. for 5 yrs. 1,083.9
By Fiscal Yrs. 1950 1,143.1 1951 1,342.3 1952 1,839.0 1953 2,118.8 1954 2,102.5 1955 2,290.6 1956Fl 2,446.6 1957Fl 2,729.7
EEstimate. " and predecessor agencies. b 2-year average-1943 and 1944. Source: 74.
Air Force" Army
83.7 80.9
164.9 265.5
218.4 120.8 297.9 159.3 523.0 316.0 618.4 415.0 598.0 428.4 695.2 458.0 745.2 422.9 816.4 420.0
Navy AEC"
80.2 403.5&
118.2 353.4
310.8 221.4 363.8 242.6 476.0 249.6 535.7 261.8 505.8 274.3 511.5 289.8 493.3 403.5 514.1 530.8
NACA
7.6
33.5
54.5 61.6 67.4 78.6 11 t)r/1.5
..q b'() I
o21f.3 I )..S-,q H~d
89.5/,\, 73.8 t. 71.0 z 75.0 -z.

decade, " ·ith sign ificant r esults and great strides continuously being made. Yet demands for higher and higher performance in all weapon systems keep increasing. ·without the never-ending search by t lw aircraft industry-military t eam for new equipment to meet th e nation's security needs, the nation's future would be j eopardized. EYer.'· aircraft company is studying r equirements to meet th e needs of national defense ten and twenty years hence. 'l'hese companies a re investing large rortions of their earnings in r esearch and development faci lities and devoting mu ·h of their engineering manpower to future requirements.
In 1954, the last year for which statistics are available, aircr aft manufacturers were utilizing almost three-fifths of their nearly ;)0,000 scientists and engineers in r esearch and development work- a h if!· her proportion than in any other industry. At th e same t ime, th ese manufacturers, ·with an aYerage of 270 supporting· workers per 100 r esearch and development scientists and engin eers, made more extensi Ye use of supporting p ersonnel than any other industry. This was due to th e extensive use of supporting personnel in such work as building and test ing prototype ai r·craft.
The cost of r esearch and developm ent in the, aircraft industry rose about 21 per cent , from $758 million in 1953 to over $900 million in 1954, r epresenting th e sharpest researeh and development cost ri se in any industry. The all-i ndust ry average increase was only about 12 per cent fo r the two-year period . The ai rcraft industry 's r ear ch and drvelopment cost was about one-fifth of that by all U . S . industri es in both y rars.
Expenditures by t he mi li tary fo r resr.arch and development ha,·e almost don bled from fiscal 1951 to the end of fiscal ] 956, rising f rom $758

RESEARCH AND DEVELOPMENT 43
million in 1951 to $1.5 billion in 1956. These expenditures are expected to remain at these high levels and are estimated at $1.54 billion in fiscal 1957 and $1.58 billion in fiscal 1958.
Yet these expenditures do not represent the entire research and development efforts of the Defense Department. Because of rapidly advancing technology, the lines between research, development, test, and procurement cannot be drawn precisely. For purposes of budgetary presentation, a narrowly construed definition has been used by the Department of Defense for ''research and development,'' which does not give the full meaning of the research, development, test, and evaluation
MAJOR REsEARCH AND DEVELOPMENT PROGRAMS oF THE FEDERAL GoVERNMENT
1954 TO DATE
Year
1954 1955 1956 1957E 1958E
1954 1955 1956 1957E 1958E
E Estimate.
(In Millions of Dollars) Department of Defense
(including Air Force, Army, and Navy) Obligationsa
Guided Operation of
Airc1·aft Research Missiles Facilities
269.8 231.4 266.3 293.6 214.0 249.0 352.2 280.4 280.2 282.2 346.5 349.8 276.3 331.8 385.8
ATOMIC ENERGY CoMMISSION ExPENDITUREs
Expenditures for Increase of Research and Development
Plant
145.2 110.5 120.0 177.0 228.0
Production & Reactor Biology, Medicine, Increase in Weapons Development & Physical R&D Plant
96.0 70.6 62.9 44.8 92.1 95.4 65.9 36.4
106.4 155.1 74.0 49.6 117.5 261.3 89.0 104.5 142.0 329.7 98.5 139.9
a Obligations may exceed expenditures; for total DOD obligation the difference Is less than 3%, but may be more in any one program.
Source: 46.

44 AVIATION FACTS AND FIGURES, 1957
effort. It does not include funding for suppor t ing activ it ies directly related to resear-c h and development. The entire military r esearch and development program for fiscal 1957 has been esti mated at about $5.2 billion. This compares with an estimated program in fiscal 1955 of $3.4 billion and in fiscal 1956, $3 .8 billion.
Items under cle,·elopment, test, and eYaluation account fo r $2.9 billion of t he estimat ed fiscal 1957 program, compared to $1.8 billion in both 1955 and 19;56. Ai rcraft represent $816 million of the $1.8 billion in 1955, \rhich decreased to $163 million in 1956, and are expected to rise to $522 m illion in fi scal 1957. Outlays for guided missile development, test, and eYa luatio n continue to rise-from $657 million in fisca l 1955 to an estimated $1.9 billion in fisca l 1957.
Also important to the O\'e r-all r esearch and de\'elopment effo rt are the activities supporting it. These include funds fo r military construction, industrial fac ilities, and military p ersonnel pay and allowances. The cost of t hese support in g act ivities has incr eased 76 per cent since fi scal 1955.
The emphasis on r esear ch and development during the last te n years is responsibl e for fi ghter in terceptor ai rcraft which today fly at twice the speed of sound, with programs under \Y ay which will carry man at Mach 5, or fi"e times the speed of sound, and forecasts of Mach 10 mann ed \'Chicles have been made. A U. S. bomber flying today is the first supersoni c bomber in th e world , supplementing transonic bombers in today's itwentory whi ch a re capable of intercontinental missions with in-fligh t r efuelin g. Today fighters operate at altitudes whi ch were only touched a fe" · short years ago in r esearch vehicles.
Althoug-h missi les are virtually still in their infancy, neve rtheless, th eir p er formance and fire power are beyond the imagination of a decade ago. Research r rsulting in gu idance and propulsion sys-

RESEARCH AND DEYELOPMENT 45
tems and materia ls to withstand temperatures greater than any ever before encountered have provided th e way for guided missiles to become a major part of f u t ure p lans fo r deterring " ·ar or winning a \\·ar if one should be inevitable.
Every science known today is needed in the development of future weapon systems. Yet the technological ach ancement r esulting f rom military work cannot be isolated from commer cial uses. \Var t ime know-how and t echnological developments, r esulting largely f rom th e use of federal funds, have a multitude of peacetime applications. Technol ogical developments in new materials (e.g., synthetic rubber, aviation gasoline, plast ics and other synthetic materials, plywood, magnesium , aluminum, and alloying elements ); new methods (e.g., in joining of metal b~· riveting, welding or stretching, in heat t r eating procedures, in metal sp inning, in powder metallurgy, in casting, in metal spraying and in inspection) ; and n ew products (e.g., aircraft design, bombsight, and navigation devices, j et propulsion, r adar, processed foods, and numerous ot her developments in the electronics fi eld ) have made t heir appea rance as a result of military research supported in whole or in part by g·oyernm ent f unds.
\Vhile securi ty in t his air/atomic age r equires us to plate a greater emphasis on technology, specifically to meet military requirements, it has made some significant contribut ions to a better life in these United States. The j et engine, for instance, was almost entirely a military development. Now we can look forward to better mea11s of tr ansportation that will bring the entire world closer together. 'l'elevision, common to almost every home in Ameri ca today, "·as moYed ahead by many years as a direct result of military work The atom ic bomb-perhaps the greatest of all war deterrents- has brought about the adaptation of nuclear power for many peacetime purposes. lVI ilitary resear t: h being conducted today will open up new fi elds and contribute to a co ntinued upward trend in techn ology and bette r national economy fo r years to come.

.. Each symbol represents 50,000 workers on the n aircraft, engine, propeller, or parts industry.
MANPOWER
Emp loyment in th e ai r('raft indust1·y climbed from au aver age of 738,-±00 in 1955, to 804,100 in Hl56 . Characterized as a " h <>al thy" gain, the in cr <>ase is due, in part, to th e steadily in c r·easin g complex ity of the aeronaut ical product, and, in par t , to the general advance of av iation in t h e economy of t lw nation as a tool of commerce and transportation.
'fh <> 804,100 employees of the a ircraft industry wo ;ed an average of 42 hours p er week at a n ave rage we<>kl y wage of $93.57. The aircraft industr.v today is the la rgest manufactu 1·in g employe r in th e U nited States. And, becausP of the quality of skills demanded in the manufact ure of its ae 1·ona ntieal products, its employees ' ·wages a re a mong th e hi gh est " ·ee kly wages among· manufaeturing empl oyees.
46

L
MANPOWER . 47
Today, great technological progress is being made throughout the( aircraft industry. To fashion this progress, approximately 11 per cent of the total employees in the aircraft industry are engineers, compared with 4 per cent during ·world War II. The aircraft industry employs nearly 10 per cent of the total research and development personnel employed by American industry as a whole.
The materials required for the construction of the super and hypersonic aircraft and missiles have created a whole new materials technology for men to master. The industry is already at the approximate limits of aluminum alloy usage. It has barely opened up the potential of the titanium family of metals. It has begun to show increasingly large requirements for stainless steels.
The deYelopments in "metal-cutting" alone have had a significant
AVERAGE HouRLY EARNINGS IN AmcRAF'.r AND PARTS PLANTS \ 5 1939 TO DATE
(Includes Overtime Premiums)
' Monthly Aircraft Aircraft Other Average TOTAL Aircraft Engines Propellers Aircraft for the (Airframes.) and Parts and Parts Parts and Year Equipment
1939 N.A. N.A. $0.83 N.A. N.A. 1940 N.A. N.A. .83 N.A. N.A. 1941 N.A. N.A. 1.00 N.A. N.A. 1942 N.A. N.A. 1.21 N.A. N.A. 1943 N.A. $1.16E 1.26 N.A. N.A.
1944 N.A. 1.22E 1.31 N.A. N.A. 1945 N.A. 1.22E 1.28 N.A. N.A. 1946 N.A. 1.28E 1.34 N.A. N.A. 1947 $1.38 1.36 1.41 $1.44 $1.41 1948 1.49 1.47 1.55 1.57 1.55
1949 1.57 1.55 1.60 1.63 1.61 1950 1.64 1.62 1.70 1.73 1.70 1951 1.79 1.75 1.89 1.93 1.80 1952 1.90 1.87 1.98 2.05 1.88 1953 2.00 1.99 2.03 2.05-c· 1.99
1954 2.08 2.08 2.09 2.09 2.08 1955 2.17 2.17 2.17 2.18 2.17 1956 2.27 2.27 2.28 2.26 2.29
N.A.-Not available. E Estimate. SouTres: 64. 65

48 AVIATION FACTS AND FIGURES, 1957
AIRCRAFT AND TOTAL MANUFACTURING EMPLOYMENT, 1914 TO DATE
Year or Month
1914 1919 1921 1929 1933 1939 Dec. 1941 .............. Nov. 1943 ............. Aug. 1945 ..............
Including subcontractors Dec. 1941 .......... Nov. 1943 ......... Aug. 1945 ..........
1948 1950 1953 1954 1955 1956
• Less than .05 percent. Source: 16, 17, 31, 64,65
Aircraft Total Aircraft as Employment Manufacturing Percent of Total
Employment Manufacturing lin thousands)
.2 7,514 a
4.2 9,837 a
2.0 7,557 a
18.6 9,660 .2 9.6 6,558 .2
64.0 9,527 .7 423.0 13,817 3.1
1,342.5 17,858 7.5 351.4 15,343 2.2
567.0 13,817 4.1 2,101.6 17,858 it.S
519.9 15,343 3.4
237.7 15,321 1.6 281.8 14,967 1.9 779.1 17,238 4.5 764.1 15,995 4.8 738.4 16,557 4.5 804.1 16,893 4.8
impact upon the manpower problem in the aircraft industry. For example, as aircraft, aircraft engine, components and systems manufacture become more complex, ,_an increased reliance is placed upon eon trolled machine operations. As a result, the aircraft industry has had to move to increasingly larger proportions of highly skilled workers and technicians for its labor force. This is directly reflected in the upward trend in aircraft industry wages.
The perfection of the piston engine; of jet propulsion ; the turbopropeller engine ; and the spectaculal'ly increasing demands in missile manufacturing, have revolutionized transportation in peace and wartoday and tomorrow. Further refinements in these engine fields require still higher skills among the men that design and build t 1'em.
The same is true in aircraft electronics system:-; manufacturing. Achievements in electronics are coming so rapidly that their significance has come to be considered almost commonplaee. But continued gains in this phase of aeronautics, similarly, place great demand upon new
•·
MANPOWER 49 .
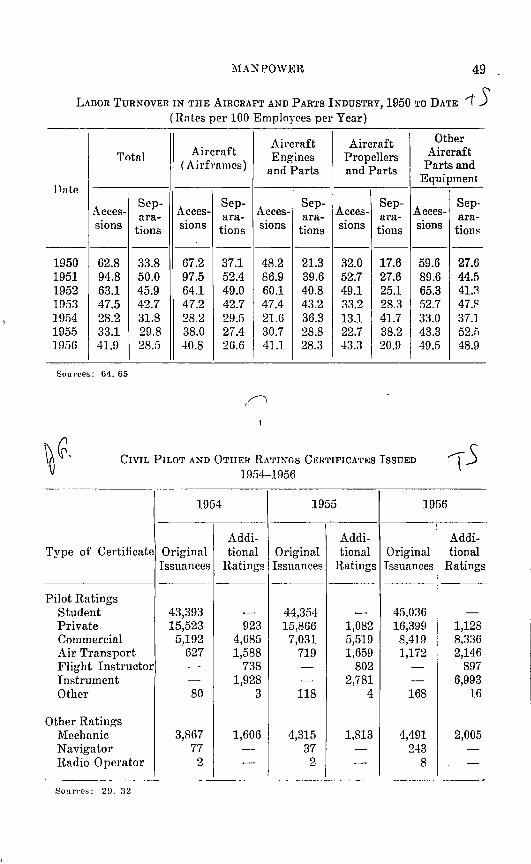
LABOR TURNOVER IN THE AIRCRAFT AND PARTS INDUSTRY, 1950 TO DATE 1 5 (Rntes per 100 Employees per Year)
Aircraft Aircraft
I Other
Tntnl Aircraft Engines Propellers Aircraft ( Airfmmes) and Parts and Parts Parts and
Equipment llnte
Acces-Sep-
Acces-Sep-
Acces-Sep-
Acces-Sep-
Acces-Sep-
ara- ara- ara- ara- nra-sions tions sions tions sions tions sions tions sions tion!'
-- ----------------1950 62.8 33.8 67.2 37.1 48.2 21.3 32.0 17.6 59.6 27.6 1951 94.8 50.0 97.5 52.4 86.9 39.6 52.7 27.6 89.6 44.5 1952 63.1 45.9 64.1 49.0 60.1 40.8 49.1 25.1 65.3 4Ul 1!)53 47.5 42.7 47.2 42.7 47.4 43.2 33.2 28.3 52.7 47.fl 1954 28.2 31.8 28.2 29.5 21.6 36.3 13.1 41.7 33.0 37.1 1955 33.1 29.8 38.0 27.4 30.7 28.8 22.7 38.2 43.3 52.1i 1956 41.9 28.5 40.8 26.6 41.1 28.3 43.3 20.9 49.5 48.9
Sources: 64. 65
CIVIL PILOT AND OTHER RATrNos CERTIFICATES IssuED
1954-1956
1954 1955 1956
Addi- Addi- Addi-Type of Certificate Original tional Original tional Original tional
Issuances Ratings Issuances Ratings Issuances Ratings
Pilot Ratings Student 43,393 - 44,354 - 45,036 -Private 15,523 923 15,866 1,082 16,399 1,128 Commercial 5,192 4,685 7,031 5,519 8,419 8,336 Air Transport 627 1,588 719 1,659 1,172 2,146 Flight Instructor - 738 - 802 - 897 Instrument - 1,928 - 2,781 - 6,993 Other 80 3 118 4 168 16
Other Ratings Mechanic 3,867 1,606 4,315 1,813 4,491 2,005 Navigator 77 - 37 - 243 -Radio Operator 2 - 2 - 8 -Sour<·es: 29, 32

50 AVIATION FACTS AND FlGURES, J95i
Worn;: STOPPAGES I N THE A I RCR ,\ FT AKD PAHTS l NDUS'l'HY
1927-'1'0 DATE
Year N umb er of Strikes
1927- 1933 4 1934 4 1935 1 1936 1937 6 1938 N .A.
1939 2 1940 3 1941 29 1942 15 1943 60
1944 103 1945 85 1946 15 1947 10 1948 8
1949 10 1950 18 1951 29 1952 44 19.'):::1 31 1954 11 1955 38
N .A .- Not ava ilable. Source : 62
talents and ever greater skills of employees.
Number of Workers In volved
1,153 3,207 1,700
9,390 N.A.
1 ,263 6,270
28,422 6 ,584
52,481
189 ,801 150,200
21,300 3,520
21,400
10,300 23,900 48,800 81,000 57,800 6,350
48,500
eJJ g in Pers as well
Man-Days Idle in Y ear
18,!J G5 ll1 ,048
6,800
90,964 N.A.
85 ,419 36,402
ll2,549 12 ,416
130, ll2
386,371 581,000 557,000
67 ,900 1.100,000
451,000 145 ,000 765 ,000 927,000
1,350,000 171,000 403,000
as prod ut.:tion 1 in e
T h e complexes of s.'·stems and comp onents of th e moder n aP rial 1veapon arc so inte r-rela t ed a nd the skills 11Ceded to produce a nd iJJtcf!Tate th ese, so specialized, t hat onl y a h ighly educated and tra in ed inc1i-v id ual can pe r·form aclPqu at ely . •
Th r, a ir1· raft manufacturing inclnstry, 1\·h ich has bee n r epeaterl ly facPcl with shor·tages of skillerl pe rson nel , lllldertal\es apprenti re Rn cl i ll p lant trainin g progra ms. Some of the larger compani• offe r adva neecl rour'Ses in vario us t rchni r·al aspeL· ts of aviation resea rl'h, cl1' velupm ent , and p rodnrtion. Th ese ro mpani rs, hard prrssrcl for qual ified t erhnical p er sonn el in most cases, wi ll take qu alified c• JJ g in Pc rs iu a ny fi eld and train th em to th eir aeronauti cal n eed.

L
\
~fANPOWER
ef1 ~
I
CIVIL FLYING SCHOOLS, STUDENTS AND CERTIFICATED PILOTS
1927 TO DATE
Student Pilot
Certified Civil Certificates Year Flying Schools Issued
As of December 31
1927 - 545 1928 - 9,717 1929 24 20,400 1930 39 18,398 1931 29 16,061
1932 21 11,325 1933 19 12,752 1934 21 11,994 1935 24 14,572 1936 27 17,675
I
1937 30 21,770 1938 24 15,556 1939 46 29,839 1940 749 110,938 1941 1,054 93,366
1942 843 93,777 1943 693 36,802 1944 N.A. 51,618 1945 964 77,188 1946 1,557 173,432
1947 3,078 192,924 1948 3,058 117,725 1949 2,430 49,575 1950 2,086 44,591 1951 1,625 45,003
1952 1,280 30,537 1953 1,093 37,397 1954 1,035 43,393 1955 902 44,354 1956 809 45,036
N.A.-Not available.
Sources: 29, 32.
51

52 AVIATION FACTS AND FIGURES, 1957
In 1953, the aircraft industry employed 48,500 of the 553,800 professional research engineers and scientists in United States industry.
The aircraft industry in 1953 also employed 10.1 per cent of all engineering personnel employed by American industry; 1.7 per cent of all ehemists; 6.2 per cent of all metallurgists; 16.0 per cent of all physicists; 14.1 per cent of all mathematicians; and a considerable number of research personnel covering virtually all other of the physical sciences.
The nation's airlines operate flight and ground schools for the orientation and training of new employees, and for maintaining a high level of personnel efficiency.
While our educational prowess has, until recently, presented a bleak picture for the future, public spirited Americans in industry, govern-
WORK-IN JURY RA'fES FOR THE AIRCRAFT AND ALL MANUFACTURING INDUSTRIES 1939 TO DATE
Aircraft Industry Aircraft Parts Industry All Manufacturing
Year Injury- Severity Injury- Severity Injury- Severity Frequency Ratesa Frequency Rates• Fr~quency Rates•
Rates• Rates• Rates•
1939 12.9 1.9 b b 14.9 1.4 1940 15.8 1.3 b b 15.3 1.6 1941 10.4 1.4 b b 18.1 1.7 1942 11.4 0.7 9.5 0.9 19.9 1.5 1943 9.7 0.7 11.7 0.8 20.0 1.4
1944 8.8 0.6 10.1 0.6 18.4 1.4 1945 9.4 1.2 10.6 1.7 18.6 1.6 1946 5.2 0.8 13.7 2.1 19.9 1.6 1947 4.8 0.7 11.1 0.6 18.8 1.4 1948 4.9 0.8 10.2 0.8 17.2 1.5
1949 4.3 1.0 9.2 1.0 14.5 1.4 1950 4.0 0.9 5.9 0.6 14.7 1.2 1951 4.5 0.6 7.1 0.9 15.5 1.3 1952 3.7 0.3 6.7 0.4 14.3 1.3 1953 3.8 0.6 6.3 0.5 13.4 1.2 1954 3.2 0.7 5.8 0.5 11.9
I
1.0 1955 2.8 0.3 4.8 0.3 12.1 0.6 1956 2.7 N.A. 4.4 N.A. 11.9 N.A.
:-\.A.-Not available. • 'l'be in.iu ry frequen~y rute is the average number of disabling work injuries for each miilion
employee·hours worked. T11e severity rate is the avernge number of days lost as a result of disabling work in.iuries for
each 1,000 employee-hours worked. The romputations of duys lost include standard time charges for fatalities nnd permanent disabilities.
b Included with "Aircraft." Source: 63, 68
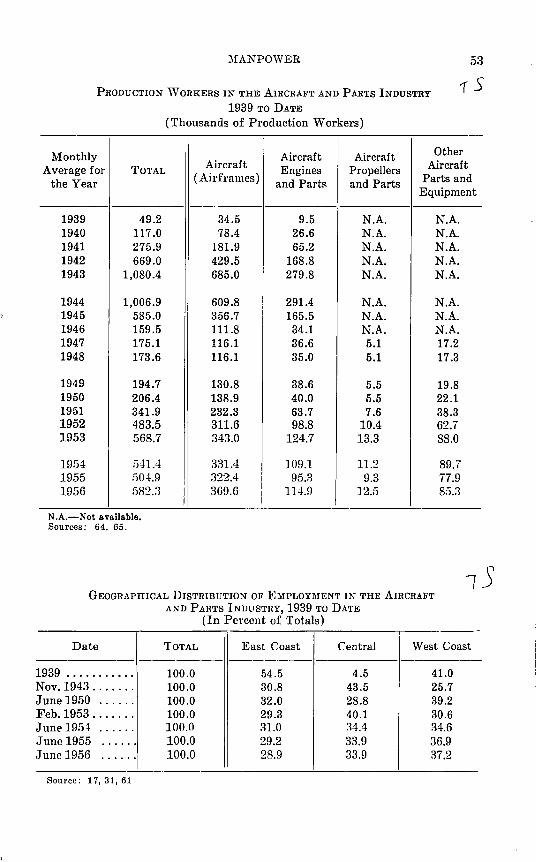
MANPOWER 53
PRODUCTION WORKERS IN THE AIRCRAFT AND pARTS INDUSTRY 1939 TO DATE
(Thousands of Production Workers)
Monthly Aircraft Aircraft Other
Average for TOTAL Aircraft Engines Propellers Aircraft (Airframes) Parts and the Year and Parts and Parts
Equipment
1939 49.2 1940 117.0 1941 275.9 1942 669.0 1943 1,080.4
1944 1,006.9 1945 585.0 1946 159.5 1947 175.1 1948 173.6
1949 194.7 1950 206.4 1951 341.9 1952 483.5 1953 568.7
1954 541.4 1955 504.9 1956 582.3
N.A.-Not available. Sources: 64, 65.
--· 34.5 78.4
181.9 429.5 685.0
609.8 356.7 111.8 116.1 116.1
130.8 138.9 232.3 311.6 343.0
331.4 322.4 369.6
9.5 N.A. 26.6 N.A. 65.2 N.A.
168.8 N.A. 279.8 N.A.
291.4 N.A. 165.5 N.A. 34.1 N.A. 36.6 5.1 35.0 5.1
38.6 5.5 40.0 5.5 63.7 7.6 98.8 10.4
124.7 13.3
109.1 11.2 95.3 9.3
114.9 12.5
GEOGRAPHICAL DISTRIBUTION OF EMPLOYMENT IN THE AIRCRAFT AND PARTS INDUSTRY, 1939 TO DATE
(In Percent of Totals)
N.A. N.A. N.A. N.A. N.A.
N.A. N.A. N.A. 17.2 17.3
19.8 22.1 38.3 62.7 88.0
89.7 77.9 85.3
15 -
Date TOTAL East Coast Central West Coast
1939 .•.•••••••• 100.0 54.5 4.5 41.0 Nov.1943 •••.... 100.0 30.8 43.5 25.7 June1950 ...... 100.0 32.0 28.8 39.2 Feb.1953 •..•... 100.0 29.3 40.1 30.6 June 19M ••• 0 •• 100.0 :n.o ~4.4 34.6 June 1955 ...... 100.0 29.2 33.9 36.9 June 1956 ...... 100.0 28.9 33.9 37.2
Source: 17, 31, 61

54
/
AVIATION FACTS AND FIGURES, 1957
SALARIES AN D WAGES I N THE AIRCRA FT lKDU STRY
1914 TO DATE
(Thousands of Dollars )
I Production \Vorkcrs
Year T OTAL
-----1914 $ 1!:)6 1919 6 ,908 1921 3,235 1923 6,160 1925 N.A.
1927 9, 146 1929 31,448 1931 N.A. 1933 13,824 1935 21 ,475
1937 46,867 1937a N.A. 1939 108,286 1947 703,693 1949 956,189
1950 1,132,017 1951 2 ,1 02 ,913 1952 3,179,442 1953 ::3,941,133 1954 .J.,0-!8,811 1955 4,150,0{)0E 1956 4,800,000 E
N.,\.-Not ava ilable . E Estimate.
Salaries
$ li l 2,00 1 1,033 1,638 N.A.
2,289 9,524 N.A.
3,516 6,582
13,514 N.A.
30,798 227,396 311,821
371,773 GI3 .S21
1 ,01.4,977 1,301,268 1,423,511 1 ,570 , 000 1~
I 1 ,900 ,000 P.
Average W ages Weekly
Eamings
$ 105 $15.45 4,907 26.63 2,202 30.36 4,522 29 .97 4,222 30.06
6 ,857 29.83 21,924 28.66 15,481 30.16 10,308 25.36 14 ,893 25.16
33,353 26.72 43,827 27.74 77,488 30 .56
476,297 56.33 644,368 63.98
' 760,244 6!).12 1,460,092 77 .43 2 ,164,465 81.17 2,639,8 -t7 S L50 2,625,300 86.16 2,580,000 E !-J0 .79E 2;900,0001': !Hl.79 r.
a rl'his l ine and nil follo w i ng lin es in clud e da ta for a i r craft en gine manufat·t urers w hich are not ava ilable for prior years .
S ou r ces : 16, 17 , 1 9
rrJPnt, a nd in our g r·pat Pll uc: ationa l iustitutiom; a re a roused anc1 arr t akin g r em ed ia l ad ion. The high s<.:hools a nd colleges of the na tio n, more and more, are in c: r r'asing t hr ir c: urrit.: ul a to t.:OH' I' ma ll .\ Aelds of av ia tion . Collr ges a re, in man y t.:asrs, offerin g pre-fiigh t av ia t ion tra in in g, a ncl some offer fli gh t training.
Plight T1·aining During \Norlcl \Var lf , mor·p t ha n 160 ci \·ilian aviat io11 Sl'hools WC'I'C'

L
1\IANPOWER 55
under Army Air l<'oree contract to train flying and technical personnel. To a lesser degree, the Air Force employed this system of contracting with civilian schools during the early days of the Korean War.
The Air Force has since discontinued its use of civilian schools for other than primary flying instruction, and as a result most training schools have been faced with serious economic problems. The picture is brightening generally, however, with the growing awareness of the public of the significance of the civil aviation industry in the nation's economy.
Flight training is gradually increasing. In 1955, 45,036 new certificates were issued to student pilots; 16,399 private pilot certificates were issued; 8,419 commercial certificates; 1,172 air transport certificates; and 168 other proficiency type certificates were issued by the Civil Aeronautics Administration.
Monthly Average for
AVERAGE WEEKLY HOURS IN AIRCRAFT AND PARTS PLANTS
] 939 TO DATF.
Aircraft Aircraft TOTAL Aircraft Engines Propellers
(Airframes)
Other Aircraft
Parts and the Year and Parts and Parts Equipment
----1939 N.A. 1940 N.A. 1941 N.A. 1942 N.A. 1943 N.A.
1944 N.A. 1945 N.A. 1946 N.A. 1947 39.9 1948 41.0
1949 40.6 1950 41.6 1951 43.8 1952 43.0 1953 41.9
1954 40.!l 1955 41.3 19!16 42.4
X.A.-::-<ot avnilnble. Sourres: 64, 65
N.A. N.A. N.A. N.A. N.A.
N.A. N.A. N.A. 39.7 41.1
40.5 41.4 43.3 42.6 41.3
40.!l 41.2 42.1
44.6 N.A. N.A. 46.6 N.A. N.A 47.6 N.A. N.A. 49.7 N.A. N.A. 48.6 N.A. N.A
47.7 N.A. N.A. 43.2 N.A. N.A. 41.6 N.A. N.A. 39.9 41.5 40.1 40.9 39.7 41.0
40.7 41.0 40.0 42.1 42.4 41.7 45.4 46.2 43.7 43.9 45.0 43.2 43.0 41.9 42.8
40.7 30.4 41.2 41.0 41.6 41.7 42.9 40.3 43.0

56 AVIATION FACTS AN D FIGURES, 1957
ElllPLOYME N T I N THE AIR CRAFT AND PARTS I N DUSTRY, 1939 TO DATE
(Thousands of Emp l o~· rrs)
Month ly Aver-age for the Year
1939 1940 1941 1942 1943
1944 1945 1946 1947 1948
1949 1950 1951 1952 1953
195± 1955
I 1956
N. A.-Not a va ilable. Soun:es : 64, 65
T OTAL
63 .2 148.6 347.1 831.7
1,345.6
1,296.6 788 .1 237.3 239.3 237 .7
264 .1 281.8 463 .6 641.6 779 .1
764.1 738.4 804.1
Aircraft (Air-
frames)
45 .1 101.8 234.6 549.6 882.1
815.5 489.9 159.0 158.5 158.0
175.3 188.4 313.3 413 .9 472.4
470.0 471.2 512.0
Aircraft Aircraft Other Aircraft Engines and Propellers Parts and
Parts and Parts Equipment
11.3 N .A. N.A. 31.4 N .A. N.A.
"75.3 N .A. N.A. 192.0 N .A. N.A. 314.9 N.A. N.A.
339.7 N.A. N.A. 210 .9 N.A. N.A.
49 .9 N.A. N .A. 50 .1 7.8 23.0 48 .6 7 .7 23.3
53.5 8.2 27.0 55.8 8.3 29.3 90.8 10.8 48.8
134.7 14.0 79.1 174.7 17.7 114.2
159.4 15.8 118.9 147.1 13.6 106.5 165.2 16.1 110.8

MANPOWER. t::rfJ (, !J7
(!1
cf ·~ 2 ,- ] fay, (
I(_ ---;-., fvv fl J , I s
I•
\VO~IEN EM P LOYEES I N T il E i \ IRCRAl'T I NDUSTRY , 1942 TO DA 'I' r:
Da te Number (thousands) Percent
Jan. 1942 • • 0 0 0 . 0 0. 0 •• 0 . 0. 23.1 5.0 Nov. 1943 •• • 0 . 0. 0 0 ••• 0 • • 486 .1 36 .7 Oct . 19LJ7 • • • 0 0 • • • • • • • • •• • 28 .5 11.8 Sept. 1949 • • ••••• •• • •• • 0 33 .3 12.5 Sept. 1950 •••• •• 0 •• 0 . 0 • • 36 .2 12.4
SPpt. 1951 . ... .. .. . . . .. . 88 .6 17 .7 Sept. 1052 • 0 • ••• • • •••• • • 11 7 .!:1 1H.O SPpt. Hl53 • 0 •• • • • • •• 0 • • • 133.4 17.6 Sept. 1954 0 0 ••••• •• • • 0 • • 132.3 16.6 Oct. 195;1 • • • • • •• • •• 0 •• • • llSA 15.7 Oct. 1956 • • 0 • •••••• ••• • 0 135.4 15.6
Sources : 1 8, 64 , 6R , G6

58 AVIATION F ACTS AND FIGURES, 1957
AVERAGE WEEKLY EARNINGS IN AIRCRAFT AND PARTS PLANTS
1939 TO DATE
(In cludes Overtim e P rellliums )
Monthly Aircraft Aircraft Other
Average for TOTAL Aircraft Engines Propellers Aircraft
the Year (Airframes) and Parts and Parts P<..rts and Equipment
---- -----1939 N.A. N.A. $36.93 N .A. N.A. 1940 N.A. N.A. 38.82 N.A. N.A. 1941 N .A. N.A. 47 .65 N .A. N.A. 1942 N .A. N .A. 60 .14 N .A. N.A . 1943 N.A. N.A. 61.24 N.A. N .A.
1944 N.A. N .A. 62.68 N .A. N .A. 1945 N .A. N.A. 55.34 N.A. N.A. 1946 N.A. N.A. 55 .66 N.A. N .A. 1947 $54 .98 $53.99 56.30 $59.68 $56 .50 1948 61.21 60.21 63.40 62.13 63.59
1949 63.62 62.69 65.24 66.83 68.08 1950 68.39 67.15 71.40 73.90 70 .81 1951 78.40 75.78 85.81 89.17 78.66 1952 81.70 79.66 86 .92 92.25 81.22 1953 83.80 82.19 87.29 85.90 85.17
1954 85.07 85.07 85.06 82.35 85.70 1955 89.62 89.40 88.97 90.65 90.4!) 1956 95.57 94.66 97.13 96 .95 98.01
N.A.-Not avai lable .
/ "., . . .A~ Sou r ces : 64 , 65 LJ_YV' r , cfy11

'l'he aircraft manufacturing i ucl us try is a "contracting industry " and is capitalized acco rdingly.''' 'l'his requires, among other things, that the capitalization of the co mpani es (1) provide the liquidi ty necessary to justify a high ]eyel of mercantile and bank cr edit, (2) furnisll the workin g capital and finan cial strength to support a high level of sales and yet (3) avoid th e costly burden of over-capitalization during the Pl'olonged p eriods of low volume production.
*Data contained in thi s chnptc>r cover fina ncia l a ctil"i t ies of t he t woiYe mn.j or air frame compan ies \Yith t h C' rxception of one Jn.rge prod uce r ll'hich is a divi sion of ::u~oth er corporation aH<l docs n ot publi sh fi11an c ial d nta on i ts ai rc raft actil'itics. F n1nn cinl activiti es s ho11·11 ]1Prcin co,·er the yrn rR 1950 throu g h l!J5G.
_ It should be 11 oh•d that· all C' arnin g Ji gnr~s in t he tnblc. fo r t he ~-ca rs 1!153 t l1roug h l ~o6 a rc s nb.i ec t to clommard rPacl .in s tm ent·, in nrco rdan re with t he 'R enrgotint ion Act o_f 1941; datn fo r th ese fi ll(] <'arli c r yc:Hs mn.r be o1·erstntcll by fi ll nnkH 0\\'11 amou11t, smc~ the effect of' renegotiati on refu nd s, \Yhcn mnd c, i · not r e fl ected in t he cn rli cr pubh shcd fin n Hc i:d stat·ements or the compani es in volved .
59

~_/
? A VIA 'l' IOK FACTS A JD FIGURES, 195 7
-------------------------------------------NET PROFIT AS PERCENT OF SALES 1956
.. 10.5
NON FERROUS METALS
~ 10.4
PETROLEUM PRODUCTS
8 5.7
----AUTOS AND TRUCKS
~ "" 4.4 0
RAILWAY EQUIPMENT
~ 7.2 '
IRON AND STEEL
~ AIRCRAFT AND PARTS
~ 6.
ALL MANUFACTURING

L
FINANCE 61
BALANCE SHEET ColiiPARISONS, 12 :MAJOR AIRFRAME CoMPANIES 1951 TO DATE
(Thousands of Dollars)
1951 I 1952 1953 1954 1955 1956
Assets Current assets:
295,3651$ Cash $ 159,676 $ 216,470 $ 261,932 $ 295,506 $ 311,572 Securities 8,484 5,613 5,478 26,437 29,372 -Receivables 360,165 479,506 526,400. 461,910 463,848 594,247 Inventories 373,429 531,020 583,923 592,056 638,208 874,550 Miscellaneous 13,102 18,569 27,467 12,934 23,040 31,329
-Total current assets $ 914,856 $1,251,178 $1,405,200 $1,388,702 $1,449,974 $1,811,698
Total net plant 124,457 154,010 166,077 186,406 214,077 309,981
Investments 9,264 9,531 9,208 6,278 5,679 5,820 Development, etc., expenses - 1,780 2,202 - - -
Deferred charges f 13,271 11,932 13,644 19,731 19,410 22,604 Miscellaneous
Total assets $1,061,848 •$1,428,431 $1,596,331 $1,601,117 $1,689,140 $2,150,106
Liabilities Current liabilities: Payables $ 369,910 $ 541,006 $ 544,162 $ 396,217$ 375,822 635,018 Accruals-taxes-renegotiation-refunds due U.S. 209,048 297,102 406,906 409,039 375,642 347,620
Advances-contracts deposits 48,087 91,550 92,540 121,403 127,246 176,468
Reserve 4,923 3,618 3,458 8,851 12,317 5,078 Miscellaneous 8,474 9,577 8,347 11,112 13,509 27,315
Total current liabilities $ 640,442 $ 942,853 $1,055,413 $ 946,622$ 904,536 $1,191,499
Bank loans, etc. 27,782 30,763 8,648 8,589 36,756 73,690 Contingency reserve - 500 - -Capital stock 66,164 94,831 95,460 125,706 135,499 168,391 Capital (paid) surplus 61,371 68,927 77,181 100,331 110,216 162,050 Earned surplus 260,828 283,366 353,885 415,443 495,861 548,971 Miscellaneous 5,261 7,191 5,744 4,426 6,272 5,499
Total liabilities $1,061,848 $1,428,431 $1,596,331 $1,001,117,$1,689,140 $2,150,106
Net current assets $ 274,414 $ 308,325 $ 349,7871$ 442,0801$ 545,438 $ 620,199
Source: 4

62 AVIATION FACTS AND FIGURES, 195'i
As is the case with the other contracting industries, the most economical and efficient method of financing production is for the customer (whether civil or military) to provide some of the financing needed for performance of the contract. If such were not the practice, and if contracting industries were capitalized to handle their infrequent peak volume, it would be necessary during years of low volume for the price of the end product to include the heavy carrying costs of excess capitalization.
The nature of the aviation product, with its inevitable high unit cost, its 16 to 30 months manufacturing cycle and the necessity to avoid the danger of over-capitalization, requires that the industry make efficient use of its working capital as well as the total funds invested. Efficiency in financial management has historically been one of the distinguishingcharacteristics of the aircraft manufacturing industry. The aircraft industry has always achieved a higher rate of net worth turn-over than any other comparable industry. In 1956, for example, the twelve major airframe companies turned over their net worth 6.4 times. ·working capital of approximately $620,000,000 during the same period was turned over a little better than nine times. With a working capital of this magnitude, and a turn-over rate of once every 40 clays, the length of time between receipt of cash and its disbursement is extremely short. Any disturbance in the flow of incoming cash inevitably has a serious effect upon tl1e individual company's-or the inclustry's-operations.
~) BACKLOG OF ORDERS REPORTED BY MANUFACTURERS OF COMPLETE AIRCRAFT, ENGINES AND PROPELLERS, 1948 TO DATE '
(Millions of Dollars)
\ Aircraft
Aircraft Aircraft Other
December Engines Propellers Products 31 Total and and and and
Parts .... ·- -· Parts Parts Services
1948 $3,104 $2,094 $ 786 $103 $121 1949 3,010 2,013 749 ' 91 157 1950 5,039 3,102 1,470 145 322 1951 12,665 8,126 3,531 241 767 1952 17,653 11,222 5,172 298 961
1953 16,753 11,604 4,080 218 851 1954 14,852 10,639 2,929 187 1,097 1955 15,776 10,682 3,123 130 1,841 1956 18,385 11,784 4,064 191 2,346
Source: 22

FINANCE
Co~Il'OSITI0.:-1 OI•' CunnBNT Assi!.'TS, 1937 TO DATE,12 MAJOR AIRFRAME CoMPANIES (In Percent of Total)
-Total
Cash and Year Current Inventories Receivables i\liscellaneous Assets Securities
1937 100.0 17.6 35.2 46.6 .6 1938 100.0 35.1 33.8 30.3 .8 1939 100.0 37.9 48.9 13J .1 1940 100.0 46.4 35.7 12.2 5.7 1941 100.0 23.2 52.3 24.4 .1
1042 100.0 25.1 33.8 40.9 .2 1943 100.0 27.6 25.5 45.9 1.0 1944 100.0 26.7 22.7 49.1 1.5 1945 100.0 34.1 13.7 48.9 3.3 1046 100.0 32.9 43.8 23.2 .1
1047 100.0 18.6 54.9 25.6 .9 1948 100.0 23.9 40.1 35.3 .7 1!>40 100.0 26.8 41.6 30.5 1.1 1950 100.0 23.3 36.2 39.6 .9 19fi1 100.0 18.4 40.8 39.4 1.4
1952 100.0 17.8 42.4 38.3 1.5 1953 100.0 19.0 41.6 37.5 1.9 1 !):)4 100.0 23.1 42.6 33.3 1.0 1955 100.0 22.4 44.0 32.0 1.6 1956 100.0 17.2 48.3 32.8 1.7
-· Source: 4, 5
'l'he extremely rapid advance in all of the sciences and the almost daily rate of new discoveries in recent years have permitted industry to provide the military air forces with weapons of far greater effectiveness than their comparable ·world War II counterparts. Since World War II, we have s<>en the missile come over the horizon as an offensive and defensive air weapon. Within the n<>xt decade, missiles will undoubtedly constitute the bulk of our air arsenal. 'l'his transition from the air weapons of W oriel \Var II to those in use now and those that will be needed in the foreseeable future has <•reat<>d, among other things, financial problems of a magnitude heretofore unknown in the aircraft industry. How to accunmlate the risk capital nPrded for new facilitiPs has been the primary finalH•ial problPm.
Ut>nerally speaking, the briek-and-mortar for production and test fa<•ilitirs now ownrd hy the aircraft industry were designed and laid out

64 AVIATION FACTS AND FIGURES, 1957
for the development and production of ·world War II type aircraft. The same is true for mueh of the production and test equipment. The subsonic wind tunnels of \Vorld \Var II are wholly inadequate for today's Mach 2-3 fighters and bombers. Under today's competitive conditions, it is also necessary that the design-manufacturer own or control some of these high speed wind tunnels, since some testing of models or verification of calculations must be made before a company can even submit a proposal in a design competition. Thus industry's facilities problem today is somewhat of a paradox. Many of the facilities now in being are excess to the productive and development needs of today 's and tomorrow's weapons. At the same time, the greatest single problem of management today is where to get the funds to provide for production and test facilities needed to produce the air weapons on order now and needed during the foreseeable future.
INCOME AccouNTs, 12 MAJOR AIRFRAME CoMPANIES, 1937 TO DATE (Millions of Dollars)
Year Net Sales Total Income
1937 $ 61.8 1938 88.5 1939 141.0 1940 247.4 1941 812.6
1942 2,788.9 1943 5,209.0 1944 5,766.3 1945 3,965.3 1946 519.0
1947 545.0 1948 843.4 1949 1,131.7 1950 1,388.2 1951 1,979.3
1952 3,731.1 1953 5,120.1 1 !l!H 4.926.8 1955
I 5,188.1
1956 5,637.1
a Subject to renegotiation. •• Credit.
\
Figures in parentheses indicate loss. Sources: 4, 5
$ 3.6 10.1 19.1 45.1
168.7
341.8 429.8 322.1 215.1 (37.0)
(115.4) 24.2 57.8
111.1 98.9
220.5 317.1 ~71.0
370.7 328.1
Total Federal Net Profit Taxes, net
$ 1.3 $ 2.3 2.1 8.0 4.5 14.6
13.3 31.8 108.6 60.1
281.2 60.6 357.0 72.8 263.5 58.6 147.7 67.4
26.3". (10.7)
73.5". (41.9) 21.8 2.4 21.7 36.1 48.5 62.6 68.0 30.9
138.8 81.7 200.5 116.6° 1RR.4 182.6. 191.9 178.8° 171.6 156.5"

FINANCE
FINANCIAL RATIOS, 12 MAJOR AIRFRAME COMPANIES
1937 TO DATE a/ L
Net Federal Year Taxes as Percent
of Total Income
1937 26.5 1938 21.9 1939 19.8 1940 26.9 1941 59.5 1942. 72.6 1943 72.0 1944 71.7 1945 57.5 1946 Not applicable 1947 Not applicable 1948 82.3 1949 37.5 1950 43.7 1951 68.6 1952 62.9 1953" 63.2 1954" 50.8 1955" 51.8 1956" 52.3
Figures in parentheses indicate net loss ns a percent of sales. a Subject to renegotiation. Sourc<>s: 4, 5
.J Industry
/c)Liu 1 c11 "'· (d· (~> "'-
Nonferrous Metals Petroleum Products Autos and Trucks Railway Equipment Iron and Steel
AIRCRAFT AND PAR'l'S
Total Manufacturing
a Subject to renegotiation. Source: 48
NET PROFIT AS PERCENT OF SALES, Seven Selected Industries,
1950 TO DATE (After Taxes)
1951 1952 1953 1954 <.,;. s> "i' 2 (o, '(
8.8 7.7 6.9 7.3 11.5 10.5 10.6 10.7 5.2 5.5 4.4 6.4 4.8 3.8 3.3 4.1 5.8 5.0 5.7 6.0
2.2 2.4" 2.4 3.8"
6.2 5.4 5.3 5.9
Net Profit as Percent of Sales
3.7 9.1
10.3 12.9
7.4 2.2 1.4 1.0 1.7
(2.1) (7.7) 0.3 3.2 4.5 1.6 2.2 2.3 3.7 3.4 2.8
1955 (.() 9.5
10.6 7.4 4.7 7.8
3.9"
6.7
65
' f!.i)t
m cw
tp.l 7·5" 'l• (p 4/t !>,
~,f L(!l
:~ .' ), .. f,O btD
1956 ~,0
10.5 10.4 5.7 4.4 7.2
3.4"
6.0

66 AVIATION FA CTS AND FIGURES, 1957
Some evidenee of industry \ ef-forts to solve this problem is illdiea ted by the table ou page 61 eoveri11 g tlw eollsoliuated bal a llee sheet of t he 12 major airframe companies. The 1ut<tl facili t ies im·estm ent for these twelve eompanies iner eascd durin g the year from $2] 4,000,000 to !1;310,-000,000. 'l'his additional $06,000,000 that \nLs risked by the industry during 1956 r epresents their ·eaiinings during the san1e year on t hree and one-half billion dollars in sales at their profit rate during that y ear of 2.8¢ per dollar of sales. Thus the earnings on over 60 per cent of their sales during 1956 were used to provide some of th e n eeded production and test facilities.
The primary source for most of these funds invested in n ew facilities during 1956 was r etained earnings. In addition, it will be noted that during the year the bank borrowings increased a little over three ~fold . Also, several companies sold additiona l sha res of equity capital. Others incr eased their long-term fixed debt through the sale of debentures. Thus the industry is using every available source of funds to solve this most pressing problem. How this problem is r esolved today will have an important bear·ing on the quality and quantity of air weapons available to th e military services in 1965.
Forwa rd financial planning in the aircraft industry is further complicated by the delays inher ent in the r en egotia tion process. Although 1956 earnings have been r eviewed and scrutinized by the military services on a eontrac t-by-contract basis, either during original negotiations or, as is more often the case, at varying points during performance of the contract , earnings are subject to later r eview by the Renegotiation Board leading to possible r efunds by manufacturers. This r eview and determination that a r efund of eam in~·s should or shonld not be made often r equires four years. This extended delay greatly incr eases the unknown, and thus the risk involved in any investment in facilities that have limited use for other than military weapon development, test and production.

GENERAL AVIATION
'!'he la rgest segment of civil av iation, in terms of hours flo\vn , units of aircraf t operated, and use of the federal airways system, is general aviation- which is all civil flying, excepting that of the scheduled airlines and the large irregular air carrier s. During the past year, according to CiYil Aeronautics Administration and industry estimates, general aviation operated 63,000 aircraft and fl ew 10,000,000 hours. This is in cont r·ast t o the nation 's civil airline fl eet which numbers about 1500 units which fl ew approximately 3lj2 million hours.
General aviation has become a major business and one, which through its very nature, makes substantial contributions to t he national economy and defense through speeding the transportation of businessmen, materials, equipment and supplies, and for agricultural purposes.
General aviation includes the activities of many differ ent kinds of nse rs of the air space of the n ation and its various aviation facilities-airports, a irways, a ir navigation a ids and the communicat ions which link these facili t ies together. General aviation also utilizes all types of civil aircraft , f rom the small single-engined cub type craft to rnulti-engined aircraft similar to transport airliners. H elicopters are also used in various fi elds of general aviation.
Nor, con tr ary to the fr eq uentl y found popular belief, is general avia t ion principally fl ying fo r pleasure or sport. Actually, though still a substantial segment of all such flying, it is the least in terms of hours , less th an 21 per cent of the to tal. 'I'he fl eet of general aviation is usrd in six prin cipal areas which are :
67
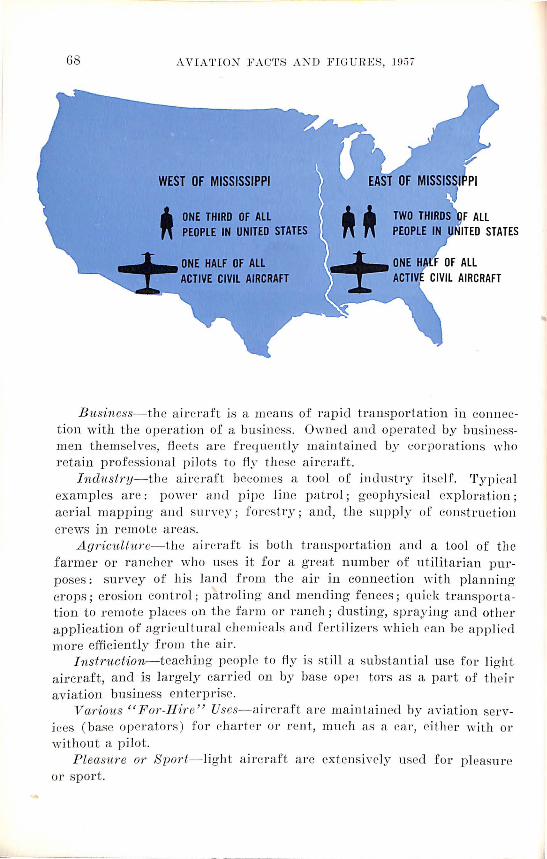
68 AV I ATION FAC'l'S AN D FIG UR ES, 1D57
WEST OF MISSfSSIPPI
' ONE THIRD OF ALL " PEOPLE IN UNITED STATES
B usiness-t he a ir craft .is a means of r apid t ra nsp ortation in connection with t he operat ion of a bus iness. Own ed a nd operated by busin essmen t hemselves, fl ee ts are fr eq uen tly ma intained by cor por ations who r etain profession a l pilots to f-l y these aircraft.
I n dustTy- the a ircraft becomes a tool of ind ust ry i tself. Ty pi cal examp les ar e : power a ud p ipe li ne patr ol; geophys ical explorat ion; aerial mappin g a nd su rvey; f orestry; and, t he supp ly of co nstruct ion cr ews in r emote areas.
A gTicu lt w ·e- t hc a i reraft is both t r a nsp orta tion a nd a t ool of th e farmer or r an ch er who uses it fo r a g r eat number of u t ilitar ian purposes : survey of his land f rom the air in connection with planning cr ops; erosion con t rol ; patr oling and mendin g f en ces ; quick t r anspor tation to r emote p laces on th e farm or r an ch; dusting, spr ay ing a nd other application of agricu ltural chemicals a nd f er t il izers which ca n be ap pl ied more efficien t ly f rom t he a ir.
l nstn ,wtian---teachiiJ g peop le to fl y is still a substant ial u se fo r l ight air cr af t , and is largely carried on by base ope1 tor s as a part of t heir aviation busin ess enterprise.
VaTious " For·-IIiTe" Uses- a ircraft a re mainta in ed by aviat ion services (base oper a tors ) for chart er or r ent, mu ch as a ca r, eith er with or without a pilot.
Plectsw·e OT SzJoTt- light a ircraft a re ext ensively used fo r pleasure or spor t.

GENERAL UTILITY AVIATION
CERTIFICATED CIVIL PILOTS AND STUDENT PILOTS, 1927 TO DATE
Certificated Airplane Pilots As of De-cember 31
TOTAL Airline Commercial Private PILOTS Transport
1927 1,572 a N.A. N.A. 1928 4,887 a N.A. N.A. 1929 10,287 a 6,053 4,162 1930 15,280 a 7,847 7,433 1931 17,739 a 8,513 9,226
1932 18,594 330 7,967 10,297 1933 13,960 554 7,635 5,771 1934 13,949 676 7,484 5,789 1935 14,805 736 7,362 6,707 1936 15,952 842 7,288 7,822
1937 17,681 1,064 6,411 10,206 1938 22,983 1,159 7,839 13,985 1939 33,706 1,197 11,677 20,832 1940 69,829 1,431 18,791 49,607 1941 129,947 1,587 34,578 93,782
1942 166,626 2,177 55,760 108,689 1943 173,206 2,315 63,940 106,951 1944 183,383 3,046 68,449 111,888 1945 296,895 5,815. 162,873 128,207 1946 400,061 7,654 203,251 189,156
1947 433,241b 7,059b 181,912b 244,270b 1948 491,306° 7,762° 176,845° 306,699° 1949 525,174 9,025 187,769 328,380 1950 d d d d
1951 580,574 10,813 197,900 371,861
1952 581,218 11,357 193,575 376,286 1953 585;974 12,757 195,363 377,854 1954 613,695 13,341 201.441 398,913 1955 643,201 13,700 211,142 418,359
N.A.-Not available. a Airline Transport Rating bet·nme effective May 5, 1982. bAs of April1, 1948. • As of May 1, 1949. tJ No survey made. Sources: 29, 82.
Student Pilot Glider
Approvals Pilots During Year
545 -9,717 -
20,400 -18,398 178 16,061 267
11,325 209 12,752 149 11,994 109 14,572 145 17,675 138
21,770 161 15,556 172 29,839 170
110,938 138 93,366 160
93,777 211 36,802 1,435 51,276 2,412 . 77,188 2,438
173,432 N.A.
192,924 2,995b 117,725 3,143° 49,575 3,291 44,591 d
45,003 3,300
30,537 3,365 37,397 3,402 43,393 3,512 44,354 3,657
69

70 AVIATION FACTS AND FIGURES, 1957
The business use of utility and executive type aircraft has perhaps shown tJ;te most spectacular growth, having increased from about one million annual hours in 1946 to an estimated 5 million hours in 1956. The strong trend towards the decentralization of American business enterprises has generated a demand for faster means of travel. Today's businessman cannot spend three or four days travelling to do one or two days of productive work. Through the use of executive aircraft he has found that he can douple, and often quadruple, his productivity. A measure of the extent to which aircraft are used by businessmen today is found in the numbers of general aircraft used for business purposes : an estimated 23,000, which is more than one-third of the total active fleet of civil aircraft. More than ninety of the nation's 100 largest corporations operate one or more aircraft for business purposes and executive transportation.
Farmers, ranchers, and others engaged in various phases of agricul-
CIVIL AIRPLANE PRODUCTION
1.9.'/7-1945, by Number of Engines and Places
TOTAL By Number of Engines Landplanes, by Place
Year PRODUCTION Single Multi 1-2 3-5 Over 5
1937 2,2894 2,171 118 1,668 460 105 1938 1,823 1,770 53 1,487 258 42 1940 6,785 6,562 167 5,527 1,031 140 1945 2,047 1,946 101 1,929 17 73
1946 to Date, by Type of Use and Number of Places
TOTAL By Type of Use By Place
' Year PRODUCTION General Transports 1-2 3-5 Over 5
1946 35,001 34,568 433 30,766 3,802 433 1948 7,302 7,039 263 3,302 3,737 263 1950 3,520 3,391 129 1,029 2,362 129 1951 2,477 2,279 198 614 1,661 202 1952 3,509 3,057 452 3,056 453 1953 4,134 3,825 309 3,822 312 1954 3,389 3,098 291 2,982 407 1955 4,820 4,575 245 3,586 448 1956 7,205 6,778 427 6,505 700
N.A.-Not available. "Civil airplane p1·oduction shown here differs from that on pp 8 & 9. Recent CAA revision
of total civil airplane production not yet carried through all breakdowns. Source: 20, 29

•
GENERAL UTILITY AVIATION 71
ture, too, haYe found that the ge neral aircraft has a vital place . .t\gronomists of the Civil Aeronautics Administration and the Department of Agriculture, have estimated that agricultural uses of aircraft have added as much as 3 billion dollars annually to farm income.
The airplane also is assuming an increasing industrial role where it becomes less a means of transportation and more a tool of industry. Specific exampl es are powrr and pipel ine patrol, geophysical exploration , and aerial mapping and survey \YOrk.
General aYiation utilize.· all types-but principally light transports, some helicopters, and la rge numbers of single-engined aircraft.
There are four main types of utility aircraft:
(1) small one- and two-place aircraft with 65 to 150 horsepower engines, and speeds of 70 to 135 miles per hour. These are the kind of aircraft most often used for instruction, for light agricultural use, and for sport flying.
(2) three- and four-place aircraft grossing up to 2,700 pounds and powered with engi nes from 125 to 225 horsepower. Good "crosscountry" a ircraft, able to maintain ern ising speeds of 150 miles per hour or more, they have endurance of three to four hours without refueling. Such aircraft are extensively used in all categories of general aviation.
( 3) four- to five-place aircraft, weighing as much as 5,000 pounds with 175 to 300 horsepower. Able to cruise at speeds rang·ing from 140 to 225 miles per hour and generally r eferred to as exernti,·e aircraft , th ey are well equipped with radio and instruments. and rn pabl r of cross-conntry flight nnder instrument ronditions.
( ..J. ) fon r- to ten-pla er, mnHi-engine light transports. with 175 to 500 horsepo\\'er eng- in es. J,it·r t·ally small transports, such aircraft haYe a cross-count-ry speed of from 150 to 300 miles per hom.

72 AVIATION FACTS AND FIGURES, 1957
CIVIL AIRCRAFT BY STATES, JANUARY 1, 1956
State Total Active I In- State Total Active In-active active
------ ----TOTAL 85,320 60,432 24,888
------Alabama .......... 668 468 200 Nebraska ....... 1,565 1,231 3:1-t Arizona ........... 1,174 780 394 Nevada ........ 444 307 1B7 Arkansas .......... 1,018 680 338 New Hampshire. 203 135 (iS California ......... 9,926 6,766 3,160 New Jersey ..... 1,789 1,199 5011 Colorado .......... 1,168 852 316 New Mexico .... 780 534 24(i
Connecticut ....... 664 469 195 New York ...... 4,255 2,969 1,28fi Delaware ......... 224 156 68 North Carolina .. 1,526 1,055 471 District of Colum- North Dakota ... 974 625 34!l
bia ............. 446 331 115 Ohio ........... 4,115 2,904 1,211 Florida ........... 2,458 1,442 1,016 Oklahoma ...... 1,812 1,311 501 Georgia ........... 1,121 766 355 Oregon ......... 1,619 1,176 443
Idaho ............. 802 631 171 Pennsylvania ... 3,388 2,413 971l Illinois ............ 4,741 3,487 1,254 Rhode Island ... 184 133 51 Indiana ........... 2,538 1,834 704 South Carolina .. 509 361 148 Iowa ............. 1,966 1,629 337• South Dakota ... 992 769 223 Kansas ........... 2,200 1,641 559 Tennessee ...... 845 585 260
Kentucky ......... 641 455 186 Texas .......... 6,617 4,703 1,914 Louisiana ......... 1,326 863 463 Utah ........... 484 355 129 Maine ............ 434 314 120 Vermont ....... 149 90 59 Maryland ......... 799 551 248 Virginia ........ 1,075 687 388 Massachusetts ..... 1,295 877 418 Washington •.... 2,219 1,587 632
Michigan ......... 3,611 2,625 986 West Virginia ... 507 336 171 Minnesota ........ 2,220 1,675 545 Wisconsin ...... 1,689 1,255 434 Mississippi ........ 867 ' 559 308 Wyoming ....... 477 360 117 Missouri .......... 1,965 1,498 467 Territories and Montana •......... 1,123 868 255 Foreign ...... 1,708 1,135 573
Source: 29
Four to seven hours' endurance, and extensive instrumentation and radio, enable these aircraft to duplicate airline-type performance and to operate in marginal weather. This type of aircraft is much in demand by corporate 11 •rs.
In addition to these four principal aircraft types, all of which are being currently manufactured and deliv<>red, there is an active fleet of several hundred larger multi-engined aircraft, quite comparable or identical to planes used by the airlines, in use by corporations for busi-

GENERAL UTILITY AVIATION 73
ness purposes, principally executive transportation. Deliveries of new aircraft of the above-described types used in gen
eral aviation-a significant yardstick to measure growth-has shown a marked increase in recent years. In 1954, 3,098 new airplanes were delivered; in 1955, 4,575; and in 1956, 6,778. The 1956 shipments show a 50 per cent increase in both unit and dollar volume which, in this latter year, was $98,000,000 (retail value).
The dollar value of the active fleet of general aviation is now estimated to exceed 700 million dollars ; and, in terms of purchases of new equipment, gasoline, repair and maintenance, an~ the salaries of mechanics, and of professional personnel who fly many of these aircraft, now
LANDING AIDS TO AIR NAVIliATION, 1941 TO DATE -
Calendar Year Instrument Precision Airport Surveillance Landing Systems Approach Radar Radar
1941 1 - -1946 31 - -1951 97 10 10 1952 120 10 10 1953 143 10 17 1954 153 10 28 1955 157 10 31 1956 160 10 40
Sources: 29, 32
HOURS FLOWN BY UTILITY AIRCRAFT, 1931 TO DATE
Instructional Commercial" Businessb Pleasure, TOTAL etc.
Calendar (Thousands Year of Hours) ; Hours Per- Hours Per- Hours Per- Hours Per-
OOO's cent OOO's cent OOO's cent OOO's cent ---------------
1931 1,083 307 28.3 281 25.9 152 14.1 343 31.7 1941 4,460 2,816 63.1 511 11.5 250 5.6 883 19.8 1951 8,451 1,902 22.5 1,584 18.8 2,950 34.9 2,015 23.8 1952 8,186 1,503 18.4 1,727 21.1 3,124• 38.2 1,832 22.3 195:1 8,527 1,248 15.0 1,649 19.0 3,626 42.0 2,004 2-l'' 1954 8,963 1,292 14.4 1,829 20.4 3,875 43.2 1,967 22.0 1955 9,500 E E E E' E 1,275 13.4 1,950 20.5 4,300 45.3 1,975 20.8
a Includes contract, industrial, and commercial agricultural flying. • Includes flying for corporate or executive purposes as well as flying on personal businePs • Company Business 2.1 million hours; Individual Business 1.0 million hours. E Estimate. Sources: 1, 28

74 AVIATION FAC'l'S AND FIGURES, 1957
adds an estimated half bill ion dollars or more a nnually to the national
economy. General aviation's active fl ee t includes several times more multi
engined aircraft fully equipped to fly on the nation's airways under instrument conditions than do the airlines. Large numbers of singleengined craft are also so equipped. It is not unusual for small business aircraft to have onc-lhinl or HWI'e of their cost r epresented in the instrumentation. Th e gener al aircraft fl eet operates more auto pilots and airborne ·weather radar than do the airlines. This results hom th e fact that users of general aircraft haYe found that to gain the most efficient
PuBLIC AIRPORTS BY LENGTH OF RuNWAY AND REGION, JANUARY 1, 1957
A irports by Length of Runway (in feet)
Region TOTAL 0- 3,000- 3,500-14,200- 5,000- 5,900- 7,000-
2,999 3,499 4,199 4,999 5,899 6,999 & OVf'l'
--- - - - ------ --- --- - - - - - -
TOTAL • ••• • 0 ••••••• 2,798 1,229 363 389 203 346 92 176 --- --- ---· ------ --- --- --
New England . .. .. . 120 59 3 26 12 11 2 7 Middle Atlantic . . .. . 299 193 36 24 13 21 3 9 East North Central .. 538 305 90 71 20 32 7 13 West North Central . 441 226 70 62 21 29 10 23 South Atlantic . . ... . 329 Jl!) -1-3 :i9 27 76 6 23 East South Centrn l .. 118 47 "17 20 ]1 1-1 1 8 West South Centra l . :w1 107 46 67 3G 4!) 18 22 Mountain 0 . 0 •• • 0 ••• 301 fil 23 !j() 36 70 27 -1-1-Pacific 0 0. 0 •••••••• 311 ]2() 3!5 30 37 I -~ 8 18 37
Source: 29.

J;''
GENERAL UTILITY AVIATION 75
AIDs TO AIR NAVIGATION, 1926 TO DATE
Civil Airways Radio Range Federally Air Com-Non- Operated Traffic
Mileage Stations direc- Control Facilities Traffic bined
tiona! Com- Sta-
Year Radio muni- tion
Con- Direct Low and Very cations Tow-Medium High Bea- Airport Airway Sys-trolled VOR ers
Airways Fre- Fre- cons Towers Centers terns Airways quency quency
--- --1926 2,041 - - - - - - - -1931 17,152 - 47 - 46 - - - -1936 22,245 - 146 - 57 - - 203 -1941 36,062 - 323 8 48 - 14 415 -1946 44,145 - 364 50 74 115 29 397 -1951 74,424 - 375 385 152 157 31 427 34 1953 72,097 54,490 368 392 181 115 31 395 53 1954 69,359 64,995 346 403 170 104 31 376 70 1955 67,770 81,209 344 424 175 100 31 364 75 1956 67,783 90,268 342 441 180 103 32 369 79
Sources: 29, 32
use of their aircraft, they must be well equipped so as to be able to fly both on and off the airways in fair weather and foul. The value of these equipments is now in excess of $100,000,000.
Although there are approximately 644,000 certificated pilots, only about. 217,000 of these pilots haYe current medical certificates. Of the active pilots, airline pilots and co-pilots number about 8,000, which gives an indication of the size of the active pilot group which flies general aviation's planes. The large number of certificated pilots results in a degree from the fact that returning military pilots at the end of World War II were given civilian pilot certificates, many of which are no longer active. The number of current medical certificates is the real measure of the number of active pilots. Of the approximately 209,000 pilots who operate the general aircraft fleet, about 76,000 have air transport or commercial ratings, and 23,500 instrument ratings, which is a further measure of the competence of the pilots of general aircraft's fleet to operate on today 's increasingly congested airways.
In the type of economy existing in the United States, which is Yitally dependt>nt on transportation, and which is quick to utilize any new means which will increase the efficiency of business, broaden its base, and malw it more competitive, the air transportation provided by

76 AVIATION FACTS AND FIGURES, 1957
the use of general aircraft offers a challenge which increasing numbers of businessmen, industries, and farmers and ranchers are accepting.
Nor, are the day-to-day civil uses of general aircraft's fleet it-s only value to the nation. The thousan¢1.s of well-equipped light aircraft, together with the trained pilots who fly them and the base operators who service and maintain them, provide a reserve of transportation which could become vital under the emergency conditions which would be imposed by war or civil disaster. Under such conditions when the usual form of surface transportation can become seriously disrupted or completely blocked, light aircraft capable of landing in small areas under emergency conditions would be vitally important in bringing ·the supplies and providing the communications necPssary to re-establish the productivity of devastated areas.
As of January 1
1928 ........•.•.•. 1932 ..........•.•. 1935 ...•.......... 1941 .............. 1951 .............• 1952 .............. 1955 .............. 1956 ..........•... 1957 ..............
N .A.-Not available. E Estimate. Sources: 29, 32
TOTAL CIVIL AIRCRAFT, 1928 TO DATE
TOTAL Active Inactive
2,740 N.A. N.A. 10,680 N.A. N.A.
8,322 N.A. N.A. 26,013 N.A. N.A. 92,809 60,921 31,888 88,545 54,039 34,506 92,067 58,994 33,073 85,320 60,432 24,888 87,531 64,688 22,843

GE NERAL UTILITY AVI ATION
AVERAGE COSTS PER MILE TO FLY NEW SINGLE ENGINE AIRPLANES IN 1956
Flying at 145 MPH Block Speed Costs • BVz cents per mile
Range of Costs:
A $10,000 Plane at 125 MPH 6 8j 10 cents per mile A $25,000 Plane at 170 MPH 10 8/ 10 cents per mile
C IV I L AIRCRAF~'", BY YEAR OF M ANUFACT URE
A s oF J".AN UAH¥ 1, 1957
Year Num ber Percent of T otal of
Manufacture 85,320 100.0
Pri or to 1945 23,652 27.7 1945 1,157 1.3
1946 1,606 1.9 1947 24,342 28.5 1948 10,283 12.1 1949 5,102 6.0 1950 2,558 3.0
1951 2,729 3.2 1952 1,786 2.1 1953 2,734 3.2 1954 3,255 3.8 1955 2,613 3.1 1956 3,503 4.1
77
a N umber of civil a ir cr aft, nc ti ve a nd inac ti ve. commercinl tra nspor t a nd u ti li ty, r ecord ed with Civil Aero nautics Adm ini strnt ion .
Source: 3 0

HELICOPTERS
Increasing r ecognition of the heli copter 's p lace in ciYil operations and importa nt str ides in the fi eld of VTOL';:• and ST OL':'";:• development work wer e th e important mileposts during the past year in this phase of t he a ir craft manufacturing industry. Acceptance of rotorcraft by t he a rm ed forces following \ iV orld ·war II a nd th e r emarkable r ecord established by t his craft, not only in assault land ings and other tactical maneuvers but in t he fi eld of spectacula r r escue operatim1 s, established helicopters as an integra l part of ou r military sys tem and made possible the continued development of "bigger and better" craft r eadi ly adaptable to innumerable civil n eeds.
According to an industry survey, approximately 400 helicopters a re now being operated by about 80 charter companies and, at th e same time, individual cor porations ha \·e learned the effi cient capabilities of this type of aircraft and, ea rly in 1957, a check showed t hat forty co rporations wer e oper ating 65 heli copters on company bu.siness.
A very sign ifi cant stat ement was made by H ervey F. Law of the Port of Te w York Authority regard ing the g rowth of heli co pter passenger busin ess. Speakin g before th e H elicopter Association of Am erica this past January, Mr·. Law declared: ''vVe of t he 'ort Authority believe t hat t he h elicopter will be t he most f requently u ,;ecl business a ircraft of the future for short-h aul operation s. \Ne are also convinced that the
* V e rti cn1 rrake o ff o.nd J.Alnclin g ** , hort T a keofi nnd L and ing
----- --
78

HEL TCOPTERS 79
ill'li t.:opte r COllllll O!l t.:a rrier has a gTeat future iu the short-haul fi eld. Ou r 1%2 study ' Transportation by H eli eopter 1955-75' indi ca ted that helif'opte r s a re admirabl y suited to proYide a Yastly improYecl type of servit.:e in t hree importa nt fi elds: (1 ) on rou tes bet\reeu t.: it ies from 40 to 175 miles apart; (2) Oll routes linking eity t.:e nters \\·ith the suburbs; and (3) on rou tes linking t il e a irports \rith each other and \rith downtown centers. The study indicated t hat three types of services would result in a combined total of 5,000,000 helicopter passengers a year entering or leaving Manhattan by 1970 ... traYeling by helicopter will be as r:ommon as air travel today.''
Confirming the New York situation is the announcement that the Port Authority plans additional heliports in mid-town east side, in the downtown \Vall Street area, in the northern ar ea of Staten I sland, and in Brookly H.
In similar fashion the Department of Airports, City of Los Angeles, has announced that their over-all planning· for the f uture includes a system of modern design heliports to be located in fi ve areas-valley, Holly\vood, downtown, east and harbor. 'l'hese would be so situated as to serve t he large population a reas with speedy shuttle ser vice for both mail and passenger s. The Department points out that passenger helicopter service in that area has been increasing by about 20 per cent a month since its inauguration in 1954 and that about 50 communit ies in the greater I ... os Angeles met ropoli tan area are being served by I ... os A ngeles .Ainra.;rs from fourteen heliports, through in terline connection with Internati onal Ai rport.
S ign ifica nt also as to the definite trend toward development of the
(_ .
'o~ . ~ . " . ' . • • I I· '.,
l...l..l..o.! "ttlll..a. ... ~..- '
on
COST OF GRAZING A 2000 ACRE TRACT 3 TIMES

80 AVIATION FACTS AND FIGURES, 1957
u. s. EXPORTS OF CIVIL ROTARY-WING AIRCRAFT
1948 TO DATE
Year Number Value in Thousands
1948 47 $1,933 1949 31 1,181 1950 38 984 1951 28 899 1952 37 1,411 1953 98 4,873 1954 74 4,044 1955 66 4,165 1956 55 3,658
Source: 20.
helicopter as a public service vehicle was the action of the Pennsylvania Aeronautics Commission in retaining the services of Frederic P. Kimball, aviation consultant, to prepare an exhaustive report on the helicopter to provide guidance for the state's line of action.
In an industry report submitted to Edward P. Curtis, Special Assistant to the President for Aviation Facilities Planning, certain pertinent conclusions are presented, such as the indication that five distinct markets represent a fertile potential for the continuing sale of rotary-wing aircraft:
(a) Department of Defense (b) Corporations (c) Air Commerce (other than air carrier) (d) Air Carrier (e) Private ~.
With an analysis showing that the 1956 distribution was predominently military (80 per cent) with commercial second (15 per cent) this report looks ahead to 1965 and the expansion of corporate and commercial deliveries to 50 per cent and military being 40 per cent of total output. Air carrier demand would take 8 per cent and private the remaining 2 per cent.
Growth of corporate and commercial usage would follow the trend already clearly perceptible. Despite the slownes• of the majority of our larger cities and industrial centers to make heli(·upter services accessible to their people through the provision of suitable landing areas-heliports -the existing, and prospering, charter operators are establishing a re-
. markable record of accomplishment. For example, Rick Helicopters, located at San Francisco, now operate 30 helicopters on a wide variety
. i

HELICOPTERS 81
oE charter missions. Okanagan Helicopters, organized by Carl Agar and no"· operating a tota l oE 52 helicopters, r eports 1956 income at $2,000,000 as compared to $7,000 in 19-!7.
'l'weh·e-passenger heli eoptc rs a lready are in senice in scheduled operat ions, \\·hi le the CiY il Aeron auties Administration this Spring certifi cated a fifteen-passenger, tandem rotor helicopter with greatly improved cabin si lencing and extremely roomy in the transport type, where r eg ula r ai rl in e-type seating is used . Fo r higher density seating, a different type of furnishing will aecommodate 19 passengers.
The announcement that two helicopters had been acquired for the use of the President and his aides made internatiomtl news this Spring and proYided great impetus to the g rO\ring r ealization of this air craft's efficiency. The President's helicopters ''"ill pick him up right on the ·white House grounds for fl ight to his destination, thus eliminating the traffic jams and congestion on the higlnrays always occasioned by the President's automobile journeys.
No. No. of
Producer of En-P laces g incs --- - --
Bell 3 1 3 1 3 1 4 1
Doman 8 1
Hiller 3 1 3 1 2 2
Kaman 5 1
Sikorsky 12 1 12 1 - 2 20 1
V r r tol 22 1
Sou rre : 1
v HELICOPTERS I N PRODUCTION
April1957
J>! /)
'-
Military Designations Com-
HP mercia! Des ign USAF USA USCG USMC
-- - --
200 47G H-13G I-I-13G HTL-6 I-ITL-6 250 47G2 I-I -13H 200 47H1 250 47-J HUL
400 LZ-5-2 YH-31
200 12-C H-23-C I-I -23-C 250 12-D H -23-D H-23-C
96 I-IJ -1 I-I-32
600 KC-600 HOK-1
600 S-55 I-I-19A I-I-19C H04S-2G HRS-1 700 S-55A I-I-19B I-I-19D HR.S-3
4,200 856 H-37-A HR.2S-1 1525 S-58 H-34-A I-IUS-1
1425 H-21 H-21B H-21 C
USN
I-ITL-6
HUL
HOK-1
H04S-1 H04S-3 HR.2S-1W HSS-1

82
SALES AND BACKLOG OF l\IAJOR HELICOPTER :MAXUFACTURERS
(In Millions of Dollars)
195-.l 1955 1956
Totals Sales during the Year ........ $307.4 $333.5 $337.0 To Military Agencies ............ 202.6 260.1 283.6 Civilian Sales .................. 104.8 73.4 53.4
Total Backlog at End of Year ....... $677.8 $540.1 446.6 Military Orders ................. 584.3 469.0 379.7 Civilian Orders ................. 93.5 71.1 66.9
Source: 2.
More than 1,000 members and guests of the American Society of Planning Officials, meeting in San ]'rancisco in March, were told of the urgency of heliport planning as well as the need for eliminating unnecessary legal restrictions that unintentionally hamper the full development of helicopter services and resulting benefits to the public.
Years ago when state aeronautical laws were first being passed, legislatures drew upon the definition of the word ''aircraft'' used in Federal statutes: "Any contrivance now known or hereafter in\'ented, used or designed for navigation of or flight in the air.'' This definition, coined when only fixed-wing aircraft were in common usage, still appears in statute books throughout the country and, consequently, today embraces helicopters and other rotary-wing vehicles.
·where no corrective action has been taken to distinguish the helicopter's performance characteristics and relieve it from fixed-wing restrictions, development has been seriously retarded. Prospective operators, for example, hesitafe to invest in rotary-wing aircraft when they fear that operations will be unduly curtailed.
AlA's Helicopter Council, the National Association of State Aviation Officials, the American Bar Association, the Helicopter Association of America and other organizations and individuals are striving to correct this condition.
While concentrating in the main upon helicopter development and production, the industry has been equally alert to the promise of STOL and VTOL development. A number of developmental designs awarded by the military are well along toward completion. One design, described as a tilt-wing, and the first of this type built, was a development contracted for by the Army and Naval Research. In April it was undPrgoing ground tests with flight testing to follow.

AIRLINES AND TRANSPORTATION
In the short sp an of seven years, the scheduled airlines of the free world have mad e r ecord gains in every type of operation. Since 1949, there has been almost a threefold increase iu the number of passengers carried and passenger miles flown . During 1956, the world 's scheduled airl ines carried 78 mill ion passengers, each an average distance of 575 miles.
U. S. sch'3duled airlines, for the 19th consecutive year, set new r ecords in 1956. The number of passengers carried increased 10 per cent over 1905 and was more than three times greater than in 1949 . . A .. s an indication of the r apid g rowth of the U. S. scheduled airline industry, in July 1956, these airlines carried their 300,000,000th passenger , just two year·s after carrying their 200,000,000th passenger . In 1950, more than 20 years after airline service began, the 100,000,000th passenger was carried.
Thi s vast number of a ir travelers are flying today, with greatly improved equipment and se rvice, at about the same fares set when the Civil Aeronauti cs J\ ct of' 1938 was passed. Safety in flying continues to improve with a stE><lLly Llrop in airline accident fatality rate in the last ten years. Ai 1· t ra \"(' l tod ay is four times as safe as riding in one's own automobile.
83
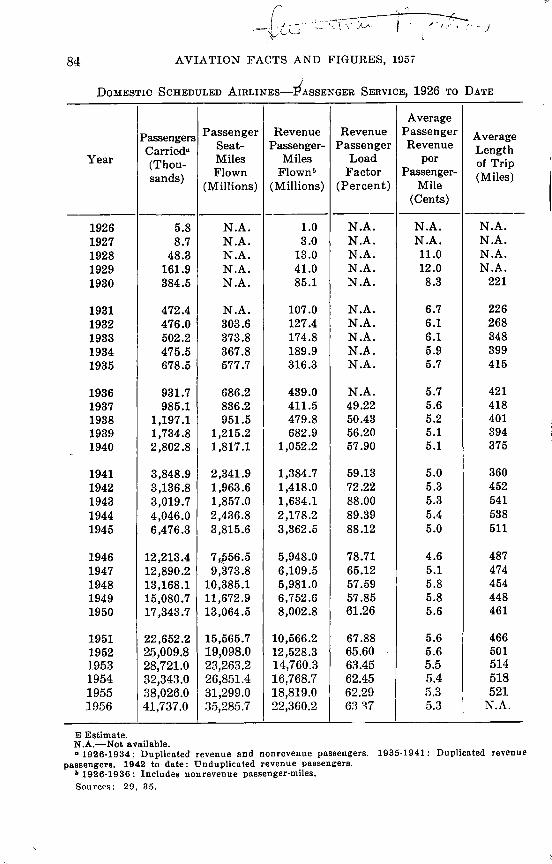
84 AVIATION FACTS A.ND FIGURES, 1957
DoMESTIC ScHEDULED AmLINEs-:P'AsSENGER SERVICE, 1926 To DATE
Passengers
Year Carried a
(Thou-sands)
1926 5.8 1927 8.7 1928 48.3 1929 161.9 1930 384.5
1931 472.4 1932 476.0 1933 502.2 1934 475.5 1935 678.5
1936 931.7 1937 985.1 1938 1,197.1 1939 1,734.8 1940 2,802.8
1941 3,848.9 1942 3,136.8 1943 3,019.7 1944 4,046.0 1945 6,476.3
1946 12,213.4 1947 12,890.2 1948 13,168.1 1949 15,080.7 1950 17,343.7
1951 22,652.2 1952 25,009.8 1953 28,721.0 1954 32,343.0 1955 38,026.0 1956 41,737.0
E Estimate. N.A.-Not available.
Passenger Revenue Seat- Passenger-Miles Miles Flown Flownb
(Millions) (Millions)
N.A. 1.0 N.A. 3.0 N.A. 13.0 N.A. 41.0 N.A. 85.1
N.A. 107.0 303.6 127.4 373.8 174.8 367.8 189.9 577.7 316.3
686.2 439.0 836.2 411.5 951.5 479.8
1,215.2 682.9 1,817.1 1,052.2
2,341.9 1,384.7 1,963.6 1,418.0 1,857.0 1,634.1 2,436.8 2,178.2 3,815.6 3,362.5
7 ,p56.5 5,948.0 9,373.8 6,109.5
10,385.1 5,981.0 11,672.9 6,752.6 13,064.5 8,002.8
15,565.7 10,566.2 19,098.0 12,528.3 23,263.2 14,760.3 26,851.4 16,768.7 31,299.0 18,819.0 35,285.7 22,360.2
Average Revenue Passenger Average
Passenger Revenue Length Load per of Trip
Factor Passenger- (Miles) (Percent) Mile
(Cents) ----
N.A. N.A. N.A. N.A. N.A. N.A. N.A. 11.0 N.A. N.A. 12.0 N.A. N.A. 8.3 221
N.A. 6.7 226 N.A. 6.1 268 N.A. 6.1 848 N.A. 5.9 399 N.A. 5.7 415
N.A. 5.7 421 49.22 5.6 418 50.43 5.2 401 56.20 5.1 394 57.90 5.1 375
59.13 5.0 360 72.22 5.3 452 88.00 5.3 541 89.39 5.4 538 88.12 5.0 511
78.71 4.6 487 65.12 5.1 474 57.59 5.8 454 57.85 5.8 448 61.26 5.6 461
67.88 5.6 466 65.60 5.6 501 63.45 5.5 514 62.45 5.4 518 62.29 5.3 521 6:-l'W 5.3 N.A.
,. 1926·1934: Duplicated revenue and nonrevenue passengers. 1935-1941: Duplicated revenue passengers. 1942 to date: Unduplicnted revenue passengers.
b 1926-1936: Includes nonrevenue passenger-miles. Sources: 29, 35.

AIRLINES AND 'l'RANSPORT A'l'ION 85
1'1·ans-Atlan f?·c A ir 'l'·ravel
Tra ns-At lan t ic a ir traYel surpassed sea t r aYel for the first t ime in histo1·y last year. App roximately 482,000 passengers traveled W estbound acr oss t he A tl antic in a irplanes dm:ing 1956, compared to about 479,000 in ships. Eastbound traffic by air \Yas eYen higher as compared to sea : 411 ,000 a ir t raxeler s compared to 385,000 sea travelers. Eightysix civil a irplanes a day flew acr oss the Nor th Atlant ic during July and August. This m eans t hat about eYer y 16 or 17 minutes a passenger plane, either scheduled or non-scheduled, was taking off for a t ransJ\tlantic fli gh t .
Air Mail
*' Although t he mail ton miles of the U. S. scheduled a irlines continues to incr ease, th e r e.-enue obtained from carry ing mail r epresents a smaller and small er portion of airline eamings each year. In 1939 mail pay in th e form of s ubsidy, or public service r evenue, was a major source of a irline in co me. By compar ison , in 1956, public service r evenue paid to th e a irlines r ep resented only 2.3 per cent of th eir gross income. The dome»tic trunklines " ·er e almost enti rely free of subsidy. Only the local senice a irlines. certain segments of international routes, the terri torial a irlines and new heli copter senices still r eceive public ser vice r evenues.
An experimen t of ca rrying three-cen t mail by a ir when the scheduled ai rlin es haYe space aYa il able was brgun in 1953. It continues to expand

86 AVIATION FACTS AND FIGURES, 1957
DOMESTIC AIRMAIL RATES, SINCE 1918
Effective Date Rate Note
1918, May 15 .... 24¢ per ounce or fraction 10¢ of this for special delivery July 15 ..... 16¢ for first ounce or fraction 10¢ of this for special delivery Dec. 15 .... 6¢ per ounce or fraction
1919, July 18 ..... 2¢ per ounce 1924, July 1. ..... 8¢ per ounce or fraction per zone 3 zones established
1925, July 1. ..... 10¢ per ounce or fraction Overnight airmail New York· Chicago
1926, Jan. 19 ..... 10¢ per ounce for fraction up More for greater distances to 1 ,000 miles
Sep. 4-11 ... Special rates for special services Varying from 8 to 32 ¢ 1927, Feb. 1 ..... 10¢ per half ounce or fraction Zoning abandoned 1928, Aug. 1. .... 5¢ for first ounce or fraction
1932, July 6 ...... 8¢ for first ounce or fraction 1934, July 1. ..... 6¢ per ounce or fraction 1944, Mar. 26 .... 8¢ per ounce or fraction Overseas mail to servicemen
6¢ per half ounce 1946, Oct. 1 ...... 5¢ per ounce or fraction 1949, Jan. 1. ..... 6¢ per ounce or fraction
4 ¢ per postal card or post card 1953, Oct. 6 ••••• Experimental airlift of On a "space available" basis
3¢ mail between selected points.
Sources: 58, 78
and proves to be more and more successful. It is estimated that in 1956 this experiment saved billions of hours of delivery time for millions of letter writers. Millions of letters reached their destinations an average of 12 hours sooner than had they been carried by surfare means.
Inaugurated in 1948, the use of air parcel post has increased 277 per cent in less than ten years. The number of pieces flown, both domestic and international, in 1956, was 24,201,198, a gain of 11.9 per cent over the previous year.
Equiprnent
Airlines of the free world operated a fleet , . L over 2500 aircraft in 1956, of which more than 85 per cent were American-built. The combined fleets of the nation's sr·heduled airlines by the end of 1956 exceeded 1,500 aircraft, representing an investnwnt of more than half a billion dollars.
At the end of the first two months of 1956, U. S. manufacturers had

AIRLINES AND 'rR.ANSPORT AT ION
AIRCRAFT I N SERVICE ON WORLD AIRLINES
( l\Ieu dJcrs of Intemational Air Transport Association-Dec. 31, 1955)
Aircraft by Country in ·which Manufactured
GRAND TOT.L\L . ..................... .. .................... ..
:\lade in the Un ited States .................... .. DC-7 .................................................. .. DC-6 ................................................... . DC-4 .................................................. .. DC-3 -----------·······-----------·--- -- ----------------Super Constella tion ......................... . Constellation .................................... .. Convair 340 ...... . ............................ . Convair 240 ..................................... -.. Str atocruiscr ................................... .. Martin 4-0-4 and 2-0-2 .................... .. All other .................. .......................... ..
Made in Great Britain ........................ _____ _ Viscount ............ ............ .................... .. Viking .... ............................................. . DH Heron ...................................... .. Bristol 170 .......... .............................. . E li znbcthnn DH Hnpidl' All other
!\fa !lc in Ca nada :\fndc in other countri es
Ao nrce : 53
Number of
Aircraft
2,529
2,188
250
GO 31
89 336 208 702 140 173 151 132
52 115
90
69 36 38 21 19 18 49
P ercent of
Total
100.0
86.5
9.9
2.4 1.2
87

88 AVIATION FACTS AND FIGURES, 1957
orders on their books for about 900 large transport aircraft. Nearly 400 o£ these are large piston and turbo-compound powered airlinersplanes which will be delivered in the 1957-1959 period and which will remain in airline service for decades. About 500 jet and turboprop airliners are also on order from U. S. aircraft companies. American-manufactured turboprop airliners will enter service in 1958, U. S. jet transports in 1959.
Air Traffic Control
On this threshold of the jet age in civil aviation, the problems of air traffic control become more intensified. Today, military and civilian aircraft using the Federal Airwa_\·s System have speeds ranging from 100 miles per hour to 600 miles per hour and fly at altitudes to 40,000 feet ~·"'
and above. This presents a very different situation from that of a few years ago when practically all aircraft flown on instruments on the air-ways were unpressurized and had approximately the same modest cruis-ing speed and climb and descent capabilities. In early 1956, a Special Assistant for Aviation Facilities Planning was appointed by the Presi-dent to develop comprehensiYe proposals for meeting the Nation's need
DEVELOPMENT OF WORLD CIVIL AIR TRANSPORT
(Scheduled Services-International and Domestic, Excluding China and USSR) 1919 TO DATE
Passen- Passen- Cargo Mail Average Average Miles gers ger- Ton- Ton- No. of Miles
Year Flown Carrie,p. Miles Miles Miles Passen- Flown (mil- (mil- (mil- (mil- (mil- gers Per Per
lions) lions) lions) lions) lions) Aircraft Passen-ger
1919 1 N.A. N.A. N.A N.A. N.A. N.A. 1929 57 N.A. 132 N.A. N.A. 2.3 N.A. 1934 101 N.A. 405 N.A. N.~. 4.0 N.A. 1939 185 N.A. 1,262 N.A. N.A. 6.8 N.A. 1944 257 N.A. 3,412 N.A. N.A. 13.3 N.A. 1949 840 27 15,000 390 130 18 545 1951 1,010 42 22,000 640 170 22 520 1953 1,200 52 29,000 720 190 24 560 1955 1,440 68
I 39,000 910 260 27 570
1956 1,630 78 45,000 1,030 280 28 575
N.A.-Not available.
Sources: 50, 55

AIRLINES AND TRANSPORTATION
~ -·{_~~ --U.S. INTERNATIONAL SCHEDULED Anu.INE&-0PERATOR81
EQUIPMENT, SPEED, 1928 TO DATE
As of December Operators
31
1928 1 1929 4 1930 3 1931 3 1932 3
1933 3 1934 2 1935 2 1936 2 1937 2
1938 2 1939 2 1940 3 1941 3 1942 3
1943 3 1944 3 1945 4 1946 9 1947 12
1948 13 1949 13 1950 12 1951 12 1952 13
1953 14 1954 15 1955 15 1956 13
Fl Estimate. N.A.-Not 8\'ailnble. Sources: 29, as.
Aircraft in
Service
57 83
103 100 108
86 99
101 94 92
73 84 68 83 68
70 70 97
147 154
175 ri7 160 140 148
161 161 147 Ul6
Average Route Miles Average Available Operated Speed
Seats (thousands) M.P.H.
N.A. N.A. N.A. N.A. N.A. N.A. N.A. 19.2 N.A. N.A. 19.5 N.A. N.A. 19.6 N.A.
N.A. 19.4 N.A. N.A. 22.2 N.A. N.A. 31.3 N.A. N.A. 32.0 N.A. N.A. 32.0 N.A.
16.9 35.0 N.A. 17.7 43.5 N.A. 18.3 52.3 N.A. 18.0 N.A. N.A. 17.7 N.A. N.A.
17.5 27.2 N.A. 18.5 29.7 149.2 18.9 38.9 150.7 27.2 66.4 166.3 35.2 95.5 191.1
35.1 105.9 198.5 36.6 109.0 207.1 41.0 106.4 218.4 46.4 108.8 223.5 49.1 110.5 226.8
52.3 112.3 229.9 !)6.9 111.8 N.A. 57.03 114.0 245.4 !)8.43 131.4 244.6
-
89
Passenger Fatalities
per Million Passenger-
Miles Flown
N.A. N.A. N.A. N.A. N.A.
N.A. N.A. N.A. N.A. N.A.
13.0 12.8 N.A. 1.2
N.A.
3.9 5.3 3.7 3.5 1.1
1.0 N.A.
2.1 1.1 3.0
. 0.1 N.A.
0.4 0.19

90 AVIATION FACTS AND FIGUR ES, 1951
1" ~ pJ..f?---->-DoliiESTIC ScHEDULED AmLINES-0PERATORS, EQUI PMENT, A N D SPEED
1926 TO DATE
As of December Operators
31
---- - --- --1926 13 1927 18 1928 34 1929 38 1930 43
1931 39 1932 32 1933 25 1934 24 1935 26
1936 24 1937 22 1938 16 1939 18 1940 19
1941 19 1942 19 1943 19 1944 19 1945 20
1946 24 1947 28 1948 31 1949 37 1950 38
1951 38 1952 35 1953 32 lf)fi~ 32 1955 31 19fi6 :w
E E sti mate. N .A.- Not avail able. Sources : 20. as .
I ' Aircraft I Average
in Available Service Seats
-----N.A. N.A. N.A. N.A. 268 N .A. 442 N.A. 497 N.A.
490 N .A. 456 6.61 418 7.59
· 423 8.86 363 10 .33
280 10.67 291 12.52 260 13.91 276 14.66 369 16.54
370 17.54 186 17.91 204 18.34 288 19.05 421 19.68
6'14 25.25 810 29.93 87R 32 .37 913 35.03 960 37.47
981 39.55 1,078 42.71 1,13!) 46.07 1.1 7:) 50.06 1,212 51.63 ] ,347 52.43
Passenger Fatalities
Route Average p er :i\Iillion Mileage Speed, Passenger-
Operated M .P.H. l\Ii les Flo \\"It
---- - --- -N .A. N .A. N .A. N .A. N.A . N.A. N.A . N.A. N.A. N .A. N.A. N.A.
30,293 N.A. N. A:
30,857 N.A. N .A. 28,956 N.A. N .A .-28,283 N.A . N .A. 28,609 N.A . N.A . 29,190 N .A. N.A.
29,797 N.A . N .A. 32,006 N .A. N .A. 34,879 N.A. 4.5 36,654 N .A. 1.2 42,757 N .A. 3.0
45,163 N .A . 2.3 41,596 N .A . 3.7 42,537 N.A . 1 .3 47,384 155.6 2.2 48,516 155.4 2.2
53,981 160.2 1.2 62,215 168.2 3.2 6 ~ .702 171.9 1.3 7~,667 179.0 1.3 77,440 181.2 1.1
78,913 184 .6 1.3 77,894 190.8 OA 78,38-± I 97.8 0.6 78,2!)-± 205.8 0.1 7R '12 209.0 0.76 B-Lti-1-!) 21-1-.fi 0.6

AIRLI N E S A::-l"D TRA NSPORTATIOK 91
for a ir traffi c control and air naYigation . A Yiat ion F acili ties Planning G roup has >Yorked " ·ith and studied all segments of aYiation a11d the air traffi c con t rol problems for the past yea r . The establishment of an Airways Moderni za tion Board b~· Congress to continue the impr ovemen t of t he r\ir\\·a.••s S~·stem has been p roposed as a r esult of the year·'s study.
F'or eeasts of GG milli on passengers t raYeling the domest ic a ir \\·ays in l % 0. !J3 milli on b,,- 1965, a nd 118 million by 1970 f urther amplify the need fo r a ir traffic con t rol improYemen t. I n line with the growt h trends of "C. S. a irline t r axel, it has been est imated that airline t ravel will exceed r a ilroad t ravel fo r the fi r st t ime in 1957.
ilhi'i/ m·y A i1· 'l'ra nspo·r t S e1· v·icc
During t he yea r 1956, lVLATS tran:;por t, ai r r e::;eue, air evacuation, \\'Cath er , a nd other a ircraft logged 1.2 million hom s, an increase of some 20,000 hour:; over r eL:or cl-brcakin g 1955. Every hour of the clay, the lVI ili tary .A ir Tra nspor t Servi ce airlift ed about 100 passengers and patients an u nea rl;' 20 tons of ca rgo fo r all branches of the Depar t ment of D e£e11se.
I n August MATS p lanes p assed t he 100,000th ocean-crossing mark. Thi s mea nt that th e big- transports h<w e averaged an Atlantic or Pa· l· ifit: cross in g C\'c t·.v 48 minu tes ::;in ec t lt c creation of the Comm and in Ill id -1 948.
The largest U ni ted States military mer cy mission since the Berlin A ir lift-a mission designed to help p ro,·icle a home fo r t housands of Hunga ri an ,·idims of l'OII1llllllli st 1".'"1'11 1111 .)'- \\'as one of the g reat accomplisltJJil ' JJ1s uf till• 1\ lili bJJ'.' . ,\ir 'l'ran-;por t :-;l'l'\'i l'l' in ] !)5G.
(' f,·i! R escrl'l' : lir ]!' feel ((' J? .-171')
'fh e Civil Bl'sen ·e A ir l<'l eet is composl'Ll of on•r 300 long- range, fou rl' llg ine civil trausports com mi tted to fl y on 48 hours' notice um1er oper a-

..
92 AVIATION FAC'rS AND FIGURES, 1957
tional control of the Military Air Transport Service. It is operated , manned, maintained, and serviced by the civil airlines with their own people under their own management. 'fhe CRAF program saves hundreds of millions of dollars in tax monies whi ch otherwise would have to be spent for maintaining emergency airlift on a stand-by basis.
U. s. SCHEDULED AIRLINES-AIRCRAF T IN SERVICE BY MAKE AND MODEL
1941 TO DATE
Domestic International"
Aircraft Aircraft I Make& 1941 1953 1954 1955 1956 Make& 1941 1953 1954 1955 Model Model
1956
- ------------ ---- - - ----Bell
B47D, G .. 6 6 7 7
Boeing Boeing 247D 27 . . . . . . . . 307 3 . . .. . . . . 307 5 . . . . . . . . 314 8 . . .. . . . . 377 .. 16 11 10 9 377 . . 27 27 26 25
Convair Convair 240 .. 90 92 93 95 240 . . 14 10 5 5 ::!40 . . 103 121 123 123 440 19
Curtiss C-46 .. . . . . . . 3
Douglas Douglas DC-3, 3S ~so 331 ·_:?!)() I 301 321 DC-2 3 . . . . . . . . DC-4 .. 12fl 100 100 75 DC-3 45 24 2~ 18 15 DC-6,A,B . . 17fi tSfi 190, 218 DC-:4 .. 45 ::ll 28 40 DC-7 . . 10 (]] 77 99 DC-6,A,B . . 42 62 60 70
DC-7 .. . . . . 5 33
Lockheed Lockheed 2 .. . . . . . . 10 16 . . . . . . . . 10 3 .. . . . . . . 18 1:1 ]_]_ 11 9 10 18 . . 9 9 5 6 L49 . . 37 Cl7 44 fi() 149 . . . . . . 2 649 . . 5 3 . . . . L1049 749 . . (] ~ (]2 58 5R
I 1049 . . :11 ::!7 61 n
(Continued on next page)
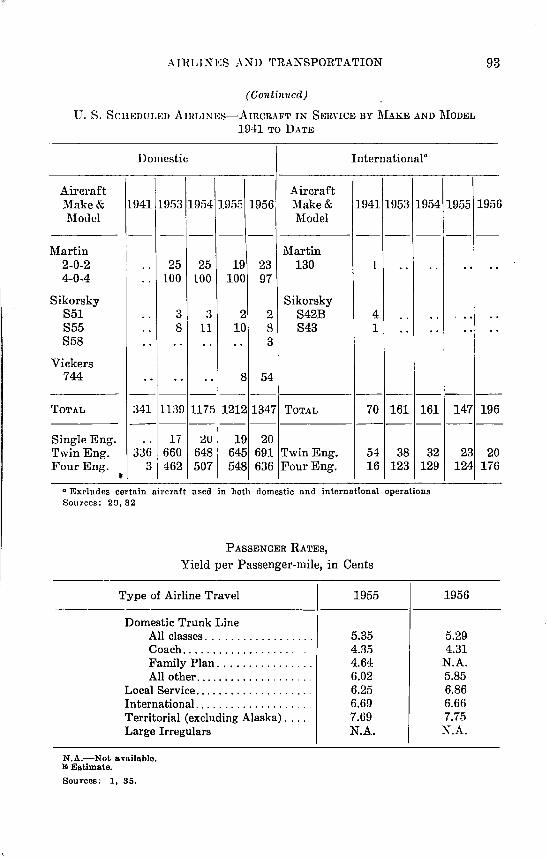
AIRLINES AND TRANSPORTATION 93
(Contimteit)
U. S. ScH.,;nuLED AmLIN.,;s-AIRCRAFT IN SERVICE BY MAKE AND 1\IODEL
1941 TO DATE
Domestic International a
Aircraft I Aircraft Make& 1941. 1953 1954 1955 1956 l\Iake & 1941 1953 1954 1955 l\{odel Model
-- -- -- -- -- -- -- --Martin Martin
2-0-2 ' . . 25 25 19 23 130 l . . . . .. 4-0-4 : too 100 100 97 ..
Sikorsky Sikorsky S51 . . 3 3 2 2 842B 4 . . . . .. 855 . . 8 11 10 8 843 1 . . . . .. 858 . . . . . . .. 3
Vickers 744 . . .. . . 8 54
-------- --------TOTAL 341 1139 1171'> 1212 1347 TOTAL 70 161 161 147
-------- --------8ingleEng. .. 17 <!U 19 20 Twin Eng. 336 660 648 645 691 Twin Eng. 54 38 32 Four Eng. 3 462 507 548 636 Four Eng. 16 123 129
t
a Excludes certain aircraft used in both domestic and international operations Sources: 29, 32
PASSENGER RATES,
Yield per Passenger-mile, in Cents
Type of Airline Travel
Domestic Trunk Line All classes ................. . Coach ..................... . Family Plan ............... . All other ................... .
Local Service ................... . International ................... . Territorial (excluding Alaska) ... . Large Irregulars
N.A.-Not available. EEstimate. Sources: 1, 35.
1955
5.35 4.35 4.64 6.02 6.25 6.69 7.69 N.A.
23 124
1956
5.29 4.31
N.A. 5.85 6.86 6.66 7.75 N.A.
1956
--
. .
. .
. .
--196 --
20 176

94 AVIATION fACTS AND·1:E':Y3-URES, 1957 ': .. /~ ... -~:f- .. "-·
u.s. INTERNATIONAL Scii:EDULED AIRLINEs-PASSENGER SERVICE
1929 TO DATE
Average
Passengers Passenger Revenue Revenue Passenger Average Carried" Seat- Passenger- Passenger Revenue Length
Year (Thou- Miles Miles Load per of Trip sands) Flown Flownb Factor Passenger (Miles)
(Millions) (Millions) (Percent) Mile (Cents)
--- -----1929 11.5 N.A. N.A. N.A. N.A. N.A. 1930 33.0 N.A. 18.6 N.A. N.A. 464 1931 59.2 N.A. 14.2 N.A. N.A. 238 1932 71.5 N.A. 20.8 N.A. N.A. 289 1933 74.4 N.A. 25.0 N.A. N.A. 315
1934 96.8 N.A. 36.8 N.A. N.A. 351. 1935 111.3 N.A. 46.0 N.A. N.A. 381 1936 87.7 N.A. 41.8 N.A. N.A. 414 1937 112.3 N.A. 53.7 N.A. N.A. 416 1938 N.A. 116.1 53.2 45.83 8.33 487
1939 136.1 134.4 71.8 53.46 8.57 557 1940 170.2 175.5 99.8 56.88 8.83 614 1941 235.8 248.3 162.8 65.57 8.61 713 1942 276.2 313.1 237.0 75.68 8.85 880 1943 292.9 307.5 244.2 79.42 7.92 874
1944 356.7 391.3 310.6 79.37 7.82 910 1945 493.5 583.4 448.0 76.78 8.67 942 1946 1,066.4 1,553.7 1,100.7 70.85 8.31 1,057 1947 1,359.7 2,924.3 1,810.0 61.90 7.77 1,332 1948 1,372.9 3,292.3 1,889.0 57.38 8.01 1,376
1949 1,520.1 3,624.~.\ 2,054.0 56.67 7.72 1,351 1950 1,675.5 3,695.4 2,206.4 59.71 7.28 1,316 1951 2,041.8 4,327.7 2,599.8 60.08 7.10 1,273 1952 2,365.5 4,850.9 3,021.0 "62.28 7.04 1,277 1953 2,700.4 5,472.5 3,385.6 61.87 .. 6.87 1,254 1954 2,875.0 6,288.0 3,750.0 59.63 6.79 1,314 1955 3,415.0 7,029.0 4,419.0 62.87 6.69 1,294 1956 3,947.0 8,308.3 5,226.2 62.90 6.70 N.A.
E Estimate. N .A.-Not available. a 1929·1946: Total passengers; 1947 to dote: Revenue passengers or. • D 1980-1987: Total passenger-miles; 1988 to date: Revenue passenger-miles.
Sources: 29, 85.

AIRLI:NES AND TRANSPORTATION
TRANSPORTATION ACCIDENT DEATH RATES 1955
Passenger Kind of Transportation Miles Deaths
(Millions)
Passenger Deaths in-passenger automobiles and taxis ...... . 900,000 24,000 busses .............................. 52,000 100 railroad passenger trains .............. 28,550 19 scheduled air transport planes ......... 20,550 156
All Deaths connected with the operation of passenger automobiles and taxis ...... 900,000 33,700 busses .............................. 52,000 550 railroad passenger trains .............. 28,550 1,065 scheduled air transport planes ......... 20,550 181
Source: 73.
95
Death Rate per
100,000,000 Passenger
Miles
2.7 0.19
..
·a o1 . ... '
0.76
3.7 1.06 3.6 0.9
TRANS-ATLANTIC PASSENGER TRAVEL BY AIR AND SEA, 1950 TO DATE
By AIR (Regular Scheduled) I Year Ending By SEA,
June 30 TOTAL u.s. Other PASSENGERS
PASSENGERS Carriers
Westbound 1950 161,091 106,908 54,183 427,113 1951 180,465 ' 107,195 73,270 401,243 1952 194,914 114,659 80,255 458,427 1953 251,303 142,153 109,150 397~018 1954 309,648 177,124 132,524 419,559 1955 370,026 231,861 138,165 452,520 1956 481,618 307,280 174,338 479,401 -
Eastbound 1950 135,804 88,020 47,784 296,996 1951 137,733 82,990 54,743 262,378 1952 177,432 1(\0,768 76,664 308,654 1953 245,718 143,928 101,790 354,494 1954 274,001 155,755 118.246 379,119 1955 338,163 206,111 132,052 377,932 1956 411,454 243,280 168,174 385,339
Source: 60

96 AVIATION FACTS AND FIGURES, 1957
AMERICA'S TRANSPORTATION NETWORK
(Thousands of Miles)
Medium of Transportation
Airways - Domestic .............•..•.......•.. Railroads- Road Owned ...................... . Total Rural Roads .....•.......................
Surfaced .....•............................ Federal-Aid Primary Highways ................. . Petroleum Pipelines ......••....•.•............. Waterways and Great Lakes ................... .
Sources: 1, 11, 26, 27, 29, 36, 59.
1930
30 249
3,009 649 193
89 28
1955
79 221
3,045 1,942
234 140
23
ESTIMATED INTERCITY PASSENGER TRAFFIC, BY TYPE, 1916 TO DATE
Domestic Inland Year TOTAL Air Railroadsm Highways
Carriers Waterways
Billions of Passenger-Miles
1916 36.0 b 35.2 b .8 1939 270.7 .7 22.7 245.9 1.5 1941 310.6 1.4 29.4 278.0 1.8 1944 311.5 2.2 95.7 211.7 1.9 1947 424.5 6.1 46.0 370.9 1.8 1951 539.5 11.7 35.3 491.1 1.4 1954 609.9 17.9 29.4 560.9 1.7 1955 653.4 19.8 28.5 603.4 1.7E 1956 679.8E \\22.4 28.2 627.5E 1.7E
Percent 1916 100.0 b 97.8 b 2.2 1939 100.0 .3 8.4 " 90.8 .5 1941 100.0 .4 9.5 89.5 .6 1944 100.0 .7 30.7 68.0 .6 1947 100.0 1.5 10.8 87.3 .4 1951 100.0 2.2 6.5 91.0 .3 1954 100.0 2.9 4.8 92.0 .3 1955 100.0 3.0 4.4 fl".3 .3 1956 100.0 3.3 4.1 ~}~ .3 .3
• Includes commutation and electrifted divisions of steam railway companies, but excludes electric railwa)'ll.
& Negligible. Sources: 11, 26, 29, 56.
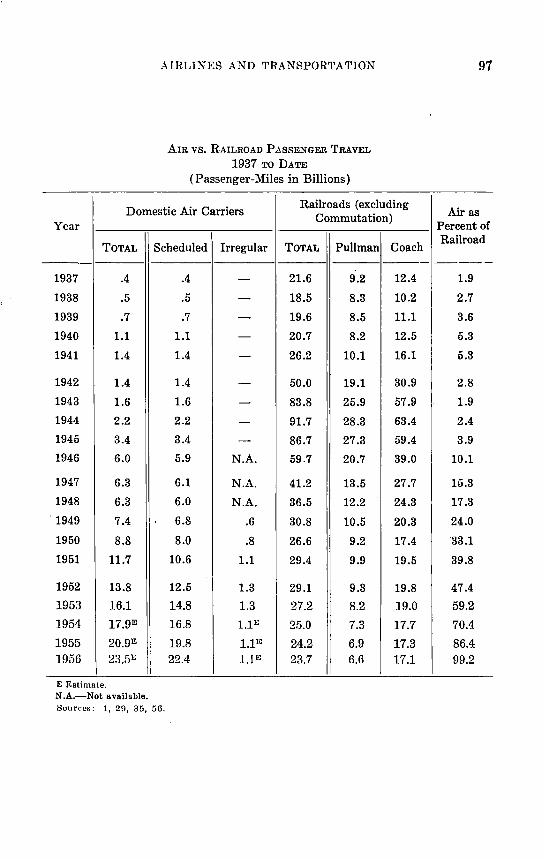
AIRLINES AND TRANSPORTATION
AIR VS. RAILROAD PASSENGER TRAVEL
1937 TO DATE (Passenger-Miles in Billions)
Domestic Air Carriers Railroads (excluding
Year
TOTAL Scheduled
1937 .4
1938 .5
1939 .7
1940 1.1
1941 1.4
1942 1.4
1943 1.6
1944 2.2
1945 3.4
1946 6.0
1947 6.3
1948 6.3
"1949 7.4
1950 8.8
1951 11.7
1952 13.8
1953 16.1
1954 17.9E
1955 20.9E 1956 23.5E
E Estimate. N.A.-Not available. Sources: 1, 29, 35, 56.
.4
.5
.7
1.1
1.4
1.4
1.6
2.2
3.4
5.9
6.1
6.0
6.8
8.0
10.6
12.5
14.8
16.8
19.8 22.4
Commutation)
Irregular TOTAL Pullman Coach
- 21.6 9.2 12.4
- 18.5 8.3 10.2
- 19.6 8.5 11.1
- 20.7 8.2 12.5
- 26.2 10.1 16.1
- 50.0 19.1 30.9
- 83.8 25.9 57.9
- 91.7 28.3 63.4
- 86.7 27.3 59.4
N.A. 59.7 20.7 39.0
N.A. 41.2 13.5 27.7
N.A. 36.5 12.2 24.3
.6 30.8 10.5 20.3
.8 26.6 9.2 17.4
1.1 29.4 9.9 19.5
1.3 29.1 9.3 19.8
1.3 27.2 8.2 19.0
1.1E 25.0 7.3 17.7
1.1E 24.2 6.9 17.3 1.1E 23.7 6.6 17.1
97
Air as Percent of Railroad
-----1.9
2.7
3.6
5.3
5.8
2.8
1.9
2.4
3.9
10.1
15.3
17.3
24.0
"33.1
39.8
47.4
59.2
70.4
86.4 99.2

98 AVIATION FACTS AND FIGURES, 1957
Sullll\IARY OF U. S. Am 'l'HA~'FIC TRENDS, 1948 TO DATE -
Year Domestic Local Inter- Te1-ri-Ending TOTAL" Trunk Service national torinl ami Other June 30 Lines Carriers Carriers Alaska Carriers
Revenue Passenger-Miles (Millions)
I 1948 7,913 5,931 64 1,868 N.A. .... 1953 18,465 13,398 371 3,261 113 1,322 1954 20,326 15,128 412 3,523 115 1,148 1955 23,835 17,770 500 4,108 120 1,337 1956 27,306 20,460 585 4,808 122 1,331
Cargo Ton-Miles (Millions)
1948 I 137 89 • 46 N.A. . ... .. IQ53 452 182 2 89 3 176 1954 435 190 2 97 3 143 1955 464 219 3 101 4 137 1956 584 248 3 115 3 215
Mail Ton-Miles (Millions)
1948 50 36 • 14 N.A. .... 19!l3 9:} 69 1 23 2 .... 1!lll1 107 76 1 29 1 ••• 0
1955 131 83 1 46 1 .... 1956 147 89 1 55 1 1
N.A.-Not available. • "Total" may exceed the listed components because subtotals for "Not Available" items may
be included. • Less tban one-half million.
Source: 34.
Year
1939 1944 1949 1953 1954E 1955E
EEstimate.
Sources: 1, 57.
AvERAGE PAf5SENGER LoADS, 1939 TO DATE
(Passenger-Miles per Vehicle-Mile)
RR Sleeping AIIRR Class I
Coaches & Parlor Passenger Int1:1r-City Cars Cars Busses
17.0 9.3 13.4 16.4 41.0 20.3 31.9 24.9 23.6 11.0 18.1 18.4 23.7 10.1 17.7 18.: 23.3 9.7 17.5 18.1 23.6 9.9 18.0 18.3
Scheduled Domestic Airliners
7.9 15.2 19.2 29.2 31.3 32.7

-
Year
1926 1937 1947 1952 1953 1954 1955 1956
.-\ JRLTNE S AXD TRANSPORTATION
AVERAGE REVENUE PER PASSENGER - MILE, 1926 TO DATE
(Cents)
AIRLINES RAILROAD
Domestic Coach Pullman Domestic Non- (Excluding
Scheduled Scheduled Commuter) (Total)
12.0 - 3.35 N.A.
5 .6 - 1.80 3.08 5.1 - 2.02 3.53 5.55 3.20 2.53 4.60 5.45 3.20 2.53 4.68 5.39 3.20E 2.50 4.66 5.35 8 3.20E 2.47 4.62 5.30E 3.208 2.56 4.77
N.A .-Not nvnilnble. E Estimate. S ources : 1 , a, 35 , 5 7 , 72.
99
INTER-
CITY
Bus
-2 .96 1.73 1.70 2.02 2.06 2.06 2.07 2.128

100
I,,.; 1 -
/-· J
AVIATION FACTS AND FIGURES, 1957 (I
Tn'E TEN LEADING PASSENGER TRANSPORT COMPANIES (Millions of Revenue Passenger Miles4 )
1956 1955 American Airlines ............ 4,793 United Air Lines ............. 4,274 Eastern Air Lines . . . . . . . . . . . . 3, 788 Pennsylvania Railroad . . . . . . . . 3,305 Trans World Airlines . . . . . . . . . 3,261 New York Central System ..... 2,695 Atchison, Topeka & Santa Fe
American Airlines . . . . . . . . . . . . 4,266 United Air Lines ............• 3,754 Eastern Air Lines . . . . . . . . . . . . 3,342 Pennsylvania Railroad . . . . . . . . 3,324 New York Central System ..... 2,897 Trans World Airlines . . . . . . . . . 2,866 Atchison, Topeka & Santa Fe
Railway System . . . . . . . . . . . . 1,981 Union Pacific Railroad Com
Railway System . . . . . . . . . . . . 1,943 Union Pacific Railroad Com-
pany ...................... 1,364 pany ...................••. 1,437 New York, New Haven & Hart-
ford Railroad Company ..... 1,250 Southern Pacific Company . . .. . 1,239
Southern Pacific Company . . . . . 1,295 New York, New Haven & Hart-
ford Railroad Company . . . . . 1,208
4 Excludes commuters and multiple ride passengers. Note: Data do not include foreign operations of the airlines.
Sources: 35, 56.
I '":
, 1 ~-- EMPLOYMENT, WAGES, AND AVERAGE ANNUAL EARNINGS IN THE TRANSPORTATION INDUSTRY, 1955
Air Water, Trans- High- Pipe-
ALL porta- way line, ALL TRANs- tion Rail- Trans- and
INDUSTRY PORTA- (Com- roads porta- Other TION mon tion Trans-
'•\ Car- porta-rier) tion
Full-Time Equivalent "
Employees (Thous-ands) ............... 54,917 2,601 120 1;196 951 334
Wages and Salaries (Million Dollars) ..... $210,354 $12,368 $633 $5,628 $4,446 $1,661
Average Annual Earn-ings per Full Time Employee .•.••.•••• $3,830 $4,755 $5,275 $4,7(' $4,675 $4,973
Source: 14

'fhe export of civil aviation products has a .·ignificance beyond its dollar value. Aviation products become an integral part of the importing nation's economy; flag carriers of many foreign countries are an arm of national policy, and are operated by the government. The ties formed among nations are based on the hard r ealities of export-import r elations, and America's position of leadership in the free world is partially due to the superiority of its aviation products. This is apart from the key role that military aircraft play in the defense programs.
During 1956, the United States exported more than $1 billion in aviation products, the highest peacetime year in hi tory. Total exports r eached $1,059,300,000, an increase of about 45 per cent over 1955. This high degree of acceptability is underlined by the fact that the lead ing overseas market for this equipmen t \ras the Briti h Commonwra lth whic·h is th r larg-Pst procln re r of airnaft outside the U nitrd Statrs and Rnssin . 'l' his B1·it ish area in 1!):16 importrcl more th an $5-I: milli on \rorl"ll of ei,·il airl'l'aft and eng ine'.· of lr.-s than -1-00 horsr power. 'l'his amounted to almost 26 per ce nt of this clas. of expo rts.
The remarkable gain in exports accounts fo r an increasingly impor-
101

102 AVIATION FACTS AND FIGURES, 1957
_Iii\ --,----
\!.!1
tant part of over-all production in this country. It represents an advance from 8.6 per cent of gross aviation production value in 1955 to 11 per cent in 1956. In terms of manpower it means the employment of 88,000 workers for export production compared with 63,000 employed in 1955.
Dollar availability is still the limiting factor in exports. However, this si~uat~o.t;t is showing great improvement as longer term financing has become availabie through private and government sources. Financing institutions have become more liberal regarding aircraft loans. The size of the financing has, in some cases, put the risk involved out of proportion. The risk is actually small when it is considered in the light of earnings produced by the aircraft. New export financing sources have been found and the prospects are that the problem of dollar availability will become less critical.
One reason for the steadily advancing leadership of U. S. aviation products is the domestic demand. This domestic demand assures a tremendous market and a valuable proving ground for the products. It is
UNITED KINGDOM: AERONAUTIC EXPORTS, 1924 TO DATE
" Million Annual Million Annual
AvP.Tl!JrP. Dollar!': " Dollllr!':
1924-1928 $ 5.6 1952 121.6 1929-1933 7.1 1953 182.0 1934-1938 16.3 1954 1 !lfUl
1939-1943 33.9 1955 185.3 1944-194~ !l7.7 1956 292.6 1949-1951 112.3
Source: 51

n v (),~/
AIRCRAFT EXPORTS~~ r; 'l (/-~
UNITI..:O KINGDOM: ORDERS FOR GAS TURBINE AIRLINERS uP TO MARcH 26, 1957
(Number of Units) v For For
Name Total British Export Use
Comet 1 & 1a (all delivered) ... 19 10 9 Comet II .................... 18 18 .. Comet III I I I I I I I I I I I I I I I I I II 1 1 .. Comet IV and IVA .......... 33 19 14 Viscount 700 ................. 265 47 218 Viscount 800 I • I I I I I I I I I I I I I I I 99 41 58 Vanguard .................... 40 20 20 Britannia 100 ..... •.• ......... 15 15 .. Britannia 250 ......... •.• ..... 16 16 . . Britannia 300 ................ 6 1 5 Britannia 310 I I I I I I I I I I I I I I I I 28 20 8
Total 502 179 323
Source: 51
UNITED KDlGDOM: EMPLOYMENT AND PRODUCTION IN THE AIRCRAF'I' 1\fANl;FACTrRT-:-:r. TNnTTRTRY
Year.
1918 1935 1939 1944 1948 1950 Hlfi4 Hln5 1056
N.A.-Not available. E Estimate by official British sources. a As of end of November. Sources: 51, 52
Employment
347,112 35,890
355,000 1,821,000
134,219 153,600 238,200" 258,300" 265,300"
Value of Production
(Million Dollars)
N.A. 69.1
N.A. N.A. 455.2 423.1 fi24.0E N.A. N.A.
103
possible to offer for export highly advanced equipment that has been fully proven in serviee in the United States far beyond the capabilities of other producers whose home markets are far more restricted. For example, the turbojet engine which will power two of the jet transports now being built in the U. S. will have accumulated 4,500,000 operational

104 ·I .r AVIATION FACTS AND FIGURES, 1951 2 CANADAO .Ammw>r AND PARTS INDUSTRY, 1935 TO DATE
/ > Gross Average
Number Number Selling Value Year of of of Products
Plants Employees (Millions of U. S. Dollars)
1935 7 294 $ .9 1936 7 416 1.3 1937 8 606 1.7 1938 13 1,617 6.9 1939 13 3,596 12.6
1940 19 10,348 24.2 1941 24 26,661 74.0 1942 42 44,886 137.8 1943 45 69,529 223.7 1944 45 79,572 388.2 ..
1945 38 37,812 253.3 1946 16 11,405 36.2 1947 12 9,374 44.3 1948 11 8,049 45.6 1949 14 10,695 59.7
1950 15 10,549 50.2 1951 23 19,198 111.3 1953 43 38,048 398.7 1954 47 35,089 346.0 1955 51 32,751 353.2
Sources: 10,45
hours before it starts commercial service, insuring the same degree of safety and reliability that characterize U. S. piston-engined planes.
One of the notable increases in exports was in new commercial transport aircraft weighing more than 3,000 pounds. This category increased from 95 aircraft exported in 1955 to 151 i~ 1956, a gain of 59 per cent in number. The largest gain in the category was in the large transports with an airframe weight of 30,000 pounds and over. This category showed an increase from 51 planes in 1955 to 85 in 1956. The increase in value of aircraft in the 3,000 pounds-and-over-class was from about $81 million to nearly $133 million, a 64 prr cent gn:n in value>.
Utility, personal and liaison aircraft shipments c•co,atinurd to advance. This section of civil aviation accounted for shipments of 9(:i6 aircraft
" valued at $11 million with the greatest number shipped capable of carrying four or more persons.

AIRCRAF'T EXPORTS 105
U. S. military aircraft are flying today with the insignia of most nations of the f ree world emblazoned on the fuselage. The nations forming the North Atlantic Treaty Organization have based their air forces on American aircraft. It is not possible to break clown by countries and models the aircraft exports made through the Mutual Security Program, but these account for the bulk of U. S. exports. During 1956, 2,766 aircraft were shipped, nearly twice the total shipments for 1955. Total shipments under the :Mutual Security Program since 1950 amount to 10,644 military aircraft.
- PRODUCTION EXPORTS
UNITED KINGDOM
CANADA
1 __ .. _ ... _ ... !35
~...p;m m l
2 3 4 5 6 7 8 9 10 (IN MILLION DOLLARS)
U.S. TOTAL EXPORTS .AN D EXPORTS OF AERON AU TIC PRODUCTS
1912 TO D ATE
Year
(Millions of Dollars)
Total United States Merchandise
Total Aeronautic Products
Percent of total
-·------- ---------- ---------- --------1912 1915-1918 1921 1929 1939
1946 1952 1953 1954 1955 1956
n Less tha n .05 percent. Sources : 23,24, 25, 26 , 27
$ 2,170.3 22,176.'1
4,378.9 5,157.1 3,123.3
9,500.2 15,025.7 15,649.0 14,948.1 15,418.5 18,839.7
$ .1 31.5
.5 9.1
117.8
115 .3 603 .2 880.6 618.9 727.5
1,0fi9 .3
.14
.18 3.R
1.2 4.0 5.6 4.1 4.7 5.6

MuTUAL SECURITY PROGRA.M, SHIPMENT OF MILITARY AIRCRAFT 1950 TO DATE
Year Ending September 30
1950 1951 1952 1953 1954 1955 1956
TOTAL4
4 Oct. 6, 1949 to Dec. 31, 1956. Sources: 41, 42
Total Air Force
251} 850 818}
1,317 1,124 2,689 2,274 1,170 923 1,362 1,138 2,766 2,680
10,664 9,204
EXPORTS OF CIVIL AIRCRAFT, 1948 TO DATE
NEW PASSENGER TRANSPORTS
Navy
283
193 415 247 224 86
1,460
TOTAL 3,000-14,999 lbs 15,000-29,999 lbs 30,000 lbs & over airframe weight airframe weight airframe weight
-Year
Num- Value Num- Value Num- Value Num- Value her (Millions) her (Millions) her (Millions) her (Millions)
--1948 91 $37.4 34 $2.4 14 $4.2 43 $30.8 1949 51 22.2 16 1.3 25 7.6 10 13.4 1950 48 40.4 4 .4 15 6.6 29 33.4 1951 26 13.2 13 1.1 1 a 12 12.1 1952 25 18.2 9 .6 1 .6 15 17.0 1953 87 79.2 17 1.3 13 7.5 57 87.0 1954 110 93.0 29 2.0 7 4.0 74 70.4 1955 95 81.2 39 2.5 5 2.4 51 76.3 1956 151 132.9 6! 4.7 2 .8 85 124.4
NEW UTILITY, PERSONAL AND LIAISON PLANES '\
TOTAL 3-Places or less 4-Places and over
Year Value Value Value
Number (Millions) Number (Millions) Number (Millions)
1948 935 $4.2 552 $1.5 383 $2.7 1949 510 2.8 235 .7 275 2.1 1950 408 2.2 173 .5 235 1.7 1951 540 3.7 237 1.0 303 2.7 1952 815 5.6 551 3.1 264 2.5 1953 776 5.4 370 1.5 406 3.9 1954 529 4.5 223 1.1 306 3.4 1955 749 7.4 296 1.9 453 5.5 1956 966 11.0 340 2.5 626 8.5
(Continued on next page)

AIRCRAFT EXPORTS 107
(Continued from previous page)
OTHER
Rotary Wing Aircraft Used Aircraft Oth('r
Year Value Value Number Value Number
(Millions) Number
(Millions) (Million~·)
1948 47 1949 31 1950 38 1951 28 1952 37 1953 98 1954 74 1955 66 1956 55
a Less than $500,000.
Source: 20
$1.9 1.2
• 9 . 9
1.4 4.9 4.0 4.2 3.7
202 $ .7 . . . . . ..... 252 .6 . . . .. ..... 262 .9 ..... . .... 300 .9 . . . .. ..... 303 1.5 . . . . . ..... 416 1.5 . .. . . ..... 340 1.2 . . . . . ..... 800 37.1 4 .01 534 22.7 1 .002
U.S. EXPORTS OF AIRCRAFT ENGINES" FOR CIVILIAN AIRCRAFT, 1948 TO DATE
Year Number Value (Thousands of dollars)
1948b 660 $326 1949b 107 112 1950 247 285 1951 304 509 1952 551 941 1953 347 708 1954 728 1,516 HI 55 R!l7 2.016 1956 1,371 3,529
a Under 400 b.p.; data for exports of engines of 400 h.p. and over withheld for "security reasons.••
& Under 250 hp. Source: 20

t
t
PUBLIC RELATIONS OFFICIALS OF MEMBER COMPANIES OF
THE AIRCRAFT INDUSTRIES ASSOCIATION
DIVISION A
Aero Design & Engineering Co. Hal Weatherly P. 0. Box 118 Bethany, Oklahoma
.A:erojet-General Corp. George Pelletier 332 Irwindale Ave. Azusa, California
Aeronca Manufacturing Corp. John P. Lawler, President Middletown, Ohio
Aircooled Motors, Inc. C. F. B. Roth, President Liverpool Rd. Syracuse 8, New York
Allison Division, General Motors Corp. Roger C. Fleming Speedway, Indianapolis 6, Ind.
Avco Manufacturing Corp. James J. Cassidy 420 Lexington Ave. New York 17, New York
Bridgeport-Lycoming Div. Paul Deegan Stratford, Connecticut
Crosley Division John Metcalfe Cincinnati, Ohio
Bell Helicopter Corporation /~ James C. Fuller
P. 0. Box 482 Ft. Worth, Texas
Boeing Airplane Company Harold Mansfield Box 3107 Seattle 14, Washington
Wichita Division J. 0. Mitchell Wichita 1, Kansas
Cessna Aircraft Company W. G. Robinson 5800 Franklin Rd. Wichita 14, Kansas
Chance Vought Aircraft, Inc. Keith Baker P. 0. Box 5907 Dallas Texas
Continental Motors Corp. Henry Hopkins 1504 Garden Building Detroit, Michigan
Convair, a division of General Dynamics Corp.
Ned Root 3165 Pacific Highway San Diego 12, California
Research & Advance Developments Div.
Fort Worth Division Lloyd L. Turner Grant's Lane Fort Worth, Texas Robert MeLeod
Everett, Massaehusetts
Beech Aircraft Corp. Phil McKnight E. Central Ave. Wic-hita 1, Kam;aJ-;
Brll Air<'raft Corporation Franc-is W. Dunn Assistant to the PrPsidPnt P. 0. Box 1 Buffalo 5, New York
Pomona Division J. M. Glass P. 0. Box 1011 Pomona, California
Curtiss-Wrig-ht ('. ,·poration Ronald S. Gall Wood-Ridg-e, NPw ,Jprsey
108
Dnmnn Helicopters, Tnc. Walter J. Hatdll'r Danbury, Connecticut

PUBLIC RELATIONS OFFICIALS 109
Douglas Airl'raft Co., Ine. A. ~I. HodJ)en, Vil'e President 3000 O!'t'Hll Park Blvd. Santa l\Ionil'a, California
Santa l\Ionil'a Division Larry Vitsky 3000 Ocean Park Blvd. Santa Monica, California
Long Beach Division Wilson Silsby 3855 Lakewood Blvd. Long Beach, California
EJ Segundo Division Robert H. Wilson 827 Lapham St. El Segundo, California
Tulsa Division Dave Wyatt 2000 North Memorial Drive Tulsa, Oklahoma
Fair~h!Id Engine & Airplane Corp. Wilham G. Key, Director Public Relations
L
Airplane Division Joseph Crockett Hagerstown, Maryland
Engine Division Lou Davis Deerpark, L. I., New York
Guided Missiles Division Gene Henkel vVyandanch, L. 1., New York
Stratos Division Gene Henkel Bayshore, L. I., New York
Genera) Electric Company Tom Irvine, News Bureau Schenectady 5, New York
Aircraft Gas Turbine Division Production Engine Dep't. Gene Bradley Evandale, Ohio
Aircraft Accessory Turbine Dep't. Paul Schratter Lynn, Massachusetts
Small Aircraft Engine Dep't. Ralph Hunwn Lynn, Massachusetts
Defense Electronics Di\·ision Missile & Eledrouic Systems
Dep't. J. C. Hoffman Philadelphia, Pn.
Heavy Military Electronic Equip-ment Dep't.
B. A. Mangum Syracuse, New York
Light Military Electronic Equipment Dep't.
Harvey Johnson Utica. New York
Goodyear Aircraft Corp. L. E. Judd 1210 Massilon Road Akron 15, Ohio
G 1·umman Aircraft Engineering Corp. John B. Rettaliata Bethpage, Long Island, N. Y.
Gyrodyne Co. of America, Inc. Peter J. Papadakos, President St. James Long Island, New York
Hiller Helicopters Ralph W. Kummer 1350 ·Willow Rd. Palo Alto, California
Hughes Aircraft Company C. E. Blandford Culver City, California
Ingersoll Kalamazoo Div., Borg-Warner Corp.
R. F. Schutz, Vice President 1810 N. Pitcher Street Kalamazoo, Michigan
!c-
The Kaman Aircraft Corp. Charles Kirchner Bloomfield, Connecticut
/~
Kellett Aircraft Corp. Don Duffin 160 N. 15th Street Philadelphia 2, Pennsylvania
Lockheed Aircraft Corp. John Canaday, Vice President Burbank, California
Georgia Division Henry Chappellet Marietta, Georgia

llO AVIATION FACTS. AND FIGURES, 1957
Public Relations Officials (Continued) California Division W. R. Wilson P. 0. Box 551 Burbank, California
1\iarquardt Aireraft Co. Jack G. Anderson 16555 Saticoy Street South Annex, Van Nuys, Calif.
The Martin Co. Joe M. Rowland, Corporate
Director Baltimore Division F. N. Nutt Baltimore 3, Maryland
Denver Division Don Herron Denver, Colo.
Orlando Division E. L. Coster Orlando, Florida
McDonnell Aircraft Corp. W. B. Haylon P. 0. Box 516 St. Louis 3, Missouri
North American Aviation, Inc. E. J. Ryan Los Angeles Int'l. Airport Los Angeles 45, California
Columbus Division J. A. Snodgrass Columbus, Ohio
Rocketdyne Division D. B. Juenke Canoga Park. Calif.
:Missile Development Division G. H. Hall Downey, Calif.
Autonetics Division Kerme Anderson Bellflower, Calif.
Xorthrop Aircraft, Ine. AI Cline Northrop FiP!d Hawthorne, California
Radioplane Co. Todd Fast 7901 Woodley Ave Van Nuys, California
Piasecki Air<"raft Corp. 1- 1. A. Ceres Island Road International Airport Philadelphia 42, Pennsylvania
Piper Aircraft Corp. Howard Piper, Vice Prcsid<>nt Lock Haven, Pennsylvania
R<>aetion 1\iotors, Inc. Richard Whitcomb Denville, New Jersey
Republic Aviation Corp. Leon Schloss, Manager Puhlic
Relations ' Farmingdale, L. I. New York
The Ryan Aeronautical Co. William Wagner, Director Pu hli1·
Relations Lindbergh Field · San Diego, California
Stroukoff Aircraft Corp. C. \Y. O'Connor Scotch Road W. Trenton, Kew Jersey
Taylorcraft, Inc. . Clifford Ball Conway-Pittsburgh Airport Conway, Pennsylvnnia
Temco Aircraft Corp. Sydney Carter P. 0. Box 6191 Dallas, Texas
United Aircraft Corp. Paul Fisher, Direetor, Public ,....
Relations E. Hartford, Connecticut
Pratt & Whitney Division John F. Smith East Hartford, ConnP<·ti ··;1t
Hamilton Stan!lar1l I>ivi,ioa Russell Trotman Windsor Locks, Co:mP.ti u t
Sikorsky Division William Kil••atriek Bridgeport Comw<•ti1·ut
Vertol Aircraft Corp. :E. J. Doherty Assistant to the President Morton, Pennsylvania
PUBLIC RELATIONS OFFICIALS 111
\Vestinghouse l~lt>di'ie Corp. A,·iation Gas Turbim• Di\"ision J. G. Grat>f, Manager P. 0. Box 288 Kansas City, l\Io.
DIVISION B
Aero Supply l\Ifg. Co., Ine. John L. Wilson Director of Industrial Relations 611 W. l\Iain St. Corry, Pennsylvania
Aerodex, Inc. Richard S. Skidmore Public Relations Mana"'er P .. 0 .. Box 123, Int'l. .Xirport l\Iwnu 48, Florida
Aluminum Co. of America John St. Peter 1200 Ring Bldg. Washington 6, D. C.
Anwril'an Airmotive Corp. Charlt>s E. Lewis, President P .. 0 .. Box 187, Int'l Airport, BR, J\Iwnu 48, Florida
Arcturus l\Ifg. Corp. Paul Anderson 4301 Lincoln Blvd. Venice, California
The B. G. Corporation Robert Brattvet Director of Sales and Engineering 321 Broad Ave. · Ridgefield, New Jersey
Franklin Balmar Corp. J. J. Kirchoff, Genernl Manage1· 3500 Clipper Rd. Baltimore 11, Maryland
Bendix Aviation Corp. W. A. Mara D~rector of Advertising F1she~· Building Detrmt 2, Michigan
Champion Spark Plug Co. J · R. McGeorge Toledo I, Ohio
Chandlt>r-gvans Div. Pratt & Whitney Co., I II<'. J. E. Lowes Charte1· Oak Blvd. W. Hartford. Connecticut
The Cleveland Pneumatic Tool Co. I-Iarrv Kendall 3781 ·E. 11th Street Cleveland 5, Ohio
The Connecticut Hard Rubber Co. James F. Cantwell 407 East Street New Haven, Connecticut
Cook gJeetric Company Harry Thornton 2700 Southport Ave. Chicago 14, Ill.
The Dow Chemical Co. AI Smith, .Jr. ~Iidland, l\Iichigan
Dumont Aircraft Fitting Co. M. P. Balwan 1:~56 Orizaba Ave. Long Beach, California
Fletcher Aviation Corp. L. C. Launer Executive Vice President Fletcher Airport Rm;pmead, Califomia
Flrxonits Corporation D. Ghent 1315 S. Third Ave. :Maywood, Illinois
Flight Rt>fueling, Inc. H. A. May Friendship Int'l. Airport P. 0. Box 1701 Baltimore 3, Maryland
The Garrett Corporation Ted Burke 9851 Sepulveda Blvd. Los Angeles 45, California
GenPral Laboratory Associatrs, Inc. L. A. De Meliier, Advertising 17 E. Railroad St. Norwich, N. Y.
Tlw B. F. Goodrich Co. Henry Maxson Akron, Ohio
Harvt>y l\Iarhine Co., Inr. Gene Alfred 19200 s. \V l'Stl'rn A \'l'. Torrence, California
Hoffrunn LnboratoriPs, Inc. John O'BriPn 1625 Eve Strept, N.W. Washington 6, D. C.

112 AVIATION FACTS AND FIGURES, 1957
Public Relations Officials (Continued) Hydro-Aire, Inc.
S. Scott 3000 Winona Ave. Burbank, California
,J aek & Heintz, Inc. John Whiteman Cleveland 1, Ohio
Kaiser Aircraft & Electronics Corp. H. W. Cloke Cafritz Building Washington, D. C.
Kollsman Instrument Corp. Dr. Milia Alihan 80-08 Forty-fifth Ave. Elmhurst, New York
Land-Air, Inc. M. Breit 7 444 Wilson Ave. Chicago 31, Illinois
Lear, Inc. Norman Warren, Vice President 3171 S. Bundy Dr. Santa Monica, California
Longren Aircraft Co. Hampden Wentworth, V. P. 2576 W. Carson St. Torrence, California
Luria Engineering Co. Charles Ketcham, V. P. 1010 Vermont Ave. Washington, D. C.
The MB Manufacturing Co., Inc. J. Wirtz 1060 State Street New Haven 11, Conn. '\
Mac Whyte Company Forest Nelson 2904 14th Ave. Kenosha, Wise.
Minneapolis·Honeywell Regulator Company
J. H. Porterfield 2747 4th Ave. S. Minneapolis 8, Minnesota
National Tapered Wings, Inc. E. E. Baker, Vice President
General Manager 3001 E. lith Street Los Angeles 23, California
and
The New Y01·k Air Brake Company H. R. Doughty 230 Park A venue New York 17, New York
Pacific Airmotive Corp. R. Backman, Vice President-Sales 2940 Hollywood Way Burbank, California
Parker Aircraft Company Don Ziegler 5827 W. Century Blvd. Los Angeles 43, California
Radio Corporation of America J. Haber Building 2-7 Camden 2, New Jersey
Reynolds Metals Co. Keen Johnson 2500 S. 3rd St., P. 0. 1800 Louisville 1, Ky. '
Rheem Manufacturing Co. Ken Snelling 11711 S. Woodruff Ave. Downey, California '
Robertshaw-Fulton Controls Robert Sweeney Santa Ana Freeway at Euclid Anheim, California '
Rohr Aircraft Corp. E. T. Austin Chula Aista, California
Simmonds Aerocessories, Inc. Edward L. Spellerberg 105 White Plains Road Tarrytown, New York
Solar Aircraft Company Fred S. Hage 2200 ~acific Hi~hway San Diego, Cahfornia
Sperry Gyroscope Company Div., Sperry Rand Corp.
C. H. Jones Great Neck, N. I., New York
Sundstrand Aviation Div. of Sundstrand Machine Tool
C• P. ~'\. Anderson 24211lth Street Rockford, Illinois

GOVERNMENT AGENCIES
Thiokol Clwmil'al Corporation Rolwrt Wav 780 North Clinton Avenue Trenton 7. New Jersey
Thompson Products, Inc. William R. Crowell 23555 Euclid Ave. Cleveland 17, Ohio
Tinnerman Products, Inc. W. A. Garman P. 0. Box 6688 Cleveland 1, Ohio
Wm. R. ·whittaker Co., Ltd. J. l\I. Wehrly 915 North Citrus Avenue Los Angeles 38, California
The Franklin C. Wolfe Co., Inc. William Lester 10567 Jefferson Blvd. Culver City, California
Zenith Plastics Company Ross Garrett P. 0. Box 91 Gardena, California
113
Transco Products, Inc. M. Cleland, Sales Manao-er 12210 Nebraska Avenue"' Los Angeles 25, California
Aircraft Industries Association Avery McBee, Director, Public
Relations
Vickers, Inc. Division of Sperry Rand Corp. E. J. Doucet, Jr. 1400 Oakman Blvd. Detroit 32, Michigan
610 Shoreham Building Washington 5, D. C.
Aircraft Industries Association Fred Steifler-West Coast 7660 Beverly Boulevard Los Angeles 36, California
Government Agencies Directly Concerned with Aviation
AIR COORDINATING COMMIT'rEE Department of Commerce 14th Street and Constitution Avenue, N. W. W ashin!!ton 25 D C E ~ ' ..
~ xecutive Secretary-William E. Neumeyer Sterling 3-9200 Extension 3613
AIR FORCE, DEPARTMENT OF THE Pentagon BuildinO' Washington 25 D>=> C
Offi ' . . ce of Information Services-Brig. Gen. Arno Luehman
Liberty 5-6700 Extension 76061 ARMY, DEPARTMENT OF THE
Pentagon Buildin{}" . Washington 25, D~ c.
C?Ief of Information-Maj. Gen. G. S. Meloy, Jr. Liberty 5-6700 Extension 55135
ATOMIC ENERGY COMMISSION 1901 Constitution Avenue, N. W. Washington 25, D. C.
Director of Information Services-Morse Salisbury Sterling 3-8000

114 AVIATION FACTS AND FIGURE~, 1957
CIVIL AERONAUTICS ADMINISTRATION Temporary Building #4 17th Street and Constitution AYenue, N. W. Washington 25, D. C.
Director, Aviation Information Office-Raymond Nathan Sterling 3-9200 Extension 3661
CIVIL AERONAUTICS BOARD Department of Commerce Building 14th Street and Constitution Avenue, N. W. Washington 25, D. C.
Chief of Public Information-E. E. Slattery, Jr. Sterling 3-9200 Extension 3806
COMMERCE, DEPARTMENT OF 14th Street and Constitution Avenue, N. W. Washington 25, D. C.
Director of Public Information-Albert Leman Sterling 3-9200 Extension 3135
DEFENSE AIR TRANSPORT ADMINISTRATION 14th Street and Constitution Avenue, N. W. Washington 25, D. C.
Administrator-Theodore Hardeen, Jr. Sterling 3-9200 Extension 4707
DEFENSE, DEPARTMENT OF Pentagon Building Washington 25, D. C.
Director of Public Inforn:ation-C. Herschel Schooley Liberty 5-6700 Extension 71~~6
NATIONAL ADVISORY COMMITTEE FOR AERONAUTICS 1512 II Street, N. W. Washington 5, D. C.
Assistant to Executive Secretary (Tnformation)-Walt«:>r T. Bomwy Liberty 5-6700 Extension 63229
NAVY, DEPARTMENT OF TH~J Pentagon Building Washington 25, D. C.
Chief of Information-R«:>ar Adm. E. B. Ta: 1r Liberty 5-6700 Extension 77391

SOURCES:
1 Aircraft Industries Association
~ Aircraft Industries Association, "Aircraft Year Book" (1919-195£f)
3 Aircraft Industries Association, "Aviation Facts & Figures" (1945, 1953, 1955 & 19~00
---4 Aircraft Industries Association: Cm~liJilaJi_ons from Aircraft Manufacturmg Companies' Amnia! Financial Rfatements
:3 ~irc1:af~ Industries Association: Cmnrnlahons from Moody's Industrial Manuals
6 ;(ircraft Resources Control Office, Model Designations of Military Air
eraft_ Re,-ised_ December 1944"
7 Air Transport Association
8 Department of the Air Force, Directorate of Statistical Services
9 ~~ent of_:~tr~, ~tr:::Foree,-Office ' 0 ~~ ::!~orma1}Qn __ ~ ·
10 ~ir Industries & Transport Association of Canada, Annual Reports
11 U. S. Army, Offic~ of the Chief of Eng'iiieel•s - { ' '
1~ ~utotnobile Manufacturers Association, ''Automobile Facts and Fig-ures" (Animal) (
13 Department o?J[ommeree) "Air Com-merce Bul!eti (V'oltn'n~ Number 5) ~ r· ,- ,
14 Department of Commerce, "Survey of Cufl'ent Business-National Income"·
15 Department of ~mnerce, Bureau of ~~~;c~:lsus! -~~chi~ezs an~ Equipment
' .\-._, ·----·--'--
115
16 D(J})ar.tment-of--Bommetce, _Bu_!etn!=-Uf -the Census,.'' BieJWial Census of 1\lan
nf:.wtmes'' (1921, 1937) .::::::.___. --- --·-
17 Department of Commerce, Buren~ of the Census, ''Census-of-1.be- Umted States- l\Ianu(uctii.resn-·(1919, 1929, 1939~
18 Department of Commerce, Bureau of the Census, "(\•ns}ls of Manufactures, I~ 1954'' CG-, f · -~ "'-r C.<-<--...
II . 19 Department of Commerce, Bu;eau of
the Census "Annual Survey of Manufactures" '_( 1949, 1950, 1951, 1952; 1953y-~
20 Department of Commerce, Bureau of the Census, "Facts for Industry," Series l\[37G, (Monthly)
21 Department of Commerce, Bureau of the Census, "Facts for Industry," Series M37C, (Monthly)
•>•) Department of Commerce, Bureau of the Census, "Facts for Industry,'' Series M37D, (Quarterly)
24
· f c 1·ce Bureau of 25 Department o omme • the Census, "U. S. Expo~ts ?,f Dome:t tic & Foreign Merchandise, (Rcpo FT-410)
26 Department of Commerce, Bl_lr':au of the Census, "Historical Stat,~shcs of the United States, 1789-1945
27 Department of Co~m~l~r e, Bureau of _) the Census, "Stahstw _A.bst.i:ae&-of- · the United States,'' ( nnual) 1

...
I - I
116 SOURCES p;((J ::!8 Department of Commerce, Civil Aero
nautics Administration, "The Airplane at Work for Business & Industry"
:!9 Department of Commerce, Civil Aeronautics Administration, "CAA Statistical Handbook of Civil Aviation"
30 Department of Commerce, Civil Aeronautics Administration, "Statistical Study of U. S. Civil Aircraft," Janu-ary 1, 1955 . ,.)
31 Department of CommtJc/, ~ivil Aeronautics Administration, "U. S. Military Aircraft Acceptances, 1940-1945"
32 Department of Commerce, Civil Aeronautica_C -.:Admini_r!tra._ti~ffice of Aviation Tnfor~ation ~-·
33 Department of Commerce, Civil Aeronautics Administration, "Report No. ACA-503"
34 Department of Commerce, Civil Aeronautics Board, "Annual Report of the Civil Aeroii'iiiitics Board"
35 Department of Commerce, Civil Aeronautics ~oard, Statistical Section
36 Department of Commerce, Bureau of Public Roads
37 Department of Defense, "Estimated Expenditures by Budget Category," EISED 315, J I ( :/[/
38 Department of Defense, "Expenditures by Major Budget Category," FY 1958 with 7 Year Comparisons," EISED 220
39 Department of Defense, Office of Public Information
40 Depp.rtment of Defense, Office of Secretary of Defense, Assistant Secretary
/ (R&D)
41 Department of Defense, Managerial Statistics Division, Office of International Security Affairs
42 Department of Defense, Office of Military Assistance, "Department of Defense Key MDAP Statistics" (Monthly)
43 Department of Defense, "Releasable ·Information on U. S. Air Force Air· craft"
44 "Dispost)'l~ Surplus Aircraft and Mar· or C~~~~~;?nents '!'hereof," Senate Subc unittee Print No. ll, June 26, 194
45 Dominion Bureau of l:o!tatistics, Otta-wa, Ontario, Canada [/v ( ;-
46 Executive Office of the President, Bureau of the Budget, Estimates Division, "Budget of the U. S. Government" (Annual)
47 Federal Coordinator of Transportation, "Public Aids to Transportation," (Volume 1)
48 First Natim~al City Bank, Monthly Letter, "Busmess and Economic Conditions"
49 Hous~ ~ubcommittee Hearin•gs, "Appropnatwns for the Department of the Air Force" (19~,
50 ~· ~· St_at~;ny Office, London, "The C1v11 Avwfion and ~chnical Review 1938" - /) I f(j '
51 H. M. Central Office of Information, London
52 H. M. Stationery Office, London "Ministry of Labour Gazette" (Month: ly)
53 International Air Transport Association, "Bulletin" (Annual)
54 International Civil Aviation Organization "Development of Civil Aviation" (Annual)
55 International Civil Aviation Organization, "Scheduled Airline Operations Digest of Statistics/ ~o. 36," Series T, No. 9 /d /J ,
56 Interstate Commerce Commission, Bureau of Transport' Economics and Statistics
57 Interstate Commerce Commission, "Transport Economics, Monthly Comment"
58 Interstate Commerce Commission "Some Aspects of Postwar Air & Sur: face Transpor tion" January 1945 \
59 Interstate Commerce Commission, Bureau of Transport Economics and Statistics, "Statistics of Oil Pipe Line . Companies"
.~ I.

SOURCES 117
60 Department of Justice, Immigration 68 Department of Labor, Bureau of and Naturalization Service, Adminis- Labor Statistics, "Work Injuries in trative Division, Statistics Branch, ~-" (Annual) "Report of Travel Between U. S. and . '~- c~ ~, Foreign Countries." (Monthly) --~~-~~~,Inc.
61 Department of Labor, Bureau of Em- 70::1.funitions~Bcr!lf0 ployment Security 71 Munitions ~Eoard~'Oifice · ofail'craft
62 Department of Labor, Bureau of Labor Statistics, Division of Wages and Industrial Relations
63 Department of Labor, Bureau of Labor Statistics, Industrial Hazards Branch
64 Department of Labor, Bureau of Labor Statistics, "Employment and Earnings" (Monthly) (Formerly "Employment and Payrolls")
65 Depa1:tment of Labor, Bureau of Labor Statistics, "Rev~e,d Series-Employment" AI { /'1
66 Department of Labor, Bureau of Labor Statistics, "Wartime Development of the Aircraft I?~lustry " Bul-letin #800 · /D / t'J '
67 Bure~u .of Laoo~. Statistics, "Wholesale_ Yfices and :price Indexes''
I I
Pr(}gram:s 72 National Association of Motor Bus
Operators
73 National Safety Council, "Accident Facts," (Annual)
74 National Science Foundation, "Federal Funds for Science: II and V"' \ (Annual) ·
75 Department of the Navy, Bureau of ---, Aeronautics
76 Department of the Navy, Office of Information
77 Department of the Navy, Bureau of Naval Personnel, Military Personnel Statistics
78 Post Office Department, Bureau of Transportation, Division of Air Service

INDEX
A
ACCEPTANCES (see Indi vidua l S ubj ects such as Ai rcraf t, Engines, etc.)
ACCESSION RA'fES (see Labor Turnover)
ACCESSORIES (see Aircraft Eq ui pment and Parts)
ACCIDENTS, 5~, 89, 90, 9:3 AIR CARGO (see Ca rgo ) AIR CARRIERS (see A irlin es ) AIRCRAFT (see a lso Airframes )
A cceptances, 31 A irline, 87, 92 App ropria tions, 28, 29 Back log, 62, 82 Civil, 6, 8, 9, 11, 20, 70, 72, 76 Expor ts, 102-107 Federal E xpenditures, 24, 28, 3-±, 35 In Use, 87, 92 Mutual S ecurity Prog ram, 106 P rodu ct ion
W eight, 21, 31 V alue, 12 N um ber, 8, 9, 20, 70
P lace, 70 R egiste red, 72, 76 Tactica l, (see Bombers and :Fighters) T y p es, 6, 17, 20, 32, 81
AIRCRAF'l' ENGINES (sec E ng ines) AIR CRAFT EQUIPMEN'l' AN D
PART S, 16 AIRCRAFT I N DUSTRY ( sec a lso Indi
dd ua l , ' ubj ccts) , 13, 47-GO, G:! -!i8
AIR l 'OHCE, 2-±, :!8, 30, 31, 3~ , 3-±, 35, 37, 41
AIRFRAME ( sec a lso Ai rcraft) Facil i t ies, 15 Ma nuf acturi ng Indust ry
Employment ( see E mp loy ment ) Fina ncia l, 61-65 Hours (sec H ours)
P rodu ction, 14, 31 ·w eig h t, 21, :n
AlRLTN ES Dom est ic
Accid c nf's, 80, DO, 9:) Airc ra ft, 87, DO , 92 L ength of Tr ip, 84, 04 Lo:1d Facto r, 84, 9+ Ma il, 86, 98 Ope ra tors, 89, 90 :Passe nger -L oad, 8+, 9+
Do mestic Passe nge r -M il es, 84, 9-± Pa sse nger Hevc nues, 84, 9:) , !H, !)!:J
P assenge rs, 84, 94
118
AIHLIN ES (cont inu ed) R a t es, 86 R oute Milengc, 89, 90 Seat Miles, 84, 94 Seats, 89, 90 Speed, 89, 90
Inte rn ationa l (U. S. Flag) (see a lso Individ ua l Subj ects), 89, 92, 93, 04
Il'l' egul a J·, 93, 97, 99 L oca l, 93 T e rri to rial , 93 Tra nsatlan t i c Cross in gs,!).)
AIH MAIL, 86, 88, 98 AIHl\IEN, M ilitn ry , 2.- , 30 Ail~ NAVIGA'l' ION, 73, 7:i AIRPLANES (sec A ircraf t ) AIRPORTS, 74 AIR 'l'RANSPOR'l' (sec A irlin es) AIRWAYS, 96 ALUMINUM, 13, 18 APPROPRIATIONS, 28, 29 AR~1:Y, 17, 20, :!4, 35, 37, 8 1 ASSETS, 61, 6:1 ATOMIC ENERGY, +1, +3 AVIA'l'ION ( sec a lso I ndividua l S ub
j ects) Appropriat-ions, 28, 29 Expenditures , :!4, 28, 34, 35
J\ VIATION CJ\ DET S, 30
B
BACKLOG, 62, 82 BALANCE SHEET S, 61 BOMBEHS, 17, 32
BUDGET (see Appropriations and Expenditures)
BUREAU OF AERON A UTJCS (see N:m1l Aviation )
BUS, O!i, 08, Ofl
BUSINESS FLYING , 7:::
c C'A-:\ ADA, 10+ CAPI'l'AL
A irf ra me l\Ian uf;; , 111 rcrs, 61 C'ARGO, 88, 98 C'ARRI EHS, (sec Airlin es a nd H.ailroa ds) C'Af-l lf , 6 1
C'E RTIJ"IC 'ATES, 49 , 51, 69 Cl V JL ( see Indiv idual S ubj ect s such as
A irlin es, Ai rcraft, etc. )

INDEX 119
CIVIL AIRWAYR, 75 CIVIL J<'L YING SCHOOLS, ill CONSTRUCTION (see Facilities) COPPER, 13, 19 COST (see Value, Expenditures) COST PER ::\fiLE, 77
D
DEFICIT (see Loss) DELIVERIES (sec Individual subjects
such as Aircraft, Engines) DEVELOP).IENT (see Research and
Developmcn t)
E
EARNINGS (see also Profits) A~rcraft Wor_lyers, 47, 54, 58 ~ucraft Eqmpmcnt \Vorkcrs, 47, 58 Airframe ·workers, 47, 58 Engine \Vorkcrs, 47, 58 Hourly, 47 Production \Vorkcrs, 47, 53, 58 Propeller Workers, 47, 58 Salaries, 54 Weekly, 58
EMPLOYMENT, 48, 53, 56, 57 ENGINE INDUSTRY, 16
Exports, 107 Facilities, 15 Production, 14
EQUIPMENT (sec Aircraft Equipment Facilities)
EXPENDITURES (sec Value, Financing) Aircraft and Related Equipment, 24,
28 Air Force, 28 Federal, 24, 41, 43 Guided Missiles, 35 Military Services, 24, 41, 43 N n val Aviation, 28 ResearPh and Development, 41, 43
EXPORTS, (sec also Mutual Security Program, 80, 102, 105-7
EXPRESS (sec Cargo), 88, 98
F
J<'ACILITIES, Hi FARES (see Rates) FATALI'l'IES (sec also Accidents), 89,
90, 95 FIGHTERS, 17, 32 FIN ANCJNG (see also Capital) FLOOR, SPACE, 15
FOREIGN AVIATION (see Individual Countries)
FREIGHT (sec Cargo), 88, 98 FREIGHT RATES (see Rates)
G
GEOGRAPHICAL DISTRIBUTION (see Location)
GLIDER PILOTS, 69 GOVERN)'IENT (see Individual Sub
.iects such ns Appropriations, Air Force, etc.)
GUIDED :MISSILES, 33ff
H
HELICOPTERS, 78ff HIGHWAYS, 96 HOURS, 55, 73
INCOME (see Profits, Sales), 61, 62 INJURIES (see Accidents) INSTRUCTIONAL FLYING, 73 INSTRUMENT LANDING SYSTEMS,
73 INSTRUMENTS (see also Aircraft
Equipment and Parts) INVENTORIES, 64, 65
J JET ENGINES (see Engines) JETS (see Aircraft)
L
LABOR TURNOVER, 49
LANDING AIDS, 73 LANDING FIELDS, (sec Airports)
LIABILITIES, 61 LOAD FACTOR (sec Passengers)
LOCATION, ii3 LOSSES (st•e also Profits), 64
M MACIIINEH Y (see Facilities) MAIL (see Airmail) 1IATERIALS
Consumed, 13, 18 Prh•cs, Hi
l\II~CHANICS, 49 MILES FLOWN (see Individual Sub
jects such ns Pnssenger Miles) MUTUAL SECURITY PROGRAM, 106

120 AVIATION FACTS AND FIGURES, 1956
N NAVAL AVIATION, 25, 2G, 28, 31 NAVY, (see Naval Aviation) NET WORTH, 61
p
PARTS (see Aircraft Parts and Equipment)
PASSENGER FATALITIES (see Acci-dents)
PASSENGER MILES, 84, 88, 94-98, 100 PASSENGER RATE (see Rates) P ASSENGER REVENUE (see Rates),
84, 93, 94 PASSENGERS, 84, 88, 94, 95 PAY ABLES, 61 PERSONAL AIRCRAFT (see Utility
Aircraft) PERSONNEL (see Employment), 25, 30 PILOTS, 30, 49, 69 PIPELINES, 96, 100 PLANES (see Aircraft) PLANTS (see Facilities) PLEASURE FLYING, 73 PRICES, MATERIALS, 16 PROCUREMENT (see Appropriations,
Expenditures, Sales, Value) PRODUCTION (see Individual Sub
j ect s) PRODUCTION WORKERS (see Em
ployment) PROFITS ( sec a.l so Losses) , 64, 65 PROPELLERS, 16
R
RADIO RANGE STATIONS, 75 RAILROADS, 95-100 RATES, 86, 93 RA'l'INGS, Civil Pilot awl Othe r, '19, 69 RECEIVABLES, 61, 63 RESEARCH AND DEVELOPMEN'l',
40ff REVENUE (see Passenger Revenu e,
Rates) ROADS (see Highways )
s SAFETY (see Accidents) SALARIES (see Earnings)
SALES, 12, 16, 64, 65
SCHEDULED AIRLINES (see Air lines and Individual Subjects)
SEA (see Water Transport) SEPARATIONS (see Labor Turnover) SHIPMENTS (see Production) SPARE PARTS (see Aircraft Parts and
Equipment) SPEED, 32, 89, 90 STEEL, 13, 19 STRIKES (see Work Stoppages) STRUCTURES (see F acilities) S'l'UDEN T PILOTS, 51, 69 SURPLUS (see Profits)
T
TAXES, 63-65 TRAFFIC (see Airlines) TRAINERS, 17, 25 'l'RANSA'l'LAN'l'IC, 95 TRANSPORTATION, 83ff
Leading Transport Companies, 100 TRANSPORTS, 17, 20, 25 TRAVEL (see 'l'ransportation) TURNOVER (see Labor Turnover)
u UNITED KINGDOM, 102, 103 USAF (sec Air Force) U. S . NAVY (see Naval Aviation) UTILITY AIRCRAF'l', 67ti
v VALUE (see Individual subj ects such as
Facilities, Production) \ I.ALUE ADDED BY MANUFACTURE,
12
w vVAGE EARN ERS (sec Emvloyment) WAGES (see Eamings) WA'l'ER TRANSPORT, 95, 96 WEIG JI'l' (sec Ai rframc Weight) WOME N, fi7
\VORK I N.TURJES, G2 WORKERS (sec Employment ) WORK STOPPAGES, 50

THE AIRCRAFT INDUSTRIES ASSOCIATION