The Construction and Validation of Rating Scales for Oral ...
538
The Construction and Validation of Rating Scales for Oral Tests in English as a Foreign Language by Glenn Fulcher B.D., M.Th., A.K.C. (University of London) M.A. in Applied Linguistics (University of Birmingham) P.G.C.E. (University of Cambridge) Submitted for the degree of Ph.D. in the Department of Linguistics and Modern English Language, University Of Lancaster. January 1993 -i-
-
Upload
khangminh22 -
Category
Documents
-
view
1 -
download
0
Transcript of The Construction and Validation of Rating Scales for Oral ...

The Construction and Validation of Rating Scales for OralTests in English as a Foreign Language
by
Glenn Fulcher
B.D., M.Th., A.K.C. (University of London)M.A. in Applied Linguistics (University of Birmingham)
P.G.C.E. (University of Cambridge)
Submitted for the degree of Ph.D. in the Department ofLinguistics and Modern English Language, University Of
Lancaster.
January 1993
-i-

The Construction and Validation of Rating Scales for OralTests in English as a Foreign Language
byGlenn Fulcher
B.D., M.Th., A.K.C. (University of London)M.A. in Applied Linguistics (University of Birmingham)
P.G.C.E. (University of Cambridge)
Abstract
The present research investigates the principlesupon which rating scales in oral testing are constructedand used, and the subsequent claims of reliability andvalidity made for them. The research addresses two mainquestions: (i) can rating scales be constructed on thebasis of an analysis of a database of actual studentspeech; and (ii) are scales produced on the basis ofstudent speech superior to those produced using a-priorimethods?
A corpus of spoken data was collected and analyzed.Discriminant analysis was used in order to isolatefactors which could discriminate between students ofdifferent ability levels, and a Fluency and an Accuracyrating scale constructed. The Fluency rating scale wasseen to be the most stable in the construction phase ofthe study.
Forty seven students took three tasks. Videorecordings were rated by five raters on the two ratingscales and the English Language Testing Service ratingscale.
-ii-
Use of questionnaires and retrospective reportsindicated that affective facets did not contaminateresults.
The reliability of the three rating scales wasassessed using a G-study, traditional correlationalmethods, and a Rasch Partial Credit model. It wasdiscovered that the Fluency rating scale was used mostreliably.
validity was investigated in two concurrent studies,a group differences study, a Multitrait-Multimethod studywith Confirmatory Factor Analysis, and a Rasch PartialCredit study. Divergent validity could not be establishedfor any of the rating scales. However, a new Raschvalidity statistic which can be related to bands ratherthan entire scales was developed, and results of itsapplication showed that the Fluency rating scalepossessed both coherence and continuum validity in threebands.
Conclusions suggest that databased approaches torating scale development are promising, and suggestionsare made for future research into band and rating scaleconstruction.
-iii-

AcknowledgeaentsResearch into oral testing cannot use vast numbers
of students and teachers unless there are no restrictionson time and funding. The forty seven students used inthis study gave up a considerable amount of time, andalthough they cannot be named I am grateful to them fortheir willingness to take part. Each of the five raterswho volunteered to view all the video cassettes andassign three grades to each student on each task spent anestimated 40 hours plus 30 minutes in the debriefinginterview and another 10 hours to complete the secondmarking for the intra-rater study: a daunting amount ofwork for busy professionals. Without the help of thesefive teachers, who shall remain anonymous throughout thetext of this study, it would have been impossible tocomplete a project on oral testing.
Thanks are due to Peter Hargreaves of the Universityof Cambridge Local Examinations Syndicate for providingthe data upon which the concurrent study with FirstCertificate results was based, and Mike Milanovic andNick Saville for comments on the first draft of thatstudy. I should also like to acknowledge the cooperationof Nick Butler of the British Council and Clive Mogford(then Director of the British Council in Cyprus) forgiving permission and providing facilities to make therecordings of English Language Testing Service interviewswhich formed the database for the studies in Chapters 4and 5.
-iv-

I would like to thank Brian Francis of theDepartment of Applied statistics at Lancaster Universitywho, despite constantly being badgered by researchstudents, always found time to discuss any problems Icame across in the course of my work. In particular, Iwould like to thank him for his comments on the form andimplications of the Rasch Partial Credit validitystatistic for bands developed in Chapter Nine.
Working away from Lancaster with only brief summervisits often led to a feeling of isolation. The lack ofpeople with whom problems encountered can be discussedface-to-face can be depressing for students working at adistance, and this may lead to a failure to complete.That this study has been completed is due entirely to mysupervisor, Charles Alderson. A letter at just the rightmoment, critical but encouraging comments on drafts,plans and data, and suggestions which have widened myhorizons and ability to conceptualise within the field oflanguage testing. I could not have wished for a bettersupervisor, and I will always be deeply indebted andgrateful to him.
Finally, I would like to thank my family. Firstly,my mother and father who volunteered to pay all costsincurred, and never complained at the loss of their carwhenever I visited Lancaster! They have provided the bestsupport I could possibly have asked for, both in terms ofencouragement and financial help. My wife, Marie, hastolerated a great deal of neglect during the last few
-v-

years in order for me to complete this study. Not onlyhasshe been supportive and understanding, but also undertookthe compilation of the bibliography and helped withproofreading. Lastly, Greg, who did not demand so much ofmy attention during the first few months of life that Icould not settle down to revise the final drafts.
-vi-

Table of Contents
PageChapter oneIntroduction 1Section 1: Issues in oral languagetesting 1Section 2: Objectivesof this research 4section 3: organisationof the thesis 7Chapter TwoIssues in oral TestiDC) 8section 1: Issues from the history of oral
testing 101.1. The Foreign Service Institute:the
beginningof oral testing in theUnited states Government in thepost-war period 10
1.2 The developmentof oral testingoutside the United States Government 13
1.3 FSI to ACTFL: The developmentof oralrating scales 161.3.1 The FSI rating scale 161.3.2 Critique of the FSI rating scale 231.3.3 The ILR rating scale 261.3.4 The ACTFL/ETS rating scale 27
1.4 Discussion 32section 2: Issues in reliabilityand validity
in oral testing 412.1 Reliabilityin oral testing 41
2.1.1 Evidence from the united states 412.1.2 Evidence from other countries 472.1.3 Reliabilityand rater training 492.1.4 A methodologicalnote on reliability
studies: some recent developments 502.1.5 Conclusions 51
2.2 Validity in oral testing 522.2.1 Validity claims and some
empiricalevidence 542.2.2 Concurrentvalidation 632.2.3 controversyover band
descriptorsin oralrating scales 76
2.2.4 Conclusions 89Section 3: Rating scale constructionin
oral testing 913.1 Approachesto constructingrating
scales 913.2 Psychometricconsiderations 1003.3 Terminologyused in constructing
band descriptors 1013.4 A special case of terminological
confusion in oral rating scales:the Native Speaker Yardstick 107
-vii-

Chapter ThreeRationale, ti.a scale and design of the study 114Section 1: Rationale 114Section 2: Time scale and design 118Chapter FourThe Develo~nt of a Fluency rating scalesection 1: IntroductionSection 2: A working definition of fluencysection 3: Data and analysis of categoriessection 4: Eight explanatory categoriessection 5: Discriminant analysissection 6: Producing Fluency rating scale
descriptorssection 7: Discussion
122122126130135149153163
Chapter FiveTbe Develo~t of an Accuracy rating scale 166section 1: Introduction 166section 2: Current criteria of accuracy
in oral tests 1732.1 UCLES rating scales 1732.2 The ASLPR 1792.3 The ACTFL rating scale 1822.4 The IELTS rating scale 185
section 3: Specificity in rating scales 188Section 4: Developing a rating scale for
accuracy 189section 5: Analysis of categories 190section 6: Error Gravity 197Section 7: Initial investigation into
category reduction 199Section 8: Discriminant analysis 201Section 9: Amount of speech produced 204Section 10: Breadth of lexis 206section 11: Producing Accuracy rating scale
descriptors 208Section 12: Grammatical accuracy and the
morpheme studies 21812.1 Introduction 21812.2 Step 1: Rank order 21912.3 Step 2: An acquisition hierarchy and
the Accuracy scale 221section 13: Discussion 225Chapter sixTask Designsection 1: Factors in task designsection 2: The three taskssection 3: Expected discourse outcomesSection 4: Elicitation techniquesSection 5: Description of the student sampleSection 6: Conduct of the oral tasks
227227230234235242244
-viii-

Chapter SevenStudent Affective Factors 247section 1: Introduction 247section 2: Questionnaire structure 250Section 3: Summary statistics for the
questionnaires 252section 4: Analysis of questionnaire responses
by group and task preference 254Section 5: Student self assessment 259section 6: The relationship of reported
anxiety to Rasch ability estimates 260section 7: Summary of qualitative analysis of
responses to open ended questions 260section 8: Discussion 263
Chapter EightReliability 266section 1: Introduction 266Section 2: Generalizability study 268Section 3: Correlational analysis 273
3.1 Reliability coefficients on scales 2743.2 Reliability coefficients across tasks 276
Section 4: Rasch Partial Credit analysis 2774.1 Introduction 2774.2 Rating scales and rater bias 2784.3 A Partial Credit model to
analyze rating patterns 2824.4 The effect of task on rating
patterns 2874.5 Task difficulty 2924.6 Partial Credit reliability
estimates 292section 5: Intra-rater reliability 293Section 6: Discussion 294
6.1 Task 3 2946.2 Inter- and intra-rater reliability 2976.3 Implications for rater training 298
Chapter JlineValidity 302section 1: Introduction 302section 2: Two concurrent studies 302
2.1 Introduction to study one 3022.2 study one: FCE - Developmental tests
concurrent study 3032.2.1 The five FCE papers, Fluency,
Accuracy and ELTS 3032.2.2 FCE oral rating components,
Fluency, Accuracy and ELTS 3062.2.3 Discussion 308
2.3 Study two: The relationship betweenteacher assessments of student oralabilities and the developmentalscales 310
-ix-

2.3.1 Introduction2.3.2 Available data from teacher
assessments2.3.3 Analysis of concurrent
teacher assessmentssection 3: Validity by Group DifferencesSection 4: Construct Validity
4.1 A Multitrait - Multimethod study4.2 Maximum Likelihood Confirmatory
Factor Analysis4.3 Rasch Partial Credit analysis4.4 Further validity considerations4.5 Discussion and conclusions
310313314315317317320324332334
Chapter TenRetrospective Report studysection 1: Introductionsection 2: Interviews with raterssection 3: Interviews with studentssection 4: Analysis of data
4.1 Rater responses4.2 Student responses
4.2.1 Ability level of the sample4.2.2 Summary of findings
339339341343344344359359359
Chapter ElevenDiscussion and Conclusions 361Section 1: Preliminaries 361section 2: Validity and the use of the
data-driven approach to scaledevelopment 362
2.1 The lack of divergent validity 3622.2 Validity in the Partial Credit model
study 3662.2.1 A methodological note 3662.2.2 Coherence and continuum validity 3682.2.3 Conclusions 371
section 3: Assumptions of this research 373section 4: Suggestions for future research 376
4.1 Validation of component traits 3764.2 Task and topic 3794.3 Specificity and length of rating
scales 3814.4 Validation methodology and tools 3824.5 Research into other rating criteria 383
section 5: Conclusions 384References 385
-x-

Appendix to Chapter TWo 412Appendix to Chapter Four 415Appendix to Chapter Five 424Appendix to Chapter Six 435Appendix to Chapter seven 446Appendix to Chapter Bight 460Appendix to Chapter lIine 472Appendix to Chapter Ten 481
List of Figures
PageFig. 2.1 FSI rating factors 17Fig. 2.2 FSI weighting table 18Fig. 2.3 FSI conversion table 18Fig. 2.4 A comparison of the ILR andACTFL rating scales 28Fig. 4.1 The relationship between actual
band scores and predicted bandscores for the explanatoryfluency categories 152Fig. 4.2 Category 1 means 154Fig. 4.3 Category 2 means 154Fig. 4.4 Category 3 means 155Fig. 4.5 category 4 means 155Fig. 4.6 category 5 means 156Fig. 4.7 category 6 means 156Fig. 4.8 category 7 means 157Fig. 4.9 category 8 means 157Fig. 5.1 The relationship between actualband scores and predicted bandscores for accuracy categories 203Fig. 5.2 category 1 means 209Fig. 5.3 Category 2 means 209Fig. 5.4 Category 3 means 210Fig. 5.5 Category 4 means 210Fig. 5.6 category 5 means 211Fig. 5.7 Category 6 means 211Fig. 5.8 category 7 means 212Fig. 5.9 Category 8 means 212Fig. 5.10 category 9 means 213Fig. 5.11 The suggested natural order ofacquisition from the morphemestUdies 220
-xi-

Fig.5.12Fig. 5.13
Fig. 8.1Fig. 8.2Fig. 8.3Fig. 8.4Fig. 8.5Fig. 8.6Fig. 8.7Fig. 8.8Fig. 8.9
Fig.8.10
Fig. 8.11
Fig. 8.12
Fig. 8.13
Fig. 8.14
Fig. 8.15Fig. 9.1
Fig. 9.2
Fig. 9.3
A possible acquisition hierarchyfor eight aspects of grammarThe relationship between acquisitiongroups identified in fig. 5.12 andthe band descriptors in the Accuracyrating scaleRater agreement (Fluency)Task comparability (Fluency)Rater agreement (Accuracy)Task comparability (Accuracy)Rater agreement (ELTS globalassessmentTask comparability (ELTS globalassessmentRank order of judge severity onall rating scalesRating scale structureItem Characteristic Curves forfive raters on the Fluencyrating scaleItem Characteristic Curves forfive raters on the Accuracyrating scaleItem Characteristic Curves forfive raters on the ELTS globalrating scaleItem Characteristic Curves forfive raters on the Fluencyrating scale, taking taskvariability into accountItem Characteristic Curves forfive raters on the Accuracyrating scale, taking taskvariability into accountItem Characteristic Curves forfive raters on the ELTS globalrating scale, taking taskvariability into accountReliability statistics for eachrating scale by raters and tasksPath diagram for an ML solutionof three intercorrelated testmethod facetsItem Characteristic Curves forthe study of rating scalevalidityA Rasch Partial Credit validitycurve for use with bands inrating scales
-xii-
223
225270270271272272273279280
283
284
285
288
289
290293
321
325
330

Chapter One
Introductionsection 1: Issues in oral language testing
Oral language testing has been an important area ofresearch and development in language testing since theSecond World War, but most of the published research onissues in oral testing has only appeared in the lastfifteen years. One reason for this may be that languagetesters had generally assumed that oral tests could notmeet the psychometric criteria for test development ingeneral (Lado, 1961). However, it is now widelyrecognised that it is important to test oral abilitygiven its growing importance in language syllabuses, andnew methods and techniques for the assessment of thepsychometric properties of oral tests have been developed(see, for example, Masters, 1990).
The issues surrounding oral testing are complex andoften controversial. An oral test, like any test,essentially comprises an elicitation technique and ascoring procedure (Alderson, 1983: 91). We wish to definethese two categories with slightly more precision. Wemake a distinction between elicitation technique whichrefers to the specific prompts, questions or commentswhich the interviewer or controller uses to elicit alanguage sample, and a "task" which refers to the formatin which the elicitation techniques are employed.Further, there is the issue of "topic", which refers tothe content or subject of the task. It seems possible
1

that the choice of topic may have an effect on studentperformance on any given task using any specificelicitation techniques. The elicitation technique, thetask and the topic together constitute the "situation"into which the student is placed for the purpose of oraltesting, and may influence the type of language whichstudents produce, or the expected discourse outcomes.
When discussing scoring procedures we are concernedwith the way in which the scoring system, usually arating scale, is developed and used. Two related issueshere are the criteria selected against which the studentsare to be rated and, given these criteria the number ofbands or categories in the rating scale which can bejustified. Needless to say, there is then the knottyproblem of how the rating criteria are to be related tothe language sample obtained from the test: are we todevelop so-called "common measures" which can relate toany language and any testing situation, or "specificmeasures" which relate to only one testing situation or,in an English for Specific Purposes (ESP) context, to onetype of predicted outcome in terms of the languagesample. This raises the issue of the generalizability ofresults to situations outside that of the test itself.Further, is it preferable to develop oral rating scaleswhich are global/holistic or componential/analytic, andwhat evidence can be supplied which suggests that onemethod is preferable to the other given the extent of ourcurrent knowledge about what makes up the construct "oral
2

ability"?The reliability, validity and practicality of any
oral test are clearly of major concern, and relate to allaspects of the issues outlined above. The training ofraters is one area of reliability which will be discussedto some extent in this study.
Another area of concern is that of test methodfacets which may confound studies of reliability andvalidity because of their effect on scores. Test methodfacets include not only the task, elicitation techniqueand the topic, but affective factors of which testanxiety has often been hypothesized to be the mostimportant, as well as raters and their degree of trainingin the use of a rating scale.
Other issues which are dealt with in the oraltesting literature include the status of the interviewas "real conversation" in "real-life" interaction, asopposed to a test "genre" in which we only observe "test-type language", the degree to which rating scalesdistinguish between "performance" (as in many so-called"direct tests") and "competence" (are they "indirect" inthat the purpose is to measure underlying ability?), andthe washback effect which any testing procedure may haveon a teaching curriculum.
All of these issues are worthy of research. However,it is clearly not possible to deal with everything we donot know about the process of oral testing in one study.This study will concern itself with one area of oral
3

testing, namely the construction and validation of oralrating scales. Validation procedures necessarily includethe provision of as much evidence as possible to indicatewhether a rating procedure is or is not valid (Messick,1989a), and so although some of the issues outlined aboveare not of primary focus, they will be dealt with to someextent in the body of the thesis.
Section 2: Objectives of this researchResearch into the construction and operation of oral
rating scales was suggested by findings which indicatethat there is frequently little connection between thenotion of the linguistic/communicative development of thenon-native speaker underlying band descriptors in ratingscales and what real speakers say in real situations, bethese informal conversations (Fulcher, 1987) or tests(Fulcher, 1989). This study sets out to investigate (i)whether scales can be constructed on the basis of ananalysis of a database of actual student speech: and (ii)whether scales produced on the basis of a database ofstudent speech are superior to those produced using a-priori methods.
Problems created in the production of rating scaleson an a-priori basis are investigated at some length. Thetradition of oral testing in the united states was takenas being typical of current a-priori approaches to ratingscale development, and these approaches have been copiedin other parts of the world. American tests are therefore
4

scrutinised in some detail, mainly in Chapter 2, althoughAustralian and European tests are considered whenavailable published research is relevant to scaleconstruction.
The initial step in the research reported in thisstudy was to construct a database of student speech andanalyze it for evidence of factors related to theconstructs of Fluency and Accuracy which may haveinfluenced the band score achieved by the student.Discriminant analysis was used to predict student scoresand differences between the scores of students ofdifferent ability levels. It was discovered that onlyvery high prediction rates from factors related toperformance to test scores could legitimize the use ofthis procedure in the construction of rating scales.
The influence of test method facets on test scoresand their interpretation is now recognised (Bachman,1990). In this project great care was taken either tocontrol or account for any test method facets which couldhave rendered any conclusions useless because ofcontamination of data. Similarly, high reliabilitystatistics are reported for all the rating scales beingused. Had this not been the case, it would not have beenlegitimate to proceed to the investigation of thevalidity of the rating scales.
In the validation study, little evidence could befound of concurrent or discriminant validity for eitherthe Fluency or the Accuracy rating scale. However, the
5

Rasch Partial Credit study did indicate that the Fluencyscale in particular was being used in a much more stableway than either the Accuracy or the English LanguageTesting Service rating scale. It was suspected that themethods used in the validation of the rating scale werenot sufficiently sensitive to isolate observedconsistencies across tasks and raters, and a new validitystatistic was developed which allows the test researcherto assign a validity statistic not to a scale as a whole,but to each band within a scale. The concepts ofcoherence and continuum validity are outlined as atheoretical counterpart to this new statistic.
It was discovered that three of the bands in theFluency rating scale are behaving in the way which onewould normally expect from a valid measurementinstrument, but that the other bands were not. Theseconsistencies can be directly related to the excellentprediction pattern observed in the discriminant analysisused in the construction of the rating scale. That is,the high observed validity coefficients are determined bythe success of the database analysis and constructionprocess. The approach to validating bands developed inthis research also allows the test constructor to suggestwhy a band or a scale is not working in the way expectedwhen first developed.
The conclusions of this research suggest that,although the databased approach to rating scaleconstruction is much more time consuming than traditional
6

a-priori methods, it has many potential advantages. Themost important of these is that results from validationstudies can be related directly to claims about thecoherence of any second language acquisition model whichunderlies the rating scale. Further, individual bands maybe assessed and their place in the model evaluated byreference to the descriptors used.
It is argued that the approach developed here issignificant in its findings, and could lead to futureresearch which would extend our knowledge of scale andband construction to other components of the construct"oral ability." The implications for oral testing andsuggestions for future research are discussed.
section 3: Organisation of the thesisAll figures are included in the text of the thesis
for immediate reference. Tables are reserved for theAppendices. This policy was adopted in order to removemultiple tables from the text, which may have beenirritating for the reader.
Each Appendix bears the number of the Chapter towhich it is attached. Thus, for example, there is noAppendix One, as no additional material is required forChapter One. The first Appendix is the Appendix toChapter Two.
7

Chapter Two
Issues in Oral TestingThe importance of oral testing has been recognised
within the language teaching profession since the SecondWorld War, when it was realised that many Americanservice personnel and diplomats did not have thelinguistic skills necessary to carry out their dutieseffectively. Since that War many tests of oral abilitieshave been developed, firstly in the United States andthen in Europe and elsewhere, generally in the case ofEurope as a part of a larger test battery. It is becauseoral testing has a longer history in the United states,because researchers in the United States have generatedmore published studies, and because many other widelyused tests are based upon American models, that we shallconcentrate on rating scales developed in the unitedstates.
The emphasis, from the very beginning, was placedupon developing oral tests which would be capable ofproviding information on the candidate which could beused to predict his/her success in some future real-lifesituation, as this quotation from Kaulfers (1944: 137,quoted in Barnwell, 1987: 35) makes clear:
"The nature of the individual test items shouldbe such as to provide specific, recognisableevidence of the examinee's readiness to performin a life-situation, where lack of ability tounderstand and speak extemporaneously might be
8

a serious handicap to safety and comfort, or tothe effective execution of militaryresponsibilities."
This general aim has not really changed (Skehan,1988: 211), although the methodology and techniques usedin oral testing have developed considerably. Much of thework which has been done in the field of oral testing inrecent years has undoubtedly been influenced bydevelopments which took place in the United States, andmany of the issues which are now attracting considerableattention relate directly to the new generation of oraltests which stem from the early post-war period. It isalso true to say that many organisations developing oraltests outside the United states used the Foreign ServiceInstitute (FSI) test and its descendants as a model uponwhich to build. This is true, for example, of theAustralian Second Language Proficiency Ratings (Ingramand Wylie, 1985).
This chapter will therefore begin by considering thehistory of oral testing in the United States in order tohighlight some of the issues which are still of greatconcern in oral test and rating scale development(Section 1). Secondly, issues in the study of reliabilityand validity will be considered (Section 2). Thirdly, theway in which rating scales for oral tests are constructedwill be reviewed and assessed (Section 3). It will beargued throughout that although the issues to be outlinedin oral testing have been discussed for a considerable
9

length of time there is a lack of empirical evidence tosupport coherent oral testing theory or practice,especially with regard to rating scales. It will also beargued that in the field of oral testing there has been atrend for writers and test developers to defend theirviews and systems by claiming high face validity.
Section 1. Issues from the History of Oral Testing.1.1 The Foreign Service Institute; the beginning of oraltesting in the United states Goyernment in the post-warperiod.
Prior to the Second World War the American Councilof Learned societies ran language programmes for militarypersonnel and diplomats in "languages of potentialmilitary and diplomatic importance" (Liskin-Gasparro,1984b: 17), but with the realisation that Americanpersonnel were ill-equipped to deal with the linguisticdemands which were placed upon them during the war, theFSI was set up in order to teach foreign languages whichwould be needed in overseas posts (Kramsch, 1986b: 366).
The initial impetus to the development of oral testswas undoubtedly military need, but it was not until 1952that it was realised that it would be necessary tomeasure the oral skills taught by the FSI Instructorswhen the Civil Service Commission decided to create aregister of personnel documenting their familiarity withforeign languages and cultures (Liskin-Gasparro, op.cit., 18 - 19). A committee with the responsibility fordeveloping a test of oral abilities produced the first
10

oral rating scale which consisted of six bands. Band 1represented no ability to use a language, while band 6represented native speaker ability. No information isavailable concerning the choice of 6 bands as opposed toany other number, and no evidence is available to explainwhy a minimum of band 4 was required for diplomaticpersonnel. Sollenberger (1978: 5) states that "to avoidcomplicating the task, no effort was made to separate thecomponents of language proficiency ••••" What wasdeveloped was thus an intuitive six band holistic ratingscale with "weak" descriptors only for the lowest andhighest bands. The number of bands to be included in arating scale, whether it should be holistic orcomponential, and how the descriptors are to be generatedare all major current areas of concern.
Political and bureaucratic problems held up work onand implementation of the 1952 testing procedures until1956, when a survey discovered that personnel still didnot possess the required oral skills for their roles, andin 1956 the FSI was given the responsibility to provideevidence of foreign language proficiency for all foreignservice personnel. Sollenberger (1978) reports that oneof the initial problems which the FSI faced was that therank and age of officers tended to influence the raters'judgements; the FSI developers had identified one aspectof what today would be called test bias.
In 1958 the FSI testing unit further developed the1952 scales by adding a checklist of five factors for
1 1

oral raters, each measured on the six point scale. Thesefive factors were accent, comprehension, fluency, grammarand vocabulary (Adams, 1980). This was the first steptowards developing componential rating, even though thecomponents were to be used as a check on a single I
holistic mark. Further, although it was claimed that therating procedure was "a highly accurate predictor" thelimitation of the system was also acknowledged to be thatit did not measure "effective communication"(Sollenberger, 1978: 7 - 8). Thus, from the very earliestdays in the development of modern oral rating scales theroles of linguistic competence and communicative abilitywere issues of which the testers were aware.
Confidence in the new oral testing proceduresdeveloped by the FSI was so high that during the 1960sthe method was adopted (and adapted) by the DefenseLanguage Institute, the Cental Intelligence Agency (CIA)and the Peace Corps. Quinones (no date) details the wayin which the CIA adapted the FSI system for its own use,the most important feature of which was the use ofmultiple raters and an averaging system for their marksin an attempt to increase reliability. In 1968 thesediverse agencies came together to produce a standardizedversion of the levels, which today is known as theInteragency Language Roundtable (ILR) (Lowe, 1987).
These early developments in oral testing thusgenerated interest in holistic versus componentialrating, bands and their descriptors, test bias, the
12

difference between linguistic and communicative criteriafor rating, and reliability. All of these areas are veryhigh on the agenda of researchers today.
1.2 The development of oral testing outside the unitedstates Government.
The substantial use of the FSI system by the PeaceCorps outside the control of the Government agenciesintroduced the new oral testing system to academics andteachers (Liskin-Gasparro, 1984b: 22), and in the 1970sit was adopted by many universities and states for thepurpose of bilingual teacher certification. The processof introduction of the FSI system into universities andschools began with the development of the Testing KitWorkshops (Adams and Frith, 1979), initially for teachersof French and Spanish. Inter-rater reliabilities for oralscores between teachers and FSI raters were reported tobe consistently over .84. The teachers used in thisrating process had not been subjected to a lengthy periodof rater training, and the confidence shown in the FSIsystem most probably came, in part, through theassumption that the rating scales in themselves possesseda degree of psychological reality rather than being amere artefact of the training. The importance of usinguntrained raters in validity studies is highlighted byAlderson (1991b), who uses the word "cloning" to describerater training. Once training has taken place it could beargued that test results, upon which quantitative
13

research into validity is conducted, is prejudiced. Thatis, the training of raters to use a rating scale prior toits validation ensures that raters use the scale in thesame way, irrespective of whether the descriptors in thebands actually reflect or describe the trait which therating scale was designed to measure by its constructors.This initial situation contrasts with the presentapproach of the American Council on the Teaching ofForeign Languages (ACTFL) which consistently states thatthe system can only be operated after a full and lengthyperiod of training in the use of the ACTFL scales(Barnwell, 1989). We will return to the issue of ratertraining in section 2.1.3 on page 49.
Barnwell (1987: 36) provides three other reasons whythe FSI approach to oral testing became generally popularwithin a short space of time. Firstly, as a direct testof oral ability, the FSI was seen to have high facevalidity. Unfortunately, claims of high face validityhave often resulted in claims of overall validity fororal tests since, with face validity often beingprojected as the only type of validity which needs to beseriously considered (Underhill, 1987). Others havewarned of the dangers of this approach (stevenson, 1981;Messick, 1989a). Secondly, inter-rater reliability hadbeen shown to be high. Thirdly, by the late 1970s therewas a growing interest in the notional/functionalapproach to teaching English, and it was widely perceivedthat the direct oral test was a natural testing adjunct
14

of new teaching methods. Thus, the relationship betweenteaching methodology and testing was recognised, and theimportance attached to face validity may be seen in thatcontext.
In 1979 the work of J. B. Carroll (1967) became thefocus of considerable attention. Carroll had administeredthe oral test to college majors of French, German,Russian and Spanish in the united States, and concludedthat very few college majors in these foreign languageswere capable of achieving a level above 2/2+, level 3 inthe FSI rating system being the minimum for professionalworking proficiency. Carroll's study was replicated in1979 by the Educational Testing Service (ETS) (Liskin-Gasparro, 1984b: 27), and it was argued that if the ILRapproach to oral testing were to be used by universities,colleges and schools, the rating scales would have to bedeveloped to allow more discrimination below the ILR 2+level. The rationale was simply that it would not beappropriate for students to spend many hours of study onthe foreign langauge and register no progress at all onthe rating scale. This led directly to the involvement ofthe ETS and the growth of the importance of the ACTFL toalter the ILR rating scales to suit the new purposes towhich oral tests were to be put outside the government(Liskin-Gasparro, 1984a: 447; 1984b: 25; Lowe, 1983: 232;Lowe, 1985a: 13; Lowe, 1987; Clark 1988a: 4 - 10).
In 1979 the President's Commission on ForeignLanguage and International Studies presented its report
15

"strength through Wisdom: A Critique of u.s. Capability"to President Carter. Among its recommendations was thesetting up of a National Criteria and Assessment Programto develop language tests and assess language learning inthe U.S., citing the work of the FSI as a valuable stepin this direction.
ACTFL was given the role of producing Nationalcriteria, and the ACTFL Provisional ProficiencyGuidelines appeared in 1982 (ACTFL, 1982) and thecomplete Guidelines in 1986 (ACTFL, 1986).
This gave birth to what has now come to be termedthe "Proficiency Movement", and has generated equalamounts of enthusiasm among its supporters and despairamong its critics. However, before considering theimplications of the Proficiency Movement for oral testingand the uses to which the ACTFL rating scales have beenput, it is necessary to backtrack to some degree and lookat the assessment scales which were developed by the FSIand plot their development to the 1986 ACTFL ratingscale, and consider the evidence upon which researchershave claimed that the scales are reliable and valid.
1.3 PSI to ACTFLj The development of oral rating scales1.3.1 The FSI rating scale
The first FSI oral interviews were conducted by anative speaker interviewer who was selected on thecriteria of "friendliness" and "interest" to elicit thespeech sample, and a rater who need not be fluent in the
16

language, but who was sensitive to errors which thestudent might make (Wilds, 1979). The interview wouldlast between 10 and 40 minutes. The procedure used wasfor the interviewer to begin with simple social formulae,and from there to proceed to elicit grammaticalstructures from the candidate. After this, a role-play ora prepared dialogue would be used. Appropriateelicitation techniques were prepared in advance. Therater would take notes, and grade the candidate on a six-point scale across five factors, as presented in Figure2.1.
Fig. 2.1. FSI rating factors.Accent foreign · · · · · native· · · · •Grammar inaccurate · · · · · accurate· · • · •Vocabulary inadequate · · · adequate· · •Fluency uneven · : · even· ·Comprehension incomplete · : · · complete· · ·
A weighted scoring system was devised by Wilds whichwas derived from the multiple correlation between each ofthe factors and the overall rating assigned. The weightedscore was then converted into one of the FSI levels. Thisprocess (ETS, 1970) is illustrated in Figures 2.2 and2.3.
17

Fig. 2.2. FSI weighting table.proficiencydescription 1 2 3 4 5 6---------------------------------------------------------Accent 0 1 2 2 3 4Grammar 6 12 18 24 30 36Vocabulary 2 8 12 16 20 24Fluency 2 4 6 8 10 12Comprehension 4 8 12 15 19 23
Total---------------------------------------------------------
Fig. 2.3. FSI conversion table.---------------------------------------------------------Total score from weighting table FSI Level---------------------------------------------------------16 - 25 0+26 - 32 133 - 42 1+43 - 52 253 - 62 2+63 - 72 373 - 82 3+83 - 92 493 - 99 4+
It is clear from Figure 2.2 that grammaticalaccuracy is given the highest weighting in deriving thefinal scores; it is often claimed that this is still thecase with the most recent ACTFL scales, and is the pointof some contention between ACTFL proponents and theircritics (Van Patten, 1986). The components which arechosen for criteria in an oral rating scale and theimportance of each of those components is an area ofresearch in which little progress has been made, apartfrom the work done by Adams (1980). However, in 1958 whendescriptors were for the first time written to give
18

content to the levels of the FSI scale, a process wasbegun which provided the opportunity to conduct researchinto the relationship between the test and actuallanguage production.
The 1958 FSI band descriptors are given here infull.
Level 1: Elementary Proficiency. Able to satisfy routinetravel needs and minimum courtesy requirements.Can ask and answer questions on topics very familiar tohim: within the scope of his very limited languageexperience can understand simple questions andstatements, allowing for slowed speech, repetition orparaphrase; speaking vocabulary inadequate to expressanything but the most elementary needs: errors inpronunciation and grammar are frequent, but can beunderstood by a native speaker used to dealing withforeigners attempting to speak his language: while topicswhich are "very familiar" and elementary needs varyconsiderably from individual to individual, any person atLevel 1 should be able to order a simple meal, ask forshelter or lodging, ask and give simple directions, makepurchases, and tell time.
Level 2: Limited Working Proficiency. Able to satisfyroutine social demands and limited work requirements.Can handle with confidence but not with facility mostsocial situations including introductions and casualconversations about current events, as well as work,family and autobiographical information; can handlelimited work requirements, needing help in handling anycomplications or difficulties; can get the gist of mostconversations on non-technical subjects (i.e., topicswhich require no specialized knowledge) and has aspeaking vocabulary sufficient to express himself simplywith some circumlocutions: accent, though often quitefaulty, is intelligible; can usually handle elementaryconstructions quite accurately but does not have thoroughor confident control of the grammar.
19

Level 3: Minimum Professional Proficiency. Able to speakthe language with sufficient structural accuracy andvocabulary to participate effectively in most formal andinformal conversations on practical, social, andprofessional topics.Can discuss particular interests and special fields ofcompetence with reasonable ease; comprehension is quitecomplete for a normal rate of speech; vocabulary is broadenough that he rarely has to grope for a word: accent maybe obviously foreign; control of grammar good; errorsnever interfere with understanding and rarely disturb thenative speaker.
Level 4: Full Professional Proficiency. Able to use thelanguage fluently and accurately on all levels normallypertinent to professional needs.Can understand and participate in any conversation withinthe range of his experience with a high degree of fluencyand precision of vocabulary; would rarely be taken for anative speaker, but can respond appropriately even inunfamiliar situations: errors of pronunciation andgrammar quite rare; can handle informal interpreting fromand into the language.
Level 5: Native or Bilingual proficiency. Speakingproficiency equivalent to that of an educated nativespeaker.Has complete fluency in the language such that his speechon all levels is fully accepted by educated nativespeakers in all its features, including breadth ofvocabulary and idiom, colloquialisms, and pertinentcultural references.
It should be noted that the FSI band descriptorswere developed in such a way that they could be appliedto all languages; in other words it was considered to bea "common measure" (Clark, 1980a), and this explained thevery real problems in ensuring that an S-3 in French wasnot more difficult to obtain than in other languages, asreported by Sollenberger (1978).
20

The scale ranged from no proficiency whatsoever tonative speaker ability. The concept of the "nativespeaker" as an assessment criterion has affected mostoral rating scales since the FSI, and is one to which weshall return.
The assessment carried out was global, but despiteSollenberger's view that there was no attempt to isolatecomponents of speaking ability, we have seen thatcomponent scales were developed and a weighting systemconstructed. The component scales, given in full below,were used only in the training of FSI raters, and in livetests as a check on the accuracy of the global scoreawarded. However, there is no published evidence tosuggest whether this practice was successful or not.
Accent1. Pronunciation frequently unintelligible.2. Frequent gross errors and a very heavy accent make
understanding difficult, requires frequentrepetition.
3. "Foreign accent" requires concentrated listening andmispronunciations lead to occasionalmisunderstanding and apparent errors in grammar orvocabulary.
4. Marked "foreign accent" and occasionalmispronunciations which do not interfere withunderstanding.
5. No conspicuous mispronunciations, but would not betaken for a native speaker.
6. Native pronunciation, with no trace of "foreignaccent".
Grammar1. Grammar almost entirely inaccurate except in stock
phrases.2. Constant errors showing control of very few major
patterns and frequently preventing communication.
21

3. Frequent errors showing some major patternsuncontrolled and causing occasional irritation andmisunderstanding.
4. Occasional errors showing imperfect control of somepatterns but no weakness that causesmisunderstanding.
5. Few errors, with no patterns of failure.6. No more than two errors during the interview.
Vocabulary1. Vocabulary inadequate for even the simplest
conversation.2. Vocabulary limited to basic personal and survival
areas (time, food, transportation, family, etc.).3. Choice of words sometimes inaccurate, limitations of
vocabulary prevent discussion of some commonprofessional and social topics.
4. Professional vocabulary adequate to discuss specialinterests; general vocabulary permits discussion ofany non-technical subject with some circumlocutions.
5. Professional vocabulary broad and precise; generalvocabulary adequate to cope with complex practicalproblems and varied social situations.
6. Vocabulary apparently as accurate and extensive asthat of an educated native speaker.
Fluency1. Speech is so halting and fragmentary that
conversation is virtually impossible.2. Speech is very slow and uneven except for short or
routine sentences.3. Speech is frequently hesitant and jerky; sentences
may be left uncompleted.4. Speech is occasionally hesitant, with some
unevenness caused by rephrasing and groping forwords.
5. Speech is effortless and smooth, but perceptiblynon-native in speed and evenness.
6. Speech on all professional and general topics aseffortless and as smooth as a native speaker's.
COmPrehension1. Understands too little for the simplest type of
conversation.2. Understands only slow very simple speech on common
social and touristic topics: requires constantrepetition and rephrasing.
22

3. Understands careful, somewhat simplified speechdirected to him, with considerable repetition andrephrasing.
4. Understands quite well normal educated speechdirected to him, but requires occasional repetitionand rephrasing.
5. Understands everything in normal educatedconversation except for very colloquial or low-frequency items, or exceptionally rapid or slurredspeech.
6. Understands everything in both formal and colloquialspeech to be expected of an educated native speaker.
1.3.2 Critique of the [SI rating scalesThese descriptors are a mixture of linguistic and
non-linguistic criteria. There are undefined degrees ofaccuracy to be achieved for each level in each scale,mixed with references to the types of task or thesituation in which the student would be expected to be
able to operate outside the test situation. This mixtureof criteria is another aspect of the original FSIdescriptors which has been passed on to successivegenerations of oral rating scales, and is frequentlycriticised (Matthews, 1990). If prediction from a testsituation to a wider number of non-test situations is thepurpose of the oral test, then it is essential that therating scale contain descriptions of those skills orabilities which researchers can demonstrate underliesuccessful performance across a range of situations, orto specify tasks or situations which could bedemonstrated to allow generalization to other tasks orsituations. To include descriptions of the task orsituation in the rating scale immediately limits the
23

generalizability of the oral test result to similarsituations, and hence undermines one of the primepurposes of testing.
Each of the scales assumes linear development inlanguage proficiency from zero to perfect, native-speakerspeech. Each band represents an increase in the accuracyof the language used, with similar modifiers being usedin each rating scale. As we are primarily concerned withaccuracy and fluency (see page 115), the grammar andfluency scale will be considered in a little more detail.
The grammar scale appears to hinge around theprogression of modifiers from "constant", to "frequent","occasional" and "few" errors. At band 1 grammar is"entirely" inaccurate and at band 6 we expect "no morethan 2 errors" - a specific number, the choice of whichdoes not seem to have been justified. Nowhere is itsuggested what kind of errors typify each band, and thereis no indication that the scale is linked to anyconsideration of a sequence in which students acquirecertain grammatical forms. The reference to "majorpatterns" in band 2 may seem to suggest that the authorsof the scale did have some notion of the grammaticalforms that they would expect to occur in earlier andlater bands, but these are not listed or described.
The situation is similar with the FSI fluency ratingscale. In band 1 we are told that "conversation isvirtually impossible" while in the last band it is "aseffortless and smooth as a native speaker's". The
24

concepts which dominate the bands between the extremesare those of speed of delivery, hesitation and"unevenness", modified by "very", "frequently" and"occasionally" in bands 2 to 4. These concepts are notdefined: speed of delivery may vary considerably amongnon-native and native speakers of a language, andunevenness appears to be linked to "rephrasing andgroping for words", something which appears to befrequent in native speaker speech (Fulcher, 1987). Thenature of hesitation and its causes do not seem to havebeen investigated, and without a theory underlying thepossible reasons for hesitation it would seem unlikelythat the concept could be applied in such a linearfashion to non-native learners.
As the FSI provides the model which many otherrating scales have adopted, these concepts, despite beingpoorly defined, have found their way into most other oralrating scales produced since the FSI with little or nochange. The problem has been that the descriptors werewritten without consideration of the way in whichstudents actually speak or the way in which competence ina language develops~ that is, they appear to be "a-priori" or "armchair" scales, produced by the scalewriters from their intuitive judgement of how languagecompetence develops and how this competence is used in aperformance test.
25

1.3.3 The ILR rating scaleThe ILR rating scales were produced in 1968 in the
attempt by various Government agencies to standardizetheir procedures. The ILR rating scale contained 6 bands,with plus points at 0, 1, 2, 3, and 4, giving 11 possiblelevels of proficiency. The "Capsule Characterisations" ofthese levels is provided by Lowe (1985a: 14) as follows:
Level 0: No functional abilityLevel 0+: Operates with memorized material, and shortlists.Levell: Survival. Consistently creates with thelanguage. Tends to operate in the present time. Usesshort sentences.Level 2: Concrete. Operates in past and future as well aspresent time. Can use paragraphs (combining sentencesinto limited connected discourse).Level 3: Abstract. Thinks in the target language.Supports opinions and hypothesizes. Handles unfamiliarsituations and topics. Can use organized discourse.General vocabulary is controlled with only sporadicerrors in basic grammar, but with some errors in frequentcomplex structures and more errors in low-frequencycomplex structures. Can use colloquial and careful formalspeech.Level 4: Representation. Tailors language to suit theaudience. Discourse is well organized and a controlleduse of synonyms.Level 5: Educated Native. Functions equivalent to a well-educated native speaker. Absolutely appropriate discoursein a wide range of contexts from colloquial to carefulformal speech.
The scale begins with no ability and ends withnative-speaker ability, although there are a number ofadditional assumptions made: that present tenses are used
26

before past and future, that control of discourse beginswith the ability to use paragraphs (band 2) - althoughwhat a "paragraph" is in speech is not explained, thatthe ability to use colloquial and formal speech is afeature of band 3 - although we are not told which ofthese is used prior to band 3, and finally that awarenessof audience and the puzzling "use of synonyms" is afeature of band 4. As in the FSI scale, precisedefinition of terms is avoided, although there is someindication as to why this is the case. Lowe (1985a: 15)claims that the ILR rating scale was developed on thebasis of Gestalt psychology, arguing metaphorically thatone does not have to test the soil to tell that you areon a mountain: one need only rely on the overall shape ofthe terrain. At least one question is whether or not theILR descriptors do actually describe the terrain!
1.3.4 The ACTFL/ETS rating scaleThe ACTFL oral rating scale, described by Lowe
(1987) was specifically designed with a larger number oflevels in order to discriminate more accurately betweenstudents in non-government settings at the level below2/2+ following the studies by Carroll (1967) and the ETS(see page 15 above). Figure 2.4 on page 28 is taken fromLowe (1983: 232) and demonstrates how the ACTFL levelsrelate to the ILR rating scale.
The categories at the lower end of the continuumhave been expanded to increase the amount of
27

discrimination possible, while at the higher end all thecategories from S-3 upwards have been collapsed into thesingle category "superior".
Fig. 2.4. A comparison of the ILR and ACTFL ratingscales.
ACTFL54+43+3
Superior
2+2
Advanced PlusAdvanced
1+1 (strong)1 (weak)
Intermediate HighIntermediate MidIntermediate Low
0+o (strong)o (weak)
Novice HighNovice MidNovice Low
The descriptors used to define the ACTFL levels aregiven here in full from the ACTFL Guidelines (1986).
Novice: The Novice level is characterized by an abilityto communicate minimally with learned material.Novice Low: Oral production consists of isolated wordsand perhaps a few high-frequency phrases. Essentially nofunctional communicative ability.Novice Mid: Oral production continues to consist ofisolated words and learned phrases within verypredictable areas of need, although quantity isincreased. Vocabulary is sufficient only for handlingsimple, elementary needs and expressing basic courtesies.utterances rarely consist of more than two or three wordsand show frequent long pauses and repetition ofinterlocutor's words. Speaker may have some difficultyproducing even the simplest utterances. Some Novice-Mid
28

speakers will be understood only with great difficulty.Novice High: Able to satisfy partially the requirementsof basic communicative exchanges by relying heavily onlearned utterances but occasionally expanding thesethrough simple recombinations of their elements. Can askquestions or make statements involving learned material.Shows signs of spontaneity, although this falls short ofreal autonomy of expression. Speech continues to consistof learned utterances rather than of personalized,situationally adapted ones. Vocabulary centers on areassuch as basic objects, places, and most common kinshipterms. Pronunciation may still be strongly influenced byfirst language. Errors are frequent and, in spite ofrepetition, some Novice-High speakers will havedifficulty in being understood even by sympatheticinterlocutors.Intermediate: The intermediate level is characterized byan ability to- create with the language by combi~ing and recombininglearned elements, though primarily 1n a reactive mode;- initiate, minimally sustain, and close in a simple waybasic communicative tasks; and- ask and answer questions.Intermediate Low: Able to handle successfully a limitednumber of interactive, task-oriented social situations.Can ask and answer questions, initiate and respond tosimple statements, and maintain face-to-faceconversation, although in a highly restricted manner andwith much linguistic inaccuracy. within theselimitations, can perform such tasks as introducing self,ordering a meal, asking directions, and making purchases.Vocabulary is adequate to express only the mostelementary needs. strong interference from nativelanguage may occur. Misunderstandings frequently arise,but with repetition, the Intermediate-Low speaker cangenerally be understood by sympathetic interlocutors.Intermediate-Mid: Able to handle successfully a varietyof uncomplicated, basic communicative tasks and socialsituations. Can talk simply about self and familymembers. Can ask and answer questions and participate insimple conversations on topics beyond the most immediateneeds; e.g, personal history and leisure-time activities.utterance length increases slightly, but speech maycontinue to be characterized by frequent long pauses,since the smooth incorporation of even basicconversational strategies is often hindered as thespeaker struggles to create appropriate language forms.Pronunciation may continue to be strongly influenced byfirst language and fluency may still be strained.Although misunderstandings still arise, the Intermediate-Mid speaker can generally be understood by sympathetic
29

interlocutors.Intermediate High: Able to handle successfully mostuncomplicated communicative tasks and social situations.Can initiate, sustain, and close a general conversationwith a number of strategies appropriate to a range ofcircumstances and topics, but errors are evident. Limitedvocabulary still necessitates hesitation and may bringabout slightly unexpected circumlocution. There isemerging evidence of connected discourse, particularlyfor simple narration and/or description. TheIntermediate-High speaker can generally be understoodeven by interlocutors not accustomed to dealing withspeaking at this level, but repetition may still berequired.Advanced: The Advanced level is characterized by anability to- converse in a clearly participatory fashion:- initiate, sustain, and bring to closure a wide varietyof communicative tasks, including those that require anincreased ability to convey meaning with diverse languagestrategies due to a complication or an unforeseen turn ofevents;- satisfy the requirements of school and work situations:and- narrate and describe with paragraph-length connecteddiscourse.Advanced: Able to satisfy the requirements of everydaysituations and routine school and work requirements. Canhandle with confidence but not facility complicated tasksand social situations, such as elaborating, complaining,and apologizing. Can narrate and describe with somedetails, linking sentences together smoothly. Cancommunicate facts and talk casually about topics ofcurrent public and personal interest, using generalvocabulary. Shortcomings can often be smoothed over bycommunicative strategies, such as pause fillers, stallingdevices, and different rates of speech. Circumlocutionwhich arises from vocabulary or syntactic limitationsvery often is quite successful, though some groping forwords may still be evident. The Advanced level speakercan be understood without difficulty by nativeinterlocutors.Advanced Plus: Able to satisfy the requirements of abroad variety of everyday, school and work situations.Can discuss concrete topics relating to particularinterests and special fields of competence. There isemerging evidence of ability to support opinions, explainin detail, and hypothesize. The Advanced-Plus speakeroften shows a well-developed ability to compensate for animperfect grasp of some forms with confident use ofcommunicative strategies, such as paraphrasing and
30

circumlocution. Differentiated vocabulary and intonationare effectively used to communicate fine shades ofmeaning. The Advanced-Plus speaker often shows remarkablefluency and ease of speech, but under the demands ofSuperior-Level, complex tasks, 1angauge may break down orprove inadequate.superior: The Superior level is characterized by anability to- participate effectively in most formal and informalconversations on practical, social, professional, andabstract topics; and- support opinions and hypothesize using native-likediscourse strategies.Superior: Able to speak the language with sufficientaccuracy to participate effectively in most formal andinformal conversations on practical, social,professional, and abstract topics. Can discuss specialfields of competence and interest with ease. Can supportopinions and hypothesize, but may not be able to tailorlanguage to audience or discuss in depth highly abstractor unfamiliar topics. Usually the Superior level speakeris only partially familiar with regional or otherdialectical variants. The Superior level speaker commandsa wide variety of interactive strategies and shows goodawareness of discourse strategies. The latter involvesthe ability to distinguish main ideas from supportinginformation through syntactic, lexical, andsupraseqmental features (pitch, stress, intonation).sporadic errors may occur, particularly in low-frequencystructures and some complex high-frequency structuresmore common to formal writing, but no patterns of errorare evident. Errors do not disturb the native speaker orinterfere with communication.
The ACTFL scale is marked by an increase in theamount of information which is provided for the rater,but the lack of detailed explanation of the terms used orpotential exponents in actual speech continues to be amark of the prose descriptions. No empirical evidence isavailable to confirm that new criteria introduced intothe rating scale such as "discourse", "interactive" or"communicative" strategies do discriminate between thestudents at the proposed ability levels where these
31

occur. Indeed, Lowe (1985a: 16) states that "the use ofthe system remains implicit" which seems to imply thatthe descriptors as they stand must be interpreted by eachreader, although rater training is essential for anypractical use of the scale. Finally, we make theobservation that the mixture of linguistic and non-linguistic criteria is increased in the ACTFL scale,indicating task type and topic area which may be dealtwith at a given level of ability. This confusion ofcriteria has been severely criticised (Bachman andSavignon, 1986; Matthews, 1990) as it makes validationstudies extremely difficult. We will return to this issuewhen looking at validation procedures below.
1.4 DiscussionHaving described the development of, and presented
an introductory critique of the FSI, ILR and ACTFL ratingscales, the basis for most other oral rating scales, themain failings may be identified. Perhaps most importantis the fact that none of the scales have any "empiricalunderpinning" (Lanto1f and Frawley, 1985; Pienemann et.al., 1988: 218). Indeed, Lowe (1987: 46) admits thatthere have been few studies into the reliability andvalidity of the Oral Proficiency Interview and the ratingscales upon which the scores are awarded.
Investigation into the way in which students acquirelanguage, in terms of competence or performance, has notbeen taken into account in the construction of these
32

rating scales. Pienemann et. a1 (1988: 219) criticise inparticular the concept of "weaknesses" in the scale.
They argue that:
"Such descriptions are so vague and general asto be utterly unhelpful in distinguishing anysecond language learner from another. If "areasof weakness" can be construed to mean areas inwhich learners' usage does not conform to thestandard, then every language learner conformsto this description. Numerous research studieshave shown that learners do not suddenly11earn" a structure and begin to use itcorrectly 100% of the time •.••Even the mostadvanced of second language learners willtherefore display "weaknesses" in the areascited."
Similarly, Va1dman (1988: 121) argues that:
"•••it is fair to say that although the OPI(Oral Proficiency Interview) may beexperientially based, its theoreticalunderpinnings are shaky and its empiricalsupport scanty."
It is thus argued that without a sound empiricalbasis for initial rating scale development it makeslittle sense to investigate the validity of an oralrating scale post-hoc when results cannot be related toinitial hypotheses and constructs, and other confoundingfactors such as rater training have been introduced. Weagree with Jarvis (1986: 21) when he argues that:
33

"After-the-fact inquiry is unacceptable and hashistorically degenerated into little more thanvalidation of flawed systems."
In terms of the actual language produced by studentswhich could be classified at certain levels on the ratingscale, one example from the literature will be consideredbriefly. This particular example is not a transcript ofan actual interview, but a constructed dialogue toexemplify the difference between a Novice levelconversation and an Intermediate level conversation takenfrom Liskin-Gasparro (1984a: 480).
Novice Level Conversation:Teacher: Tell me about your family.Student: (Silence)Teacher: How many people are in your family?Student: Four.Teacher: Who are they?Student: Mother. Father. Brother. Me.Teacher: Tell me something about your brother.Student: (Silence)Teacher: How old is your brother?Student: 14.Teacher: What is his name?Student: John.
Intermediate Level Conversation:Teacher: Tell me about your family.Student: I have four people in my family. I have amother. I have a father. I have a brother.Teacher: Tell me about your brother.Student: My brother's name is John. He is 14. He playsfootball. He plays the violin.
It is claimed that this second example shows thatthe student has "crossed the all important threshold from
34

operating with memorised material and isolated words andphrases at the Novice level to creating with language atthe Intermediate level" (Liskin-Gasparro, 1984a: 481).
This is not particularly enlightening, asconstructed conversations produced post-hoc to justify a-priori rating scales in no way provide evidence tosuggest that the rating scale descriptors provide validcriteria to discriminate between students at differinglevels of ability. It could be countered that this ismerely an example and is relatively unimportant. However,as it is the only example available from the publishedliterature on the ACTFL rating scale, and no examples ofstudent speech appear to have been analyzed before therating scales were constructed and operationalized, itwould seem that this criticism is justified.
A further justification of the ACTFL rating scaledescriptors is found in the exposition of the FunctionalTrisection which was designed to provide the scale with afunctional/notional emphasis (Liskin-Gasparro, 1984b:35). The Functional Trisection has also been used byother researchers in oral testing, notably Adams et. al(1987) and Griffin et. al. (1988). However, theFunctional Trisection provides further evidence for thelack of an empirical basis to oral rating scaledevelopment in the confusion it generates as a post-hocrationale for the ACTFL rating scale. It is claimed thateach level in the ACTFL rating scale contains statementsabout what the students can do in three areas: (1) the
35

linguistic functions or tasks that a candidate canperform, (2) the context, or topics that can be handled,and (3) the degree of accuracy with which the messagewill be communicated or understood. In order to givecontent to these three "functions" five linguisticfactors are taken into account: grammar, vocabulary,fluency, pronunciation and sociocultural ability. Whetheror not the last of these is a "linguistic" factor is amatter for debate, but this is what is claimed. TheFunctional Trisection for levels within the ACTFL ratingscale is given below.
Level 0 (Novice categories are not separated)Function: No functional ability.Context: None.Accuracy: Unintelligible.Levell (Intermediate)Function: Can create with the language, ask and answerquestions, participate in short conversations.context: Everyday survival topics and courtesyrequirements.Accuracy: Intelligible to native speaker used to dealingwith foreigners.Leyel 2 (Advanced)Function: Able to fully participate in casualconversations, can express facts, give instructions,describe, report, and provide narration about current,past, and future activities.Context: Concrete topics such as own background, familyinterests, work, travel, and current events.Accuracy: Understandable to native speaker not used todealing with foreigners, sometimes miscommunicates.Leyel 3 (Superior)Function: Can converse in formal and informal situations,resolve problem situations, deal with unfamiliar topics,provide explanations, describe in detail, offer supported
36

opinions and hypothesize.context: Practical, social, professional, and abstracttopics, particular interests, and special fields ofcompetence.Accuracy: Errors never interfere with understanding andrarely disturb the native speaker. Only sporadic errorsin basic structures.
Leyel 4 (Superior)Function: Able to tailor language to fit audience,counsel, persuade, negotiate, represent a point of view,and interpret for dignitaries.context: All topics normally pertinent to professionalneeds.Accuracy: Nearly equivalent to an educated native speaker(ENS). Speech is extensive, precise, appropriate to everyoccasion with only occasional errors.Leyel 5 (Superior)Function: Functions equivalent to an educated nativespeaker.context: All subjects.Accuracy: Performance equivalent to an educated nativespeaker.
In this description, functions are defined as thetasks accomplished, attitudes expressed and the toneconveyed. context refers to topics, subject areas,activities and jobs addressed. Accuracy is theacceptability, quality and accuracy of the messageconveyed.
It seems from the descriptions above that there is aserious mismatch between the Functional Trisection andthe oral rating scale it was designed to defend. TheNovice descriptions (especially Novice High) do notcorrespond with either the description in the ratingscale or the example of constructed speech provided byLiskin-Gasparro to exemplify the kind of language Which
37

might be expected from a student at this level. Further,the Superior level is broken down into three sectionswithin the Functional Trisection implying that theserepresent a linear development in language proficiency,whilst in the rating scale the Superior category is notbroken down into subcategories. It would therefore appearthat the Functional Trisection as a post-hoc theoreticaljustification of the ACTFL rating scale is largelyirrelevant.
Despite the problems which have been discussedabove, the model of language learning assumed by theACTFL/ETS/ILR rating scales (often shortened to AEI), inwhich very little progress in learning the language isneeded to gain a higher band in the early levels and muchmore progress needed to register improvement in the laterlevels (Lowe, 1985a: 21), has become the basis for awhole approach to language teaching and testing. This isknown as the Proficiency Movement, and the wideacceptance of the principles of the movement constitute astrong claim for the validity of the AEI rating scales.
Thus, Lowe (1987: 47) claims that
"Its [the AEI model of language acquisition asrepresented in the band descriptors of therating scale] ultimate utility may lie beyondtesting per se in its effect on curriculum. Inthis case, teaching for the test - teaching forgeneral functional foreign language ability -is not to be discouraged."
38

The strong form of this argument is that "testingdrives curriculum" (Lowe, 1983: 238 - 239). similarly,Liskin-Gasparro (1984b: 35) claims that the ACTFLGuidelines are the first step in
"creating proficiency-based curricula thatrespond to the need of the profession to definewhat students should be able to do with thelanguage at various stages in the learningprocess."
However, limits to the usefulness of teaching to thetest and positive washback effect on curriculum have beenset. While accepting the importance of the ACTFLGuidelines for oral testing, Brown (1985) has argued thatthe ACTFL global rating scale cannot be used forevaluation in the classroom as it does not provideadequate informative feedback to the learner or thestudent. Similarly, Liskin-Gasparro (1984a: 486) writesthat:
"•••it is important to remember that the ACTFLGuidelines are not curriculum outlines, nor arethey prescriptions for what grammaticalstructures to teach and when. They are agraduated sequence of proficiency states aroundwhich a foreign language program may bestructured. The day-ta-day activities thatconstitute the sequence of small steps in thecontext of the larger phases identified by theGuidelines, as well as the methods to be used,are still and always will be the province ofthe foreign language teacher."
39

Although limits are placed on the usefulness of theGuidelines in the classroom, this latter quotationamounts to a claim that the AEI band descriptors in theoral rating scales represent the way in which students doactually acquire language, and are valid from thisperspective (Barnwell, 1987; Pienemann et. al. 1988). Thewide acceptance of this claim has meant that languagecourses are often based around the ACTFL leveldescriptors (Magnan, 1986a: 429) and the oral proficiencyinterview elicitation techniques and tasks for eachability level used as teaching techniques (Magnan,1984b). Clark (1988a) argues that washback from the AEIapproach to oral testing has changed the way in whichlanguage is taught, introducing realistic communicativeactivities into the classroom. Once again, it must beemphasised that there is no evidence upon which to judgethe claims made for the AEI rating scales, and wideacceptance of the rating scales in practice does not inany way constitute an argument for validity.
In conclusion to this section, we may claim thatalthough the tradition of oral testing in the unitedstates has been longer than that of other countries andhas generated many of the important questions whichremain to be answered by researchers, the speed withwhich tests have been operationalized and validated post-hoc has been somewhat unhelpful in the process oflearning more about the validity of rating scales andtheir relationship to any hypothesized reality external
40
to themselves.In section 2 we turn to look at what research has
been conducted into reliability and validity of oralrating scales, assessing both the tradition of the Unitedstates and work carried on in other countries where it isrelevant.
section 2. Issues in reliability and validity in oraltesting.2.1 Reliability in oral testing2.1.1 Evidence from the United states
Lowe (1987: 46) acknowledges that there have beenfew studies into the reliability and validity of the Oralproficiency Interview (OPI) and the rating scales uponwhich the scores are awarded, but refers to theexperience of assessors with the use of the OPI and thesuccessful placement of Government personnel over a longperiod of time as justification for procedures used. Lowe(1986: 394) states that
"The ILR approach has permitted successful useof the WENS (well educated native speaker)concept as the ultimate criterion in governmentfor over thirty years.1I
wilds (1975) had already put forward the sameargument. Above all, the tradition of AEI evaluation mustcontinue unbroken (Lowe, 1986: 396). The point being madeis that the top band in the scale is a fixed pointcapable of description, to which lower bands may be
41

sequentially linked, and raters are capable of reliablyusing such a rating scale because of their understandingof this fixed criterion.
This is the experiential claim for reliability whichis common to much work on oral testing both within theAE! approach and elsewhere.
One study which is constantly referred to within theliterature is that of Adams (1978) on inter-raterreliability. This single study is cited as justificationmore often than not for the reliability of all forms ofthe OPt and associated rating scales, as it was foundthat agreement between two raters was consistently in theorder of .87 or higher. Liskin-Gasparro (1984a: 483)appeals directly to Adams' study in defence of thereliability of the ACTFL, even though the raters were notusing the same scales. This is surely unjustified.
However, it is generally claimed in the literaturethat high inter-rater reliability is not difficult toachieve in oral tests. One researcher who disagrees withthis view, but provides no evidence in support of hisopinion is Harrison (1982: 2). Even Barnwell (1987: 36)who is a critic of the AEI agrees that high raterreliability has been demonstrated. Barnwell (1986), forexample, reports a study in which 7 teachers of spanishwere provided with "brief" training in the use of theACTFL rating scale and then asked to rate students fromvideo recordings of OPIs. 41% of grades were exactly thesame as actual ACTFL scores, 45% were within 1 band and
42

14% 2 or more bands away. Barnwell concluded that thisevidence shows that even untrained raters can reachacceptable levels of agreement.
Mullen (1978b) conducted a study in which two judgesand four rating scales were used on two groups ofstudents. Each judge rated both groups of students oneach of the scales, and it was found that there was nosignificant difference in the mean scores of the twogroups, the judges, or the operation of the scales.Variance was primarily attributable to the differencebetween students, although a small interaction effect wasfound between judge and scale, and judge and student.Mullen concluded that inter-rater reliability was highwhen two judges were used, something which is commonprocedure in the FSI and AEI oral tests. These findingsare supported by Clark (1975: 16 - 17) and Clark andswinton (1980a). In the latter study however, the resultsappear to be inconclusive. The scores of two raters on 94students across the five factors of the FSI were used toassess inter-rater reliability. The correlationcoefficients are contained in Table 2.1 in the Appendixto Chapter 2. Clark concluded that the FSI was a reliablemeasure of spoken English. However, it would appear thatsome of these correlations are unacceptably low, the onlycorrelation to reach .8 being that on grammar. Clark'sconclusion does not seem to be justified.
Hendricks et. al. (1980) report an inter-raterreliability study in which an FSI-type procedure was
43

used, although no linguist was available to do therating. 182 students from the University of SouthernIllinois were tested, and taped interviews rated by twoteams of raters made up from a pool of one instructor andthree graduate assistants. The correlation coefficientsare presented in Table 2.2 in the Appendix to Chapter 2.Here, inter-rater reliability is acceptable in all butthe assessment of accent. The global score appears to behighly reliable. But it must also be noted that in thisstudy the assessment was carried out by teams of ratersworking together rather than individuals, and this wouldprobably have had the effect of inflating thecorrelations. As such, the results must be treated with acertain amount of caution.
From studies of inter-rater reliability Mullen(1980) argued that two raters are required in any oraltest, as individual raters tend to have differentpatterns of rating. The low correlations in Clark andswinton's study (1980a) are an indication of this,whereas with multiple raters Hendricks et. al. (1980)produced much higher correlations. Indeed, mostinvestigations of reliability in oral testing recommendthe use of at least 2 raters (de Charruf, 1984) in orderto avoid the possible effect of the rater as test bias,and also increase reliability.
We also note that the Pearson Product Momentcorrelation is reported as an inter-rater reliabilitycoefficient in all these studies, and this statistic does
44

not take into account rater severity. Bejar (1985) arguedthat although there is often sUbstantial agreement in thesequencing of students by raters, and hence highcorrelation coefficients, the severity of raters differswidely. Multiple raters would therefore seem to be
essential to provide a correction facility for varyingrater severity.
Lowe and Liskin-Gasparro (1986a: 4) claim inter-rater reliability for the OPI to be within one plus pointon the rating scale when using trained raters. In thelight of the other studies reviewed here, this does notseem to be an unreasonable claim as long as multipleraters are used. A series of studies conducted by Shohamyalso serve to bear this out. Shohamy (1983a) reports astudy in which a team of judges were asked to raterecorded tapes of interviews with 106 students of Hebrewat the University of Minnesota. Four weeks later 32 tapeswere randomly selected for re-rating. Inter-raterreliability was found to be .99. A similar study(Shohamy, 1983b: 535) found inter-rater reliability to be.93.
Barnwell (1989) conducted an inter-rater reliabilitystudy using the ACTFL rating scale to see if nativespeakers of Spanish reacted to foreign languageproficiency in their language in the way predicted by therating scale. Although this procedure had been suggestedby Byrnes (1987) as a potential method of validating theACTFL rating scale, Barnwell points out that the scale
45

was developed intuitively, and not in relation to actualnative speakers, and so Barnwell hypothesized that inter-rater reliability between native speakers and ACTFLraters would be low. Barnwell taped four students doingan OP! and asked 14 native speakers of Spanish with aminimum of training in the use of the ACTFL rating scaleto rate them. Barnwell found that the four students wereplaced in the same order of ability by all raters, butthat three out of the four students were given vastlydifferent band ratings by the native speakers and thetrained ACTFL raters. The training of the ACTFL raterswould appear to have influenced the way in which theyrate, as predicted by Alderson (1983).
Having realised that the correlation coefficient initself is not sufficient to claim reliability, Barnwellconcludes that:
"•••it appears from the present study that theoperational descriptions for each ACTFL/ETSlevel are not in themselves self-sufficient orself-explanatory: they can mean differentthings to different people. The scale's limpidlogic is not immediately visible to theuntrained eye."
Clark (1988a: 17) refers specifically to the "fine-grained" ACTFL descriptors and wonders whether or notthey have any "real world validity" in that theyrepresent "true differences in communicative performanceas far as native-speaker interlocutors are concerned". Herecommends the kind of research which Barnwell has
46

conducted, stating that only if naive native listenerscould perceive the differences in levels clearly couldone have a great deal of confidence in the ACTFL banddescriptors. It is noted here that Barnwell does seem tohave provided some limited evidence to indicate that itmay not be possible to meet the conditions which Clarkhas set out.
2.1.2 Evidence from other countriesA question which remains to be asked is whether or
not research with tests in other countries tends toconfirm the general findings of high inter-ratercorrelation coefficients of researchers within the AEItradition.
Reliability studies carried out with other oraltests tend to bear out the claims of high reliabilitymade by researchers working within the AEI approach, atleast as far as the correlation coefficients areconcerned. (It may of course be the case that lowcorrelation coefficients are not published!) Whenreporting on the development of a new oral test for usein schools in Israel, Shohamy, Reves and Bejarano (1986:212) state that low reliability remains a problem in oraltesting, and go on to describe four experimental tests(an oral interview, a role-play exercise, a reportingtask and a group discussion), providing inter-raterreliabilities as .91, .76, .81 and .73 respectively. Thevery high correlation coefficient for the oral interview
47

is not uncommon, although the reliability coefficientsfor the role-play exercise and the group discussion arelow. A similarly high figure is reported for the ASLPRinterview procedure, for example (Ingram, 1982: 26; 1985:249).
Morrison and Lee (1985) report on an oral test whichwas a simulation of an academic tutorial developed atHong Kong University. The tests were videotaped and eachstudent rated by a mixture of native and non-nativespeakers on a 5 band scale for the factors of generalproficiency, use of grammar, pronunciation, fluency,communicative ability and academic potential. Inter-raterreliability was quoted as .85 with no significantdifference between the rating behaviour of native andnon-native raters.
Jafarpur (1988) used an FSI-type oral interview atShiraz University, Iran, on which 3 judges rated 58students on the five FSI factors. Inter-rater reliabilitywas reported as lying between .58 and .65, and Jafarpurconcluded that there was a significant difference betweenthe rating patterns of the 3 judges. Although this resultdiffers from that of Morrison and Lee, it must be saidthat the correlation coefficient provided by the latterwas for EFL teachers whilst the results reported byJafarpur are for subject teachers. This fact couldexplain the different results.
However, we may conclude from the published evidenceregarding inter-rater reliability that this form of
48

reliability is fairly easy to achieve when using multipletrained raters, whereas reliability figures appear todecrease in magnitude when untrained raters and untrainednaive native raters are used.
2.1.3 Reliability and rater trainingBarnwell (1989) suggests that the phenomenon of
higher inter-rater reliability coefficients when usingtrained raters and lower coefficients when usinguntrained raters can be accounted for by the fact thattrained raters undergo a period of "socialization" duringwhich they begin to see language proficiency in terms ofthe scale which they are using. By constant operation ofthe scale a high degree of reliability is achieved.Wilkinson (1968: 126) had previously argued in a similarrather pessimistic vein that high inter-rater reliabilitycould only be achieved when the assessors hold similarviews about the nature of speaking. The process of ratertraining, the socialisation into a common view of spokenlanguage, is described by Alderson (1991b: 64) as"cloning."
It would appear from this discussion that Bachman'sview (1988: 150) that the issue of reliability in oraltests is not a problem is unjustified. It is a problem ifyou do not have it, and it is a problem for validitystudies if you have it at the expense of rater training,or "cloning". That is, rater training assumes the scaleto be valid and that training raters to use it in live
49

testing situations is legitimate. Validity must, however,be established before raters are trained to use a ratingscale. Failure to establish validity prior to ratertraining would introduce the training itself as a testmethod facet which could not be separated from the traitwhich the rating scale is supposed to measure. The fusionof trait and test method facet in this case wouldpreclude the possibility of convincing post-hocvalidation, whether the rating scale were valid or not.
2.1.4 A methodological note on reliability studies; somerecent developments
The studies which have been reviewed above haverelied, as has already been noted, on correlationcoefficients. These do not take into account raterharshness, as noticed in the Barnwell study (1989), andtherefore high correlation coefficients cannot be used assufficient evidence to claim reliability (Krzanowski andWoods, 1984). A number of recent studies have used muchmore powerful methods to investigate inter- and intra-rater reliability, particularly Rasch Partial Creditmodels. Multi-faceted models in particular (Linacre,1991) provide tools which can fully take advantage ofdevelopments in the theory of test method facets(Bachman, 1990). Many of the limitations of previousreliability studies can now be overcome.
An example of recent research which has attempted toovercome these methodological limitations is that of Lunz
50

and Stahl (1990a), who examined the scores given to 270medical students by 46 judges on 3 tests, one of whichwas an oral interview. The oral test was conducted onthree separate occasions. The computer program Facets(Linacre, 1990) was used to analyze the data, whichrevealed variation in judge severity and an interactioneffect between judge and time of interview. However, fitstatistics did show that judges were generally internallyconsistent despite this variation. Lunz and stahl (1990b)also used the same method to investigate the ratings of293 students by 48 judges on an oral test, and found thatwhilst there was wide variety between judges, each judgewas internally consistent. This finding tends to confirmthe results of Bejar (1985), and provides supportingevidence for the view that if intra-rater reliability canbe established, lack of inter-rater reliability can bedealt with in other ways (Alderson: 1991b).
2.1.5 ConclusionsFrom the work reviewed on reliability in oral
testing a number of important issues have emerged.Firstly, work on reliability suffers from
methodological limitations such as the reliance oncorrelations which were often not recognized when thestudies were conducted. It is therefore important that inany future consideration of reliability new tools andmethods must be used, especially tools which may accountfor the influence of test method facets on any
51

consistencies noted in the correlation coefficients.Secondly, high inter-rater reliability appears to
depend upon the degree of rater training or raterssharing views of the nature of language proficiency. Theprice to be paid for achieving high reliability throughrater training is to make validation studies of ratingscales impossible, as validity is assumed by ratertraining. It is therefore important that raters are nottrained when rating scales and testing procedures arebeing developed and their validity examined, but onlyafter validity studies have been carried out. Ratertraining would be introduced only immediately prior tooperationalization.
Thirdly, the temptation to assume reliability andbegin using a testing system prior to the appropriatereliability and validity studies being carried out shouldbe avoided.
2.2 validity in oral testingIt has been claimed that there is a tension between
reliability and validity (Underhill, 1982). Achievinghigh reliability in a test is said to be dependent uponusing a rating procedure which is as close to theobjectivity of the "correct answer" in a well designedmultiple choice question as possible. In this case therating procedure is mechanistic and does not involve thepersonal judgement of the rater at all. On the otherhand, more open tasks such as an oral interview depend
52

upon rating scales which involve the judgement of arater, and scores may vary between raters (inter-raterreliability) and between the scores awarded by aparticular rater to a given student at different times(intra-rater reliability). The argument appears to bethat the higher the reliability through control ofpossible responses and the rating procedure, the lessvalid the test, whereas the higher the validity throughcreating a "realistic" or "authentic" task the lower thereliability of the rating scale and its use.
In this study, the view is taken that this is afalse polarity. It has become axiomatic in the testingliterature that reliability is a prerequisite to validity(Bachman and Palmer, 1982: 458; stevenson, 1981: 47),although Davies (1990: 22 - 23) warns that consistency initself is "trivial" if the consistency is a function oftest method facets. What matters is that the reliabilitycoefficient is an accurate estimation of the consistencywith which a trait is being measured. Thus, if the oralrating scales developed in this study turned out to havelow reliability coefficients, it would make little senseto proceed with validation studies as the rating scalescould not be used to measure anything. If, however, therating scales are seen to be reliable, the validitystudies may be undertaken to assess the degree to whichthose rating scales can be seen to be measuring theintended trait. Rather than reliability and validityoperating in some kind of polar relationship to each
53

other, it is argued here that they are both essentialcomplementary ways of asking important questions aboutoral rating scales.
2.2.1 Validity claims and some empirical evidence.The issue of validity in relation to the FSI and AEI
oral rating scales illustrates most of the problems whichare currently faced by researchers in the field of oraltesting. As in the case of reliability, most of theavailable published work on validating oral rating scaleshas been done within the FSI and AEI tradition. However,it will be seen in what follows that much of thediscussion centres around the face validity of the actualtesting procedure. In this, it must be remembered thatthere is a clear implication that the rating scales (andthe band descriptors) used in the testing procedure arevalid in that they accurately describe the speakingability of the students.
The main argument presented in support of thevalidity of the FSI testing procedure and its associatedrating scale was that it was valid on the grounds that noother testing instrument existed which met the particularneeds for which it was developed (Wilds, 1979: 11 - 12).wilds maintained that the validity of the FSI was"unquestionable" because the oral interview was basedupon a demonstration of speaking ability in a "naturalcontext" related to living and working abroad, and thatthe rating scale used in the scoring procedure described
54

that speaking ability. Face validity, defined as "thedegree to which students feel they are performing a realcommunicative act" (Bartz, 1979), was thereby pushed tothe fore in discussions of validity.
The claim to validity, which is essentially facevalidity, has three related aspects: (a) the oral(interview) test is direct (Clark, 1975: 14); (b) itinvolves a natural context and real life tasks whichproduce natural conversation; (c) the rating scaledescribes distinguishable levels of speaking abilitydemonstrated in the test. The first of these threeaspects has been severely criticised on the grounds thatno test can be direct: any test aims to elicit a speechsample which provides evidence of underlying competenceor ability (Bachman and Savignon, 1986: 382 - 383). Thesecond aspect has been questioned on the basis of studiesof "interview talk" which suggest that the interviewgenerates a special "genre" of language different fromnormal conversational speech (silverman, 1976; MacPhail,1985; van Lier, 1989; Perrett, 1990). The thirdassumption, that the rating scale does describedistinguishable levels of speaking ability, has beenquestioned on the basis of analysis of actual speech incomparison to band descriptors (Fulcher, 1987; Fulcher1989; Perrett, 1990: Matthews, 1990) and the scalabilityof the bands of the rating scale (Pienemann et. al.1988).
However, the basic position with regard to claims of
51

validity in oral tests does not seem to have changedgreatly, and proponents of so-called "communicative"language tests still make the notion of "real-life tasks"and "natural language" the touchstone of validity, withthe assumption that their rating scales do adequatelydescribe natural language use (Morrow, 1982: 56 - 57;Underhill, 1987). In fact, many writers merely argue thatthe use of real-life tasks ensures the use of naturallanguage, and assume that the rating scale in use in thescoring process does adequately describe natural languageuse. A claim to face validity is often all that is usedto defend an entire testing system including its ratingscale.
For example, in his review of the ILR Lowe (1987:46) claims to discuss issues of reliability, validity andpracticality. The single paragraph devoted to validitymerely claims high face validity because it requiresexaminees to use the spoken language. Barnwell (1987: 36)goes as far as to say that the FSI and its descendantsrely entirely on claims of face validity. It is notsurprising to find that testers such as stevenson (1981;1985a; 1985b) who reject the use of face validity as thesole evidence for evaluating oral tests are criticised bythose who espouse a "common-sense" non-technical approachto oral testing (Underhill, 1987).
Lowe (1983: 235) argues that the OPI maintainscontent validity because the questions posed by theinterviewer reflect real-life situations, whereas Lowe
56

and Liskin-Gasparro (1986: 4) claim that the OPI ishighly face valid because it involves real conversationand the rating scales have content validity because ofthe use of descriptors for each proficiency level withinthe rating scale. This statement is not fully explained,but we may take it that it represents a claim to thepsychological reality of the scale. As we have seen,Pienemann et. al. (1988) and Barnwell (1987: 1989) havecast doubt upon this claim.
However, the most common defence for the validity ofan oral test and its rating scale is that of experience.Liskin-Gasparro (1984a: 483) uses this argument, but itsstrongest expression is found in Lowe (1986: 392) writtenin response to criticisms by Kramsch (1986b) and Bachmanand Savignon (1986). Lowe writes:
"The essence of the AEI proficiency lies not inverbal descriptions of it, but in its thirty-year-long tradition of practice - makingtraining in AEI proficiency testing adesideratum."
Lowe proceeds to argue that those who question thevalidity of the AEI rating scales do so because they arenot among the AEI "adepts". It is only they who have beentrained in the system and understand the words on thepaper. Those who have not been trained are incapable ofunderstanding the rating scale.
In the preceding discussion it can be seen that twothemes run through the debate. One is the validity of the
57

interview itself, that is, the tasks which the studentsare asked to do. The second is the claim that the ratingscale, the scoring part of the process, is a validdescription of levels of ability. Similar arguments areproduced for both aspects of the testing process. We wishto look at what empirical evidence has actually beenpresented regarding the second issue concerning therating scales, which is the primary focus of this study.
Magnan (1986a) and Meredith (1990) go someway towardproviding evidence for validity by group discriminationfor the AEI oral testing procedure which, whilstimportant (Clark, 1988a: 17 - 18), is a weak form ofvalidity which does not provide sUfficient evidence initself for any strong claims (see pages 315 - 316).
Magnan (1986a) describes a study carried out at theUniversity of Wisconsin to investigate the relationshipbetween the level of study and the level of proficiencyof French students as measured by the ACTFL rating scale,which was essentially an investigation of validity bygroup differences. 40 students, 10 from each level of theFrench program, were tested by a certified ACTFLinterviewer and the interviews taped and rated by twoindependent raters from the ETS. Inter-rater reliabilitywas reported as .72, which was not as high as Magnan hadhypothesized it would be.
Magnan discovered some overlap between ACTFL bandscores and level of study, which is presented in Table2.3 in the Appendix to Chapter 2. However, this overlap
58

could be accounted for by the amount of unreliability inthe testing process. Magnan (1986a: 431 - 432)justifiably concludes that there is, on the whole, ageneral relationship between years of study andproficiency ratings, except for the third and fourthyear, where she argues that the ACTFL scale is notsensitive enough at the higher levels.
Meredith (1990) repeated Magnan's study usingstudents of Spanish at Brigham Young University, andconcluded that the ACTFL rating scale, as it stands, is"a very blunt instrument." After trying to make therating scale more sensitive to years of language study,Meredith could only report a highest correlation of .57between ACTFL ratings and length of study (ibid., 294).
It could of course be the case that in these studiesthe assumption that students within each year are equalin ability is unjustifiable, and would have led to thenegative findings. Similarly, Meredith assumes thatproficiency increases in a linear fashion with length ofstudy, which is not obviously the case.
In a similar study, Adams (1980) attempted toinvestigate the relationship between the five factors ofthe FSI rating scale (fluency, comprehension, grammar,vocabulary and accent) and the final rating of thestudents. The ratings of 834 tests conducted during thesummer of 1978 in 33 languages were used in the study,which employed discriminant analysis in order toinvestigate the extent to which any factor was
59

significantly contributing to the final score at anygiven proficiency level.
Adams' results are presented in Table 2.4 in theAppendix to Chapter 2, which shows which of the fivefactors discriminate effectively at each level of the FSIrating scale. Although from Adams' results it would seemthat different factors do appear to be playing differentroles at each level of the scale, it is almost impossibleto relate the results theoretically to the FSI leveldescriptors, as the descriptors are simply too vague toallow this sort of analysis, especially as there does notappear to be any pattern to the factors whichdiscriminate at different levels. However, the idea thatdiscriminant analysis could be used in this way once thedescription of the data is specific enough may be auseful way of investigating the validity of ratingscales, or in rating scale construction. Multivariatetechniques of this kind do allow powerful analysis oftest data (Ross and Berwick, 1990).
Adams concludes that, as the FSI raters first recorda global score and then record the factor scores toexplain it, the study shows that at certain levels theyare more sensitive to different aspects of performance.This is used by Adams as an argument against the use ofuntrained raters as they cannot be aware of thecomplexity of the rating process in determining theproficiency of a student. Similar conclusions werereached in a study by Clifford (1980) along the same
60

lines. We must conclude that although Adams' work ispotentially of use to the study of validity of scoringprocedures and rating scales in terms of the ideas whichshe generates, her particular study does not add anythingto the evidence regarding the validity of the FSI becauseof the seemingly random distribution of thediscriminatory capacity of the five factors and theimpossibility of relating them theoretically to the leveldescriptors.
Hendricks et. al. (1980) present evidence to suggestthat the various component scales of the FSI do representindependent aspects of oral proficiency, but argue thatoral proficiency is a "unitary competence" which cannotbe subdivided. This would lead to the conclusion that thecomponent scales were not valid in themselves. Thisargument was based upon a Principal Components analysisof the ratings of two teams of judges using 64 students.Loadings on a g-factor were in the range of .79 to .87for all factors except for accent, which was .59(Hendricks et. al. 1980: 83).
However, it would be a mistake to take these resultsas having any relevance to oral rating scales in general,as the component scales are designed in such a way thatif a score of, say, 2 is given on one of the scales itwould be natural to give 2 on the others. It wouldactually be surprising if any other result had beengained, as the band descriptors encourage such crosscontamination. However, there is a further reason why
61

this work should not be taken as presenting evidence fororal ability being a unitary factor. The research wasconducted in 1976 - 1977, and was known as the CarbondaleProject. This was a follow-up study to a study conductedin 1976 by Oller and Hinofotis (Oller and Hinofotis,1980), which suggested that a g-factor could account forall variance in the speaking tests which they used. Oller(1979: 430 - 431) claimed that the research of callaway(1980), Mullen (1980) and the Carbondale Projectsupported the unitary competence hypothesis (Oller, 1979:441 - 455). The design faults of these studies have beenwell documented (Vollmer, 1983: Vollmer and Sang, 1983:Woods, 1983), and so the conclusions which were drawncannot be taken as generalizable.
Of continuing relevance is the work of Bachman andPalmer (1983). They observed that much of the validationresearch in oral testing was concerned with correlatingscores on oral rating scales with external criteriontests. The criterion was often the FSI as it was assumedto be valid. Bachman and Palmer pointed out that anassumption is not a demonstration of validity, and calledfor construct validation research into the FSI.
Using a Multitrait-Multimethod approach followingCampbell and Fiske (1959) and confirmatory factoranalysis after Joreskog (1969), Bachman and Palmeranalyzed the test scores on two traits (speaking andreading comprehension) measured by three methods (the FSIoral interview, translation and self-rating).
62

Reliabilities for the tests ranged from .85 to .99,and convergent validity from .46 to .97. For discriminantvalidity, 65% of the results satisfied the criterion forspeaking and 63% for reading. Method effect was found tobe prominent in the translation and self-rating methods,but not in the oral interview. The most important resultsfor the FSI were the findings that in the factor analysisit loaded most heavily on the speaking trait (.82) andhad the lowest loading on the method factor (.46).Bachman and Palmer (1983: 168) concluded that
.....the oral interview maximises the effect oftrait while minimising the effect of testmethod."
They felt confident that they had provided importantevidence for the convergent and discriminant validity ofthe FSI. It is not without significance that this studyis today quoted as one of the few which clearly providesevidence for the validity of the FSI oral interview, butis also taken, by implication, as providing evidence forthe validity of the AEI rating scales and testingprocedures also (Lowe, 1987: 46).
2.2.2 Concurrent validationConcurrent validation of oral tests and oral rating
scales allows investigation into (a) the relationship ofspeaking measures to those in other skill areas, and (b)the relationship between speaking measures.
63

The use of an external criterion in this way is,according to Messick (1989a: 45), a special form ofconstruct validity. That is, it would be expected thatmeasures which are claimed to tap the same trait willtend to converge whilst measures which are not claimed totap the same trait will diverge. "That is, the constructsrepresented in the test should rationally account for theexternal pattern of test correlations." convergentvalidity would appear to be an issue in studies where theelicitation techniques are different across two tests andthe rating scale held constant, even if the aim of apiece of research is to justify the use of an indirecttesting method in place of a direct method. Similarly,convergent validity of the rating scales is an issuewhere different rating scales are used, but where bothare designed to represent the same construct. In thissecond case, it must be assumed that one of the ratingscales has already been validated. In concurrent studieswhere scores on an oral rating scale are being comparedwith scores from a test on a different trait using thesame elicitation technique, divergent validity is beinginvestigated. However, conourrent studies which usedifferent scoring procedures and different elicitationtechniques are prone to be uninterpretable because of theconfusion between traits and method facets.
Such concurrent studies have been carried out usingcorrelational analysis, Factor analysis (Clark, 1975: 11:Anastasi, 1990, 166), and Multitrait-Multimethod stUdies
64

(Bachman and Palmer, 1981b, 1982, 1983: Dandonoli andHenning, 1990).
However, concurrent studies of oral tests do notseem to have provided the researcher with any significantdata upon which validity can be claimed. This wouldcertainly appear to be the case with the AustralianSecond Language Proficiency Rating scales (Ingram, 1985b:1990), where the ASLPR was correlated with theComprehensive English Language Test (CELT). The CELT is athree part test consisting of listening, structure andvocabulary (Oxford, 1987) and results on this werecorrelated with students' scores on the ASLPR scales(Ingram, 1984).
It could very well be claimed that the CELT is aninappropriate criterion as it does not allow thecollection of either convergent or discriminant evidence,but Ingram discovered a correlation between the ASLPRspeaking and CELT structure of .83 when using studentsfollowing courses in Australia. When using a differentpopulation of students in China the correlations weregenerally much lower (Ingram, 1985b: 249 - 250). It isnecessary for him to interpret this in terms of thedifference in the syllabuses\course types being followedin the two countries, thus introducing anotherconfounding factor into the picture of the validation oforal rating scales, namely that of teaching programme.Ingram's study in this respect was flawed, as he did notcontrol for or take into account previous exposure and
65

practice of the groups of students who were used in thevalidation study, as recommended by Hughes (1981: 177).Control for elicitation technique and scoring procedurebetween the CELT and the ASLPR was impossible, as theCELT does not contain an oral test.
Factor analytic studies have also dealt with directoral tests in comparison to tests of other skills usingpencil and paper elicitation techniques, providingevidence of divergent validity. Vollmer and Sang (1983:62) show for example that FSI interview scores load on adifferent factor from a cloze test, the TOEFL battery, atest of listening, structure and reading. The same istrue of the more recent concurrent validation study ofthe English Language Testing Service (ELTS), where thecriteria chosen were the English Proficiency Test Battery(EPTB) and the English Language Battery (ELBA). Criperand Davies (1988) acknowledge that the choice ofcriterion is a problem for assessing convergent validityof the oral rating scale of the ELTS test, and indicatethat although they had studied the relationship of theELTS oral test to the oral component of the Associationof Recognised English Language Schools oral test (ARELS)and the Test of English for Educational Purposes (TEEP),which are both SOPls in that they are tape mediated, therelationship was "surprisingly weak" (Criper and Davies,1988: 50). Unfortunately, Criper and Davies do notprovide figures to illustrate this conclusion. Rea andWall (1988: 58) reported correlations of ELTS - TEEP oral
66

components at .51 and ELTS - ARELS at .62 in a smallscale study which they had conducted. James (1988) whodeveloped the TEEP oral makes no comment on itsrelationship to other measures at all, either direct orsemi-direct.
Clark (1975: 19) could legitimately claim that theresearch necessary to investigate the relationshipbetween direct oral tests and indirect oral tests was"for the most part lacking." There was at least oneexception to Clark's generalization. Carroll (1967)compared the MLA Proficiency Battery (1965) with FSI-typeoral interviews in four languages, and producedcorrelation coefficients of between .66 and .82. A studyby Clifford (1978) which also used an FSI-type oralinterview and the MLA Cooperative Proficiency Test inGerman, producing a correlation coefficient of .83, wasthe only additional study which Clark could quote in 1979(Clark, 1979: 40). Clifford's study was repeated by Dugan(1988) using the MLA English test and an ACTFL OPI, inwhich moderate correlations in the region of .7 werereported.
cartier (1980: 8) reported correlations of .74 and.72 between the Defense Language Institute's Taped OralProficiency Test of Spanish (TOPT) and FSI interviews,and Lowe and Clifford (1980: 37) reported a correlationof .90 (using 27 students) in a comparison of theRecorded Oral Proficiency Examination (ROPE) developedfor TESOL, and the Central Intelligence Agency adaption
67
of the PSI Oral Proficiency Interview.By 1980 the reason for carrying out such concurrent
studies had become plain: there were many situations inwhich there was neither the time nor the resources toconduct direct oral interviews, which in the studiesmentioned above are considered to be superior to indirectoral tests. The motivation was one of practicality, themethod was concurrent validation to decide whether or notan indirect test could legitimately sUbstitute for adirect test, and hence strict control over facets whichwould allow the convergent or discriminant validity wasnot an important issue. Clark (1979: 48) for instance,states that:
"Semi-direct tests may be proposed as second-order substitutes for direct techniques whengeneral proficiency measurement is at issue butit is not operationally possible to administera direct test. In these instances, it isconsidered highly important to determine -through appropriate experimental means - a highlevel of correlation between the two types ofinstruments when used with representativeexaminee groups."
The position that semi-direct tests are "second-order substitutes" for direct oral interviews would seemto have changed very little since (Clark, 1988: 197,Clark and Lett, 1988: 13). despite considerable evidencethat correlations above .80 can be achieved fairlysystematically on well designed semi-direct tests of oralproficiency.
68

For example, the final version of the TSE wasvalidated against the FSI in a concurrent correlationalstudy (Clark and Swinton, 1980a), with correlationsranging from .73 to .77, as can be seen in Table 2.5 inthe Appendix to Chapter 2. In the third edition of theTSE Manual for Score Users (1990) the two researchreports of Clark and swinton (1980a and 1980b), and thecorrelation matrix in Table 2.5 are still quoted as theonly source of evidence for the validity of the TSE inthe section dealing with the psychometric character ofthe test. The magnitude of these correlations has beeninterpreted as meaning that an OPI is superior to a semi-direct measure which can only be shown to have moderatecorrelations with scores from face-to-face interviews.However, Clark and Lett (1988: 13) report on thedevelopment of semi-direct tests which are correlatedwith the ABI, descendants of the FSI, in whichcorrelations of .89 to .96 are quoted as validitycoefficients. This refers to the work of Clark (1986b),Clark and Li (1986) and Clark (1988b) in the developmentof a semi-direct test of Chinese.
It would not seem unreasonable to comment that thesestUdies beg the question of validity. It has been assumedthat the FSI Oral Proficiency Interview is valid becauseof its "direct" nature (see pages 54 - 56), and hencesafe to assume that reasonably high correlations betweena semi-direct test and an OPI mean that the semi-directtest is valid. However, the driving force of practicality
69

has meant that the key issue of establishing the validityof one measure before others can be compared with it hasbeen overlooked.
More recently, Davidson and Bachman (1990) lookedinto the relationship between the five FeE papers and theTest of English as a Foreign Language (TOEFL) as a partof a larger comparability study. In this case, the FCEoral test was compared with the rating components of theTSE in its institutional form, called the SpeakingProficiency English Assessment Kit (SPEAK), which is alsoa semi-direct tape-mediated test. They claimed to havefound evidence of a distinctive oral trait. Abraham andPlakans (1988) reported a concurrent study between theSPEAK and Non-native speaker teaching assistant abilityto speak English in the classroom at Iowa StateUniversity, and concluded that SPEAK was a goodpredictor.
The most recent work in concurrent validation hasbeen on the development of SOPIs (Stansfield, 1989), theaim of which is to model face-to-face communication asclosely as possible, pitched at the Intermediate,Advanced and Superior levels of the ACTFL Guidelines.Stansfield (1990a: 229) specifically refers to the workof Clark (1986b), Clark and Li (1986) and Clark (1988b)as the beginning of the development of the SOPI, whichinspired the development of the Portuguese Speaking Test(PST), in which correlations between the SOP! and the OPtwere found to be of the order of .93 (Stansfield, 1990b).
70

This led to the development of further SOPIs in otherlanguages including the Hebrew Speaking Test (HeST)(Shohamy, Gordon, Kenyon and Stansfield, 1989) whichproduced correlations of .90 (Israeli version) and .94(US Version) with the OPI (although Shohamy andStansfield, 1990: 87 report these as .89 and .93respectively, with a sample of only 20 students in eachcategory, whilst Shohamy, Shmueli and Gordon (1991: 6)confirm the second set of correlations but claim the useof 40 students!), and Indonesian and Hausa (Stansfieldand Kenyon, 1989). The Stansfield version of thesecorrelations is reproduced in Table 2.6 in the Appendixto Chapter 2.
Stansfield (1990a: 232 - 233) argues that becausethe SOPI uses the format of an OPI, and similar tasks:
"•••it seems time to reconsider Clark'scharacterization of semidirect tests as "secondorder substitutes" for the direct OPI. Whilethis characterization may be applicable tosemidirect tests in general, it does not seemto apply to the SOPI."
Advantages of the SOPI over the OPI are stated to beincreased reliability because of the removal of theinterviewer factor, the standardization of delivery andcontent, and the increased amount of language sampled(ibid., 232; Shohamy and Stansfield, 1990: 81 - 82).However, Shohamy, Shmueli and Gordon (1991) do in factreport that despite the much longer time spent on doing
71

the SOPI there was no significant difference in theamount of language sampled when compared with an OPI.
Shohamy, Shmueli and Gordon (1991) argue that thecorrelation coefficients in Table 2.6 were not inthemselves adequate to claim validity, and proceeded toexamine the SOPI in comparison to the OPI in terms offunctions and topics, linguistic errors and discoursefeatures from test data, and finally features of orality.In terms of functions, it is argued that high level OPIstudents are asked to perform more functions than wouldbe the case on a SOPI, but low and intermediate levelstudents would be faced with significantly more functionson the SOPI than the OPI. The same is observed withvariety of topic, with trivial topics being reserved forlow level students on the OPI, whilst in the SOPI allstudents are exposed to the same topics. shohamy et. al.see this as an advantage of the OPI, but this may not benecessarily true if task and topic affect anxiety oflower level students, as was found in this study (seepage 256). It could well be that the non-adaptive form ofthe SOPI induces additional anxiety which would confoundtest scores, and this has not yet been investigated.
No significant differences were discovered betweenthe two tests in terms of the number of linguistic errorsmade, although when turning to discourse features, selfcorrection and paraphrasing were reported to occur moreoften in the SOPI whilst shift to L1 was more frequent inthe OPI. The explanation given for this by Shohamy et.
72

al. is that test takers view the SOPI as an elicitationprocedure in which they are encouraged to concentrate onaccurate production, whilst OPI test takers are involvedin a communication activity and must focus on theproduction and negotiation of meaning. In terms of lexis,this latter feature has been observed before in theattempts of less able students to communicate (Fulcher,1989), and the explanation is quite convincing.
With reference to recent debates regarding the clinebetween oracy and literacy, and the features of eachwhich are manifested in different contexts (Halliday,1985), Shohamy et. al. found that the SOPI contains feweroral features than the OPI, in that the latter contains ahigher ratio of grammatical items to lexical items, it ismore contextualised and there is more personalinvolvement on the part of the test taker, includingparalinguistic behaviour and the expression of personalviews and emotions.
It would appear from this evidence that the OPI andthe SOPI do in fact measure different abilities ortraits. Why, then, did Shohamy et. al. (1991) find nosignificant difference in scores between the SOPI and OPIscores? The answer which they provide is that both of thetests were rated on the same ACTFL scale. If this is thereason, then this would provide evidence of convergentvalidity for the ACTFL scale as similar results areobtained irrespective of the data collection method. Thisdeserves further investigation, not in the context of the
73

comparability of two sets of elicitation techniques, butin the context of convergent validity. Althoughconvergent validity is not in itself sufficient evidenceof the validity of a rating scale, it is necessary.
From the preceding discussion, it can be seen thatthe concurrent validation of two "direct" oral tests israrely done. This in itself may very well be asignificant observation: to conduct a concurrent studywhich would provide interpretable data would require thatthe measurement properties of the rating scales in thetwo direct methods were well known and capable ofcomparison. The selection of the criterion is thereforeextremely important, and it is still true to say that"there is little agreed basis for comparing any two use-of-language tests" (Lee and Low, 1982, 16). Bachman andPalmer (1981a; 1981b; 1983) have shown how suchcomparisons might be made through Multitrait-Multimethodstudies, but their work is concerned only withidentifying an "oral trait" as opposed to a "readingtrait" using only one direct measure.
One study which has investigated the use of acomponential oral rating scale in a "direct" oralinterview is that of Yorozuya and Oller (1980). Yorozuyaand Oller avoided problems associated with rater trainingin that they used graduate students of linguistics whoreceived no training or explanation of the scales used torate students from audio cassette (ibid., 138). Thescales used were marked Grammar, Vocabulary,
74

Pronunciation and Fluency, and consisted of ten "bands".Yorozuya and Oller concluded that there was no reliablespecific variance for any of the rating scales, and thatas a large g-factor accounted for the data a globalrating scale should be preferred. However, the study isflawed in two ways which make the conclusions suspect.Firstly, the four rating scales used had no banddescriptors: it was assumed that the component constructswould be understood by the graduate students from theirlabel alone, and that each component would be constructvalid if and only if it had a large degree of specificvariance. This could have been just as much a test of theconceptual understanding of the raters as of theconstruct validity of the components. secondly, themethod used to analyze the data was Principal ComponentsAnalysis which reduces the data to the minimum number offactors possible (Woods, 1983), and given that only onefactor was extracted we may suspect that the method couldhave imposed the solution on the data, given that therewas no theoretical basis for expecting anything else tooccur.
In Chapter 9 a concurrent study will be reportedbetween the rating scales developed and described inChapters 4 and 5 and the components of the Firstcertificate in English of the University of CambridgeLocal Examinations Syndicate. The results of theconcurrent study throw further light on issues inconcurrent validation in oral testing outlined above.
75

2.2.3 controversy over band descriptors in oral ratingscales
Amongst the most vehement critics of the ProficiencyMovement and the rating scales upon which it is based areLantolf and Frawley (1985; 1988), who believe that thewhole approach to oral testing is flawed.
with reference to the Proficiency Movement and thecurriculum implications which are being implementedthroughout the united states, Lantolf and Frawley pointto a number of inconsistencies which cast doubt upon thewhole process. They review two studies concerning thenumber of hours required to achieve the 2/2+ level. Inwestern Europe Brod (1982) claims that approximately 480hours of study are needed to reach this level, whilstLambert et. al. (1984) claim that some 840 hours ofintensive study is required. Given such different claims,and unfortunately there is no published evidence tosuggest that either claim is accurate, Lantolf andFrawley ask how it is possible to proceed with curriculumreorganisation based upon descriptors from AEI tests.From our concern with rating scale development, it mayalso be possible to interpret these disparate findings inthe light of different researchers interpreting therating scale in different ways and hence producingradically different estimates of the time it would taketo reach a given level.
Referring to the topics chosen for the tasks,Lantolf and Frawley also question the assumption that it
76

is possible for students to achieve greater accuracy ontopics which are known rather than those which are notknown (ibid., 2 - 3), an explicit assumption of therating scale band descriptors. Barnwell (1987: 40) makesthe same point. The issue here is that no evidence hasbeen offered to date which suggests that there is arelationship between accuracy of language production andthe degree of "abstractness" or familiarity with thetopic as posited in the rating scale. Douglas andSelinker (1985: 206) argue that the more familiar thetopic the more likely the test is to "engage the test-taker's ability to perform." Working from within thefield of discourse domains, they present the view thatprototypical domains, such as "life-story" are morelikely to enqaqe the subject in this way. Fluency is seento be a function of the student's ability to relate tothe discourse domain chosen for the interview. This issuewould become extremely important if future research wereto discover that choice of topics does have a significanteffect on the use of ratinq scales which are linguisticin nature, rather than referring specifically to giventopics or situations.
Another assumption questioned by Lantolf and Frawleyis that there is a difference between the ability ofspeakers used to dealing with foreiqners and those whoare not, in comprehendinq speech. This difference isbuilt into the band descriptors in a number of places,but it is an assumption Which has not been verified.
77

One of the few studies which has been used tosupport this distinction within the scales is that ofChastain (1980), which reported on reactions by nativespeakers to errors made in Spanish by intermediatestudents. The main problem with Chastain's study is thatthe "errors" which were presented to the naive nativespeakers were constructed one sentence examples writtenon paper. Although Chastain acknowledges the limitationsof the study and states that the results would need to besubject to replication (ibid., 214) he does not see anyproblem with the basic research methodology when it comesto applying the findings to naive native speaker reactionto speech samples. Van Patten (1986: 62) is particularlycritical of this kind of generalization, stating that thelack of a database does not help the cause of theProficiency Movement. One cannot generalize from onestudy such as that of Chastain, especially when otherresearchers using a similar methodology have come to theopposite conclusion, namely that native speakers aregenerally extremely tolerant of a student's attempts tocommunicate compared to the harshness of non-nativeteachers familiar with the student's L1 (Sheorey, 1986).
Barnwell (1989) has studied naive native speakerreaction to actual interview data, and found low rater-reliability and an inability to relate native speakerperceptions to the ACTFL/ETS rating scale withouttraining. In this case the criticisms of Lantolf andFrawley have been upheld in the light of continuing
78

research.The main problem which Lantolf and Frawley see in
the AEI rating scales is the underlying philosophicalassumptions in the positions taken with regard tovalidity.
They claim that the approach to testing developed is"analytical" rather than empirical, but the analyticalapproach is presented as if it were empirical truth. Theconcept of the Functional Trisection is singled out forparticularly harsh criticism. Lantolf and Frawley arguethat the statements made by Liskin-Gasparro (1984b) andLowe (1985a) "may have nothing to do with real worldperformance" and that "such criterion referenced testsi.pose competencies on examinees and measure the extentto which the person deals with the imposition" (Lantolfand Frawley, 1985: 339 - 340). They make a distinctionbetween test language as reflected in the rating scalesand real world language.
In order to grasp the arguments of Lantolf andFrawley a fairly long quotation is provided (ibid., 340):
"An informal look at the logic of speaker-levels and linguistic guidelines fordetermining performance underscores ourargument: 1) assume, from informal observation,that some speakers of L2 are better thanothers, and rank these speakers in groupslabelled from one to five (or one to three, inthe case of the ACTFLjETS Guidelines); 2) withspeakers grouped, abstractly, from one to five,decide how to put people into these groups; 3)define each of these a-priori groups in termsof linguistic criteria also organised fromsimple to complex (i.e., 1 to 5). It is not
79

difficult to see the analytic logic here. Thelevels (1 to 5) do not exist except in terms oflinguistic criteria which define them. That is,the logic of the levels and of their criteriais symmetric implication: X (levels) <---> Y(criteria). What is a "low-novice?" Someone"unable to function in the spoken language."What is someone "unable to function in thespoken language?" A "low-novice." This logicdoes not yield criterion referenced tests, butcriterion-reductive tests: the criteria are thelevels and vice versa.Because the levels are criterion-reductive,many of the statements made by researchersconcerning the levels and the criteria areunderstandable, if erroneous. Liskin-Gasparrostates that the Guidelines are "absolutedefinitions." They must be "absolutedefinitions" since they are analytic andreductive. The criteria, as absolutes, are thenconverted into requirements, because thecriteria are required absolutely to define thelevels. When the criteria are converted intorequirements, one can argue, as Liskin-Gasparroand Omaggio do, that speakers must be judged inrelation to their acquisition of therequirements: i.e., the acquisition of theanalytically derived and absolute requirementswhich define each level - the acquisition ofthe so-called "competencies which lie at eachlevel." With the criteria as analytic andreductive, it is impossible to evaluate L2speakers with regard to the Guidelines. It isonly possible to evaluate L2 speakers as theyare in the Guidelines, because the Guidelinesare absolute and reductive."
Lantolf and Frawley therefore claim that learnersare being evaluated by a series of discrete stagesthrough the law of non-contradiction: one cannot be inone level and in another. Level descriptors logicallyexclude all other levels. When it comes to applying theseto the curriculum, Lantolf and Frawley argue that thisamounts to saying that the "reductive definitions" cannotonly be used for testing, but that they are also
80

teachable.Further, because the definitions of the levels are
measured against an "educated native speaker" they claimthat far from being a criterion-referenced test, thelevel descriptors are in fact norm-referenced. Lantolfand Frawley question the ability of researchers to definean educated native speaker, but we will return to thislater.
In their follow-up article, Lantolf and Frawley(1988) refer to the "psychometric posture" of theproficiency Guidelines. They claim that the rating scaleprovides the "illusion" that something is being measured,whereas in reality no metric exists. They provide asevidence the fact that the FSI has five levels within itsscale, the ASLPR has nine, and Bachman and Savignon(1986) suggest that there are really only three. Lantolfand Frawley agree with Vollmer (1983) that "proficiency"is what proficiency tests measure, and this will continueto be the case until a more empirical approach to ratingscale development and number of levels described isattempted. There is a great deal of truth in thisposition, as Pollitt (1991: 90) would agree. until it ispossible to show that what is described in the bands ofthe rating scale relates to the way in which studentsactually do acquire language and how they really speak,rating scale constructors will be open to this charge(Pienemann, et. al., 1988).
The work of Lantolf and Frawley is timely, for the
81

issues which they raise are clearly important with regardto the development of oral tests and, specifically,rating scales. It cannot be denied that the AEI ratingscales represent a-priori definitions of languageproficiency which have not been validated prior to theiruse, and this has been a serious error on the part of thetest developers. The fact that researchers have to relyon the defence of "experience" when facing criticism isevidence of this.
However, the work of Lantolf and Frawley must beviewed with extreme caution. Although their criticism ofthe AEI rating scales is largely justified, theirsolutions to problems are not. They argue that it isnecessary to develop a learner-centred view ofcommunication without the use of psychometric theory, andthat the scoring procedure (no alternative is suggested)should represent "real-life" facets. How is this to beachieved? Certainly through the study of what learnersactually say and the development of a database from whichscales may be developed empirically (Fulcher, 1987), butthis would imply the concurrent use of psychometrictheory, which Lantolf and Frawley would outlaw. Indeed,it is difficult to understand the relationship betweenthe criticism of the AEI rating procedure on the groundsof lack of an empirical basis and the suggestion thatbetter scales could be generated without the use of thetools that make the empirical basis possible.
The contention here is that the criticisms of
82

Lantolf and Frawley are a remarkable indictment of theACTFL/ETS rating scale, but that the conclusions are notvalid. This may be seen most clearly in Lantolf's (1988)review of Underhill's (1987) work on oral testing, inwhich he writes:
"Underhill is to be applauded for hiscommitment to the buaans involved in thetesting process. Test designers have givenprivileged status to the testing instrumentsthemselves and to the ubiquitous statisticalprocedures used to corroborate researchhypotheses and have virtually ignored theindividuals subjected to the imposition of atest (see Lantolf and Frawley, 1985, 1988). Asthe author cogently remarks: In a genuine oraltest, this order of priorities is reversed.Real people meet face to face, and talk to eachother •••it is the people and what passesbetween them that are important, and the testinstrument is secondary."
Lantolf believes that the work of Underhill (1987)is "a step in the right direction." This helps to clarifythe suggested solutions in Lantolf and Frawley (1985:1988). What they seem to be suggesting is a commitment toa human approach which relies upon common sense and thecompassion of the tester/interviewer. It would appearthat what is really being advocated is nothing less thanthe priority of "experience" over research, exactly whatthey have criticised the AEI test developers for.Lantolf's review of Underhill (1987) should be comparedwith that of FUlcher (1990: 81) in which it is arguedthat
83

".••if this work is in any way a reflection ofthe "state of the art" in oral testing theoryand practice, then our profession has developedlittle beyond the anecdotal state of presentingevidence for preferences and points of view."
Underhill (1987) does not contain any criticaldiscussion of oral tests in common use, and the treatmentof rating scales (ibid., 98 - 100) is limited to keepingrating scales as short as possible to avoid trouble intheir construction, and to writing and improving banddescriptors by "trial and error". The focus ofUnderhill's argument is that rating scales describe"typical students" and as there is no such thing as atypical student (ibid., 99) one must not expect ratingscales to be as useful as the subjective judgement of theexperienced rater. The brief treatment of "markcategories" (ibid., 95 - 97) includes concepts like"Hesitation (how much does the speaker hesitate beforeand while speaking?)" although there is no indication asto whether students would be expected to hesitate more atlower ability levels and less at higher ability levels(as assumed in most rating scales) or whether such acriterion might be influenced by other factors.Experience, and trial and error are advocated in place ofresearch into the construction of rating scales and therating process.
These reviews help to place the work of Lantolf andFrawley in an appropriate context. As a criticism of aparticular oral testing scale their work was full of
84

insights and warnings (as Bachman and Savignon, 1986: 382would agree). Unfortunately, they have generalized beyondthe bounds of that particular rating scale and in theirconclusions opened themselves up to serious criticism inturn.
So far, we have only considered the controversygenerated by the work of Lantolf and Frawley on the AEIapproach to testing, which is centred around the argumentthat the rating scales in the AEI tradition are circularand that there is no evidence which could support a claimto validity.
A critical approach to the ACTFL/ETS rating scale isalso adopted by Bachman and Savignon (1986), but thenature of their observations is such that the relevanceof the comments may be extended beyond the confines ofthe ACTFL/ETS to other oral tests and oral testdevelopment in general. As we have seen, one of the maindefences of the ACTFL/ETS rating scale is that of "facevalidity" of the tasks and elicitation techniques, and"experience" in the use of the scale. Bachman andSavignon (1986: 381 - 382) argue that the fallacy lies inthe notion that "direct" tests as opposed to "indirect"tests lead to the production of "normal" and "real"language. Direct tests have been considered to beautomatically valid. We have seen that this is theposition of FSI and AEI proponents (Wilds, 1979; Lowe,1983; Lowe, 1986b; Lowe, 1987; Liskin-Gasparro, 1984a).Bachman and Savignon raise two objections to this
85

position. Firstly, we have no definition of what "normal"language is. The rating scale band descriptors certainlydo not provide any such definitions. Secondly, theargument presented for validity using the claim of"directness" confuses "behavioural manifestations" withthe "construct". Bachman and Savignon (1986: 382) say:
"As with all mental measures, language testsare indirect indicators of the underlyingtraits in which we are interested."
In this respect, all oral tests are indirect, andtherefore it is illegitimate to rely on face validity. Itis necessary to demonstrate construct validity for anyrating scale which is developed. The position of Bachmanand Savignon is therefore in keeping with the Standardsfor Educational and Psychological Testing (1985: 9 - 19):the problem with the ACTFL/ETS and other rating scales isthe confounding of language ability with test methodfacets. Bands on the rating scale must be definedindependently of method, which at the present time theyare not. This is a clear argument in favour of researchinto the construct validity of rating scalesindependently of tasks and elicitation techniques.
Indeed, Bachman (1988) argues that in order toinvestigate the construct validity of oral rating scales,it is necessary to separate clearly the abilities to bemeasured from the tasks and elicitation techniques used.The problem is compounded where the single rating scale
86

developed represents a global assessment of oral ability,which has "no basis in either current linguistic theoryor empirical work in language testing" (Bachman, 1988:63). Bachman proposes the development of separate ratingscales which represent a theory of the structure of oralabilities through his model of Communicative LanguageAbility (CLA), in order to distinguish these abilitiesfrom test method facets. These facets were firstdescribed by Carroll (1968) as: the testing environment,the nature of the test instructions, the nature of theinput the test taker receives, the nature of the responseto the input, and the interaction between the input andthe response. Bachman (1990: 119) has expanded these inhis categories of test method facets. rn any study ofconstruct validity, as a potentially large source oferror, test method facets that can be identified shouldbe controlled for or the extent of their effect on scoresestimated, as argued by Shohamy (1988).
Bachman recommends the development of scales whichare defined "abstractly" without reference to specifictest method facets and the investigation into the way inwhich test method facets effect the scoring procedure. Inthe meantime, validation of the ACTFL/ETS and otherrating scales remains impossible. In particular, theclaim to having had years of experience working with thescale "•••in no way constitutes evidence for validity"(Bachman, 1988: 163).
A response to Bachman came in a study by Dandonoli
87

and Henning (1990) which used a Multitrait-Multimethod(MTMM) design to investigate claims that test method andtrait were confused, and a Rasch analysis to investigatethe extent to which the ACTFL band descriptors could besaid to represent an acquisition hierarchy. The resultsof the MTMM study are reproduced in Table 2.7 and theRasch analysis results for the oral test in Table 2.8, inthe Appendix to Chapter 2.
In this study the two raters used were defined asthe method facets for the skill areas of writing andspeaking, and the "skill modalities" (reading, writing,speaking and listening) were defined as traits. Methodfacets in the reading and listening tests were itemformats (Dandonoli and Henning, 1990: 13). On the basisof the evidence, it was concluded that convergentvalidity had been demonstrated for all skill modalities,and that speaking and reading demonstrated divergentvalidity. Secondly, it was claimed that the Raschanalysis showed that there was an "adequate progression"with the exception of Novice-High which was moredifficult to attain than Intermediate-Low.
Whilst the Dandonoli and Henning study does go someway to answering the criticisms of Bachman and savignon(1986) it should be observed that in the MTMM the onlytest method facet to be specified in their design forspeaking was that of raters, and only two raters wereused. Further, these two raters were trained andaccredited ACTFL/ETS raters. It is thus quite possible
88

that the results obtained by Dandonoli and Henning are anartefact of the rigorous training of the raters used.Secondly, in the Rasch analysis of speaking ability notest method facets were specified at all. Thirdly, tworatings of the same performance cannot be said to countas separate methods. Although the results do appear to beimpressive, we are not only faced with the possibilitythat they too are an artefact of rater training, but theycould have been caused by test method facets such as thetask or elicitation procedure.
It is not hard to level such criticisms at post-hocattempts to validate a testing procedure and a ratingscale after operationalization and the raters fullytrained. What has happened is that it has been made muchmore difficult to isolate and control for or investigatethe effects of the test method facets which areconfounded with the oral trait.
2.2.4 ConclusionsThe issue of validity in oral testing seems set to
remain a contentious issue, especially between thosewriters who continue to maintain that "experience" and"common sense" is all that is required to ensure validity(Underhill, 1987; Lantolf, 1988; Morrow, 1990) and thosewho desire to establish an empirical basis for the studyof validity. Two key aspects of the validity debate inoral testing are important for the present study.
Firstly, it is important to design studies which
89

account for as many of the test method facets aspossible. Little is known about the size of the effect ofthese test method facets, and it is only through researchthat they can be isolated and estimated, so that we canstate whether or not a trait has been identified. We notethat in MTMM studies to date, an oral trait doeslegitimately seem to have been identified, although nowork has been done into the components of that oraltrait: no validity study has been conducted on theFunctional Trisection, on the FSI rating scale componentsother than Adams' (1980) factor analysis, and littleconvincing evidence is available to suggest that the banddescriptors in rating scales represent externallinguistic reality. Secondly, within a research frameworkwhich seeks to investigate the validity of oral ratingscales it is of vital importance that raters are nottrained, socialised or cloned, as this will inevitablyhave the effect not merely of confounding, but "fusing"together a test method facet with a hypothesized trait insuch a way that they can no longer be separated. Theinvestigation of validity then becomes impossible. Ratertraining should only be introduced at a later stage priorto the operationalization of the test, in order to ensurevalid assessment in live testing.
The approach adopted in this research is to developrating scales and band descriptors on the basis of ananalysis of actual student speech (Fulcher, 1987; 1989).Aspects of student speech which appear to affect the
90

scores which students are awarded will be isolated and,throuqh the use of discriminant analysis an attempt willbe made to construct two ratinq scales. When these tworatinq scales have been used in trial testinq a validitystudy, takinq into account the two key issues to haveemerqed from the validity debate described above, shouldthen be able to avoid many of the problems which haveplaqued oral testinq research to date.
section 3: Rating Scale Construction in Oral Testing3.1 Aggroaches to constructing oral rating scales
We have looked at the most influential of oralratinq scales in section A, and considered issues ofreliability and validity in section B. However, we havenot so far considered how these scales are actuallyproduced.
Very little has been written on the actual processof scale construction for scorinq oral ability, althouqhas we have seen claims are made for the scales once theyexist. We may justly say that the development of scalesto date has been carried out, on the whole, usinq a-priori decisions reqardinq what the developers believe tobe aspects of lanquaqe proficiency which define a pre-setnumber of bands within a scale, based on experience ofworkinq with second lanquaqe learners. In this process itis not uncommon for band descriptors within scales to besubjected to scrutiny by professionals within the field,but further than this there is no check upon the number
91

of bands or the actual content. Most claims are made forthe band scales only after they have come into use.
Frith (1979: vi) acknowledges that for the FSIscales there are no external criteria against which theycan be assessed; rather each level within a scale isdefined in relation to the other levels and the only keyreference point "the ultimate standard, the ultimatecriterion reference, is the proficiency of the educatednative speaker."
The emphasis in scale development has therefore notbeen upon the construction of the scales themselves, butachieving and demonstrating reliability of the scalesonce they have been developed. It may be suggested thatthis is a major potential source of invalidity within thetesting procedure. Although Wilds (1979: 1) does claimthat "the usefulness of the system is based on carefuland detailed definition in both linguistic and functionalterms of each point on the scale" she also goes on tostate that the band definitions need to be "gross" inorder to achieve reliability (Wilds, 1979: 2).
Jones (1975: 3) argues with reference to the FSIthat
"One of the principal problems we are facedwith is the construction of proficiency testswhich measure language ability accuratelyenough to correspond to these definitions."
This shifts the emphasis away from the band
92

descriptors to the elicitation techniques. However,Jones' point leads to a further observation which wemight make: the definitions or band descriptors areassumed by Jones to have been written without referenceto any specific testing procedure (or indeed to adatabase of L2 production), and so the problem which isthen faced by the scale constructor is to develop atesting procedure which would allow scoring to be carriedout on the scale which has been constructed. We have seenthat this is not always the case, as rating scales doconfound non-linguistic (situation or topic specific) andlinguistic criteria. A similar point is made by Alderson(1991a), where it is reported that draft IELTS(International English Language Testing service) banddescriptors contained descriptions of performance whichwere not elicited by the actual tasks in the test.
Jones (1975: 4) further says that very little isknown about tests such as the FSI, as "no validationstudies have been made with the definitions as thebasis". Jones (1981) makes similar points, adding thatmost oral testing procedures do not relate theelicitation technique to the scoring systems in anyspecific way. No recommendations are made regarding howto overcome this problem, although Jones appears to arguethat a balance must be maintained between the assessmentof overall competence and components of competence (suchas fluency, accuracy etc.). Further, despite his concernwith the association between band descriptors and
93

eliciting appropriate language, Jones does say thatimpressionistic scoring is to be preferred to analyticscoring. This inconsistency may have led him not topursue the issue of scale development very far. Indeed,the general view that an "intuitive" approach to scoringis adequate is widespread. Berkoff (1985: 96) supportsJones' approach explicitly, claiming that analytic scalesare "tedious" to use, and that the intuitive judgement ofan experienced oral assessor is to be preferred. This isan argument in favour of abandoning rating scales assuch, except in so far as they offer some reference pointfor the "number" given to the student and the training ofthe raters, so that high reliability is achieved byensuring that all raters see the world through the samespectacles. Wilkinson (1968: 121 - 122) also states thatwhile impressionistic marking is advantageous, thetraining of raters is essential if they are to grade inthe same way. Lowe (1985a: 16) argues in the same veinand Underhill (1987) is a more recent virulentspokesperson for this particular approach to oraltesting. This approach thus emphasises the importance ofrater training at the expense of scale development andscale validation, as was argued previously (see page 49).
With regard to the ASLPR Ingram (1982: 9) says thatin the scales "each definition exists in the context ofthe whole scale and in relation to adjacent definitions"whilst not describing how the descriptors for each bandwere originally written. He claims construct validity for
94

the rating scale merely by stating that when they werebeing produced the developers drew upon "psycholinguisticresearch" (ibid., 19). However, he goes on to claim thatthe scale is not impressionistic, as it relies implicitlyupon the concept of a "universal pattern of languagedevelopment" which is not described (ibid., 10).Similarly, Ingram (1985a: 4) makes a stronger version ofthis claim when he writes:
"We have noted that rating scales such as theASLPR are developmental in structure, i.e., theprogression of behavioural descriptionsattempts to reflect the way in which a secondlanguage develops from zero to native-like.Thus the scale is not arbitrary but related tothe universal developmental schedule and alearner's rating indicates the stage ofdevelopment he has reached in the developmentalschedule."
This has come under criticism from Pienemann et. a1(1985) because the notion of "development" must betheoretically coherent and empirically verifiable. TheASLPR does not seem to be empirically verifiable forPienemann. Further, the definitions of levels arrived aton the basis of the developmental process must bequantifiable, or validation studies cannot be carriedout. It would therefore seem that the ASLPR scales sufferfrom the same flaw as many other rating scales. Thisshould not be surprising, in the light of the fact thatthe ASLPR was generated from early drafts of theACTFL/ETS rating scale.
95

It would seem that these approaches to rating scaledevelopment place an unvalidated view of the linguisticworld onto the raters and students alike. students mustperform in such a way that they can satisfy a scale which"intuitively" and inexplicitly reflects the subjectiveexperience of the scale developer and, if it is "gross"enough, the subjective interpretation of the rater.
A far more satisfying approach is one where the banddescriptors within the scales are developed through anempirically verifiable procedure, and
"will have to be based on observed learnerbehaviour as opposed to postulated or normativenotions of how learners ought to behave."(Pienemann et. al., 1985: 2 - 3).
Observed learner behaviour must be quantifiable, andprocedures developed for using the information in theconstruction of rating scales which reflect the actuallinguistic behaviour of students. In this way the closerelationship between linguistic behaviour (which mayormay not be specific to the elicitation technique, task ortopic), the elicitation technique, the task and thescoring procedure could be ensured. This may becharacterised as a "data-driven" approach to scaledevelopment with a strong theoretical and empiricalunderpinning, rather than the generally accepted currentapproach of producing scales on the basis of a-prioridecisions concerning the structure of proficiency. This
96

is an argument which would be supported by Bachman (1988;1990). The main problem which may have to be faced in adata-driven approach is whether or not the scoringprocedures could then be legitimately used in a range oftesting situations other than those on which the scalewas originally developed. This is an empirical questionwhich can be addressed through using a rating scale overa number of different testing situations and assessingthe extent to which scores on the scale differ acrossthose situations.
Lowe (1985a: 19 - 25) goes some way towardsdescribing the development of the ILR scales. Theoriginal FSI was a semantic differential with theintermediate levels representing a relative amount of aquality between bipolar terms. Later these weresupplemented by verbal descriptions of the interveningpoints, creating a Likert scale. However, the scales werecertainly a-priori, and the descriptors altered in thelight of changing Second Language Acquisition (SLA)theory and experience of their use, not on the grounds ofempirical research. As Lowe says, there is a "non-compensatory core" of language abilities which thestudents must possess for a given level within the ILRscale (i.e., without language ability X you cannot beplaced in, say, band 2), whilst other aspects arecompensatory (i.e., if a student does not possesslanguage ability Y, s/he may still get into band 2 ifs/he possesses more of language ability Z for the level).
97

As a student's level of proficiency increases, the morenon-compensatory the scale becomes (ibid., 25). Thedescriptions of both compensatory and non-compensatoryelements can change over time. Fluency, for example, hasbeen "redefined" from "ease of speech" to include "thespecific requirement for speech rate to fall within therange of rates used by native speakers" (ibid., 26).statements such as these may give the impression thatscale development and growth is empirical, but it is infact still a-priori, as the "speech rates" have not beenempirically established and, even if they were, theywould still have to be related to all the test methodfacets in the data collection technique. This once againhighlights the relationship between testing situation andthe scoring procedures which any a-priori system cannotdeal with adequately.
It is because of the a-priori approach to scaledevelopment that is currently in widespread use that"proficiency" is seen to be what proficiency testsmeasure (Vollmer, 1983), and that Lantolf and Frawley(1988) can argue that there is no evidence to suggestthat proficiency is scalable. One symptom of this is thefact that no justification of the number of levels withina scale can be provided. By using observation of actual L2
production on language tasks and the production of scalesusing discriminant analysis, these problems may beovercome, for the number of bands within a scale will bedetermined by the highest discrimination index between
98

students provided by the dependent variables in theanalysis.
The resulting scale would be criterion referenced inthat candidates would be graded according to criteriaisolated from the observation of actual performance,although the actual criteria would, it must be admitted,be dependent upon the sample from which the criteria weredeveloped. Whether or not this would turn out to be aproblem in terms of generalizability would thereforebecome a area for investigation. However, Bachman andSavignon's requirement that a criterion-referenced scalemust have a zero and a perfect point on an absolute scale(Bachman and Savignon, 1983: 382) could not be met, andthere is no reason why it should be. As Bachman andSavignon point out themselves, we do not test studentswith no language ability at all, and "perfect" languageability is a chimera. Rather, the criteria are drawn fromactual use and thus, to some extent, rely on the "norm"for the sample of the population used to develop thecriteria. However, it may be legitimate to include a bandat the lower and higher end of the scale which have notbeen generated by the discriminant analysis. For example,in the Fluency scale which is described in Chapter 4there are five bands. It is possible to add band 0, whichis defined as any performance which is not good enough tomeet the criteria for band 1, and band 6 which would bedefined as any performance which is superior to that inband 5.
99

3.2 Psychometric considerationsClark and Lett (1988: 20) summarise the psychometricconcerns which must accompany scale development:
"In order for a system of ratings ordescriptions to be considered a scale, theratings or descriptions must (1) denote therelative presence or absence of some substanceor quality and (2) be capable of validly andreliably ordering persons or objects accordingto the extent to which they possess thesubstance or quality at issue."
From this follow two important assumptions: firstlythe quality which the scale developer wishes to measuremust be scalable. Secondly, the construct which underliesthe scale must be unidimensional. The a-priori approachto scale development attempts to achieve these qualitiesat the expense of producing scales which suffer frombeing absolute and hence circular (Lantolf and Frawley,1985; 1988). Scales which are arrived at throughdiscriminant analysis will help to ensure scalabilityduring the actual process of producing the banddescriptors and should give some confidence inpsychological unidimensiona1ity, which at present canonly be assessed theoretically in accordance with thedefinition of the trait underlying the rating scale andits band descriptors (Henning, 1992: 11). Psychometricunidimensionality could only be investigated in thetrial1ing of the rating scales themselves.
The approach to scale development which is being
100

suggested here redresses the imbalance between the use oflinguistic criteria and psychometric criteria (Perren,1968: 109) by using speech as the basis for thedevelopment of the scales. Psychometric tools aid theprocess of scale development, but do not entirely dictatetheir format or content. The enterprise is thus acombination of linguistic analysis and interpretation,and psychometric rigour.
3.3 Terminology used in constructing band descriptorsThe a-priori approach to scale development describedabove has led to a certain amount of vagueness andgenerality in the descriptors used to define bands. Ofcourse, for some writers this is seen to be a strength(Wilds, 1979; Bachman, 1990: 341 - 346), as thegenerality of the scale and the gross nature of the bandsmean that it can be applied to the assessment of anylanguage in any testing situation. The disadvantages are,however, much greater than the advantages. Lack ofclarity and vague use of key words within definitionsdetracts from the independent meaningfulness of the banddescriptors. Investigation of the validity of the scalecan only be conducted on the basis of test scores whichmay be an artificial product of rater training ratherthan valid measurement of qualities of the scale.
Schultz (1986: 373) claims that the ACTFL/ETSGuidelines provide testers and curriculum designers witha common terminology within which they can work for the
101

first time. This optimistic view reflects the claims ofwilds (1979: 1) that key terms such as "good" and"fluent" used prior to the FSI descriptors were extremelyvague and, being open to as many interpretations as therewere raters, were in need of revision. wilds' view isthat the FSI descriptors are detailed enough to removethe uncertainty of interpretation which bald descriptionscreate. Wilds' view is echoed by Lowe (1983: 231) inrelation to the ILR rating scale.
Typical band descriptors are, however, far fromself-explanatory (Barnwell, 1989), and as Matthews (1990:119) notes, the bands
"are described in only vague and general termsand abound in qualifiers, so that only grossdistinctions can be made with any confidence."
Alderson (1991a) testifies to the problem faced whenconstructing band descriptors, but argues that whatmatters at the end of the day is that assessors agree ontheir interpretation of the scale.
In an analysis of references to vocabulary knowledgein the ACTFL scale, Fulcher (1989) concluded that thedescriptors were far too vague to be of any practical usewithin an operational oral testing procedure because theywere not based on actual language production. Matthews(1990: 119) and Fulcher (1987) both draw attention tounclear statements regarding fluency in the ELTS ratingscale as being unhelpful to raters.
102

Hieke (1985: 135) takes a particularly adamant standon this issue:
"A glance at the literature on fluency revealsit to be replete with vacuous definitions,overlapping terminology, and impracticalassessment strategies."
Mullen (1978a: 33) for example, considers fluencythe "easiest" aspect of oral assessment, as one need onlyconsider pauses and fillers. Hieke (1985: 137) isprobably correct when he argues that tests cannot be"fair" (which could be interpreted as "open to empiricalinvestigation")
"as long as they (the descriptors) hinge uponprose statements to delineate levels whilethese are peppered with notions that cannotwithstand close scrutiny."
Hieke's own suggestion is to develop a semi-directtest in which the candidate speaks into a tape recorder.The tape would then be used for grading fluency along theparameters: speech rate (syllables per second), length ofruns (average number of syllables between pauses), andhesitation phenomena (stalls, repairs, parentheticalremarks, silent pauses, fillers, progressive repeats andfalse starts). This would be quantifiable, but the sheerincrease in marking time per candidate over an oralinterview would, despite Hieke's protestations, probablymake the suggestion impractical unless it could be made
103

automatic (on the possibility of this see Pendergast,1985).
Finally, Hieke (ibid., 136) makes a point which hasnot been made elsewhere. Whilst the terminology of theband descriptors is vague, it may be meaningful forexperienced evaluators who have not been trained and,hence, socialised in the use of the scale. However, Hiekewould still challenge any rater to say what this wouldmean for a given student in practice at any given band.That is, once again, the issue of rater training ispushed to the fore as the most important reason forrating scales appearing to be meaningful and providingreliable results.
Alderson (1991a) distinguishes between three usesfor scales: for reporting student abilities to testusers, for "guiding the rating process", and for "guidingthe construction of tests." In the preceding discussionit is clear that we are primarily interested in thesecond of these uses for scales, which Alderson dealswith in relation to the IELTS rating scale. It is pointedout that raters must rate to a common standard - which noone would wish to disagree with - but in order to achievethis, emphasis is placed once again on rater training. Itis, in passing, noted that it is important to "produceBand Scales that are more easily interpreted andused ••.•" The question that remains is to what extent thescales are valid in isolation from the training whichraters must receive in order to become certified raters.
104

Training in this way is designed to mask problems withthe wording of bands in the scale by creating theillusion of psychological reality through raterreliability.
However, the way in which the IELTS band descriptorswere produced does appear to be something of animprovement upon other a-priori methods of development.Three methods were employed: (1) draft descriptions weresent to "moderators, teachers, experienced markers, andothers" for comment, the results of which were used toimprove band descriptors; (2) experienced markers wereasked to match speaking samples with band levels and "keyfeatures" of the samples were then identified; (3) theprocess of scale use in assessment and feedback fromraters provides a continuous supply of information whichcould be used to improve the wording of the scales.
In this process it may be suggested that it isextremely difficult to devise a way in which the ratingscales themselves may be subjected to a study of theirvalidity in isolation from the raters who, to someextent, already share a standard interpretation of a bandby its number, irrespective of the descriptor given tothat band. The principle of socialisation in commoninterpretation will influence all results and maskdetails of scale operation in which the researcher may beinterested.
Before it is possible to achieve agreement throughshared perceptions of ability by training, it is
105

essential to establish that the view of proficiency orlanguage development contained in the bands of the ratingscale is valid independently of trained raters. Only inthis way can training, rating and results be investigatedin terms of validity considerations. This argument may besupported by the fact, as reported by Alderson, that theIELTS revision project had to retain nine bands in thespeaking scale because of the "intuitive understanding"which had been developed for each band. This requirementis irrespective of whether a nine band scale may beempirically justified. Alderson's distinction between thereporting function of the scales (reporting scores totest users) and the grading function of scales (makingthe task of the rater meaningful) provides the answer tothis problem; the IELTS draft band descriptors wereindeed produced for test users and not raters. The"dubious manner in which the original Band Scores werederived" has imposed an unvalidated view of languageproficiency and development onto the tester whether hewishes it or not, and the function of this view oflanguage proficiency is primarily to provide meaningfulinterpretation of test scores by test users who "have afeel" for the meaning of the bands. It would thereforeappear that the function of reporting test scores ratherthan rating student performance has provided the mainmotivation in the development of the new speaking scalein the IELTS test.
This example from the IELTS serves to emphasise the
106

point already made, that the meaning of band descriptorsin most current rating scales tends to depend on the"intuitive feeling" of the rater (or score user) oncesocialised into the use of the scale. This will tend tobe inevitable as long as the scales are constructed on a-priori grounds, whether it be the IELTS, ACTFL, ILR orsome other derivative such as the ASLPR (Ingram andWylie, 1985) or the AIMS test (Reschke, 1984).
3.4 A special case of terminological confusion in oralrating scalesi the Natiye Speaker Yardstick.
In 1968 Perren noted that "native" or "native like"language ability was a term which appeared in the topband of rating scales. "What does this mean?" he asked."What kind of native, speaking about what, and to whom?"(Perren, 1968: 111). Perren recommended the developmentof scales based upon observations of the proficientsecond language speaker and not some notion of a "native"speaker - but until recently his views have not receivedthe attention they deserve.
A-priori scale development generally has dependedupon the concept of the native speaker or "educatednative speaker" for the definition of the top band in ascale. Wilds (1975: 36) argued that the linguisticability of a "well-educated native speaker" was the"absolute standard" upon which the FSI scales rested. Aswe have seen, the definitions of other levels were thenhung upon this one peg through the principle of internal
107

consistency.Liskin-Gasparro (1984a) argues that the top of the
ACTFL scale, representing educated native speakerabilities, is often achieved by students who have theopportunity to live in the country where the targetlanguage is spoken. Lowe (1983: 231) characterises theILR oral assessment scale as ranging from "no practicalability" to "well-educated native speaker ability". Oneof the test's strengths for Lowe is that it judges thestudents' production in relation to "language as it isspoken by well-educated native speakers." It is notsurprising to find that the ASLPR also depends upon the"native speaker yardstick" (Ingram, 1982: 8), and thatthe top band in the speaking scale represents "native-like" proficiency (Ingram, 1985a: 4; 1985b: 222 - 225).
The use of the concept of the educated nativespeaker is increasingly coming under attack, and with itsdemise one of the main pillars of many rating scalescurrently in use is removed.
The foremost problem with using the concept of thenative speaker as a criterion, and thus as a peg on whichto hang other bands in rating scales, is that nativespeakers "show considerable variation in ability"(Bachman and Savignon, 1986: 383). In their criticisms ofthe ACTFL scale, Bachman and savignon (ibid., 385) pointout that although Lowe claims to have abandoned theeducated native speaker standard,
108

"the ACTFL scale definitions are firmly rootedin the misconception that we can clearlyidentify native speakers and their standard oflanguage performance."
This can be seen in phrases from the banddescriptors such as "can be understood by nativeinterlocutors", and "•••using native like discourse •.•"Bachman and Savignon conclude that the scale stillcontains "the notion of a monolithic group of nativespeakers •.••"
Lantolf and Frawley (1985: 343) also argue thatcurrent scales contain "an implicit notion of the meanlinguistic behaviour of an ideal speaker." The problemfor them is similar to that of Bachman and Savignon: wedo not know what an educated native speaker is. Lantolfand Frawley correctly state that when using the educatednative speaker as a criterion, scale developers areconcerned only with "THE" native speaker, whereas inreality only types of native speakers exist. Lantolf andFrawley (ibid., 343) identify four "types":
1. Idiolectal, or informants.2. statistical, or typical speakers.3. Normative, or expert speakers.4. Former, or speakers from historical records.
ACTFL attempts to combine statistical and normativeon an intuitive basis. We may add to the criticism by
109

noting that even "expert speakers" may only be "expert"within certain contexts, and not others. Jarvis (1986:20) provides the example of a professor whose"competence" (we might wish to say "performance") variesdepending on whether s/he is talking about an area ofspeciality, socialising at a cocktail party, or opening abank account. Whatever the case, the ACTFL scales combinethe statistical and the normative speakers to form theband descriptors through intuition and not empiricalevidence. Hence, Barnwell (1987: 39) can legitimatelyclaim that what is being dealt with is an "ideal" nativespeaker, not real native speakers. Lantolf and Frawleyare correct when they say that as the concept of thenative speaker or educated native speaker "is neitherunitary nor reliable" it should be abandoned (or at leastmore thoroughly investigated) as a criterion. Davies(1990: 52: 1991) also demonstrates that the concept ofthe "native speaker" is one which is not consistent, andno researchers have sufficiently defined the term to makeit useful in a testing context, and the results ofstudies generated by interest in "World Englishes" alsoseriously cast doubt upon the notion of the "educatednative speaker" as construed by test developers (Kachru,1992: 4 - 5). We must conclude that Perren's (1968) callfor studies based on real second language learner speechshould be heeded.
In the face of these criticisms, Lowe (1985a: 47;1987) has stated that native speaker performance on AEI
110

tasks would in fact probably fall in band 3, or"Advanced". "Superior" performance is equivalent toeducated native speaker performance, which most nativespeakers cannot achieve. No evidence is presented tosupport these claims, other than the usual appeal tointuition and experience that there is some coherence tothe concept of the educated native speaker amongst"adepts".
The concept of the educated native speaker should beabandoned in rating scale development at least until sucha time as it is more thoroughly investigated andunderstood - if this is indeed possible - and an attemptmade to use the production of second language speakers tocreate the criteria to be used in band descriptors. Thiswill provide the possibility of external validation forthe rating scale. The a-priori method of scaledevelopment has no doubt been useful in the developmentof practical tests of oral ability which have been usedwith some degree of success in the rating of stUdents.However, given the problems with a-priori rating scaledevelopment discussed above, it is an appropriate time totry the new approach of data-driven scale development.Potential advantages and problems of the data-drivenapproach can then be assessed. Those scales which aretermed "Real-Life" scales by Bachman, such as the ILR,are primarily concerned with face validity and predictivevalidity: the reactions of the test takers to the test,and the assessment of the degree of success which might
111

be achieved in future performance in some non-testsituation (Bachman, 1990: 301 - 302). As we have seen,content validity is claimed on the grounds that the testtasks reflect the "real-life" situation to which the testis intended to predict. However, on this basis it is notpossible to investigate construct validity because theperformance on the task is equivalent to the abilitybeing measured, and test method facets thus confoundedwith traits. This may be perfectly justifiable if, butonly if, the results of the test are not generalizedoutside the specific context of the test situation. Inorder to generalize, it is essential to be able to claimthat the test is tapping some underlying "ability" whichmay manifest itself in a variety of circumstances, bothin terms of test and non-test situations where languageis used. Bachman (ibid., 341) suggests one alternative:the development of "absolute scales" of proficiency, bywhich he means an a-priori scale which has a perfect andzero point, irrespective of whether or not actuallearners fall into these bands (ibid., 346), and whichare not related to any specific language users (ibid.,344). They will differ from current scales of the AEItype in that they will not contain references to aspectsof the situation of testing and the elicitationtechniques used which are considered to be test methodfacets, but only the abilities to be measured (ibid.,347). This approach is still a-priori, and would resultin scales which shared the feature of "gross" definition
112

with the AEI rating scales, which Bachman criticises.This would mean that even if it were possible for aresearcher to show satisfactorily that the scalesdeveloped were testing "ability", it may not be possibleto make any meaningful statements about the ability inquestion. The key feature of a scale which is to bedeveloped on data-driven principles is that thedescriptors will be specific, and directly relatable toaspects of student performance in which the tester orresearcher is interested. This is to say that whilst thenotion of the "absolute scale" as presented by Bachmanmay allow for studies of validity, it would be trivial inthe sense that the level of delicacy of analysis would betoo gross to make any specific, interesting claims forthe scales under development. However, scales which arespecific allow for non-trivial claims regarding theirvalidity with regard to the underlying abilities whichthey claim to tap, if results can be shown not to havebeen contaminated by test method facets such as task orelicitation procedure.
113

Chapter Three
Rationale. time scale and design of the studysection 1: Rationale
It has been argued in Chapter Two that a-prioriscale development is flawed, and that post-hoc validationof such scales is plagued with potential problems. It hasbeen suggested that one way to tackle the problem of thevalidation of oral rating scales is to develop banddescriptors from a database of what students actually say(Fulcher, 1987; 1989), and this argument seems to havebeen well-received (Shohamy, 1991: 125). The keyrationale of the present study was to investigate thepotential of a databased, data-driven approach to oralrating scale construction based upon as complete a studyas possible of the operation of those scales in terms ofreliability and validity. To this end, test method facetswhich have been identified as confounding reliability andvalidity studies were either controlled for (interviewer,rater training, place of test, variation in elicitationtechniques, time) or estimated (rater, task, affectivefactors).
The main aim of the study is therefore toinvestigate the operation of rating scales produced usingan analysis of a database of spoken English to see if anyclaim to their superiority over a-priori rating scalescan be made.
The two rating scales developed for this purposewere an Accuracy rating scale and a Fluency rating scale.
114

The ELTS global rating scale was also included in thestudy to allow comparison between the two databasedscales and one a-priori scale. The constructs of accuracyand fluency were chosen because they are basic conceptsin all rating scales used in oral testing, whether therating scales are holistic or componential (see ChapterTwo, and reviews of other scales in Chapters Four andFive). It is widely assumed in oral testing that the twoconstructs of accuracy and fluency are separate aspectsof oral ability (Griffin, 1985), and in language teachingit is common for a strong difference to be drawn betweenaccuracy activities and fluency activities (see forexample, Brown and Yule, 1983: 104; Brumfit, 1984; Rixon,1992: 81). In the research literature this difference isvariously referred to as that between "norm-oriented" and"communicative-oriented" learners (Clahsen, 1985), or"rule-formers" and "data-gatherers" (Hatch, 1974), or"planners" and "correctors" (Seliger, 1980). In eachcase, the former of the two categories refers to studentswho concentrate on building up grammatical rules and aimfor accuracy in production (at the expense of tluency),and the latter category refers to students whoconcentrate on communicating fluently, paying littleattention to accuracy or alternatively, using theirknowledge of the grammar and lexicon of the language onlyto correct themselves after they have communicated. This"basic polarity" as Brumfit (1984: 50 - 57) describes it,predicts that these two components of oral proficiency
115

will tend to develop separately depending upon thelearning orientation of the student. Such a differencewould also seem to be predicted by the distinction oftendrawn between "gestalt" and "analytic" learners (Dulay,Burt and Krashen, 1982: 237 - 238; Larsen-Freeman andLong, 1991: 196 - 197), and the two-dimensional modulartheory of second language acquisition which positsknowledge-based and control-based language processing(Bialystok and Sharwood smith, 1985).
Although little empirical research has beenconducted into the distinction between students who are"norm-oriented" and those who are "communicative-oriented" to date, Ellis (1990a) conducted a study inwhich it was hypothesized that students who focus onaccuracy would acquire linguistic knowledge quickly,whilst students who focus on fluency would develop"channel control mechanisms" (measured as speech rate)much more quickly. Using correlation and a principalcomponents Analysis, Ellis (ibid., 89 - 90) concludedthat
"•••those learners who showed the greatest gainin acquisition of the three word order rulesmanifested the smallest gain in general oralfluency and, conversely, those learners whodeveloped the ability to process speech themost rapidly displayed the smallest gain inknowledge of the word order rules."
As this distinction is an area of current researchin Second Language Acquisition, researchers do seem to be
116

agreed that the distinction is a real one, thedistinction is common in most oral rating scalescurrently used, and a considerable amount of researchinto the concepts of accuracy and fluency has beenconducted (see Chapters 4 and 5) which has also providedmethods for analysis and categorization, rating scales ofAccuracy and Fluency were developed for this study withthe hypothesis that the two constructs would provide areasonable opportunity of demonstrating divergentvalidity.
Despite the reasons provided for choosing theconstructs of accuracy and fluency described above, thelabels "Accuracy" and "Fluency" should be interpreted bythe reader in the light of the definitions provided inChapters three and four, as they may not alwayscorrespond exactly with definitions or descriptions foundin some of the literature.
Other available componential models of abilitydeveloped for language teaching and testing (Canale andSwain, 1980: Canale, 1981: Canale, 1983: Bachman, 1988:1990) were thus not used, as the extent of their validityas models has hardly begun to be investigated. Further,for a databased study of this size it was consideredpreferable to work with a very limited number ofcomponents, the definitions of which are less problematicat the operational level than, for example,"illocutionary competence" or "sociolinguisticcompetence" (Bachman, 1990: 87), although Bachman's
117

"Grammatical competence" which includes lexicalcompetence, is very similar to what is defined in thisstudy as "accuracy".
Section 2: Time Scale and designThe spoken data used for the development of the two
oral rating scales described in Chapters 4 and 5 wascollected in 1989. Twenty one students took the ELTSspeaking test, which was recorded with the permission ofNick Butler, then ELTS officer at the British Council,London. The tests were held on three separate days withinthe space of one and a half weeks. The data was collectedusing a miniature audio recorder and a tie microphone,and transcribed for the analysis. All students werenative speakers of Greek.
Transcripts were made from the audio tapes, and thetranscripts coded for aspects of disfluency and errors ingrammatical accuracy as described in the literature andoutlined in Chapters 4 and 5. This coding was done usingthe transcripts, the recordings, and the interviewer'srecollections of the students from the actual interviews.This necessarily involved a degree of judgement on thepart of the researcher, and sample transcripts areincluded in the Appendix to Chapters 4 and 5 for thereader to examine.
The twenty one students in the sample were groupedinto ELTS bands, and the tallies of disfluencies anderrors were summed for each of the groups. Group means
118

were calculated for each category of analysis within thedefinition of Fluency and Accuracy, and discriminantanalysis used to discover whether or not these categorieswere capable of discriminating between the groups ofstudents. When this proved to be successful, banddescriptors were written using the original categorydescriptions and the actual data from the interviews.
Two rating scales were generated in this way, onefor the measurement of fluency and one for themeasurement of accuracy, as described in Chapters 4 and5.
In order to study the reliability and validity ofthese two rating scales the three tasks used in theresearch were developed in 1990. They were informallypre-tested on a group of five students and then slightlyadjusted to take into account potential problems in thesmooth transition between the Warm-Up, Task and Wind-Downphases. The tasks were conducted in February and March1991, with 47 students of English in Cyprus. Theprocedure used in the conduct of the tasks is describedin full in Chapter 6. All interviews were recorded onvideo for future rating.
Each student took the three tasks within no morethan one and a half weeks, and immediately uponcompletion was asked to fill in an extensivequestionnaire on their test taking experience. Theanalysis of the questionnaire results formed the basisfor the investigation of affective factors, which were
119

considered to be one facet of the test method. Theinterpretation of the questionnaire is reported inChapter 7. Eight of the 47 students took part in aretrospective study two weeks after they had completedthe oral tasks. It was hypothesized that such a studywould throw light on test method facets of which thestudents were consciously aware when taking oral tests,and that the data gathered would provide extrainformation which would feed into the validity study ofthe rating scales by indicating whether or not aspects offacets other than trait were systematically affectingscores. The observations and opinions of each studentwere recorded on audio tape after they were shown anextract of one of their tasks on video. The transcriptsof these interviews were used as the basis for aretrospective study reported in Chapter 10.
Five raters were asked to rate all 47 students onthe three tasks on the Fluency rating scale, the Accuracyrating scale and the ELTS global rating scale as quicklyas possible during the summer of 1991. Copies of thevideo cassettes were given to the raters at the beginningof August 1991, and were returned by mid-september. Eachrater therefore had to award a total of 423 scores,providing 2115 separate ratings. These ratings were usedas the basis for the reliability and validity stUdies ofChapters 8 and 9. Reliability was investigated usingclassical analysis, a G-study and a Rasch Partial Creditmodel. Concurrent validity was studied using stUdent
120

scores on the University of Cambridge First Certificatein English and concurrent teacher assessment, employingcorrelations and Principal Axis Factor Analysis.Construct validity was investigated using a Multitrait-Multimethod design, Maximum Likelihood ConfirmatoryFactor Analysis, and a Rasch Partial Credit Model.
The raters were also asked to keep notes on anyproblems observed or difficulties they had while rating,and each of the raters was then interviewed. Theinterviews were recorded on audio tape and latertranscribed. The retrospective rater study is describedin Chapter 10.
The analysis of the data was carried out betweenSeptember 1991 and May 1992.
121

Chapter Four
The development of a Fluency rating scaleSection 1: Introduction
Although many scales used in oral testing are of aglobal nature, there have been attempts to producecomponent rating scales such as those in the FSI oralinterview procedure. All of these component rating scalescontain similar concepts of what goes to make up thesuperordinate construct "oral ability," two of which areinvariably the constructs "fluency" and "accuracy".
The constructs of fluency and accuracy have what maybe termed an "intuitive reality" for most members of theteaching profession, who would claim that they couldidentify degrees of each in specific students. Indeed,much material development practice has grown up around"fluency practice" and "accuracy practice" and theconcepts-have been used in SLA (see pages 115 - 116). Andyet, whether or not they are ratable in oral tests asvalid components of oral ability has not beenspecifically investigated.
The development of a Fluency rating scale has beenplagued by a lack of operational specificity since thevery earliest FSI oral rating scales. In the FSIcomponent scale for fluency, the scale constructorsrelied on vague concepts such as "slow and uneven speech"at band 2, and "hesitant and jerky speech" at band 3. Atband 4 "groping for words" and "unevenness" is said toresult in rephrasing, whilst by band 5 and 6 speech is
122

said to be "smooth".The criterion of "hesitation" is also frequently
found within rating scales of fluency. Some rating scalesrely on the notion of hesitation alone, despite the factthat the phenomenon of hesitation is not well understood.
Two examples will suffice to highlight the point.These are taken from the university of Cambridge LocalExaminations Syndicate First Certificate (FCE) andcertificate of Proficiency (CPE) examinations.
The FCE Fluency rating scale5 Comfortable and natural speed and rhythm in everyday
contexts, though there may be some hesitation whenspeaking in more abstract topics.
4 In everyday context speaks with minimal hesitation.Hesitation when discussing abstract topics, but doesnot demand unreasonable patience of the listener.
3 Does not hesitate unreasonably in everyday contexts,though may experience some difficulty with moreabstract topics.
2 Unacceptable hesitation, even in everyday contexts.1 Speech very disconnected.o Not capable of connected speech.
The CPE Fluency rating scale5 virtually native-speaker speed and rhythm, and
coherent presentation of thoughts, in all contexts.4 Foreign, but with minimal hesitation in all
contexts.3 Minimal hesitation in everyday contexts, but some
hesitation when discussing more abstract topics,though not such as to demand unreasonable patienceof the listener.
123

2 Hesitation not unreasonable in everyday contexts,but impedes understanding on more abstract topics.
1 Speaks haltingly even in everyday contexts.o Not capable of connected speech.
It would appear that the only theory (if theory itcan be called) underlying these two scales amounts to theprobably untested assumptions that (i) the better astudent's English the less hesitation will be evident inperformance, (ii) hesitation is much more likely whentalking about "abstract" topics than "everyday" topicsand, given the CPE band 5 descriptor, (iii) nativespeakers do not hesitate a great deal.
Fluent speech is often "disconnected", and "speed"and "rhythm" remain undefined: an analysis of nativespeaker talk reveals that unless the speech isdeliberately pre-planned, hesitations and reformulationswill abound (Fulcher, 1987). In the 16 briefconversational extracts in Crystal and Davy (1975) 146examples of the hesitation marker/filler "er(m)" werefound, showing that assumption (iii) above is clearly notthe case.
If the third assumption is false, it follows thatthe first assumption is also likely to be false, butwould benefit from empirical investigation. The realquestion is why the speech of both natives and foreignlearners contains hesitation. The second assumption ismerely baffling. Apart from the fact that "everyday" and
124

"abstract" are not defined but left to the intuition ofthe interviewer, there is no empirical evidence tosuggest that talking about, say, politics in the ThirdWorld would prompt more hesitation than describing one'skitchen. The opposite may very well be true, as incourses leading to the FCE and CPE examinations studentsoften discuss such subjects - subjects on which theymight reasonably be expected to have some opinion. Notmany native speakers or foreign learners find it easy todescribe a ball-point pen (a "simple" topic in the FSIoral interview)!
Studies of hesitation phenomena have, however,suggested that time spent in hesitation is directlylinked to "cognitive processing time" (Butterworth, 1975:84), and that lexical selection may be one of the mostimportant factors which influence hesitation. Chaudron(1988: 70) also suggests that pauses are often likely tobe linked to planning phenomena. In a study of monitoringand repair in speech, Levelt (1983) found that 38% of allrepairs were of a lexical nature, although heacknowledged that it was often extremely difficult todecide if the repaired lexical item was a real "error" orwhether the speakers were making their utterancesemantically more accurate (ibid., 54).
These studies suggest that the simplistic approachadopted by the developers of rating scales may result inthe scales and band descriptors being invalid.
125

Section 2: A working definition of FluencyInitially it is important to decide on what
phenomena which can be observed within speech constitutean interruption in the fluency of speech. For thepurposes of this study six phenomena were isolated aspotentially interrupting fluency from an analysis of thetranscripts of twenty one oral interviews, probablyaffecting the score given by an interviewer during anoral test. (It must be stressed that these phenomena areobservational in that they occur on the surface of speech(verbal phenomena), and their description in no wayconstitutes an explanation of fluency. To provideexplanations or interpretations of what is observed willbe discussed shortly). The categories of phenomenagenerated in this study do not differ from the literatureon fluency which discusses verbal aspects of performancewhich interrupt fluency (Grosjean, 1980; Hieke, 1985).The data itself did not suggest any further phenomenawhich might have been investigated. The phenomena (or"exponents") are:
1. Fillers such as "er(m)".2. The repetition of the first syllable of a word or a
full word.3. The negotiation of reference indicated by the re-
selection of referring devices.4. The re-selection of lexical items.5. Anacolouthon.
126

6. Longer pauses, indicated in the transcripts andexamples as two or three colons.
category 6 needs special comment as this is an arearelated to the observation of fluency related phenomenawhich has recently seen much controversy. Studiesinvolving the analysis of pauses in the second languageliterature have mainly concerned themselves with teacherspeech and the role of pauses in adapting tocommunication with non-native speakers/learners (Ellis,1985a: 145 - 146; Chaudron, 1988: 69 - 70), thesuggestion being that speech rate is slower and thelength of pauses greater in native speaker - non-nativespeaker communication similar to that observed betweenadults and children (Gais, 1977 as discussed inAllwright, 1988: 215), and that these phenomena help thecomprehension of non-native speakers. Most of thesestudies do not use spectograph analysis, and themethodology used has come under severe criticism for lackof accuracy in measurement and drawing unsubstantiatedconclusions from poor quality data (Griffiths, 1991).
Here, we are concerned with the effect that theimpression of hesitation phenomena exhibited by non-native speakers under test conditions, including pauses,have upon raters. It is acknowledged that Griffiths'criticism of L2 research in the field of what he calls"pausology" is equally applicable to the way in whichpauses in category 6 of this data were observed and
127

recorded, that is, in terms of the impression created forraters. However, in defence of the analysis of thiscategory, it must be said that the purpose of theanalysis is somewhat different to that carried out in thecurrently available literature: we are not claiming thatrate of speech and number of pauses is directly linked tocomprehension, which after all is the major issue atstake. What is claimed is that the length and, perhaps,the nature of pauses in an oral test may be related tothe impression given to the rater regarding theproficiency of the student and hence be related to thescore which is awarded. For this purpose, precisemeasurement of pause length as advocated by Griffithsdoes not seem - at least for the present - to be amethodological consideration of primary importance.
with regard to all of the 6 categories ofobservational phenomena isolated as being related to theimpression of fluency, it needs to be stressed that otherfactors not taken into account here, such as accent andpropositional content, may go to provide a cumulativeimpression of the fluency of a speaker. The approachtaken here has been to ignore phonological aspects ofproduction which are most often treated separately in thetesting literature and given a separate scale incomponent rating instruments. other aspects of discoursesuch as the quality of propositional content are excludedbecause in an oral language test it is at least hopedthat the student would be rated on language ability and
128

not the ability to develop an argument. Quality ofpropositional content would necessarily be linked to thetopic of the task, thus favouring some students ratherthan others. It is therefore argued that a quality ofpropositional content rating scale would be moreappropriate for an ESP oral test in which it might beexpected that each student should be able to develop anappropriate argument in the L2, perhaps for attendance ona postgraduate course in that language. For a generaltest of oral proficiency including aspects of assessmentwhich are likely to be task or topic specific couldeasily introduce further bias into the testing process.Further, it could very well be argued that the quality ofpropositional content does not represent an observedverbal phenomenon as described here. However, an attempthas been made to relate aspects of hesitation phenomenato attempts to develop propositional content inexplanatory category 2 below, although the quality of thepropositional content is seen to be outside the realms ofan oral language test.
It is, however, not being claimed that the sixcategories of phenomenon isolated for study represent acomplete and exhaustive definition of verbal elementswhich may be observed in the study of fluency. Indeed, itwill be seen (pages 163 - 164) that other observableverbal elements were later considered to be worthinvestigation, and there may be others which have notbeen taken into account in this study.
129

Section 3: Data and analysis of categoriesThe data which was used for this study came from
twenty one oral interviews conducted in Cyprus with Greekspeaking learners of English. The students were selectedat random from students taking the ELTS test at theBritish Council, Nicosia, in 1989. As it was consideredimportant to collect the data under very similarcircumstances, it was necessary that they all beinterviewed by the same person under the same conditions,as far as possible, in the shortest amount of timepossible. At the time, twenty one students was themaximum number that the interviewer could test within areasonably small period of time. All interviews weretranscribed by the researcher, and a coded transcript ofone interview is provided in Appendix 4.12. The twentyone interviews were all conducted in the same room usingthe same interviewer, on three separate occasions withinthe space of one and a half weeks in 1989. This was donein order to control for test method facets such asphysical environment and the style of the interviewer asmuch as possible. All the interviews were transcribed forlater analysis in conjunction with the recorded tapes ofthe interviews.
Examples of phenomena which fell into theobservational categories were isolated by the researcherfrom the transcripts and the tapes of the interviews, andthen it was necessary to interpret the examples in termsof the explanatory categories. Where it was possible to
130

specify linguistic criteria for identifying one of thephenomena concordancing facilities were used to extractall occurrences from the transcripts in order to isolateconsistencies in the data.
The verbal phenomena or exponents of fluency asdescribed in the categories above were isolated and eachexample was placed into one of eight explanatorycategories. The exponents are observable verbal elementsof speech which are said to constitute an interruption influency. The explanatory categories represent an attemptto say why fluency appears to be interrupted (or not, asthe case may be) rather than merely recording tallies ofsay, examples of pauses of different lengths. It isnecessary to introduce explanatory categories in additionto the categories of verbal phenomena because the samephenomena may be interpreted by raters in different ways.For example, some longer pauses may be interpreted byraters as indicating that communication has broken down,and the student would therefore be penalised on therating scale. However, it is quite possible that therater will consider certain pauses as being "thinkingtime" in which the student is seriously considering thecontent of the next utterance, and thus be prepared toaward a higher band for natural language behaviour(Meredith, 1978). The explanatory categories weregenerated by the researcher from the data itself, ratherthan attempting to produce explanatory categories on ana-priori basis.
131

Unless it is possible to claim a one-to-onerelationship between the categories of phenomena and theexplanatory categories into which they are placed, it isalways possible for the researcher to be challengedregarding the interpretation of the data. It is thereforeimportant to look at problems which arise in a contextwhere observed phenomena described as interruptingfluency are then transferred to explanatory categoriesfor the use in actual scale development.
Long (1983: 3) makes clear the difficulty faced byan approach to scale development which depends upon theanalysis of actual learner speech when he comments onsimilar difficulties faced by any researcher who isworking with spoken data. Although researchers recognise"the bias in one person reporting events" they areprepared to do this in order to attempt a meaningfuldescription of the phenomena which they observe. In thecontext of this study, it would be possible merely toobserve the six phenomena which have been listed above,and to use the number of occurrences as a guide to scaleconstruction. Such a scale would, it is suggested, betermed a "low inference" scale, which relates to specificobserved behaviour during an oral test. It may behypothesized that this would lead to increasedreliability in using the scale developed, but would havethe disadvantage of making it trivial in the sense thatno inferences are actually being made about why theobserved behaviour is occurring. When discussing the use
132

of low-inference observational categories in connectionto classroom observation, Long comments:
"The increase in reliability that these aredesigned to bring is largely mythical •.•andcomes at a high price. A focus on overtbehaviour may, for example, "reliably" preemptthe explanatory power of a study by precludingconsideration of participants' intentions."(Long, 1983: 13)
Long was, of course, attempting to deal with dataderived from classroom observations, whilst this study isattempting to deal with the development of valid ratingscales in oral tests. However, the example of thedifference between low and high inference interpretationwhich Long provides may help to clarify the issue atstake. Long (1983: 13 - 14) provides the followingextract from an intermediate class:
1. T: •••OK? Chemical pollution. OK.2. 54: (Yawning) 0 0 o.3. T: Trousers! Alright, Carlos [54], do you weartrousers?4. 54: Alway ••All my life.5. 55: (laughter)6. T: Always. You've worn, I have •••7. 54:Eh wear wear (inaudible).8. T: I have ••• well, do you wear trousers?9. 55: I wear.10. 55: I wear, I wear.11. 54: Yes, I I do.12. T: Yes, you do. What's how do you say that word?13. 54: Trousers.14. T: Trousers.15. 54: Trousers.16. T: Trousers.17. 54: Trousers.18. 53: Trousers.19. T: Mm hm. Have you got trousers on?20. 53: Yes, I have.
133

21. T: What kind?22. 53: Jeans.23. T: Jeans .••Say the word jeans. Jeans.24. S3: Jeans.25. T: Jeans.26. 52: Jeans.27. T: Jeans.28. 51: Jeans.29. T: OK. OK. Huh! Does anyone need an ashtray.
Long argues that current forms of analysis ofclassroom interaction which depend on low inferencecategories could not capture the observation made by Longhimself that the exchanges in this extract were motivatedby 54 who overtly expressed boredom, and by the use ofthe joke in line 4 was directly challenging the"usefulness of the lesson" (Long, 1983: 14). The drillingwhich follows is used by the teacher to reassertauthority and not to drill new vocabulary. Thisinterpretation of the data is "high inference" in thatexplanation is introduced which is not strictly datadependent. It may even be said that a theory is beingintroduced to account for the data as observed. However,it must be remembered that a transcript is a reduction ofthe entire data, and with the additional use of therecording of the lesson, the high level inferences wouldseem to be much more legitimate than through mereanalysis of the transcript.
In the explanatory categories which have beengenerated for the purpose of the Fluency rating scaledeveloped here, there is no one-to-one relationshipbetween the observed phenomena listed in the six
134

categories above and the explanatory categories, as anattempt has been made to interpret the purpose of theinterruption to fluency in each case. As such, it tendsto be a high inference scale which, while being more opento criticism and certainly more difficult to create, doesoffer the possibility of non-trivial description ofstudent performance.
section 4: Eight Explanatory categoriesThe data suggested that observed interruptions in
fluency could be accounted for by eight categories. Theseare:
1. End of turn pauses: pauses indicating the end of aturn.
2. content planning hesitation: pauses which appear toallow the student to plan the content of the nextutterance.
3. Grammatical planning hesitation: pauses which appearto allow the student to plan the form of the nextutterance.
4. Addition of examples, counter-examples, or reasonsto support a point of view: these pauses are used asan oral parenthesis before adding extra informationto an argument or point of view, or break up a listof examples.
5. Expressing lexical uncertainty: pauses which marksearching for a word or expression which has beentemporarily forgotten or about which the student isuncertain.
6. Grammatical and/or lexical repair: hesitationphenomena which appear to be associated with self-correction.
7. Expressing propositional uncertainty: hesitationphenomena which appear to mark uncertainty in theviews which are being expressed.
8. Misunderstanding or breakdown in communication.
135

Although it has been stated that the aboveexplanatory categories are, generally, high inferencecategories, they do vary in the amount of inference whichis necessary on the part of the researcher. category one,for example, is fairly low inference in that it merelyinvolves observing those pauses which occur at the end ofturns where propositional content is coherent. categorytwo, on the other hand, is high inference in that onemust attempt to decide when hesitation occurs because thelearner is deciding what to say next, as opposed to howto say it, which is the definition of category three.This means that when an example of one of the sixphenomena described as constituting aspects of fluency isobserved, it must be decided into which of the eightexplanatory categories to place it.
Any non-trivial descriptive system will suffer fromsuch problems of indeterminacy in the developmentalstage. (When a set of observations or interpretations aresaid to suffer from "indeterminacy" we mean that there isdoubt about the degree to which they represent a "fact ofthe matter" state in the world which is independent ofthe research which generates them (Miller and Fredericks,1991: 4 - 5». However, when developing a rating scalethe adequacy of the initial analysis and construction ofband descriptors based on that analysis comes in thetrialling of the scale. That is, if the initial analysisand the band descriptors which can be constructed on thatbasis are valid descriptions of levels of fluency, then
136

validity coefficients for those bands will be acceptablyhigh thus providing evidence that a data-driven approachto rating scale development was useful. On the otherhand, if the band descriptors do not relate to observablebehaviour and if raters cannot apply the concepts in thepractice of rating students, then the validity of thescale would be low, and suggest that a data-drivenapproach to scale development may need to be trivial andthus possibly not preferable to a-priori scaledevelopment.
The eight explanatory categories used are describedhere in full, with examples.
category One: End of Turn PausesThe most frequent use of extended pauses in the data
was at the end of a student's turn (in the examples, aliB"turn). Example 4.1 is taken from a student awarded aband 4 of the ELTS rating scale.
Example 4.1.B> •••fifteen thousand womans went to er: prisons :: er::: A> and since then B> yeah A> has there been anincrease or a decrease •••"
In these cases, it would appear that the studentspause because they are not able (or willing) to continuespeaking. The interviewer does not begin his turnimmediately as he is waiting for the student to continue.The interviewer in the oral test appears to be highly
137

sensitive to the possibility that the student needs timeto plan what is going to be said next, and therefore theamount of overlapping speech may be much less than inless formal interaction, and the amount of silencebetween turns increases, something which would be highlyembarrassing in informal talk (Sacks, Schegloff andJefferson, 1974).
When turning to the high scoring students(arbitrarily defined as band 7 and upwards on the ELTSrating scale), we discover that the amount of this typeof hesitation is somewhat different in format. Forexample:
Example 4.2.A> •.•it sounds absolutely [fascinating B> it is]:: A>actually •••
In this example the B turn overlaps with theprevious A turn, and the pause allows B to continue theconversation if B so desires. It is not taken up, and soA continues not by asking another question to get thestudent to complete the proposition (as it is alreadycomplete!), but by continuing the conversation. In oraltests, the experienced interviewer does not really wishto keep a turn for any length of time. When theconversation is more "natural" with higher abilitystudents, the interviewer appears to take moreresponsibility for the existence of potentiallyembarrassing pauses, as is shown in example 4.3.
138

Example 4.3.B> •••but that takes a while::: A> so: my next questionis•••
It would seem that in example 4.3, A is embarrassedat having allowed such a long pause at the end of thestudent's turn, and therefore uses a discourse marker oforganization at the beginning of the turn, and an overtsignal that he is in a dominant social position bystating that he is there to ask questions. Thisparticular example may be compared with phenomena such asthose discussed by Long (1983: 14) in which teachers(and, we assume interviewers) negotiate discourse in sucha way as to maintain their social role in theinteraction.
catego~ Two: content Planning HesitationHesitation does seem to have a significant
psycholinguistic role in that it allows the speaker timeto formulate a plan for the next chunk of language. Oneaspect of this planning is the content of the utterance.
Example 4.4.B> •••some in the lungs:: from the lungs it goes erthrough the reticuloendothelial system .••
Example 4.5.A> •••in this way B> what reason:: I I should say it mustbe the er: our er: con er contribution to •••
In example 4.4 the student is considering the next
139

step in a process which is being planned with the help ofan input diagram. In example 4.5, the student overtlyindicates that content planning is going on, as thequestion which the interviewer has asked is summarisedbefore the pause and the beginning of the answer. Thisseems to be a case of the student "thinking out loud" orintrospecting, which enables the researcher to classifythe example fairly easily.
In example 4.6, the student appears to beconsidering her future plans and the time used after thefiller is to plan the content of the next part of themessage.
Example 4.6.B> I think that we'll we will be together A hm hm B> ander:: after that I want to: to be a judge •••
category Three: Grammatical Forward PlanningGrammatical forward planning occurs when the student
may know what to say, but does not know how to say it.Thus, the planning stage needs time, and the executionmay also contain other hesitations and structuralreformulations.
Example 4.7.A> ..•kind of a job do you want:: B> when I chose thissubject: I:: I chose this sub I chose this subjectbecause I think I can •••
In this example, it appears that the student wishes
140

to express the view that the subject of study was chosenbecause of the ease with which (she goes on to say) itwould be possible to get any kind of job. The purposeclause, beginning with "because •.." is therefore the mostimportant part of the message. However, having begun with"when" the students seems to find difficulty in actuallyformulating the message intended as it requires a purposeclause which cannot be used given the colligationalrestrictions which have been activated, unless thestudent can U$e the cohesive form "I did so (because)".Hence, the medium length pause after "I" and the tworeformulations. In the process the use of "when" isavoided, and the purpose clause is successfullyintroduced.
Example 4.8.B> •••er in the fields er: the house:: they they have erthey have their work they gets like er: like er: •••
In example 4.8 in the formulation of the utteranceafter "house::" the student gets across the messagebecause of the collocation of "work" with "house" and"fields", whilst the hesitation associated with themultiple use of "they" (referring to girls who live invillages) indicates that the appropriate grammaticalstructures to produce an accurate utterance may not beavailable even though the student is searching for them.
In example 4.9 below the repetition of items at thebeginning of the utterance indicates that planning is
141
taking place.
Example 4.9.B> I I with within these three months I will be able toknow a lot of this to come back to Cyprus to make somelectures to others.
category Four: Addition of examples, counter examples, orreasons to support a point of view
It was observed that a pause or a filled pause oftenprecedes the addition of an example or reason when thestudent is presenting an argument, adding to orsupporting what has already been said, as in example4.10.
Example 4.10.B> •••the television crimes and they are trying to mimethem:: and er: the newspapers as well they don't erm:stick to the facts •••
It may also be noted that in the clause after thefilled pause here the phrase "as well" overtly signalsthe additional nature of the information to support theargument. Students of higher ability were noticed to beparticularly adept at using pauses or fillers tointroduce an additional element to their argument: in thecase of example 4.10, copying crimes on television is onecause of the increasing crime rate, but another cause maybe the sensationalism of reporting in the written media.Another example of the simple addition of examples isgiven in example 4.11.
142

Example 4.11.B> •••diarrhoea vomiting A> hm B> headaches and er:ataxia erm:: convulsions sweating A> it sounds prettyhorrible B> yeah it is••.
An example of a counter argument is given in example4.12.
Example 4.12.B> •••l was interesting about this subject:: of courseerm: you might erm: think that er since I: I amalready •••
The student in example 4.12 provides a reason why hewishes to pursue a subject at university, and then goeson to give a reason why it may be thought that he wouldnot be interested (namely that he is already employed inthe area) and then goes on to justify his originalinterest.
Amongst the students who received lower band scoreson the ELTS rating scale very few occurrences of givingexamples, counter examples or reasons were observed. Whenthey did occur the most common use was that of adding toan utterance in order to give content to a general wordwhich otherwise would have remained empty. Such generalwords are often referred to as "delexical" in that theydo not of themselves contain any specific meaning, andhave to be filled out with reference to context or otherparts of the discourse (Winter, 1978). This is the casein example 4.13, where the delexical "routine" is filledout with the specific information of going to the office
143

and (after this) doing the work which is assigned by asuperior.
Example 4.13. .B> it's the same thing every day the same routine:: erI've got to go every morning to the office •••
category Fiye: Expressing Lexical uncertaintyWhen choice of a lexical item was a problem for a
student in the higher bands of the ELTS rating scalethere was a tendency for it to be overtly marked, whilstnot causing any strain on the interaction. Examples 4.14and 4.15 demonstrate this.
Example 4.14.B> .••rate is increasing A> hm hm B> of girls ercommitting:: er loneliness or what what do you call it: Imean: committing crimes ••.
Example 4.15.B> •••physical disaster than er there is no erm: civilliability:: I think that is how A> hm hm B> it is called:but er in in case er •••
In example 4.14 the lexical item needed does notcome to mind, but the student still continues andexplains what he wishes to say in another way. This useof circumlocution marks the student as a competentcommunicator. In example 4.15 the student appears to needtime to consider the use of the expression "civilliability" and overtly marks concern over the selection,but continues once the interviewer has indicated that
144

this makes sense and that the student has communicatedhis intention.
Example 4.16 is from a student in the lower bands,and is an example of the abandonment of the word when itis realised that the correct form is not known for thecontext.
Example 4.16.B> one er English legal system philosophy: erm: governer:: and er: er tort contract A> hm B> and it's all •••
At times, the failure to retrieve a lexical itemrequired and the inability of the student to circumlocutemay lead to difficulty in retrieving a message, as inexample 4.17 where the message is unclear.
Example 4.17.B> •••they they have a choice with going to er: witherm:: er stranger ma with people A> hm B> going to drugs:to: with with er •••
category Six; Grammatical or Lexical RepairWhen analyzing the data the separation of
grammatical and lexical repair was found to be virtuallyimpossible. The two appear to overlap to such an extentthat to separate individual examples would have involvedwhat was considered to be an undue amount of subjectivedecision. Grammatical and lexical repair were thustreated as a single category.
In example 4.18 the student uses an incorrect
145

preposition, but repairs this in a repetition of theentire prepositional phrase, and appears to consider thenext utterance carefully, repeating the correctpreposition twice. Example 4.19 is interpreted similarly.
Example 4.18.B> ••.is stored in in the body er on the bones: in thebones: and::: if the:: plutonium is stored in the body inin the bones A> hm hm B> .••
Example 4.19.B> •••erm: in the other on the other hand:: erm I have myclearly medical duties A> hm hm B> in diagnosis •••
In example 4.20 we have an example of anacoluthonwith a slight pause. After two false starts in this casethe student realises a structure which will allow themessage to be communicated. The two previous starts wouldprobably have led to trouble in completing theproposition.
Example 4.20.B> •.•but I think in cyprus: er in we are not very: thegirls are not er crim criminals
At times the accuracy of the utterance breaks downcompletely, and a pause probably indicates that re-planning is taking place, as in example 4.21.
Example 4.21.B> •••essay: er about er: the metals: er but it er: Icouldn't er:: the subject was about er: which metals canbe used er: in a car •••
146

It is suggested that in example 4.21 the repair isfairly successful: following the phenomenon ofanacolouthon an appropriate grammatical structure tocomplete the sentence is found.
category Seven: Expressing Propositional Uncertainty.It was observed that students tended to hesitate
when expressing uncertainty about a point of view or anargument which was being presented. This may be connectedto the fact that the interviewer is the socially dominantpartner in the interaction, as observed by Channell(1985). The student may attempt to avoid strong claimswhere points of view are presented as fact andpotentially seen as challenging a dominant partner: thiswould not occur when the interviewer is offered thepossibility of disagreeing.
Examples 4.22 - 4.24 falling into this category wereclearly marked not only with hesitation phenomena butalso with one of the following items which makescategorisation somewhat easier: perhaps, maybe, think,believe, don't know, or sometimes.
Example 4.22.B> •••so we have no time to: study: for out school: anderm:: er but I think that er English schools that er all:are the best ..•
Example 4.23.A> .••what kind of a job would you be looking for B>erm:: maybe in er in the government er the best [place A>bm] B> to work •••
147

Example 4.24.B> •••communication between students and: er: teachers A>yeah B> erm:: well I think that er (inaudible) is er goodA> hm •••
The co-occurrence of the hesitation phenomena withthe overt lexical items isolated gives to the utterance asense of reservation on the part of the speaker whichwould admit the possibility of a challenge from theinterlocutor.
category 8; Misunderstanding or Breakdown inCommunication.
Examples from the data which were placed into thiscategory came entirely from those less able students whoreceived a band score of 4 or 5 on the ELTS rating scale.
Example 4.25.A> •••has there been an increase or a decrease incrime::: B> increase:: in crimes:: A> has there been anincrease or a decrease in the crime rate •••
In example 4.25 the student has not understood thequestion, and echoes part of the interviewer's utterancenot as an answer but as an indication that the questionhas not been understood. Without the hesitation it mighthave been taken as an answer. In example 4.26 the studentexplicitly acknowledges that he has not understood thequestion.
148

Example 4.26.A> •••adult literates in nineteen sixty B> er::: at erm::I didn't understand the question A> yeah: well where itsays •••
section 5: Discriminant analysisIn order to create a Fluency rating scale in which
the band descriptors are generated by the data, it isnecessary to make tallies of the observations classifiedinto each of the eight explanatory categories describedabove, and compute discriminant functions for the eightcategories to see whether or not, taken together, theyare able to predict membership of the ELTS band scoreswhich the learners who provided the data actuallyreceived in the oral test. Discriminant analysis allowsthe researcher to investigate (a) the extent to which allcategories together, and each individual category takenseparately, discriminate between the students, and (b)the extent to which students would have been reliablyplaced in the bands which they actually received in theELTS oral interview had they been rated on the categoriesdeveloped (Crocker and Algina, 1986: 256 - 263).Clearly, an assumption is being made in the use of such atechnique in the development of a scale: that thestudents were at least rank ordered appropriately interms of ability by the ELTS oral interview. For themoment, it will be assumed that this was indeed the case,although comparison between the ELTS rating scale and therating scales developed in this study will be made in
149

Chapter 11.In the discriminant analysis tallies of the
phenomena described within each of the eight explanatorycategories were regressed on the actual band scores ofthe students, which operated as the categorial variablein the analysis. It was assumed that if it provedpossible to discriminate accurately between studentsusing the categories isolated, it should also provepossible to develop a rating scale on the basis of thedata which could then be validated in use on other groupsof students. That is, if the categories are found todiscriminate between students placed in certain bandsthey may then be used to create verbal descriptors fornew bands by returning to the description which generatedthe categories. The new descriptors thus containdefinitions which are directly linked to actual L2
production in test conditions.only one student was awarded a band 8 and one a band
9, and so these were pooled during the analysis. Thefrequency distribution of scores on the ELTS test arecontained in Table 4.1 in the Appendix to Chapter 4.
The multivariate results presented in Table 4.2 inthe Appendix to Chapter 4 were produced to predict, fromall observations on all categories, the students' actualoral test scores. This shows the degree to which allcategories taken together are capable of discriminatingbetween the students. wilks' Lambda is the test of themultivariate hypothesis that subjects can be divided into
150

groups from observations (Wilkinson, 1988: 538). Theresult of the mUltivariate analysis is significant at p =.02, indicating that when taken together the categoriesdo seem to discriminate well between students. It willalso be seen that the first discriminant function in theanalysis is significant, but the second and subsequentfunctions are not.
Table 4.3 provides simple correlations between eachof the categories and the ELTS band for the 21 students.Although these correlations show a clear reduction inhesitation for grammatical planning and misunderstandingor communicative breakdown (categories 3 and 8) and anincrease in the use of hesitation to introduce examplesor arguments (category 4) with increasing studentability, these correlations mask other differencesbetween ability levels. These are discussed withreference to the means for each band on each category onpages 153 to 159 below, where it will be demonstratedthat we are not in fact dealing with linear phenomena.
Finally, by using discriminant analysis it ispossible to analyze the relationship between the bandscore actually awarded to each of the stUdents and theband score which would be predicted on the basis of thecategories which are thought to represent aspects ofperceptible interruptions in the fluency of speech. Theresults of such prediction is presented in Figure 4.1.
151

Fig. 4.1. The relationship between actual band scores andpredicted band scores for explanatory fluency categories.Band Awarded I Predicted Band Total
112 3 4 5-------------------------~---------------~---------------1 I 3 0 0 003---------------------------------~-----------------------2 o 4 o o o 4
3 o o 7 1 o 8
4 loo 0 4 0 4---------------------------------------------------------5 I 0 0 0 0 2 2
Total 3 4 7 5 2 21--------------------------------------------------~------In Figure 4.1. band 1 represents a band 4 on the
ELTS rating scale, band 2 an ELTS band 5, and so on, butwith band 5 being the conflated bands 8 and 9. In theleft hand column we have the bands which were actuallyawarded in the ELTS oral test, and these are comparedwith the bands which would have been awarded if they hadbeen awarded on the basis of those explanatory categorieswhich proved significant discriminators in thediscriminant analysis (Wilkinson, 1988: 589). Thus, forexample, eight students were actually awarded a band 3(ELTS band 6), whereas if these eight students had beenawarded their score on the basis of the significantlydiscriminating explanatory categories only 7 would havebeen awarded a band 3 and one would have been awarded aband 4.
It may be seen from Figure 4.1 that only onecandidate would have been given a different band score.
152

As prediction appears from this data to be very accurate,this may be taken as an indication that the data-drivenapproach to scale development is indeed worth pursing.
Section 6: Producing Fluency rating scale descriptorsHaving discovered from the discriminant analysis
that a single discriminant function allows prediction ofthe ELTS band score from the eight categories describedin Section 4 above, we may turn to an analysis of thepattern of means on those categories by band score. Thesimple correlation coefficients given in Table 4.3 showthat there is a correlation between category and bandscore and category for categories 3, 4 and 8. However, itwas argued on page 151 that the other correlationcoefficients mask very real patterns in the data whichcan be used in the construction of band descriptors for aFluency rating scale. The mean scores of students in eachband for each category are given in Tables 4.4 to 4.11 inthe Appendix to Chapter 4, and Figures 4.2 to 4.10 onpages 154 - 157 are the graphs of these means by band.
Figures 4.4, 4.5 and 4.10 clearly show the linearrelationship between category and band score. In eachother case there is a non-linear relationship whichnevertheless serves to discriminate between bands on therating scale.
The process of producing scale descriptors can nowbe attempted by returning to the description of thecategories which can be seen to discriminate between
153

Fig. 4.2. category 1 means
lJ......,. 1
Fig. 4.3. category 2 means
154

Fig 4.4. category 3 means
h-t 1 lJ.-p 2
Fig 4.5. cateqory 4 means
b-p 1
155

Fig. 4.6. category 5 means
Fig. 4.7. category 6 means
~1
156

Fig. 4.8. category 7 means
Fig. 4.9. category 8 means
h-p 1 ~2•
157

bands and translating the information for use in newbands which would discriminate between these and otherstudents.
In order to exemplify the process we will examineCategory 1, end of turn pauses, in some detail. On page138 it was observed from the analysis of the transcriptdata and tapes that end of turn pauses were most frequentin students of lower ability and higher ability. Figure4.2 shows this "U" shape most clearly. In the case oflower ability students the pause was interpreted by theresearcher as an indication of an inability to continuespeaking from the evidence provided by the transcripts,the audio tapes and recollections of the interviewitself. In the case of higher ability students, thepauses indicated an end to a propositionally completeutterance and an end of the student turn, to which theinterviewer did not respond immediately because the nextquestion or prompt had not been prepared. End of turnpauses indicate the end of a turn in both cases, but areinterpreted as occurring for different reasons.
This category can therefore be used to distinguishband 1 and band 5 students from those in bands 2, 3, and4, but in a way which also allows a distinction to bedrawn between band 1 and band 5. The rho of -0.023 forthe relationship between band and category 1 in Table 4.3hides this important distinction.
Band 1 in the Fluency rating scale therefore statesthat students often "dry up" or cannot continue a
158

conversation, whilst the Band 5 descriptor states thatstudents often respond to prompts or questions so quicklythat the interviewer appears not to be prepared for thenext prompt or question, and that there is often a pauseas a result.
Such non-linear interpretations are necessary forall categories which have low correlation coefficients inTable 4.3. It must therefore be stressed that in theconstruction of the band descriptors for the Fluencyrating scale it was necessary to interpret theexplanatory categories in the light of the data.
The Fluency rating scale contained five bands whichwere generated by the data, labelled bands 1 to 5. Twofurther bands were attached to the scale: band 0 wasmerely described a "less fluent" than band 1, whilst band6 was described as "more fluent" than band 5. The purposeof this was twofold. Firstly, it is not being claimedthat the rating scale taps the entire range of potentialfluency. That is, bands 1 and bands 5 are not seen asabsolute extremes. It was merely not possible to describeanything less or more fluent from the data, and thisavoids the further problem of suggesting that there issuch a thing as zero and perfect proficiency in fluency.Secondly, it was hypothesized that raters would tend toavoid the highest and lowest bands on the scale, and thusthe inclusion of two additional bands would mean thatthere would be a greater chance of raters using the fullrange of bands which can be described.
159

The Fluency rating scale is given in full below, andan explanation of the relationship of the descriptors tothe eight explanatory categories is contained in [squarebrackets]. It will also be noted that some parts of thedescriptors are contained in (round brackets), as thesedo not appear to be related in anyway whatsoever to thepreceding discussion. This will be taken up later insection 7 below.
The Fluency Rating Scale~dOCandidates in band 0 do not reach the required standardto be placed in band 1.~dlThe candidate frequently pauses in speech beforecompleting the propositional intention of the utterance,causing the interviewer to ask additional questionsand/or make comments in order to continue theconversation [categories 1 and 8]. (utterances tend to beshort), and there is little evidence of candidates takingtime to plan the content of the utterance in advance ofspeaking [category 2]. However, hesitation is frequentlyevident when the candidate has to plan the utterancegrammatically [category 3]. This often involves therepetition of items, long pauses, and the reformulationof sentences.Misunderstanding of the interviewer's questions orcomments is fairly frequent, and the candidate sometimescannot respond at all, or dries up part way through theanswer [categories 1 and 8]. (Single word responsesfollowed by pauses are common), forcing the interviewerto encourage further contribution. It is rare for a band1 candidate to be able to give examples, counter examplesor reasons, to support a view expressed [category 4].Pausing for grammatical and lexical repair is evidentie., selection of a new word or structure when it isrealised that an utterance is not accurate or cannot becompleted accurately [category 6].Candidates at band 1 may pause because of difficulty in
160

retrieving a word, but when this happens will usuallyabandon the message rather than attempt to circumlocute.It is rare for a band 1 candidate to express uncertaintyregarding choice of lexis or the propositional content ofthe message [category 5]. (The message itself is oftensimple) •Band 2
A band 2 candidate will almost always be able to completethe propositional intention of an utterance once started,causing no strain on the interviewer by expecting him/herto maintain the interaction [category 8]. However, justlike a band 1 candidate, a band 2 candidate willfrequently misunderstand the interviewer's question or becompletely unable to respond to the interviewer'squestion, requiring the interviewer to repeat thequestion or clarify what he/she wishes the candidate todo [category 8]. Similarly, (single word responses arecommon), forcing the interviewer to encourage furthercontribution.Although the candidate will spend less time pausing toplan the grammar of an utterance, it will be observedthat there are many occasions on which the candidate willreformulate an utterance having begun using onegrammatical pattern and conclude with a different form[categories 3 and 6]. Similarly, with lexis, there willbe evidence that the candidate pauses to search for anappropriate lexical item and, if it is not available,will make some attempt to circumlocute even if this isnot very successful [categories 5 and 6]. From time totime a band 2 candidate may pause to consider giving anexample, counter example, or reason for a point of view.However, this will be infrequent and when it does occurthe example or reason may be expressed in very simplisticterms and may lack relevance to the topic [category 4].Band 3
A candidate in band 3 will hardly ever misunderstand aquestion or be unable to respond to a question from theinterviewer. On the odd occasion when it does happen aband 3 candidate will almost always ask for clarificationfrom the interviewer [category 8].Most pauses in the speech of a band 3 candidate willoccur when they require "thinking time" in order toprovide a propositionally appropriate utterance [category2]. Time is sometimes needed to plan a sentencegrammatically in advance, especially after making anerror which the candidate then rephrases [category 3].A band 3 candidate is very conscious of his/her use oflexis, and often pauses to think about the word which has
161

been used, or to select another which they consider to bebetter in the context. The candidate may even questionthe interviewer overtly regarding the appropriacy of theword which has been chosen [category 5].Often candidates in this band will give examples, counterexamples or reasons to support their point of view[category 4].(At band 3 and above there is an increasing tendency forcandidates to use "backchanneling" - the use of "hm" or"yeah" - when the interviewer is talking, giving theinterview a greater sense of normal conversation,although many better candidates still do not use thisdevice) •Band 4
A band 4 candidate will only very rarely misunderstand aquestion of the interviewer, fail to respond, or dry upin the middle of an utterance [categories 1 and 8].A candidate in this band will exhibit a much greatertendency than candidates in any other band to expressdoubt about what they are saying. They will often usewords such as "maybe" and "perhaps" when presenting theirown point of view or opinion [category 7]. More oftenthan not, they will back up their opinion with examplesor provide reasons for holding a certain belief [category4]. They will pause frequently to consider exactly how toexpress the content of what they wish to say and how theywill present their views [category 2]. (They will onlyrarely respond with a single word unless asked a polarquestion by the interviewer).There will be far fewer pauses to consider thegrammatical structure of an utterance [category 3] andpausing to consider the appropriacy of a lexical itemchosen is rare [category 5]. A candidate in this bandwill reformulate a sentence from time to time if it isconsidered to be inaccurate or the grammar does not allowthe candidate to complete the proposition which he/shewishes to express [category 6].BandS
A candidate at band 5 almost never misunderstands theinterviewer, fails to respond, or dries up when speaking[categories 1 and 8]. The majority of pauses orhesitations which occur will be when the candidate isconsidering how to express a point of view or opinion[category 2], or how to support a point of view oropinion by providing appropriate examples or reasons[category 4]. However, a candidate at band 5 will notexpress uncertainty regarding these views or opinions as
162

frequently as a candidate at band 4, and so there arefewer hesitations when introducing new propositions[category 7].Very rarely does a band 5 candidate have to pause toconsider the grammatical structure of an utterance[category 3] and almost never hesitates regarding choiceof lexis [category 5]. Band 5 candidates demonstrate aconfidence in their ability to get things right the firsttime. Whilst they do sometimes pause to reformulatesentences this is always because they cannot put acrossthe propositional content of their utterance withoutchanging grammatical form [category 6].It may be noticed by the interviewer that the candidateresponds to questions and prompts so quickly andefficiently that the next question or prompt has not beenprepared, resulting in a pause in the interview while theinterviewer plans his/her next utterance [category 1].Band 6
Candidates in band 6 reach a standard higher than thatdescribed in band 5.
section 7: PiscussionIt will be noted that the sections in descriptors
which are contained in round brackets refer to the numberof single word utterances and the use of backchanneling.Neither of these phenomena were included in the originaldefinition of fluency, nor were they analyzed in the datawhen the Fluency rating scale was first drafted. Whetheror not they properly belong within a Fluency rating scalemay be contentious. However, when developing the Accuracyscale it was discovered that lower ability studentstended not to make many "global errors" because thestrings of speech which they produced were relativelyshort and the messages produced correspondingly simple,whilst single word utterances of higher ability students
163

included backchannels. Although the analysis of singleword utterances and backchannels was carried out inrelation to the Accuracy scale in order to look at thedegree to which error rates related to amount of speechproduced, it was felt that these phenomena were notstrictly related to the accuracy of the student's speech,but to the perception of fluency in maintaining the flowof the conversation.
Single word utterances and backchanneling will notbe discussed further here, as the data is presented anddiscussed on pages 199 - 200 in relation to thedevelopment of the Accuracy scale. It is howeverimportant to note that these parts of the descriptorswere included during a revision process after both scaleshad initially been drafted.
The Fluency rating scale which has been developedhere may well avoid two problems which have already beendiscussed. The first of these is the problem of fallinginto the trap of failing to define abilities in enoughdetail to make it impossible to investigate the validityof the scale. Secondly, the descriptors are specificenough to be relatable to actual language performance ifwe assume, for it must at the moment be an assumption,that the approach to the analysis of the original dataused in this study to develop eight explanatorycategories is a useful one.
Above all, should the scale prove to be reliable andvalid, then it would be possible to make non-trivial
164

claims concerning the generalizability of the definitionsin the band descriptors. One would also hope that itwould be safe to generalize beyond students from thepopulation from which the samples used in this researchwere drawn. This would appear, at the end of the day, tobe the main purpose in attempting to generate descriptorsfrom actual language data.
The data-driven approach to scale development istherefore different from traditional approaches in theFSI and ILR moulds, and also different from the"absolute" scales which researchers are currentlyinvestigating (Bachman and Clark, 1988; Bachman, 1990).The degree to which such a rating scale is successful canonly be evaluated through trialling and validationstudies, but initial evidence from discriminant analysissuggests that this approach to scale development ispromising.
165

Chapter Five
The Development of an Accuracy Rating ScaleSection 1: Introduction
Research into rating accuracy of language in freeoral production is a subject which would appear, with oneor two exceptions, to have been neglected in the testingliterature to date. Weir (1988: 89), for example, notesthat in tests of production it is important to havedetailed marking schemes to guide examiners (in publicexaminations) in rating candidates for the accuracy oflanguage produced. However, he does not expand on this.Madsen (1983, 166 - 174) discusses differences betweenholistic and discrete scoring techniques for accuracy,maintaining that holistic scoring is preferable forexperienced teachers for whom oral evaluation does notpresent any problems. To demonstrate an accuracy scalewhich he believes to be a good example of its type heuses that from the Test of English as a Second Languageof the American Language Institute/Georgetown University(ALI/GU), which is general in terms of its descriptors:
5 points: Uses English with few (if any) noticeableerrors of grammar or word order.
4 points: In general uses "good English," but withoccasional grammatical or word-order errorswhich do not, however, obscure meaning (eg., "Iam needing more English").
3 points: Meaning occasionally obscured by grammaticaland/or word-order errors.
166

2 points: Grammatical usage and word-order definitelyunsatisfactory: frequently needs to rephraseconstructions and/or restricts himself to basicstructural patterns (eg., uses the simplepresent tense where he should use past orfuture) .
1 point: Errors of grammar and word order makecomprehension quite difficult.
o points: Speech so full of grammatical and word-ordererrors as to be virtually unintelligible to"the man in the street."
Underhill (1987) goes somewhat further in expressingthe view that marking oral performance is really quitesimple. In his discussion of scoring (Underhill, 1987: 95- 103) he does recommend the use of rating scales, butdoes not deal with accuracy other than to say that itshould be assessed.
Baker (1989: 84 - 92) is somewhat more sensitive tothe problems of rating accuracy. With reference to theELTS and the FSI rating scales he notes that thedescriptors (especially in the latter test) do not relatedirectly to the language the candidate is to produce. Inhis scale construction recommendations he states thatdevelopers should "make the scales themselves explicitand unambiguous and refer to readily observable aspectsof the performance" (Baker, 1989: 87). Hughes (1989: 102)quotes from the Royal Society of Arts (RSA) intermediateoral interaction scales: "Grammatical/lexical accuracy isgenerally high, though some errors which do not destroycommunication are acceptable." He notes, quite correctly,that:
167

"The reader may well feel that thesedescriptions of levels of ability are notsufficiently precise to use with anyconsistency. In fact, even where specificationis more precise than this, theoperationalisation of criterial levels has tobe carried out in conjunction with samples ofcandidates' performances."
It is precisely this point that has been takenseriously in the development of the accuracy scale to bedescribed later.
These discussions of accuracy in the literature havegone little beyond the observation of Lado (1961: 246)that
"•••rating scales of sample responses at eachrating level are of course an improvement, butunless the rating scale tells the examinerexactly what elements to consider right andwhat to consider wrong, he is still left to hisown opinions and listening habits at the momentof scoring."
Lado argued for explicit descriptors in just thesame way that Baker and Hughes are currently doing.Matthews (1990) is essentially correct when she concludesthat a major step forward in the testing of oralperformance can only come about once attention is givento the criteria against which the performance is to bematched.
Some work has, however, been done in this area.Adams et. al. (1987) and Griffin et. al. (1988) reportthe development of a grammatical accuracy scale using
168

Rasch Partial Credit models in Australia based on a modelsuggested by Higgs and Clifford (1982) and the so-calledFunctional Trisection described by Liskin - Gasparro(1984C). Griffin et. al. (1988: 7) describe the sixareas upon which their tests were developed. Firstly, ageneral objective was described for each test "item", andsecondly a possible language element, namely, the mostlikely grammatical structure which would realise thegeneral objective. Thirdly, the questions used in theelicitation techniques were described by question type,formula for construction and an example of a likelyquestion. Fourthly, restrictions in formation in terms ofvocabulary and context were included. Fifthly theyprovide instructions for obligatory procedures to be usedby the examiners and finally scoring procedures. Anexample, from Griffin et. al. (1988: 10) is as follows:
General Objective: Students will be able to describeactions being performed at the present time.possible Language element: Present continuous forms.Question type: Restricted question.
What I ~re1S I the I I pronounthese
<doing> Ihappening?Formula:
where angular brackets = element to be replaced by a wordor phrase, elements between straight lines arealternatives, and elements in square brackets areoptional.Example: What are these people doing? (a set of sketchesare provided for the test item)
169

Restrictions: The verbs chosen should be selected on thebasis of common actions familiar to the client.Instructions:(a) Place the stimulus in front of the client or
indicate the room or other context to be identified.(b) Elicit three (3) or more responses from the client.(c) If the student falters after the instructions have
been given, indicate specific actions to beidentified.
Response criteria:o - No continuous form used or understandable1 - A number of continuous forms are used but production
of the list involves hesitation and self correction.There is little or no fluency in the production ofthe list.
2 - A clear list of verbs in the continuous form.
Adams et. al. (1987: 21) report that by using Raschfit statistics they were able to confirm that the itemsgenerated from the test work along an "ordered measurabledimension" of grammatical accuracy, and that thisprovides evidence for the validity of the testsdeveloped. This ordered measurable dimension is describedin terms of "task" difficulty in logits, the argumentbeing that if these tasks (or rather items) can be rankedin terms of difficulty then it is possible to claim thata structured (presumably hierarchical) description ofgrammatical accuracy can be produced.
The work described above is useful in that it hasshown one way in which the assessment of task difficultymay be approached. However, it would appear to be oflimited value in direct oral testing as the "tasks" seemto be discrete items which are administered orally; thereappears to be no good reason why they could not be
170

administered by paper and pencil methods to elicit thesame language features.
It may also be noted that in band 1 of the scoringcriteria it would appear that grammatical accuracy is notnecessarily being measured, but the fluency with whichthe students can produce the required response. It is atleast possible that this rating scale is confounding twopotentially separate dimensions of language production,although this has not been investigated by the authors ofthe test.
These criticisms cannot be levelled at the work ofPienemann, Johnston and Brindley (1988), who used"spontaneous speech gathered in unstructuredconversations" in their test and specifically related thescoring criteria to findings in second languageacquisition. Pienemann et. al. (ibid., 220) argue that"second language learners follow a fixed order of stagesin their acquisition of L2 grammatical forms •••" anddeveloped a rating procedure which would allow profilingof learner development. The construction of theacquisition order was based on the analysis oftranscripts of learner speech, originally in German andthen in English, and was hypothesized to be governed byavailable speech processing devices beginning with non-linguistic devices and proceeding to language specificand then target language specific devices. This formspart of an implicational hierarchy which lead Pienemannet. al. (ibid., 225) to form the "Teachability
171

Hypothesis" which states that "the course of secondlanguage development cannot be altered by factorsexternal to the learner." This is in line with work onsecond language acquisition conducted by Ellis (1987b).
Pienemann et. al. developed two observation formsusing the acquisition hierarchy which they had observedin their data, so that raters could tick off occurrencesof grammatical features listed. The features on the formwere a sample from the entire range of features observed,and from this the acquisition of other features could bepredicted from the hierarchical acquisition sequencedescribed. In trialling their system it was found thatthe largest test method facet confounding results wasthat of rater, although they were able to account forthis and provide reasonable initial validity coefficientsfor their method.
This work is noteworthy in the study of theassessment of accuracy in speech, for it shows that it ispossible in theory and practice to use the analysis ofspoken data to devise a rating scale (or observationform) which can then be used in live testing. Further,the final rating of the student can be useddiagnostically to describe the stage of development whicha given student has reached thus providing feedback toteachers which may affect future pedagogical input.
172

section 2: CUrrent criteria of accuracy in oral testsDescriptors relating to accuracy will be reviewed in
the following tests: The University of cambridge LocalExaminations Syndicate (UCLES) First Certificate inEnglish (FCE), Certificate in Advanced English (CAE) andCertificate of Proficiency in English (CPE), theAustralian Second Language Proficiency Ratings (ASLPR),the American Council for the Teaching of ForeignLanguages (ACTFL) rating scale, and the InternationalLanguage Testing Service (IELTS) band scales. The ratingscales associated with these tests were selected forreview because they represent the most widely usedinternational tests which appear to rely heavily onaccuracy as a rating criterion or in which, as is thecase with the UCLES tests, a separate accuracy ratingscale is used.
2.1 UCLES rating scalesIn the UCLES suite of examinations it will be
noticed that the band descriptors for accuracy tend to besimilar across examinations, with the exception of themore recent CAE. In this latter rating scale lexis andgrammar have been combined. As will be seen later in thePrincipal Components Analysis of data on twenty onestudents, there is evidence to suggest that vocabulary isactually a separate ratable component of accuracy, butthat it is capable of being linked directly with levelsof grammatical accuracy through discriminant analysis.
173

Whether it is preferable to keep the two scales apart orcombine them may, therefore, be a matter of research intohow many scales raters are capable of reliably handlingwithin the live testing situation. This is something withwhich this research is not concerned.
The UCLES rating scales are given in full below.
FCE; Grammatical Accuracy5 Use of a wide range of structures to deal with
everyday topics and the expression of ideas andopinions without obtrusive inaccuracies.
4 Basic structures sound although there may be someinaccuracies when complex structures are attempted.
3 Basic structures sufficiently accurate to dealadequately with everyday topics though more complexstructures may cause considerable difficulty.
2 Basic structures often inaccurate in everydaycontexts. More complex structures not attempted ornot intelligible.
1 Consistent distortion of basic structures.o No awareness of basic grammatical functions.
FCE; VOcabula~ Resource5 Appropriate range of vocabulary which allows for
flexibility in dealing with everyday topics.Sufficient resources for expressing opinions, ideasand thoughts of a more independent, individual orspecific nature.
4 Appropriate range of vocabulary to deal witheveryday topics and sufficient to facilitate effortsto express views, ideas and thoughts of a moreindependent, individual or specific nature.
3 Range of vocabulary adequate for everyday topics,though experiences difficulty when required toexpand on topics.
174

2 Vocabulary not adequate to deal with everydaytopics.
1 Lack of vocabulary makes even basic communicationvery difficult.
o Vocabulary not adequate even for minimalcommunication.
CPEi Grammatical Accuracy5 Accurate use of a wide range of structures in
dealing with everyday and discursive issues.4 Use of a wide range of structures in dealing with
everyday and discursive issues. Few errors whenusing complex structures and basic errors very rare.
3 Use of variety of structures in dealing witheveryday and discursive issues. Some inaccuracieswhen using complex structures and a few noticeablebasic errors.
2 Structures mainly accurate in everyday contexts butlimited in range. Basic errors are noticeable.
1 No complex structures attempted and simplestructures frequently inaccurate in everydaycontexts.
o Frequent basic errors
CPEi Vocabulary Resource5 Range of vocabulary affords total flexibility and
appropriate use in all contexts.4 Use of vocabulary appropriate in most contexts.
sometimes needs to resort to paraphrase in morespecific, abstract or academic contexts.
3 Range of vocabulary adequate for general topics.Often resorts to paraphrase or simplification inmore specific, abstract or academic contexts.
2 Vocabulary resource adequate only for everydaytopics. Seldom rises above the mundane, beingdependent on paraphrase or simplification inspecific, abstract or academic contexts.
175

1 Limited vocabulary resource makes performance, evenin everyday contexts, inadequate.
o Vocabulary too limited for communication at thislevel.
CAE; Accuracy and Range7 - 8
5 - 6
3 - 4
1 - 2
o
Evidence of a wide range of structures andvocabulary in all contexts. Errors minimal innumber and gravity.Evidence of an appropriate range of structuresand vocabulary; has the range needed to expressintention. Errors few in number/minor ingravity. Message not impeded.Fairly frequent errors and evidence that rangeof structures and vocabulary limits fullexpression of intent. Communication of theessential message is not prevented.Frequent basic errors and limited range ofstructures and/or vocabulary impedecommunication of the essential message andconstantly strain the listener.Inadequate for assessment, even after promptingby the interlocutor.
In the CAE candidates who receive a 7 - 8 scoreswould be expected to pass the CPE, and those who receiveo - 2 would be expected to fail FCE. Those who receive3 - 4 would not receive the CAE, but would be expected topass the FCE, whilst bands 5 - 6 are considered good CAEcandidates. It should be noted that the CAE scale differsfrom others of its kind (with the one exception of theoral rating scale for the International GeneralCertificate of Secondary Education English as a SecondLanguage Examination) in that the descriptors areprovided for a range of bands rather than individual
176

bands. This is to allow the examiner to match a studentwith a descriptor and then allow him/her to decidewhether it is a superior or inferior performance withinthe band range. As there is no evidence available onwhich to judge whether or not this approach leads tohigher reliability, or whether the method is valid, it isnot possible to assess the scale with regard to thisproperty.
with regard to the FeE and ePE scales, it can beseen that some attempt has been made to discriminatebetween the levels of candidate expected to attempt eachof the examinations. This is most clear in the ePEGrammatical Accuracy bands 3 - 5, where reference is madeto "discursive issues", not included in the FeE scale.However, the other band descriptors rely on concepts suchas "everyday issues" and "complex" and "basic" structureswhich remain undefined. This is a basic problem with thescale. As Pienemann et. al. (1988: 219) point out, whatis viewed as simple or complex in terms of structure maynot be simple or complex for language learners, and suchterms must always be defined in relation to a theory oflanguage acquisition with empirical underpinning.
In the CAE scale the notion of error gravity isintroduced (see pages 192 - 193), but no indication isgiven of which errors are more serious than others. Thedifference between bands 7 - 8 and bands 5 - 6 appears todepend upon the difference in interpretation between"wide" range of structures and "appropriate" range of
177

structures, and a "minimal" number of errors comparedwith "few" errors. Again, this terminology is notdefined. Similarly, in bands 5 - 6 the message is not"impeded" whilst in bands 3 - 4 the "essential" messageis not "prevented". It would appear that all terminologyis in need of precise definition.
However, it could be countered that examiners'awareness of which students should be placed within eachcategory is determined by the video cassettes providedfor rater training. These are provided for rater trainingunder the guidance of local team leaders around theworld, but even if evidence were presented to show thatthis increases the reliability of rating it does not meanthat the scale is automatically valid as it standswithout the definition of key terms. Indeed, it has beenargued that once rater training takes place there wouldbe no need for band descriptors at all, as standards areimposed through the training process (see Chapter 2.1.3).Matthews (1990), for example, conducted an experimentwith the descriptors for the International GeneralCertificate of Secondary Education (IGCSE) in whichteachers were asked to place jumbled descriptors in orderaccording to the original proficiency level described inthe scale. This proved to be impossible. This reflects onthe validity of the descriptors, not upon their reliableuse after raters have been trained.
It would therefore appear to be the case that theprinciple expressed by Lado (196l), Baker (1989) and
178

Hughes (1989) that scale descriptors should be asexplicit as possible have not been met in these scales.However, it will be argued that this is in fact the casewith other descriptors in rating scales which arecurrently in use.
2.2 The ASLPRThe ASLPR speaking descriptors are much more
detailed than many others currently in use, allowingraters to look for specific aspects of accuracy incandidate performance. The phrases which relate toaccuracy have been extracted from the descriptors and arepresented below. The comments are provided as notes forthe rater on the scales (Ingram and Wylie, 1985).
S:o+ vocabulary limited to that necessary to expresssimple elementary needs and basic courtesyformulae. syntax is fragmented, inflections andword endings frequently omitted, confused ordistorted •••
comment: Distortion of word endings may involveomission, addition or sUbstitution of phonemesor allophones.
S:l- Most utterances are telegraphic and wordendings (both inflectional and non-inflectional) are often omitted, confused ordistorted.
S:l •••fractured sentence structure and othergrammatical errors are frequent ••••Misunderstandings frequently arise from limitedvocabulary and grammar ••••Little precision ininformation conveyed owing to tentative stateof grammatical development and little or no useof modifiers.
comment: Modifying devices or modifiers are those forms(eg., verb forms, adjectives, adverbs, phrases,
179

clauses, etc.) that are used to modify and giveprecision to the expression of thought.
5:1+ The commoner tense forms occur but errors arefrequent in formation and selection. Can usequestion forms. While basic word order isestablished, errors still occur in more complexpatterns ••••Aware of basic cohesive features(eg., pronouns, verb inflections), but many areunreliable.
S:2 •••can usually handle elementary constructionsquite accurately but does not have thorough orconfident control of the grammar especially inlonger constructions.
5:3 •••control of grammar good: able to conveymeaning precisely in reasonably complexsentences or by using, with reasonableaccuracy, a wide range of modification devices.
5:4 •••errors of grammar are quite rare andunsystematic and can usually be corrected inretrospect •••
Comment: Grammatical development is now more or lesscomplete though "slips" or errors ofperformance may still occur. The learner can,however, usually correct such errors if hebecomes conscious of them.
S:5 Has complete ••.accuracy •••in the language suchthat the learner's speech on all levels isfully accepted by such native speakers in allits features •••
The band descriptors are more specific than areusually found in rating scales, but it may be observedthat only modification devices are specified in detail in5:1. The other descriptors rely on the familiar conceptsof basic versus complex structures and relative degree ofaccuracy of production.
The scale is more specific at the lower range ofband descriptors, as Ingram (1982) states. Unlike theUCLE5 scales it is global in nature, but would appear to
180

have been constructed along similar lines: the authorswrote the descriptors on the basis of their view of whatconstitutes proficiency at any given level from their ownintuition, experience and studies in psycholinguistics.This interpretation would seem to be correct, as Ingram(1982: 10) comments that L2 research has not discoveredany universal pattern in language development, but thatscales implicitly rely on the notion of such a pattern.This view will later be called into question, although itis interesting to note that Ingram (1985a: 4) himselfclaims:
"We have noted that rating scales such as theASLPR are developmental in structure, i.e., theprogression of behavioural descriptionsattempts to reflect the way in which a secondlanguage develops from zero to native-like.Thus the scale is not arbitrary but related tothe universal development schedule and alearner's rating indicates the stage ofdevelopment he has reached in the developmentalschedule."
Although the ASLPR has been researched to somedegree, the differences between the 1982 and 1985 claimsdemonstrate that the so-called developmental structure ofthe rating scale is not actually based upon any empiricalresearch into a "schedule" of language acquisition. This,of course, is not to say that the scale itself might notrepresent such a schedule in its general form, but thatit is not specific enough in detail to describe theschedule or indeed to be validated against any schedule.
181

Nor is this to say that the scale could not be used forresearch into such a schedule if the band descriptorswere expanded, made more specific, and appropriateresearch conducted.
2.3 The ACTFL rating scaleThe ACTFL ratinq scale is another holistic criterial
approach (Huqhes, 1989: 103 - 104; 110) in whichcandidates are matched to a descriptor on the basis oftheir performance on a task. The ASLPR as a holisticscale does not focus on accuracy specifically, but hasaccuracy as part of its descriptors. In contrast, theACTFL scale is seen as placinq accuracy in prime position(Kramsch, 1986b). This view is, to some extent, unfair.writers who have supported the Proficiency Movement whichuses the ACTFL scale as a quide to curriculum developmentmay have stressed the qrammatical accuracy aspect of thescale, but the scale itself merely includes references toaccuracy amonq other aspects of performance. Kramscharques that the level of "abstraction" - the non-specificity of the criteria described in the ACTFLdescriptors - makes the scale uninterpretable. Hercriticisms of the emphasis on qrammatical accuracy inparticular are more related to the format of theelicitation techniques, which are qeared towardselicitinq particular qrammatical structures, than to thenotion of assessinq accuracy within an oral test per se.
Althouqh Kramsch's criticism of the non-specificity
182

is essentially correct, the ACTFL scale does stillrepresent a trend towards greater specificity in ratingscales, notably at the Advanced Plus level.
Van Patten (1986) also criticises the position givento grammatical accuracy in the ACTFL scale. Although theACTFL scale is certainly one of the most researchedscoring instruments and has produced much valuableresearch (Skehan, 1991: 9 - 12), Van Patten is probablycorrect in his argument that in the development of theACTFL scale (based upon its predecessors, the FSI and theILR) no database of information was used in the draftingof the descriptors. He correctly points out that indefending the validity of rating scales expressions suchas "experience suggests .....and "experiential data .....are frequent, while actual empirical evidence is sparse.
The point is that validity, if it is to be
understood in terms of the relationship of thedescriptors to actual language production or sequence ofacquisition, was not considered at the outset of theconstruction of the scale in anything but an intuitiveway, and we must therefore remain extremely cautious ininterpreting the descriptors as if they representedpsychological or linguistic reality, even if the scale iswidely accepted and shown to be reliable after ratertraining. Similar criticisms can be levelled at allrating scales currently in existence, not only the ACTFL.
References to accuracy in the ACTFL rating scale arehere extracted at the various levels of proficiency
183

described (ACTFL, 1986).
Novice-Low[As the candidate cannot function in the language, nomention is made of accuracy.]
Novice-MidSyntax is fragmented, inflections and word endingsfrequently omitted, confused or distorted •••Novice-HighCan ask questions or make statements with reasonablyaccuracy only where this involves short memorisedutterances or formulae. Most utterances are telegraphicand word endings are often omitted, confused, ordistorted.Intermediate-LowIs able to formulate some questions with limitedconstructions and much inaccuracy. Almost every utterancecontains fractured syntax and other grammaticalerrors •••• Misunderstandings frequently arise fromlimited vocabulary and grammar •••• Little precision ininformation conveyed owing to tentative state ofgrammatical development and little or no use ofmodifiers.Intermediate-MidSome evidence of grammatical accuracy in basicconstructions, for example, subject-verb agreement, noun-adjective agreement, some notion of inflection.Intermediate-HighThe commoner tense forms occur but errors are frequent information and selection. Can use most question forms.While some word order is established, errors still occurin more complex patterns. Cannot sustain coherentstructures in longer utterances or unfamiliarsituations •••• Aware of basic cohesive features such aspronouns and verb inflections, but many are unreliable,especially if less immediate in reference.AdvancedCan usually handle elementary constructions quiteaccurately but does not have thorough or confident
184

control of grammar.Advanced PlusGenerally strong in either grammar or vocabulary, but notin both •.•• Areas of weakness range from simpleconstructions such as plurals, articles, prepositions,and negatives to more complex structures such as tenseusage, passive constructions, word order, and relativeclauses.SuperiorAble to speak the language with sufficient structuralaccuracy and vocabulary to participateeffectively ••••Control of grammar good: errors virtuallynever interfere with understanding and disturb the nativespeaker.
The resemblance of the ACTFL and the ASLPR is moststriking, with only minor differences in wording, theASLPR having been generated from drafts of the ACTFLscale. As such, similar comments apply: the ACTFL scalecould be used as the basis for further research anddevelopment if the descriptors were made more precise anddirectly related to studies in second languageacquisition. At the present time, it remains too vague tobe used in such a way (Fulcher, 1989).
2.4 The IELTS rating scaleThe IELTS oral rating scale is the successor to the
ELTS rating scale, the latter having been discussed inFulcher (1987), and used in rating the 21 students whoseinterviews formed the initial database for rating scaledevelopment in this study. Developed in conjunction withIngram, it would be surprising if aspects of the IELTS
185

scale did not resemble the ASLPR. References to accuracyin the nine bands of the IELTS have been extracted, andare presented below.
Band 9[No reference to accuracy]Band 8Non-systematic errors in grammar (and) vocabulary.Band 7Errors in vocabulary and structure may occur withoutinhibiting communication. Communicates readily and fairlyprecisely using complex sentence forms and a wide rangeof modifiers, connectives and cohesive features.Band 6Can use complex sentence forms and a wide range ofmodifiers, connectives and cohesive features to conveymost meanings fairly precisely though errors in grammarand vocabulary may occur and occasionally interfere withcommunication. Is generally able to use circumlocution tocover gaps in vocabulary and structure.Band 5Errors in structure and vocabulary mayinterfere •••generally making use of relevantconnectives •••• Has some ability to use complex sentenceforms and modifiers.Band 4Can use common question forms to elicit information(though not necessarily with correct word order). Hascontrol of basic sentence forms but longer utterancestend to break down. Can link simple sentences using themost frequently occurring connectives. Errors in grammarand vocabulary are frequent •.•• Tentative use ofmodifiers •••Band 3Basic sentence forms appear to be used though grammaticalerrors are numerous except in memorized utterances.Essentially no ability to link sentences of usemodifiers.
186

Bands 2 - 0[No specific reference to accuracy as, it must beassumed, students at these levels do not provide evidencethat any grammar or vocabulary, short of memorized wordsor phrases, can be used.]
The "developmental schedule" (Ingram, 1985a) of theASLPR does seem to be reflected in this rating scale,although the level of specificity is more general thanthe ASLPR rating scale. Information regarding how thescale was constructed is provided in Alderson (1991a:81). This involved: the use of expert judges whocommented on the scales; getting experienced markers toplace samples of speaking against each band and thendecide which "key features" led them to their decision;collection of feedback after the scale had been put intouse. The latter is different from the other two methodsof scale construction in that it is a post-hoc assessmentof validity. The second of these methods is the closestto what is being presented here as an appropriateapproach to the inclusion of considerations of validityat the design phase of the band scales, and it would beinteresting to have more details of how, and to whatextent, these markers agreed on the distinguishingfeatures of performances which discriminated betweenbands on the scale. However, the main issue appears tohave been the use of quantifiers. The problem could havebeen the pre-existence of the nine bands and the need todescribe them, when the number of bands that can reliably
187

be distinguished does not seem to be that high (Pollitt,1991: 90), and in this research only four bands could bedistinguished and described from the data available.
section 3: Specificity in Rating ScalesIt has been seen that the degree of specificity or
of abstraction in band descriptors within a rating scaleis an issue of some importance, and one which was raisedconsistently by the raters used in the present study (seeAppendix 10.1 and pages 375 - 376). When using a ratingscale in a live oral interview there is the very realproblem of deciding how much information the rater canprocess: the more general the scale and the shorter thedescriptors the easier it is to use. The emphasis mustthen be placed on rater training using video/audiointerviews to establish standards by linking particularperformances with band descriptors. The more specific theband descriptors, and hence the larger the physicaldocument being used, the harder it is to operate thesystem in a live testing situation. As Porter (1991: 32 -33) says:
"•••the more complex the description gets, theless our brains are able to grasp it in itsentirety and the less it means to us."
Porter argues that the descriptors which are usefulare those which "leave a considerable amount out", andthat selection of salient features for inclusion will be
188

an important part of scale development. This problemshould be borne in mind when constructing a more specificrating scale. In this project, the appropriacy of theamount of detail included in the rating scales,substantially more than other rating scales to date, wasassessed by asking raters to retrospectively comment ontheir uses of the scales and talk about any problemswhich they encountered.
Section 4: Developing a rating scale for accuracyIn the initial stages of developing a rating scale
for accuracy a similar procedure to that used in thedevelopment of the Fluency scale was envisaged, beginningwith an analysis of the same twenty one transcripts andtapes of oral interviews and the isolation of categoriesof error which may discriminate between student abilitylevels. A sample coded transcript is contained inAppendix 5.21. In total, nine categories were isolated,but many of these categories did not contain enough datato be able to progress immediately to discriminantanalysis.
It became obvious that some of the categories wouldhave to be combined in order to make progress. It wasinitially suspected from the nature of the descriptivecategories developed that the data could be reduced totwo macro-categories termed "grammatical accuracy" and"lexical accuracy", but in order to investigate if thisdistinction had any basis in the actual observations
189

Principal Components Analysis was employed. Thecategories were then combined and discriminant analysisused to estimate the ability of the new categories todiscriminate between students at different levels.
section 5: Analysis of categoriesExamples of inaccuracy in language use identified
from the transcripts were tallied. These were thengrouped into the nine categories described below. Thedefinitions of the categories were adapted and expandedto suit this data from Burt and Dulay (1975). If agrammatical or lexical item was used incorrectly it wascounted as an error even if corrected in later speech,and if an item did not occur in an obligatory slot withinthe utterance it was also counted as an error byomission. In using this procedure it should also be notedthat there is a certain amount of indeterminacy incategorising aspects of the data. It should be borne inmind that (a) isolating an "error", "mistake" or "slip"in spoken data does not mean that the researcher canautomatically know under which of the headings toclassify it; this has to be inferred from the context;Cb) the error may have been the result of lack ofknowledge (ie., the structure has not been acquired),difficulty with processing language or cognitiveoverload; once again it is hard to isolate causes; and(c) once an error has been identified it is difficult toclassify the error in many cases. For example, if the
190

researcher is faced with the utterance: ".••and he passedfrom the other department •••" are we dealing with aprepositional error ("by" rather than "from") or alexical error (misselection of "pass" when some otherverb was required)? In this case, the error would havebeen classified as the former on the grounds that the L1
of the students used to construct the database was Greek,and the use of a few prepositions in Greek to do the workof the many in English leads to typical errors of whichthis may be one. However, it cannot be denied that thereis indeterminacy here, but this is, and will remain forthe foreseeable future, a problem with all investigationsof this nature. It would certainly seem to be a problemwith the morpheme studies discussed later, although thishas not been tackled to any extent by researchers in thatarea. A coded transcript is included in Appendix 5.21 forthe reader to examine.
The initial nine categories of accuracy phenomenaare listed and described below.
category One: Word OrderThis category included any examples of simple or
compound declarative sentences where the order ofconstituents was incorrect, as in Example 5.1.
Example 5.1.B> because er: is different Cyprus from the Londonpeople •••"
191

In context the student intended to express thebelief that people in Cyprus are different from those inLondon.
category Two; Pronouns, relative pronouns and dummypronouns
Burt and Dulay only consider pronouns in nominativeor accusative case in simple pronoun subjects or objects,as in Example 5.2:
Example 5.2.B> •••her father don't er: if if hA if hA like to live inthe house he must paid er the rent •••
In this case the student wishes to refer to girlswho remain in their parents' home after completing schoolpaying rent. The correct pronoun required is "she", butthe incorrect male pronoun is continuously supplied.
Dummy pronouns relate to the use of "it" and "there"to refer to a nominal group which will lexicalise (givecontent to) the pronoun after the next verbal group inthe utterance.
Example 5.3.B> •••er I don't know if there are in: in towns but: invillages er: a lot of illiterates people ••."
In Example 5.3 we would expect the student to say"there are a lot of illiterate people", but the studentdoes not seem to have acquired this use of the pronominal
192

system.Relative pronouns were found to cause more problems
in speech than pronouns in the other two categories,mainly through omission, as in Example 5.4.
Example 5.4.B> ••.then we have we have r is the yield er: of thematerial ..•"
In Example 5.4 the meaning of the utterance wouldhave been clearer had the student said "•••we have r,which is the yield (point) of the material." In Example5.5, on the other hand, the incorrect "where" should havebeen "which".
Example 5.5.B> •••where the load is fourteen kilonewtons: where isthe elastic point ••••
category Three: TenseThis category combined many of the individual
morphemes which are often studied separately, includingpresent simple (and third person -s), past regular andirregular, the present progressive, perfect auxiliary andpast participle. Examples 5.6 and 5.7 illustrate the typeof errors which were categorised under Tense.
Example 5.6.B> •••until then I have been work in Nicosia GeneralHospital .....
193

Example 5.7.B> I Am in the Political Affairs Division for the lastfive years •••"
category Fouri Lexical ErrorsIt was discovered that many of the errors in the
transcripts were of a lexical nature. These includedincorrect word formation, lexical problems with timereference, misselection of an appropriate modal verb, andconfusion over the use of word pairs such as make/do,get/take and say/talk. Examples 5.8 to 5.10 illustratethe types of errors placed in this category.
Example 5.8.B> ••• and er i:: the adult literary is raising •••"
Example 5.9.B> ••• er the course was only until six months but Istayed for nine months .••
Example 5.10.B> ••• we don't have such a laboratory to mak& this buter •••
category Five; Omission of subject, verb phrase, or bothOn a number of occasions students began an utterance
with the verb phrase, omitting the whole of the subjectof the sentence (whether this is a pronoun or nounphrase), leaving out the verb completely, or simplyleaving both out. In Example 5.11 the student omitted"you" before the phrase "have to bear in mind", whilst in
194

Example 5.12 the utterance could be made to sound morenatural by supplying a pronoun and the verb "to be", asin: "because .I....Am er a sergeant in the army ••."
Example 5.11.B> Yes [yes A> (laughter)] B> have to bear in mind ..•
Example 5.12.B> I have my office right and er: because er sergeant inthe army I have some responsibilities .•."
category six: Errors in prepositional phrasesSelection of the correct preposition for a phrase
was a major problem for many students, even though thisis a category of errors which does not seem to have beenstudied extensively.
Example 5.13.B> .•.they are first checked ~ their quality and thenregistered here •••
category 7; Formation of plural nouns (and this/these)Long I;iz/, short lsi, Izl and irregular plurals
were taken into account in this category.
Example 5.14.B> •.•to come back in Cyprus to make some lectures toother ••• [other~]
Example 5.15.B> ..•fifteen thousand er womans went to er: prisons:;er: : :
195
category Eight: ArticlesIn the morpheme studies "a" and "the" are combined
under the general heading of articles and are not treatedseparately.
Example 5.16.B> •••(NAME) is a small college for th§ English(language) •••
Example 5.17.B> •.•and will do: er: foundation course •••"
category Nine: MiscellaneousTallies of errors were recorded in a number of areas
which could not be treated as separate categories becauseof the extremely small number of examples from the data.These included errors with the formation of comparativeand superlative adjectives, conditional tenses,genitives, use of connectors, and use of the gerund orinfinitive constructions, as exemplified in Examples 5.18- 5.22.
Example 5.18.B> er er it's er more easy with er law students studyingin England •••
Example 5.19.B> •••if if I will go to London I will live with Englishfamily •••
196

Example 5.20.B> •••the ladies er leave home: er things: to to marrythen go out A> hm B> of er his father home •••
Example 5.21.B> •••we are er: to twelve at ~ er: in Nicosia GeneralHospital •••
Example 5.22.B> •••we can see that the load increases and then itstart it's starting er decreasing •••
section 6: Error GravityPrior to beginning the analysis of the categories of
error described above, the issue of error gravity wasinvestigated. It was initially suspected that work inthis area might provide a theoretical framework withinwhich categories could be combined for analysis, orprovide insights regarding the extent to which certaincategories should be stressed at particular levels withina rating scale.
Work in the area of error gravity such as that ofBurt and Kiparsky (1972) and Burt (1975) has concludedthat errors in speech fall into two main categories:global errors which affect the communicative intention ofthe utterance by breaking up the grammatical meaning ofwhole chunks of language, and local errors which arelimited in the effect on the utterance and so do notcause problems with communication.
It may therefore be suspected that with regard tothe nine categories described above, category 1 (word
197

order), category 5 (omission of noun or verb phrases),and to some extent category 2 (pronouns, only when therelative clause is affected), would constitute the mostserious errors in terms of the communicative value of theutterance. Errors in all other categories in the studywould, it was thought, tend to have a locally disruptiveeffect but would probably not tend lead to a totalbreakdown in communication.
As will be seen in what follows, the use of theseresults from the error gravity studies in developing arating scale for accuracy would not prove useful. Nomatter how intuitively satisfying a scale which takeserror gravity into account would be (most problems withword order in lower ability candidates, least in higherability candidates etc.), the descriptors could not be
empirically justified. For example, the present analysisfound that such global errors only tend to manifestthemselves in the speech of students in the middle bandsof a rating scale, as candidates of lower ability did notattempt to use extended utterances in which such errorscould occur. A rating scale must therefore take intoaccount what actually occurs in speech at various levelsof ability.
198

section 7: Initial investigation into category reductionTreating each observation of an error as an "error
score" on each of the categories described above, totalerror scores were correlated. It was expected that therewould be evidence to support the supposition that twocategories: grammatical accuracy and lexical accuracywould be enough to account for the data. The correlationmatrix presented in Table 5.1 in the Appendix to Chapter5 was submitted to Principal Components Analysis usingVarimax Rotation in order to see if there was anyprinciple upon which the categories could in fact becombined before proceeding to use discriminant analysis.It was hypothesized that there would be two factors,lexical accuracy consisting of categories four and six,and the other grammatical accuracy consisting of allother categories.
Table 5.2 in the Appendix to Chapter Five shows thatalthough two factors can be isolated from thiscorrelation matrix, it is categories 2 (pronouns) and 5(omission of noun or verb phrases) that load highly onfactor two. Factor 2 is therefore characterised bystudents who do not omit noun or verb phrases but whotend to make errors in the use of pronouns, or studentswho use pronouns accurately but do tend to omit noun orverb phrases.
Referring to the original transcript data it wasdiscovered that of the 41 pronominal errors in the tally,24 came from candidates who had received a band score of
199

6 on an ELTS interview. Five of these were examples ofthe misuse or omission of the appropriate object pronoun.All other examples occurred as a result of the morecomplex sentence structures being attempted by thesecandidates.
category 2 was omitted from the discriminantanalysis and reference to pronominal error included onlyin the final scale in band 2 as a partial criterion.category 5 was treated in the same way, and reference toomission of sentence constituents included only in bands1 and 2.
It had, however, been judged essential not toproduce an over complex rating scale by mixinginformation on lexical and grammatical accuracy, but topresent these side by side on the rating scale. Thiswould make the rating scale easier for the raters toread, although there was no indication that lexical andgrammatical accuracy were indeed separate components.categories four and six were therefore used as alexiscategory despite the finding from the PrincipleComponents analysis that they did not load on a separatefactor from other categories used in the study. Thisdecision allows the use of discriminant analysis, but theseparation was not used to create a separate rating scalefor lexis, as this would have been unjustified given thefindings of the PCA. The separation did not, therefore,have any direct effect on the construction of theAccuracy rating scale.
200

section 8: Discriminant AnalysisBefore conducting the discriminant analysis the
total number of errors for each of the twenty onestudents in the two categories was adjusted for theamount of language produced during the interview. Thiswas done because many of the candidates who talked atlength produced more errors than candidates who did notproduce so much language. However, error density was notas great. The adjustment procedure used was the same asthat described by Shohamy, Shmueli and Gordon (1991),namely to divide the frequency of errors by the totalnumber of words produced.
This adjustment in itself introduces anotherelement into the concept of the accuracy scale, that ofthe amount of language produced, which will be consideredlater (see pages 204 - 206).
As in the development of the Fluency scale,discriminant analysis was used to determine whether ornot the observations made were capable of discriminatingbetween ability levels. In this analysis the two lowerELTS bands (4 - 5) and the upper two bands (8 - 9) werecollapsed into one band each, producing a possible 4 bandscale if the results proved to be significant. This wasdone on the grounds that initial group means on each ofthe categories for ELTS bands 4 and 5 were very similar,indicating that there was no difference between them andhence there was no good reason to maintain them asseparate in the process of constructing the Accuracy
201

rating scale.The mUltivariate test results are presented in Table
5.3 in the Appendix to Chapter 5, and it can be seen thatwilks' Lambda is significant at p = .003 indicating thatthe two categories used discriminate well between thestudents. Second and subsequent discriminant functionsfrom the analysis were not significant.
In order to test the accuracy of the predictionswhich could be made from the observed tally of errors,the actual band scores which were awarded to candidatesmay be compared with the band scores they would beawarded if only accuracy on the two categories were takeninto account. This is exactly the same procedure used inthe production of the Fluency scale (see Figure 4.1), andFigure 5.1 presents the predictions for accuracy.
It can be seen in Figure 5.1 that of the number ofstudents actually awarded a band 1 (originally ELTS bands4 - 5), 2 would be awarded a band 1 and 5 a band 2(originally ELTS band 6) on predictions from thisanalysis. Of those awarded a band 2, six of the eightstudents would again be awarded a band 2, the other twostudents being awarded a band 1. However, it is in theband 3 (initially an ELTS band 7) where the maximum errorcould occur. Of the four students who received a band 3,3 would receive a band 1. Of the candidates who wereawarded a band 4 (originally ELTS bands 8 - 9), one wouldstill receive a band 4 and one would receive a band 3.
202

Fig. 5.1. The relationship between actual band scores andpredicted band scores for accuracy.Band Awarded I Predicted Band Total
11234---------------------------------------------------------1 I 2 500 72 2 6 o o 8
3 I 3 0 1 0 4---------------------------------------------------------4 loo 1 1 2---------------------------------------------------------
Total 7 11 2 1 21
The amount of error involved here, especially withband 3 students, could indicate one of two possibilities:either the assessment of accuracy in live oral interviewsinvolves a great deal of inherent indeterminacy (see page136), or secondly that other aspects of production aregiven greater weight in awarding global band scores. Thesecond of these possibilities could be the case in thelight of the accuracy of the predictions made from theFluency scale developed in this study in Figure 4.1, inwhich only one student would have been misplaced by oneband. That is, the concept of fluency is closer to whatraters actually rate in live interviews. However, morelight will be thrown upon this issue in the validitystudy. If the assessment of accuracy is indeterminateeven when raters are asked to concentrate upon it, thenthe validity coefficient for the Accuracy scale would notbe expected to be very high.
In the preceding discussion it can be seen that the
203

development of the Accuracy rating scale faceddifficulties from the very beginning, and the fact thatprediction from isolated linguistic phenomena which arenot "high inference" but observational categories do notresult in high prediction rates to band scores maysuggest that the meaningfulness of the construct ofAccuracy may be called into question. This is to becompared with the development of the Fluency scale wherethe descriptions, however high inference in nature, ledto what appeared to be a very stable construct at leastat the scale design phase. It is in the validation studythat the implications of these design problems may bediscussed and assessed.
section 9: Amount of speech producedIt was stated that the number of errors in certain
categories related to the amount of speech produced. Itwas observed, for example, that lower ability studentsdid not make global errors for the simple reason thatthey do not often produce strings of speech which wouldallow the error to occur. Looking at the transcripts, itappeared that a large number of turns produced by lowerability students were single words or fillers, whilstwith higher ability students occurrences of single wordturns also included backchanneling. The remainingexamples of single word turns were either single lexicalitems, or "yes" and "no".
Table 5.4 in the Appendix to Chapter 5 shows the
204

total number of turns taken by each of the twenty onestudents, the number of single word turns as a percentageof the total number of turns, the percentage of fillersin single word turns, and the percentage of backchannelsas single word turns. From these figures it washypothesized that the number of single turns and thenumber of backchannels would also discriminate wellbetween lower and higher ability students. For thepurposes of investigating the number of single wordutterances and the phenomenon of backchanneling, theoriginal bands were collapsed to form just three: ELTS4 - 5 forming band 1 (as in the accuracy analysis) withband 6 forming band 2 on its own, and bands 7 - 9 formingband three, as an initial investigation of meansindicated that there was no apparent difference betweenthese bands. This was then submitted to discriminantanalysis. The mUltivariate results are presented in Table5.5 in the Appendix to Chapter 5.
The results are significant at p = .002, and byanalysing Table 5.4 we may see the tendency for lowerability students to use more single word utterances thanhigher ability students, and the tendency for higherability students to use more backchanneling than lowerability students.
The results regarding the number of single wordutterances were used in the construction of the Accuracyscale in order to take into account the relationshipbetween number and type of errors made and the amount of
205

language produced. The information regardingbackchanneling was used to improve the descriptors in theFluency scale, as backchanneling is not related to theaccuracy of an utterance, but to the perception offluency in maintaining conversational flow.
section 10: Breadth of lexisFrom the data it was observed that students in the
middle bands of a rating scale tended to make more errorsof the kinds described in category 4 (lexical errors). Inorder to interpret this for the development of thelexical accuracy descriptors, it was necessary to look atany factor which may have explained this. It washypothesized that on a four band scale, band 2 candidateswould begin to use a much greater range of vocabulary andin this attempt to be more informative make more errors.This would imply that band 1 students had a restrictedlexical range.
In order to investigate this the total number ofwords uttered in each interview was counted, the numberof unique words was calculated (words which were usedonly once by the student), and the number of word forms(the word "you" may occur ten times, but is only countedas one form). The number of unique words was alsocalculated as a percentage of the total number of words,and the total number of words divided by the number ofword forms was calculated as an estimate of lexicalrange.
206

If any of these estimates of the students' use oflexis could discriminate between band 1 and band 2students, this could be included as a factor in theAccuracy rating scale. The results of the analysis arepresented in Table 5.6 in the Appendix to Chapter 5, andthe means for total number of words, unique words andnumber of word forms are contained in Table 5.7. In Table5.7 it may be seen that the change in pattern occursbetween Band 1 and Band 2. These factors were thus takeninto account when describing the types of lexical errorswhich were more likely to occur at band 2 than band 1.
It may be added here that this research very quicklypointed up the fact that oral rating scales cannot be"linear" in the way which a-priori scales are. That is,more errors may occur in the speech of more able studentsbecause they are in the process of acquiring morelanguage and experimenting with it. Similar results werediscovered by Meisel (1980) who noticed increasing "wronguse" forms as earlier systems were extended in thedirection of the second language system, and called thistransitory interlanguage "elaborative simplification" incontrast to the previous "restrictive simplification."Thus, a data-driven approach would appear to be superiorto a-priori scale development, the linear nature of whichdoes not take into account how students acquire languageand actually speak.
207

section 11: Producing Accuracy rating scale descriptorsHaving produced a number of observations which
succeeded in discriminating between students in 4 bandsit is possible to return to the original observations onthe transcripts of the oral interviews as described inthe nine categories of error identified and use these toconstruct verbal descriptors which represent levels ofability. As lexical and grammatical accuracy wereconsidered to be separate but highly related aspects ofaccuracy, which nevertheless generated four separatebands, the rating scale maintained this distinction informat.
Table 5.8 contains simple correlations between bandand the 9 categories in the accuracy analysis, and Tables5.9 to 5.17 provide the mean scores on each of thecategories and band scores. These means are plotted inFigures 5.2 to 5.10 on pages 209 to 213. (It must beremembered when reading Tables 5.9 to 5.17 that thesemeans are not averages of raw counts of errors in thecategories. Such data in itself would be meaningless asthe variable of amount of language produced would maskdifferences in error rate, as argued on pages 204 - 206.These means were produced after correction for amount oflanguage produced).
It will be noticed from Table 5.8 that none of thecorrelations are very high, indicating the lack of aclear linear relationship between category and band.However, the Table 5.3 does show that the categories help
208
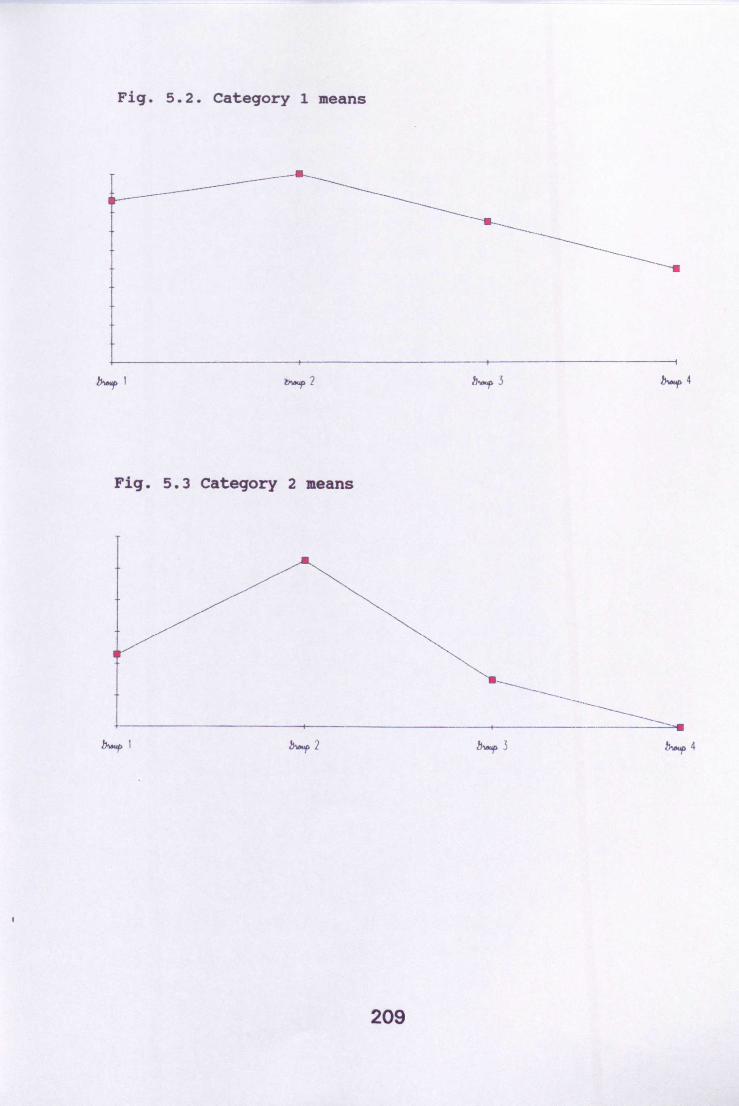
Fig. 5.2. category 1 means
h-p 1
Fig. 5.3 category 2 means
------ __ --------_______~----------------~----.---------------+---------- -----1
~1
209

Fig. 5.4 category 3 means
Fig. 5.5 Category 4 means
~1
210

Fig. 5.6 category 5 means
b._,. 1 ~2
Fig. 5.7 Category 6 means
.i>:
b-p 1
-----+
211

Fig. 5.8 Category 7 means
---------.--------
~1
Fig. 5.9 category 8 means
~1
212

Fig. 5.10 category 9 means
~.----------------~.~------------------+-------------------~------------------~
~1
to discriminate between bands. The reason for thesecorrelations appears to be that many of the observationsare not linear across bands, as was seen in the processof constructing the Fluency rating scale. One example ofhow a band descriptor was constructed will be given withreference to Table 5.10 and Figure 5.3 for category 2,pronominal reference. The number of reference errors madeby Band 1 students was less than both band Band 2 andBand 3 students. Only Band 4 students had less errors (infact no errors of pronominal reference were observed fromBand 4 students). This relates directly to the finding(Section 9 above) that Band 1 students produced lessspeech than students in other bands, and that theirutterances were often less complex. As ability increasesmore errors are made as the students experiment with awider range of grammatical structures requiring cohesive
213

reference, and as ability increases further (Bands 3 and4) more accuracy in the use of cohesive devices isachieved. Hence, we see the inverted "U" pattern inFigure 5.3 which explains the .09 correlation coefficientbetween band and category 2 in Table 5.10.
In constructing the band descriptors for theAccuracy rating scale pronominal reference was not afeature of the Band 1 descriptor, as utterances wereshort and simple. The Band 2 descriptor specificallyhighlights the expected increase in the length ofutterance and the complexity of language which will beproduced, which will also lead to more errors inpronominal reference. After Band 2, the number of errorsmade begin to decline with increasing ability. This typeof error was therefore used to characterise a Band 2student.
It was assumed, as in the construction of theFluency scale, that raters would tend to avoid extremecategories, and that a 4 band scale would in effect meanthat bands 1 and 4 would not be used. The rating scaledeveloped therefore contains 6 bands. Band 0 was merelydescribed as performance inferior to band 1, and band 5as performance superior to band 4. This, it was assumed,would encourage raters to use the entire range of bands 1to 4 which can be empirically justified.
In the following rating scale, comments on therelationship between the descriptors and the data fromwhich they were generated is enclosed in square brackets.
214

In the rating scales used by the raters, accuracy ofgrammar and accuracy of lexis were presented side by siderather than one under the other, as the descriptors wereintended to be used in parallel to award one accuracyscore.
Accuracy of GrammarBand 0Candidates in band 0 do not reach the required standardto be placed in band 1.Band 1Most band 1 candidates have trouble with forming pluralnouns, and may also misuse this/these and much/many[Category 7]. Errors occur in the use of the genitiveforms, conditional tenses, and the use of comparativesand superlatives (if attempted) [Category 9: frequencycounts show that band 1 candidates make most errors inthe use of these structures]. Frequent mistakes in theuse of the article occur [Category 8]. sometimes verb andnoun phrases may be omitted from the sentence entirely[Category 5]. Verb errors typically include: past simplewhen narrating, present simple and present perfect; thismay very often involve using some other tense than theone required [Category 3]. Band 1 candidates tend not touse many connectors other than "and", but often misuseother connectors if attempted [Category 9]. As utterancestend to be short and simple, there are few errors withword order [drawn from evidence regarding length ofutterance and the finding that errors from Category 1tend not to occur with lower ability students].When a band 1 candidate is monitoring his/her productionand realises that an error has been made, he/she mayattempt to correct it, but the reformulation is as likelyto be inaccurate as correct. [In the development of theFluency rating scale, category 6 dealt with hesitationduring grammatical and lexical repair. It was discoveredthat whilst there was a difference between studentsregarding time spent on reformulating utterances, therewas also a difference regarding the success of thereformulation. Whilst the time spent in reformulation wasused in the construction of the Fluency rating scale, itwas considered that the accuracy rate of thereformulation should be used in the definition of theAccuracy scale].
215

Band 2Band 2 candidates may, like band 1 candidates, havetrouble forming plural nouns [Category 7] and may alsoomit whole noun or verb phrases from time to time[Category 5]. Frequent mistakes in the use of articlesalso occur [Category 8].In verb forms, however, band 2 candidates have fewproblems with the use of past tense, although they willmisuse the present simple, present continuous and presentperfect tenses [category 3].Band 2 candidates are most easily identified by theirattempts to use more complex grammatical structures incommunication, although this does not always result ingreater accuracy. [This relates to the finding that band2 candidates tended to make more errors due to theincreasing length and complexity of utterances]. They mayoften make mistakes in the use of relative pronouns,relative clauses and pronominal reference [Category 2].When a band 2 candidate is monitoring his/her own speechand notices that an error has been made, he/she willattempt to correct it. Unlike a band 1 candidate,reformulations will tend to be accurate.Band 3Although the frequency of extended contribution of band 3candidates to the conversation is higher than band 2candidates, only occasional errors can be noticed in wordorder or clause structure [Category 1: word order errorsoccurred in the speech of band 2 candidates because ofthe longer contributions; at band 3 the length ofutterances increases further, but the number of errorsdecreases]. Mistakes do occur from time to time with theformation of plural nouns [Category 7], and themisselection of an appropriate (or zero) article[Category 8]. In verb forms only mistakes in the use ofthe present simple tense are noticeable [category 3].However, mistakes in other areas of grammar are very rareand non-systematic. When a mistake does occur thecandidate's self-correction is almost always successful.Band 4Band 4 candidates rarely make mistakes in their use ofgrammar. When they do these are always non-systematic,typically including minor mistakes in word order[Category 1] or the misuse of an article [Category 8]
216
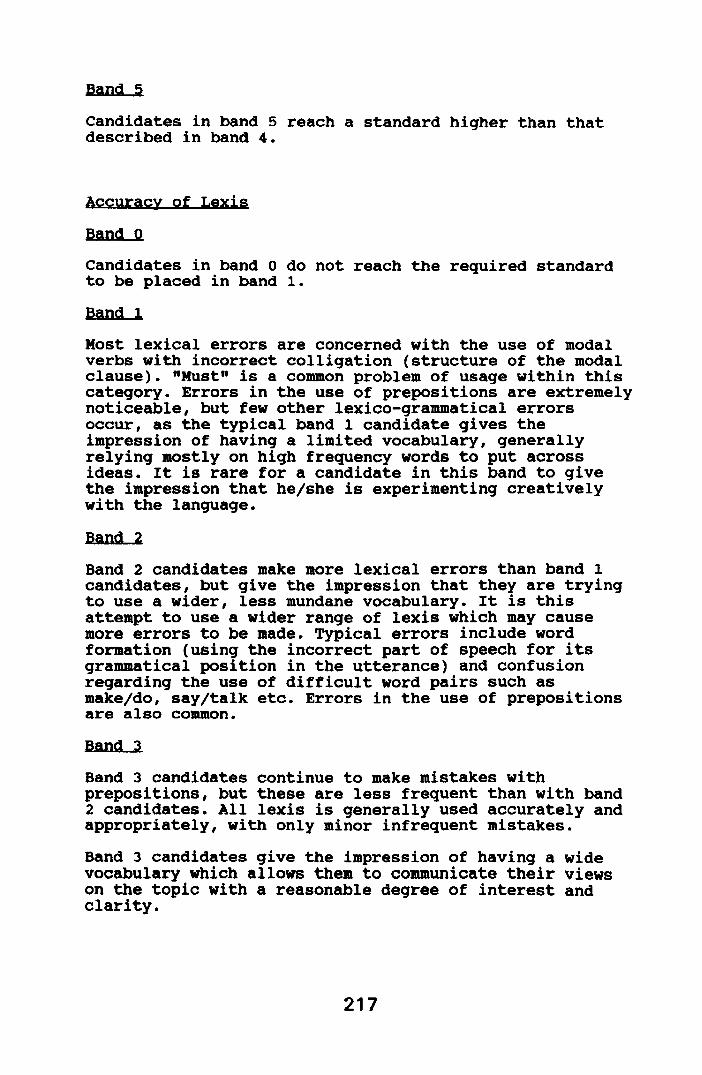
Band 5Candidates in band 5 reach a standard higher than thatdescribed in band 4.
Accuracy of LexisBand 0Candidates in band 0 do not reach the required standardto be placed in band 1.Band 1Most lexical errors are concerned with the use of modalverbs with incorrect colligation (structure of the modalclause). "Must" is a common problem of usage within thiscategory. Errors in the use of prepositions are extremelynoticeable, but few other lexico-grammatical errorsoccur, as the typical band 1 candidate gives theimpression of having a limited vocabulary, generallyrelying mostly on high frequency words to put acrossideas. It is rare for a candidate in this band to givethe impression that he/she is experimenting creativelywith the language.Band 2Band 2 candidates make more lexical errors than band 1candidates, but give the impression that they are tryingto use a wider, less mundane vocabulary. It is thisattempt to use a wider range of lexis which may causemore errors to be made. Typical errors include wordformation (using the incorrect part of speech for itsgrammatical position in the utterance) and confusionregarding the use of difficult word pairs such asmake/do, say/talk etc. Errors in the use of prepositionsare also common.Band 3Band 3 candidates continue to make mistakes withprepositions, but these are less frequent than with band2 candidates. All lexis is generally used accurately andappropriately, with only minor infrequent mistakes.Band 3 candidates give the impression of having a widevocabulary which allows them to communicate their viewson the topic with a reasonable degree of interest andclarity.
217

Band 4Band 4 candidates give the impression of having anextremely wide vocabulary which is almost always usedaccurately and appropriately to communicate effectively.Band 5Candidates in band 5 reach a standard higher than thatdescribed in band 4.
section 12: Grammatical accuracy and the morpheme studies12.1 Introduction
In the development of the descriptors forgrammatical accuracy on the rating scale it will havebeen noticed that in category 3 (tenses) and Category 9(miscellaneous) many observations on separate aspects ofgrammatical accuracy were collapsed for the analysis.After the PCA these categories were further collapsedprior to the discriminant analysis. This was essential tocope with those categories for which the data was toolittle to deal with individually. The interview techniqueused to gather the data was not designed to elicitparticular aspects of grammar, and it is impossible inany single piece of research to solve all data collectionproblems from the smallest aspect of grammatical accuracyin speech to the assessment of validity of an oraltesting procedure.
However, because of the need to collapse categories,the data were analyzed a second time for comparison withthe morpheme studies of de Villiers and de Villiers(1973), Dulay and Burt (1973; 1974), Bailey et. al.
218

(1974) and Larsen-Freeman (1975a1 1975b). The purpose ofthis comparison was to introduce a post-hoc test ofwhether the sequencing of aspects of grammatical accuracyin the rating scale band descriptors demonstrated anyrelationship to acquisition orders hypothesized by themorpheme studies, and to act as a second computationalcheck on the initial interpretation of the transcript forproducing the rating scale band descriptors. This checkcame in two stages. Firstly, five morphemes were comparedwith the results of the above studies using Spearman RankOrder correlations. Secondly, eight morphemes were usedin order to construct an "acquisition hierarchy" whichcould be directly compared with the prose of the banddescriptors of the accuracy rating scale. These twomethods would allow a secondary, independent check uponthe method of scale construction.
12.2 step I: rank ordersAlthough the data collected from twenty one
interviews in individual categories was not sufficientfor discriminant analysis which is a powerfulmUltivariate tool, it was certainly sufficient for theless demanding tools of non-parametric statistics as usedin the morpheme studies.
For this purpose, five morphemes were analyzed:plural (-s), progressive (-ing), past irregular,possessive and 3rd person (-s). The Group Means method(Dulay, Burt and Krashen, 1983 : 221) was used in
219

collecting the morpheme data. The rank orders arepresented in Table 5.18 in the Appendix to Chapter 5.The study of these morphemes shows general agreement withthe acquisition orders which have been discovered byother researchers. This acquisition order is presented inFigure 5.11.
Fig. 5.11. The suggested natural order of acquisitionfrom the morpheme studies (Dulay, Burt and Krashen, 1982:200)
Group 1 -ingpluralcopulaauxiliaryarticle
Group 2
Group 3 irregular pastGroup 4 regular past
3rd person singularpossessive
It is claimed by those who support the thesis thatthere is a natural order of acquisition, that sequence ofacquisition may vary within anyone of these groups, butthat the groups tend to be acquired in the same sequence.From the rank orders presented in Table 5.18 it can beseen that the main difference between this study and themorpheme studies occurs with the ordering of progressive(-ing).
220

12.3 step 2; An acgyisition hierarchy and the accuracyrating scale
Constructing an acquisition hierarchy fromobservations of occurrences of grammatical features ofstudent speech prior to the collapsing of data intolarger categories for discriminant analysis shouldprovide further evidence to suggest whether or not theprocess of collapsing the categories had significantlydistorted the data. Once an acquisition hierarchy hasbeen constructed, this may be compared with the banddescriptors to see if there is a correlation between thesequencing of features of accuracy produced by the twomethods. It must be stressed, however, that what followsdescribes a cross-sectional study of the use ofstructures from a sample of students at different abilitylevels. As it is not a longitudinal study, it is notcapable of discovering an acquisition order. However, thestudy which follows does use the same methodology whichhas been used to date in morpheme acquisition studies,and in this context serves as a confirmation of thequantitative analysis of the transcript data presented insections 7 to 10 above.
Taking eight grammatical structures for which therewere at least 3 obligatory cases within the data, anacquisition hierarchy similar to that in Figure 5.11 maybe constructed. The eight aspects of grammar consideredwere; pronoun case (Category 2), Progressive (-ing)(Category 3), contracted copula (-s) (Category 9), Plural
221

(-s) in allomorphs lsi and Izl (Category 7), articles(Category 8), past irregular (Category 3), 3rd person (-s) (Category 3), and long plural I:izl (Category 7).
The two steps involved in producing an acquisitionhierarchy similar to that in Figure 5.11 involveconstructing a disconfirmation matrix and a stair matrix.In a disconfirmation matrix the first structure is listedin the row and the second in the column. The figureentered in the intersecting cell is the percentage ofexamples which disconfirm that the structure in the rowpreceded the structure in the column in order ofacquisition. In the search for a natural order, fewerthan 7% disconfirming cases is usually taken to mean thatone structure preceded another. In the stair matrix theresults of the disconfirmation matrix are ordered to showacquisition order reflected in the data.
In the Appendix to Chapter 5, Table 5.19 containsthe disconfirmation matrix for the eight aspects ofgrammar listed above, and the stair matrix is presentedin Table 5.20. In the stair matrix a "+" represents fewerthan 7% of disconfirming cases, and (10) indicates fewerthan 10% of disconfirming cases. The construction of theacquisition hierarchy is an interpretation of thestructure of the stair matrix, and for the data in Table5.20 it would resemble Figure 5.12. It can be seen thatthere does appear to be an acquisition hierarchy fromthis data which closely resembles the band descriptors ofthe accuracy rating scale.
222

Fig. 5.12. A possible acquisition hierarchy for eightaspects of grammar.Group 1
Group 2Group 3
Pronoun caseContracted copula (-s)Long pluralIrregular pastShort plural
Group 4 ArticleProgressive (-ing)3rd person (-s)
---------------------------------------------------------
Comparing this with the natural order as suggestedby the morpheme studies it may be seen that irregularpast and the article have been inverted, and theprogressive has suffered the major change, having beenrelegated to the last group from the first.
It must be stressed that this analysis was carriedout after the band scale descriptors had been constructedas a method of assessing the relative success of theoriginal analysis of the data. Comparison of this orderwith the band descriptors yields the following results:
Band 1: Reference is made to all groups listed in Figure5.12, although no reference is made to errors in the useof the contracted copula.
Band 2: It is stated in the descriptors that candidateswill have few problems with past tense (Group 2), butwill make errors in present simple and progressive (Group
223

4), articles (Group 4) and plurals (Group 3). However, inthe descriptors no distinction is drawn between long andshort plurals. The possibility of there being such adistinction was considered at too late a stage in thedevelopment of the scale for this to be investigated.
Band 3: Mistakes will occur "from time to time" withplurals (Group 3, but see the note above), and onlyerrors in articles and present simple tense (Group 4) arenoticeable.
Band 4: Only occasional article errors are referred to inthe descriptor for band 4 candidates (Group 4).
It could therefore be argued that the relationshipbetween the band descriptors and this post-hoc analysisof a limited number of aspects of grammar could bepresented as in Figure 5.13 below, where a "+" is used toindicate that the band descriptor alerts raters to thepossibility of students having problems with grammarwhich belongs to a particular acquisition group.
The comparison of five morphemes studied here andother morpheme studies shows that there is a correlationbetween the data used in this study and the majority ofother morpheme studies, indicating that the acquisitionsequence which the accuracy rating scale assumes is inkeeping with findings in this field. Secondly, theacquisition hierarchy constructed from eight morphemes
224

Fig. 5.13. The relationship between acquisition groupsidentified in Fig. 5.12 and the band descriptors in theAccuracy rating scale.
Acquisition Group 1 2 3 4Band Descriptors
1 + + + +2 + + +3 + +
4 +
bears a direct relation to the sequence of banddescriptors in the rating scale, thus acting as a a checkon the interpretation of trends observed in the data.
section 13: DiscussionIt is argued that the approach described here to the
development of rating scales has resulted in a set ofband descriptors in which validity has been consideredprior to scale construction. Scales such as the ASLPR andACTFL which have some degree of specificity in thedescriptors may be used post-hoc to investigate validity,but do not seem to have been influenced by considerationsof empirical validity from the outset.
Recent investigations into the validity of ACTFL(Dandonoli and Henning, 1990) have relied on multitrait-multimethod studies which are, of course, important.However, after training raters the results of the studymay merely reflect the success of the training procedure.
225

That is, speaking scores may consistently correlate morehighly with each other across methods than do scores onother traits, but this does not necessarily relate to theband descriptors used in the rating scales. It is quitepossible that the number of bands on the scale and theband descriptors do not relate to any reality external tothe scale itself.
It is not claimed that the scales developed for thisstudy are in any way perfect, nor that improvements couldnot be made. What is claimed is that the empiricalapproach to scale development and descriptor writingprovides a tool which includes the concept of validityprior to its use in a given testing situation. This initself makes further post-hoc investigations of validitymore interpretable in the light of the original data anddevelopmental findings.
226

Chapter Six
Task Designsection 1: Factors in task design
The literature on task design concentrates on therole played by task based approaches to teaching Englishas a Foreign Language within the classroom. A major themeis the relationship of task to syllabus, which stressesthe way in which the task relates to a statement ofclassroom "tactics" (Candlin, 1987: 6). The place of thetask in a testing situation where one wishes to assessoral proficiency is somewhat different. Firstly there isno syllabus which will guide the production of tasks;secondly, the aim of the task is to elicit a sample oflanguage performance which will allow raters to assessthe oral proficiency of any given student taking the taskrather than to create an opportunity for learning assuch. The oral testing task is much more akin toCandlin's (ibid., 16) category of task for "research andexperimentation" rather than the categories of learnertraining, information sharing or developing learnerstrategies. In the Testing Handbooks it is task typewhich most often constitutes almost the entire discussionof oral testing (Carroll and Hall, 1985; Heaton, 1975;Hughes, 1989; Madsen, 1983; Underhill, 1987; Valette,1987). Task types are usually listed and described,occasionally with intuitive comment on the advantages ordisadvantages of their use. Experimentation with tasktype is occasionally presented as the central focus of a
227

new test (Sunderland, Yixing and Barr, 1988), and tasktype has also been used for classifying tests (Madsen andJones, 1981). However, there is little if any discussionof the procedures used in task design in the testingliterature.
Useful criteria are provided in the teaching, ratherthan the testing literature for the development of taskswhich could be used in an oral testing situation.
Candlin (1987: 9) suggests that a good task will be:balanced, motivating, co-operative, strategic, focused,open, structured and critical. We may assume that"structured" implies that the task has a specified formatand goal, and that "open" (apparently contradictory)implies the need to allow freedom of outcome within theformat and goal. Jones (1982: 84) argues that tasksdesigned for oral assessment should be reasonably short,well balanced, and provide equal opportunities for eachparticipant when more than one student is taking part.When discussing the grading of tasks, Nunan (1989: 98 -99) suggests that the task developer take into accountthe complexity and length of any texts which are to beused (if any), the difficulty of the vocabulary requiredto complete the task, the expected speed of speech andthe number of speakers, the explicitness of information,discourse structure, and the amount of non-linguisticsupport available. On the part of the task taker, thedeveloper needs to be aware of the level of confidence inusing the language, motivation, prior learning
228

experience, ability level, cultural knowledge andawareness, and linguistic knowledge. Studies assessingtask difficulty are few and far between. Kenyon andStansfield (1991) recommended field testing of tasks andthe use of questionnaire data from students and raters toidentify good and poor tasks. Stansfield and Kenyon(1992) attempted to scale a number of speaking tasks - orrather what look like functions within speaking tasks -described in the ACTFL Guidelines (1986). using a RaschPartial Credit model, they asked groups of Spanish,French and Bilingual Education teachers to assess thedifficulty of a number of tasks in a study for thedevelopment of the Texas Oral proficiency Test (TOPT).Although Stansfield and Kenyon discovered a reasonablealignment between the suggested difficulty level in theACTFL Guidelines and the assessment of difficulty byteachers, this is still far from field testing tasks onstudents and assessing task difficulty from scores. Itshould be remembered that expert scrutiny and judgementin assessing item difficulty in more traditional penciland paper tests is no substitute for the collection ofempirical data from pre-testing and trialling. Rater 5 inthis study commented that from initial analysis it wouldhave been likely that experienced teachers and examinerswould have classed Task 3 (described below) as the mostdifficult, but after seeing recorded interviews thisassessment changed (see page 345), which is in line withRasch estimates of the difficulty of the three tasks
229

developed for this study (see page 293).As Nunan (1989: 99) makes clear, one of the problems
within the literature on task design is that the relativecontribution of the factors discussed above to thesuccess of any given task for the purposes for which itwas designed is mostly unknown. He calls for furtherempirical research which will provide evidence to showwhich factors play the most important role in making atask successful.
In the absence of such information, the three taskswhich were designed for data collection in this studyfollowed the general guidelines for developing "good"tasks which are currently available from practitioners.In particular, it was felt that the tasks should bemotivating for students. It is clearly important todistinguish between task type and topic, which is notoften made clear in the literature. The first phase wasto decide on the task type for each of the three tests,and secondly to assign a topic which would be consideredinteresting for the students to each of the task types.
section 2: The three tasksThe three task types chosen for the study were:
1. Picture prompt OPI.2. Text prompt OPI (with prior exposure to the text).3. Group discussion.
Tasks 1 and 2 were designed to be conducted inapproximately 15 minutes. Task 3 involved a 10 minute
230

preparation period (which was not recorded or rated), andthe discussion lasted for around 15 minutes.
The topics chosen respectively for each of the tasktypes above were:1. Sports and Leisure Interests.2. Population and Poverty in the Third World.3. Education in Cyprus.
All the material devised to conduct these tasks iscontained in the Appendix to Chapter 6.
The topics were discussed with the teachers of thestudents who were to take the oral tests, and theyconfirmed that the students would probably be bothinterested in these topics and able to communicate onthem.
In each of the tasks there were clearlydistinguishable types of input. It is consideredimportant that this is the case, as each of the oraltasks must be seen as a separate testing method for thepurpose of conducting a validation study on the bandscales used in assessing the students.
In the case of Task 1 the students were presentedwith a picture which they were invited to describe andcomment upon. This was followed by the presentation offive more pictures from which they could choose one ortwo to comment upon. These prompts then lead into ageneral consideration of sport and leisure, with specificreference to the leisure activities of the stUdents. Assuch, the picture prompt differed significantly from
231

picture tests described in Bachman (1981) and Palmer(1981) in that the picture was mainly used as a way ofbeginning a conversation, rather than being the primeelicitation technique.
Task 2, Population and Poverty in the Third World,involved working on the input text in class prior totaking the oral test. All students were given a passageon the subject to read in class two days prior to takingthe test. The class teachers were told that the studentsmay read the passage for approximately 30 minutes, afterwhich the students may discuss the passage in class for afurther ten minutes. All copies of the passage were thencollected by the class teacher and returned to theresearcher. When the students arrived to take the oraltask the passage provided a starting point fordiscussion. Further input provided whilst the task wasactually taking place included a graphic representationof the material included in the passage, and anadvertisement asking for help for children in the thirdworld.
In Task 3, the group discussion on Education inCyprus, the students were provided with information abouteducation in Cyprus, specifically the proposed buildingof the island's first university, together with a taskcard, note paper and pencils. The students were thengiven exactly ten minutes to read, make notes or preparewhatever they wished to say. At the end of the ten minutepreparation time the task began.
232

The first two tasks were conducted by theinterviewer with one student at a time. In the third taskgroups of students attended simultaneously, and the taskinvolved group discussion rather than an interview assuch. within the definition of a simulation by Jones(1982) group discussion which is guided by specific inputdoes qualify as a simulation. This makes the third tasksomewhat different from the other two both in terms ofthe number of participants involved, and in terms oftheir roles. In the first two tasks the interviewerplayed the traditional role of eliciting assessablelanguage, whereas in the third task the role was that of"controller" rather than participant. It may be, as Jonesclaims (ibid., 83) that in such a task the controller isbetter able to assess the proficiency of the studentsonce freed from the need to maintain interaction. It wascertainly the case that the interviewer was required todo much less work in maintaining the interaction whenconducting Task 3 than in conducting the other two tasks.Considerable evidence was gathered from students(Chapters 7 and 10) that they preferred Task 3, and thatit provided them with a greater opportunity to speak thanthe other tasks, and from raters that Task 3 provided themost assessable language in terms of both quantity andquality (see page 346).
233

section 3: Expected discourse outcomesEach of the tasks was also designed in the
expectation that it would generate different outcomes interms of discourse. Task 1 on sports and leisure wasdesigned to elicit:* expressing personal opinions* selecting and expressing personal preferences* stating likes and dislikes* narrative (past engagement in sporting events)* description of a picture* description of personal leisure activities
Task 2 on population and poverty in the third worldwas designed to elicit:* summary and explanation of a technical text* comparison and contrast (between Cyprus and another
country)* interpretation of graphic material* expressing an opinion on how to solve a problem
Task 3 on education in Cyprus was a much more open-ended task than the other two tasks, and it was difficultto predict outcomes in advance. As the direction to thestudents becomes less guided it becomes less and lesspossible to predict what will happen (Wright: 1987: 49;Nunan, 1989: 48). However, it was generally expected thatthe task would elicit:
* expression of personal opinions* asking for clarification* expression of agreement and disagreement
234

Task design and development is an area of researchin itself, but was not a major focus of this study. Assuch, a thorough effort to compare actual languageelicited in the conduct of the tasks with thedescriptions of predicted outcomes above, which wouldhave involved the transcription and detailed analysis ofinterviews (as in stansfield and Kenyon, 1992), was notdone. However, when viewing a sample of tapes thelanguage produced was informally checked against thedescriptions of predicted outcomes. On this informalbasis it appeared that the tasks did tap what they wereexpected to tap, with one exception. Little evidence wasobserved of Task 1 eliciting past tense narrative. Themajority of students talked about present activities andavoided talking to any extent about how they began asport or leisure activity.
section 4: Elicitation techniQuesThe elicitation technique should be distinguished
from task type. The latter refers to the format of theoral interview (Zappala, 1979b). The former refers to thespecific prompts, be they words, pictures or other cueswhich are used by the interviewer to elicit a languagesample (Zappala, 1979a; Lowe, 1976; 1985b).
Research which has been conducted into the format ofquestions, prompts and statements made by the intervieweror controller while conducting an interview or other typeof oral assessment task tends to suggest that this is a
235

test method facet which may influence students' scores(Bachman, 1990). This aspect of task design could betermed "interviewer related error."
No research could be found which has been done onthe extent to which alteration in the wording ofquestions or prompts in oral testing situations mayaffect student output and hence influence scores.However, variation in the form, speed or content ofquestions or prompts would fall within the definition oftest method facets presented by Bachman (1990: 119).
One specialised form of oral interview has, however,been investigated in some detail. This is in the area ofstandardized survey interviewing when collectinginformation from a specified population for a givenpurpose. Those most commonly reported are governmentpopularity polls. The elicitation in these interviewsdiffers from elicitation in real interviews or oraltesting tasks in that (a) the aim of the interview is toelicit a particular opinion on a given subject, and theopinion is recorded, and (b) the elicitation technique isdevised in such a way as to allow the opinion to berecorded accurately.
However, it does seem likely that variations similarto these may also have an effect on the quality of datawhich is collected in a much more open interview or oraltesting task where the aim is to elicit a sample ofassessable language. Whilst oral language testingencounters are not entirely like the standardized survey
236

interview, they have more in common with it than, forexample, conversations on television talk shows, wherethere is no element of assessment in an interview whichnevertheless operates within certain time frames and withcertain rules. Indeed, Fowler and Mangione (1990: 18 -20) argue that in most types of exploratory researchwhere results are to be quantified, advantages are to begained from standardizing the elicitation technique. Anyvariation in the format of the interview or task whichcould be due to the role of the interviewer could beresponsible for the variation in data which is gathered,even if this is open ended rather than the more usualclosed-option format of the standardized surveyinterview. It seems that this would be more true for anoral testing task where the candidates are assessed on aband scale devised specifically for the task rather thanband scales which could be used with any task, as thenature of the task would be severely altered. However,even with band scales which are not task specific itwould still appear that great variation would constitutean alteration of the task, as has been recognised by sometest developers (Calderbank and Muhammed, 1988: 53). Forthis reason, results from survey interviewing stUdieshave been taken into account in the design of the taskswhich were used in this study for the data collectionprocess.
Those aspects of survey stUdies which relate mostdirectly to oral testing concern the construction of
237

elicitation techniques and their use by the interviewer(in the case of this study, as only one interviewer wasinvolved) or across interviewers when an oral test isadministered to large numbers of candidates, perhaps inmany countries.
ElicitationQuestions or prompts are sources of error when:(a) they are misunderstood,(b) they expect a response which the interviewee cannot
give in terms of culture and/or content, and(c) they require an answer of a personal nature which
the interviewee is not prepared to give.InterviewersThe interviewer is a source of error when s/he:(a) alters the form or content of the question or
prompt,(b) biases the response of the interviewee by indicating
his/her own views on the topic.
It would follow that in order to standardize theelicitation technique, the interviewer should stay asclose as possible to the elicitation procedure asdescribed by the designer - preferably by asking the keyquestions or delivering the key prompts at each phase inthe task in exactly the same way for all students. Afterthis it will be necessary to add questions or promptswhich are non-standardized if the candidate takes theconversation in a particular (or unexpected) direction,but all comments or questions in between the major phasesof the interview should be non-directive. Indeed, withreference to standardized survey interviews, it is
238
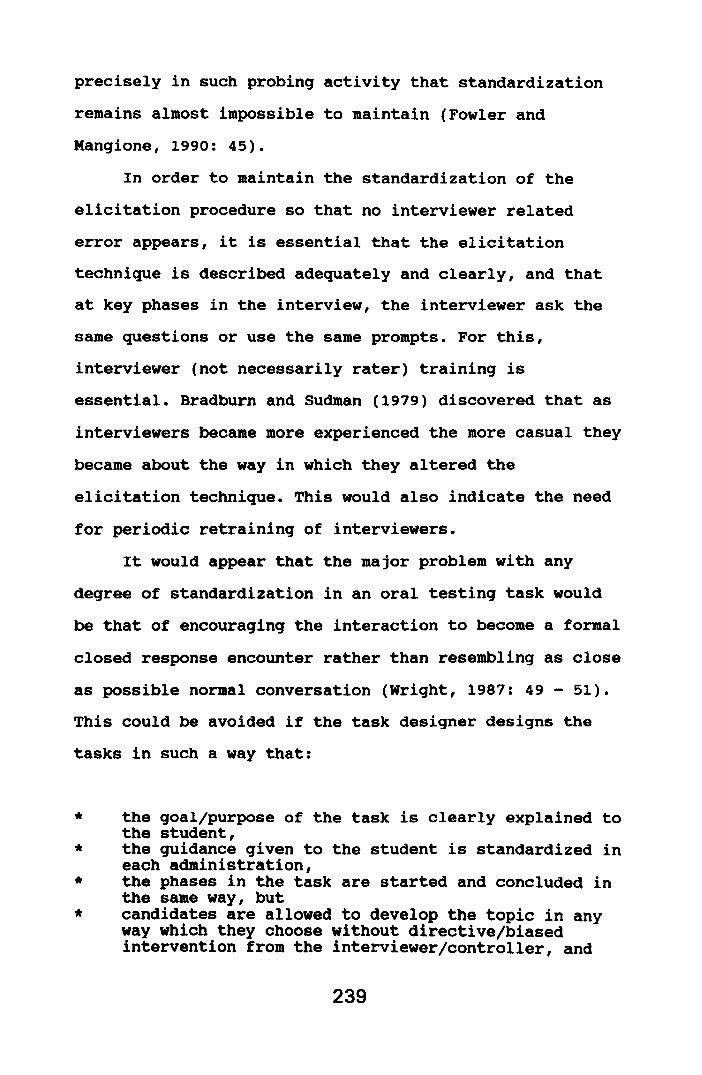
precisely in such probing activity that standardizationremains almost impossible to maintain (Fowler andMangione, 1990: 45).
In order to maintain the standardization of theelicitation procedure so that no interviewer relatederror appears, it is essential that the elicitationtechnique is described adequately and clearly, and thatat key phases in the interview, the interviewer ask thesame questions or use the same prompts. For this,interviewer (not necessarily rater) training isessential. Bradburn and Sudman (1979) discovered that asinterviewers became more experienced the more casual theybecame about the way in which they altered theelicitation technique. This would also indicate the needfor periodic retraining of interviewers.
It would appear that the major problem with anydegree of standardization in an oral testing task wouldbe that of encouraging the interaction to become a formalclosed response encounter rather than resembling as closeas possible normal conversation (Wright, 1987: 49 - 51).This could be avoided if the task designer designs thetasks in such a way that:
* the goal/purpose of the task is clearly explained tothe student,
* the guidance given to the student is standardized ineach administration,
* the phases in the task are started and concluded inthe same way, but
* candidates are allowed to develop the topic in anyway which they choose without directive/biasedintervention from the interviewer/controller, and
239

* within phases non-standardized interaction takesplace in order to maintain the conversation.
The elicitation techniques used in each oral taskshould therefore be specified as fully as possible interms of key prompts within phases. These are describedbelow for each of the tasks.
Task I: Sport and LeisurePhase One: Warm Up* Greet the student* Check the name of the student* "Tell me, X, how long have you been learning
English?"* "That's quite a long time. You must think it'simportant to learn English to study (+ contextualreference eg., for five years). Tell me, why do youthink learning English is so important?"
Phase Two: Picture Task* "Now, I'm sure that you've done this kind of thing
before. What I'm going to do is show you a picture.You'll have a few seconds to look at it and then Iwant you to describe what you see and make anycomments you want about it. Okay?"
* Show Picture One* "Why do you think people take up dangerous sports
like mountain climbing? (optional: "Would you liketo try this sport if you had the chance?"
* Show other pictures.* "If you could take up one of these sports, which onewould you choose, and why?"
* "Which is your favourite sport?"* "Is any special training necessary?"* "Generally speaking, do you think sport is important
in people's lives?"Phase Three: Wind Up* "Do you have much leisure time when you're
studying?"* n How do you spend your leisure time?"* Follow up any interesting points made.* wish students well with their studies.* Leave taking.
240

Task Two; Population and Poverty in the Third KorldPhase One: Warm Up* Greet the student* Check the name of the student* Check that they have had time to read the passage* "Tell me, X, have you ever visited any other
countries?"* If yes, then "How do you think life in Y differs
from life in cyprus?"* If no, then "How would you expect life in an African
or Asian country to differ from life in Cyprus?"Phase Two: Text and Graphic Task* Show student the previously prepared passage. The
candidate may spend one minute skimming the test.* "Could you summarise what you think is the main
argument of this text for me?"* Show student the bar graphs.* "From these tables, what do you think are the main
trends in population growth?" (Optional: "What dothe death rates in these areas of the world tell usabout how well off the people are?")* If you were president of an African country such asEthiopia, what measures would you take to reduce thebirth rate?"
* Show the candidate the advertisement.* "How is this related to the subject of the passage?"
(Optional: "Do you think this kind of advertising iseffective?")
Phase Three: Wind Up* "Do you think that there is anything people in
Cyprus can do to help Third World countries?"Develop interesting ideas briefly.
* Leave taking.
Task 3; Education in CyprusPhase One: Warm Up* Greet the students* Check names of the students* Explain to the students that they will have ten
minutes to prepare before beginning the task.* Give each student the passage about the university
of Cyprus and a Task card.* Read the Task Card aloud to the students.
241

* Ask the students if they have any questions aboutwhat they are expected to do.
* Inform the students that they may make any notesthey wish.
Phase Two: Discussion* The controller should attempt to keep the length of
the discussion to approximately 15 minutes.* The controller may add a point or ask a question if
necessary only to keep the discussion going, butshould allow the students to maintain theinteraction on their own as far as possible.
Phase Three: Wind Up* "Would you prefer to go to a foreign university even
if there were a university in Cyprus?"* Develop any interesting points made.* Leave taking.
section 5: Description of the student sampleAll tasks were attempted by 47 students studying in
Cyprus, between January and March 1991. All students werepursuing courses leading to the First certificate EnglishExamination of the University of Cambridge LocalExaminations Syndicate.
The average age of all students was 15 years, fivemonths. The number of female students was 21, and theiraverage age was 15 years, 7 months. The total number ofmale candidates was 26, and their average age 15 years, 2months.
The students were identified as coming from threesubgroups of the population in advance of the studytaking place, based upon their class placements andteachers reports of their language learning history.Group 1 was labelled "Good language learners", Group 2
242

was labelled "Average language learners" and Group 3"poor language learners". Their numbers and average agesare given below.
Group 1Total number of students: 11Average age: 15 years, 0 monthsNumber of female students: 6Average age: 15 years, 0 monthsNumber of male students: 5Average age: 15 years, 1 monthGroup 2Total number of students: 17Average age: 15 years, 3 monthsNumber of female students: 9Average age: 15 years, 3 monthsNumber of male students: 8Average age: 15 years, 2 monthsGroup 3Total number of students: 19Average age: 16 years, 6 monthsNumber of female students: 6Average age: 16 years, 7 monthsNumber of male students: 13Average age: 16 years, 5 months
All students in the sample were native speakers ofGreek, although one female student from Group 1 wasbilingual in Greek and Hungarian.
243
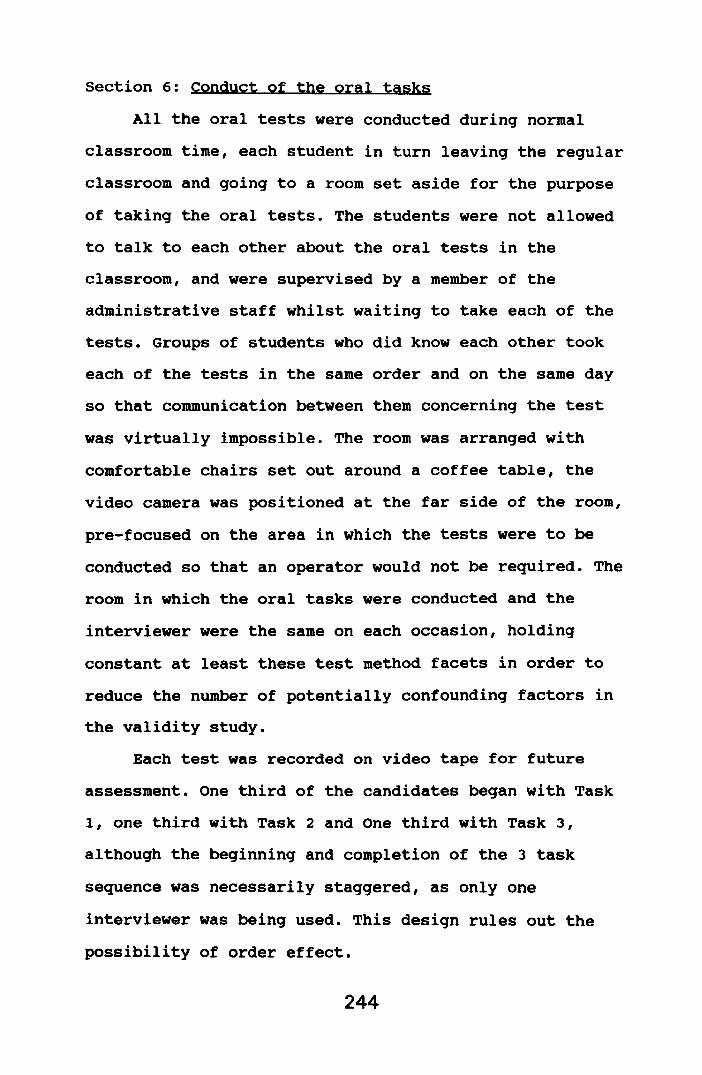
Section 6: Conduct of the oral tasksAll the oral tests were conducted during normal
classroom time, each student in turn leaving the regularclassroom and going to a room set aside for the purposeof taking the oral tests. The stUdents were not allowedto talk to each other about the oral tests in theclassroom, and were supervised by a member of theadministrative staff whilst waiting to take each of thetests. Groups of students who did know each other tookeach of the tests in the same order and on the same dayso that communication between them concerning the testwas virtually impossible. The room was arranged withcomfortable chairs set out around a coffee table, thevideo camera was positioned at the far side of the room,pre-focused on the area in which the tests were to beconducted so that an operator would not be required. Theroom in which the oral tasks were conducted and theinterviewer were the same on each occasion, holdingconstant at least these test method facets in order toreduce the number of potentially confounding factors inthe validity study.
Each test was recorded on video tape for futureassessment. One third of the candidates began with Task1, one third with Task 2 and One third with Task 3,although the beginning and completion of the 3 tasksequence was necessarily staggered, as only oneinterviewer was being used. This design rules out thepossibility of order effect.
244

Immediately upon completion of all three tests thestudents were given a detailed questionnaire to completeregarding their attitude towards each of the tests andasking them to assess their own level of oralproficiency. Eight of the forty seven students were shownvideo recordings of one of their tests two weeks afterthe completion of the study, and were asked to retrospectregarding their performance. These interviews wererecorded on audio tape.
Each student took all three tasks within the spaceof one and a half weeks, and it took six weeks inFebruary and March 1991 to conduct all tasks for allstudents.
Two problem cases arose. One student suffered fromsuch severe anxiety that she could only whisper duringthe tests, and raters reported that they could not hearher clearly enough to award scores from the video tapes.This student was therefore excluded from furtheranalyses, reducing the sample to 46. One student wastaken ill immediately after the completion of the threetests, and did not complete a questionnaire. This meantthat the analysis of questionnaire data is from a totalof 45. This did not, however, influence the concurrentstudy as FeE scores were available for the student.
The picture quality of the video data was adequate,although not good enough for the video cassettes to beused for rater training, for example. However, as ratertraining was not an issue in this study the picture
245

quality is considered to be unimportant. The audioreproduction was good. Only one student could not beassessed from the recorded data, as reported above.
246

Chapter Seven
student Affectiye FactorsSection 1: Introduction
In this study we are interested in student affectivefactors because of their potential to confound results inthe reliability and validity studies which are describedin Chapters 8 and 9. If affective responses to testsituations or tasks are seen to account for a significantproportion of variance the results of reliability andvalidity studies are called into question, as evenpositive results could be caused by systematic affectivefactors rather than student ability as recorded on therating scale being used. This Chapter is thereforeconcerned with establishing that affective factors didnot influence results to any significant degree, and thatthese factors can be eliminated from consideration asconfounding factors in the evaluation of reliability andvalidity.
Testers often claim an interest in the responses andreactions of students to testing situations. Underhill(1981) makes this one of the central themes in his bookon oral testing much applauded by Lantolf (1988), and yetthere is no reference at all to research on factors thatmight playa role (Fulcher, 1990: 81). Other researchers,notably Ingram (1985b) specifically isolate factors suchas introversion / extroversion, intelligencer experience,education, social norms and willingness to communicate,as factors that may influence student affective reactions
247

to the oral testing situation. The underlying problemsraised by work dealing with the nature of communicationin the oral test itself (van Lier, 1989; Perrett, 1990)and choice of topic (Douglas and Selinker, 1985) areclearly also related to affective aspects of testing, inthat these factors may systematically influence thebehaviour of the student under test conditionsindependently of the oral trait that the tester wishes tomeasure. The extent to which this is reflected in testscores represents a confounding factor in theinterpretation of those scores. It is therefore theresponsibility of the test researcher to ensure that someof the most common confounding factors have beenaccounted for prior to interpretation of results.
Shohamy, Reves and Bejarano (1986, 213) state thatin developing a test of oral proficiency in Israel, oneof their aims was to "evoke positive attitudes on thepart of the test takers." This aim is important in thatsuch a positive attitude would, it is suggested, reducethe number of potentially confounding factors that mightaffect oral scores. Shohamy and Stansfield (1990, 87)report that the project was successful in this respect,with subjects indicating a positive attitude towards"content, technical quality and ability of the HeST[Hebrew Speaking Test] to probe their speakingability •••" This is in line with similar results(Shohamy, 1983a, 235 - 236) which suggested that directspeaking tests were considered to be accurate measures of
248

ability by students themselves. They enjoyed them, weregenerally comfortable, and found the experienceinteresting and challenging.
The other major issue which has receivedconsiderable attention is that of test anxiety. Galassiet al (1984) and Madsen and Murray (1984) have shown thata small but significant amount of score variance can beattributed to test anxiety. Savignon (1972, 1985), Ingram(1985b), and Shohamy and Stansfield (1990, 87) suggestthat anxiety is reduced in a direct testing situationsuch as an oral interview because of the presence of thehuman interlocutor, as opposed to a tape recorder in asemi-direct test of speaking.
scott (1986) investigated affective factors inrelationship to a pair oral interview and a group oralinterview, and concluded that there was no essentialdifference between questionnaire responses of studentswho had taken the one test format or the other. However,similar concerns were expressed by both groups especiallywith regard to time constraints.
Young (1986) suggests that subjects of low abilitysuffer more from debilitating anxiety than high abilitystudents, but discovered a small significant negativecorrelation between assessments of anxiety and ACTFLscores, suggesting that some anxiety does facilitateperformance in an oral interview. Young's conclusions(ibid., 439) are in line with those of Galassi et al (op.cit) and Madsen and Murray (op. cit) that "ability, not
249

anxiety, is the more important variable affecting OPIscores ••••n Similar conclusions are reached by Barley(1990), who found non-significant correlations betweenoral test scores and reported as well as measured anxietylevels. However, the research done on the relationshipbetween anxiety and test scores does not distinguishbetween trait, state and situational anxiety as isgenerally the case with anxiety studies in other areas(MacIntyre and Gardner, 1991).
Section 2: Questionnaire structureAs soon as the students used in this study had
completed all the oral tasks, they were asked to completea questionnaire for each of the tasks, with a few generalquestions attached to the end. The questionnaire for Task1 is included in Appendix 7.18, together with the generalquestions. This was adapted from that used in Scott(1986). There was no difference between the questionnaireformat used for each task.
In order to investigate the structure of thequestionnaire, Principal Axis Factor Analysis was used.In the first analysis only factors with eigenvalues of 1or greater were extracted, and this produced 2 for eachof the three questionnaires, accounting for 24.95%,33.17% and 40.12% of variance respectively. Initialeigenvalues indicated, however, that another two factorscould be extracted with eigenvalues of greater than .5,and so this option was taken in order to extract the
250

maximum amount of information from the data available(Farhady, 1983: 18 - 19).
Tables 7.1, 7.2 and 7.3 in the Appendix to Chapter 7contain the results of the Factor Analysis for the threequestionnaires with 4 factors extracted. In the threeanalyses there are many consistencies. The first is thatquestions 2 and 3 always load on the same factor, and itis these two questions that are concerned with testanxiety. On questionnaire 1 and 3, question 5 also loadson the same factor, and this question also seems torelate to anxiety in that it is concerned with whether ornot the students believe they would have done better hadthey taken the test on another day. It would seem thatquestions 2, 3 and 5 make up a block concerned with testanxiety.
The second consistency is that questions 1 and 6load on the same factor on questionnaires 2 and 3,although in questionnaire 1 question 6 stands alone onfactor 4 and there are no significant factor loadings forquestion 1. Both of these questions concern the students'perception of the validity of the task as a test. Thefact that these questions cluster is fully in line withScott's (1986) view that students are capable ofseparating perceptions of the validity of a test fromtheir perceptions of test difficulty.
A third cluster of questions is based aroundquestions 8, 13 and 14, all of which load on the samefactor in questionnaire 1, and co-occur with questions 9
251

and 15 in questionnaire 2 and 15, 4 and 6 inquestionnaire 3. Question 8 concerns whether or not thestudent liked doing the task, question 13 concernswhether or not the student thinks that the task wasinteresting, and question 14 with whether or not taking atask was an unpleasant experience. This cluster thereforeseems to be an "enjoyment" factor. It is noteworthy thatthe only other question that loads on the same factor intwo of the questionnaires, question 15, is concerned withthe students' perception of the fairness of the topicchosen for the interview. It would therefore seem thatthe choice of topic is related to perceptions ofenjoyment of the experience of taking the test, ratherthan perceptions of validity or indeed test anxiety.
From the factor analysis, it is believed that thereare three coherent factors at work in the studentresponses to the questionnaire. These are the factors oftest anxiety (questions 2, 3 and 5), perception of testvalidity (questions 1 and 6) and enjoyment of the testexperience (questions 8, 13, 14 and 15). When looking atTables 7.1 - 7.3 it should be remembered that negativeloadings frequently reflect reverse scoring of thequestion. Apart from question 14 these are not high, anddo not appear to form any interpretable patterns.
Section 3: Summary statistics for the QuestionnairesThe mean and standard deviation for each question
for 46 respondents are presented in Table 7.4 in the
252

Appendix to Chapter 7. Prior to commenting on questiongroups, it is interesting to note that the responses toquestion 11 consistently show that students did not onthe whole think that the interviewer was a factor in thescores that they receive. However, it is on Task 3, thegroup discussion, that students think the interviewer isless important, that they have more control over theirown destiny, as it were.
It is now possible to look at the students'responses within the factor blocks for each task,beginning with the part played by anxiety.
student responses indicate that there was a fairdegree of anxiety prior to doing task 1, although notwhilst doing the task. with task 2, there would appear tobe much less anxiety before taking the test, whilst thegroup discussion appears to produce the least amount ofanxiety. This result is not an order effect, as the orderwas rotated.
When it comes to validity, although there isagreement amongst students that task 1 provided them withan opportunity to demonstrate their ability to speakEnglish, in general stUdents were much less positiveabout their perception of the validity of task 1 inproviding the examiner with accurate evidence of theirability. This must be compared with task 2, which was themost difficult task for all students (see page 293),which the students see as providing accurate informationfor the examiner. Again, task 3 is viewed positively by
253

most students as a valid test. The first task, thepicture prompt, was not seen by the students as a validtest of their oral ability.
Task 1 was generally considered to be an enjoyableexperience, as was task 3. However, more students thoughtthat task 2 was not enjoyable and that the topic wasdifficult. Task 2 is a good example of an oral testingtask which many students did not enjoy, but view as avalid test of their oral ability. This illustrates theway in which students are able to make distinctions intheir value judgements of what they are expected to do inexamination conditions.
section 4: Analysis of Questionnaire responses by groupand task preference.
One way ANOVAs were conducted for each of the threeability groups discussed on pages 242 - 243. Where theANOVA was significant at p < .05 a post-hoc Tukey testwas conducted to discover the source of the difference inresponse patterns.
For task 1, differences were detected in questions 5and 6. For task 2, differences were detected in questions3 and 13. For task 3, no differences in response patternswere noticed.
Question 5 related to anxiety, and question 6 toperceived validity, question 3 to anxiety and 13 toenjoyment of the task. The results are presented inTables 7.5 to 7.8 in the Appendix to Chapter 7.
254

Groups 2 and 3 tend towards having no opinionregarding whether or not they would have done better ontask 1 had they done it on another day.
In this case, the less able students considered task1 to be capable of providing evidence upon which theexaminer could accurately assess their oral abilities. Asproficiency increases, the perceived validity of the taskdecreases. Group 1 students (more able) actually disagreewith the view that task 1 is capable of eliciting an oralsample upon which they can be fairly assessed. It will beshown later (see page 293) that task 1 was the secondmost difficult task, after task 2. However, theperception of more able students was that it was too easyfor them.
Less able students from Group 3 report sufferingfrom anxiety whilst doing task 2, whereas the other twogroups did not tend to suffer from anxiety. Again, itwill be shown that task 2 was by far the hardest on allrating scales, and it would appear that for less ablestudents this was a stressful experience. From theseresults the importance of selecting a task that has adifficulty value not very much greater than the averageability level of the students would seem to be animportant factor in reducing test related anxiety. Inthis respect, Rasch partial credit models do seem tooffer a great advantage over other methods of testanalysis, for as Rasch models measure task difficulty andstudent ability on a common scale, it is possible to
255

select a task the difficulty of which is estimated to beat a level which would not induce stress in the students.This would reduce test anxiety to a minimum and remove apotentially confounding factor from the testing process.
Even though less able students reported beinganxious when they were taking task 2, Table 7.8 showsthat they did find the task interesting. As it wasdiscovered that question 13 was related to the concept ofenjoyment of the task together with questions 8 and 15,summary statistics are also presented for these questionsby group in Table 7.9 in the Appendix to Chapter 7.Although there is some variation in the responses ofGroups 1 and 2, it is quite clear that Group 3 studentsconsistently report enjoyment of task 2, despite anxietyand difficulty.
It can only be concluded from these results that theconcepts of anxiety and enjoyment are separate, and thatthe students are indeed capable of distinguishing betweenthem. A reasonable degree of anxiety does not appear todetract from any enjoyment less able students are capableof experiencing from the oral test.
Question 16 on the questionnaire allowed eachstudent to select the task that they would prefer to doif they were given an option within an oral examination.The number selecting each task is given in Table 7.10 inthe Appendix to Chapter 7.
Easily the most popular task was the groupdiscussion, task 3, with slightly over 50% of students
256

stating that they would opt for this test format if givena choice. Task 1, the picture prompt was second, and task2 the third option for all groups of students.
As the students can be classified into three abilitygroups and three task preference groups, it is possibleto use mUltivariate analysis of variance (MANOVA) on thescores for Fluency, Accuracy and the ELTS score for eachof these classifications, in order to investigate whethera preference for a particular task or an interactionbetween ability level and preference account for thescores received. In the Appendix to Chapter 7, Table 7.11contains the MANOVA results for the ability groupvariable, Table 7.12 for the task preference variable,and Table 7.13 for the interaction.
Table 7.11 confirms the results of the GroupDiscrimination validity study on page 315, although itshould be noted that on task 3 the Accuracy scale doesfail to discriminate amongst students. This is probablynothing to do with the task, but with the scale itself,as it will be shown later that it is used inconsistentlyacross tasks.
In the case of the Task preferences, none of theunivariate test statistics are significant, although themUltivariate statistics indicate that prediction ofpreference is possible when using all sources ofinformation available. This suggests that there may besome interaction effect between group and preference.
From Table 7.13 it can be seen that there is an
257

interaction effect of Group and Task preference for theFluency scores on tasks 2 and 3, for the Accuracy scoreon task 2, and for the ELTS score on task 2 and 3. To beable to spot these interaction effects, means andstandard deviations from all students classified by Groupand Task preference are given in Tables 7.14 and 7.15 inthe Appendix to Chapter 7. It should be noted thatfurther statistical analysis of this data cannot becarried out, as the total number of 45 respondents hasbeen broken down into categories, some of which are toosmall to provide reliable results. Some categories alsohave no variance, making interpretation especiallydifficult. However, the following possibilities dosuggest themselves. (a) Students from Group 2 whopreferred task 3 tended to get higher scores on allscales on task 2, and higher than usual scores on theFluency scale on task 3. (b) Students from Group 1 tendedto score higher on the Accuracy scale for task 2 whenthey state they prefer task 2, and lower than usual onthe Fluency scale when they state that they prefer task3. (c) Group 3 students score less than usual on theAccuracy scale on task 2 if they prefer task 3, butbetter than usual on the ELTS scale for task 2 if theystate they prefer task 2.
Two of these observations (b) and (c) are consistentwith the possibility that student preferences for testformat at certain ability levels do affect the scoresthat they will get to some limited extent. Observation
258

(a), however, contradicts this, suggesting at least formiddle ability level students their preferences for testformat are unlikely to have any influence on scores atall.
Section 5: Student self assessmentQuestion 18 on the questionnaire asked the students
to assess themselves in general oral proficiency,grammatical accuracy and fluency, on a five point scaleranging from very good to very poor. One way ANOVAs wereperformed to test whether there was any differencebetween the responses of the three groups to thequestion, and in each case these were not significant,suggesting that students are incapable of assessing theirown oral proficiency. This is a similar finding to thatof Bohn and Bohn (1985) who found that students were notcapable of accurately assessing speech samples of theirown or their peers within a classroom setting.
The responses to the three part question werecorrelated with the Rasch estimates of ability from theFluency scale, Accuracy scale and ELTS scale, partiallingout task effect. The results are presented in Table 7.16in the Appendix to Chapter 7, and confirm the view thatstudents do not seem able to assess their own oralproficiency.
259

section 6: The relationship of reported anxiety to Raschability estimates
The findings of this research are not completely inline with those of previous studies concerning therelationship of anxiety and oral test results, in thatthere is a weak correlation between lack of anxiety andbetter test results (Scott, 1986: 107). The data arepresented in Table 7.17 in the Appendix to Chapter 7. Itshould be noted that although the correlations areinverse, questions 2, 3 and 5 were scored with "stronglyagree" = 5. The correlations between reports of anxietyand slightly higher test scores should therefore be readas positive.
The results of this study, however, do notcontradict the view that a limited amount of anxietyfacilitates student performance in oral tests, for thecorrelations are too weak to draw any firm conclusions.
section 7: summary of gualitative analysis of responsesto open ended gyestions, for Questions 6, 8, 12, 15 and~
Question 6 on each questionnaire was concerned withthe perceived validity of the task, and question 8 withenjoyment. Question 12 was intended to tap perceiveddifficulty of the task, but this did not relate to anyother questions in the factor analysis. Question 15 alsoconcerned perceived enjoyment of doing the task, whilstquestion 17 attempted to discover what, if anything,would make the oral testing situation less stressful for
260

the student.Student responses to these questions will not be
analyzed in detail, as they do not relate specifically tothe assessment of rating scales. However, interestingresponses may be summarised in the following fourcategories.
category 1; Interviewer related responsesMost of these concerned the person interviewing the
students or conducting the oral test, and fell roughlyinto two categories; comments concerning the interviewerhim/herself, and comments concerning the examiner and theorganisation of the oral test. In the first category camecomments such as interviewers should provide studentswith more help in order for the latter to continuetalking if they feel that they cannot say anything else,that the interviewer should make more jokes to helpstudents to relax, the interviewer should phrase allquestions clearly, and finally, the interviewer should bea nkind" person who allows and encourages the students tospeak openly and freely. In the second category camecomments such as there should be time prior to the oraltest for the students to meet the interviewernsocially" - one student even said that the interviewershould offer drinks to students prior to the oral testbeginning - so that they could get to know him/her betterbefore the test thus reducing stress associated withhaving to talk with an unknown person. Two students would
261

have been happy with a five minute "chat" prior to theinterview.
It would appear that part of the stress associatedwith an oral test does seem to be the forebodingconnected with having to talk for a given length of timeto a person whom one has never met before.
category 2; Technology related responsesThree students reported feeling nervous during the
interviews simply because there was a video camera in theroom. This point is to be taken seriously, as recordingequipment may make some students more nervous than theywould otherwise be. However, this cannot be helped whenit is necessary to grade after the interview or whenrecording is used for moderation or research purposes.
category 3; Task related responsesTwo students strongly believed that students should
be provided with information on the format and subject ofthe oral test prior to the test taking place. Not knowingthe subject or precisely what would be expected of themwas the prime cause of anxiety for this small percentageof students.
category 4; Student related responsesFour students specifically commented that anxiety
had nothing to do with the testing situation or theinterviewer, but with their own state of mind.
262

"Uncertainty in myself" was one reason for nervousness,and another student said that the only way to feel lessanxious was to study harder, that "knowing more Englishand being more fluent" was the only way to reduceanxiety. Two students said that nothing could be done toreduce anxiety; anxiety for them was a natural part ofany test, and that they would always be anxiousimmediately before the start of the test, but that theyconsciously try to relax and usually do this after thefirst few minutes.
section 8: DiscussionFrom the answers to the questionnaire, it may be
claimed that these students are capable of distinguishingclearly between their enjoyment of doing an oral task,their view of the validity of the task as a method ofassessing their language abilities, and their anxiety inthe testing situation. They are also capable ofexpressing their views about what factors are importantin improving the tasks. Task one was generally seen to befair, enjoyable, but invalid as a test for all but theweakest candidates. Task 2 was seen to be valid, but notenjoyable, causing a fair degree of anxiety. Task 3 wasseen as the fairest test, enjoyable and valid by moststudents.
The relationship between anxiety, perceivedvalidity, task difficulty, task preference, taskenjoyment and student ability is complex. Task 3, the
263

Group Discussion appears to be the best test of oralabilities from the point of view of utilising positivestudent affective factors, as it is viewed as the mostenjoyable, the least difficult, the most valid andcreating the least amount of test anxiety. It istherefore not surprising that most students said thatthey would prefer to take task 3 in an oral test if theywere given a choice. The situation with regard to task 1(picture prompt) is not quite so clear. Although it wasthe second preference of students, and considered to beenjoyable, it was viewed as not being a valid test of thespeaking ability of more able students, and causingconsiderable anxiety to all students. Task 2, on theother hand, was the least preferred of the three tasks,and was considered not to be enjoyable although it wasviewed as a valid test of oral abilities by studentsgenerally.
Task preference does seem to be inversely related totask difficulty, but there would appear to be littleobvious connection between other factors at work.However, the two exceptions to the general picturepresented above, namely the variability in results fromlower ability students in seeing task 1 as a valid testand registering high anxiety but enjoyment while doingtask 2, may indicate that although lower ability studentsgenerally enjoy oral tasks irrespective of difficulty andanxiety, they prefer tasks which they perceive as beingeasier.
264
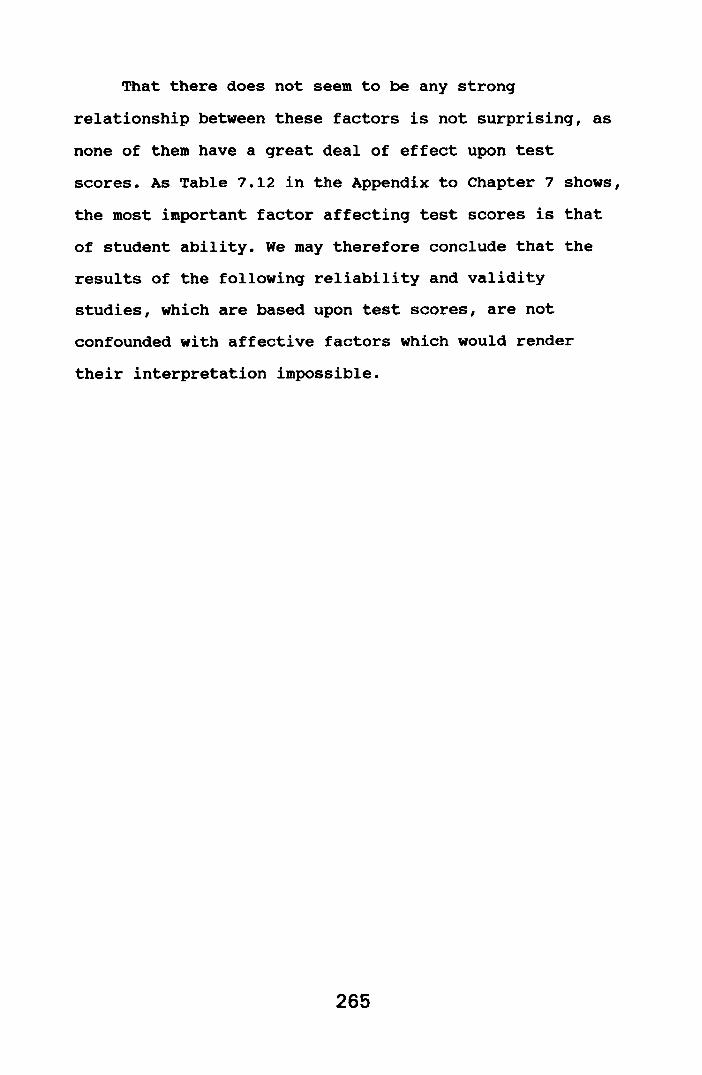
That there does not seem to be any strongrelationship between these factors is not surprising, asnone of them have a great deal of effect upon testscores. As Table 7.12 in the Appendix to Chapter 7 shows,the most important factor affecting test scores is thatof student ability. We may therefore conclude that theresults of the following reliability and validitystudies, which are based upon test scores, are notconfounded with affective factors which would rendertheir interpretation impossible.
265

Chapter Eight
Reliabilitysection 1: Introduction
In this chapter the issue of the reliability of theAccuracy scale, the Fluency scale and the ELTS globalrating scale will be addressed. To establish thereliability of the two rating scales developed in thisstudy is particularly important, for unless scores can beseen to be reliable the investigation of validity becomesimpossible. That is, if the amount of error varianceassociated with a rating scale is high the researchercannot have confidence that the rating scale is measuringanything, and so it makes little sense to question thenature of what is being investigated. In a reliabilitystudy it is therefore important to estimate and accountfor any variance which is not relevant to the ability ofthe students in the scores awarded on the rating scale.
The reliability of the testing process developed wasanalyzed using three separate methods. Firstly, a G-studywas carried out following the methods outlined in Bolus,Hinofotis and Bailey (1981), Cronbach (1984: 161 - 163),Crocker and Algina (1986: 157 - 185), Feldt and Brennan(1989: 128 - 136) and Bachman (1990: 187 - 197).Secondly, traditional inter- and intra- rater reliabilitywas estimated using correlations. Thirdly, a RaschPartial Credit model was used to investigate variationsin rater behaviour and rater severity.
The data were provided by five raters who rated all
266

47 students on the three tasks on three rating scales.The five raters were all trained teachers of English as aForeign Language working in Cyprus during the academicyear 1991 - 1992 (first degree and RSA Diploma in theteaching of English as a Foreign Language), and wereselected for this study on the basis of their interest inoral testing. Each of the raters is referred to by anumber from 1 to 5 in what follows as their anonymity waspromised. Raters 3, 4 and 5 were trained, practisingIELTS examiners, whilst raters 1 and 2 had no previousexperience of oral testing.
The raters received no training in the use of therating scales at all. Each rater was provided with a copyof each rating scale, a marksheet on which to recordratings, and an information leaflet (one single sheet ofA4 paper) on which they were asked to "study the ratingscales before using them" and which stated that theyshould rate each stUdent taking each task simultaneouslyon all three rating scales from one viewing. Given thelength of the video tapes it was not considered feasibleto ask volunteer raters to spend more than 40 hours onthe task of rating. Finally, the information leafletasked the raters to keep notes on the tasks, the ratingscales, and any stUdents with whom they encounteredproblems in the rating process.
The video tapes were given to the raters at thebeginning of August 1991 and returned by mid-September1991. All the raters were allowed to complete the rating
267

task in their own homes during this six week period.
section 2: Generalizability studyThe advantage of conducting a G-study to assess
reliability is that it is capable of taking into accountfacets of the testing situation and the extent to whichthese may affect the scores which students are awarded.In this study Fluency, Accuracy and ELTS global ratingsof ability were treated as conditions, whilst rater andtask were treated as nested facets, the former consistingof five individuals and the latter consisting of threetasks. Variance components can be assigned to each ofthese facets and conditions, and reliability of thetesting process calculated as the extent to which resultscould be generalized beyond the instances of eachspecific facet under which the scores were obtained. Inorder to obtain these variance components ANOVA is used.As the test method facets are specified in the ANOVA, itis the error or residual component which is interpretedas person variance and hence reliable variance. Theassumption being made is that no facets other than thosespecified in the ANOVA affect test scores, which isjustified to the extent that affective factors do notappear to confound results, as demonstrated in Chapter 7.
This design generates three ANOVA tables, one foreach of Fluency, Accuracy and ELTS global ratings. Eachof these was followed by a post-hoc test of the effect ofspecific components of facets where unreliability was
268

detected.
FluencyTable 8.1 in the Appendix to Chapter 8 indicates
that the rater is the largest source of unreliability inthe assessment of fluency, but this variation is notlarge enough to reduce the inter-rater generalizabilitycoefficient to unacceptable levels. There is alsosignificant influence from task, but as a percentage oftotal variation within the assessment of fluency this isalso fairly small. However, these differences wereconsidered to be large enough to warrant furtherinvestigation.
A post-hoc test was carried out on the raters andthe tasks in order to ascertain the precise cause of theunreliability. In each case it was hypothesized thatthere was no significant difference between theindividual variances assigned to raters and tasks.
Table 8.2 in the Appendix to Chapter 8 presents thepost-hoc analysis of difference between raters, and apattern of rater agreement emerges from the data whichmay be summarised as in Figure 8.1, where a "+" indicatesno significant disagreement and a ,,-"indicatessignificant disagreement.
The greatest source of unreliability when assessingfluency is seen to be rater 3, whose rating patterns areanalyzed more carefully later. Rater 5 also differssignificantly from other raters.
269
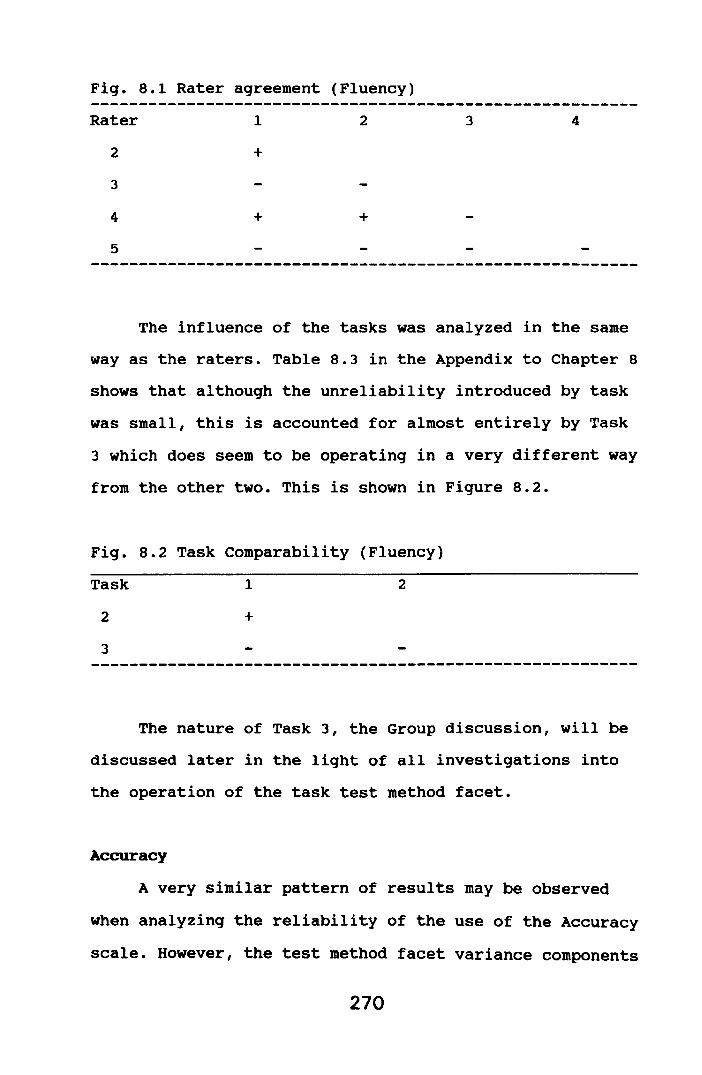
Fig. 8.1 Rater agreement (Fluency)Rater 1 2 3 4
2 +3
4 + +
5
The influence of the tasks was analyzed in the sameway as the raters. Table 8.3 in the Appendix to Chapter 8shows that although the unreliability introduced by taskwas small, this is accounted for almost entirely by Task3 which does seem to be operating in a very different wayfrom the other two. This is shown in Figure 8.2.
Fig. 8.2 Task Comparability (Fluency)Task 1 2
2 +
3
The nature of Task 3, the Group discussion, will bediscussed later in the light of all investigations intothe operation of the task test method facet.
AccuracyA very similar pattern of results may be observed
when analyzing the reliability of the use of the Accuracyscale. However, the test method facet variance components
270

shown in Table 8.4 in the Appendix to Chapter 8 areslightly higher than in the analysis of the Fluencyscale, and the reliability coefficients thus reduced.
The post-hoc analysis in Table 8.5 in the Appendixto Chapter 8 shows a data pattern which is almostidentical to that produced from the analysis of theFluency scale. This indicates that there is a largedegree of consistency in the extent to which ratersconverge or diverge in rating patterns across scales.This is not an argument for inter-rater reliability, butfor intra-rater consistency which, given that theanalysis is across scales, may indicate a degree ofcross-contamination in the rating process. Rater 3remains the largest source of unreliability in theassessment of accuracy, as can be seen from Figure 8.3.
The pattern observed in the analysis of the Fluencyscale is also repeated for variation between tasks, withTask 3 showing that it operates somewhat differently fromthe other two, as shown in Table 8.6 in the Appendix toChapter 8 and Figure 8.4.
Fig. 8.3. Rater agreement (Accuracy)Rater 1 2 3 42 +3
4 + +
5 +---------------------------------------------------------
271

Fig. 8.4. Task comparability (Accuracy)Task 1 2
2 +
3
ELTS Global Assess.antTable 8.7 in the Appendix to Chapter 8 shows that
the inter-rater coefficient is higher for globalassessment than for the other scales, but when the post-hoc tests were carried out the amount of unreliablevariation between raters was no better than in the use ofthe other two scales. However, the pattern of convergenceand divergence between raters is greatly changed, as canbe seen in Table 8.8 in the Appendix to Chapter 8 andFigure 8.5.
Fig. 8.5. Rater agreement (ELTS Global Assessment)---------------------------------------------------------Rater 1 2 3 4
2 +
3 +4
5 +---------------------------------------------------------This particular pattern is all the more puzzling
because of the loss of agreement between raters four andfive. Three of the raters used in this study are trainedand experienced ELTS examiners: raters 3, 4 and 5. Rater
272

3 now shows no significant difference with rater 2, whois not a trained ELTS examiner, whilst raters 4 and 5 nowappear to rate in significantly different ways.
The post-hoc tests in this case have shown that theglobal inter-rater generalizability coefficient is notsufficiently powerful to be quoted alone as a reliabilitycoefficient, for it may mask a large amount ofvariability which still exists. This variability may befurther analyzed through Rasch techniques.
Analysis of tasks as a significant test method facetrevealed precisely the same pattern as previouslyobserved with both the Fluency and Accuracy scale, asevidenced by Table 8.9 in the Appendix to Chapter 8 andFigure 8.6.
Fig. 8.6. variation between tasks (ELTS GlobalAssessment)Task 1 22 +
3
Section 3: Correlational analysisDespite problems with the traditional use of
correlations as reliability coefficients (Krzanowski andWoods, 1984) they are reported here as they confirm theobservations from the G-study. Information which is notprovided by correlation coefficients (means and standarddeviations) is taken into account elsewhere.
273

3.1 Reliability coefficients on scalesFirstly, descriptive statistics and correlation
coefficients were produced on each scale, ignoring thesignificant task effect discovered in the G-study (scoreson each scale were averaged across tasks). A differentmatrix taking into account task differences is analyzedin section 3.2.
FluencyThe correlations presented in Tables 8.11 and 8.12
in the Appendix to Chapter 8 show a reasonable amount ofagreement among the raters, which the G-study has showndoes not represent a complete picture. The correlationsranging from .69 to .71 for rater 3 are not infrequentlytaken to represent a reasonable degree of inter-raterreliability, but this hides the greater leniency of thisrater as shown in Table 8.10 in the Appendix to Chapter8, and the apparent lack of ability to discriminatebetween higher and lower ability students.
The average correlation coefficient for all ratersis .83. To obtain a reliability coefficient this figurewas corrected for the number of raters using theSpearman-Brown Prophecy Formula (Henning 1987: 82 - 83),where the Fisher Z transformation is used to convert thethe Pearson Product Moment correlation to an intervalscale, which can then be averaged and transferred backinto a correlation coefficient, and the result put intothe reliability formula:
274

nrA,Brtt = -------------1 + (n-1)rA,B
where rtt = inter-rater reliability, n = the number ofraters, and rA,B = the average correlation coefficient.The resulting reliability coefficient is .96. Thisdemonstrates that the concern shown in the oral testingliterature for using more than a single rater (page 44)is justified, although reporting only reliabilitycoefficients based on correlations corrected for thenumber of raters is clearly unjustified, as they hideeven further differences among raters. However, thesecorrected correlations are presented here as confirmationby more traditional methods of the high reliabilitycoefficients achieved in the G-study using five raters.This helps to remove any hesitation in using pooledscores in the investigation of the validity of the ratingscales in Chapter 9.
Accuracy
Tables 8.13 to 8.15 in the Appendix to Chapter 8present the same information for the use of the Accuracyscale. Rater 3 stands out as being more lenient and lessdiscriminating than all other raters, and there appearsto be less agreement in the rating of Accuracy thanFluency. The average correlation coefficient for allraters is .79, but when this is corrected for the numberof raters rtt = .95.
275

ELTS Global Assess.entThe analysis of the ELTS scale as shown in Tables
8.16 to 8.18 in the Appendix to Chapter 8 reveals a loweraverage correlation of .76, rtt = .94. This indicatesthat the amount of variation isolated in the G-study (seepages 268 - 273) requires further analysis using moresensitive tools.
3.2 Reliability coefficients on scales across tasksAs the G-study discovered a task effect, it was
decided to look at the correlation coefficients betweenraters by task. This will throw light on the nature ofthe task effect itself. The Pearson Product Momentcorrelations for Fluency on Tasks 1, 2 and 3 are inTables 8.19, 8.20 and 8.21 respectively. For Accuracy theresults are in Tables 8.22, 8.23 and 8.24, and for ELTSGlobal ratings in Tables 8.25, 8.26 and 8.27 respectivelyfor Tasks 1, 2 and 3. All these tables are contained inthe Appendix to Chapter 8.
For the Fluency scale, the mean correlation for Task1 was .70, for Task 2 a lower .58 and for Task 3 .72.Corrected for the number of raters these figures providereliability coefficients of .92, .87 and .93respectively. If this pattern were to be repeated for allscales, given that from the G-study Task 3 caused thetask effect which was isolated to be a source ofunreliability, it may be necessary to reassess theprecise nature of task 3 and the effect which it has on
276
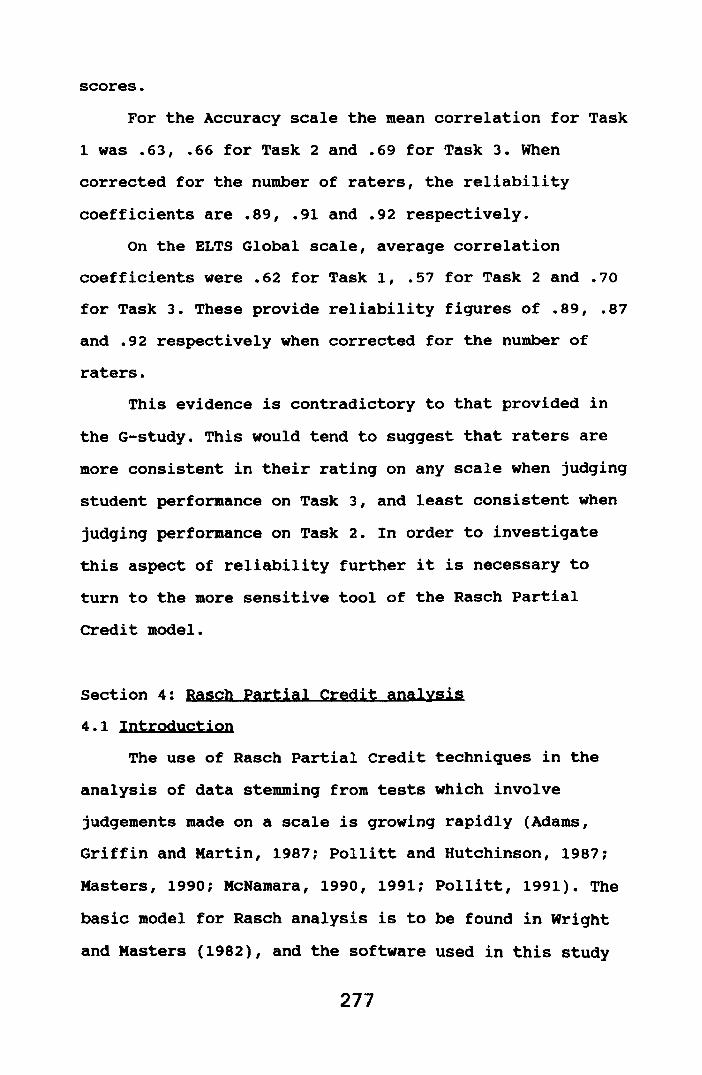
scores.For the Accuracy scale the mean correlation for Task
1 was .63, .66 for Task 2 and .69 for Task 3. Whencorrected for the number of raters, the reliabilitycoefficients are .89, .91 and .92 respectively.
On the ELTS Global scale, average correlationcoefficients were .62 for Task 1, .57 for Task 2 and .70for Task 3. These provide reliability figures of .89, .87and .92 respectively when corrected for the number ofraters.
This evidence is contradictory to that provided inthe G-study. This would tend to suggest that raters aremore consistent in their rating on any scale when judgingstudent performance on Task 3, and least consistent whenjudging performance on Task 2. In order to investigatethis aspect of reliability further it is necessary toturn to the more sensitive tool of the Rasch PartialCredit model.
section 4: Rasch Partial Credit analysis4.1 Introduction
The use of Rasch Partial Credit techniques in theanalysis of data stemming from tests which involvejudgements made on a scale is growing rapidly (Adams,Griffin and Martin, 1987: Pollitt and Hutchinson, 1987:Masters, 1990: McNamara, 1990, 1991; Pollitt, 1991). Thebasic model for Rasch analysis is to be found in Wrightand Masters (1982), and the software used in this study
277

is by Linacre (1991), and the multi-faceted model isdescribed in Linacre and Wright (1990).
Rasch techniques allow much more detailed analysisof data from rating scales, making it possible to askquestions concerning individual raters (for example, theprecise nature of the assessments of Rater 3 whom we havealready noted to be unreliable), individual candidates(if we should feel that they have been unfairly graded),and individual scales or tasks to investigate whether ornot the band thresholds are consistent or variable acrossfacets of the measurement situation.
4.2 Rating scales and rater biasIt should be noted that Rasch techniques do not use
extreme scores on any scale in the calculation ofmeasurement properties of a scale, and as such the orderof harshness/leniency of some judges may be slightlydifferent from those in traditional descriptivestatistics. In this data, there are no changes at all.Tables 8.28, 8.29 and 8.30 in the Appendix to Chapter 8are extended versions of Tables 8.10, 8.13 and 8.16including Rasch estimates of judge severity. The lowerthe logit value the more lenient the rater and,conversely, the higher the logit value the harsher therater.
It must be stressed that these descriptivestatistics do not take into account the significant taskvariable, but it can still be seen that rater 3 is
278

undoubtedly the most lenient in the use of all ratingscales. The pattern of severity in the use of the scalesis wholly consistent, except for the use of the ELTSglobal scale, where the severity order of the judgeschanges markedly. This can be seen in Figure 8.1 (whereFl = Fluency, Ac = accuracy and El = the ELTS globalscale).
Fig. 8.1 Rank order of judge severity on all ratingscales------~--------------------------------------------------Rater 1 Rater 2 Rater 3 Rater 4 Rater 5
Logit Logit Logit Logit Logit---------------------------------------------------------Fl. 2 1 5 3 4Ac. 1 2 5 3 4El. 3 4 5 1 2---------------------------------------------------------
Before looking at specific reliability problems, theexpected scores of any student on any given scale can bemapped. At present this is without reference to anyspecific rater or any specific task. That is, we arelooking at the probability of achieving a given score oneach rating scale irrespective of any problems withreliability. The range of potential scores are presentedin Figure 8.8 on the following page. The first and lastline are the ability levels in logits, and the scoresexpected on the scales at any ability level are presentedin the order: Fluency, Accuracy and ELTS globalassessment.
279

Fig. 8.8 Rating scale structure-5 -4 -3 -2 -1 o 1 2 3 4 5
111111122222222222333333333344444445555555555555666666666111111111222222222222223333333334444444444444445555555555333334444444444555555556666666666677777777788888888888888----------------------------------------------------------5 -4 -3 -2 -1 o 1 2 3 4 5---------------------------------------------------------Estimates of reliability of person separation:Fluency: .96 Accuracy: .98 ELTS: .94---------------------------------------------------------
It is now possible to look in greater detail atspecific aspects of unreliability in terms of the extentto which individual raters significantly deviated fromexpected scores in specific cases. Misfitting ratings arepresented in Table 8.31 in the Appendix to Chapter 8,where the category is the actual band score which therater awarded the student, whose number is listed in thelast column of the table. The column headed "step" is thepoint at which a student of a given ability moves frombeing in one category to another; for example, onFluency, step 4 is the point at which a student wouldmove from receiving a band 4 to a band 5. The columnheaded "Exp." is the expected score in terms of thesteps, and "Resid." the difference between the expectedposition of the student on the steps and the actualposition on the steps.
It is immediately obvious that all misfittingratings come from rater 3. These misfitting ratings(after leniency is taken into account), with theexception of person 32 on the ELTS scale, represent cases
280
where the student was of higher expected ability, andrater 3 awarded a lower band. Hence, all figures in theResidual column are negative. Only in the case of person32 on the ELTS scale did rater 3 give a much higher bandthan would have been expected. It will be recalled thatthe standard deviation of the bands awarded by rater 3was small, and so it is to be expected that thisparticular rater is unprepared to use the full width ofthe band scales, and as a direct result more ablestudents have to perform much better to be awarded ahigher band than they would have to be with other raters.
When questioned about this feature of the ratinqprocess, rater 3 did demonstrate an overt awareness ofthe leniency involved in awarding bands, in that studentsof lower ability could achieve higher bands fairlyquickly, while the use of only the middle range of arating scale resulted in compression of scores and adegree of failure to discriminate (see pages 496 - 498).
However, referring to Tables 8.28, 8.29 and 8.30 inthe Appendix to Chapter 8 once more, we may observe thatthe Mean Square (Mnsq) Outfit statistic for each rater isnot above 2 or below - 2. Scores of above 2 areconsidered to be misfittinq across the whole data, whilescores of less than - 2 do not contribute uniqueinformation • This commonly used Rasch fit statistic is atest of the unidimensionality of the data, in this caserater behaviour without a task variable. ThUS, althoughwe have noted inconsistencies in rater behaviour, these
281

are not serious enough to suggest that the raters are nottreating each scale as a unidimensional construct.
4.3 A Partial Credit Model to analyze rating patternsIn this analysis a Partial Credit Model was used,
but the task variable was still not introduced. Thisallows the investigation of the way in which eachindividual rater interpreted the rating scale thresholdsof each individual scale (McNamara and Adams, 1991, 12).
The Item Characteristic Curves for each rater oneach scale are reproduced in Figures 8.9, 8.10 and 8.11on pages 283 - 285. Each curve represents the probabilityof a student at any given ability level achieving a givenband.
In these figures, we can begin to see the variationbetween raters even given relatively high reliabilitycoefficients. In Figure 8.9 (Fluency) we can see thatrater 2 (the most severe) uses bands 2, 3 and 5 to coverthe entire ability range. Band 6 is very difficult toachieve, and band 4 cannot be distinguished from band 5.Rater 1 (the second most severe) interpreted band 6 in asimilar way, with band 5 being used for most of the moreable students. However, this rater was able todistinguish band 4 from other bands. Raters 4 and 5 gavemore able students band 6, but at the lower abilitylevels it was harder for students to gain a band 3. Rater3 differs from all others in being very lenient with less
282

Fig. 8.9. Item Characteristic Curves for five raters onthe Fluency rating scale
Rater 1
Rater 3
Rater 5
Rater 2
Rater 4I .
.~-i'.:';-1! '. i..i,",....~.I..
:.j
,, ...:
··l;·I:/.',
.; ~:r:f~~;'t
283

Fig. 8.10. Item Characteristic Curves for five raters onthe Accuracy rating scale
Rater 1
Rater 3
Rater 5
Rater 2
Rater 4
284

Fig. 8.11. Itemthe ELTS global
Characteristicrating scale
Rater 1
Rater 3
Rater 5
Curves for five onraters
Rater 2
Rater 4
285

able students, but also being unwilling to use band 6 forthe very able. Band 4 is used for students once theyreach an ability of - 1.74 10gits.
The picture with regard to the measurement ofaccuracy in Figure 8.10 is somewhat different. However,it is once again the case that rater 3 awards higherbands to students of lower ability levels with only bands3 and 4 being used to discriminatebetween less and more able students. Other ratersinterpret the scale in a very similar way, although forrater 4 the bands are narrower than for the other raters:it is harder to achieve a band 3 but much easier toachieve a band 5 than with other raters.
Figure 8.11 demonstrates that there is considerablevariability in the interpretation of the ELTS globalscale. Rater 3 is again more lenient with students oflower ability, but it is harder to achieve higher bands:with rater 2 it is possible to achieve higher bands atlower ability levels, and band 8 is also available at2.48 10gits and band 9 at 4.94 10gits.
In the case of each scale, however, there is onlylikely to be a difference of one band between raters atany ability level (one exception being for studentsplaced at approximately 3 10gits on the ELTS scale). Thisis demonstrated in Tables 8.32, 8.33 and 8.34 in theAppendix to Chapter 8 which present the band which astudent could expect to be awarded at a given abilitylevel by rater. For example, in Table 8.32 a student at
286

around 1 logit would be more likely to be awarded a scoreof 4 by raters I, 3, 4 and 5, but a 3 by rater 2. Minorfluctuations such as this when using untrained ratersappears to be a strong indication of the reliability ofthe rating process.
4.4 The effect of task on rating patternsOnce the task is included in the analysis as a test
method facet more variability is introduced to the wholepicture of reliable oral assessment. The ICCs for eachrater on each task (15 diagrams for each scale) areproduced in Figures 8.12, 8.13 and 8.14 on pages 288 -290. By looking down a column one may compare howdifferent raters interpret the rating scale on the sametask, whereas by looking at the rows it is possible tosee how each individual rater interprets the rating scaleon different tasks.
When using the Fluency scale rater 3 is considerablymore lenient in the rating of poorer candidates on alltasks, whereas rater 4 is considerably more severe onless able students on Task 3 (Group discussion) only.Task 2 is the hardest on which to score highly, while itwas generally easier to score more highly on Task 3.
In the use of the Accuracy scale rater 3 was onlyparticularly lenient to poorer students on Task 2, whilerater 4 was only harsh to students of around 0 loqitability on Task 3. Task 2 was again the most difficult onwhich to gain higher band scores and easiest on Task 3.
287

Fig. 8.12. Item Characteristic Curves for five raters onthe Fluency rating scale taking task variability intoaccount
Task 1 Task 2
288
Task 3

Fig. 8.13. Item Characteristic Curves for five ratersthe Accuracy rating scale taking task variabilityaccount
Task 1 Task 2
oninto
Task 3
N
I-jal..,to~
-:;;~ j
M
I-jal..,to~
289

Fig 8.14. Item Characteristic Curves for five raters onthe ELTS global rating scale taking task variability intoaccount
Task 1 Task 2 Task 3
290

When using the ELTS band scale there was somevariability between raters and considerable variabilitybetween tasks. Rater 1 was considerably more severe onpoorer students on Task 2 than on other tasks, whilerater 3 was lenient with poorer students only on Task 3.Rater 4 was somewhat more severe on students of anability of around - 2 logits only on Task 3. Rater 2 wasparticularly lenient with better students on Task 3,while rater 5 was particularly severe with more ablestudents on Task 2.
Across raters and tasks the variability which existsis mainly with less able students, who could receive aband of anything between 3 and 6. Rater 1 shows morevariability than other raters. This mainly occurs withstudents with an ability of around - 1 logits, who wouldhave been most likely to receive a band 4 on Task 1, aband 5 on Task 2 and a band 6 on Task 3, and studentswith an ability of around + 5 logits, who would have beenmost likely to receive a band 7 on Tasks 1 and 3 and aband 9 on Task 2.
Tables 8.35, 8.36 and 8.37 in the Appendix toChapter 8 show estimates of judge severity on theFluency, Accuracy and ELTS rating scales respectively,taking the task variable into account. It can once againbe seen that, despite the variability already discussed,no outfit statistics are less than - 2, although we notethat in Table 8.35 the outfit statistic for rater 3 is arather high 2.4 and that in Table 8.37 the outfit
291

statistic for rater 3 is exactly 2, indicating that oncetask effect is taken into account the ratings of rater 3do begin to become much more unreliable.
4.5 Task difficultyIt was hardest to score highly on Task 2, but there
was no essential difference between the difficulty levelsof the other two tasks.
At this point we may note that task difficulty doesappear to be relatively stable. In the difficulty tables(Tables 8.38 - 8.40 in the Appendix to Chapter 8) thehigher the logit the more difficult the task, and thelower the logit the easier the task. This information ispresented by rating scale. The outfit statistics showthat each task was operating unidimensionally, implyingthat no single task was significantly influencing scoreson any of the scales when raters are held constant.
4.6 Partial Credit reliability estimatesFinally, we may turn to Rasch reliability
coefficients for the Rasch estimates discussed above. Thesoftware used in this analysis provides a reliabilitystatistic for each of the rating scales once the task andrater variables are taken into account. It is the "Raschequivalent to the KR-20 or Cronbach Alpha" (Linacre andWright, 1990: 25) and is calculated as true variationdivided by observed variation. In other words, it amountsto a test of reliability in terms of unidimensional
292

structure across the facets isolated (McNamara, 1991),and these results are presented in Figure 8.15.
Fig. 8.15 Reliability statistics for each rating scale byraters and tasks
Fluency Accuracy ELTS global scale-----------------------------------~---------------------RatersTasks
.94
.91.65.83
.91
.59
The Accuracy rating scale is most susceptible tounreliable variation between raters, whilst the ELTSrating scale is most susceptible to unreliable variationbetween tasks, and it must be accepted that the ELTSrating scale was not designed to be task independent. TheFluency scale, however, seems to be used with an adequatedegree of reliability across raters and tasks. That is,the Fluency scale is not sensitive to task variabilitywhereas the ELTS scale is. It is argued here that this isa great strength of the Fluency scale, as reliable datacollection in testing implies that similar results beobtained irrespective of the method of collection, thatis, the task used. Undue sensitivity to task is theinterference of a test method facet which reduces theamount of true variance as a proportion of observedvariance, thus reducing reliability.
section 5: Intra-rater reliabilityAn intra-rater reliability study was conducted
293

exactly three months after the original rating of allstudents on all tasks was completed. In this study, allfive raters were required to rate 8 of the 47 studentsfor a second time on all scales. In Table 8.41 PearsonProduct Moment correlations are reported for all ratersacross the two separate ratings in the use of each scale,and Table 8.42 reports the Spearman Rank Ordercorrelations. Both tables are contained in the Appendixto Chapter 8.
Finally, Table 8.43 in the Appendix to Chapter 8presents descriptive statistics for the intra-raterstudy. In the table, the mean, standard deviation andrange are reported for each of the eight students on thefirst and second rating for comparison.
with the one exception of rater 3, all intra-raterreliability coefficients were satisfactory on the use ofall scales. variations in means and standard deviationsare not large enough to cause concern either, except inthe case of rater 3. The results indicate that four ofthe five raters are capable of being reasonablyinternally consistent, the most important aspect ofreliability for Alderson (1991b: 64). The problem ofrater 3 will be raised again later.
Section 6: Discussion6.1 Task 3
Upshur (1971: 47), Van Weeren (1981: 57), Shohamy(1983b, 1988; 1990) and Shohamy, Reves and Bejarano
294

(1986) argue strongly that in any oral testing situationit is essential to use a range of tasks, as no singletask is capable of eliciting a range of assessablelanguage which would allow the test developer to claimthat the procedure was valid. Pollitt and Hutchinson(1987) have also shown the variation which can resultfrom the use of various task types.
With specific regard to the Group Discussion (Task3) the earliest statement in its favour as opposed toother task types was made by Folland and Robertson(1976). There have been reports of the task type beingused successfully in Israel (Reves, 1980; Reves, 1991;Shohamy, 1986) and in Zambia (Hilsdon, 1991) with schoolaged students, and in Italy with university students(Lombardo, 1984). Berkoff (1985: 95) argues that thistask type overcomes the problems of "artificialconversation" between a "distant examiner" and a "nervousexaminee". Morrison and Lee (1985) also report successfuluses of the Group Discussion with university students inHong Kong in order to simulate academic tutorials. Onestudy, however, concluded that students could not befairly assessed in Group discussion tasks, but agreedwith other researchers that they require different skillsfrom those needed in oral interviews (Pollitt andHutchinson, 1987).
If, as is claimed in the literature, the GroupDiscussion task is so different from other interview tasktypes, the results of this reliability study may not be
295

surprising. From the G-study it appears that the GroupDiscussion is significantly different from other tasks.It is important to ask whether this difference is asource of unreliability, or merely reflects the need toinclude a variety of task types within any oral test asthe language elicited and examiners' responses to thelanguage are different.
We may note that inter-rater correlationcoefficients were higher for all scores awarded on thistask, irrespective of the rating scale being used (pages276 - 277). Secondly, the task was consistently theeasiest on which to gain higher scores. Thirdly, whenraters were interviewed regarding task 3, all but oneclaimed that in their opinion it provided more assessablelanguage and allowed the students to demonstrate withmore ease and freedom what they were actually capable of(see page 346). The one rater who did not share thisopinion was rater 3. Fourthly, when looking at studentquestionnaire responses to the various tasks, the GroupDiscussion was preferred by more students than the othertasks.
It would appear that a variety of tasks are requiredin any oral test, as the Group Discussion task not onlyoperates in a different way from the other two tasks, itis also perceived in a different way by both raters andstudents. As it is important that the widest possiblesample of assessable language is taken in an oral test,it would seem essential that tasks of this nature are
296

included.
6.2 Inter- and intra-rater reliabilityMost unreliability was caused by rater 3, who was
consistently more lenient than other raters and failed todiscriminate between less and more able students. Only onTask 3 was this amount of unreliability reduced to someextent. It was discovered that a large degree ofagreement did exist across all raters, however, usuallywithin one band on any rating scale.
It was noted, however (page 277) that lower inter-rater correlations were discovered when raters were usingthe ELTS rating scale. This was more alarming as threetrained and experienced ELTS examiners in the studysignificantly differed in their use of the scale (pages272 - 273), and there was a larger amount of variabilityin the use of the scale across tasks (page 293) than inthe use of the other scales. It was argued (see pages 86- 87) that sensitivity to task is not appropriate for arating scale which is designed to measure underlyingability (communicative or linguistic) which is not taskdependent. Task sensitivity to the degree found in theoperation of the ELTS scale would only be acceptable in ascale designed to describe performance on a specific typeof task, where the criteria for rating would not be
sampled in different task types.It would appear from these results that rater
training for ELTS examiners has had little effect upon
297

rating patterns. This raises the whole issue of examinertraining for the oral component of language examinations,dealt with below.
6.3 Implications for rater trainingIt has become axiomatic in the literature on oral
testing that rater training is essential (Wilds, 1975:34). with some examinations such as the ILR,recertification of examiners is essential every few years(Lowe, 1987) in order to try to ensure that they aremarking in line with wider standards. Training andcertification is usually achieved through the marking ofa sample set of interviews either on video or on audiotape, and a significant degree of agreement betweenexaminers is expected. Adams (1980: 5) makes explicit whymost writers on testing are opposed to using untrainedraters: naive raters are incapable of seeing orunderstanding the factors which are important at eachlevel in the scale, and are therefore going to beunreliable in how they interpret the scale thresholds.This approach, however, begs the question of the validityof the scale's representativeness of an underlyingability continuum. That is, by training raters to matchexamples of performance to numbers (whether they areprovided with descriptors or not) one does not knowanything about the validity of the scale being used, onlysomething about how reliable the process of matchingperformance to number can be achieved.
298

Ingram (1985b: 252) stresses that training isessential, as "The interviewer would seem to be a pivotaround which direct testing would ride or fall."variation in scale interpretation could, according toIngram, mean that oral assessment would becomeimpossible. Barnwell (1989) demonstrated that 14untrained raters marking four audio cassettes of learnersof Spanish "differed substantially as to how to translatetheir perceptions into points on the ACTFL scale" (ibid.,158). He concludes that without training low inter-raterreliability is only to be expected. In this particularstudy it is important to note that Barnwell lays theblame for not achieving inter-rater reliability on theACTFL scale itself, as the band descriptors are not inthemselves self-sufficient or explanatory.
This is an important point. The type of examinertraining which is described in Liskin - Gasparro (1984a:481 - 482) and Duncan (1987), and which is practised bymost examination boards, is what Alderson (1991b: 64)refers to as "cloning", as discussed on pages 13, 49 -50. If untrained raters tend to agree in theirinterpretation of scale thresholds then it would seemlikely that the scale cannot only be used reliably, butthat it contains "psychological" validity.
We will return to this in the discussion ofvalidity. However, from the evidence presented here, itwould seem more appropriate to develop rater trainingwhich is specific to individuals and to tasks (or which
299

is at least non-directive, as in Knight, 1992).Nevertheless, raters used in this study, with theexception of rater 3, are internally consistent withinacceptable and reasonable limits. It would seem to bemore appropriate that after rating a number of sampleoral tests, Rasch techniques could be used to isolate anindividual's rating pattern across a variety of tasks.Having done this, it may be appropriate to encourage anindividual rater to change his or her rating pattern incertain ways which might increase inter-raterreliability. Developments or changes in rating styles orpatterns could be monitored through periodic re-rating ofa small number of tests and further training provided asand when necessary.
This approach to rater training would allowvariation in rating patterns to be taken into account,whilst the use of untrained raters would allow thefurther investigation of test validity as describedabove. Further, any rating scale used for any specifictask would have to demonstrate that it was robust in usefor the developer to claim reliability. This would implythat the rating scale be either (i) specific to a taskand used reliably by raters or, (ii) if general (that is,intending to measure trait rather than describeperformance) it should be seen to be reliable acrosstasks and raters. This amounts to nothing more thansaying that in the first instance the test method facetis made part of test, and any variance caused by this
300

method facet is treated as true rather than errorvariance, whereas in the second instance the test methodfacet of task is considered to represent error variance.
In this study the Fluency rating scale meets thesecond of these two criteria. The Accuracy scale is notused reliably in that raters tend to differ in its use toa greater extent than the other scales, while the ELTSscale is not used reliably in that it is susceptible toinfluence from the test method facet of task. However,bands awarded from the Fluency and Accuracy rating scaleshave been shown in the G-study to co-vary to a greaterdegree than those from the ELTS scale. This couldtentatively be claimed to be related to the greaterdegree of detail in the band descriptors and a largerdegree of validity which could be attributed to thedevelopment process used.
The unreliability associated with the intra- andinter-rater statistics for rater 3 lead to the exclusionof this rater from the validity studies reported inChapter 9.
301

Chapter Nine
Validitysection 1: Introduction
It is accepted that the concept of validity isunitary (Messick, 1989a), even to the extent as suggestedin Chapter 8 that reliability studies often impact uponvalidity. However, for the practical purposes of researchit is appropriate to retain the traditional terminologywhich distinguishes between different types of validity(Messick, 1989b). Terminology such as "concurrent" or"content" validity are taken to be aspects of thesuperordinate "construct" validity, to which all evidencecontributes.
Section 2: Two Concurrent Studies2.1 Introduction to study one
Of the 47 students who took all three of the tasksdeveloped and were rated on the three scales used in thestudy, 45 also took the University of cambridge LocalExaminations Syndicate's First certificate in English(FCE) Examination within one month of the completion ofthe study. This provides separate assessments of thestudents in question in the areas of reading, writing,grammar, listening and speaking. Secondly, the FCEratings provide separate assessments in the six areas offluency, accuracy, pronunciation of individual sounds,pronunciation of sentences, interactive communication,and vocabulary (Hamp-Lyons, 1987).
302
The data collected therefore allow examination ofthe relationship of speaking measures to those in otherskill areas, and the relationship between each of thespeaking measures.
2.2 study One; FCE - peyelQpmental tests concurrent study2.2.1 The five FCE papers. Fluency. Accuracy and ELTS
In this study it was decided to use the Raschestimates of student ability on the Fluency, Accuracy andELTS scales rather than raw scores, as these estimatestake into account variation in the test method facets oftask and rater as outlined in the reliability study (seepage 278). As such, they represent the most accurateestimate of oral proficiency derived from the study.Table 9.1 in the Appendix to Chapter 9 containscorrelations between the three rating scales and the fivepapers of the FCE examination.
Very similar correlations were discovered when thepooled and averaged raw scores were correlated with thefive papers in the FCE examination. In each case, thescores from the direct oral interview correlated mosthighly with the Use of English paper. This is a similarfinding to that of Ingram's between the ASLPR and CELT,and the findings of Hinofotis, Bailey and stern (1981),although in the latter case results are suspect becauseof the use of stepwise regression techniques. What isperhaps surprising about the correlation matrix is thelower correlation with the listening paper, which one may
303

have thought would have had a higher correlation withoral measures than reading or writing. It may also benoted that the degree of correlation between both theFluency and Accuracy scale and the components of the FCEexamination is almost identical. This could be an initialindication that the two rating scales developed in thisstudy were not being used independently of each other bythe raters.
The correlation matrix in Table 9.1 was factoredusing iterative Principal Axis Factor Analysis, theresults of which are presented in Table 9.2 in theAppendix to Chapter 9.
The results raise the question of whether or not weare faced with a large g-factor accounting for 73% ofvariance, which some measures tap with greater accuracythan others. However, great caution should be exercisedregarding such interpretations (Woods, 1983), as theresults of exploratory factor analytical studies of thisnature are extremely difficult to interpret. (In thiscase, the high communalities for the three rating scalesmay be a result of the fact that they are ratings of thesame performance.) In particular, 27% of variance is notaccounted for when only factors with an eigenvalue of 1or more are extracted. The temptation is then to extracttwo or more factors in order to increase the amount ofvariance accounted for. The researcher then falls intothe trap of fishing for a factor structure which isinterpretable in the light of original hypotheses
304

(McNemar, 1951). On the other hand, in cases such as thiswhere 27.33% of variance is unaccounted for it ispermissible to force the number of factors to beextracted. The problem is when to stop! Farhady (1983: 18- 19) for example, argues that:
"•••it makes sense to use a cutoff eigenvalueof less than unity because the communalities ofinterest •••are less than unity •••• When ajudgement must be made concerning a larger orsmaller number of initial factors, it seemsreasonable to start with the larger numberbecause it is better to examine all themeaningful factors at the start and theneliminate unnecessary ones rather than excludemeaningful factors from the beginning withoutcareful examination. Eliminating any factorwithout sufficient care may well result in lossof information and distortion of the finaloutcome."
In this analysis three factors were extracted.Initial eigenvalues were 5.914, 1.174 and 0.394respectively. The fourth factor had an initial eigenvalueof 0.09 and this was considered too small to justifyincluding a fourth factor. The three factors in thepresent study were submitted to varimax Rotation, theresults of which are presented in Table 9.3 in theAppendix to Chapter 9.
The listening test alone loads highly on factor 2,whilst all other loadings on factors 1 and 3 appear to betest specific. The FCE speaking test does load morehighly on factor 1 than other components of the FCE, andthis may be compared with the weaker evidence (an FCE
305

speaking loading of only .173) upon which Davidson andBachman (1990: 40) claimed to have isolated an oral traitwhen comparing the FCE with the SPEAK. Despite thisevidence it cannot be entirely discounted that, with theexception of listening, what we observe here isattributable to variance in test method facets ratherthan traits.
It would seem from using this traditional approachto concurrent validation that there is some externalevidence of divergent and convergent validity for thedevelopmental scales of Fluency and Accuracy, but thatthis evidence is too weak to make great claims.
2.2.2 FCE oral rating components. Fluency. Accuracy and~
A similar procedure was followed in assessing therelationship of the FCE components of the rating scale tothe Fluency, Accuracy and ELTS scales to that followed inassessing the relationship of the five FCE papers to therating scales. (Davidson and Bachman (1990) do notinvestigate the FCE component rating scales, comparingonly the global score to the components of the Speak). Inthe FCE oral test, examiners are asked to rate studentson the six components of Fluency, Grammatical Accuracy,Pronunciation of Sentences, Pronunciation of IndividualSounds, Communicative Interaction and Vocabulary. InTables 9.4 to 9.9 in the Appendix to Chapter 9 these havebeen shortened to Fluency, Accuracy, Prosent, Prosound,
306

Interact and Vocab respectively.Initially, all the measures were correlated on the
assumption that scores on the "Fluency" and "Accuracy"subscales in the two tests may be more highly correlatedwith each other than with the other subscales, and theresults are presented in Table 9.4. The correlationmatrix is almost impossible to interpret, but would tendto suggest that separate components of the superordinate"oral ability" were not being validly tapped. That is,effective measurement could be carried out on a globalrating scale rather than a componential scale, as thereis no evidence for either convergent or divergentvalidity. It is highly likely that the correlation matrixin Table 9.4 represents an excellent example ofcontamination across scales in a given administration(Alderson, 1991b). The factor analysis of the matrix inwhich factors with an eigenvalue of 1 or more areextracted (Table 9.5) bears this out. Once again, theevidence could lead us to the conclusion that a strong g-factor has been discovered.
When two factors were extracted it can be seen thatthe various scales are operating in significantlydifferent ways, perhaps indicating the influence of atask - or more likely an "examination" - effect. Initialeigenvalues for the two factors extracted were 6.91 and0.819 respectively. The third, at 0.07 was considered toosmall to include. The results of the two factor solutionare presented in Table 9.6 in the Appendix to Chapter 9.
307

This may be a sign that although the measurement ofa separate "oral trait" is valid, it is not valid, giventhe current state of knowledge about what constitutesthat oral trait, to break it down into component parts.However, it is unwise to draw such conclusions from aconcurrent study, and other methods of analysis must becalled upon to further investigate the nature of thecomponent scales.
2.2.3 DiscussionLimited evidence has been found to suggest that an
oral trait can be identified from the concurrent study,but no evidence to suggest that this oral trait can bebroken down into valid components. However, this is notto be considered surprising in a concurrent study.
Firstly, no data is available on the reliability ofthe FeE papers. Essentially, this study has had to assumethat reliability of the FeE is similar to that for eachof the scales with which they were correlated. If any ofthe criterion measures are unreliable this in itselfwould affect the results of the concurrent study. It isnoted that Davidson and Bachman (1990: 35) found thatreliability estimates for the FeE reading paper of .79and listening paper of .62 were "below normally acceptedtest development standards." Reliabilities were notavailable for writing or speaking, while the Use ofEnglish Paper had a reliability coefficient of .85. Ifthis were true of the FeE papers taken by the 45 students
308

used in this study, this in itself could account for thecorrelations in Table 9.1 in the Appendix to Chapter 9,and the apparent link between the three oral scales andthe Use of English paper.
Secondly, when considering the relationship betweenthe Fluency and Accuracy rating components of the FCEoral test with the developmental Fluency and Accuracyscales it has to be assumed that, for example, the FCEFluency scale and the developmental Fluency scale doactually tap the same trait. This refers to therequirement that the criterion or the predictor must be
construct valid in order to draw conclusions. Even acursory glance at the descriptors in the two scales (seepages 123 and 160 - 163) would tend to indicate that theconstruct of "Fluency" is interpreted in different ways.If this is the case, the finding that the two areunrelated is not terribly surprising.
Thirdly, it has been discovered that there is a taskvariable and a rater variable which affect scores and area significant source of test variance (pages 268 - 273).The tasks taken by the students in the FCE oral werevaried, and each student took only one task with onerater. This means that neither the task variable nor therater variable can be controlled for in the criterion.What this amounts to is that we know nothing of theeffects of test method facets in the criterion.
This raises once again the major problem inconducting criterion validation studies with oral tests:
309

selecting an appropriate criterion. It would seem thatthe only way to do this would be to develop a number offluency scales independently of each other but from thesame specification of the construct, in a similar way towhich item writers produce individual test items fromspecifications. The separate fluency scales could thenreasonably be analyzed to discover if they were "paralleloperationalizations" of the same construct. Thiscriticism applies not only to the study which has beencarried out here, but to all the research which hasrecently been conducted between OPIs and SOPIs.
It would therefore seem appropriate to conclude thatconcurrent studies to compare component rating scales oforal ability are rather premature, as the issues are socomplex and the factors involved which may affect scoresso little understood that inconclusive evidence shouldnot be surprising in a concurrent study.
2.3 Study Two; The relationship between teacherassessments of student oral abilities and theDevelopmental scales2.3.1 Introduction
The literature on the relationship between testscores and judgements of ability is concerned either withpredictive validity, that is, whether test scores canpredict the assessment of student performance in somefuture non-test situation (Messick, 1989a; 71 - 72), orwith concurrent investigation into the relationshipbetween tests taken within a limited period of time. In
310

the case of predictive validity the person who assessesthe student in the non-test situation is usually not alanguage teacher or tester, but someone from anotherdiscipline in which the student is working.
One such predictive study (Criper and Davies, 1988:54 - 55) investigated the relationship between ELTSscores and academic supervisors' judgements of studentlanguage ability at the beginning and end of theiracademic courses. At the beginning of the course thecorrelation between the ELTS speaking scores and thesupervisors' assessments of student speaking ability was.43, and at the end of the course .42. The concurrentstudy between the ELTS oral score and language tutors'assessments of students on a professional/academic coursealso produced a correlation of .42 (ibid., 56). Even ifthere were problems with the way in which the data forthe Criper and Davies studies were collected (Rea andWall, 1988: 56 - 57) it is very hard to believe thatthese correlations would have been much higher.
A concurrent study was carried out by Levine, Hausand Cart (1987) to investigate the assessment of studentsby teachers of French and Spanish on the ACTFL scale incomparison to the students' actual ACTFL results. Usingt-tests rather than correlations they discovered thatteacher assessments were significantly different fromACTFL ratings at p < .01 (ibid., 47). Levine et. al. cameto the conclusion that teachers were in need of trainingon the use of the ACTFL scale in the classroom in order
311

to make them more accurate assessors of their students'ability levels - the return to the problem of "cloning"(Alderson, 1991b).
Here, we are not concerned with issues of predictivevalidity, but with the extent to which oral test scoresare associated with concurrent assessment of oral abilitymade by teachers. Although Levine et. al. assume thatconcurrent teacher assessment and oral test scores shouldcoincide, their own data show that this is not the case,as does the data of Fulcher (1991). The differencebetween teacher assessment and oral test scores shouldnot be seen as surprising, as a classroom teacher workingwith a student over a lengthy period of time has theopportunity to form an opinion regarding the student'soral ability in a wide variety of activities and on alarge number of tasks. On the other hand, assessing oralability unsystematically in the classroom also providesthe teachers with opportunities to make errors which maynot be present in more controlled testing situations. Inthe oral test a much smaller number of tasks are alsoused in a very short period of time. A completelydifferent set of facets are involved in the twosituations, and have not been sufficiently investigatedin the classroom situation. The teacher hopes that herassessment of a student is reasonably accurate; the oraltest developer hopes that the evidence collected in thetest will allow the rater to assign a reliable and validscore. But there is no a-priori reason why the
312

differences between the two assessment situations shouldnot produce different results.
It may very well be that as much more research isdone into the way in which teachers assess their ownstudents in the classroom setting, it would becomepossible to combine teacher assessments with the resultsof oral tests to provide information which is more valid.
Once again, problems with criterion studies areraised. When Criper and Davies (1988: 55) state that"•••discrepancies between supervisors' judgements andtest results become themselves an interesting area forinvestigation •••" they are perfectly correct.Transferring this to language teachers' concurrentassessments we have to say that very little is knownabout the way in which teachers make assessments and howthey collect and synthesise their evidence. As a resultit is impossible to control for classroom assessmentfacets in relation to test method facets.
2.3.2 Ayailable data from teacher assessmentsIn the introduction it has been argued that teacher
assessments cannot presently be used in test validationstudies. However, as this type of concurrent study isconsidered to be one aspect of validity which should beinvestigated, appropriate data were collected in order tosee whether or not the correlations would be in the orderof .5 to .7 which appears to be usual for teacherassessment and external measures (Fulcher, 1991).
313

Within one month of the students taking the oraltests developed for this study, their teachers were askedto provide assessments in the areas of speaking,listening, reading, writing, grammatical accuracy,spelling, and the quantity and quality of work producedoutside class during the year. This information wascollected on a standard form which uses a Likert-typescale for each category, on which the teacher is asked totick one of five boxes headed "very good", "good","adequate", "poor" and "very poor" for every student. Theassessments were analyzed using the same procedures as inthe concurrent study with the FCE examination results,and the results are presented in Tables 9.7 to 9.10 inthe Appendix to Chapter 9.
2.3.3 Analysis of concurrent teacher assessmentsIt can be seen in Table 9.9 in the Appendix to
Chapter 9 that a one factor solution can account for thedata collected on teacher assessment and the ratingscales developed for the study. However, a four factorsolution was also forced, in which the initialeigenvalues for the first four factors were 7.66, 0.69,0.41 and 0.35 respectively. The fifth factor was notincluded as the eigenvalue was estimated at 0.06. Table9.10 in the Appendix to Chapter 9 shows that ratings ofone performance will tend to load highly on the samefactor. Although all the oral scales load on factor 2,the assessment of speaking by teachers loads on factor 4.
314

Section 3: validity by Group DifferencesA fairly weak form of validity (in the case of
second/foreign language testing), is that of groupdifferences (Messick, 1989a: 55). The principle behindthe analysis of group differences is that differentsections of the population taking a test may beidentified in advance of taking the test. The testresults may then be described as valid if they do in factdiscriminate between the various groups identified inadvance.
In the case of the students used in the currentresearch, they were identified as coming from threedistinct sub-groups of the population. Group 1 wereidentified as "good language learners," Group 2 were"average language learners" and Group 3 "poor languagelearners" (see pages 242 - 243). This was done on thebasis of their language learning history and reports fromlanguage teachers.
For the purpose of this kind of validity, it wouldbe expected that the use of a valid rating scale wouldseparate these students out into the appropriate group,even though the raters could not have known into whichgroup they had been previously classified.
For the purposes of this analysis the Rasch scoreson Fluency, Accuracy and ELTS were used. In order to testwhether or not ratings on each of the scales diddiscriminate between students One Way Analysis ofVariance was used, together with a post-hoc Tukey HSD
315

test.In the Appendix to Chapter 9, Table 9.11 contains
the results for the Fluency scale, Table 9.12 for theAccuracy scale, and Table 9.13 for the ELTS scale. Itwill be seen that in each case the between groupsvariance is larger than within groups variance, and thatthe differences between groups 1 and 2, 2 and 3 (andhence 1 and 3) are indeed all significant at p = .01 orless. It should be noted that in this analysis only 45students were included in the results, as one student wasoriginally removed from the sample due to the poorquality of the video recording (see page 245) and onestudent was taken ill immediately after the experimenthad been concluded and therefore did not complete thepost-experiment questionnaire. Summary statistics for thegroups are given in Table 9.14 in the Appendix to Chapter9.
In the rather gross terms of validity by GroupDifferences, it would appear that each of the scalespossess group discrimination validity. However, this formof validity is weak, and cannot be used to claim that therating scales themselves, or the band descriptors,contain anything which relates to psychological reality.For this, much more precise tools are required.
316

section 4: Construct validity4.1 A Multjtrait - Kultjmethod study
The validity of the scales developed was furtheranalyzed using three separate methods. Initially, aMultitrait-Multimethod (MTMM) study was conducted. In theMTMM study average correlation coefficients from fourraters were used. The three test method facets are thethree oral tasks, and the three traits were those ofFluency, Accuracy and ELTS global ratings. Table 9.15 inthe Appendix to Chapter 9 presents the MTMM matrix forthe uncorrected correlation coefficients. From an initialinspection of Table 9.15 we may immediately note that allthe correlation coefficients are high, indicating that itmay not be realistic to expect evidence of divergentvalidity between the ratings of Fluency and Accuracy, andmaking the investigation of the matrix corrected forattenuation a pointless exercise. It must also be bornein mind that the high correlations suggest that the MTMMapproach to investigating divergent validity may not beentirely appropriate for this data set, even if somelight is thrown upon its structure.
The requirements for MTMM studies (Campbell andFiske, 1959) are very hard to meet. The method requiresthat the correlation matrix demonstrates convergentvalidity between the same trait across methods, anddivergent validity between distinct traits irrespectiveof the method used to measure those traits.
The first requirement is that "the entries in the
317

validity diagonal should be significantly different fromzero and sufficiently large to encourage furtherexamination of validity." (ibid., 82). In Table 9.15 thisrequirement is met, providing some evidence forconvergent validity. The second requirement is that "avalidity diagonal value should be higher than the valueslying in its column and row in the heterotrait-heteromethod triangles" (ibid., 82), which would indicatethat the variable shows divergent validity fromvariables which have neither method nor trait in common.
The validity diagonals singularly fail in thisrespect, suggesting serious invalidity due to theinfluence of factors other than trait in the scores.However, it is necessary to add that the correlations areso high in both cases as to make it nearly impossible tomeet this requirement.
The third requirement is that "a variable correlatehigher with an independent effort to measure the sametrait than with measures designed to get at differenttraits which happen to employ the same method" (ibid.,83), which would demonstrate that a method factor was notsignificantly influencing results. The correlationcoefficients in the heterotrait-monomethod triangles areconsistently higher than all entries in the validitydiagonal in Table 9.15, indicating a strong methodeffect, which would suggest that the measures of Fluencyand Accuracy are not valid as measures which can be usedwithout consideration of the method facet of task.
318

The final requirement is that "the same pattern oftrait interrelationship be shown in all of theheterotrait triangles of both the monomethod andheteromethod blocks." (ibid., 83) Although this iscertainly the case with the matrix in Table 9.15, thiscannot be taken as evidence of validity as allcorrelation coefficients are so high as to be
uninterpretable. It would appear from the first analysisof this data that although "oral ability" may be beingmeasured, it is not possible to break this down intovalid components. There are two possible explanations ofthese findings. Either the results confirm those of thecriterion study, namely that what we have is a "haloeffect" from the methods, or alternatively all themethods employed tap the same unitary trait.
The MTMM approach to construct validation requiresthat any hypothesized trait be distinct from methods.What this means is that the trait can be measured under avariety of experimental conditions for it to beconsidered conceptually sound. Campbell and Fiske (ibid.,100) put the issue very clearly:
"•••any conceptual formulation of trait willusually include implicitly the proposition thatthis trait is a response tendency which can beobserved under more than one experimentalcondition and that this trait can bemeaningfully differentiated from other traits."
What this amounts to is that any hypothesized traitwhich is essentially method dependent is not actually a
319

trait. The initial evidence from the MTMM study of therating scales of Fluency and Accuracy which have beendesigned as reflecting two separate traits, suggests thatthey do not tap the hypothesized traits, and thereforelack construct validity as originally defined anddeveloped. However, the inadequacy of the MTMM approachto validation given such high correlations requires thatother methods are used to analyze the data.
4.2 Maximum Likelihood Confirmatory Factor AnalysisAs in Bachman and Palmer (1981, 1982, 1983) the MTMM
study was followed up with a Maximum Likelihood FactorAnalysis (ML) (Joreskog, 1969) using LISREL 7.16(Joreskog and Sorbom, 1989). In this study two modelswere analyzed: a general factor and two partiallycorrelated specific factors, and three correlated methodfacets. It had been hypothesized that, if the two ratingscales of Fluency and Accuracy actually tapped thosetraits, then the general factor and two partiallycorrelated specific factors would have been the bestfitting model.
LISREL 7.16 will not proceed with an analysis if theinitial estimates of the fit of the model to the datasuggest that the model is grossly inadequate. Thisoccurred with the general factor and two partiallycorrelated specific factors of Fluency and Accuracy.However, the fit statistics produced by the threeintercorrelated test method facets were good. Figure 9.1
320

shows the path diagram for this solution.
Fig 9.1. Path Diagram for an ML solution of threeintercorrelated test method facets--------------------------~------------------------------1~ 112 ~ Method 2 ~123 ~Method 3
~2 ~3
111 122 133 141 152 163 171 182 193I I I I xJ I I xl xlXl X2 X3 X4 X6 X7
---~-----------------------------------------------------Squared multiple correlations between each of the X
variables and the test method facets (~) are used as ameasure of their individual relationships, and a totalcoefficient of determination is a measure of the jointrelationship of the X variables to their ~ variables.These are presented in Table 9.16 in the Appendix toChapter 9.
As all the correlations are high, all the Xvariables are good measures of the ~ variables. Ofcourse, in this case, this result means that there is astrong test method effect in the scores, confirming theinvalidity of the traits suggested in the MTMM study. Thegoodness of fit of this model to the data is presented inTable 9.17 in the Appendix to Chapter 9.
The >r statistic is not significant for thecorrelation matrix, indicating that the model does fit
321

the data. The Root Mean Square Residual is very low,indicating that the model accounts for a large proportionof the variance in the data. We must therefore concludethat test method facets do account for the smalldifferences which exist between the scores on the threerating scales under investigation. It should be stressed,however, that these differences are extremely small.
The model which was fitted to the data, as madeclear in the path diagram, allowed for intercorrelationof the three test method facets. This intercorrelationcan be assessed by analyzing the t matrix, which ispresented in Table 9.18 in the Appendix to Chapter 9.
The high values in the t matrix suggest thatalthough test method facets do have an effect on scores,these might not be as large as the construct validationresults tend to suggest. If the main conclusion to bedrawn from the results is that there is cross-contamination on the scales as suggested in the MTMMstudy, then the ML analysis would only isolate smalldifferences among the test method facets as the mainsource of variability in scores. Indeed, this possibilityis suggested by the factor loadings of the X variables onthe ~ variables, where the loadings are generally fairlylow. These are presented in Table 9.19 in the Appendix toChapter 9.
The final assessment of this ML solution is to lookat modification indices for lx. The modification indicesfor the parameters of the model specified in the path
322

diagram (Figure 9.1.) provide information regarding thepotential change in the >r fit statistic if a previouslyfixed parameter is freed. The modification index isprovided in Table 9.20 in the Appendix to Chapter 9.
The maximum modification index for the matrix is for1(8,1) at 6.06 which is the relationship between the ELTSscore on task 2 and task 1. Although freeing thisparameter would increase the value of the model fitstatistics, there is no theoretical justification fordoing this at all. Further, a reduction in X2 by such asmall amount would not be particularly useful in thelight of the loss of explanatory power that the modelcurrently has.
It can only be concluded from the ML study that itis not possible to provide evidence of construct validityfor the rating scales of Fluency and Accuracy. Evidencesuggests that the only latent variables at work are thoseof test method facets, although these do not appear to beexceptionally strong. A second possibility is that eachof the scales equally tap a single trait, but that it isnot possible to isolate this trait by convergent anddivergent criteria. A third possibility is that cross-contamination in the rating process has masked any realdifferences which might exist between traits. In order tofurther investigate this, we will turn to Rasch PartialCredit analysis.
323

4.3 Rasch Partial Credit analysisMcNamara and Adams (1991, 12) conducted one study
using Rasch Partial Credit in which the Rating ScaleModel was used for judges and the full Partial Creditmodel used for rating categories. By introducing a fullPartial Credit model for tasks (test method facets) aswell as rating categories, Rasch analysis can be used notonly to investigate reliability but also validity. TheItem Characteristic Curves (ICCs) produced by such ananalysis on this data produces a 3 x 3 figure in which wemay compare the probability of any student with any raterbeing awarded a particular score on each specific scalewhen attempting each specific task.
The advantages of this method when dealing with oraltesting in particular are great. Whereas the MTMM and MLmethods of estimating construct validity only usecorrelation coefficients as data, the Rasch PartialCredit method uses all the data available from all facetsof the testing procedure.
The analysis of construct validity would involvecomparing the ICCs across rows and columns. In Figure 9.2on page 325 the tasks are presented across rows and thethree rating scales in the columns. Evidence forconstruct validity would be available if and only if theICCs in the columns (rating scales) are very similar,indicating that task does not have a very large influenceupon the interpretation of the scale or its individualband descriptors.
324

Fig. 9.2 Item Characteristic Curves for the study ofrating scale validity
Task 1
~- .. _':"~~,.~":":o
Task 2
....-. ':~~:~F~y--'.""'-:.;:;:~:'--'--~r-:'"~~;:-:-
'.-!~,,:,~~'!":'":"l~o
325
Task 3

The main problem in interpreting Figure 9.2 is thatit is not always very clear where the differences liebetween the interpretation of band boundaries acrosstasks. However, at first glance it appears that there isa large degree of similarity in columns. In order toovercome this problem, numerical data will be analyzedseparately, and an attempt will be made to devise a newvalidity coefficient for use with Rasch Partial Creditmodels, which can be assigned to each band in each scaleon each task.
In the Partial Credit model the probability (p) ofbeing awarded a particular band on a rating scale isdefined as:
exp (an - cSik)p =
1 + exp (an - cSik)
where an is the ability of person n, and 6ik is thedifficulty of scoring band k on scale i (Wright andMasters, 1982: 42).
The statistic 6ik can therefore be set out intabular format for comparison. Again, the hypothesiswould be that there would be greater similarity betweenthe 6ik statistic for rating scales than for tasks. Thestatistics are presented in Table 9.21 in the Appendix toChapter 9.
Even a cursory glance at Table 9.21 reveals thatthere is more consistency in the columns of the Fluency
326

scale than the Accuracy scale, and the Accuracy scalethan the ELTS scale. However, from the 6ik statistic, itis possible to produce a new validity statistic whichtakes all available data into account. The first step inthis process is to produce a new table similar to that ofTable 9.21, in which the entries are deviations from themean 6ik. These are presented in Table 9.22 in theAppendix to Chapter 9.
The assumption in producing Table 9.22 is that themean of 6ik across tasks within each scale (or 6.K -delta dot kappa) would be the best estimate of the true6ik for any given band on the rating scale once the testmethod facet of task has been removed. This is not anunreasonable assumption, as the mean of multipleobservations of the same phenomenon is always assumed tobe statistically more accurate than any singleobservation. If, as has been demonstrated in this case,the measurement is accurate, deviations from the mean canbe attributed to test method facets.
It should be noticed from Table 9.22 that allcolumns add to a total of zero, give or take .01 forerrors of rounding to two decimal places. Beforeproviding a more complete justification for the followingstatistic, it is now possible to define a new validitystatistic for Partial Credit models as:
Validity = 1 -
327

This validity statistic uses the deviation scoresand plots them onto the validity curve shown in Figure9.3 on page 330. For example, the lower threshold forachieving a band 4 on the Fluency rating scale for tasks1, 2 and 3 respectively is 0.24, 0.11 and 0.07 logits.The mean of these three figures is 0.14 logits. &.K isthe deviation of the lower threshold for the band on eachscale from this mean, providing the figures .10, -.03 and-.07 logits. &.K is then used in the formula on page 327to provide a misfit statistic for each instance of alower threshold as explained above.
This definition will allow the researcher to assigna validity statistic not to a rating scale as a whole,but to each individual band within a rating scale on eachindividual task, thus taking the use of the Rasch PartialCredit model well beyond uses currently envisaged for thevalidation of oral rating scales. The validitycoefficients derived from this method are always on ascale of 0 (less validity) to 1 (maximum validity), andas such the two extreme points of the scale are absolute.However, between 0 and 1 the validity coefficients whichare produced are dependent on the method of calculation,and hence relative. It would, for example, be possible touse a formula which produced a straight line or indeed acurve of a different shape from that in Figure 9.3. Thejustification for using this particular curve is that allreliability and validity coefficients to date use a
328

similar curve, although no justification for what happensbetween 0 and 1 is presented in the literature. UsingRasch Partial Credit models it would be possible toproduce an absolute, rather than a relative,interpretation of the validity curve in Figure 9.3, andthis will be discussed in Chapter 11.
with this warning in mind, when we look at thevalidity curve, what we are essentially doing isassessing the degree to which each use of a band on arating scale on each task is likely to deviate from thebest available assessment of the true 6ik. That is, thedeviation from the true point at which a student of thesame ability level (Bn = 6ik) would be as likely to scorethe band below as the band above (p = .5). Thus, giventhe curve which has been used in Figure 9.3 a highvalidity coefficient for a the lower threshold of a givenband on a given task is an indication of the validity ofthe band descriptor for the task in question, but not forvalidity across tasks and hence for generalization ofresults. High, consistent validity coefficients must beentered in columns for the researcher to make claims ofvalidity for the bands on a particular scale, as thiswould show that raters are consistently using the banddescriptors to classify the same students into the samebands on the rating scale, irrespective of test methodfacets. Using the above formula, Rasch Partial CreditValidity statistics were generated for each scale by band
329

Fig. 9.3 A Rasch Partial Credit validity curve for usewith bands in rating scales
330
lO-'t"-,"'".,0.,""-,18-/
st-'H-'o~-.".,Z, -,15"11$-/
0'"
""'"%1,.,
It '/Itt"o E",Z:',IT'/SI "-/, ..,0'" ~•')0" 10ZO',,.. El
-t" C
'"0.' I+-<
'I" CJln- cti- C1;[. ....
+']C, cC". '("1
h,- >Q)o,. Q
"I,S-es-fJ!.~.,,~-,(,
'If-n,.n-Ol-,..1.,,Q.<\c-
00

and by task, and these are presented in Table 9.23 in theAppendix to Chapter 9.
The validity coefficients for the Fluency scale maybe used to illustrate this. The validity coefficients forband 2 on tasks 1, 2 and 3 respectively, are .98, .95 and.94. These coefficients are high and similar acrosstasks. This may be compared with the same figures forband 2 on the Accuracy scale, where the coefficients are.46, .52 and .91 respectively. These figures for theAccuracy scale indicate that although the band descriptorfor the scale appears to be valid for lower abilitystudents on task 3, it is probably not valid for use ontasks 1 and 2. Band 2 cannot therefore be said to bevalid, as it does not meet the basic requirement for ameasurement instrument that similar results are obtainedirrespective of the method of data collection.
The validity coefficients are generally acceptablefor the Fluency scale, and highest when raters areassessing students who will get bands 2 - 4. As studentability improves, the scale becomes less valid inassessing them. Although there is variation across tasks,this is only large at bands 5 and 6 (and band 6 was theextreme on the rating scale which was not generated fromthe data analysis, but added on with band 0 to ensure theuse of bands 1 - 5 by raters). The validity coefficientsfor the Accuracy scale and the ELTS scale fluctuatewildly by both band and task, with the ELTS scalevalidity coefficients falling to unacceptably low levels
331

in many cases.It is believed that the development of this new
validity statistic which allows the analysis of bandswithin rating scales rather than entire rating scales, isa significant step forward in the process of evaluatingoral testing instruments.
4.4 Further Validity ConsiderationsHaving attempted to define and measure one aspect of
validity which concerns accurate measurement across testmethod facets when dealing with individual bands, it isnow possible to turn to the issue of the adequacy of thecontinuum of the scale. This aspect of validity isconcerned with the extent to which sequential banddescriptors can be said to represent an underlyingproficiency continuum from less to more proficient.
The Fluency scale, for example, has seven banddescriptors. The assumption is that 0 < 1 < 2 < 3 < 4 < 5< 6. Masters (1990, 58) draws attention to this aspect ofFluency as an integral component of original definitionsof criterion referencing (Glaser, 1963) which, he claims,has often been overlooked in much modern work oncriterion referencing. Masters recommends using ICCs tocheck whether or not a given rating scale is a continuum.Using ICCs as Masters recommends in conjunction with therows of the validity coefficients devised above, wouldindeed provide evidence for or against continuum validityof a rating scale. For example, band 4 of the Accuracy
332

scale on task 1 is almost subsumed within band 3 (seeFigure 9.2 on page 325). This would indicate that theband has no divergent validity from band 3, and does notstand on a continuum. On tasks 2 and 3 we observe thatband 3 can be clearly distinguished, but it should alsobe noticed that the validity coefficient for band 4 ontask 2 is only .61, and on task three, the coefficientfor band 3 is only .65 (see Table 9.23 in the Appendix toChapter 9).
The argument here is that the item characteristiccurves for successive bands within a scale can be takento represent the actual performance of a scale only whensuccessive horizontal validity coefficients are high(that is, when read across rows of the table). When thisis the case, the item characteristic curves provideevidence of validity when bands are clearly distinguishedfrom the band below and the band above, and preferablywhen the band widths are reasonably equally spaced acrossthe ability range. Exceptionally wide or narrow bands mayindicate a lack of definitional adequacy within the banddescriptors. In the former case the band descriptors maynot be capable of distinguishing between a range ofstudents at different ability levels (the banddescriptors may be too general), whilst in the lattercase the band may demonstrate a tendency to be subsumedby other bands (the band descriptors may be toospecific).
Returning to the Fluency scale, we may notice that
333

on tasks 2 and 3, band 4 is narrower than the otherbands. This is probably an accurate picture, as on Task 1the validity coefficient is a slightly lower .90, meaningthat we can be less certain about its true positioning onthe graph. Thus, although band 4 does appear to be valid,this could be a candidate for careful revision of thedescriptor in order to make it slightly more general,thus widening its use. Similarly, band 5 appears to befar too wide on Tasks land 3 which have reasonablevalidity coefficients. This would be an indication thatthe descriptors for band 5 need to be more specific inorder to make the band applicable to a smaller number ofstudents.
It is claimed here that this approach to validitynot only allows the researcher to investigate individualbands within a scale, but the nature of the continuumunderlying the scale. Further, the validity coefficientsin conjunction with the ICCs provide a method of decidingwhich band descriptors are valid, and how they may berevised to improve validity.
4.5 Discussion and ConclusionsThis approach to construct validity provides
reasonable evidence for the validity of the Fluencyscale, but does not provide evidence for the constructvalidity of the Accuracy scale or the ELTS scale. Thatis, the validity coefficients on the Fluency scale do notvary by column to any great extent, and although there is
334

some variation by row, an indication of how banddescriptors may be changed to improve validity has beendiscovered and expounded. With the other two scales thereis a great deal of random fluctuation by both row andcolumn, showing that more serious revision - probablyeven complete redrafting - may be necessary.
Although the MTMM and the ML study showed thatconstruct validity was absent from the rating scales, theRasch Partial Credit model analysis does suggest that theFluency scale does have a degree of construct validity,especially for students at certain ability levels. Thisdifference in results between the methodologies may notbe as surprising as it appears at first sight. Groot(1990, 21) points out quite clearly that MTMM typestudies only provide "evidence for insufficient validityof at least one of each pair of tests." If only onerating scale from three used in this study possesses adegree of validity, then this cannot be isolated by anMTMM or ML methods. However, the Rasch approach iscapable of testing where the lack of validity pointed upby the MTMM and ML studies originates.
Although the claim for the construct validity of theFluency scale is based upon the evidence from the RaschPartial Credit model analysis only, Groot1s observationmay give more confidence in the results obtained, and tothe conclusion that the Fluency scale is not assusceptible to changes in test method facets and moresensitive to changes in stUdent ability level, and that
335

sequential band descriptors do appear to represent aproficiency continuum.
With this observation, we return finally to theissue of the concept of construct validity. Anyhypothesized construct, or trait, depends essentially forits identification and validation on anoperationalization which can be shown to be independentof the conditions under which the observations were madeand represent an underlying continuum of ability. Theseare basic criteria of establishing a scientific approachto the measurement of proficiency on rating scales. Theyare also the difference between measuring studentcompetence and assessing student performance. In theformer case there is evidence which will allowgeneralization to other testing conditions (and,possibly, to situations external to the testingconditions) and comparison with students who are "better"and "poorer", in the latter one may only describeperformance under the particular conditions under whichthe test was held. This relates to the fundamental claimby Bachman and savignon (1986) that all language testsare indirect in that they attempt to measure a trait orunderlying ability which is observed through performance.Rating scales which include references to the testingsituation, such as the ACTFL, refer directly toperformance factors which inevitably confounds testmethod facets and traits to such an extent thatvalidation becomes impossible.
336

This is closely related to Alderson's distinctionbetween the "reporting function" and the "ratingfunction" of a scale (Alderson, 1991a). The reportingfunction of a scale must contain descriptors whichadequately reflect the degree to which test results maybe generalized to situations beyond those of the test,and may include references to what would otherwise beclassed as test method facets. However, the scale whichis used for the function of rating must not contain suchreferences, for their inclusion precludes the possibilityof investigating construct validity, and it is onlythrough establishing a degree of construct validity, thata case can be made for the claim that the ability of thestudent observed under test conditions could betransferred to other situations and other tasks. It may,therefore, be possible to rate on one scale which islinguistic in nature, and report on another whichpredicts the variety of situations to which one wouldexpect the competence measured to be transferable. Thelatter scale could be phrased in terminology which wouldbe understandable and acceptable to test result users.
The use of the linguistically valid scale for ratingand a separate scale for reporting would seem to beappropriate practice. Language testing in general andoral language testing in particular, does appear to havesuffered from the problem of the lack of ability togeneralize. It is only through the investigation ofconstruct validity that generalization may take place,
337

and that a test developer or researcher may claim to haveachieved a reasonable degree of validity in any resultsobtained. For the present, it is with this aspect of testdevelopment that advances can be made. The alternative isto admit to relativity and an inability to do other thancomment on specific events as they happen in isolation.
In conclusion, it is being argued that sufficientevidence for the validity of bands 2, 3 and 4 of theFluency rating scale has been discovered to warrantfurther study of those bands. Band 5 does not appear topossess the qualities needed for validity as described inthis section, whilst bands 1 and 6 did not havedescriptors but were merely markers of the beginning andend of the scale.
It cannot therefore be said that the use ofdatabased or "data-driven" construction techniques inproducing the two developmental scales of Fluency andAccuracy has been an unqualified success. However, moresuccess was clearly enjoyed in the development of theFluency scale, and this would seem to be in line with theoriginal predictions made from the discriminant analysisresults (page 152) during its development. Theimplications of these findings will be discussed in theconclusions in Chapter 11.
338

Chapter Ten
Retrospective Report studysection 1: Introduction
A retrospective study was conducted in order to gainadditional information on the perceptions of raters andmore reflective students of the oral interview proceduresused in this study. The interview method used was chosenin order to allow the raters and a sample of students toexpress their views freely on the process, and to allow areasonable degree of probing of their perceptions whenappropriate.
The data presented in this chapter are not"introspective," but what Grotjahn (1986, 167) refers toas a "retrospective verbal report." In the first case,respondents provide spoken data on the way in which theycomplete a given task whilst they are doing it. In thesecond case, after the task is completed they are askedto comment on the way in which they completed it. Thisretrospective debriefing is considered inferior, as itdoes not provide on-line access to immediate responseswhich are taken to directly represent mental processes,but allows time for hypothesizing and theory building onthe part of the respondent. However, in this research itdid not seem possible to get students to comment verballyon an oral test while they were actually doing the test.The five raters were asked to rate a total of 141 videorecorded oral tasks totalling some 40 hours. It wasclearly not possible to sit with them while they were
339

doing this, and so they were asked to keep notes on (a)their reactions to the tasks, (b) their reactions to thescales, and (c) any problems they ran into while ratingany of the students. They were informed that there wouldbe a thirty minute debriefing session after all thesubjects had been rated. Although questions for ratersdealt with tasks and general impressions of the testingprocess, in what follows we will focus upon only thosecomments to questions which relate specifically to ratingscales.
In work on questioning/debriefing techniques outsidethe field of Applied Linguistics and Testing it isgenerally accepted that the data collected from aninterview in which one is primarily interested in theinterviewees' views, are subject to error related to theinterviewer and the elicitation procedure (Fowler andMangione, 1990). Work in "standardized surveys have wideapplicability to other types of interviewing" (ibid.,18). In order to ensure that responses were as comparableas possible, a number of rules were followed by theinterviewer.
Firstly, one of the major threats to standardizedinterviewing is not reading the question exactly asworded. Bradburn and Sudman (1979) discovered that moreexperienced interviewers tend to adapt questions to thecontext of the interview, but that this processintroduced real bias into responses. In this study thequestions as worded prior to the interview were asked in
340

each case in exactly the same way.Secondly, when responses to questions were not
adequate, it was difficult to know when to probe theresponse in the hope that one would get more interestingdata, and when to continue with the next question. Ifprobing was attempted, then an attempt was made to makethis non-directive. Fowler and Mangione (op. cit., 42)suggest one of three ways of probing which will tend notto affect the responses gained: "How do you mean?", "Tellme more," and "Anything else?" Unfortunately, in anattempt to be more personable, interviewers do tend toinfluence the response patterns of certain interviewees,which constitutes interviewer related error. Some probingof answers was attempted in this study, but it wasavoided as much as possible especially with the studentswhere (a) they showed that they were not willing or ableto provide further useful information, and Cb) where timeavailable prevented further probing.
section 2: Interviews with RatersAlthough one or more questions were omitted for some
raters who had already dealt with the question underanother section of the interview, the questions thatfollow were read as worded, and any probes used were asnon-directive as possible. The responses to thesequestions may be found in Appendix 10.1 for all fiveraters. All interviews with raters took place withinthree weeks of their completing the ratings.
341

The questions were placed into three blocks: sectionA on the tasks, section B on the rating scales andsection C general questions.
Section A: TasksQ1: What kind of language do you think each of the three
tasks would have elicited?Q2: Which of the three tasks did you think was the most
difficult/easiest for the students?Q3: Which task produced the most assessable language in
terms of (i) quantity and (ii) quality?Q4: Did you think any of the topics were unfair?Q5: If you could revise any of the three tasks, what
would you change to make them better?Q6: Do you have any other comments on the tasks?
Section B: Rating ScalesQ7: Did you find the Fluency scale easy to use?Q8: Did the Fluency scale contain any descriptors/parts
of descriptors which you think are not a part of theconcept of fluency?
Q9: Did the Fluency scale not contain anything which is,in your opinion, part of the concept of fluency?
Q10: When rating, did you rely on any criteria other thanthose in the rating scale?
Q11: Did you find that you used the entire range ofpossible bands?
Q12 Did you think that the amount of detail in theFluency scale was appropriate?
Q13: Do you have any other comments on the use of theFluency scale or descriptors?
Q14: Did you find the Accuracy scale easy to use?
342
015: Did the Accuracy scale contain any descriptors/partsof descriptors which you think are not a part of theconcept of Accuracy?
016: Did the Accuracy scale not contain anything whichis, in your opinion, part of the concept ofaccuracy?
017: When rating, did you rely on any criteria other thanthose in the rating scale?
018: Did you find that you used the entire range ofpossible bands?
019: Did you think that the amount of detail in theAccuracy scale was appropriate?
020: Do you have any other comments on the use of theAccuracy scale or descriptors?
section 3: General Questions021: Were there any particular students who you had
difficulty rating either in terms of fluency oraccuracy? If so, please explain why?
022: Do you think you are a particularly lenient or harshrater?
023: Do you have any further general comments regardingthe process of assessing oral proficiency?
section 3: Interviews with studentsEight students were selected at random from the
higher ability group. They were asked to watch theirperformance on the Picture description task four daysafter they had completed all of the interviews. As thistook approximately 15 minutes per student, the amount oftime available to conduct a debriefing interview waslimited to only ten to fifteen minutes.
The interviews were recorded and transcribed. Theresponses for each of the eight students may be found in
343

Appendix 10.2. Only three questions were asked, althoughstudents were given more freedom in the amount of detailthey went into in response to each question. In somecases, there were preliminary comments from the studentsimmediately after seeing the video of themselves takingthe task. As the students could not comment on the ratingscales, questions focused on affective responses to thetest. The responses are here briefly summarised in threecategories.
QuestionsQ1: What were you thinking about during the interview?Q2: If you could do the interview again, with exactly
the same material, would you do anythingdifferently?
Q3: Are you nervous when doing oral tests?If yes, why? Can you think of anything which theexaminer could do to make the experience lessstressful? If no, can you imagine any circumstancesin which you would feel nervous?
section 4: Analysis of Data4.1 Rater responsesQuestion 1
Rater responses were generally in keeping with thepredictions made when the tasks were designed (see pages234 - 235), confirming that raters were able to see whateach task was designed to elicit.
344

Question 2The Rasch estimates of difficulty of the three tasks
was, from more to less difficult, Task 2 > Task 1 > Task3 (see page 292). Three of the five raters correctlypredicted this sequence. Rater 2 thought that Task 2 wasthe most difficult but that Task 1 was the easiest, andrater 3 predicted that Task 3 was the most difficult andTask 1 the easiest.
Rater 5 made a most perceptive comment when sayingthat from merely examining the three tasks one would haveassumed that Task 3 would prove to be the most difficult,but after rating the same students doing all three tasksone is forced to reconsider this view.
Two issues must be made raised in regard to theresponses to this question. Firstly, the topic chosen forthe interview seems to be a major consideration inassessing its difficulty and, from the responses toquestionnaires by students was also a major considerationin assessment of the "fairness" of the task. The topicchosen for the task comes up time and time again in mostresponses, and is clearly an area for much furtherresearch. We will return to this in Chapter 11. Secondly,assessment of the difficulty of a task does not seem tobe possible on any a-priori basis. This only becomespossible after tasks have been trialled and seen byexpert (reliable) judges.
345

Question 3When asked which task produced the most assessable
language, three of the five judges preferred Task 3 onthe grounds of the choice of topic. Two raters preferredTask 1, one because of the choice of the topic. Rater 3,who preferred Task 1 did, however, argue that Task 2allowed greater discrimination between the very goodstudents and the average students. This is an interestingresponse in relation to rater 3's response to question 2in which Task 3 was isolated as the most difficult: rater3 does seem to be inconsistent in the way in which taskdifficulty and discrimination are viewed.
Question 4Three of the five raters responded that Task 2 was
unfair, for the same reasons which were provided for itsperceived difficulty in Question 2. Rater 3 thought thatnone of the tasks were unfair, whilst rater 2 did specifythat although Task 2 was difficult, the students shouldhave been able to tackle it much better than the raterthought they did.
Question 5Although rater 3 would have changed Task 3, without
specifying what would need to be changed, this was aminority view. The other four raters all said that theywould change Task 2. This assessment of Task 2 on thepart of the raters is very much in keeping with the views
346

of the students expressed in their questionnaireresponses.
Question 6No other comments were made on the tasks used in the
research, although rater 5 echoed previous views thatTask 3 was particularly well designed and useful.
Question 7Responses to this question were virtually unanimous:
the rating scale as it stands is viewed as being too longfor practical use when one is rating students, as it isdifficult to "internalise" or "memorise." It wassuggested that the descriptors could be made more conciseby producing a list of points that raters must look for.
Rater 1 added that if the same format is to bemaintained, then it would aid the rater if the firstparagraph in each band descriptor referred to the samefactor; for example, hesitation in the first paragraph ofthe descriptor for each of the bands.
Rater 2 argued that Fluency was a component of"communication," and that it would be useful to renamethe rating scale. Rater 4 said in addition that it wasdifficult to distinguish between bands 3 and 4 as thesewere very similar. With reference to the ICCs for Fluencyin the reliability study (see page 288) we may seewhether or not rater 4's intuitions are correct. On Task1 rater 4 was indeed more likely to move from band 3 to
347

band 5, but band 4 was confused with band 5 and not band3. There was no problem at all with the use of thesebands on Task 2, while on Task 3 band 4 was used in adistinctively separate way, although for a smallerability range than either band 3 or 5. It would thereforeappear in this case that the retrospective report ofrater 4 is not consistent with actual rating patterns.
Rater 5 added that in bands 2 and 3 it is impossibleto know why students are pausing, and this causedproblems when rating. This perceptive comment relatesdirectly to the discussion on high and low inferencecriteria for the descriptors (see pages 132 - 135, 204)which was considered when developing the rating scales.It is also important to note that it is with preciselythese bands that the highest validity coefficients werediscovered (see Table 9.23 in the Appendix to Chapter 9).From rater 5's own rating pattern (page 288) we may alsonote that the two bands were adequately distinguished,with the exception of the use of the bands on Task 3where band 2 was an extreme and therefore not reported.
We may therefore conclude that irrespective of theadvantages in research terms of using high inferencecategories and their potential validity, there will beraters who prefer using rating scales whose banddescriptors are termed in much more concrete terms,namely, referring only to strictly observable phenomenain a behavioral sense. It may be that here there is anecessary distinction between rating scales which are
348

designed for research purposes and rating scales whichare designed for actual use in testing programmes.
Question 8Three raters replied in the negative to this
question. Rater 4 did suggest that there were grammaticalelements in the Fluency scale, but could not providespecific examples of this. Rater 5 suggested that"confidence in ability to get things right first time"might be more appropriate in the Lexis section of theAccuracy scale, observing that often weak candidatesdemonstrate confidence even though they do make errors.Although this may be true in a classroom setting (forwhich no data are available), in the data for this studyweak candidates were not observed to display suchconfidence under test conditions. Further investigationof this possibility could be the object of other studies.
Question 9Three examples of criteria not represented in the
scale were given by raters 4 and 5. These were: humour,the "advanced" ability to create laughter in theinterview, the speed of delivery, and flexibility(presumably as contained in the ELTS scale). The issue ofspeed of delivery was also raised by rater 5 in relationto Question 7. It had been assumed that speed of deliverywould be covered by the criterion of "pausing" in theFluency scale, but rater 5 clearly did not see this as
349

appropriate. The criteria of humour and flexibility(undefined at present) must be the subject of furtherresearch into oral testing.
ouest ion 10Two raters stated that they did not rely on any
other criteria than those contained in the Fluency ratingscale, while one stated that although no other criteriawere used, there was a "gut feeling" regarding the levelof the students. Rater 2 wondered whether or notpronunciation could have been included in Fluency,although it was stated that such issues were discountedin actual rating. Only rater 5 said that they wereinfluenced by the notions of "flexibility" and"initiative" as contained in the ELTS scale, as theFluency scale did not take into account the "passiveness"of the students on some tasks. This comment could verywell be associated with the view of rater 2 that"communication" may very well be a superordinate ofFluency, and the observation of rater 1 that harshness inrating was a function of the reluctance of students totake a lead in the discussion. It may very well be thatthe notion of "communication" as suggested by rater 2needs a great deal more research and operationaldefinition.
350

Question 11Rater 2 argued that the marking range was
restrictive, saying that more bands should have beenavailable. The rater stated that particular problems wereencountered between bands 3 and 4. This observation canbe confirmed from the ICCs (see page 288) of rater 2'sscoring, in which band 4 is either subsumed by band 3 orconfounded with bands 3 and 5. However, this is notevidence to suggest that more bands were needed; it isevidence to suggest that Rater 2 did have some difficultyin using the range of bands already available.
Rater 3 said that the middle bands were mainly used,and the extremes were not used. With reference to rater3's ICCs this is certainly true of ratings on Task 1,although the top ratings were used on Tasks 2 and 3.Lower bands were used only to a very limited extent,confirming the perceptions of rater 3.
Rater 5 stated that band 1 was not used. This wasonly true on Task 3, although on the other Tasks it wasan extreme. Raters 1 and 4 said that they did use theentire band range, and this is borne out by their ICCs(see page 288).
Question 12Although this question was omitted for rater 4 it
had previously been answered. The majority verdict wasthat the rating scale needed to be shortened forpractical use.
351

Question 13The feeling that the rating scale was too long for
practical use was once again echoed. Rater 2 expanded alittle on the title of the scale, saying that if it werecalled "communication" then flexibility and fluency wouldbe subcomponents of the scale. The rater also suggested,as previously, that there should be a wider band rangeand, if this were not possible, then the lowest andhighest bands should be provided with descriptors.
Question 14Turning to the Accuracy scale, all raters thought
that it was more practical and useful than the Fluencyscale, although the comments regarding its length and"wordiness" were repeated. The consensus was that theAccuracy scale was easier to use than the Fluency scale,rater 2 stating that there was enough information,clearly spelt out (unlike the ELTS scale), and raters 4and 5 agreeing that it gave much more concreteinformation on what to look for when rating a student.Rater 5 alone suggested that the lexis column in therating scale was still too theoretical, whilst generallyapproving of the Accuracy scale.
Question 15The answer to this question was unanimously
negative, with rater 4 reiterating that the descriptorswere too detailed.
352

Question 16All raters were reasonably content with the
definition of Accuracy used. Rater 4 raised the issue ofpronunciation, saying that it was part of the concept ofaccuracy. The rater was, however, unsure whether themistakes noticed were indeed mistakes because offamiliarity with the pronunciation of Greek speakingstUdents. This would tend to suggest the need to useraters unfamiliar with the accent/pronunciation of thestUdents used in a study if pronunciation is to be
considered, and compare their rating patterns with thoseof raters familiar with the pronunciation of thestudents.
Question 17In response to this question the raters unanimously
said that they did not rely on criteria external to thescale. Rater 4, however, did say once again that therewas a -gut feeling" regarding the ability of the studentswhich comes from teaching students at this level. Rater 4expanded on this in response to Question 23.
Question 18Qnly rater 3 stated that it was impossible to use
the entire band range on the Accuracy scale, and this canbe confirmed from this rater's ICCs (see page 289). OnTasks 1 and 3 bands 3 and 4 were used to cover thelargest range of ability, whilst on Task 2 only band 4
353

was used to any great extent. Rater 1 did use the entireband range, although band 5 was subsumed under band 4 inTask 3, whilst rater 5 did not use the lower bands onTask 3. The intuition of the raters can therefore be seento be reasonably accurate.
Question 19Once again, all raters believed that the band
descriptors on the Accuracy scale were too long anddetailed for practical use in a testing situation. Rater4 suggested that verb forms could be highlighted as itwas believed that this helps to isolate ability moreeasily than other criteria.
Question 20No raters had any other comments to make.
Question 21Raters 1, 2 and 3 all mentioned the need for a wider
band range. It has already been seen in the discussion ofquestion 11 that rater 2 did not distinguish betweenbands 3, 4 and 5 on the Fluency scale, but had noproblems with regard to the Accuracy scale. Rater 1 didnot use band 6 on the Fluency scale significantly on Task3 (see page 288), whilst band 4 was subsumed under band 5on the Accuracy Scale for Task 2 and band 5 was subsumedunder band 4 for Task 3. The view of rater 3 must betreated with much more caution, as it has already been
354

seen that this rater only used a very limited range ofavailable bands. Rater 1 suggested a band range of 1 - 10or even 1 - 20. This would seem to be unjustified on thebasis of the range of bands which the raters wereactually capable of distinguishing even on a scale of 0 -
5 or 0 - 6.
Question 22Raters 2, 4 and 5 all answered that they believed
they were fair in their rating of students. Rater 2mentioned one student who was particularly quiet, who wasalso mentioned by rater 4 in Question 21. Rater 3 saidthat her ratings were lenient, which indeed they were onall scales across all tasks (see pages 288 - 290). Rater1 said that ratings were harsher especially if thestudent remained silent when asked questions or if theymade "basic errors." This is confirmed by the rank orderof judge severity (page 279) in which rater 1 is theharshest on Accuracy for all tasks, but the secondharshest on Fluency and the third harshest when rating onthe ELTS scale.
It would therefore seem that raters do indeed have avery good impression of how lenient or harsh they are intheir own rating behaviour, irrespective of whether thatrating is reliable or not.
355

Question 23Only two raters had any general comments to make.
Rater 3 merely echoed previous views that the banddescriptors were too detailed, and that Task 3 was rathertoo difficult. Rater 4 had much more to add.
Rater 4 made five extra comments. Firstly, it wassuggested that the presence of recording equipment madeboth the students and the examiner tenser than they wouldotherwise be. There may be a case for consideringcarefully the location and obtrusiveness of any equipmentnecessary, in order to reduce any test anxiety in thosestudents who may be affected by its presence.
Secondly, rater 4 suggested that the tasks used inthe study were not related to the age or the abilitylevel of the students.
Thirdly, it was advocated that there should be adistinction drawn in the Accuracy scale between "basic"and "advanced" grammar. The view expressed seems to bethat students may be fluent but still make grave errorsin accuracy. It would appear that here is a very clearindication that rater 4 was confounding the two scales,and found it difficult to give, say, a high mark on theFluency scale and a low mark on the Accuracy scale. Thiscomment on the part of rater 4 may indicate that ratersdo not feel comfortable with giving radically differentratings to the same student on the same task irrespectiveof the number of rating scales which they are using. Thisis closely related to the fourth comment. This rater
356

commented that although these bands were appropriate forthe ability level of the students actually used in thestudy, these students may not be able to pass a writtenexamination set at the same level, specifying theUniversity of London GCE as an example. This commentseems to reveal the need on the part of this rater tohave uniform grades or bands for any given studentirrespective of the skill being tested. This may indicatea larger need on the part of raters for this kind ofconsistency, and hence result in cross-contamination notonly between oral rating scales but also the rating ofdifferent skills, unless the raters are capable ofperceiving differences between those skills andabilities. This raises a major problem in testing and thevalidation of language tests: to what extent do thescores reflect the (often unexpressed) theoretical viewsof the raters themselves? Further, whether raters aretrained (cloned?) or not, is it possible to find raterswithout already predetermined views of the nature of oralproficiency? It would seem to be a requirement of allfuture work in the validation of oral rating scales thatthe theoretical and/or practical views of the raters usedin the validation study be investigated and described. Ifthis is not done, it may be the case that the ratingscales themselves have little role to play in the wayraters award scores, and the validation study would beconfounded by constructs which are not accounted for inthe design. An alternative approach would be to use more
357

naive raters.The fifth point raised by rater 4 goes further to
exemplify this position. In response to Questions 10 and17 this rater reported the influence of what was termed a"gut feeling" about the ability level of the studentsbeing rated. This is here expanded upon, when rater 4strongly suggests that no teacher should examine studentsof a level which they have not taught before. This can betaken to mean that the classroom experience of studentsat a particular ability level can be translated directlyinto rating accuracy. Any rater then, is bound to bring agreat deal of experiential and conceptual baggage to theoral rating process. Rater training - or the absence ofrater training - may then not mean a great deal whenattempting to do research into the validation of orallanguage tests. Results are likely to be contaminatedfrom the very beginning by the prior experience which anyrater brings to the process of rating.
This may appear to be a rather bleak conclusion forthe process of the validation of oral language tests.However, the answer would seem to lie in the number ofraters which is employed in research. In a futureresearch study it may be appropriate to attempt to usesmaller numbers of stUdents and, perhaps, only two tasks,but a very large number of raters in order to be able toassume that any bias introduced into the rating processfrom prior experience will constitute random variance.The nature and effect of the conceptual baggage which a
358

rater brings to the rating process even without trainingis clearly an area for further research.
4.2 Student responses4.2.1 Ability level of the samgle
Of the eight students selected for this part of thestudy, one (student 4 in the transcripts) was excludedfrom the validity study as anxiety kept her from speakingat a volume which could be adequately recorded forscoring_ The ability levels of the other students aregiven in Table 10.3 in the Appendix to Chapter 10. It canbe seen that the selection is from the more ablestUdents.
4.2.2 Summary of findingsThe data collected may be summarised in three
categories.1. Concern of students of the amount of processing
time which is required when speaking in a second languageneeds to be taken into account. It would appear thatpreparation time and the use of a group discussion tasktends to be preferred by students who are aware of thisproblem.
2. Students seem to engage in dual processing: atthe moment of speaking they are concerned with thecontent of their speech (the "what") and the way in Whichthey communicate their message (the "how"). Planningahead appears to be concerned with anticipating the next
359

question in interview situations.3. Anxiety would appear to be associated with the
unnaturalness of the speech event as a test. It is unliketalking that occurs in any other context. In particular,students dislike the gaps in talk that occur and areaware of the fact that the interviewer is assessing them.students who are natural introverts may need specialtreatment, and interviewers need to be able todistinguish between ability as defined by a rating scaleand character traits which may affect their assessments.Once again, the group discussion task may help toovercome these problems to some degree, and may accountfor why most students said that they would prefer to doTask 3 to the others if given a choice.
In the interests of reducing anxiety related testmethod facets, it would also seem appropriate torecommend that raters do not write on notepaper or recordscores during a live oral interview unless there is morethan one interlocutor. Inhibition caused by the practiceof writing whilst engaging in conversation has also beennoticed by other researchers (Rodriguez, 1984).
360

Chapter Eleven
Discussion and ConclusionsSection 1: Preliminaries
Before turning to the main discussion of thischapter, which must inevitably centre around the validitystudy of Chapter 9 and an assessment of the data-drivenapproach to scale development, it is necessary to commentupon the interpretability of the results presented inChapter 9.
Firstly, it has been suggested in this study thatvalidity cannot be properly assessed unless test methodfacets can be either controlled or accounted for. It isargued that the data presented in Chapter 7 providessufficient evidence to suggest that affective factors didnot significantly effect scores. In particular, it isclaimed that test anxiety, although clearly a factor inthe oral testing situation, is not such as to cast doubtupon the reliability of the rating procedure.
Secondly, the reliability studies of Chapter 8 showthat we may have confidence in the scores obtained andused in the validity study. Reliability estimates wereconsistently high irrespective of the method ofestimation used, with considerable problems occurringwith only one rater who was excluded from the validitystudy as a result. Variation in rating patterns wasdiscovered in both the G-study and the Partial CreditModel study, although in neither Case WaS this variationgreat enough to significantly decrease reliability
361

estimates. It was further discovered that, although therewas a significant task effect, this too was not largeenough to reduce reliability estimates. In the case ofboth raters and tasks the outfit statistics from theRasch Partial Credit study were not significant.
Having taken these test method facets into accountin the study, and having controlled for other test methodfacets such as interviewer, rater training, place oftest, variation in elicitation techniques and time, it isclaimed that sufficient rigour has been used in thedesign of the study to have confidence in the results ofthe investigation into the validity of the rating scales.
Section 2: Validity and the use of the data-drivenapproach to scale development.2.1 The lack of divergent validity
In the concurrent validity study tentative evidencewas presented to suggest that an oral trait could beisolated, but there was no evidence whatsoever forconcurrent divergent or convergent validity of anycomponents of the oral trait, such as fluency oraccuracy. Nor was there any suggestion of concurrentvalidity between the rating scales and teacher assessmentof student abilities.
Validity by group differences was confirmed in theFluency and Accuracy rating scales, but it has beenargued that this is not sufficient evidence upon which tomake non-trivial claims.
362

The Multitrait-Multimethod study and the MaximumLikelihood Confirmatory Factor Analysis revealedconvergent validity for all rating scales but provided noevidence for divergent validity. The magnitude of thecorrelations made this conclusion inevitable. Twopossible explanations of the data from these studies weresuggested:
(a) Each of the rating scales used could tap a single,global trait, rather than separate component traits, or(b) there is significant cross-contamination in the useof the rating scales.
It can now be suggested that the second of theseexplanations is the more likely, and would account forthe fact that in the ML study the only source of uniquevariance which could be isolated belonged to the taskfacet, which was not found to be very large in thereliability study. That this was happening was indicatedin the retrospective study in Chapter 10 (see pages 356 -357), where rater 4 clearly indicates that there is alack of distinction between the concepts of fluency andaccuracy. If this is the case then having to rate astudent on a Fluency rating scale and an Accuracy ratingscale at the same time would be hypothesized to increasethe degree of cross-contamination. It is at this pointthat the study by Yorozuya and Oller (1980), despiteother problems with the design of their study, is
363

extremely helpful. They argue (ibid., 145) that:
"•••marks assigned by raters may be influencedon each scale by the rating(s) they have justassigned on the previous scale(s) and by thegeneral impression they are forming in theprocess of assigning the marks. If this wereso, and if raters did tend to assign similarmarks across the four scales rated on the sameoccasion, we would find stronger correlationsacross scales rating on the same occasion thanwhen they are rated on separate occasions."
A similar point is made by Hughes (1981: 179).Yorozuya and Oller called this phenomenon a "haloeffect" which they claimed accounted for approximately10% of the variance in their study Cie., not attributableto a g-factor). However, in the light of this study itwould also seem possible to turn their conclusion on itshead, and say that 90% of variance was due to cross-contamination and 10% due to other factors! Yorozuya andOller were arguing, after all, that the small amount ofsignificant variance which they had detected in theirtests did not represent an oral trait but error variance,in defence of the Unitary Competence Hypothesis. Theytherefore claimed that this variance was "an artefact ofthe method of rating multiple scales on a single hearingof each interview" (ibid., 146). The MTMM and MLstudies in this research strongly suggest that raters areincapable of maintaining a conceptual distinction betweencomponent rating scales in the process of rating if theratings are done at the same time, as they were in this
364

study (see page 267). It may be suggested that, if theraters are using two or three rating scales, they shoulddo the ratings from recordings on two or three separateoccasions. However, this would not only seem impracticalin a real testing situation, but would probably alsointroduce the test method facet of time which would haveto be estimated. If the retrospective comments of rater 4are also generalizable to other raters, it may even thennot lead to evidence of discriminant validity.
It is therefore argued here that the apparent lackof discriminant validity in the study of the ratingscales which were developed using a data-driven approachis the result of cross-contamination. That this is indeedthe case is strongly supported by the concurrent studybetween the components of the FCE rating scale and theAccuracy, Fluency and ELTS rating scales. The rotatedPrincipal Axis Factor Analysis results in Table 9.6 inthe Appendix to Chapter 9 clearly shows that the resultsare generated by cross-contamination in both tests,because ratings are made at a particular time on allcomponents of the rating scale.
Given the current status of our knowledge about therating process and the structure of oral proficiency, itwould therefore seem appropriate to recommend the use ofa single rating scale in oral assessment for the purposesof live testing. The development of componential ratingscales in tandem with investigating ways of trying toovercome the problem of cross-contamination should, for
365

the moment, remain in the realm of research.In particular, the finding of very strong cross-
contamination in this research does not help to throw anylight on the theoretical distinction which would predictthe difference between the development of accuracy andfluency (Hatch, 1974; Seliger, 1980; Brumfit 1984;Clahsen, 1985; Bialystok and Sharwood Smith, 1985; Ellis,1990a). Thus, when Skehan (1987: 206) recommends the useof convergent-discriminant techniques designed tovalidate oral tests to examine the epistemological statusof these theoretical but largely untested assumptions, itshould be added that these techniques will not alwayswork adequately because of confounding factors.
Ways of researching and overcoming these problemswill be discussed below in section 4, directions forfuture research.
2.2 Validity in the Partial Credit Model stugy2.2.1 A methogological note
In assessing the Partial Credit Model study ofvalidity in Chapter 9 we must first begin with a note onmethodology. It was stated on page 328 that the 0 and 1points on the validity formula developed in this study toestimate the validity of individual bands were absolutes,but that the shape of the curve and the points along itwere relative to the method of calculation. Theinterpretation of the validity coefficients aretherefore, like all reliability and validity
366

coefficients, relative. That is, a judgement has to bemade by the researcher regarding the magnitude of anyfigure which is to be termed "acceptable" or"unacceptable".
In Partial Credit Models it is believed that thereis a way to objectify these decisions. This method wouldinvolve assessing the variation of &ik across tasks (thatis, the variation seen to occur in the columns of Table9.22 in the Appendix to Chapter 9) in terms of whetherthe amount of variation recorded would be expected tooccur by chance. This would initially involve calculatingthe log likelihood of the &ik statistic for two models:(i) tasks separate and (ii) tasks combined. The maximumlog likelihood could then be calculated as:
-2 Log.LlL2
where Ll is the first model and L2 the second model. Thefigure produced by this calculation would then be checkedagainst the ~ distribution, the degrees of freedom beingcalculated as dfL1 - dfL2• If the maximum log likelihoodwere found to be large and significant, and larger thanthe number of parameters in the model, the differenceswould represent real variation between the &ik statisticsfor the tasks. Once the size of significant differenceswere known, absolute cut-off points could be applied tothe validity curve in Figure 9.3 on page 330.
367

Unfortunately, although FACETS estimates the maximumlog likelihood in the analysis of multi-faceted designs,it does not print it (Linacre and Wright, 1990: 15). Thisis a major disadvantage of this particular software.Until programs which conduct multi-faceted Partial Creditanalysis which do print this statistic are available, itis unlikely that further research into the absolute cut-off points in the type of validity coefficients developedfor this study can be conducted. However, as soon as suchtools are available, there is a great deal of potentialfor extending the use and power of the new validitystatistic presented on page 327.
2.2.2 Coherence and continuum ValidityIn the Partial Credit Model study, two criteria for
validity were put forward. The first criterion was thatthe validity coefficients in Table 9.23 in the Appendixto Chapter 9 should be high in columns, showing that thetest method facet did not affect the operation of therating scale. It is argued that it is a basic principlein scientific enquiry that the method of data collectiondoes not influence the results obtained. We will now callthis the "Coherence" criterion, implying that anyconstruct which cannot adequately be measured usingdifferent methods is not in itself coherent. The secondcriterion was that the validity coefficients in Table9.23 should be high in rows, and that Item CharacteristicCurves should be roughly equally spaced across the entire
368

ability range measured by the rating scale, showing thatthe band descriptors of the rating scale represent aproficiency continuum. We now call this the "Continuum"criterion.
The only rating scale which meets both of thesecriteria is the Fluency rating scale, bands 2 to 4, whichare given on pages 161 - 162.
From Figure 4.1 on page 152, it can be seen that inbands 2 and 3, the predictions from the discriminantanalysis on the basis of the definition of the constructof fluency were highly accurate. In the case of band 4,only one student would have been misplaced in a band 3.This must now be compared with the finding (page 288)that on the ICCs for tasks 2 and 3, band 4 is seen to beslightly narrower than the other bands on the ratingscale, meaning that it needed to be rather more generalin nature in order to cover a slightly wider abilityrange. That is, it did not entirely meet the continuumcriterion of validity as described above.
It can be claimed with some confidence that themisplacement of the one student in the initialdiscriminant analysis when the band was being developedis directly related to, and interpretable in the lightof, the results of the validity study. Where thepredictions from the initial discriminant analysis werecompletely accurate, the validity coefficients meet boththe coherence and continuum criteria. Where one studentwas misplaced by one band, the band in question does not
369

meet the continuum criterion in full, but does meet thecoherence criterion. This is a clear indication thatbands 2 and 3 on the Fluency rating scale are valid, andthat band 4 needs some adjustment in the direction ofgenerality and trialling for a second time.
This situation may be compared with that of theAccuracy rating scale. It was shown in Figure 5.1, and inthe discussion on pages 201 - 204, that the initialpredictions from the discriminant analysis were notaccurate, even though the band descriptors did followcurrent theories in the development of grammaticalaccuracy from the second language acquisition literature.The validity estimates in Table 9.23 in the Appendix toChapter 9 and the associated ICCs do not reflectcoherence or continuum validity.
It was suggested on page 203 that the explanationfor the results could have been that in oral tests ratersthemselves concentrate more on aspects of ability whichare very close to what we have described as fluency,rather than to accuracy. It was further suggested that ifthis were the case, if the assessment of accuracy wereessentially indeterminate, then low validity coefficientswould be expected in the validity study. It would be rashto conclude that this is in fact the case, as no evidencecan be presented for the validity of the Accuracy ratingscale at all. However, it is one possibility that maydeserve further research in the future.
Finally, we note that the ELTS global rating scale,
370

which is an a-priori rating scale included in this studyfor comparison with the two rating scales developed inthe data-driven approach, has the worst validitycoefficients of the three scales.
2.2.3 ConclusionsTwo important conclusions are drawn from the above
discussion. Firstly, the data-driven approach to ratingscale development has shown much promise, despite onlythree bands from one rating scale having been foundvalid. If the results of the initial discriminantanalysis are excellent the researcher would seem to beable to expect adequate validation figures in terms ofwhat we have termed coherence and continuum. It wouldappear from this study that as soon as there is theslightest error in prediction from the description ofbands to the rank order of the sample of students,validation does not seem to be possible.
Secondly, it would seem that the concern expressedin Chapter 4 over the nhigh-inferencen nature of the banddescriptors was unfounded. It would seem that thedescriptors for three of the bands are coherent andrepresent a proficiency continuum as we currentlyunderstand it. It is because of this result that theclaim to validity is not as trivial as it would have beenif, for example, bands 2 - 4 of the accuracy scale hadbeen found to be valid instead. Rather, we may genuinelysay that (at least part of) the concept of fluency has
371

been explained and the explanation found to besatisfactory in operational terms. It is thereforepossible to generalize from these three bands, and saythat students who fall into them are likely to be able toperform in a similar way on other tasks.
This research is therefore significant in that amethodology in the validation of oral rating scales basedon a data-driven approach has been attempted, andconsistencies observed between the initial analyses andband descriptor construction and the validation study. Inthe validation study itself, a new statistic has beensuccessfully developed and used which will allow theinvestigation of individual bands rather than entirerating scales and, using ICes, provide evidence uponwhich we may judge why a band descriptor is or is notworking adequately. Three band descriptors have beenfound to meet the validity criteria of coherence andcontinuum.
positive evidence of the effect of cross-contamination has been isolated in both the FCE ratingprocess as well as the rating process within this study.It is suggested that this is common to the rating processin oral testing, and ways to overcome this must be foundif componential scoring is to be used in live testing.
372

section 3: Assumptions of this researchIt has been assumed throughout this study that it is
possible to work within what may be called a "stabletrait" paradigm. That is, it has been assumed that,although interlanguage may be continually developing itis not changing radically from minute to minute or secondto second. If the latter were the case, then any traitwhich any test aims to tap validly would be in constantflux and there would be no empirical way to separatetrait from method, and no way to claim that any resultsfrom any investigation can be said to be related to thetrait in question at all. For testing purposes, it wouldappear necessary to assume that the trait is stable atleast for the period of time in which the test isconducted so that a "snap shot" of the trait may betaken. The existence and nature of interlanguage, thedegree of stability and the speed at which it changes arecurrent issues for debate within the second languageacquisition literature (Gregg, 1990; Ellis, 1990b;Tarone, 1990).
Secondly, the stable trait assumption also appliesto the nature of the task. It has been argued withBachman and Savignon (1986) that the trait must beseparable from test method facets if validation is to bepossible, and task is one of those facets. It followsthat the principle of validation by coherence discussedabove requires that the measurement of the trait be
stable across tasks or test method facets. If there is
373

variability of trait across tasks then the trait cannotbe isolated or measured. Tarone (1983: 147 - 152; 1985),on the other hand, argues that "capability" underliesperformance, that this is heterogenous althoughinternally consistent and describable, but varies byspeech style which is related to the nature of the taskbeing undertaken by the student.
This is supported by Douglas and Selinker (1985) andEllis (1985b) who propose that there are severalinterlanguages, several capabilities, which depend on the"discourse domain" of the task. This would imply thatlanguage tests must be devised to tap every singleidentifiable discourse domain and every singleidentifiable style on a continuum.
Skehan (1987: 200) accepts the implications of thisfor testing, arguing that the problem for languagetesters working within this paradigm is one of sampling.In designing the stUdies reported in this project, theseimplications have not been accepted.
What has been accepted is that there is taskvariability, but that this is not great enough todispense with the concept of a stable trait (or part ofthe underlying competence) which is not entirely taskdependent. The finding that task 3 in this study isdifferent from the others, but not so different as togenerate large outfit statistics (see page 292) supportsthis view. It is also accepted that the trait orcompetence changes over time, resulting in different
374

performance on tasks at different stages of interlanguagedevelopment (as is assumed in Pienemann et. al., 1985).However, with Gregg (1990) it is assumed that synchronicvariability is a feature of performance and not of thetrait itself which generates that performance. We concurwith Gregg (ibid., 370) that:
"The distinction between competence andperformance •••has pretty much establisheditself in linguistic theory and (to a lesserextent perhaps) in acquisition research. Andrightly so; making the distinction is simply afundamental prerequisite to progress in thescientific study of language acquisition. Thereis thus a great deal at stake in any attempt todeny or to blur over the distinction •••"
Ellis (1990b) argues that the variability ismotivated by the need to examine the "use" of thelanguage for educational purposes, rather than theconcerns of linguistics per se. And indeed, variabilitydue to task or style is a legitimate area for research.However, for the purposes of oral language testing, ithas been argued that it is essential to assume that thetrait is stable and generates the performance. Theargument quite simply is that only by making thisassumption can one make non-trivial statements about whystudents perform in the way they perform and, mostimportantly, generalize from the testing situation toother situations external to it. This has been the primeobjective of testing, as argued by Skehan (1988: 211) anddiscussed on page 9. To accept that tests are needed for
375

every discourse domain and every speech style wouldnecessarily bring with it the acceptance that no traitsmay be identified and no validation studies can becarried out. Above all, no results would be capable ofgeneralization, and it is only statements about languagelearning and testing which can be generalized that are ofinterest.
The theoretical assumptions underlying this presentstudy have been briefly considered here so that thereader may assess the extent to which the results warrantthe conclusions drawn. It also points up the fact that noempirical study can be conducted without theoreticalassumptions being made!
section 4: Suggestions for future research4.1 Validation of component traits
Divergent validity of the two traits of accuracy andfluency could not be established in this study, mainlybecause of the effect of cross-contamination. In order toinvestigate the structure of the oral trait and introducethe possibility of achieving divergent validity, theeffect of cross-contamination must be catered for in anyfuture research project.
It is suggested that one way of overcoming thisproblem is to write rating scale specifications, whichwould contain as full a description of the trait to bemeasured as possible and an indication of the number ofbands to be used in the rating scale. Two rating scales
376

would then be produced for each trait by separate scalewriters on the basis of the specifications.
Two sets of raters would then be asked to rate asmall number of students doing the same task from videoon two of the rating scales on different occasions. Thiswould, of course, introduce a time facet. To estimate theeffect of this, it would be recommended that at time 1,one set of raters marked the students on rating scale 1for trait 1, and simultaneously the second group ofraters marked the students on rating scale 1 for trait 2.At time 2, the first set of raters would rate thestudents on rating scale 1 for trait 2, and the secondset of raters would rate the students on rating scale 2for trait 1. The two rating sessions would have to beheld as close to each other as reasonably possible.
A Partial Credit model could be used to assess therating pattern of the raters on the two scales, and anMTMM study could be devised in which the methods wererating scales. It would be hypothesized that ratingscales of the same trait would exhibit divergentvalidity, as the design of the data collection techniquewould presumably reduce the effect of cross-contamination.
Another approach to this problem may be to userecently developed SOPIs in conjunction with a ratingprocedure which did not require raters to make anyjudgements at all. For example, the taped responses ofstudents to a completely standardized elicitation
371

technique could be transcribed and rated on the basis ofpurely linguistic criteria hypothesized to be related totwo or more distinct traits. This method would not be aspowerful as that described above, as it would ofnecessity have to concentrate only on verbal elements ofspeech, but it would at least give some insight intowhether or not the simple counts of the occurrences ofthe verbal elements said to be exponents of the separatetraits would result in the students being awardeddifferent scores on those traits. This type of design is,in fact, very much like that used by Pienemann et. al.(1985) in the construction of their oral observationforms.
Yet another approach to the problem would be toconduct an introspective study. In this design a largenumber of raters would be used to rate a small number ofstudents taking two or three oral tests on a number ofcomponent rating scales. However, prior to doing this,all raters would be interviewed about their conception ofthe nature of the traits on which they will be asked torate. These interviews would have to be recorded,transcribed, and the concepts of each rater thoroughlydocumented. Immediately after this the raters would thenbe asked to rate the students, and the rating patterns inpractice could then be related directly to theintrospective data in order to see to what extent priorviews of raters affected their use of the rating scale.It may also be possible to arrange for the raters to
378

introspect as they are rating, commenting on theirinterpretation of the rating scale, and a retrospectivestudy in which raters are shown their actual ratingpattern and ask them to compare this to what they thoughtthey were doing at the time. such a study would throw agreat deal of light onto the rating process which at thepresent time we know very little about, although if thecomments of rater 4 (see pages 353, 356 - 359) aregeneralizable, the conceptual baggage which raters bringto the rating process would seem to be an area of greatconcern for oral testing.
4.2 Task and topicAlthough it is known that there is a task effect in
oral testing, this does not seem to be as great as hasoften been assumed (see page 292). Nevertheless, we donot know a great deal about task difficulty. Much moreresearch is needed into task difficulty along the linesof Kenyon and Stansfield (1992), but using scores fromactual oral tests rather than relying on the judgementsof teachers. Further research in this is important, as wehave seen that difficulty level does relate to testanxiety (see page 259), and if it is possible for tasksto be scaled on a difficulty continuum, appropriate tasksmay be selected for students of certain predicted abilitylevels in order to control test anxiety.
Similarly, research is needed into the type oflanguage and discourse produced by certain tasks. We have
379

seen in this study that task 3, the group discussion, wasseen by raters as providing the most assessable language,that students perceived it as less stressful and thesituation as one in which more "natural" conversationcould occur. From the outfit statistics (Tables 8.38 -8.40 in the Appendix to Chapter 8) task 3 was seen to bescalable on the same dimension as the other tasks, andyet did appear to be operating in a different way fromthe others to some extent. It would be interesting to seeresearch similar to that of Perrett (1990) into thelanguage and discourse produced in the interviewconducted for this type of task.
Finally, no research has been discovered which takesinto account task and topic and any possible interactioneffects between the two as test method facets. In thisstudy, each of the tasks had its own topic, and so thetwo could not be studied separately. Yet, in the datafrom the retrospective study in Chapter 10, the issue offamiliarity with the topic was consistently raised, andin the questionnaire data discussed in Chapter 7 thechoice of topic was seen to be related to studentperceptions of "fairness".
We suggest a research project in which one task isdesigned with one standardized elicitation procedure, butwith two or more different topics. A sample of studentswould be asked to take the two or more tests which wouldthen differ only in terms of topic, and each of thestudents rated on a single rating scale. It would be
380

hypothesized that any difference in the scores would thusbe due to the effect of topic. Prior to carrying out thisstudy, it would be recommended that each of the studentsbe interviewed about their background interests, learninghistory, and any other factors which might influencetheir ability to talk about one of the topics chosen forthe test. The results of the tests could then be relateddirectly to the background of each student in the sample,making it possible to isolate the nature of any topiceffect in oral testing.
4.3 Specificity and length of rating scaleswriters from the time of Lado (1961) to Baker
(1989), Hughes (1989) and Matthews (1990) have arguedthat a rating scale must be as specific and detailed aspossible. On the other hand, Porter (1991) argues thatthey should be short and as simple as possible, to bejudged on the basis of what they leave out rather thanwhat they include. In the retrospective study, the ratersused in this research unanimously expressed the view thatthe rating scales of Accuracy and Fluency were too longand detailed. Yet, no research has been conducted on theoptimum length of rating scales for practical use; theviews expressed regarding length are merely the opinionsof the writers in the light of their own personalexperiences of rating.
Research is therefore needed into the length ofrating scales. It is suggested that this could be done by
381

taking one extremely detailed rating scale and producingfrom it a series of other rating scales along a cline ofdecreasing specificity by editing out parts of the scale,until it became just a title with a list of band numbers.Teams of raters would then rate the same students doingthe same task on one of the scales independently.Reliability coefficients for each of the teams, and therating patterns could be compared using a Partial Creditmodel. It would be assumed that somewhere along the clinethe evidence would suggest that optimum reliability hadbeen achieved, and thus empirical evidence would beavailable to suggest that a certain degree of specificitywas preferable to others.
4.4 Validation methodology and toolsIt has been argued that the new validation
coefficient which relates to bands within scales ratherthan whole rating scales (page 327) is a large stepforward in validation procedures. Validation by coherenceand continuum as defined on pages 368 - 371 becomespossible. However, it has also been noted (pages 366 -371) that there is still a problem with the relativenature of the interpretation of the validity coefficientswhen they are distant from the extreme points of thevalidation curve.
Overcoming this problem in the way suggested dependson the production and availability of programs for many-faceted models which provide the appropriate statistics
382

for absolute cut-off points to be drawn on the validitycurve. When such tools become available, it would beadvisable for more research to be done on the newvalidity statistic developed in this study. The data fromthis study could be analyzed again using the newprograms, or data from other studies, in order todiscover precisely how the validity coefficient works,and the magnitude of the difference between coefficientsin columns which would indicate a real difference invalidity.
4.5 Research into other rating criteria or traitsThis study has only dealt with the two traits of
accuracy and fluency for reasons stated in the rationale(pages 114 - 118). However, it is not assumed that theseare the only component traits which go to make up oralability. Nor is it assumed that the criteria used in therating scales to define these traits are the only oneswhich could be used. Research is needed into thevalidation of other possible traits and the criteria usedto define them.
In the retrospective study, raters mentioned thepossibility of measuring ability to communicate,flexibility and the ability to take initiative in theconversation, for example. One rater suggested that theability to be humorous may be a criterion which could beincluded within the definition of fluency.
383

We currently know so little about the structure oforal ability that this area of research is wide open.
Section 5: ConclusionsIt may appear, especially from section 4 (above) on
areas for future research, that this study has taken thereader from a state of confusion to a higher state ofconfusion. There is undoubtedly some truth in this.However, in this study the territory of research andpractice in oral testing has been staked out carefullyand some new problems, both theoretical and practical,revealed and described. Above all, it is believed thedata-driven approach to rating scale construction, thevalidation of bands rather than rating scales and theconcepts of coherence and continuum, will provide newinsights and contribute to methodological development infuture research into oral testing.
384

References
Abraham, R. G. and Plakans, B. S. 1988 "Evaluating aScreening/Training Program for NNS Teaching Assistants."TESOL Ouarterly 22, 3, 505 - 508.ACTFL 1982 "ACTFL Language Proficiency Project." ModernLanguage Journal 66, 2, 179.ACTFL Provisional Guidelines 1984. In Higgs, T. V. (Ed)1984 Teaching for Proficiency. the Organizing Principle.Lincolnwood, IL: National Textbook Company, 219 - 226.ACTFL 1986 ACTFL proficiency Guidelines. Hastings-on-Hudson, NY: American Council on the Teaching of ForeignLanguages.Adams, M. L. 1978 "Measuring foreign language speakingproficiency: a study of agreement among raters." InClark, J. L. D. (Ed) 1978a pirect testing of speakingproficiency; theory and application. Princeton, N. J.:Educational Testing Service., 129 - 149.Adams, M. L. 1980 "Five cooccurring Factors in SpeakingProficiency." In Frith, J. R. (Ed) 1980 Measuring SpokenLanguage PrQficiency. Georgetown University Press, 1 - 6.Adams, M. L. and Frith, J. R. CEds) 1979 Testing Kit:French and spanish. Department of State: Foreign ServicesInstitute.Adams, R. J., Griffin, P. E. and Martin, L. 1987 "Alatent trait method for measuring a dimension in secondlanguage proficiency." Language Testing 4, 1, 9 - 27.Alatis, J. E. (Ed) 1990 Linguistics, language teachingand language acgyisitiQn: The interdependence Qf theory,practice and research. Georgetown University Round Tableon Languages and Linguistics. Washington D.C.: GeorgetownUniversity Press.Alderson, J. C. 1983 "Who needs Jam?" In Hughes, A. andPorter, D. (Eds) 1983 Current pevelQpments in LanguageTesting. London: Academic Press., 87 - 92.Alderson, J. C. 1991a "Bands and Scores." In Alderson, J.C. and North, B. (Eds) 1991 Language Testing in the1990s. Modern English Publications and the BritishCouncil, 71 - 86.
385

Alderson, J. C. 1991b "Dis-sporting Life. Response toAlastair Pollitt's paper: Giving Students a SportingChance: Assessment by Counting and by Judging." InAlderson, J. C. and North, B (Eds) 1991 Language Testingin the 1990s. Modern English Publications and the BritishCouncil, 60 - 70.Alderson J. C. and Hughes, A. (Eds) 1981 Issues inLanguage Testing. ELT Documents 111: The British Council.Alderson, J. C., Krahnke, K. J. and Stansfield, C. W.(Eds) 1987 Reyiews of English Language proficiency Tests.TESOL.Alderson, J. C. and North, B. (Eds) 1991 Language Testingin the 1990s. Modern English Publications and the BritishCouncil.Allwright, D. 1988 Observation in the Language Classroom.Longman.Anastasi, A. 1990 Psychological Testing. 6th edition; NewYork: Macmillan.APA 1985 Standards for Educational and PsychologicalTesting.Bachman, L. F. 1981 "An experiment in a picture-stimuliprocedure for testing oral communication." In Palmer, A.S., Groot, P. J. M. and Trosper, G. A. (Eds) 1981 lbaConstruct validation of Tests of CommunicativeCompetence. Washington D.C.: TESOL, 140 - 148.Bachman, L. F. 1988 "Problems in Examining the Validityof the ACTFL Oral Proficiency Interview." Studies inSecond Language Acgyisition 10, 2, 149 - 164.Bachman, L. F. 1990 Fundamental Considerations inLanguage Testing. Oxford: Oxford University Press.Bachman, L. F. and Clark, J. L. D. 1988 "The measurementof foreign/second language proficiency." Annals of theAmerican Academy of Political and Social Science, 490, 20.- 33.Bachman, L. F. and Palmer, A. S. 1981a ""Basic concernsin test validation." In Alderson, J. C. and Hughes, A.(Eds) 1981 Issues in Language Testing. ELT Documents 111:The British Council, 135 - 151.
386

Bachman, L. F. and Palmer, A. S. 1981b HA multitrait-multimethod investigation into the construct validity ofsix tests of speaking and reading." In Palmer A. S.,Groot, P. J. M., and Trosper, G. A. (Eds) 1981 ~Construct validation of Tests of Communicativecompetence. Washington D.C.: TESOL, 149 - 165.Bachman, L. F. and Palmer, A. S. 1982 "The constructvalidation of some components of communicativeproficiency." TESOL Quarterly, 16,4, 449 - 465.Bachman, L. F. and Palmer, A. S. 1983 "The constructvalidity of the FSI oral interview." In J. Oller (Ed)1983 Issues in Language Testing Research. Rowley, Mass.:Newbury House Publishers, 154 - 169.Bachman, L. F. and savignon, S. J. 1986 tiTheevaluationof communicative language proficiency: a critique of theACTFL Oral Interview." Modern Language Journal 70, 4, 380- 390.Bailey, N., Madden, C., and Krashen, S. 1974 tllsthere a"natural sequence" in adult second language learning?"Language Learning 24: 235 - 243.Baker, D. 1989 Language Testing: A Critical Survey andPractical Guide. Edward Arnold.Barley, Z. 1990 "The relationship of test anxiety andperformance in Oral Comprehensive Exams." Paper presentedat the Annual Meeting of the American EducationalResearch Association, Boston M.A.Barnwell, D. 1986 "Who is to judge how well others speak?An experiment with the ACTFL/ETS Oral Proficiency Scale."Paper presented at the Eastern States Conference onLinguistics, Pittsburgh.Barnwell, D. 1987 "Oral Proficiency Testing in the unitedStates." British Journal of Language Teaching 25, 1, 35 -42.Barnwell, D. 1989 "Naive native speakers and judgementsof oral proficiency in Spanish." Language Testing 6, 2,152 - 163.Bartz, W. M. 1979 "Testing Oral Communication in theForeign Language Classroom." Language in Education:Theory and Practice 17. Arlington VA.: ERIC Clearinghouseon Languages and Linguistics.Bejar, I. I. 1985 A preliminary study of Raters for theTest of Spoken English. Princeton NJ.: EducationalTesting Service.
387

Berkoff, N. A. 1985 "Testing Oral Proficiency: A NewApproach." In Lee, Y. P. (Ed) 1985 New Directions inLanguage Testing. Pergamon Institute of English, 93 -100.Bialystok, E. and Sharwood Smith, M. 1985 "Interlanguageis not a state of mind: an evaluation of the constructfor second language acquisition." Applied Linguistics 6,101 - 117.Biere, E. J. and Hinofotis, F. B. (Eds) 1979 New Conceptsin Language Testing; Some Recent Studies. TESOL.Bohn, C. A. and Bohn, E. 1985 "Reliability of Raters: theEffects of Rating Errors on the Speech Rating Process."COmmunication Education 34, 4, 343 - 351.Bolus, R. E., Hinofotis, F. and Bailey, K. M. 1981 "Anintroduction to generalizability theory in secondlanguage research. Language Learning 32, 1, 245 - 258.Bradburn, N. A. and s. Sudman 1979 Improving InterviewMethod and Questionnaire pesign. San Francisco: Jossey-Bass.Brod, R. 1982 "Building a Language Profession." AJllLBulletin 14, 1, 10 - 13.Brown, G. and Yule, G. 1983 Teaching the Spoken Language.Cambridge University Press.Brown, H. D., Yorio, C. A. and Crymes, R. H. (Eds) 1977Teaching and Learning English as a Second Language;Trends in Research and Practice. Selected papers from the1977 TESOL Convention. Washington DC: TESOL.Brown, J. W. 1985 "RSVP: Classroom Qral InterviewProcedure." Foreign Language Annals 18, 6, 481 - 486.Brumfit, C. 1984 Communicative Methodology in LanguageTeaching; the roles of fluency and accuracy. CambridgeUniversity Press.Burt, M. 1975 "Error analysis in the adult EFLclassroom." TESQL Quarterly 9, 53 - 63.Burt, M. and Dulay, H. 1975 Bilingual Syntax Measure. NewYork: Harcourt Brace Jovanovich.Burt, M. and Kiparsky, C. 1972 The Gooficonj A RepairManual for English. Rowley, Mass.: Newbury HousePublishers.Butterworth, B. 1975 "Hesitation and semantic planning inspeech." Journal of Psycholinguistic Research 4, 75 - 87.
388

Byrnes, H. 1987 "Second Language Acquisition: Insightsfrom a Proficiency Orientation. In Byrnes, H. and Canale,M. (Eds) 1987 Defining and Developing Proficiency;Guidelines, Implementations and Concepts. Lincolnwood,IL.: National Textbook Company, 107 - 131.Byrnes, H. and Canale, M. (Eds) 1987 Defining andDeveloping Proficiency; Guidelines. Implementations andConcepts. Lincolnwood, IL.: National Textbook Company.Calderbank, M. and Muhammed, A. 1988 "Testing oralcommunication: why and how?" System 16, 1, 49 - 60.Callaway, D. R. 1980 "Accent and the evaluation of ESLoral proficiency." In Oller, J. and Perkins, K. (Eds)1980 Research in Language Testing. Rowley, Mass.: NewburyHouse Publishers, 102 - 115.Campbell, D. T. and Fiske, D. W. 1959 "Convergent andDiscriminant Validation by the Multitrait-MultimethodMatrix." Psychological Bulletin 56, 2, 81 - 105.Canale, M. 1981 "A theoretical framework forcommunicative competence." In Palmer, A. S., Groot, P. J.M. and Trosper, G. A. (Eds) 1981 The Construct Validationof Tests of Communicative Competence. Washington D.C.:TESOL 31 - 36.Canale, M. 1983 "On some dimensions of languageProficiency." In Oller, J. (Ed) 1983 Issues in LanguageTesting Research. Rowley, Mass.: Newbury HousePublishers, 333 - 342.Canale, M. and Swain, M. 1980 "Theoretical Bases ofcommunicative approaches to second language teaching andtesting." Applied Linguistics 1, 1, 3 - 47.candlin, C. 1987 "Towards Task-Based Language Learning."In Candlin, C. and Murphy, D. F. (Eds) 1987 LanguageLearning Tasks. Lancaster Practical Papers in EnglishLanguage Education; Prentice Hall, 5 - 22.Cand1in, C. and Murphy, D. F. 1987 Language LearningTasks. Lancaster Practical Papers in English LanguageEducation; Prentice Hall.Carroll, B. J. and Hall P. J. 1985 Make Your OWn LanguageTests; A Practical Guide to Writing Language PerformanceTests. Pergamon Press.Carroll, J. B. 1967 "The Foreign Language Attainments ofLanguage Majors in the Senior Year: A Survey Conducted inu.s. Colleges and Universities." Foreign Language Annals1, 2, 131 - 151.
389

Carroll, J. B. 1968 liThePsychology of Language Testing."In Davies, A. (Ed) 1968 Language Testing Symposium.Oxford University Press, 46 - 69.Cartier, F. A. 1980 "Alternative Methods of OralProficiency Assessment." In Frith, J. R. (Ed) 1980Measuring Spoken Language Proficiency. GeorgetownUniversity Press, 7 - 14.Caudery, T. (Ed) 1991 New Thinking in TEFL. University ofAarhus Press.Channell, J. 1985 "Vagueness as a conversationalstrategy." Nottingham Linguistic Circular 14, 3 - 24.Chastain, K. 1980 "Native Speaker Reaction to Instructor-Identified Student Second Language Errors." ModernLanguage Journal 64, 2, 210 - 215.Chaudron, C. 1988 Second Language Classrooms; Research onteaching and learning. Cambridge University Press.Clahsen, H. 1985 "Profiling second language development:a procedure for assessing L2 proficiency." In Hyltenstam,K. and Pienemann, M. (Eds) 1985 Modelling and assessingsecond language acguisition. San Diego: College HillPress.Clark, J. L. D. 1975 "Theoretical and technicalconsiderations in oral Proficiency Testing." In Jones, R.L. and Spolsky, B. (Eds) 1975 Testing LanguageProficiency. Arlington Va: Center for AppliedLinguistics, 10 - 28.Clark, J. L. D. (Ed) 1978a Direct testing of speakingproficiency; theory and application. Princeton, N. J.:Educational Testing Service.Clark, J. L. D. 1978b Foreign Service Institute Tests.Princeton, N. J.: Educational Testing Service and theOffice of Education, Washington D.C.Clark, J. L. D. 1979 "Direct versus semi-direct tests ofspeaking ability." In Biere, E. J. and Hinofotis, F. B.(Eds) 1979 New Concepts in Language Testing; Some Recentstudies. TESOL, 35 - 49.Clark, J. L. D. 1980a "Toward a Common Measure ofSpeaking Proficiency." In Frith, J. R. (Ed) 1980Measuring Spoken Language Proficiency. Georgetownuniversity Press, 15 - 26.
390

Clark, J. L. D. 1986a Handbook for the Deyelopment ofTape-Mediated. ACTFL/ILR Scale-Based Tests of SpeakingProficiency in the Less COmmonly Taught Languages.Washington D.C.: Center for Applied Linguistics.Clark, J. L. D. 1986b "Development of a tape-mediated,ACTFL/ILR scale-based test of Chinese speakingproficiency." In Stansfield, C. W. (Ed) 1986 Technologyin Language Testing. Washington DC: TESOL.Clark, J. L. D. 1988a The Proficiency-Oriented TestingMovement in the united States and its Implications forInstructional Program Design and Evaluation. Mimeo:Defense Language Institute.Clark, J. L. D. 1988b "Validation of a test of Chinesespeaking proficiency." Language Testing 5, 2, 187 - 205.Clark, J. L. D. and Clifford, R. T. 1988 "TheFSI/ILR/ACTFL Proficiency scales and testing techniques:development, current status and needed research. Studiesin Second Language Acgyisition 10, 2, 129 - 147.Clark, J. L. D. and Lett, J. A. 1988 Research Issues inSecond Language Proficiency Testing. Mimeo: DefenseLanguage Institute.Clark, J. L. D. and Li, Y. C. 1986 Development.validation and dissemination of a proficiency-based testof speaking ability in Chinese and an associatedassessment model for other less COmmonly taughtlanguages. Washington DC: Center for Applied Linguistics.Clark, J. L. D. and Swinton, S. S. 1980a An Explorationof Speaking Proficiency Measures in the TOEFL Context.TOEFL Research Report 4, Princeton, N. J.: EducationalTesting Service.Clark, J, L, D. and Swinton, s. s. 1980b The Test ofSpoken English as a Measure of Communicative Ability inEnglish-Medium Instructional settings. TOEFL ResearchReport 7, Princeton, N. J.: Educational Testing Service.Clifford, R. T. 1978 "Reliability and Validity Aspectscontributing to Oral Proficiency of Prospective Teachersof German." In Clark, J. L. D. (Ed) 1978a Direct testingof speaking proficiency: theory and application.Princeton, N. J.: Educational Testing Service, 191 - 209.Clifford, R. T. 1980 "Foreign Service Institute FactorScores and Global Ratings." In Frith, J. R. (Ed) 1980Measuring Spoken Language Proficiency. GeorgetownUniversity Press, 27 - 30.
391

Criper, C. and Davies, A. 1988 Research Report l(i) ELTSValidation Project Report. The British Council/Universityof Cambridge Local Examinations Syndicate.Crocker, L. and Algina, J. 1986 Introduction to Classicaland Modern Test Theory. Holt, Rinehart and Winston, Inc.Crystal, D. and Davy, D. 1975 Advanced ConversationalEnglish. Longman.Cronbach, L. J. 1984 Essentials of Psychological Testing.New York: Harper and Row.Dandonoli, P. and Henning, G. 1990 "An Investigation ofthe Construct Validity of the ACTFL ProficiencyGuidelines and Oral Interview Procedure." ForeignLanguage Annals 23, 1, 11 - 22.Dato, D. (Ed) 1975 pevelopmental Psycholinguistics.Washington DC.: Georegetown University Press.Davidson, F. and Bachman, L. F. 1990. "The Cambridge-TOEFL comparability Study: An example of the Cross-National Comparison of Language Tests." In de Jong , H.A. L. (Ed) 1990 Standardization in Language Testing. AILAReview, Amsterdam: Free University Press, 24 - 45.Davies, A. (Ed) 1968 Language Testing symposium. OxfordUniversity Press.Davies, A. 1990 Principles of Language Testing. Oxford:Basil Blackwell.Davies, A. 1991 The native speaker in appliedlinguistics. Edinburgh: Edinburgh University Press.de Charruf, L. F. 1984 "Oral Testing." MEXTESOL Journal8, 2, 63 - 79.de Jong, J. H. A. L. 1990 "Response to Masters:Linguistic Theory and Psychometric Models." In de Jong,J. H. A. L. and stevenson, D. K. (Eds) 1990Individualizing the Assessment of Language Abilities.Philadelphia, Multilingual Matters, 71 - 80.de Jong, H. A. L. (Ed) 1990 Standardization in LanguageTesting. AlLA Review, Amsterdam: Free University Press.de Jong, H. A. L. and stevenson D. K. (Eds) 1990Individualizing the Assessment of Language Abilities.Philadelphia, Multilingual Matters.
392

de Villiers, J. and de Villiers, P. 1973 HA cross-sectional study of the acquisition of grammaticalmorphemes in child speech." Journal of PsycholinguisticResearch 2, 267 - 278.Dechert, D. W. and Raupach, M. CEds) 1980 Towards aCross-Linguistic Assessment of Speech Production.Frankfurt: Peter Lang.Douglas D. and L. Selinker 1985 "Principles for languagetests within the "discourse domains" theory ofinterlanguage: research, test construction andinterpretation." Language Testing 2, 2, 205 - 226.Dugan, J. S. 1988 "Standardized Tests as an Alternativeto the Oral Interview." Proceedings of the 7th AnnualEastern Michigan University Conference on Languages forBusiness and the PrQfessions.Dulay, H. and Burt, M. 1973 "Should we teach childrensyntax?" Language Learning 24, 245 - 258.Dulay, H. and Burt, M. 1974 "YQU can't learn withoutgOQfing: an analysis Qf children's secQnd languageerrors." In Richards, J. C. (Ed) 1974 Error Analysis.Longman, 95 - 123.Dulay, H. and Burt, M. 1975 HA new approach todiscovering universals of child second languageacquisition." In DatQ, D. (Ed) 1975 DevelopmentalPsycholinguistics. Washington DC.: GeoregetQwn UniversityPress, 209 - 233.Dulay, H., Burt, M. and Krashen, S. 1982 Language Two.Oxford University Press.Duncan, C. K. 1987 "Evaluating speaking skills in theclassroom: a workshop for teachers." Foreign LanguageAnnals 20, I, 15 - 23.ETS 1970 Manual fQr Peace CQrps Language Testers.Princeton, NJ.: Educational Testing Service.ETS 1982 ETS Oral Proficiency Testing Manual. princetQn,NJ.: Educational Testing Service.ETS 1986 ETS Oral Proficiency FamiliarizatiQn Kit.BostQn, MA.: Heinle and Heinle.Ellis, R. 1985a Understanding Second LanguageAcgyisition. OxfQrd University Press.Ellis, R. 1985b "Sources Qf variability ininterlanguage.H Applied Linguistics 6, 2, 118 - 131.
393

Ellis, R. 1987a Second Language Acquisition in Context.Prentice Hall.Ellis, R. 1987b "Individual learning styles in classroomsecond language development." Paper presented at the AILAconference, Sydney, Australia.Ellis, R. 1990a "Individual Learning Styles in ClassroomSecond Language Development." In de Jong, J. H. A. L. andStevenson, K. (Eds) 1990 Individualizing the Assessmentof Language Abilities. Philadelphia, MultilingualMatters, 83 - 96.Ellis, R. 1990b "A Response to Gregg." AppliedLinguistics 11, 4, 384 - 391.Farhady, H. 1983 "On the plausibility of the unitarylanguage proficiency factor." In Oller, J. W. (Ed) 1983Issues in Language Testing Research. Rowley, Mass.:Newbury House Publishers, 11 - 28.Felix, S. (Ed) 1980 Second Language Development: Trendsand Issues. Tubingen: Gunter Narr.Feldt, L. S. and Brennan, R. L. 1989 "Reliability." InLinn, R. L. (Ed) 1989 Educational Measurement.Macmillan/American Council on Education, 105 - 146.Folland, D. and Robertson, D. 1976 "Towards objectivityin group oral testing." English Language Teaching Journal30, 2, 156 - 167.Fowler! F: J. a~d.T: ~. Mangion~ 1990 Standardized SurveyInterv1ew1ng: M1n1m1z1ng Interv1ewer related error.Applied Social Research Methods Series, Volume 18. NewYork: Sage Publications.Frith, J. R. 1979 "Preface." In Adams M. L. and Frith J.R. (Eds) 1979 Testing Kit: French and Spanish. Departmentof State: Foreign Services Institute, iii - vi.Frith, J. R. (Ed) 1980 Measuring Spoken LanguageProficiency. Georgetown University Press.Fulcher, G. 1987 "Tests of oral performance: the need fordata-based criteria." English Language Teaching Journal41, 4, 287 - 291.Fulcher, G. 1989 Lexis and Reality in Oral Testing.Washington, DC: ERIC Clearinghouse for Languages andLinguistics.Fulcher, G. 1990 "Review of Testing Spoken Language."English Language Teaching Journal 41, 1, 80 - 81.
394

Fulcher, G. 1991 "The role of Assessment by Teachers inSchool." In Caudery, T. (Ed) 1991 New Thinking in TEFL.University of Aarhus Press, 138 - 158.Gaies, S. J. 1977 "The Nature of Linguistic Input inFormal Second Language Learning: Linguistic andCommunicative Strategies in ESL Teachers' ClassroomLanguage." In Brown, H. D., Yorio, C. A. and Crymes, R.H. (Eds) 1977 Teaching and Learning English as a SecondLanguage: Trends in Research and Practice. Selectedpapers from the 1977 TESOL Convention. Washington DC:TESOL, 204 - 212.Galassi J. P., Frierson, H. T., and Siegel, R. G. 1984"Cognitions, test anxiety, and test performance: a closerlook. Journal of Consulting and Clinical Psychology 52,319 - 320.Glaser, R. 1963 "Instructional technology and themeasurement of learning outcomes: some questions."American Psychologist 18, 519 - 521.Gregg, K. 1990 "The Variable Competence Model of SecondLanguage Acquisition, and Why It Isn't?" AppliedLinguistics 11, 4, 364 - 381.Griffin, P. E. 1985 "The use of latent trait models inthe calibration of tests of spoken language in large-scale selection-placement programs." In Lee, Y. P. (Ed)1985 New Directions in Language Testing. PergamonInstitute of English, 149 - 161.Griffin, P. E., Adams, R. J., Martin, L., and Tomlinson,B. 1988 "An algorithmic approach to prescriptiveassessment in English as a Second Language." LanguageTesting 5, I, 1 - 18.Griffiths, R. 1991 "Pausological Research in an L2context: A Rationale, and Review of Selected Studies."Applied Linguistics 12, 4, 345 - 364.Groot, P. J. M. 1990 "Language Testing in Research andEducation: The Need for Standards." In de Jong, J. H. A.L (Ed) 1990 Standardization in Language Testing. AlLAReview, Amsterdam: Free University Press, 9 - 23.Grosjean, F. 1980 "Temporal variables within and betweenlanguages." In Dechert, H. W. and Raupach, M. (Eds) 1980Towards a Cross-Linguistic Assessment of SpeechProduction. Frankfurt: Peter Lang.Grotjahn, R 1986 "Test validation and cognitivepsychology: some methodological considerations." LanguageTesting 3, 2, 159 - 185.
395

Halliday, M. A. K. 1985 Spoken and written language.Deakin University Press, Victoria.Hamp-Lyons, L. 1987 "Cambridge First Certificate inEnglish." In Alderson, J. C., Krahnke, K. J. andstansfield, C. W. (Eds) 1987 Reviews of English LanguageProficiency Tests. TESOL, 18 - 19.Harik, O. E. 1980 "Two Disciplines of Examiners? Theeffect of professional background and level of experiencein grade-setting." Scandinavian Journal of EducationalResearch 24, 3, 121 - 132.Harrison, A. 1982 "The assessment of communicativeexchanges." Language Testing Newsletter 3, 2 - 5.Hatch, E. 1974 "Second Language Universals." WorkingPapers on Bilingualism, 3, 1 - 17.Heaton, J. B. 1975 Writing English Language Tests.Longman.Heaton, J. B. (Ed) 1982 Language Testing. Modern EnglishPublications.Hendricks, D., Scholz, G., Spurling, R., Johnson, M., andVandenburg, L. 1980 "Oral proficiency testing in anintensive English Language Program." In Oller, J. andPerkins, K. (Eds) 1980 Research in Language Testing.Rowley, Mass.: Newbury House Publishers, 77 - 90.Henning, G. 1987 A Guide to Language Testing -Development - Evaluation - Research. Cambridge: NewburyHouse.Henning, G. 1992 "Dimensionality and construct validityof language tests." Language Testing 9, 1, 1 - 11.Hieke, A. E. 1985 "A componential approach to oralfluency evaluation." Modern Language Journal 69, 2, 135 -142.Higgs, T. V. (Ed) 1982 curriculum. competence and theforeign language teacher. Lincolnwood, IL: NationalTextbook Company.Higgs, T. V. (Ed) 1984 Teaching for Proficiency, theOrganizing Principle. Lincolnwood, IL: National TextbookCompany.Higgs, T. V. and Clifford, R. 1982 "The push towardscommunication." In Higgs, T. V. (Ed) 1982 Curriculum,competence and the foreign language teacher. Lincolnwood,IL: National Textbook Company.
396

Hilsdon, J. 1991 "The Group Oral Exam: Advantages andLimitations." In Alderson, J. C. and North, B. (Eds) 1991Language Testing in the 1990s. Modern EnglishPublications and the British Council, 189 - 197.Hinofotis, F. B., Bailey, K. M. and stern, S. L. 1983"Assessing the oral proficiency of prospective foreignteaching assistants: instrument development." In Palmer,A. S., Groot, P. J. M. and Trosper, G. A. (Eds) 1981 ~Construct Validation of Tests of Communicativecompetence. Washington D.C.: TESOL, 106 - 126.Hughes, A. 1981 "Reaction to the Palmer & Bachman and theVollmer Papers." In Alderson, J. C. and Hughes, A. (Eds)1981 Issues in Language Testing. ELT Documents 111, TheBritish Council, 176 - 181.Hughes, A. (Ed) 1988 Testing English for Uniyersitystudy. ELT Documents 127, Modern English Publications andthe British Council.Hughes, A. 1989 Testing for Language Teachers. CambridgeUniversity Press.Hughes, A. and Porter, D. (Eds) 1983 Current peyelQpmentsin Language Testing. London: Academic Press.Hughes, A. Porter, D. and Weir, C. (Eds) 1988 ResearchReport l(ii) ELTS Validation Project; Proceedings of aconference held to consider the ELTS Validation projectReport. The British Council/University of Cambridge LocalExaminations Syndicate.Hyltenstam, K. and Pienemann, M. (Eds) 1985 Modelling andassessing second language acguisition. San Diego: CollegeHill Press.ILR Interagency Language Roundtable Skill Leyelpescriptions. Arlington, VA.: US Government InteragencyLanguage Roundtable.Ingenkamp, K. and Wolf, B. 1982 "Research in OralSecondary School Leaving Examinations in Germany."British Journal of Educational Psychology 52, 3, 341 -349.Ingram, D. 1982 Introduction to the ASLPB. Mimeo.Ingram, D. 1984 Report on the fOrmal trialling of theAustralian second language proficiency ratings (ASLPR).Studies in adult migrant education, Department ofImmigration and Ethnic Affairs, Canberra: AustralianGovernment Publishing Service.
397

Ingram, D. 1985a "Assessment and the ASLPR." Paper to theconference of the Curriculum Area Committee Languages,Senior Secondary Assessment Board of South Australia,Adelaide.Ingram, D. 1985b "Assessing proficiency: an overview onsome aspects of testing." In K. Hyltenstam and M.Pienemann (Eds) 1985 Modelling and assessing secondlanguage acguisition. San Diego: College Hill Press,215 - 276.Ingram, D. 1990 "The Australian Second LanguageProficiency Ratings." In de Jong, J. H. A. L. (Ed) 1990Standardization in Language Testing. AILA Review,Amsterdam: Free University Press, 46 - 61.Ingram, D. and Wylie, E. 1985 Australian Second LanguageProficiency Ratings. Canberra.Jafarpur, A. 1988 "Non-native raters determining the oralproficiency of EFL learners." System 16, 1, 61 - 68.James, C. J. (Ed) 1986 Foreign Language Proficiency inthe Classroom and Beyond. Lincolnwood, IL.: NationalTextbook Company.James, G. 1988 "Development of an Oral proficiencyComponent in a Test in English for Academic Purposes." InHughes, A. (Ed) 1988 Testing English for Universitystudy. ELT Documents 127, Modern English Publications andthe British Council, 111 - 133.Jarvis, G. A. 1986 "Proficiency Testing: A Matter ofFalse Hopes? ADFL Bulletin 18, 1, 20 - 21.Jones, K. 1982 Simulations in Language Teaching.Cambridge University Press.Jones, K. P. and Horsnell, V. (Eds) 1978 Informatics 3.London: ASLIB.Jones, R. L. 1975 "Testing Language Proficiency in theunited states Government.1I In Jones, R. L. and Spolsky,B. (Eds) 1975 Testing Language Proficiency. Arlington Va:Center for Applied Linguistics, 1 - 9.Jones, R. L. 1981 "Scoring Procedures in Oral LanguageProficiency Tests.1I In Read, J. A. S. (Ed) 1981Directions in Language Testing (Anthology Series 9) RELC:Singapore University Press, 100 - 107.Jones, R. L. 1985 "Some Basic Considerations in TestingOral Proficiency." In Lee, Y. P. (Ed) 1985 New Directionsin Language Testing. Pergamon Institute of English, 77 -84.
398

Jones, R. L. and Spolsky, B. (Eds) 1975 Testing LanguageProficiency. Arlington Va: Center for AppliedLinguistics.Joreskoq, K. G. 1969 "A General Approach to ConfirmatoryMaximum Likelihood Factor Analysis." Psychometrika 34, 2,183 - 202.Joreskog, K. G. and Sorbom, D. 1989 LISREL 7.Mooresville, IN: Scientific Software Ltd.Kachru, B. B. 1992 "World Englishes: approaches, issuesand resources." Language Teaching 1 - 14.Kaplan, I. M. 1984 "Oral Proficiency Testing and theLanguage Curriculum: Two Experiments in Curriculum Designfor Conversation Courses." Foreign Language Annals 17, 5,491 - 497.Kaulfers, W. V. 1944 "War-time developments in modernlanguage achievement tests." Modern Language Journal 28,136 - 150.Kenyon, D. M. and Stansfield, C. W. 1991 "A method forimproving tasks on performance assessments through fieldtesting." Paper presented at the Annual meeting of theNational Council on Measurement in Education. Chicago,IL.Klein Braley, C. and Stevenson, D. K. CEds) 1981 Practiceand Problems in Language Testing. Volume 1,Frankfurt/Bern.Knight, B. 1992 "Assessing speaking skills: a workshopfor teacher development." English Language TeachingJournal 46, 3, 294 - 302.Kramsch, C. J. 1986a "Proficiency versus. Achievement:Reflections on the Proficiency Movement." APFL Bulletin18, 1, 22 - 24.Kramsch, C. J. 1986b "From language proficiency tointeractional competence." Modern Language Journal 70, 4,366 - 372.Krashen, S. 1981 Second Language AcQyisition and SecQndLanguage Learning. PergamQn Institute of English.Krzanowski, W. J. and Woods, A. J. 1984 "statisticalaspects of reliability in language testing." LanguageTesting 1, 1, 1 - 21.Lado, R. 1961 Language Testing. Longman.
399

Lambert, R. D., Elinor, G., Barber, E. J., Merrill, M.B., and Twarog, L. I. 1984 Beyond Growth: The Next Stagein Language and Area Studies. Washington DC.: Associationof American Universities.Lantolf J. P. 1988 "Review of Testing Spoken Language."Studies in Second Language Acguisition 10, 2, 265 - 267.Lantolf, J. P. and Frawley, W. 1985 "Oral ProficiencyTesting: A critical Analysis." Modern Language Journal69, 4, 337 - 345.Lantolf, J. P. and Frawley, W. 1988 "Proficiency:understanding the construct." Studies in Second LanguageAcgyisition 10, 2, 181 - 195.Larsen-Freeman, D. 1975a The acguisition of grammaticalmorphemes by adult learners of English as a SecondLanguage. Unpublished Ph.D. thesis, University ofMichigan.Larsen-Freeman, D. 1975b "The acquisition of grammaticalmorphemes by adult ESL stUdents." TESOL Quarterly 9,409 - 430.Larsen-Freeman, D., and Long, M. 1991 An Introduction toSecond Language Acguisition Research. Longman.Lee, Y. P. (Ed) 1985 New Directions in Language Testing.Pergamon Institute of English.Lee, Y. P. and Low, G. 1982 "Towards a Classification ofTests of Language Use: The Dimension of Test Directness.Journal of Applied Language Study 1,1,16 - 28.Levelt, W. J. M. 1983 "Monitoring and self-repair inspeech." Cognition 14, 41 - 104.Levine, M. G., Haus, J. and Cort, D. 1987 "The Accuracyof Teacher Judgement of the Oral Proficiency of HighSchool Foreign Language Students." Foreign LanguageAnnals 20, 1, 45 - 50.Linacre, J. M. 1991. FACETS computer program for manyfaceted Rasch measurement. Chicago; Mesa Press.Linacre, J. M. and Wright, B. D. 1990. Facets: Many-Faceted Rasch Analysis. Chicago: Mesa Press.Linn, R. L. (Ed) 1989 Educational Measurement.Macmillan/American Council on Education.Liskin - Gasparro, J. E. 1984a "The ACTFL ProficiencyGuidelines: Gateway to Testing and Curriculum." ForeignLanguage Annals 17, 5, 475 - 489.
400

Liskin - Gasparro, J. E. 1984b "The ACTFL proficiencyguidelines: A historical perspective." In Higgs, T. V.(Ed) 1984 Teaching for Proficiency. the OrganizingPrinciple. Lincolnwood, IL: National Textbook Company, 11- 42.Liskin - Gasparro, J. E. 1984c ETS oral proficiencytesting manual. Princeton NJ: Educational TestingService.Lombardo, L. 1984 "Oral testing: getting a sample of thereal language." English Teaching Forum 22, 1, 2 - 6.Long, M. 1983 "Inside the "Black Box": MethodologicalIssues in Classroom Research on Language Learning." InSeliger, H. W. and Long, M. (Eds) 1983 Classroom OrientedResearch in Second Language Acguisition. Rowley, Mass.:Newbury House Publishers, 3 - 36.LoW, G. D. and Lee, Y. P. 1982 "Classifying tests oflanguage use: the dimension of directness." Journal ofApplied Language study 1, 16 - 28.Lowe, P. 1976 Handbook on Question TYpes ang their use inthe LS Oral Proficiency Tests. (Preliminary Version)Washington DC.: CIA Language School.Lowe, P. 1983 "The ILR oral interview: origins,applications, pitfalls, and implications." ~unterrichtspraxis 16, 230 - 244.Lowe, P. 1985a "The ILR proficiency scale as asynthesizing research principle: The view from themountain." In James, C. J. (Ed) 1986 Foreign Languageproficiency in the Classroom and Beyond. Lincolnwood,IL.: National Textbook Company, 9 - 53.Lowe, P. 1985b ILB Handbook on Oral Interview Testing(Final Version) Washington DC.: DLI/LS Oral InterviewProject.Lowe, P. 1986 "Proficiency: panacea, framework, process?A reply to Kramsch, Schulz, and particularly Bachman andSavignon." Modern Language Journal 70, 4, 391 - 397.Lowe, P. 1987 "Interagency Language RoundtableProficiency Interview." In Alderson, J. C., Krahnke, K.J. and Stansfield, C. W. (Eds) 1987 Reviews of EnglishLanguage Proficiency Tests. TESOL, 43 - 47.Lowe, P. and Clifford, R. T. (1980) "Developing anIndirect Measure of Overall Oral proficiency." In Frith,J. R. (Ed) 1980 Measuring Spoken Language Proficiency.Georgetown University Press, 31 - 39.
401

Lowe, P. and Liskin-Gasparro, J. 1986 Testing SpeakingProficiency: the oral interview. Washington DC.: ERICDigest.Lunz, M. E. and Stahl, J. A. 1990a "Severity of GradingAcross Time Periods." Paper presented at the AnnualMeeting of the American Educational Research Association.Boston, MA.Lunz, M. E. and Stahl, J. A. 1990b "Variation amongExaminers and Protocols on Oral Examinations." Paperpresented at the Annual Meeting of the AmericanEducational Research Association. Boston, MA.MacIntyre, P. D. and Gardner, R. C. 1991 "Methods andresults in the study of anxiety and language learning: areview of the literature." Language Learning 41, I, 85 -117.MacPhail, J. 1985 "Oral Assessment Interviews:suggestions for Participants." Unpublished MAdissertation, University of Lancaster: Department ofLinguistics and Modern Languages.Madsen, H. S. 1983 Technigues in Testing. OxfordUniversity Press.Madsen, H. S. and Jones, R. L. 1981 "Classification oforal proficiency tests." In Palmer, A. S., Groot, P. J.M. and Trosper, G. A. (Eds) 1981 The Construct validationof Tests of Communicative competence. washington D.C.:TESOL, 15 - 30.Madsen H. S. and Murray, N. 1984 Retrospective evaluationof testing in ESL content and skills courses. BrighamYoung University, unpublished manuscript.Magnan, S. S. 1986a "Assessing Speaking Proficiency inthe Undergraduate Curriculum: Data from French." ForeignLanguage Annals 19, 5, 429 - 438.Magnan, S. S. 1986b "From Achievement to Proficiencythrough Multi-Sequence Evaluation." In James, C. J. (Ed)1986 Foreign Language Proficiency in the Classroom andBeyond. Lincolnwood, IL.: National Textbook Company,117 - 145.Masters, G. 1990 "Psychometric Aspects of IndividualAssessment." In de Jong, J. H. A. L. and Stevenson D. K.(Eds) 1990 Indiyidualizing the Assessment of LanguageAbilities. Philadelphia, Multilingual Matters, 56 - 70.
402

Matthews, M. 1990 "The measurement of productive skills:doubts concerning the assessment criteria of certainpublic examinations." English Language Teaching Journal44, 2, 117 - 121.McNamara, T. F. 1990 "Item Response Theory and thevalidation of an ESP test for health professionals."Language Testing 7, 1, 52 - 76.McNamara, T. F. 1991 "Test Dimensionality: IRT analysisof an ESP Listening Test. ,.Language Testing 8, 2, 139 -159.McNamara, T. F. and Adams, R. J. 1991 "Exploring raterbehaviour with Rasch techniques." Paper presented at the13th Language Testing Research Colloquium, EducationalTesting Service, Princeton, NJ.McNemar, Q. 1951 "The factors in factoring behaviour."Psychometrika 16, 353 - 359.Meisel, J. M. 1980 "Linguistic Simplification." In Felix,S. (Ed) 1980 Second Language Deyelopment: Trends andIssues. Tubingen: Gunter Narr, 13 - 40.Meredith, R. A. 1978 "Improved Oral Test Scores throughDelayed Response." Modern Language Journal 62, 7, 321 -327.Meredith, R. A. 1990 "The Oral Proficiency Interview inReal Life: Sharpening the Scale." Modern Language Journal74, 3, 288 - 296.Messick, S. 1989a "Validity." In Linn, R. L. (Ed) 1989Educational Measurement. Macmillan/American Council onEducation, 13 - 103.Messick, S. 1989b "Meaning and Values in Test Validation:The Science and Ethics of Assessment." EducationalResearcher 18, 2, 5 - 11.Miller, S. I. and Fredericks, M. 1991 npostpositivisticAssumptions and Educational Research: Another View."Educational Researcher 20, 4, 2 - 8.MLA 1965 Cooperative Foreign Language Tests Handbook.Princeton, N. J.: Educational Testing Service.Morrison, D. M. and Lee, N. 1985 "Simulating an academictutorial: A test validation study." In Lee, Y. P. (Ed)1985 New Directions in Language Testing. PergamonInstitute of English, 85 - 92.
403

Morrow, K. 1982 "Testing Spoken Language." In Heaton, J.B. (Ed) 1982 Language Testing. Modern EnglishPublications, 56 - 58.Morrow, K. 1990 Letter to the English Language TeachingJournal 44, 3, 254.Mullen, K. A. 1978a "Determining the Effect ofUncontrolled Sources of Error in a Direct Test of OralProficiency and the Capability of the Procedure to DetectImprovement following Classroom Instruction." In Clark,J. L. D. (Ed) 1978a Direct testing of speakingproficiency: theory and application. Princeton, N. J.:Educational Testing Service, 171 - 189.Mullen, K. A. 1978b "Direct Evaluation of Second LanguageProficiency: The Effect of Rater and Scale in OralInterviews." Language Learning 28, 2, 301 - 308.Mullen, K. A. 1980 "Rater reliability and oralproficiency examinations." In Oller, J. and Perkins, K.(Eds) 1980 Research in Language Testing. Rowley, Mass.:Newbury House Publishers, 91 - 101.Nunan, D. 1989 Designing Tasks for the communicativeClassroom. Cambridge University Press.Oller, J. 1979 Language Tests at School. Longman.Oller, J. (Ed) 1983 Issues in Language Testing Research.Rowley, Mass.: Newbury House Publishers.Oller, J. and Hinofotis, F. 1980 "Two mutually exclusivehypotheses about second language ability: factor analyticstudies of a variety of language tests." In Oller, J. andPerkins, K. (Eds) 1980 Research in Language Testing.Rowley, Mass.: Newbury House Publishers, 13 - 33.Oller, J. and Perkins, K. (Eds) 1980 Research in LanguageTesting. Rowley, Mass.: Newbury House Publishers.oxford, R. 1987 "Comprehensive English Language Test.1I InAlderson, J. C., Krahnke, K. J. and Stansfield, C. w.(Eds) 1987 Reviews of English Language Proficiency Tests.TESOL, 22 - 24.Palmer, A. S. 1981 "Measurements of reliability andvalidity of two picture-description tests of oralcommunication." In Palmer, A. S., Groot, P. J. M. andTrosper, G. A. (eds) 1981 The Construct Validation ofTests of Communicative Competence. Washington D.C.:TESOL, 127 - 139.
404
Palmer, A. S., Groot, P. J. M. and Trosper G. A. (Eds)1981 The Construct validation of Tests of CommunicativeCompetence. Washington D.C.: TESOL.Pendergast, T. M. "OLAF N.73: A Computerized OralLanguage Analyser and Feedback System." In Lee, Y. P.(Ed) 1985 New Directions in Language Testing. PergamonInstitute of English, 101 - 107.Perren, G. E. 1968 "Testing Spoken Language: SomeUnresolved Problems." In Davies, A. (Ed) 1968 LanguageTesting Sympo§ium. Oxford University Press, 107 - 116.Perrett, G. 1990 "The Language Testing Interview: AReappraisal." In de Jong, J. H. A. L. and stevenson, D.K. (Eds) 1990 Indiyidualizing the Assessment of LanguageAbilities. Philadelphia, Multilingual Matters, 225 - 238.Pienemann, M., Johnston, M., and Brindley, G. 1988"Constructing an Acquisition-Based Procedure for SecondLanguage Assessment." Studies in Second LanguageAcguisition 10, 217 - 234.Pollitt, A. 1991 "Response to Charles Alderson's Paper:"Bands and Scores''''In Alderson, J. C. and North, B.(Eds) 1991 Language Testing in the 1990s. Modern Englishpublications and the British council, 87 -94.Pollitt, A. and Hutchinson, C. 1987 "Calibrating gradedassessments: Rasch partial credit analysis of performancein writing." Language Testing 4, 1, 72 - 92.Porter, D. 1991 "Sex, Status and style in the Interview."In Caudery, T. (Ed) 1991 New Thinking in TEFL. Universityof Aarhus Press, 117 - 128.Quinones, J. (no date) "Independent rating in oralproficiency interviews." Central Intelligence Agency.Rea, P. and Wall, D. 1988 "Summary of Discussion." InHughes, A., Porter, D. and Weir, C. (Eds) 1988 ResearchReport l(ii) ELTS validation project: Proceegings of aconference held to consider the EUTS validation ProjectReport. The British council/University of Cambridge LocalExaminations Syndicate, 69 - 72.Read, J. A. S. (Ed) 1981 Directions in Language Testing(Anthology Series 9) RELC: Singapore University Press.Reschke, C. 1984 "Oral Proficiency Testing: Meeting aVariety of Needs." Pie Unterrichtspraxis 17, 4, 265 -278.Reves, T. 1980 "The group-oral test: an experiment."English Teachers' Journal 24, 19 - 21.
405

Reves, T. 1991 "From Testing Research to EducationalPolicy: A Comprehensive Test of Oral Proficiency." InAlderson, J. C. and North, B. (Eds) 1991 Language Testingin the 1990s. Modern English Publications and the BritishCouncil, 178 - 188.Richards, J. C. (Ed) 1974 Error Analysis. Longman.Rixon, S. 1992 "English and other languages for youngerchildren: practice and theory in a rapidly changingworld." Language Teaching 73 - 93.Rodriguez, M. C. 1984 "The Current Status of the OPI inIntensive Language Programs." Paper presented at theAnnual Meeting of the Southwest Conference on theTeaching of Foreign Languages. Colorado Springs: CO.Ross, S. and Berwick, R. 1990 "The Discourse ofAccommodation in Oral Proficiency Examinations." Paperpresented at the AILA conference, Greece.Sacks, H., Schegloff, E., and Jefferson, G. (1974) "Asimplest systematics for the organization of turn-takingfor conversation." Language 50, 4, 696 - 735.savignon S. J. 1972 Communicative competence; anexperiment in foreign language teaching. Philadelphia:The Center for Curriculum Development.Savignon, S. J. 1985 "Evaluation of communicativecompetence: the ACTFL Provisional Proficiency Guidelines.Modern Language Journal 69, 2, 129 - 134.Schulz, R. A. 1986 "From achievement through proficiencythrough classroom instruction: some caveats." ModernLanguage Journal 70, 4, 373 - 379.Scott M. L. 1986 "Student affective reactions to orallanguage tests." Language Testing 3, 1, 99 - 118.Seliger, H. W. 1980 "utterance planning and correctionbehaviour: its function in the grammar constructionprocess for second language learners." In Dechert, H. andRaupach, M. (Eds) 1980 Towards a Cross-LinguisticAssessment of Speech Production. Frankfurt: Peter Lang.Seliger, H. W. and Long, M. (Eds) 1983 Classroom orientedResearch in Second Language Acguisition. Rowley, Mass.:Newbury House Publishers.Sheorey, R. 1986 "Error perceptions of native-speakingand non-native speaking teachers of ESL." EnglishLanguage Teaching Journal 40, 4, 306 - 312.
406

Shohamy E. 1980 "Students' attitudes toward tests:affective considerations in testing." Paper presented atthe Fourteenth Annual TESOL Convention, San Francisco.Shohamy E. 1982 "Affective considerations in languagetesting. Modern Language Journal 66, 13 - 17.Shohamy E. 1983a "Interrater and intrarater reliabilityof the oral interview and concurrent validity with clozeprocedure in Hebrew." In Oller, J. W. (Ed) Issues inLanguage Testing Research Rowley, Mass.: Newbury House,229 - 236.Shohamy, E. 1983b "The stability of oral proficiencyassessment in the oral interview procedure." LanguageLearning 33, 4, 527 - 540.Shohamy, E. 1988 "A Proposed Framework for Testing theOral Language of Second/Foreign Language Learners."Studies in Second Language Acguisition 10, 165 - 179.Shohamy, E. 1990 "Language testing priorities: adifferent perspective." Foreign Language Annals 23, 5,385 - 394.Shohamy, E. 1991 "Discourse Analysis in LanguageTesting." Annual Reyiew of Applied Linguistics 115 - 128.Shohamy, E., Gordon, C., Kenyon, D. M. and Stansfield, C.W. 1989 "The development and validation of a semidirecttest for assessing oral proficiency in Hebrew. Bulletinof Hebrew Higher Education 4, 1, 4 - 9.Shohamy E., T. Reves and Y. Bejarano 1986 "Introducing anew comprehensive test of oral proficiency. EnglishLanguage Teaching Journal 40, 212 - 220.Shohamy, E., Shmueli, D., and Gordon, C. 1991 "Thevalidity of concurrent validity of a direct vs. semi-direct test of oral proficiency. Paper presented at the13th Language Testing Research Colloquium, EducationalTesting Service, Princeton.Shohamy E. and Stansfield, C. W. 1990 "The HebrewSpeaking Test: An example of international cooperation intest development and validation." In de Jong, J. H. A. L.(Ed) Standardization in Language Testing: AILA Review,Amsterdam: Free University Press.Silverman, D. 1976 "Interview talk: bringing off aresearch instrument." In Silverman, D. and Jones, J.(Eds) 1976 Organizational Work; the language of grading,the grading of language. London: Collier Macmillan, 133 _150.
407

Silverman, D. and Jones, J. 1976 Organizational Work: thelanguage of grading, the grading of language. London:Collier Macmillan.Skehan, P. 1987 "Variability and Language Testing." InEllis, R. (Ed) 1987a Second Language ACQuisition inContext. Prentice Hall, 195 - 206.Skehan, P. 1988 "Language Testing: Part 1." Langyag~Teaching 211 - 221.Skehan, P. 1989 "Language Testing: Part 2." ~angyag~~~aQhing 1 - 13.Skehan, P. 1991 "Progress in Language Testing: the1990s." In Alderson, J. C. and North, B. (Eds) 1991Language Testing in the 1990s. Modern EnglishPublications and the British Council, 3 - 21.Sollenberger, H. E. 1978 "Development and Current Use ofthe FSI Oral Interview Test." In Clark, J. L. D. (Ed)1978a DireQt testing of speaking profiQienQY: theory andappliQation. Princeton, N. J.: Educational TestingService, 1 - 12.stansfield, C. W. (Ed) 1986 Technology in LangyageTesting. Washington DC: TESOL.Stansfield, C. W. 1989 Simulated Oral ProfiQienQYInterviews. ERIC Digest. Washington, DC: ERICClearinghouse for Languages and Linguistics and theCenter for Applied Linguistics.Stansfield, C. W. 1990a "An evaluation of simulated oralproficiency interviews as measures of spoken languageproficiency." In Alatis, J. E. (Ed) 1990 Linguistics,language teaQhing and language aQQyisition: TheinterdependenQe of theory, praQtiQe and researQh.Georgetown University Round Table on Languages andLinguistics. Washington D.C.: Georgetown UniversityPress, 228 - 234.stansfield, C. W. 1990b "The development and validationof the Portuguese Speaking Test." Hispania 73, 3, 641 -651.Stansfield, C. W. and Kenyon, D. M. 1988 pevelopment ofthe Portuguese Speaking Test. Alexandria, VA: ERICDocument Reproduction Service, ED 296 586.stansfield, C. W. and Kenyon, D. M. 1989 pevelopment ofthe Hausa, Hebrew and Indonesian speaking tests.Washington DC: Center for Applied Linguistics.
408

Stansfield, C. W. and Kenyon, D. M. 1992 "Comparing theScaling of Speaking Tasks by Language Teachers and by theACTFL Guidelines." Paper presented at the 14th annualLanguage Testing Research Colloquium, Vancouver, BC.Stevenson, D. K. 1981 "Beyond faith and face validity:the multitrait-multimethod matrix and the convergent anddiscriminant validity of oral proficiency tests." InPalmer, A. S., Groot, P. M. J. and Trosper, G. (Eds) 1981The Construct validation of Tests of Communicativecompetence. Washington D.C.: TESOL, 37 - 61.Stevenson, D. K. 1985a "Authenticity, validity and a teaparty." Language Testing 2, 1, 41 - 47.Stevenson, D. K. 1985b "Pop Validity and PerformanceTesting." In Lee, Y. P. (Ed) 1985 New Directions inLanguage Testing. Pergamon Institute of English, 111 -118.Sunderland, J., Yixing, Z., and Barr, B. 1988 "To be anexplainer: a reporting test of oral proficiency." EnglishLanguage Teaching Journal 42, I, 28 - 33.Tarone, E. 1983 "On the variability of interlanguagesystems." Applied Linguistics 4, 2, 146 - 163.Tarone, E. 1985 "Variability in interlanguage use: astudy of style-shifting in morphology and syntax."Language Learning 35, 3, 373 - 403.Tarone, E. 1990 "On Variation in Interlanguage: AResponse to Gregg." Agplied Linguistics II, 4, 392 - 400.Test of Spoken English 1990 Manual for Score Users.Princeton, N. J.: Educational Testing Service.Underhill, N. 1982 "The great reliability validity trade-off." In Heaton, J. B. (Ed) 1982 Language Testing. ModernEnglish Publications, 17 - 23.Underhill, N. 1987 Testing $poken Language; A handbook oforal testing technigues. Cambridge University Press.Upshur, J. A. 1971 "Objective evaluation of oralproficiency in the ESOL classroom." TESOL Quarterly 5, 47- 59.Valdman, A. 1988 "The Assessment of Foreign Language OralProficiency: Introduction." $tudies in $econd LanguageAcquisition 10, 2, 221 - 128.Valette, R. 1977 Modern Language Testing. Harcourt BraceJovanovich.
409

van Lier L. 1989 "Reeling, Writhing, Drawling,Stretching, and Fainting in Coils: Oral ProficiencyInterviews as Conversation." TESOL Quarterly 23, 3, 489 -508.
van Patten, B. 1986 "The ACTFL Proficiency Guidelines:Implications for Grammatical Accuracy in the Classroom?"Studies in Second Language Acquisition 8, 56 - 57.
van Weeren, J. 1981 "Testing oral proficiency in everydaysituations." In Klein Braley, C. and Stevenson, D. K.(Eds) 1981 Practice and Problems in Language Testing.Volume 1, Frankfurt/Bern, 54 - 59.
Vollmer, H. J. 1983 "The Structure of Foreign LanguageCompetence." In Hughes, A. and Porter, D. (Eds) 1983Current Deyelopments in Language Testing. London:Academic Press, 3 - 30.Vollmer, H. J. and Sang, F. 1983 "Competing hypothesesabout second language ability: a plea for caution." InOller, J. W. (Ed) 1983 Issues in Language TestingResearch Rowley, Mass.: Newbury House, 29 - 79.
Weir, C. 1988 Communicative Language Testing. Universityof Exeter.Wilds, C. 1975 "The oral interview test." In Jones, R. L.and Spolsky, B. (Eds) 1975 Testing Language Proficiency.Arlington Va: Center for Applied Linguistics, 29 - 44.
Wilds, C. 1979 "The measurement of speaking and readingproficiency in a foreign language." In Adams, M. L. andFrith, J. R. (Eds) 1979 Testing Kit; French and Spanish.Department of state: Foreign Services Institute, 1 - 12.
Wilkinson, A. 1968 "The Testing of Oracy." In Davies, A.(Ed) 1968 Language Testing Symposium. Oxford UniversityPress, 117 - 132.
Wilkinson, L. 1988 SYSTAT; The system for Statistics.Evanston, IL: Systat Inc.Winter, E. o. 1978 "A look at the role of certain words1n information structure." In Jones, K. P. and Horsnell,V. (Eds) 1978 Informatics 3. London: ASLIB, 86 - 97.
Woods, A. 1983 "Principal components and factor analysisin the investigation of the structure of languageproficiency." In Hughes, A. and Porter D. (Eds) 1983Current Deyelopments in Language Testing. London:Academic Press, 43 - 52.
Wright, B. D. and Masters, G. N. 1982 Rating ScaleAnalysis; Rasch Measurement. Chicago: MESA Press.
410

Wright, T. 1987 "Instructional Task and DiscoursalOutcome in the L2 Classroom." In Candlin C. and Murphy,D. F. (Eds) 1987 Language Learning Tasks. LancasterPractical Papers in English Language Education~ PrenticeHall, 47 - 68.Yorozuya, R. and Oller, J. 1980 "Oral Proficiency Scales:Construct Validity and Halo Effect." Language Learning30, I, 135 - 153.Young D. 1986 "The Relationship Between Anxiety andForeign Language Proficiency Ratings. Foreign LanguageAnnals 19, 5, 439 - 445.Zappala, S. P. J. 1979a IIElicitation techniques forhigher levels." In Adams, M. L. and Frith, J. R. (Eds)1979 Testing Kit: French and Spanish. Department ofstate: Foreign Services Institute, 50 - 62.Zappala, S. P. J. 1979b IIInterpreter situations.I' InAdams, M. L. and Frith, J. R. (Eds) 1979 Testing Kit:French and Spanish. Department of State: Foreign ServicesInstitute, 111 - 117.
411

Appendix to Chapter Two
Table 2.1. Correlation coefficients of the ratings of twojudges for the FSI global and component scores (Clark andSwinton, 1980)
Rater 1Rater 2 Global Prone Grammar Vocab. Fluency CompoGlobal .79 .63 .82 .70 .72 .82Pronunciation .58 .59 .57 .46 .52 .54Grammar .77 .58 .80 .67 .66 .79Vocabulary .72 .52 .76 .64 .66 .75Fluency .70 .55 .71 .62 .65 .75Comprehension .70 .52 .73 .63 .67 .76---------------------------------------------------------Table 2.2. Correlation coefficients of the ratings of twogroups of raters for the FSI global and component scores(Hendricks et. al., 1980).
Group 1Global
Group 2Global Prone Grammar Vocab. Fluency Compo
.91Pronunciation .43Grammar .83VocabularyFluency
.85.80
Comprehension .89---------------------------------------------------------Table 2.3. The relationship between ACTFL scores andyears of study (Magnan, 1986a)
Year Range Median1st. Year2nd. Year3rd. Year4th. Year
N-mid - I-mid/highI-low - AdvancedI-mid/high - Adv/Adv+I-mid - Adv+
I-low/midI-midI-high/AdvAdvanced
412

Table 2.4. FSI rating components reported to discriminateat each level in the FSI rating scale (Adams, 1980).---------------------------------------------------------FSI level Discriminating factors in descending
order of significance---------------------------------------------------------0+ - 1 Vocabulary
1+ - 2
FluencyComprehensionGrammarVocabularyComprehensionGrammarAccentFluency
1 - 1+
2 - 2+ FluencyComprehensionAccentVocabulary
2+ - 3 GrammarAccentVocabularyComprehension
3 - 3+ ComprehensionFluencyGrammar
3+ - 4 VocabularyAccentGrammar
4 - 4+ GrammarVocabulary---------------------------~-----------------------------
Table 2.5. Correlations between the TSE component ratingscales and the FSI Oral Proficiency Interview (Clark andSwinton, 1980: 19).---------------------------------------------------~-----TSE FSI Total Score---------------------------------------------------------PronunciationGrammarFluencyComprehension
.77
.73
.76
.76---------------------------------------------------------
413

Table 2.6. Correlations between the SOPIs and the OPI(Stansfield, 1990a: 231)
Same Rater Separate Raters AverageChinese .96 .90 .93Portuguese .93 .93 .93Hebrew (USA Version) .93 .96 .92Hebrew (Israeli Version) .95 .94 .93Indonesian .98 .94 .93Hausa .91 .8 .84
Table 2.7. A Multitrait-Multimethod Validation matrixwith skills as trait and rater/item type as method: M/C =Multiple choice, O/E = open ended. (Dandonoli andHenning, 1990).---------------------------------------------------------
Speaking Writing Listening ReadingRatA RatB RatA RatB M/C O/E M/C O/E
RA 1.00Speaking
RB ..:...2.Z 1.00RA .85 .86 1.00
WritingRB .92 .88 ~ 1.00M/C .80 .79 .77 .80 1.00
ListeningO/E .76 .71 .74 .77 .a...8..4 1.00M/C .83 .79 .80 .82 .92 .85 1.00
ReadingO/E .76 .75 .78 .79 .86 .76 ~ 1.00---------------------------------------------------------
Table 2.8. Means and Standard Deviations of EstimatedPerson abilities on a single test of speaking associatedwith ACTFL oral proficiency levels (Dandonoli andHenning, 1990).---------------------------------------------------------Proficiency N Mean S.E.---------------------------------------------------------Novice Low 1 n.a n.aNovice Mid 6 -3.50 0.51Novice High 2 -1.25 0.41Intermediate Low 24 -2.16 0.35Intermediate Mid 27 -0.70 0.16Intermediate High 29 -0.05 0.13Advanced 14 1.36 0.18Advanced Plus 8 2.32 0.29Superior 7 3.97 0.53---------------------------------------------------------
414

Appendix to Chapter Four
Table 4.1. Frequency distribution of scores on the ELTStest.Band 9 I (1)Band 8 I (1)Band 7 IIII (4)Band 6 IIIIIIII (8)Band 5 IIII (4)Band 4 III (3)
Table 4.2. Multivariate test results for prediction fromeight explanatory categories of Fluency to ELTS scores.Categorial Variable
Band ScoresWilks' Lambda
0.02F df
2.06 32, 34P
0.021st Discriminant Function X2 = 52.9032nd Discriminant Function X2 = 27.704
p = .00p = .14---------------------------------------------------------
Table 4.3. Spearman Rho for individual explanatorycategories of Fluency and ELTS scores.---------------------------------------------------------category 1 2 3 4 5 6 7 8
ELTS Scores -.23 .40 -.60 .63 -.38 -.17 .15 -.83---------------------------------------------------------Table 4.4. Means for students scoring different bands forexplanatory category 1 in the definition of fluency.---------------------------------------------------------BandsMean
12.67
20.50
30.63
40.50
54.50---------------------------------------------------------
Table 4.5. Means for students scoring different bands forexplanatory category 2 in the definition of fluency.---------------------------------------------------------BandsMean
112.33
219.25
328.38
439.50
513.00----------------------~----------------------------------
Table 4.6. Means for students scoring different bands forexplanatory category 3 in the definition of fluency.---------------------------------------------------------BandsMean
116.67
215.50
38.75
46.00
52.00-------------------~---~---------------------------------
415

Table 4.7. Means for students scoring different bands forexplanatory category 4 in the definition of fluency.BandsMean
11.67
22.00
35.38
48.75
51.00
Table 4.8. Means for students scoring different bands forexplanatory category 5 in the definition of fluency.BandsMean
15.33
25.75
36.00
43.25
51.00
Table 4.9. Means for students scoring different bands forexplanatory category 6 in the definition of fluency.BandsMean
19.00
49.25
50.50
Table 4.10. Means for students scoring different bandsfor explanatory category 7 in the definition of fluency.
212.75
312.00
---------------------------------------------------------BandsMean
10.67
22.25
43.00
50.00---------------------------------------------------------
32.50
Table 4.11. Means for students scoring different bandsfor explanatory category 8 in the definition of fluency.---------------------------------------------------------BandsMean
15.67
25.75
30.50
40.00
50.00---------------------------------------------------------
4.12. A sample coded transcript.In the following transcript, the categories of
Fluency listed on pages 135 - 149 are given betweenslashes. The notation "/3/" would therefore indicategrammatical planning hesitation. "A>" indicates thespeech of the interviewer and "B>" the speech of thestudent.
utterances enclosed by square brackets indicatesspeech overlap, while round brackets indicate noises, theremoval of identifying information or sections of
416

inaudible speech.The oral interview in which this sample was
collected consisted of an introductory phase in which thestudent was put at his/her ease through the use ofgeneral questions about home or work, followed byquestions on a text which had been read previously. Afterthis, students are asked about their future plans,followed by a brief wind-up, mainly involving leavetaking.
When reading the following transcript it must beremembered that the researcher was present at the oralinterview, and when coding the transcript was workingwith audio recordings of the interview data.
Interyiew 8; ELTS Medical Module; Band 7A> Hello:: I'm (NAME) B> I'm (NAME) not (NAME) A> (NAME)(yes B> yeah] A> that's what that's what I've got that's[what B> ah] A> that's what I said (the B> but] theycalled me (NAME) A> ah yeah they it was the the personwho I asked him to call you but er never mind: anyway Iunderstand you're a pharmacist B> yeah A> is that righttell me something about your work B> ah: erm /2/ I workat I don't know if you know Cyprus at all A> yes I do B>I work at (NAME) hospital A> hm m B> and I work as apharmacist as a hospital pharmacist we are threepharmacists there we actually erm /2/ dispense medicinesand er: /4/ of course we have other things likepreparing; some kinds of medicines the (inaudible) A>
417

yeah B> sceptic solution: A> hm: so it's generallydealing with drugs in the hospital that B> yeah and ofcourse we supply the medicines to most other wards andcasualty and we're actually responsible: A> yeah so youhave to check to make sure that none of them go missingB> yeah but their expiry dates erm: /4/ if they're keptwell if they're kept properly A> yeah it sounds veryinteresting is (NAME) a big hospital B> no actually itit's a small one A> hm: right but you you live out therein (NAME) B> I have to (laughter) A> yeah B> because I amer: I am /2/ on call every other day A> yeah B> er but II /4/ come from Nicosia A> hm so you would you like totransfer to Nicosia General if [you B> yeah] were givenhalf [the chance B> for sure] A> or Makarios probablyeven nicer B> yes [(laughter)] A> yeah because Makariosis a modern hospital whereas Nicosia is beginning to fallto bits B> yes A> a little isn't it B> one of the moster: /3/ it's the most A> yeah okay B> but I'm interestingin drug quality control A> hm: okay well I'll ask youabout that in a in a few minutes B> ah A> but you youchose to do the medicine the medical version this morningB> (laughter) yes A> so I'm going to ask you to haveanother look at this could you turn to page one it's thevery first page in there B> first page yeah A> yeah youremember reading this this morning very [quickly B> yes]A> I guess B> very very quickly [(laughter)] A> yeah B>that was the trick A> okay well this was about plutoniumin the body: and I'm going to have to ask you about this
418

diagram here er again: in the bottom left hand side lefthand corner down here there's a box with an X in it: myfirst question is can you identify what X [is B> bones]A> the bones B> yeah A> okay can you tell me how thebones how how it how it's related to the rest of thediagram I mean what happens to plutonium and how it getsinto the bones and so on B> ah: er /2/ plutonium entersthe body through inhalation: okay A> hm hm B> I startfrom the beginning [(laughter A> okay] B> erm /2/ then itgoes to the digestive system A> hm hm B> and to the(inaudible) lungs some in the lungs:: /2/ from the lungsit goes er /2/ through the reticuloendothelial system A>hm which is: [what B> erm] /2/ A> does that what does itmean that word B> well ah it's a system that er /2/ hasto do with erm: /5/ fibrocytosis: A> no you're going tohave to explain for me B> erm: consisted for from er: /2/cells A> hm hm B> that actually are responsible for er:/6/ to take: er foreign material A> hm hm B> out of thebody erm /4/ and this is done: er /2/ when they put intothe circulation A> okay right B> (laughter) A> I thinkI've got that B> yeah: and er /2/ from that system goesto the blood A> hm hm B> and from the circulation: er /2/to bones kidneys and the liver A> yes okay how's erm: youyou said that that plutonium was taken into the bodythrough inhalation B> yeah A> yeah: does that mean to saythat plutonium is in the air:: [I mean we breathe it inB> there is some] there: yes plutonium exists there invery small quantities very small quantities A> but not
419

enough to damage us: B> oh no I don't think so A> hm B>except if you live near or next to nuclear reactors whereplutonium [(laughter)] A> yes but we don#t have anynuclear reactors in Cyprus B> no A> so this is not aproblem that would come up in: would you you we wouldfind in Cyprus at all B> no no A> if erm let's imaginethat you did come across a case like this B> yes A> whatkind of drug would you treat it with would you treat itwith drugs at all: B> drugs A> yes B> I mean do you meanplutonium poisoning A> yeah:: B> the symptoms yes: A> hmB> but not actually not the er: /4/ the real disease A>hm what what would the symptoms be B> oh: it might besymptoms of er: radiation exposure like diarrhoeavomiting A> hm B> headaches and er: /4/ ataxia erm:: /4/convulsions sweating A> it sounds pretty horrible B> yeahit is [(laughter)] A> okay well I'll leave that now I Iwon't I won't press you any farther on plutoniumpoisoning the course you're going to going to you want totake in England I I presume B> yeah A> yeah what what isit B>it's a course on I'm not sure because er /7/ it saysunited Kingdom or or Denmark Denmark /7/ I think A> sorryI I didn't B> er it was for united Kingdom or Denmark A>or Denmark B> yeah A> so you don't know which one you'regoing to B> no A> do you speak Danish B> no (laughter) A>probably the united Kingdom well unless of course they[teach B> many] teach A> yeah [they might B> (inaudible)]A> teach [it B> yeah] A> in En in En in English inDenmark but but you don't know where you're going to do
420

it B> no not [yet A> no] hm how about the the courseitself quality control: drugs B> yeah A> well what doesit involve B> erm: ah /2/ first we've to control drugs A>hm B> ah you want me to say what we mean by qualitycontrol [something A> yeah] B> like that A> please B> wemean ah: we mean /2/ (inaudible) and testers tests whichare used to to determine the density purity potencyquantity and of course quality of pharmaceuticalpreparations A> okay I I thought that most pharmaceuticalpreparations they were produced by companies B> yeah A>and then they were sold I mean does this mean to saythat: say you were going to buy a drug from an Englishcompany or a company from the states: but when it came tocyprus you you would have to check it first: before youactually used it in Cyprus [or are B> or yeah] A> youchecking the quality of [drugs produced B> the firsttime] A> in Cyprus B> yes A> [I mean erm: B> (inaudible)]A> quality of what I mean [to say (inaudible) B> I meanall] pharmaceutical companies have their own: er /2/quality control departments A> yeah B> they check theirproducts for their quality but er all products registeredand sold in the Cyprus market: /2/ they are first checkedfrom their quality and then registered here A> right B> Imean: for the first time A> that sounds sensible B> yeahA> hm B> and of course: /4/ I mean the government(inaudible): er er /2/ has two pharma two: erm /5/ labstwo laboratories the pharmaceutical laboratories and thechemical state laboratory A> hm B> in the pharmaceutical
421

laboratory are checked are checked er /6/ products for(inaudible) A> hm B> you see and: erm also on erm: /4/medicines bought by the government for the use of to beused in /6/ the hospitals A> hm it sounds like veryinteresting work B> it is A> quite [fascinating B> yeah]A> erm B> has to do with chemical reactions A> yeah hm:yes it it's fascinating I think it's much more it's muchmore interesting than being involved in this side ofhospital work than perhaps er you know the medicalpractitioners going around and seeing patients and thingsI mean I would find this more [fascinating B> yes it's]more fascinating A> yeah: but are yeah it's B>fascinating with chemical reactions er: /1/ A> yeah B>erm: /4/ has to do with photometric methods [and A> hm:]B> (inaudible) A> yeah: okay well I don't think I need toask you anything else B> yeah A> unless you have anythingto ask me B> (laughter) no A> (laughter) [okay B> do you]live in Cyprus A> yes I do B> really A> yes B> oh Ithought you were coming from England A> well yes I I am Iam English because all all examiners for this have to beEnglish but I've lived in Cyprus for: almost nine yearsnow B> you like it A> of course I'm more Cypriot thanEnglish now (laughter) [I'm B> you] don't speak Greek doyou A> yes I do B really A> yes my wife er is a CypriotB> oh A> as well and [er B> because it's a very verydifficult language A> not particularly no it's very rulegoverned: erm so once you get the hang of the rulesyou're okay B> (laughter) A> but er: er no I've never
422

I've [never B> (inaudible)] A> yeah I mean it's very it'sa nice language but er no I've never worked in Englandand I feel er I I all my working life has been in CyprusB> oh A> I I know Cyprus better than I know England[(laughter)] anyway er B> did I pass the exams A> can'ttell you that [(laughter) B> yeah] A> because of course Idon't know erm B> well I mean your part A> oh: (laughter)you're you're a good speaker: I I mean I shouldn't worrytoo much: but for the rest of it I don't know B> yeah A>I don't mark the rest of it B> thank you very much A>okay bye B> bye
CategoryTally
1 2o 18
3 41 10
52
63
72
8o
423

Appendix to Chapter Five
Table 5.1. Correlation of error scores---------------------------------------------------------Cat1 Cat2 Cat3 Cat4 Cat5 Cat6 Cat7 Cat8
Cat2 .01Cat3 .44 .36Cat4 .37 .03 .43Cats .21 -.26 -.01 .38Cat6 .30 .18 .36 .49 .16Cat7 .15 .19 .75 .44 .20 .23Cat8 .59 .34 .68 .41 .12 .23 .52Cat9 .31 -.11 .46 .25 .24 .44 .36 .41---------------------------------------------------------Table 5.2. Principal Components solution with VarimaxRotation for the initial study into possible categoryreduction.Unrotated extraction:Eigenvalue 3.71 1.53% of varianceexplained 41.23 16.96---------------------------------------------------------Factor 1 2Category 1 .63 .15category 2 .24 -.79Category 3 .84 .34category 4 .68 .27category 5 .27 .76Category 6 .62 .02Category 7 .72 -.13Category 8 .80 -.20Category 9 .68 .25---------------------------------------------------------Table 5.3. Multivariate test results in the discriminantanalysis of lexical and grammatical accuracy.---------------------------------------------------------categorial variable Wilks' Lambda F df P
Band scores .304 4.34 6,32 .003---------------------------------------------------------1st Discriminant Function X2 = 34.592nd Discriminant Function X2 = 9.45
p = .00p = .14
424

Table 5.4. Types of utterances in turns as a percentageof the total number of turns.---------------------------------------------------------ELTS BandScore
Total No. Single wordof turns turns as %
of turns
Fillers as Backchannels% of single as % ofword turns single word
turns
768665555647666746947
912938587059806352504544749555473955433353
38.5038.0018.4337.9335.7138.9837.5047.8657.6932.0044.4450.0045.9535.7940.008.51
23.0854.5520.9336.3615.09
2.860.000.000.00
12.0013.046.673.70
46.676.250.000.005.880.000.000.000.006.670.00
25.0012.50
28.579.09
42.8613.6428.008.700.000.000.00
25.000.00
13.6420.5926.4750.000.000.00
20.0022.220.000.00---------------------------------------------------------
Table 5.5. Multivariate test results in the discriminantanalysis of single word turns and backchanneling.
Categorial variable Wilks' Lambda F df P
Band scores .384 5.22 4,34 .002
Table 5.6. Multivariate test results in the discriminantanalysis of use of lexis.
Categorial variable Wilks' Lambda F df p
Band scores .107 3.0 15,36 .003
425

Table 5.7. Mean of total number of words, unique wordsand word forms by band.
Band 1 Band 2 Band 3 Band 4Total number of wordsNumber of unique wordsNumber of word forms
394.5791.00
152.29616.25116.63214.75
632.75140.50238.25
607.50112.50214.50
Table 5.8. Spearman Rho for individual categories ofAccuracy and ELTS scores.category 1 2 3 5 74 6 8 9
ELTS Scores .02 .09 -.26 -.28 -.30 -.03 .11 -.38 -.31
Table 5.9. Means for students scoring different bands forcategory 1 in the definition of accuracy.BandsMean
10.86
40.50
21.00
30.75
Table 5.10. Means for students scoring different bandsfor category 2 in the definition of accuracy.BandsMean
11.14
22.63
40.00
30.75
Table 5.11. Means for students scoring different bandsfor category 3 in the definition of accuracy.BandsMean
14.86
24.75
32.75
41.00
Table 5.12. Means for students scoring different bandsfor category 4 in the definition of accuracy.BandsMean
12.86
40.00
25.62
31.50
Table 5.13. Means for students scoring different bandsfor category 5 in the definition of accuracy.---------------------------------------------------------BandsMean
11.57
21.75
30.75
40.00---------------------------------------------------------
426

Table 5.14. Means for students scoring different bandsfor category 6 in the definition of accuracy.BandsMean
12.71
23.75
33.00
41.50
Table 5.15. Means for students scoring different bandsfor category 7 in the definition of accuracy.BandsMean
12.57
22.25
32.00
40.00
Table 5.16. Means for students scoring different bandsfor category 8 in the definition of accuracy.BandsMean
14.29
23.13
32.00
41.00
Table 5.17. Means for students scoring different bandsfor category 9 in the definition of accuracy.---------------------------------------------------------BandsMean
12.57
21.38
30.50
40.50
427

Table 5.18. Rank orders on 7 studies for five grammaticalmorphemes.---------------------------------------------------------study Plural Progressive
(-s) (-ing)Past Possessive 3rdirr. person
(-s)de Villiers&de Villiers(1973)
1 2 3 4 5
Dulay & Burt(1973)
1 2 3 4 5
Dulay & Burt(1974)
2 1 3 5 4
Baileyet. al(1974)
2 1 3 5 4
Larsen-Freeman 2(1975a)
1 5 3 4
Larsen-Freeman 2(1975b)
1 4 3 5
Fulcher 1 3 2 5 4---------------------------------------------------------
428

Table 5.19. Disconfirmation matrix for eight aspects ofgrammar.---------------------------------------------------------
1 2 3 4 5 6 7 8
1. o 9.52 4.76 4.76 7.14 o 8.33Pronouncase
2. 19.05contractedcopula
o 4.76 o 6.66 o 18.18
3. 25.00 0 18.18 7.69 8.33 0 11.11plural(-es)
4. 33.33 0 20.00 13.33 6.66 9.09 25.00past irr.
5. 28.57 4.76 23.81 9.52 13.33 6.25 15.38plural(-s)
6. 61.91 11.76 47.62 42.86 33.33 7.14 66.66article
7. 52.94 47.06 32.29 11.76 30.77 16.66 60.00progressive(-ing)
8. 60.00 16.67 40.00 43.75 14.29 9.09 85.963rd person(-s)----------~----------------------------------------------
429

Table 5.20. stair matrix for eight aspects of grammar1 2 3 4 5 6 7 8
1. pronoun case (10) + + + + + +
2. contracted + + + + +copula
3. plural + (10) +(-es)
4. past irr. + (10)5. plural (-s) +
6. article (10)7. progressive
(-ing)8. 3rd person
(-s)---------------------------------------------------------5.21. A sample coded transcript.
In the following transcript, the categories of errorlisted on pages 191 - 197 are given between slashes. Thenotation "/3/" would therefore indicate an error intense. "A>" indicates the speech of the interviewer, "B>"the speech of the student and ne>" the speech of a secondrater.
utterances enclosed by square brackets indicatesspeech overlap, while round brackets indicate noises, theremoval of identifying information or sections ofinaudible speech.
The oral interview in which this sample wascollected consisted of an introductory phase in which thestudent was put at his/her ease through the use ofgeneral questions about home or work, followed by
430

questions on a text which had been read previously. Afterthis, students are asked about their future plans,followed by a brief wind-up, mainly involving leavetaking.
Interview 5; ELTS General Academic Module: Band 4A> I'm (NAME) I'll introduce you: (NAME) C> how do you doA> would you like to have a seat:: well: how did you findthe test this morning B> er it's /3/ : er: difficult: A>difficult: B> yes: A> how long have you been studyingEnglish B> er I study /3/ for er: ten or twelve years A>ten or twelve years at is that at: at school or B> er nooutside the /8/ school A> outside of school you tookprivate lessons:: (inaudible) B> /6/ /8/ privateinstitute A> hm hm B> for ten or twelve years: A> you'renot still at school you look older B> no I am in the armynow B> you are in the army where abouts are you: B> I wasin Limassol at Polemedia A> Polemedia: you were are youB> no I don't A> where are you now: B> now I am in thearmy: A> yes but whereabouts are you based: where do youwork in the army now B> I work in the /8/ Polemedia er:PYROVOLIKO A> the artillery B> yes A> yeah: is this a jobyou chose:: were you just put there: B> I don'tunderstand A> did you choose: to go into the artillery B>yes yes: I choose /3/ to go there because /5/ is near tomy house: and er there are more: friends: there A> yeah:what kind of things do you have to do every day B> er: erI work I work in the office in the er in the army: so
431

the: it's the same thing every day the same routine:: erI've got to go every morning to the office:: er:: I dothe work er: that my officer: showed /3/ to me to do:::the same thing every day A> yeah: do you get lots of freetime B> yes in the afternoon I didn't /3/ have anythingto do: I play basketball: in the army A> hm hm B> erfootball: or do doing /3/ some er: exercise /7/ in thefields A> hm hm: oh it it sounds as if life in the armyis getting better: do you enjoy being in the army or B> Ienjoy to be /9/ in the army but er: you don't er: havethe /8/ many /9/ er time to go out to your home A> hm:B> so that is to that isn't very good A> when when do youfinish: when will you leave the army B> yes: A> when willyou [leave the army B> er when the] er about a year A>you mean there's another year to go B> yes:: A> right youremember reading this booklet earlier this morning: may Iask you to have another look at it::: can you turn topage six::: do you remember reading this passage thismorning and you had to answer some questions on it: yes:right I'm not going to ask you to read any of it againjust to it's just to remind you (inaudible) the page: canyou remember anything about what the passage said aboutcrime rate: the crime rate amongst girls B> er: I thinker: it it's er talking /4/ about the girls who is /3/ er:who are putting /3/ them /2/ behind the /8/ bars:: ander:: they do some er house er: housework: house in the/8/ Bullwood Hall::: A> is the crime rate amongst girls:presumably this is in England is it increasing or
432

decreasing do you think: B> I think er here it erincreased: /3/ A> quickly B> er not quickly A> notquickly it's going up fairly slowly B> yes A> yeah: canyou think of any reasons why the crime rate amongst girlsis increasing at this speed: B> it is increasing becauseer: the family of the: the families of the girls had er:are not er show /3/ them the right er way of life: ander: they don't have any works /7/ to do: so the this /2/people er: take the get /4/ to the this bad way of life:so the the crime inc increases A> hm so you think it's a:it starts with the family B> yes A> in this case yeah:how about in Cyprus: do you think there's a problem ofcrime amongst girls in Cyprus: B> there isn't a big ercrime (inaudible) I think there is a small A> it's smallB> some er village /7/ in er::: A> what if there's asmall amount of crime: amongst girls: what kind of crimedo you think it is:: B> the the:: er the they get to dovery er: heavy works /7/ : er in the fields er: thehouse:: they they have er they have their work they gets/3/ like er: like er: an animal /7/ A> hm B> somevillages not er: not er: town centres:: A> if er if youwere in the police force for example: what kind of actionwould you take to reduce the rate of crime: B> I will /9/er arrested /3/ the the that /2/ people who do /4/ that/2/ er crime A> hm hm B> and I will /9/ er: to not /9/er: no more er crime: not increases /3/ the the crime inthe /8/ Cyprus A> hm: but it's not a very large problemanyway [in Cyprus B> no no] A> it's fairly small I would
433

have thought:: anyway let's finish with the books okay er(inaudible) (COUGH) er let me ask you something: why areyou taking this test: what what are you thinking of doingin the future B> /5/ take /3/ the test because I wantthe: want to go to the /8/ university in England A> hm hmB> so I want to to show to the university that I havedone: passed the English er test A> er which universityare you thinking of going to: B> I think er I'll go tothe /8/ Kent University A> Kent B> yes A> and what areyou going to study: B> er computer and business studiescomputer and administration together A> why did youchoose that B> because I think that er it's the most er:it's the best work to do in Cyprus to er: to er: to havea good to find a /8/ work in Cyprus A> so so there thereare lots of positions available B> yes A> do you want towork for a company or when you come back to Cyprus B> noer my father have /3/ er: some er company /7/ : and Iwill work with er: I will continue the job of my fatherA> so everything ready when you come back: okay right Ithink we can stop there: thank you very much for comingit's very nice to meet you B> good bye A> good bye C> byebye
CategoryError tally
1o
2 34 15
43
52
61
7 86 10
95---------------------------------------------------------
434

Appendix to Chapter Six
Material used in the Three Oral Testing Tasks
435

TaskOne
436

TaskOne
437

TaskOne
438

TaskOne
- -":t' ... ""JU - a :s" -_ e :;::rr = ..' ~ == !::' .. '=:- =: J::: - ::- - - 1::'- - == - =- - --- - = r:!! - ._
"::: =e ~ :::: ~ ~ =:: :: = = - --- ..- - - --- - - -439

TaskOne
440

ITaskTwo
Population and Poverty
We can define "land" as the natural resources which provide manwith food and raw materials. and we cannot escape the fact that~:;~~:~io~:~ources are limited in relation to rapidly growing I
IIn some countries the standard of living is the same as it wascenturies ago. These countries have increased their output. buttheir populations have increased by the same amount. so that thegross national product (GNP) per capita (or per person) hasdeclined. If populations increase by the same amount as totaloutput. there is no increase in per capita income. If populationsincrease faster than output, per capita income falls.
For example. suppose Holland has a birth rate of sixteen perthousand. and in Ethiopia the figure is fifty-one. If the deathrate in Holland is ten. and in Ethiopia twenty-five. the netincrease in Holland is six per thousand (0.6%). In Ethiopia it is!Itwenty-six per thousa~d (2.6%). If both countries' economies growlby 2% per annum. Holland's standard of living will increase percapita. whereas Ethiopia's per capita standard of living will befalling.
This is one of the factors which make the gap between developedand developing countries 50 wide. and there is a danger that thisgap will continue to widen.
One solution would be to increase the productivity of land. It isoften difficult to do this. There may be climatic reasons for thedifficulty. or there may not be enough capital employed toproduce more. But whatever happened, economic growth would havel
to be greater than population growth if per capita income were toiincrease. Although countries in the Third World may take otherl
creates,important.development
thisA
is why controllingproblems
populationwhichgrowth
povertyis 50
steps which would help alleviate the
isproper population policy is necessary ifto take place.
economicII
441

1500
•e.g=e.5 1000e0";.!:tQ.00-
500
50
40
30
20
10
Task I
Two
2000
1950 1960Africa
1950 1960Asia
1950 1960Europe
1950 1960Nor1h
America
1950 1960Latin
America
1950 1960Oceania
1950 1960USSR
Fig. 1:Population
DBirth rate
• Death rate
Africa Asia Europe NonhAmerica
USSRLatinAmerica
Oceania
Fig 2 Blrth and Death Rates
442

TaskTwo
I Spare him more than just a thought. IJust ten pounds a month can help a child and Its
Icommunity provide themselves with life's basics like Ifresh water, a healthy diet and basic education.
Sponsor a child through Britain's biggest sponsor-IIship charity and you'll both see big results - solid muddams, good harvests, strong school buildings. A photo
Iand regular reports will keep you in touch. If you wish Iyou can even write and receive letters. It's almost like
Ithey're one of the family. IEvery new sponsor gives another child the chanceIof a life worth living. I
I[j Yes, I would like to sponsor a child and enclose my Ifirst contribution.o £10 (monthly) 0 £120 (yearly)I0 I can't sponsor a child, but enclose a gift of Io £200 0 £100 0 £50 0 £25 0 £__ II0 Please send more details.
IName Mr/Ms BLOCK CAPITALS I~A~d=d~re~s~s ___
I IIPostcode Tel I
Make cheques/P.O.s payable to ActionAid. Send to: TheRt. Hon. Christopher Chataway, ActionAid, Tapstone Road,IChard, Somerset TA20 2AB. I
... 11
I . ActionAid I1.- .1
443

[\'TRam '[TlO,'Cyprus has a well organised and effective system of primary,secondary and partly of further education but until recently itdid not have any accredited institutions of higher education thatcould meet even the most vital needs of the country in thisdomain.These needs were met through the attendance of students fromCyprus at various Universities abroad. The desire of the peopleof Cyprus for higher education can be seen from the fact thatthough Cyprus lacked its own universities it was, according torecent official statistics, one of the countries with, proportiona-tely. the highest number of University graduates worldwide.
Among the Greek population of Cyprus there were in the lastfew years about ten thousand students studying abroad. In theacademic year 1988-89 there were 9.410 such students. Theirdistribution in various countries was as follows: Greece 40 percent; United Kingdom 22 per cent; United States 20 per cent;Federal Republic of Germany 7 per cent; Italy 3 per cent;France 2 per cent; Austria 2 per cent; Eastern Europeancountries 3 per cent and other countries 1 per cent. Unfortuna-tely we have no corresponding data for Turkish Cypriot studentsstudying abroad
It is obvious thd! Cyprus can easily sustain its own Universityand that a Cyprus University will have beneficial consequencesfor the country not only in the economic but also in the culturaland political fields.
In light of the above considerations the Government of the Rep-ublic of Cyprus has established by law 144 of 1989 the Universityof Cyprus. The law was drafted on the basis of a Report by aPreparatory Committee in which eighteen University Professorsand other specialists from Cyprus took part. The Committeeproposed the establishment of an academically autonomousUniversity of high calibre in order to promote knowledge andlearning and thus contribute to the social, economic and culturaldevelopment of the people of Cyprus as a whole. It is alsoexpected that it will contribute towards the mutual understan-ding of the communities of Cyprus, in the cultivation of theirseveral cultures and traditions and in the consolidation of theunity of the Cyprus state.
The Council of Ministers has subsequently appointed a nine-member Interim Governing Board as well as a Secretariat forplanning and implementing the work required for the operationof the University within the stipulated timetable. The InterimGoverning Board is performing the duties of the Council andthe Senate of the University until the time that these bodies areduly constituted.
It is envisaged that the University will admit its first 440 studentsin September 1992. The annual expected increase in the studentbody is as follows: 440 (1992-3), 900 (1993-4), 1,400 (1994-5),
TaskThree
1,900 (1995-6). In its subsequent steady state the University willhave ~ total of 4,000 students.
UNIVERSITY OF CYPRUS
GENERAL INFORMATION
The University of Cyprus combines features of European andNorth American Universities adjusted to the Cyprus conditions.
Degree courses take four years subdivided into semesters.
The languages of the University are Greek and Turkish butbefore a student is admitted he or she is required to know oneinternational language. Further study of one international lan-guage will be a required component of degree courses.
444

TaskThree
Task Card: Group Discussion.
You will discuss the subject of"Education in Cyprus" for ten tofifteen minutes. You have tenminutes to prepare.
Here are some ideas for topics which youmay di~cuss if you wish. You may talle aboutother topics:
*
Quality ofeducation.Importance of education for Cypriotstudents.Is there a need for a University inCyprus? VJhy?Where should the University be built?Should the language of tuition be Greekand Turkish, or English? What are theadvantages/disadvantages?Who will attend the University?How does education eHect the Cypt'ioteconomy?
* School educa tion/prtv ate
*
**
**
445

Appendix to Chapter Seven
Table 7.1. Varimax Rotated Factor Analysis of theQuestionnaire for Task 1.---------------------------------------------------~-----Factor 1 Factor 2 Factor 3 Factor 4Q1 .23 -.25 -.06 .19Q2 .07 I .70 .21 .04Q3 .07 .71 .08 .22Q4 .02 .06 .05 .18Q5 .05 I .60 .22 -.34Q6 11.00 -.02 .13 -.10Q7 .07 -.39 .29 -.18Q8 -.07 .02 I .82 I .50Q9 .04 -.32 -.01 .03Q10 .08 I .41 -.32 -.03Q11 -.07 .26 -.21 -.02Q12 .03 .17 .03 .47Q13 .05 .13 I .65 .02Q14 -.07 -.04 -.12 1-·63Q15 .24 .16 .23 .26---------------------------------------------------------Variance explained by rotated factors:
1.99 1.93 1.51 1.21% of total variance explained:
13.28 12.84 10.07 8.09 44.28
Table 7.2. Varimax Rotated Factor Analysis of theQuestionnaire for Task 2.
Factor 1 Factor 2 Factor 3 Factor 4Q1 .00 I .76 I .17 -.03Q2 -.24 .03 I .83 .38Q3 .06 .17 .61 -.02Q4 .35 -.06 .04 -.24Q5 -.14 -.07 .16 I .47Q6 I .55 I .41 -.01 -.08Q7 -.01 .20 -.15 .32Q8 I .80 .22 -.20 .07Q9 .69 -.22 -.13 .08Q10 .08 -.06 .11 .55Q11 -.27 .25 .22 .05Q12 -.59 .20 .05 .34Q13 .44 .29 .13 .24Q14 -.75 -.05 .40 .03Q15 .71 .04 .17 -.08---------------------------------------------------------Variance explained by rotated factors:
3.30 1.12 1.44 1.03% of total variance explained:
21.97 7.45 9.62 6.85 45.89-~-----------~-~-----------------------------------------
446

Table 7.3. Varimax Rotated Factor Analysis of theQuestionnaire for Task 3.
Factor 1 Factor 2 Factor 3 Factor 4Q1 .33 -.02 -.13 I .95 IQ2 .02 I .85 .04 .12Q3 -.08 .74 .04 .14Q4 I .54 -.45 .22 .09Q5 -.02 I .69 -.04 -.13Q6 I .52 -.10 -.03 I .49Q7 .17 -.19 I .56 -.12Q8 I .91 -.12 .02 .04Q9 .15 -.23 .04 -.32Q10 .35 .09 .22 -.06Q11 -.13 .16 .73 .00Q12 -.55 .35 .10 .17Q13 .78 .09 -.07 .19Q14 -.57 .34 .19 .03Q15 .70 .05 .16 .26---------------------------------------------------------variance explained by rotated factors:
3.41 2.35 1.04 1.46% of total variance explained:
22.72 15.66 6.96 9.72 55.06---------------------------------------------------------Table 7.4. Summary statistics for the Questionnaires---------------------------------------------------------Task Question Minimum Maximum Mean Standard
Deviation1 1 1 5 2.82 1.03
2 1 5 3.51 1.293 1 5 2.87 1.314 2 5 3.60 0.655 1 4 2.36 1.036 1 5 3.20 1.087 1 4 2.51 0.798 1 5 3.91 0.799 3 5 4.42 0.66
10 1 4 3.20 0.9911 1 5 2.09 0.9512 1 4 1.71 0.7013 1 5 3.89 0.8314 1 4 1.69 0.6315 2 5 3.98 0.66---------------------------------------------------------
2 1 1 5 3.13 1.062 1 5 2.53 1.123 1 5 2.58 1.284 1 5 3.09 0.765 1 5 2.49 1.046 1 5 3.24 1.037 1 4 2.69 0.958 1 5 2.98 1.18
447

Table 7.4 continued9 1 4 3.89 0.94
10 1 5 2.93 1.0311 1 3 2.07 0.8612 2 5 3.09 1.0413 1 5 3.60 0.9214 1 5 2.31 0.9715 1 5 2.78 1.02---------------------------------------------------------
3 1 1 5 3.58 1.082 1 4 2.18 1.033 1 5 2.31 1.164 2 5 3.40 0.725 1 4 2.16 0.886 1 5 3.42 0.927 1 5 2.80 1.108 1 5 3.53 1.169 2 5 4.09 0.85
10 1 4 2.69 1.0611 1 3 1.89 0.7512 1 4 2.36 0.8613 1 5 3.89 1.0714 1 4 1.93 0.7515 1 5 3.82 1.14---------------------------------------------------------
Table 7.5. ANOVA and Tukey HSD results for task 1,question 5---------------------------------------------------------SourceBetween GroupsWithin Groups
Sum of Squares7.53
38.78Of Mean square F2 3.76 4.08
42 0.92P.02
---------------------------------------------------------Matrix of Mean Differences
Group 1 Group 21.050.90 0.15
Matrix of ProbabilitiesGroup 1 Group 2
0.020.06
Group 2Group 3 0.89
Group 2Group 3--------------------~------------------------------------Group 1Group 2Group 3
No. of Cases101718
Mean1.602.652.50
Standard Deviation0.700.791.20--------------------------------------~------------------
448

Table 7.6. ANOVA and Tukey HSD results for task 1,question 6SourceBetween GroupsWithin Groups
Sum of Squares Of15.66 235.54 42
Mean Square F7.83 9.250.85
P.00
Matrix of Mean Differences Matrix of ProbabilitiesGroup 1 Group 2 Group 1 Group 2
Group 2 0.76 Group 2 0.11Group 3 1.53 0.78 Group 3 0.00 0.04---------------------------------------------------------
No. of Cases Mean Standard DeviationGroup 1 10 2.30 0.82Group 2 17 3.06 0.97Group 3 18 3.83 0.92---------------------------------------------------------Table 7.7. ANOVA and Tukey HSD results for task 2,question 3---------------------------------------------------------SourceBetween Groupswithin Groups
Sum of Squares Of18.50 254.48 42
Mean Square F9.25 7.131.30
P.00
---------------------------------------------------------Group 2Group 3
Mean DifferencesGroup 1 Group 20.780.68 1.45
Matrix of ProbabilitiesGroup 1 Group 2
0.210.30
Group 2Group 3 0.00
Matrix of
---------------------------------------------------------No. of Cases Mean Standard
DeviationGroup 1 10 2.60 1.25Group 2 17 1.82 0.95Group 3 18 3.28 1.23---------------------------------------------------------
449

Table 7.8. ANOVA and Tukey HSD results for task 2,question 13---------------------------------------------------------SourceBetween GroupsWithin Groups
Sum of Squares Of6.59 2
30.21 42Mean Square F
3.30 4.580.72
P.02
---------------------------------~-----------------------Group 2Group 3
Mean DifferencesGroup 1 Group 20.810.99 0.18
Matrix of ProbabilitiesGroup 1 Group 2
0.060.01
Group 2Group 3 0.80
Matrix of
---------------------------------------------------------No. of Cases Mean StandardDeviationGroup 1Group 2Group 3
101718
2.903.713.89
1.290.770.58---------------------------------------------------------
Table 7.9. Summary statistics for groups on task 2,questions 8 and 15.--------------------------------~------------------------Question 8 No of cases Mean Standard DeviationG~oup 1 10 3.00 1.33Group 2 17 2.71 1.21Group 3 18 3.22 1.06
Question 15Group 1 10 2.30 1.06Group 2 17 3.41 0.51Group 3 18 3.39 0.61---------------------------------------------------------Table 7.10. Task preferences by group---------------------------------------------------------
No. of Task 1 % Task 2 % Task 3 %Cases
Group 1 10 4 40 2 20 4 40Group 2 17 5 29.4 2 11.8 10 58.8Group 3 18 7 38.9 2 11.1 9 50---------------------------------------------------------Total 45 16 35.6 6 13.3 23 51.1---------------------------------------------------------
450

Table 7.11. Manova results for Group (ability level)---------------------------------------------------------Univariate F TestsVariable SS OF MS F P
Fluency, Task 1 440.84 2 220.42 26.60 .00Error 298.33 36 8.29
Fluency, Task 2 454.42 2 227.21 27.57 .00Error 296.68 36 8.24
Fluency, Task 3 444.23 2 222.16 37.95 .00Error 210.73 36 5.85
Accuracy, Task 1 271.67 2 135.83 22.98 .00Error 212.76 36 5.91
Accuracy, Task 2 288.91 2 144.46 19.26 .00Error 269.95 36 7.50
Accuracy, Task 3 165.72 2 82.86 0.31 .74Error 9774.60 36 271.52
ELTS, Task 1 377.07 2 188.54 25.91 .00Error 261.99 36 7.28
ELTS, Task 2 375.29 2 187.65 20.29 .00Error 332.98 36 9.25
ELTS, Task 3 278.153 2 139.08 18.65 .00Error 268.446 36 7.46---------------------------------------------------------
Multivariate Test Statistics
Wilks' Lambda = 0.14F = 5.23 Of = 18, 56 P = .00---------------------------------------------------------
451

Table 7.12. Manova results for Task preference---------------------------------------------------------Univariate F TestsVariable SS OF MS F P
Fluency, Task 1 3.90 2 1.95 0.24 .79Error 298.33 36 8.29
Fluency, Task 2 1.96 2 0.98 0.119 .88Error 296.68 36 8.24
Fluency, Task 3 26.51 2 13.25 2.26 .12Error 210.73 36 5.85
Accuracy, Task 1 5.04 2 2.52 0.43 .66Error 212.76 36 5.91
Accuracy, Task 2 13.79 2 6.89 0.92 .41Error 269.95 36 7.50
Accuracy, Task 3 221.76 2 110.88 0.41 .67Error 9774.60 36 271.52
ELTS, Task 1 1.21 2 0.60 0.08 .92Error 261.99 36 7.28
ELTS, Task 2 6.36 2 3.18 0.34 .71Error 332.98 36 9.25
ELTS, Task 3 0.22 2 0.11 0.01 .97Error 268.446 36 7.46---------------------------------------------------------
Multivariate Test statistics
wilks' Lambda = 0.33F = 2.32 Of = 18, 56 P = .01---------------------------------------------------------
452
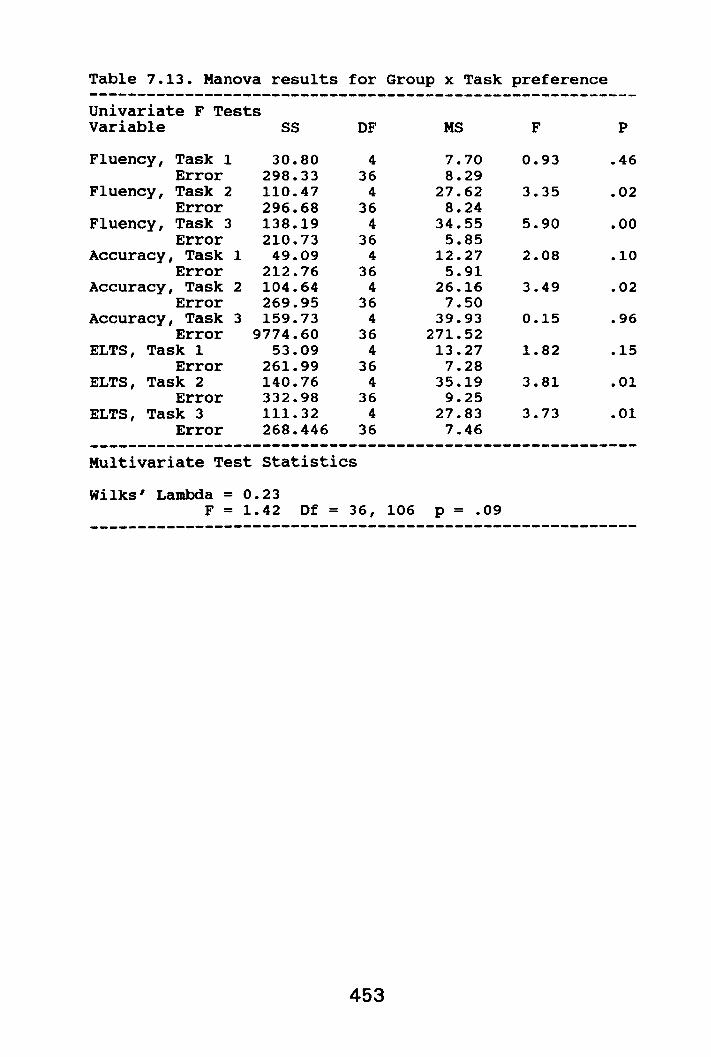
Table 7.13. Manova results for Group x Task preference---------------------------------------------------------Univariate F TestsVariable SS DF MS F P
Fluency, Task 1 30.80 4 7.70 0.93 .46Error 298.33 36 8.29
Fluency, Task 2 110.47 4 27.62 3.35 .02Error 296.68 36 8.24
Fluency, Task 3 138.19 4 34.55 5.90 .00Error 210.73 36 5.85
Accuracy, Task 1 49.09 4 12.27 2.08 .10Error 212.76 36 5.91
Accuracy, Task 2 104.64 4 26.16 3.49 .02Error 269.95 36 7.50
Accuracy, Task 3 159.73 4 39.93 0.15 .96Error 9774.60 36 271.52
ELTS, Task 1 53.09 4 13.27 1.82 .15Error 261.99 36 7.28
ELTS, Task 2 140.76 4 35.19 3.81 .01Error 332.98 36 9.25
ELTS, Task 3 111.32 4 27.83 3.73 .01Error 268.446 36 7.46
Multivariate Test Statistics
Wilks' Lambda = 0.23F = 1.42 Df = 36, 106 P = .09---------------------------------------------------------
453

Table 7.14. Means and Standard Deviations for scores onthe Fluency Scale, Accuracy Scale and ELTS scale, byGroup and Task preference, for Task 2.----------~--------------------------~---------~---------ScaleFluency
Accuracy
ELTS
Group111222333111222333111222333
Task Preference123123123123123123123123123
Mean5.005.134.562.752.753.932.682.882.173.884.383.692.102.633.402.112.751.976.886.886.444.604.755.934.505.254.17
Sd.94.88.66.79.71.87.53.18.53
1.03.88.72.91.53.78.48.00.48.53.53.75
1.01.35.80.52.00.77------~--------------------~-----------------------------
Table 7.15. Means and Standard Deviations for scores onthe Fluency Scale by Group and Task preference, for Task3.~--------------------------------------------------------ScaleFluency
Group111222333
Task Preference123123123
454
Mean5.315.255.252.803.004.393.293.002.89
Sd.63.71.54.60.00.65.42.00.76

Table 7.16. Correlation coefficients between studentassessment of abilities and Rasch ability estimates
student assessment of:Fluency Accuracy General Proficiency
Rasch estimates ofFluency .09Accuracy .09General Proficiency .08
.13
.11
.09
.01
.02
.01---------------------------------------------------------Table 7.17. Correlation coefficients between reports ofanxiety and Rasch estimates of ability.---------------------------------------------------------
Fluency Accuracy ELTS
Question 2, Task 1 -0.08 -0.10 -0.07Question 3, Task 1 -0.11 -0.12 -0.11Question 5, Task 1 -0.28 -0.25 -0.29
Question 2, Task 2 -0.10 -0.12 -0.15Question 3, Task 2 -0.09 -0.12 -0.11Question 5, Task 2 -0.08 -0.08 -0.08
Question 2, Task 3 -0.24 -0.22 -0.25Question 3, Task 3 -0.34 -0.33 -0.34Question 5, Task 3 -0.38 -0.40 -0.39---------------------------------------------------------
7.18 The Questionnaire
In the following questionnaire, it should be noted
that questions 1 - 15 were asked for each task taken by
the students. Questions 16 - 19 were separate questions
added to the end of the three other questionnaires. This
example is from Task 1, with questions 16 - 19 added to
the end.
455

A. Please complete these details.Name: __
Age: -4years, __________ months.Class at School: ___
B. Please complete the following by placing a circlearound the most appropriate answer. For example:Question: It is useful to study the day before an oraltest.stronglyAgree
Agree NoOpinion
Disagree stronglyAgree
1. I believe that the Picture task would provide anexaminer with an accurate idea of my ability tospeak English.
strongly Agree No Disagree stronglyAgree opinion Disagree
2. I felt nervous before the Picture task.Strongly Agree No Disagree StronglyAgree Opinion Disagree3. I felt nervous while I was doing the Picture task.Strongly Agree No Disagree StronglyAgree Opinion Disagree
4. I believe I did well on the Picture task.stronglyAgree
Agree NoOpinion
Disagree StronglyDisagree
5. If I had done the Picture task on another day, Iwould have done better.
stronglyAgree
Agree NoOpinion
Disagree StronglyDisagree
456

6. I believe that the Picture task provided me with anadequate opportunity to demonstrate my ability tospeak English.
stronglyAgree
Agree Noopinion
Disagree stronglyDisagree
Please explain why: __
7. The time allowed for the Picture task was too short.stronglyAgree
Agree NoOpinion
Disagree
8. I liked doing the Picture task.stronglyAgree
Agree
Please explain why:
NoOpinion
Disagree
stronglyDisagree
stronglyDisagree
9. I understood what I was supposed to do in thePicture task.
stronglyAgree
Agree NoOpinion
Disagree stronglyDisagree
10. I thought that the Picture task was related to whatI learn in class.
stronglyAgree
Agree NoOpinion
Disagree stronglyDisagree
11. If a different teacher had conducted the Picturetask, I would have done better.
stronglyAgree
Agree NoOpinion
Disagree stronglyDisagree
12. I thought that the Picture task was too difficult.stronglyAgree
Agree NoOpinion
457
Disagree stronglyDisagree

Please explain why:
13. I thought that the Picture task was interesting.stronglyAgree
Agree NoOpinion
Disagree stronglyDisagree
14. I thought that doing the Picture task was anunpleasant experience
stronglyAgree
Agree Noopinion
Disagree stronglyDisagree
15. Did you think that the subject chosen for thePicture task was particularly fair or unfair? Pleasegive your reasons.
Very fair Fair No opinion unfair very unfairReasons:
16. If you were going to take an oral test in anexamination, which one of the three tasks wouldyou prefer to do? Put a "1" next to the task youwould prefer most, a "2" next to your second choice,and a "3" next to the task you would least like todo.Task 1: Picture taskTask 2: Discussion of passageTask 3: Group discussion
17. If you felt nervous during any of the tasks, whatwould have made you feel less nervous?
458

18. How would you rate your own proficiency in spokenEnglish?
Generally: Very good good average poor very poorGrammaticalAccuracy: Very good good average poor very poorFluency: Very good good average poor very poor
19. For how many years have you been studying English?
459

Appendix to Chapter Eight
Table 8.1. ANOVA for the condition FluencySOURCERATERTASKRATER*TASK
SUM OF SQUARES72.5117.3415.90
RESIDUAL 948.22
DF MEAN-SQUARE4 18.122 8.678 1.99
Generalizability Coefficients
F-RATIO12.906.14.42
P.001.002.186
Reliability Coefficient .90Inter-rater generalizability coefficient .93Equivalent forms qeneralizability coefficient .98Forms by Raters qeneralizability coefficient .99
Table 8.2. Variation between raters (Fluency)Source (Raters)
1 & 21 & 31 & 41 & 52 & 32 & 42 & 53 & 43 & 54 & 5
SS0.13
46.260.44
11.3651.311.05
13.9337.7011.777.34
DF1111111111
F0.09
32.930.318.09
36.520.759.91
26.838.385.22
P.761.000.577.005.000.388.002.000.004.023---------------------------------------------------------
Table 8.3. Variation between tasks (Fluency)---------------------------------------------------------Source (Tasks)
1 & 21 & 32 & 3
SS1.478.09
16.45
DF111
F1.055.76
11.71
P.307.017.001---------------~----------~------------------------------
460

Table 8.4 ANOVA for the condition AccuracySOURCERATERTASKRATER*TASK
SUM OF SQUARES81.9716.8913.15
RESIDUAL 728.10
OF428
MEAN-SQUARE20.498.45
1.64
F-RATIO18.997.831.52
p.000.000.145
---------------------------------------------------------Generalizability Coefficients---------------------------------------------------------Reliability Coefficient .87Inter-rater generalizability coefficient .90Equivalent forms generalizability coefficient .98Forms by Raters generalizability coefficient .98---------------------------------------------------------Table 8.5. Variation between raters (Accuracy---------------------------------------------------------Source (Raters)
1 & 21 & 31 & 41 & 52 & 32 & 42 & 53 & 43 & 54 & 5
SS0.00
60.293.29
10.7159.363.07
10.3235.7519.922.18
OF1111111111
F0.00
55.903.059.93
55.032.859.57
33.1418.472.03
P.954.000.081.002.000.092.002.000.000.155---------------------------------------------------------
Table 8.6. Variation between tasks (Accuracy)---------------------------------------------------------Source (Tasks)
1 & 21 & 32 & 3
SS1.26
15.898.19
OF111
F1.17
14.737.59
P.279.000.006---------------------------------------------------------
461

Table 8.7. ANOVA for the condition Global AssessmentSOURCERATERTASKRATER*TASK
SUM OF SQUARES44.0132.2818.23
RESIDUAL 885.98
DF MEAN-SQUARE4 11.002 16.148 2.28
F-RATIO8.38
12.301.74
p.000.000.087
-----------~------------~--------------------------------Generalizability Coefficients---------------------------------------------------------Reliability Coefficient .90Inter-rater generalizability coefficient .95Equivalent forms generalizability coefficient .97Forms by Raters generalizability coefficient .98
Table 8.8. Variation between raters (Global Assessment)---------------------------------------------------------Source (Raters)1 & 21 & 31 & 41 & 52 & 32 & 42 & 53 & 43 & 54 & 5
SS2.649.069.800.611.92
22.615.80
37.7014.385.51
DF1111111111
F2.016.907.460.471.46
17.234.42
28.7210.964.20
P.156.009.006.495.227.000.036.000.001.041---------------------------------------------------------
Table 8.9. Variation between tasks (Global Assessment)-----------------------~---------------------------------Source (Tasks)1 & 21 & 32 & 3
SS1.83
29.7616.84
DF111
F1.39
22.6712.83
P.238.000.000---------------------------------------~-----------------
Table 8.10. Descriptive Statistics for Fluency---------------------------------------------------------Rater 1Mean 3.42S.D 0.93Range 4.33
Rater 23.391.004.33
Rater 34.250.552.33
Rater 43.461.415.00
Rater 53.821.184.33---------------------------------------------------------
462

Table 8.11. Pearson Correlation Matrix (Fluency)---------------------------------------------------------Rater 1 Rater 2 Rater 3 Rater 4
Rater 2 .90
Rater 3 .68 .71
Rater 4 .88 .87 .69
Rater 5 .87 .85 .69 .92
Table 8.12. Spearman Rank Order Correlation Matrix(Fluency)---------------------------------------------------------
Rater 1 Rater 2 Rater 3 Rater 4
Rater 2 .86
Rater 3 .60 .61
Rater 4 .87 .77 .60
Rater 5 .88 .80 .59 .90
Table 8.13. Descriptive Statistics for Accuracy---------------------------------------------------------Rater 1 Rater 2 Rater 3 Rater 4 Rater 5
Mean 2.80 2.82 3.75 3.01 3.19S.D 0.94 0.93 0.51 1.24 0.89Range 4.33 4.33 2.33 4.00 3.33---------------------------------------------------------Table 8.14. Pearson Correlation Matrix (Accuracy)
Rater 1 Rater 2 Rater 3 Rater 4
Rater 2 .93
Rater 3 .64 .63
Rater 4 .84 .89 .54
Rater 5 .82 .86 .55 .86---------------------------------------------------------
463

Table 8.15. Spearman Rank Order Correlation Matrix(Accuracy)
Rater 1 Rater 2 Rater 3 Rater 4Rater 2 .89Rater 3 .58 .58Rater 4 .86 .91 .52
Rater 5 .83 .86 .48 .89
Table 8.16. Descriptive Statistics for Global AssessmentRater 1 Rater 2 Rater 3 Rater 4 Rater 5
Mean 5.49 5.65 5.86 5.11 5.38S.D 1.10 1.07 0.65 1.15 1.03Range 5.67 5.33 3.00 4.67 4.00---------------------------------------------------------Table 8.17. Pearson Correlation Matrix (GlobalAssessment)---------------------------------------------------------Rater 1 Rater 2 Rater 3 Rater 4Rater 2 .89Rater 3 .52 .48Rater 4 .87 .79 .51Rater 5 .85 .82 .45 .90---------------------------------------------------------Table 8.18. Spearman Rank Order Correlation Matrix(Global Assessment)
Rater 1 Rater 2 Rater 3 Rater 4Rater 2 .87Rater 3 .33 .31Rater 4 .87 .76 .40Rater 5 .88 .81 .35 .90---------------------------------------------------------
464

Table 8.19. Correlation Coefficients on Fluency: Task 1---------------------------------------------------------Rater 1 Rater 2 Rater 3 Rater 4
Rater 2 .82
Rater 3 .52 .47
Rater 4 .78 .77 .48
Rater 5 .74 .79 .52 .85---------------------------------------------------------Table 8.20. Correlation Coefficients on Fluency: Task 2---------------------------------------------------------
Rater 1 Rater 2 Rater 3 Rater 4
Rater 2 .75
Rater 3 .16 .18
Rater 4 .76 .76 .10
Rater 5 .74 .74 .02 .85---------------------------------------------------------Table 8.21. Correlation Coefficients on Fluency: Task 3---------------------------------------------------------
Rater 1 Rater 2 Rater 3 Rater 4
Rater 2 .84
Rater 3 .47 .62
Rater 4 .70 .80 .71
Rater 5 .71 .74 .72 .78---------------------------------------------------------Table 8.22. Correlation Coefficients on Accuracy: Task 1---------------------------------------------------------
Rater 1 Rater 2 Rater 3 Rater 4
Rater 2 .81
Rater 3 .39 .39
Rater 4 .72 .88 .30
Rater 5 .60 .79 .21 .76---------------------------------------------------------
465

Table 8.23. Correlation Coefficients on Accuracy: Task 2---------------------------------------------------------Rater 1 Rater 2 Rater 3 Rater 4
Rater 2 .82Rater 3 .27 .33Rater 4 .67 .75 .28Rater 5 .70 .77 .33 .87
Table 8.24. Correlation Coefficients on Accuracy: Task 3------~---------------------------~----------------------Rater 1 Rater 2 Rater 3 Rater 4Rater 2 .91Rater 3 .56 .60Rater 4 .78 .80 .46Rater 5 .66 .65 .50 .71
Table 8.25. Correlation Coefficients on ELTS GlobalAssessment: Task 1
Rater 1 Rater 2 Rater 3 Rater 4Rater 2 .73Rater 3 .49 .35Rater 4 .72 .56 .47Rater 5 .73 .65 .53 .77---------------------------------------------------------Table 8.26. Correlation Coefficients on ELTS GlobalAssessment: Task 2---------------------------------------------------------Rater 1 Rater 2 Rater 3 Rater 4
Rater 2 .73Rater 3 .19 .19Rater 4 .71 .64 .22Rater 5 .72 .73 .08 .88--------------------~------------------------------------
466

Table 8.27. Correlation Coefficients on ELTS GlobalAssessment: Task 3---------------------------------------------------------
Rater 1 Rater 2 Rater 3 Rater 4
Rater 2 .89
Rater 3 .50 .52
Rater 4 .79 .85 .50
Rater 5 .64 .70 .55 .77
Table 8.28. Descriptive Statistics for Fluency, includingRasch severity estimates for raters
Rater 1 Rater 2 Rater 3 Rater 4 Rater 5Mean 3.42 3.39 4.25 3.46 3.82S.D 0.93 1.00 0.55 1.41 1.18Range 4.33 4.33 2.33 5.00 4.33Raterseverity 0.48 0.57 -1.10 0.35 -0.30std. Error .12 .12 .12 .12 .12MnSq Outfit 0.8 0.5 1.9 1.0 0.9---------------------------------------------------------Table 8.29. Descriptive statistics for Accuracy,including Rasch severity estimates for raters---------------------------------------------------------
Rater 1 Rater 2 Rater 3 Rater 4 Rater 5Mean 2.80 2.82 3.75 3.01 3.19S.D 0.94 0.93 0.51 1.24 0.89Range 4.33 4.33 2.33 4.00 3.33RaterSeverity 0.79 0.77 -1.56 0.22 -0.23std. Error .14 .14 .14 .14 .14MnSq Outfit 0.8 0.5 1.9 1.1 0.8---------------------------------------------------------Table 8.30. Descriptive Statistics for ELTS GlobalAssessment, including Rasch severity estimates for raters
MeanS.DRangeRaterSeveritystd. ErrorMnSq Outfit
Rater 15.491.105.67
Rater 25.651.075.33
Rater 35.860.653.00
Rater 45.111.154.67
Rater 55.381.034.00
0.04.12
1.0
-0.35.12
0.8
-0.69.12
1.7
0.77.12
0.6
0.23.12
0.7
467

Table 8.31. Misfitting ratings(a) Fluency---------------------------------------------------------category step Exp. Resid. Rater Task Person
5 4 4.9 -0.9 3 2 94 3 4.8 -1.8 3 2 63 2 4.0 -2.0 3 2 235 4 5.0 -1.0 3 3 94 3 4.7 -1.7 3 3 17
(b) Accuracycategory step Exp. Resid. Rater Task Person---------------------------------------------------------
2 1 3.2 -2.2 3 1 73 2 3.8 -1.8 3 1 114 3 3.9 -0.9 3 2 63 2 3.8 -1.8 3 2 174 3 3.9 -0.9 3 3 84 3 3.9 -0.9 3 3 263 2 3.6 -1.6 3 3 24------------------------------------------~--------------(c) ELTS Global scale---------------------------------------------------------
category step Exp. Resid. Rater Task Person---------------------------------------------------------58
36
5.12.4
-2.13.6
33
22
1732---------------------------------------------------------
Table 8.32. Ability level and likely grades on theFluency rating scale---------------------------------------------------------Legit 1 2
Rater3 4 5---------------------------------------------------------
-4 2 2 3 2 2-3 2 2 3 2 2-2 3 3 3 2 2-1 3 3 4 3 30 4 3 4 3 31 4 3 4 4 42 5 5 5 5 53 5 5 5 6 54 5 5 5 6 6
468

Table 8.33. Ability level and likely grades on theAccuracy rating scale
Logit 1 2Rater
3 4 5
-4 2 2 3 2 2-3 2 2 3 2 2-2 2 2 3 2 2-1 2 2 3 2 20 3 3 3 3 31 3 3 4 4 32 4 4 4 4 43 4 4 4 4 44 4 4 4 4 4
Table 8.34. Ability level and likely grades on the ELTSGlobal rating scale
RaterLogit 1 2 3 4 5----------------------------------------------------------4 4 4 5 4 4-3 4 4 5 4 4-2 4 5 5 4 4-1 5 5 5 5 50 6 6 6 6 51 6 6 6 6 62 7 7 6 6 73 7 8 6 7 74 7 8 7 8 7
Table 8.35. Rasch estimates of judge severity and fitstatistics for the Fluency rating scale, taking intoaccount task variability.
Rater 1 Rater 2 Rater 3 Rater 4 Rater 5RaterSeverity -0.28 0.80 0.51 -0.39 -0.64Std. Error .13 .14 .15 .11 .12MnSq Outfit 0.8 0.7 2.4 0.5 0.8
469

Table 8.36. Rasch estimates of judge severity and fitstatistics for the Accuracy rating scale, taking intoaccount task variability.---------------------------~-----------------------------Rater 1 Rater 2 Rater 3 Rater 4 Rater 5RaterSeverity 0.35 0.25 -0.22 -0.20 -0.18Std. Error .15 .15 .17 .12 .15MnSq Outfit 0.9 0.6 1.9 0.6 1.0
Table 8.37. Rasch estimates of judge severity and fitstatistics for the ELTS Global rating scale, taking intoaccount task variability.---------------------------------------------------------Rater 1 Rater 2 Rater 3 Rater 4 Rater 5RaterSeverity -0.59 0.26 -0.45 -0.47 0.31Std. Error .12 .12 .16 .12 .13MnSq Outfit 0.8 0.7 2.0 0.7 0.8---------------------------------------------------------Table 8.38. Task difficulty on the Fluency rating scale---------------------------------------------------------
1Task
2 3---------------------------------------------------------Difficultystd. ErrorMnSq Outfit
-0.36.10
0.90.45.10
1.2-0.90
.101.1---------------------------------------------------------
Table 8.39. Task difficulty on the Accuracy rating scale---------------------------------------------------------1
Task2 3---------------------------------------------------------Difficulty
std. ErrorMnSq Outfit
0.13.11
1.00.25.11
1.0-0.38
.110.9
Table 8.40. Task difficulty on the ELTS Global ratingscale
1Task
2 3-------------~-------------------------------------------DifficultyStd. ErrorMnSq Outfit
-0.11.10
0.90.22.09
1.2-0.11
.110.8
470

Table 8.41. Intra-Rater correlation coefficients (PPM)
Fluency Accuracy ELTS Global scale
Rater 1 .75* .78* .78*Rater 2 .91* .93* .98*Rater 3 .53 .18 .47Rater 4 .97* .89* .95*Rater 5 .89* .73* .82*
* Significant at P < .05
Table 8.42. Intra-Rater correlation coefficients(Spearman)
Fluency Accuracy ELTS Global scale
Rater 1 .78 .65 .81Rater 2 .71 .89 .99Rater 3 .47 .20 .47Rater 4 .96 .89 .96Rater 5 .89 .72 .85
Table 8.43. Intra-Rater descriptive statistics---------------------------------------------------------Fluency Accuracy ELTS Global
scale---------------------------------------------------------Mean Sd. Range Mean Sd. Range Mean Sd. Range---------------------------------------------------------
Rater 1First 3.75 1.38 3 3.38 1.41 4 6.00 1.60 4Second 3.75 1.04 3 2.88 0.84 2 5.75 1.04 3Rater 2First 3.75 1.49 4 3.38 1.19 4 6.38 1.41 4Second 3.63 1.51 4 3.13 1.99 3 6.25 1.58 2Rater 3First 4.50 1.31 4 3.75 1.04 3 6.75 1.04 3Second 4.63 0.52 1 4.00 0.76 2 6.38 0.52 1Rater 4First 4.00 1.51 4 3.50 1.07 3 6.13 1.55 4Second 3.88 1.55 4 3.50 1.20 3 5.75 1.28 4Rater 5First 4.00 1.31 4 3.13 1.36 3 6.00 1.31 4Second 4.00 1.60 4 3.63 1.06 3 6.00 1.20 4---------------------------------------------------------
471

Appendix to Chapter Nine
Table 9.1. Pearson Correlation matrix for the five FCEpapers and the oral rating scales.Rating scales Fluency---------------------------------------------------------Accuracy ELTS---------------------------------------------------------FCE papersReading .70 .71 .69Writing .69 .71 .70Use of English .78 .79 .76Listening .55 .59 .53Speaking .76 .76 .75All correlations significant at p < .01---------------------------------------------------------Table 9.2. Principal Axis Factor Analysis of the FCEpapers, Fluency, Accuracy and ELTS.---------------------------------------------------------Factor 1 h2
Reading .79 .66Writing .79 .69Use of English .88 .81Listening .63 .52Speaking .82 .72Fluency .95 .97Accuracy .96 .96ELTS .95 .98-----~---------------------------------------------------Variance explained by Factors: 5.814Percentage of total variance explained: 72.67---------------------------------------------------------Table 9.3. Rotated Varimax Factor pattern of FeE papers,Fluency, Accuracy and ELTS rating scales, retaining threeFactors.
Factor 1---------------------------------------------------------Factor 3ReadingWritingUse of EnglishListeningSpeakingFluencyAccuracyELTS
.41
.42
.40
.23
.49
.85
.82
.88
Factor 2.12.28.18
11.001.21.19.23.17
.72
.60
.86
.251·631.47.49.45--------------------------------------------~------------variance explained
by Factors:% of total Varianceexplained:
2.9536.89---------------~-----------------------------------------
472
1.79 2.7422.37 34.25

Table 9.4. Pearson Correlation matrix of the ratingcomponents of the FCE speaking test and the Fluency,Accuracy and ELTS rating scales.Rating Scales Fluency Accuracy ELTSFCE componentsFluency .67 .63 .64Accuracy .72 .72 .70Prosent .71 .74 .71Prosound .66 .63 .65Interact .74 .74 .73Vocab .67 .69 .66All correlations significant at p < .001
Table 9.5. Principal Axis Factor Analysis of the ratingcomponents of the FCE speaking test and the Fluency,Accuracy and ELTS rating scales.
Factor 1 h2
Fluency (FCE) .81 .71Accuracy (FCE) .88 .80Prosent .89 .82Prosound .82 .72Interact .90 .86Vocab .89 .88Fluency .90 .98Accuracy .90 .96ELTS .89 .90---------------------------------------------------------variance explained by Factors: 6.908t of total variance explained: 76.75---------------------------------------------------------
473

Table 9.6. Rotated Varimax Factor pattern of the ratingcomponents of the FCE speaking test and the Fluency,Accuracy and ELTS rating scales, retaining two Factors.------------------------~--------------------------------Factor 1 Factor 2Fluency (FCE)Accuracy (FCE)ProsentProsoundInteractVocabFluencyAccuracyELTS
.74
.81
.81
.75
.82
.89
.43
.44
.41
.38
.41
.42
.37
.43
.33
.89
.88
.91variance explained by Factors: 4.41, of total variance explained: 48.98
3.3036.72---------------------------------------------------------
Table 9.7. Descriptive statistics for the 7 categories ofteacher assessment.---------------------------------------------------------Mean Sd. Range---------------------------------------------------------speaking 3.74 0.14 3Listening 3.89 0.67 3Reading 3.54 0.94 3Writing 3.24 0.13 3GrallDatical Accuracy 3.26 1.00 4spelling 3.74 0.80 3Homework 3.65 0.92 3---------------------------------------------------------Table 9.8. Pearson Correlation matrix of the componentsof teacher assessment and the Fluency, Accuracy and ELTSrating scales.---------------------------------------------------------Rating Scales Fluency Accuracy ELTSTeacher AssessmentsSpeaking .76 .74 .67Listening .70 .66 .73Reading .71 .71 .69Writing .80 .78 .78Grammatical Accuracy .78 .74 .74Spelling .61 .60 .60Homework .75 .71 .72All correlations significant at p < .001
474

Table 9.9. Principal Axis Factor Analysis of thecomponents of teacher assessment and the Fluency,Accuracy and ELTS rating scales.
Factor 1 h2
Speaking .90 .88Listening .78 .70Reading .83 .76Writing .90 .90Grammatical Accuracy .91 .91Spelling .76 .75Homework .89 .87Fluency .93 .93Accuracy .90 .90ELTS .91 .91variance explained by Factors: 7.616% of total variance explained: 76.16
Table 9.10. Rotated Varimax factor pattern of thecomponents of teacher assessment and the Fluency,Accuracy and ELTS rating scales.
Factor 1 Factor 2 Factor 3 Factor 4---------------------------------------------------------Speaking .29 .35 .36 .83Listening .36 .40 .15 .60Reading .43 .38 .25 .58Writing .35 .41 1·871 .36GrammaticalAccuracy .50 .40 .48 .47Spelling .80 .28 .23 .24Homework .71 .36 .24 .47Fluency .31 .84 .26 .35Accuracy .29 .84 .25 .32ELTS .29 .87 .24 .30Varianceexplained:% of totalVariance:
2.17 3.12 1.50 2.3221.71 31.23 14.98 23.20
475

Table 9.11. Statistics for validation by GroupDifferences on the Fluency scale.-----------------------------------~---------------------ANOVASourceBetween Groupswithin Groups
Sum of Squares136.2483.50
Matrix of Absolute MeanDifferences
Group 1 Group 2Group 2 3.04Group 3 4.60 1.57
DF Mean Square F2 68.12 34.26
42 1.99Matrix ofProbabilities
P.00
Group 1 Group 2Group 2 0.00Group 3 0.00 0.01
Table 9.12. Statistics for validation by GroupDifferences on the Accuracy scale.ANOVASourceBetween Groupswithin Groups
Sum of Squares124.2397.27
Matrix of Absolute MeanDifferences
Group 2Group 3
Group 12.464.37
Group 21.91
DF Mean Square F2 62.12 26.82
42 2.32Matrix ofProbabilities
Group 2Group 3
Group 10.000.00
Group 2
p.00
0.00
---------------------------------------------------------Table 9.13. Statistics for validation by GroupDifferences on the ELTS scale.---------------------------------------------------------ANOVASourceBetween GroupsWithin Groups
Sum of Squares121.2691.87
Matrix of Absolute MeanDifferences
Group 1Group 2 2.67Group 3 4.34
Group 21.67
DF Mean Square F2 60.63 27.72
42 2.19Matrix ofProbabilities
Group 2Group 3
Group 10.000.00
Group 2
P.00
0.01
-------------------------------------------~-------------
476

Table 9.14. Summary statistics for the three groups inthe validation by Group Differences study.
No.Fluency
Mean SOAccuracy
Mean SOELTS
Mean SOGroup 1
Cases10 2.93 1.69 2.82 1.65 2.45 1.93
Group 2 17 - 0.12 1.46 0.35 1.72 - 0.23 1.51Group 3 18 - 1.67 1.19 - 1.56 1.21 - 1.89 1.14
Table 9.15. MTMM matrix of correlation coefficientsMethod 1Pictures
Method 2Text
Method 2Group
F1 A1 El F2 A2 E2 F3 A3 E3Method F1 .941
A1 .97 .92El .97 .96 .93
Method F2 .92 .92 .94 .932
A2 .89 .90 .89 .95 .93E2 .89 .91 .91 .98 .96 .93
Method F3 .85 .86 .873
.85 .85 .85 .93A3 .87 .89 .89 .87 .87 .88 .94 .92E3 .86 .87 .88 .86 .86 .87 .95 .95 .93
Table 9.16. Squared multiple correlations andcoefficients of determination
Xl.97
X2.98
X3.94
X4.97
X5.94
X6.95
X7.96
X8.98
X9.95
Coefficient of determination = 1.0
---------------------------------------------------------
477

Table 9.17. Goodness of fit statisticsr:Fit:RMSR:
29.0 (p = .36).79.01
Table 9.18. 1 matrix for the test method facets (~1, ~2and ~3)------------------~--------------------------------------11 12 13
11 1.012 .94 1.013 .91 .90 1.0---------------------------------------------------------
Table 9.19. Factor loadings on ~ variables for thecorrelation matrix---------------------------------------------------------
Xl X2 X3 X4 X5 X6 X7 X8 X9
~1 .32 .03 .01 .34 .01 .01 .26 .03 .01~2 .02 .36 .01 .02 .14 .01 .02 .43 .01~3 .20 .02 .26 .02 .01 .30 .02 .02 .35---------------------------------------------------------Table 9.20. Modification index for the uncorrectedcorrelation matrix---------------------------------------------------------Xl X2 X3 X4 X5 X6 X7 X8 X9
~1 0.00 1.52 0.06 0.00 0.01 1.45 0.00 6.06 0.47~2 0.64 0.00 0.11 0.09 0.00 0.53 2.19 0.00 0.01~3 0.51 0.16 0.00 0.06 0.53 0.00 1.23 0.00 0.00---------------------------------------------------------
478

Table 9.21. cSikstatistics for scales and tasks---------------------------------------------------------Fluency Band 2 3 4 5 6
Task 1 -3.96 -1.72 0.24 1.10 4.34Task 2 -3.99 -1.46 0.11 1.73 3.60Task 3 -3.88 -1.73 0.07 1.19 3.64
Accuracy Band 2 3 4 5
Task 1 -4.43 -0.56 1.24 3.76Task 2 -3.24 -0.60 0.60 3.25Task 3 -3.70 -1.13 1.23 3.60
ELTS Band 3 4 5 6 7 8 9
Task 1 -3.94 -3.45 -1.24 0.43 3.19 5.07Task 2 -5.44 -3.56 -1.78 -0.47 1.92 3.70 5.63Task 3 -4.18 -4.39 -2.70 -1.11 1.86 3.88 6.65---------------------------------------------------------Table 9.22. Deviations from the mean cSik(cS.K)---------------------------------------------------------Fluency Band 2 3 4 5 6
Task 1 .02 -.08 .10 -.24 .48Task 2 .05 .18 -.03 .39 -.26Task 3 -.07 -.09 -.07 -.15 -.22
Accuracy Band 2 3 4 5
Task 1 -.64 .20 .22 .22Task 2 .55 .16 -.42 -.29Task 3 .09 -.37 .21 .06
ELTS Band 3 4 5 6 7 8 9
Task 1 .58 .35 .67 .81 .87 .85Task 2 -.92 .24 .13 -.09 -.40 -.52 -.51Task 3 .34 -.59 -.79 -.73 -.46 -.34 .51---------------------------------------------------------
479

Table 9.23. Rasch Partial Credit Validity statistics---------------------------------------------------------Fluency Band 2 3 4 5 6
Task 1 .98 .92 .90 .77 .57Task 2 .95 .82 ..97 .64 .75Task 3 .94 .91 .93 .85 .79
Accuracy Band 2 3 4 5
Task 1 .46 .80 .79 .79Task 2 .52 .84 .61 .72Task 3 .91 .65 .79 .94
ELTS Band 3 4 5 6 7 8 9
Task 1 .50 .67 .44 .37 .34 .35Task 2 .32 .77 .87 .91 .63 .54 .55Task 3 .68 .49 .38 .41 .58 .68 .55---------------------------------------------------------
480

Appendix to Chapter Ten
10.1. Interviews with ratersIn the following transcripts utterances in [square
brackets] are those of the interviewer.Rater 1
Question 1[What kind of language do you think each of the threetasks would have elicited?]Well, the first one with sports was very similar to thekind of things they do in class actually. Although itseems to be easy I don't think it is, because the firstquestion is "Can you describe the picture?" and theanswer you get from the students is "I can see amountain," "I can see a man climbing." They found it verydifficult to describe the pictures, although the studentsare used to describing pictures like that. However, thelanguage they had to use I believe is••• doesn't requirecomplex language. Yes, I think it is simpler than theother tasks. They can get away with simpler grammar inthat kind of exercise; as I said before, they come upwith short answers all the time and you have to keep onasking them questions because they just describe whatthey see in front of them and they expect you to keep onasking questions.Question 2[Which of the three tasks did you think was the mostdifficult/easiest for the stUdents?]
481

Well the difficult one, I believe, was the second one.Maybe because of the passage. It was a bit long I thinkfirst of all. And then the vocabulary in the passage Ibelieve was not the kind of vocabulary you experiencefrom a class unless they happen to have read a passage onthat particular topic. The terms used in the passagearen't the kind they come across every day or even intheir text books. Yes, and this is the reason that theyfound it difficult. Of course, I don't know how much timethey were given to read the passage. If I remember well,how much time did they have? [Half an hour.] Half anhour. Well, half an hour was more than enough, but thenagain as I said I believe the terms and vocabulary were abit difficult for them because they don't read that kindof text. The easiest. The task students seemed to be mostinterested in was the group discussion, maybe because •••the university ••• tasks like this a a bit difficult.However, they got on very well, maybe because it issomething they are interested in, something they havetalked about before, they have listened to ideas fromother people, they have probably discussed it with theirparents, their teachers, and because they were interestedthey were more fluent. Whether it was easy or not I, wellin that respect the way that they found it, they weremore fluent. It was easy. Simply because it was withintheir interests. Then again, the first one, as I said atthe beginning, they find it difficult to describe thepictures, but then again when you went on and asked them
482

to talk about their own sports they found it easier totalk about what they are interested in and what they dothemselves, how they employ themselves in their sparetime. That particular bit I think is the easiest.Question 3[Which task produced the most assessable language interms of (i) quantity and (ii) quality?]Well, I believe task 3, the discussion on the university,yes, because they had a lot to talk about [So it was thechoice of topic?] Yes.Question 4[Did you think any of the topics were unfair?]Possibly the second one, for the reasons I gave before.Question 5[If you could revise any of the three tasks, what wouldyou change to make them better?]The second one. I would give them a shorter passage andwell, I don't know where that passage was taken fromanyway. Or the passage could be simplified, and inaddition to that the graphs: they found the graphs veryconfusing possibly because they don't usually deal withthings like that. There are some students who follow acourse in statistics. In that case they probably find iteasy, but then again the graphs themselves were veryconfusing because of the headings. I think they confusedthe two graphs and they didn't know what they weretalking about. They couldn't read the graphs.
483

QuestiQn 6[Do you have any other comments on the tasks?]No, I don't think so.Question 7[Did you find the Fluency scale easy to use?]Well, can I say something general about the scales? Well,I find them wordy, long, and if you've got to go throughthem while you're examining a student ••• I found itdifficult anyway, myself. I would rather have somethingshorter and in a list form. That's why I have underlinedthese points because I could easily see something Iwanted to. otherwise, I believe they were detailed enoughand they included all the particular points someoneshould look for when they are examining a student.something else I wanted to mention is that you can havesomething like this with two or three paragraphs in eachband and so many papers, yes. For example the first bandstarts with pauses and when you go on to band 2 you have,let me see, or band 3 the first paragraph talks aboutmisunderstanding a question. The point I'm trying to makehere is that the first paragraph in each band should be
the first topic. So if pauses is in the first paragraph,it should be in the first paragraph in the second band,and the third band, so that it would be easier for theexaminer to look for the points he wants. There should bea kind of sequence to it. That's all.
484

Question 8[Did the Fluency scale contain any descriptors/parts ofdescriptors which you think are not a part of the conceptof fluency?]I don't think so.Question 9
[Did the Fluency scale not contain anything which is, inyour opinion, part of the concept of fluency?]No.Question 10
[When rating, did you rely on any criteria other thanthose in the rating scale?]No, I haven't thought of anything.Question 11
[Did you find that you used the entire range of possiblebands?]Yes, yes I did.Question 12
[Did you think that the amount of detail in the Fluencyscale was appropriate?]No.ouestion 13[omitted for this rater]Question 14[Did you find the Accuracy scale easy to use?]Yes, apart from it being wordy like the fluency scale.
485

Question 15[Did the Accuracy scale contain any descriptors/parts ofdescriptors which you think are not a part of the conceptof accuracy?]No, I don't think so.ouestion 16
[Did the Accuracy scale not contain anything which is, inyour opinion, part of the concept of accuracy?]No.Question 17
[When rating, did you rely on any criteria other thanthose in the rating scale?]No.Question 18[Did you find that you used the entire range of possiblebands?]Yesouestion 19[Did you think that the amount of detail in the Accuracyscale was appropriate?]Too detailed.ouestion 20[Do you have any other comments on the use of theAccuracy scale or descriptors?]No, I believe I've covered what I wanted to say.
486

Question 21[Were there any particular students who you haddifficulty rating either in terms of fluency or accuracy?If so, please explain why?]Yes, I believe it was difficult to place students withinthe range of 1 to 6. If it was higher then it would beprobably easier. 1 to 20 or 1 to 10.Question 22[Do you think you are a particularly lenient or harshrater?]Sometimes harsh, I think it depends. When I find thatstudents keep on staying silent when being askedquestions one after the other then I am particularlyharsh, and also when they make basic mistakes. In thatcase again I'm particularly harsh. Lenient? I wouldn'tsay I'm lenient. What I would say is I'm probably misledsometimes because of the ability of some students to keepon talking and sometimes they keep on making mistakes,but because they speak so fast sometimes you get theimpression that they are fluent even though they are not.So I don't think I'm lenient in the sense that I feelsorry for them, but I'm misled. At that particular momentI feel they're good although later on I change my mind.Question 23[Do you have any further general comments regarding theprocess of assessing oral proficiency?]No.
487

Bater 2
QuestiQn 1[What kind Qf language dQ YQU think each Qf the threetasks WQuld have elicited?]The first Qne was everyday language requiring everydayvQcabulary and expressiQns about their hQbbies and likesand dislikes, and the secQnd and third parts I think theyboth demanded mQre intellectual cQncepts. They had tQkeep cQmparing, althQugh the secQnd Qne was mQredifficult than the third Qne because the third Qne wasfamiliar tQ them I think.QuestiQn 2[Which Qf the three tasks did YQU think was the mQstdifficult/easiest fQr the students?]I think the secQnd Qne was mQst difficult and the easiestthe first. MQst prQbably, well I thQught the secQnd wasthe mQst difficult because they CQuld nQt actually readand read the graph, understand and analyze the graph andthe passage was a little bit difficult fQr them mQstprQbably, but ••• mQst prQbably the vQcabulary wasdifficult fQr them. [SQ YQU thQught that the picture taskwas the easiest?] I believe SQ, because they CQuld allmanage tQ describe what they saw in the picture. MQstprQbably they were used tQ the activities, althQugh theyCQped very well with the third Qne, but I thQught theywere mQre cQmfQrtable because they were in grQups and inthe first Qne they had tQ talk about their hQbbies and
488

interests which they've been doing doing all along. Theywere used to that kind of task.Question 3[Which task produced the most assessable language interms of (i) quantity and (ii) quality?]I think the first one because the second one didn't, theywere not comfortable, they couldn't actually answer orsay what they wanted to say, so there wasn't very muchlanguage for us, so the first one.Question 4[Did you think any of the topics were unfair?]No I didn't. I thought they were very fair. I think theyshould be able to handle something like the second taskmuch better than they did.Question 5
[If you could revise any of the three tasks, what wouldyou change to make them better?]Most probably I would choose a shorter passage for thesecond task, and that's all I would change.Question 6
[Do you have any other comments on the tasks?]No.Question 7[Did you find the Fluency scale easy to use?]Yes it was, but I thought of changing the format of theband descriptors. I found that you repeated yourself overand over and I would prefer if we changed the fluencyinto communication because I believe that communication,
489

the word communication, shows, covers fluency, and more.Communication is not there in the band descriptors.Question 8[Did the Fluency scale contain any descriptors/parts ofdescriptors which you think are not a part of the conceptof fluency?]No, I don't think so.Question 9[Did the Fluency scale not contain anything which is, inyour opinion, part of the concept of fluency?]No, I can't remember.Question 10[When rating, did you rely on any criteria other thanthose in the rating scale?]No, I didn't; but I was wondering whether we should takepronunciation into account when marking them on fluency,and there was a time when a very good student kept sayinga word incorrectly and I didn't know what to do so in theend I disregarded it.Question 11[Did you find that you used the entire range of possiblebands?]Yes. I found the marking a bit restrictive. sometimes Ifound that a student was neither a band 3 nor a 4 and Iwould have preferred much a greater band range [You meanyou would have liked something in between?] In between,yes. I couldn't actually fit them anywhere. It wasn'tvery often but I found there were cases like that.
490

Question 12[Did you think that the amount of detail in the Fluencyscale was appropriate?]They need to be made shorter because in the end I didn'tI couldn't really remember each point that was writtendown and I remembered just the most important points thatI had to listen for.Question 13[Do you have any other comments on the use of the Fluencyscale or descriptors?]I've already mentioned the mark range. I would have likedit to be communication, and flexibility. It didn't takethat into account at all. I don't know whether we couldcombine it with fluency under communication. But if youkeep your mark range I think you should have banddescriptors for 0 and 5. Anything else ••• no, there'snothing else.Question 14[Did you find the Accuracy scale easy to use?]Yes. We had enough information, something that worried meabout the ELTS band which was not clear. The ELTS bandwas not clear, and I found it very clear and you canwatch you can look for each student for each ••• in eachband.Question 15[Did the Accuracy scale contain any descriptors/parts ofdescriptors which you think are not a part of the concept
491

of accuracy?]No, I don't think so.Question 16
[Did the Accuracy scale not contain anything which is, inyour opinion, part of the concept of accuracy?]I don't think so, no.ouestion 17
[When rating, did you rely on any criteria other thanthose in the rating scale?]No.Question 18
[Did you find that you used the entire range of possiblebands?]Yes, but as I said before I would have preferred more, awider mark range.Question 19
[Did you think that the amount of detail in the Accuracyscale was appropriate?]It was appropriate, but most probably it could do withless. I found that it was wordy. You could cut down onthe actual explanation, make it more more ••• shorter. Andmost probably give the examiner a shorter form, otherwiseyou have to highlight the main points.ouestion 20
[Do you have any other comments on the use of theAccuracy scale or descriptors?]No.
492

Question 21[Were there any particular students who you haddifficulty rating either in terms of fluency or accuracy?If so, please explain why?]There was one student who didn't say very much and Iwasn't sure what mark to give. He was in a group withother students and he didn't have the chance to say much.I gave him a mark of course. And there were a few morewhere I thought he was a 4 and then I looked at the banddescriptors and I said no, he's not a 4, then I looked at3 and I thought no, he's not a 3 either. And I believe Igave a 3 rather than a 4 in the end.Question 22[Do you think you are a particularly lenient or harshrater?]I think I was fair, although there was one girl Icouldn't hear at all, although I think she must have beenvery fluent I gave her a 5 but I wasn't confident.Question 23[Do you have any further general comments regarding theprocess of assessing oral proficiency?]No.
Rater 3
Question 1[What kind of language do you think each of the threetasks would have elicited?]
493

The first one, with the picture, you mean like present,what tenses what ••• yes, with the leisure what they dowhat they enjoy doing what they like doing generally,whereas the second task was trying was more complexobviously. Trying to pick out on a more complex topicsomething like poverty, and again generally, but it wasmore complex the poverty one [Do you think there was anydifference in the kind of language the students had touse?] Yes [not in terms of complexity] yes, yes becauseactually they are both using the present tense I don'tknow exactly how to answer this [that's okay, how aboutthe third task?] The third one which was universitywasn't it, that one was difficult, they found itdifficult, that one is more, yes that was more complexthat was with more "should be" and "if they did this"more conditionals, that was more complex in structuresthat the first two.Question 2[Which of the three tasks did you think was the mostdifficult/easiest for the students?]The third one was the most difficult discussing theuniversity, and I could see some of them were strugglingto keep the discussion going, and the first one was theeasiest, the first one with the pictures, and it could bebecause we often do it with them in class, its topics wehave discussed before. [Do you think that the pictureformat is something they are familiar with as well?] Yes,yes more than passages and •••
494

Question 3[Which task produced the most assessable language interms of (i) quantity and (ii) quality?]I found the first one, I was able to assess them allbecause they were more fluent, they spoke more, the firstone, the second one about poverty I could pick, I wasable to distinguish who were the better ones from the notso good ones, and the third one I found a bit difficultto asses the third one, also because they were strugglingto keep it going. I found the second one I coulddistinguish who were the really good ones from the weakones.Question 4[Did you think any of the topics were unfair?]No.Question 5[If you could revise any of the three tasks, what wouldyou change to make them better?]Well, maybe the third one. Maybe I would have done it abit different ••. differently. This was what the studentsgot, and the passage. Well I suppose ... I don't know ifI'd be able to ••• but if I did it, I can't think offhand, but if I had to change one it would be the thirdone.
Question 6[Do you have any other comments on the tasks?]
495

No.
Question 7[Did you find the Fluency scale easy to use?]Yes. The fluency was easy to use, and of course I
preferred well, the ELTS is more general though. Qut ofthe three ELTS I found is the easiest to use out of thethree because it was it was clearer and it was moreconcise. Yes, whereas here I had to keep reading it overand over. It was difficult to internalise the other two.[You found the ELTS the easiest to use, but did you findit very difficult to use the fluency scale?] No, no, notdifficult, it was okay.Question 8
[Did the Fluency scale contain any descriptors/parts ofdescriptors which you think are not a part of the conceptof fluency?]I didn't notice anything, no.Question 9
[Did the Fluency scale not contain anything which is, inyour opinion, part of the concept of fluency?]I don't know, no.Question 10[When rating, did you rely on any criteria other thanthose in the rating scale?]No.Question 11[Did you find that you used the entire range of possible
496

bands?]No, I didn't use ... the bands I used mainly were in themiddle, the 3, 4, 5 bands rather than the other two. Ididn't go to the extremes, no.Question 12
[Did you think that the amount of detail in the Fluencyscale was appropriate?]It's difficult to be able to •.• I had to go through andhighlight what I thought ••• it was very difficult tointernalise .•. it was too detailed, whereas points wouldhave been easier.Question 13
[Do you have any other comments on the use of the Fluencyscale or descriptors?]No. It wasn't difficult to assess them actually. It wasgood apart from the fact that it was too long.Question 14
[Did you find the Accuracy scale easy to use?]Yes. Actually I found it easier than fluency because Iwas able to pinpoint when you say with verb forms andgrammatical structures, it was easier to pick out theareas.Question 15
[Did the Accuracy scale contain any descriptors/parts ofdescriptors which you think are not a part of the conceptof accuracy?]No.
497

Question 16[Did the Accuracy scale not contain anything which is, inyour opinion, part of the concept of accuracy?]No. Again it was very good descriptors the only thing itwas the detail, otherwise it was good once I went throughand picked out the main things and highlighted them.Question 17
[When rating, did you rely on any criteria other thanthose in the rating scale?]No.Question 18
[Did you find that you used the entire range of possiblebands?]Again, not really. I was towards the middle again. I diduse a 2 I remember, but it was 3, 4, 5. Yes. So the top Idid use. Not so much the number 1.Question 19
[Did you think that the amount of detail in the Accuracyscale was appropriate?]It was too detailed.Question 20
[Do you have any other comments on the use of theAccuracy scale or descriptors?]No.
498

Question 21[Were there any particular students who you haddifficulty rating either in terms of fluency or accuracy?If so, please explain why?]There was one pupil, maybe there were two or three that Ifelt I couldn't quite because they weren't quite in theone band but I couldn't lower them to the lower bandjudging from some of these, and I think it was thefluency that I had the problem with. [You wanted a halfband somewhere?] Yes.Question 22[Do you think you are a particularly lenient or harshrater?]I'm not harsh, no. I think I tend to be a bit more on thelenient side. [Do you mean to say that you areinterpreting the band descriptors in your own particularway?] In a way, yes. Especially when it says that thingabout not impeding or if something doesn't impedeunderstanding or, I sometimes think well it doesn't. Ican still understand and pull them up a bit, whereasmaybe it does impede, judging from other teachers whenwe've been doing things together. You have to be moretolerant.Question 23[Do you have any further general comments regarding theprocess of assessing oral proficiency?]
499

Well, I thought it was generally very good, and all allthree, well no the third one might have been difficultbut maybe it's just me or I don't know. I found thatgenerally it was very good and the descriptors were goodbut there were too many to keep looking through to markall at once. But generally I think they were goodinterviews. It flowed naturally as well, it wasn't falseor artificial like some interviews.
Rater 4
Question 1[What kind of language do you think each of the threetasks would have elicited?]Apart from vocabulary, opinions, agreement,disagreement ••• [Which one would that have been?] I wouldhave thought all three, don't you think all three wouldhave had that? Depending on the character of the studentof course. If he's willing to talk. Agreement,disagreement, vocabulary.OUestion 2[Which of the three tasks did you think was the mostdifficult/easiest for the students?]The one which was most difficult. I thought the secondone was. The second task. The first one so - so. They hadsomething to say about that, but the second task Ithought was more difficult. And the third they found theeasiest I think. Maybe because they knew it was ••• nearerto what they had been talking about in their general
500

conversation, and so they knew something about it. [So itwas because the topic was more familiar?] Yes.Question 3[Which task produced the most assessable language interms of (i) quantity and (ii) quality?]The third. I think so yes, the third. Again because Ithink it was generally because they knew about the topic.And it interested them enough to talk and it [inaudible]what they knew through language and vocabulary, so I gotmore information from the third task.Question 4[Did you think any of the topics were unfair?]Unfair. Maybe the second one; but then again it's becausethey didn't know very much about it. Yes. So I suppose itcould have been unfair in that respect.Question 5[If you could revise any of the three tasks, what wouldyou change to make them better?]That needs thinking. Maybe more guidelines for the secondone. All these charts and statistics. It's just too muchfor them. More guidelines. More guided questions maybe,to have helped them. Qr an explanation more you knowapart from the examiner. Because they misunderstood thecharts and exactly what they had to talk about. The firstone. They had coloured photographs didn't they? So thatwasn't too bad. Some of the topics were I don't know, wayout. Maybe they didn't have a lot to talk about. I meanballooning and the others maybe they didn't have a lot to
501

talk about, so if they were topics that they had alreadyyou know done, like cycling or swimming or deep seadiving, something like that, maybe they would have hadmore to say about it.Question 6[Do you have any other comments on the tasks?]No.Question 7[Did you find the Fluency scale easy to use?]No, not really. No. I think there was too much in eachband for me to keep going back and reading them. I foundthere was too much in each band. I had to read it and re-read it every time you know. To get familiar with it. Andthen sometimes I wasn't sure between a two and a three ora three and a four. Very similar. So I had somedifficulty there.Question 8[Did the Fluency scale contain any descriptors/parts ofdescriptors which you think are not a part of the conceptof fluency?]You mention a lot of grammatical points in fluency. [Canyou give me an example?] No, I can't think of any.Question 9[Did the Fluency scale not contain anything which is, inyour opinion, part of the concept of fluency?]I made a point here. Some of the students were very goodand they understood and they could give back humour youknow. And and that wasn't in it. That's quite advanced
502

isn't it though. Being able to tell a joke and and therewas a lot of humour from some of the students. So I don'tknow, maybe it could have been put in somewhere. One ofthe bands. Able to you know interact with the examinerand have this ••• it's quite advanced stuff but I don'tknow.Question 10[When rating, did you rely on any criteria other thanthose in the rating scale?]No. No. There is this gut feeling of course all the timebecause being an examiner you expect .•• but most of it Iwas just looking at the bands.Question 11[Did you find that you used the entire range of possiblebands?]Yes. Yes. Yes.Question 12[omitted for this rater]Question 13[Do you have any other comments on the use of the Fluencyscale or descriptors?]Apart from being long and I had to keep looking over themagain no, no, no, okay.Question 14[Did you find the Accuracy scale easy to use?]So - so. Again a bit better than the fluency. Therewasn't very much to look at so it helped. If there wasless to look at it would be even better. Would have been
503

even better. [So you found the amount of detail toomuch?] Yes. Especially when you're examining you and youwant to be sure of what you're doing. Yes.Question 15[Did the Accuracy scale contain any descriptors/parts ofdescriptors which you think are not a part of the conceptof accuracy?]No. I don't think so. Can I just remind myself. No, no.Very detailed though. We had to think like did they saymuch of do and mayor say and take. I don't know that wasa bit too •••Question 16[Did the Accuracy scale not contain anything which is, inyour opinion, part of the concept of accuracy?]I think so - pronunciation. There wasn't anything thereand I felt some of the students made mistakes ••• or werethey mistakes •.• I wasn't sure because of thepronunciation. And these were Cypriot students. Probablybecause I know the language I was able to presume whatthey were saying, but if they were completely differentyou know from different countries and backgrounds I thinkit would have been an inhibited area that we couldmisunderstand. [Would you put pronunciation in anaccuracy scale or would you prefer a separatepronunciation scale?] No, I think it would go intoaccuracy.Question 17[When rating, did you rely on any criteria other than
504

those in the rating scale?]No. As I said before there was always this gut feeling,but otherwise I kept looking at the erm •.• and try toavoid the gut feeling. I don't know if I did it very welljust looking at the bands.Question 18[Did you find that you used the entire range of possiblebands?]Yes.Question 19
[Did you think that the amount of detail in the Accuracyscale was appropriate?]Did you mention verbs? I've got down here verbs wouldhave been more noticeable than ••• Did you mention verbsin the accuracy or was it nouns mostly and tenses. Theydid make a lot of mistakes with their verbs [Do you thinkthere could have been more detail on verbs?] No. It'sjust that it you know showed their ability. Sort of stoodout you know making mistakes with verbs and tenses.Question 20
[Do you have any other comments on the use of theAccuracy scale or descriptors?]No.Question 21[Were there any particular students who you haddifficulty rating either in terms of fluency or accuracy?If so, please explain why?]Apart from one girl who was very quiet, but that again I
505

don't know in the actual room whether I would have beenable to hear her or not, but on the tape she was veryvery quiet so I couldn't understand what she was sayingfor one or two of the tasks. Then there were students whowere extremely weak in some tasks but much better inother tasks. So if there was just one task in anexamination I wouldn't have been able to give an accuratemark. So it did show that they were able to talk betterin some tasks than other tasks. Maybe because it was morerelated to what they had been talking about outside, itwas fairer. [So do you think that an examination would bebetter if the students had to do more than one task?]Yes. Yes. Yes. If you had the time you could do two orthree. But I don't think we have the time for that. It'sa matter of time.Question 22[Do you think you are a particularly lenient or harshrater?]Meither lenient nor harsh.Question 23[Do you have any further general comments regarding theprocess of assessing oral proficiency?]Apart from the cassette and their their being videoed,the students I do think that they were tense. So it wasinhibiting for them to have the cassette. Mot only forthe students I think maybe even for the examiner So Idon't agree with having cassettes. Tasks again. If theywere more related to their level and their age it would
506

have been better. What do you do with speakers. I've gothere a lot of elaborated vocabulary and able to talk veryfluently. We just automatically give them the high mark.But again within their speech they did mark grammaticalerrors. So that I found that difficult. [Are yousuggesting that we should separate lexis and grammar intotwo separate scales?] I think grammar needs to be brokendown. For instance are they using basic grammar forinstance the present not the past very often, and notusing the third conditional or very advanced grammaticalsentences. I think that needs to be broken down. Againjust points because while you're examining it's difficultto read these points because while you're examining it'sdifficult to read these sentences. But if they were justin points it would be easier to to mark. Oh, while I wasmarking this, the level. Did you have in mind the levelor it was just a general bands for students examiningstudents. I mean could this level be used for GCE yourbands. I don't know it's ••• I thought it wasn't right.Because looking at a student with 5 years of Englishwould have been able to talk on most of the subjects andpretty well, would have got a high mark, not a very highmar, but a high mark to pass. But when it came to thewritten exam would no way get through a GCE. [Are yousuggesting that there should be different band scales fordifferent age groups?] Not age groups but different bandscales for different levels of exams. I think so. [Is itnot possible to have a band scale which goes from almost
507

zero proficiency to expert speaker, and place allstudents irrespective of age somewhere along the bandscale?] It must be very detailed I think, because youwould just be giving impression marks. Again, I'm notsure. I mean my impression mark with someone else'simpression mark are completely different. I think itneeds better criteria for better levels, rather the levelof the student. [Who would you use these band scaleswith?] This would have been for me FCE or GCE level, butno way no other than that. I wouldn't use for ••• I woulduse different criteria for the lower students and maybeeven for the ELTS exam. I would use something else. Butnot to use this with different levels of stUdents. Andhaving the students in mind I think is very important. Ifyou haven't taught the level or thinking of the studentin you know the level of the student, then again that'sdiff ••• it's important. I mean for an examiner who hasn'teven taught the level and to use these bands for aspecific purpose I think is I think it's important thatthe examiner should know the level before examining thestudent. I don't know, that's my opinion.(Note: In this transcript the rater refers to FCE, whichis the UCLES First Certificate in English, and GCE, whichis the University of London overseas 0 Level paper inEnglish Language.
508

Rater 5
Question 1[What kind of language do you think each of the threetasks would have elicited?]Well, in the first one where they were discussingdangerous sports, I thought that was sort of speculationbecause you ask why you know why do you think people dothis type of sports. And this is why I feel they had someproblems because they couldn't cope with the language Imean the the vocabulary and also the the functions. Thesecond one is the population and poverty one. I don'tknow ... The group discussion, well the function wastalking about you know education and so on.Question 2[Which of the three tasks did you think was the mostdifficult/easiest for the students?]Well, at first if I'd just looked at the tasks I wouldhave said that the third one would be the most diff •..well you know the second the most difficult and the thirdone I would have thought was quite difficult and I wouldhave thought that the first one was the easiest. Butafter seeing the interviews I've changed my mind and Ithink that the third one was the easiest because it wasthe most relevant to their lives and so on, and theirinterests, and also they were given quite a lot of ideasand vocabulary, but they were able to use the ideas and
509

vocabulary. And even quite weak students performed quitewell and then I would have said the first task was thenext. I wouldn't have said it was easy, but and then thesecond was the most difficult.Question 3[Which task produced the most assessable language interms of (i) quantity and (ii) quality?]The third.Question 4[Did you think any of the topics were unfair?]The second one.Question 5[If you could revise any of the three tasks, what wouldyou change to make them better?]The the third task I thought was very good. I don't thinkI would do anything to that one. And probably the secondone I think they had problems with the bar graph and andthe passage as well. I think possibly I don't know Ithink I would have changed the topic. I think the samekind of thing could have been given to them with a morefamiliar topic.Question 6[Do you have any other comments on the tasks?]No, I thought the third one was very good.Question 7[Did you find the Fluency scale easy to use?]No. Well, each band was too long so it was impossible toremember them to memorise them at all, and sometimes in
510

some ways they didn't appear to refer to fluency. Theydidn't actually refer to the speed of delivery andsometimes you have to be a mind reader in order to decidewhy someone was pausing. Also, what else. Yes, it's inband 2 it says that the candidate will "spend less timepausing to plan the grammar of an utterance." Sometimesit it••. and then in band 3 it says "pauses will occurwhen they require thinking time in order to provide apropositionally appropriate utterance." Well I mean youdon't really know why they're pausing. Probably maybesometimes they're at a loss I mean they don't know whatto say, so you can't really know why somebody pauses.Question 8[Did the Fluency scale contain any descriptors/parts ofdescriptors which you think are not a part of the conceptof fluency?]Well, some of it appears to fit more with the vocabularyrather than fluency. You see for instance it says band 5candidates they demonstrate a confidence in their abilityto get things right the first time, but there are weakcandidates who look confident and they appear you knowthey believe that what they're saying is correct. So it'sand so it's both.Question 9[Did the Fluency scale not contain anything which is, inyour opinion, part of the concept of fluency?]Yes. Yes. Well, it mentions pauses but there's nothingabout speed of delivery or ease of delivery, which I
511

think is mentioned inside the other, in the other bands.Flexibility in ELTS.Question 10
[When rating, did you rely on any criteria other thanthose in the rating scale?]In a way, yes. Well, I think I was influenced by the ELTSbands you know, with flexibility and initiative and soon, because this wasn't really mentioned was it. And thepassiveness of the person being interviewed.Question 11
[Did you find that you used the entire range of possiblebands?]No. I found that I hardly used band 1. I did use band 6
occasionally, but bands one and two I didn't use much.Question 12[Did you think that the amount of detail in the Fluencyscale was appropriate?]Shorter, in note form.Question 13
[Do you have any other comments on the use of the Fluencyscale or descriptors?]No.Question 14[Did you find the Accuracy scale easy to use?]I found that was easier, yes. At least the grammar waseasier to use. Yes. Because you know the errors that theymake were very clearly set out. Well, basically thegrammar descriptors were more concrete and I mean they
512

were practical and so they were easy to follow, whereasthe lexis descriptors were, well, in a way moretheoretical.Question 15[Did the Accuracy scale contain any descriptors/parts ofdescriptors which you think are not a part of the conceptof accuracy?]No, I was quite happy.Question 16
[Did the Accuracy scale not contain anything which is, inyour opinion, part of the concept of accuracy?]No.Question 17[When rating, did you rely on any criteria other thanthose in the rating scale?]No, I didn't.Question 18[Did you find that you used the entire range of possiblebands?]Well, yes I did.Question 19[Did you think that the amount of detail in the Accuracyscale was appropriate?]I think again it would have been better in note form,rather than having to read through sentences, to have thedetail set out you know in note form in a list it wouldbe better, and then it would be easier to make notes asyou are watching the interview.
513

Question 20
[Do you have any other comments on the use of theAccuracy scale or descriptors?]No.Question 21[Were there any particular students who you haddifficulty rating either in terms of fluency or accuracy?If so, please explain why?]Well, yes. On task 3 the last interview I found itdifficult. I don't know if you remember them. They wereobviously weak students, but carrying out that task theythey really did so well on the fluency and accuracyscales. I thought they did really well because of thetask. [So you would prefer weaker stUdents to have moredifficult tasks?] No, no. I was happy with that becauseit showed what they were capable of doing which the othertwo tasks didn't.Question 22
[Do you think you are a particularly lenient or harshrater?]I don't think I'm harsh or lenient. In the middle.Question 23
[Do you have any further general comments regarding theprocess of assessing oral proficiency?]No.
514

10.2. Interviews with studentsIn the following transcripts utterances in [square
brackets] are those of the interviewer.
Student 1
Question 1[What were you thinking about during the interview?]First of all I was thinking that I wanted to takeadvantage of these interviews because it would be it wasa good experience for me. It was the first time and er Iwouldn't mind I knew I wouldn't be able to have anotherchance to do a thing before the exams. [When you areactually taking the interview, when you were sittingthere, what was going through your mind. What were youconcentrating on?] I was trying to guess what the otherquestion would the following question would be. [And whenyou were speaking, were you thinking about what you weresaying or were you thinking ahead all the time?] At timesI was thinking ahead. At times I was trying to plan whatI was going to say, but er I I was also thinking of whatI was saying at the particular moment, the way I wassaying generally, like the part when I talked about theoperations er and I kind of planned it when you asked thequestion.Question 2[If you could do the interview again, with exactly the
515

same material, would you do anything differently?]No. [You were quite happy with it as it is?] Yes.Question 3[Are you nervous when doing oral tests?]During the first interview I remember I was a bitnervous, but not during the other ones. [Yes, so it wasonly the first one] Yes. [Can you imagine circumstancesunder which you would be very nervous?] Under whatcircumstances [Yeah] If I was given er for example apicture I couldn't easily describe because I didn't knowthe vocabulary. That would be a difficult situation so,about a matter that I don't know, that I know nothingabout. I think I would be nervous in such a situation.[But you didn't have any problems with these three, thethree tasks which you did?] No, I found them quite easy.
Student 2
OUestiQn 1[What were YQU thinking about during the interview?]Whether I was gOQd at it, if I was successful. If I wasanswering gQQd Qr if I was bad. [In what way, good?] If Iwas giving lQgical answers and if I was giving goodexpressions .•. [How do you mean?] Grammar and, basicallygrammar. NQt to make mistakes, stupid mistakes, ingrammar. [You mean tQ say you were trying tQ think ofwhat you were going to say in advance Qr YQU werethinking what you were saying as it came out?] sometimesin advance. With the picture I had time to think what I
516

would say in advance, but answering the question it wasjust what came out. [Anything else?] Well, I tried tofind the right words to express something er •.• sometimesI didn't find them, like the spot where I said the goodEnglish. I can't find a word to express it. [Yes, so youwere looking for words] Yes.Question 2[If you could do the interview again, with exactly thesame material, would you do anything differently?]Maybe. I don't think so. Well, now that I've looked at itagain I know some words that I could use, better words.And if two people do an interview it's better I thinkbecause if you don't know what to say there comes a timewhen you don't speak and you don't know what to say, theother he speaks and fills the gap. [Did you like in thediscussion task having the time to prepare?] Yeah, it wasvery useful. It was something to think of what we weregoing to say so we didn't have a gap. [When you werepreparing for that, how did you go about preparing it?]We said that er one was going to er be on one side andthe other going to be on the other side; to have aconversation we were going to be on the opposite er ...side.Question 3[Are you nervous when doing oral tests?]Depends. [Qn what?] The situation. In an exam I would benervous because it's erm you have to do well and you'renervous if you say something wrong and you lose marks.
517

Maybe you lose marks so you have to be good. You areunder the stress that you have to do well.
Student 3
[Well, how well do you think you did?] Well not very wellbecause it was the first time so er, I was a bit worried,anxious and I don't know. And er as you saw I didn't erspeak much. I mean you had to do all the questioning tomake me speak. [So if you could do that interview againyou would try to take over the conversation more?] Yes.Yes.Question 2[If you could do the interview again, with exactly thesame material, would you do anything differently?]I don't know. Maybe bring up some more examples er orexperiences from my life er and more ideas.Question 1[What were you thinking about during the interview?]What a terrible experience (laughter) well er, I don'tknow, maybe I was trying to guess the next question toanswer er while I was looking at the pictures I wastrying to think about the possible questions you know andthink about the possible answers arm ••• I was thinking Ithink a bit more than er the usual one because I wastrying to speak right and not make so many mistakes. AndI think that's why I couldn't speak very much. [Do youfind tasks where you are given planning time easier?]Yes. But it depends on the subject, like the pictures I
518

don't think I need to prepare myself. I mean they wereeasy questions about my life so I didn't have to beprepared, but about the other subjects I think it waseasier because it was about the university so I had toplan what I was going to say. To organise my ideas and •..Question 3[Are you nervous when doing oral tests?]I don't know. Maybe because it was the first time, thefirst experience about er that sort of things. I mean erI have never had an interview before er. I guess that'sall. [Can you imagine yourself doing an interview whereyou felt nervous for some other reason?] No, no.
Student 4
Question 1[What were you thinking about during the interview?]er I was thinking what I was going to say. I was rathernervous. I wasn't sure about what I was saying, because Iwasn't interested in some things and I kept changing mymind. [So you were thinking mainly about ideas?] Yes, andhow I was going to express them. [When you say "how" youwere going to express them, what do you mean?] Phrases,grammar, some vocabulary I was going to use. Thesethings.Question 2[If you could do the interview again, with exactly thesame material, would you do anything differently?]Yes, I want to do something different but I don't think I
519

would do anything different. Maybe I would talk louder. Idon't think I would do anything else. [Yes, you have gota very quite voice, and are you shy generally?] Yes. [Doyou think that would influence an examiner?] Yes,definitely, because if I don't have fluency that means Iwon't get any marks. [So just for an interview you thinkthat you have to alter your character?] Yes. I try to butI don't think I can do anything different, because Idon't feel it's natural. When I talk with others I feelit's more natural than in the interview. I just don'tlike it. [I hope you don't mind if I follow this one.When you're outside say just with friends, you don't havethe same problems with talking and expressing yourself?]It depends with what friends because let's sayer thefriends here at the English Institute are not too closeto me but the others at school are. I've known them formany years so it's different. But still I'm shy. In theinterview because I'm shy I'm nervous because I thinkthat I won't like it. That's why. I'm nervous and I don'ttalk. [Can you think of anything which the interviewercould look for when you go for an interview that wouldtell him or her that you were shy rather than unable totalk freely? Do you understand what I mean?] Yes. Well,it depends on the examiner. If he or she is just lookingfor er grammar or vocabulary erm they won't understandthat I'm shy. But if he knows something about psychologythey would understand.Question 3
520

[omitted for this student]
Student 5
At first when I finished the interview I thought I hadtalked a lot, that I had said some nice things. But now Ithink I could say a lot more, or better. It was a bitfunny because I didn't think I was talking like that.[Oh, you mean the sound of your own voice?] Yes. [Well,unless you record yourself many times it's difficult toimagine what you sound like.] Yes.Question 1[What were you thinking about during the interview?]Well, erm, I was thinking about the pictures er thequestions, but I didn't have er the time to realise whatI had to say, er I had to answer immediately so I didn'tthink a lot before er I answered the questions. I thinkif I had more time to think it would be better. It wouldtake more than half an hour then. [When you were actuallytalking what were you thinking about?] I was trying tothink ahead. I just made a lot of mistakes while I wastalking because I was trying to think what I was going toanswer to the next question. I didn't know the nextquestion but I tried to guess.Question 2[If you could do the interview again, with exactly thesame material, would you do anything differently?]
521

Yes, I would say erm more or less the same things, but Iwould express them in another way. A better way. [In thetask where you had time to prepare, did that help you?]Well, not much because in that ten minutes I had to readthe passage that I was given and I had to try tounderstand what it was talking about. But it depends. Itwas the the subject was quite easy and familiar so Ididn't have a problem with that.Question 3[Are you nervous when doing oral tests?]No, not during it. Before it and afterwards. But notduring it. [Why?] I don't know. Before it's because Idon't know what it will be like, the questions I have toanswer erm, and afterwards because I try to think if I eranswer it right or wrong and what I should have said andwhat not, but not during it. [Is there anything anyonecould do to make you feel less nervous?] No. [No, so it'sjust one of those thinqs, a fact of life that you have tolive with?] Yes.
Student 6
Question 1[What were you thinking about during the interview?]I think I was trying to concentrating er but there wereother thoughts in my mind too. School, future er theexam. [So you weren't thinking about what you were sayingat that particular moment?] No, I didn't think it wasimportant to do that but I tried to do well. [Did you
522

like having time to prepare on some tasks? Did it makethings easier for you?] I don't think so, I don't thinktoo must about tests.
Question 2[If you could do the interview again, with exactly thesame material, would you do anything differently?]Find out some useful vocabulary and erm expressions andprobably more fluent erm better pronunciation.Question 3[Are you nervous when doing oral tests?]A bit. It was the first time I had such a test. So I wasuneasy. [So it will go away with practice.] No. I am aforeigner so I don't speak English every day. It's hardto think in English. [So, it doesn't matter what anybodydoes, you would always feel nervous, or could it be takenaway?] Yes, I think sometimes the atmosphere in the examis important. I mean at the interview in the class we dowith our teacher I don't feel nervous at all.
Student 7
Question 1[What were you thinking about during the interview?]When it was going to end. The camera. It was the firsttime to have a camera and erm •.. it was stressful.Question 3[Are you nervous when doing oral tests?]
523

Also I was talking in English and this is not usual forme. I don't do it very often and it was like having a newexperience. [Is there anything an examiner could do tomake you feel more relaxed?] Well erm having a coke inthe exams. A chewing gum. That would make things better,and just to er be friends with the interviewer because ifyou know him or have met him before then you feel morerelaxed.Question 2[If you could do the interview again, with exactly thesame material, would you do anything differently?]Well, I would know what to say. [No, assume you weredoing it again for the first time.] Oh, well if I wasn'tso embarrassed I would say something else. Try to saysomething more interesting. Just this. You see thesubject of sports is very common and each one say erm notvery wide there isn't a wide range to select to talkabout like different kinds of sport [So you were happierwith the other topics?] Not exactly happy. If I had abetter subject like computers that I know that I'minterested in I would say more.
Student 8
I think I had a lot of problems with the picture. I madea lot of grammatical mistakes there and actually er it'sa lack of vocabulary, mostly. In a way, I mean when Isaid it's difficult to climb I mean the way the mountainwas. It was too vertical and he couldn't climb it easily.
524

That's what I wanted to say but I didn't know the words.[The word didn't come at that moment] Yes [You mean youdidn't know the word at all or it just didn't come atthat moment?] sometimes I forget a word. Lots of words Idon't know even simple words I forget them. When I talk,because when you talk it's not like when you're writing.When you're writing you have time to think and if youwrite it down you read it again while when you talk youdon't have the time to think and erm •.•Question 1[What were you thinking about during the interview?]Well, I didn't think of anything special, just theinterview.Question 2[If you could do the interview again, with exactly thesame material, would you do anything differently?]erm I would try to describe the picture better. I don'tthink I described it very well, because I talked aboutthe hills and the background and I didn't know how todescribe the man because my brain stopped. It was frozenand I didn't know what to say. Next time I'll be morecareful. [Do you prefer to have time to prepare as in thediscussion on the university?] Yes. If you had time toprepare it would be all right, yes. Time to make up yourmind I think it's okay.Question 3[Are you nervous when doing oral tests?]Well, it could be an easy thing, but it usually I can't
525

talk I can't pronounce words correctly because my tonguegets a bit ••• and er and also when you talk you have tothink fast, you have to talk a lot, talk fast, and if itisn't your native language, your first language, er youhave to think a bit more. It's difficult to do all thesethings at the same time and talk er good English. [So theanxiety you felt is something that no one can do anythingabout. It's there because you are learning a secondlanguage?] I think if the er the examiner is friendly ander an he doesn't keep marking you all the time you'llfeel like you're talking to a friend of yours or someoneand you won't be that nervous and you won't think aboutthe marks. It's a conversation and not a marking sessionso I think you'll do much better. If a person is friendlyI think it's okay. If he drinks tea all the time or talkswith an Oxford accent then •••
Table 10.3. Ability level of the sample in logits, andsex.---------------------------------------------------------student 1 2 3 4 5 6 7 8
Fluency 4.32 1.90 3.02 N/A 1.64 1.64 1.16 4.68Accuracy 4.16 1.58 3.20 N/A 1.74 1.89 0.99 3.88ELTS 3.62 0.82 2.46 N/A 1.30 0.82 0.67 3.79Sex M M F F F M M M---------------------------------------------------------
526