THE COMPLETE TECHNICAL PAPER PROCEEDINGS
313
THE COMPLETE TECHNICAL PAPER PROCEEDINGS FROM:
-
Upload
khangminh22 -
Category
Documents
-
view
0 -
download
0
Transcript of THE COMPLETE TECHNICAL PAPER PROCEEDINGS

THE COMPLETE TECHNICAL PAPER PROCEEDINGS
FROM:

“BUT THE DEMO LOOKED GREAT” A TECHNICAL PRIMER ON SETTOP SOFTWARE DEVELOPEMENT
Stephen Johnson Coach Media Abstract Creating effectively designed software—for any platform—is a complicated and time-consuming business. Creating software for digital settops has encountered challenges unique to the cable industry: scarce applicable design precedence, a thankfully temporary mania of inflated expectations for “interactive television,” and a paucity of basic technical knowledge about how applications are created and deployed. While the first two issues have largely faded, the last continues to hamper effective application deployment. Without a general understanding of the issues involved in settop software design, cable operators will inevitably experience frustration and disap pointment with their deployments. This paper addresses five topics in software design applicable to digital settops, providing a brief technical background of each issue followed by their individual effects on software performance—and ultimately viewer comprehension and acceptance. While illustrated by real-world examples, this discussion does not focus on a particular settop box manufacturer or set of features; rather, the principles discussed here apply to all platforms. The topics cover the following:
• Middleware Usage • Memory Allocation • Settop Performance • Viewer Interface Details • TV Display Technology
While not comprehensive, this list nevertheless covers a range of technical issues collectively having a large impact on successful software deployment. Armed with
this knowledge, cable operators and other gatekeepers can ask the right questions and thereby create—or procure—better applications to meet their ever-expanding needs.
MIDDLEWARE: FLEXIBILITY VS. SPEED
Middleware refers to a software application that runs programs—but also runs on top of an existing operating system (OS). Think of a web browser, e.g., Internet Explorer™ running “on top of” Windows™ and you get the idea. A middleware application uses code—or even just files of text or formatted data—written according to its own languages and syntax rather than that of the OS. The diagram below illustrates how these various applications stack up:
SETTOP SOFTWARE STACK
OPERATING SYSTEM
MIDDLEWARE
MIDDLEWARE APPLICATION(S)
NATIVEAPPLICATION(S)
DATA & GRAPHICS
DATA & GRAPHICS
Schematic diagram of typical digital settop box software stack
Current Examples How and where is middleware used? The most prominent use today is probably the OpenCable™ Application Platform (OCAP), which uses middleware called the Java Virtual Machine™ (JVM). Java™ was originally developed by Sun Microsystems as an Internet-friendly programming language

that could execute code using a JVM on any operating system. OCAP applications, therefore, are written in Java and could potentially run on any settop operating system; the JVM would handle all the underlying operating system routines. While OCAP remains the most prominent middleware example, the settop box development world has also seen the introduction of middleware applications from companies like OpenTV, Liberate, and Microsoft. With so many companies offering middleware solutions to settop development, why consider any competing strategy? Indeed, in addition to the promise of OCAP middleware offers some very tempting advantages. The Best of All Worlds? Start with labor. Given the latent popularity of Internet-based programming a relatively large pool of trained candidates has become available to code middleware applications—at least of the browser-based or JVM variety. Since middleware programmers don’t write code directly to the operating system, developers are additionally free to “script” quick applications and test them without enduring the rigor of compiling and linking code. Think of an HTML scripter doing a quick web page layout compared to a C++ programmer writing proprietary code and you can appreciate this difference. With deployment flexibility and an available labor pool on its side, what disadvantages could there be to middleware development? Why suffer through hiring programmers to work in a very specific and unforgiving development environment—on code that can’t be used elsewhere? In a word: speed. Programs written without middleware overhead simply run
faster. Sometimes much faster. The reasons for this are simple: fewer instructions to translate and direct, customized code. Think of the stack diagram above; when a middleware program runs its code it has to be continually translated for the operating system. The difference is as dramatic as speaking English to an English speaker versus speaking Italian to the same speaker and attempting to translate it in real-time. While the translation will generally work, no one can reasonably argue it will be as fast or as clear. While it’s certainly the most important reason to avoid middleware development, lack of speed alone unfortunately doesn’t exhaust the disadvantages. Middleware is also very large. Since it translates instructions for many different operating systems—and needs to be resident in the settop’s memory to execute commands at anything approaching reasonable speed—by necessity it often requires generous amounts of precious memory. Many middleware applications simply cannot run on older digital boxes due to memory restrictions. In addition to its other difficulties, middleware platforms also aren’t—alas—as flexible as advertised. Even Sun’s touted Java, once marketed as “write once, run anywhere” has occasionally been derided as “write once, debug everywhere.” Even discounting the jokes, Java developers often find they have to adapt code for JVMs to their particular use. So use of middleware—a key decision point in settop software development—really comes down to flexibility versus speed, with a sizeable caveat on the former and little argument over the latter.

MEMORY: BE LEAN, MEAN, AND PLAY WELL WITH OTHERS
Whether an application uses a middleware platform or not (see previous section), it still loads into the settop’s memory when launched—not unlike how a program loads on your PC. Compared to an average PC, however, settop memory is severely limited. The first issue confronting application memory usage, therefore, is simple: how much room do you need? Many developers equivocate on this issue—and not without good reason. The raw code size specified for an executable application may be misleading for at least three (3) reasons: • The additional data the application
requires (e.g., program guide data) might be even larger than the code that manipulates it;
• Graphics and other large non-code components might not be included (for good reason) in an application’s memory footprint; and
• An application may be sharing memory space with several other applications—about which it has no knowledge—and might be unstable at any size.
Why do developers need to address these issues? Program guide data, for example, can be enormous. One day of TV listing data uses up to 250 kilobytes of memory. Doing the math it’s not hard to see why loading two weeks of guide data (14 x 250K, or 3.5 megabytes) into settops with free memory sizes of a few megabytes presents some difficulties. Graphics are arguable worse: one high-resolution (uncompressed) full screen background requires almost a megabyte of data. And lack of vigilance about several different applications (regardless of size) residing in memory has very high costs: settop crashes (and reboots) correlate very well with this situation.
Developers recognize these issues and devise appropriate strategies to save memory space, but the resulting tradeoffs are far from painless. Memory-related challenges confronting developers—along with accompanying strategies and tradeoffs—are noted in the table below: Challenge Strategy Tradeoff(s) Large application size (including supporting data) vs. limited memory
• Store unused components on server
• Distinguish between launch-ready and full application
• Interactive performance when uploading new data
Large application graphics vs. limited memory
• Store unused components on server
• Compress graphics
• Use settop-based graphics
• Interactive performance when uploading new graphics
• Graphic degradation
• Customized graphic programming
Multiple applications residing in memory
• Limit number of simultaneous running applications
• Certify deployed applications
• Application Swapping
• Extensive Quality Assurance (QA)
To save memory many developers keep a subset of application code, data, and/or graphics stored on a remote server and only load it when required (e.g., on viewer request) to do so. While this strategy saves space, the process of swapping in code and data might create some awkward performance delays when contacting a remote server. Delays become acutely painful when loading graphics as viewers wait for an interface to “arrive” and a screen is not yet visually “complete.”

A related memory-saving strategy effectively divides an application into parts, allowing a smaller version to launch (e.g., initially display on-screen) while the full version is stored remotely (e.g., on a server, as described above) and downloaded later. While requiring some programming subtlety, this strategy mitigates performance delays by: 1) launching application faster; and 2) allowing other applications parts to be loaded into memory while the initial launched application runs. Compressing graphics also saves space, but tradeoffs beyond the obvious—potential visual degradation—should be considered. Depending on the compression schemes (e.g., MPEG, JPEG, BMP, IMG) supported by the settop operating system or middleware, graphics may require decompression time to be properly displayed—adding to performance delays. If compressed graphics can be shown as-is the inherent low-resolution NTSC display standard for television often hides ugly artifacts—to a point. The rapid deployment of High Definition (HD) capable settops—and their demand for high-resolution imagery—will likely eliminate this advantage very soon. The process of creating graphics directly from code available in the settop’s operating system (if available) offers the promise of avoiding speed and compression issues altogether. Already available from the OS, settop-generated graphics display very quickly and require no compression. Creating these graphics, however, requires hyper-specific programming skills and generous development time; working at the level of individual screen pixels is not uncommon. Memory management issues unfortunately aren’t limited to those relating to application size; keeping several applications—regardless of their size(s)—simultaneously in
a settop’s memory creates challenges of its own. Furthermore, these challenges directly affect the cable operator since individual developers may have no prior knowledge of other applications with which their programs need to co-exist. As noted above, having a large number of applications in memory often creates settop crashes for a variety of technical reasons beyond the scope of this paper. With this unpleasant fact in mind, cable operators need to address two challenges in this area: 1) keeping applications from running simultaneously as much as possible; and/or 2) testing multiple application combinations before deployment. The first challenge places restrictions on application features and user interfaces while the second potentially imposes testing costs on the operator. Settop boxes will probably never have enough memory for every deployed application—or combination of applications. Even with the current tradeoffs operators have deployed dozens of stable and robust interactive products. Intimate knowledge of these issues often makes the difference between deployable and “demo” applications.
SETTOP PERFORMANCE: FASTER IS GOOD, ROOMY IS BETTER
Many standards are available to gauge settop hardware performance. The previous section discussed memory management; this section covers two other issues: processor speed and permanent, or non-volatile, memory. Compared to similar hardware in PCs, settop microprocessor speeds are frighteningly slow. Even accounting for settop box economics, the numbers are startling: for example, the MicroSparc

processor in a baseline Scientific Atlanta 3000-series settop clocks in at 166 Megahertz. In non-geekspeak that’s about four to six times slower than an Intel or AMD microprocessor in a cheap PC. Fortunately, raw processor speed pales in importance to how well a settop is optimized to use it—and how well developers make use of it. Current settops are generally optimized to play digital video; relatively speaking, the processing power devoted to running interactive applications doesn’t need to be nearly as fast as that for a PC. Settop applications display graphics and data to viewers and respond to interactive commands but have little need for the number crunching power PCs require for their word processing and spreadsheet tasks. The amount of available memory—both volatile (lost without power) and non-volatile (or NVRAM, maintained without power) in a settop actually has a stronger impact on application speed and stability than its microprocessor clock speed. NVRAM contains data that a developer doesn’t want his application to lose if the settop loses power. Pay per View purchase (secured) data is an obvious example; settops have been storing this data since the days of analog boxes. Applications also use NVRAM for parameters like viewer preferences (e.g., favorite channels) and code-critical data (e.g., patches and updates). NVRAM is also expensive and therefore scarce. The aforementioned Scientific Atlanta box contains all of 2000 bytes of it. Developers who run out of room are forced to store this important data on a server, via sending it at regular intervals and correlating the data with individual settops.
Settop hardware performance therefore boils down to both suggestive and definitive numbers. Raw processor speed can be overrated—but all the memory in the world probably isn’t enough .
VIEWER INTERFACE: THE DEVIL IN THE DETAILS
Even when a settop application runs quickly, uses memory efficiently, doesn’t tax the network or local storage, it still may not look very good. Obviously this is often due to aesthetics, but this paper leaves that hornet’s nest to the legion of TV graphic designers. Rather, the primary focus here is on the technical details of the viewer interface display. While this subject is nearly inexhaustible, a survey of three (3) general areas—graphics, video, and on-screen text—suffices as a primer. Getting Graphic While graphics may be compressed in several creative ways, their resolution is ultimately dictated by the settop’s operating system. Resolution is actually made up of two separate parameters: size and color depth. The supported sizes and color depths of some typical settop boxes are shown below: Settop Class/ Manufacturer
Graphic Resolution
Color Depth
Explorer 2000/ Scientific Atlanta
320 x 240* at 72 dpi
16 bits
Explorer 8000/ Scientific Atlanta
640 x 480** 16 bits
DCT-2000/ Motorola
352 x 240 Up to 8 bits
DCT-5100/ Motorola
704 x 480 Up to 24 bits
*640 x 480 supported, but not typically used due to memory constraints** Typical use; up to 720 x 480 supported

(Motorola) settop boxes presents a developer with some intriguing differences. Notice from the table above that resolutions and color depth vary on both systems on almost a box-by-box basis. Developing for lower-end settops has attendant difficulties: low resolution graphics must be recreated for the same application on a higher-end box. Graphic resolution is often dictated by the largest image size accommodated, then scaling back if necessary. For example, the settops listed above use so-called “full” and “half” resolutions, meaning the fullest resolution uses twice the horizontal and vertical pixel count as the lowest. By some simple visualization one can see these labels are somewhat misleading: a full resolution image (at the same color depth) actually requires four times the memory capacity as a half resolution image (see below).
"Full" ResolutionExplorer / 640 x 480
DCT / 704 x 480
"Half" ResolutionExplorer / 320 x 240
DCT / 352x 240
Comparison of “Half” and “Full” Graphic Resolutions Use of low resolution graphics is often an attractive tradeoff when memory space is a consideration. In this case graphics are expanded (“stretched”) at twice their horizontal and vertical resolution to fill the screen. Fortunately the NTSC television display standard—which relies on flickering interlaced lines rather than pixels—often compensates for the low resolutions artifacts (or “stretch marks”).
Video: Scale with Caution Settop applications have little control over full-screen video playback resolution; the MPEG video compression standard (used in all digital settops) uses its own display parameters. However, when video plays back at less-than-full-screen, e.g., in a quarter screen “window”, the settop application chooses the “scaled” video window size. Since settops scale video by simply removing pixels, video playback in windows at non-fractional sizes can introduce visual anomalies: “pixelated” objects and jagged diagonal edges. In this case the relatively low resolution of NTSC television doesn’t help and often hurts: degraded video images still move at 30 frames/second and are more likely than graphics to be noticed by viewers. What’s Your Type? Like graphics and video, on-screen type must abide by resolutions largely set by the settop operating system. Unlike these other visual criteria, however, type resolution is determined by how it is rendered to the screen rather than the number of pixels or color depth of its characters. Most operating systems support both vector-based and anti-aliased fonts; the difference can be seen in the images below:
f
Vector-based Anti-aliased Bitmapped

Vector-based fonts rely on mathematical formulas to print characters with smooth edges, not unlike a standard laser printer. Although these formulas take up very little space (approximately 32 kilobytes per typeface; bold and italic versions not included) many settops exclude them because developers don’t tend to use the same typeface—and including more than a few creates storage difficulties. Anti-aliased fonts typically take up less space than vector-based fonts—and surprisingly look better at some resolutions—but have two non-trivial drawbacks: 1) they must be adjusted—sometimes pixel-by-pixel—at low resolutions to read properly; and 2) the “fuzzy” edges of their characters must be legible against every background on which they’re rendered. If an application cannot use either vector-based or anti-aliased fonts, settops typically provide several bitmapped fonts as a fallback. Characters from this font type have very rough edges but some typefaces rendered in this fashion can be reasonably legible and acceptable for limited application use.
TV DISPLAY TECHNOLOGY: “ART IS NOTHING WITHOUT LIMITS”i
Since settop applications focus primarily on displaying images to viewers (and occasionally receiving feedback) developers need a thorough understanding of television visual technology. Ignorance of these constraints doesn’t necessitate catastrophic
consequences—but the resulting applications can look pretty ugly. Interfaces that flout technical constraints exhibit overly bright colors, distorted images, and illegible or off-screen text and graphics. Two basic technical constraints on displays come straight from the arcane world of television post-production: title safety and color limits. Better Safe Than (Really) Sorry Commercial televisionsii do not show an entire video signal; rather, the TV monitor itself visually cuts off the outside edges. Images and colors at the edge of the display appear to “bleed off” the border of a TV. The reasons for this are complex, but this type of display has some advantages, e.g., allowing certain unsightly video artifacts like the vertical blanking interval, or VBI, (where closed-captioning information is transmitted) to be hidden off-screen. To complicate matters, TVs differ—sometimes drastically—in the actual amount of signal they cut off; that is, two TVs may display different amounts of the same signal. Televisions uses two cut-off display conventions: title safe, meaning the area where no TV will ever cut off any portion of an image and action safe, meaning the area where on-screen action (e.g., something moving) must be contained. Action safe is slightly larger than title safe since viewers are not especially bothered by moving objects occasionally disappearing at the edges of the screen; their eyes can compensate for the

movement. The image below shows how the safety areas work on a standard 4:3 television display.
������
Clear 55
Tonight
1515NewsNews
ACTION SAFETITLE SAFE
John Smith WeatherJohn Smith Weather
Comparison of Full-Screen Signal, Action Safety, and Title Safety
So how much should images be reduced to “fit” into these safety areas? Many rules-of-thumb exist, but a good conservative standard is 20% less than full-screen for title safety and 15% less for action safety. NTSC: Never Twice (the) Same Color As for color limits, televisions display a rather narrow range. Historical precedent is at work here: color usage was nearly an afterthought when televisions were initially developed. When black-and-white television was the standard, video was recorded at a speed of 29.97 frames-per-second; the remaining 0.03 cycles (to fill-out the 30 frames/second standard) were reserved for the (future) color spectrum. This range—0.03 Hz—is not large, and favors blue and green hues at the expense of other colors.
Settop developers wrestling with color should be aware that televisions—unlike standard computer monitors—are not calibrated to saturation values. A PC display typically uses colors in mixed values of red, green, and blue (or R/G/B); these are color saturation values, describing a linear scale of how much of each color is included to create a final value. (This technology largely mimics the process used for printing, which uses a mixture of four colors: Cyan, Magenta, Yellow, and Black, or CMYK.) Television, however, create colors based on chroma, luminance and other values that are not direct mixes of saturated colors. This process makes television sets very sensitive to sharp changes in brightness and contrast, especially with highly saturated colors, e.g., rich red, pure black and white. Offending this sensitivity leads to displays that bleed or “buzz” at the edges of colored areas of text. And strong contrasting colors aligned vertically create a bowing effect, e.g., the vertical separated image appears to curve inward or outward, depending on its on-screen placement. Armed with technical knowledge about television display constraints, developers should also consider conforming to less-formal design limitations: • Conform to standard television graphic
conventions. These include how screen objects move or animate, how images are rendered against other images, and how screens of information or video transition from one to the next (e.g., via visual effects like “wipes” and “dissolves”).
• Avoid inactivity. While an interface that must be addressed by a viewer may be “held” for a short time, never forget television is a visual, moving medium.
• Make text BIG and BOLD—and ensure messages stand out from the background on which they’re rendered.

This paper merely scratches the surface of the rich subject of TV display technology; the principles delineated here only aim to starting a design on a firm technological foundation.
CONCLUSION: EMBRACE YOUR
LIMITS—YOU’LL ALWAYS HAVE THEM
We can all dream of settops with unlimited memory and blisteringly fast processors supporting perfectly flexible middleware, full-resolution graphics and pixel-perfect video. But until then we have to make choices. The limitations involved in settop software development won’t go away tomorrow. Even if they did—mirroring the evolution of the PC development world—new limitations would surely replace them.
Asking the right questions before development begins keeps application requirements and expectations in perspective. While demonstrations often provide a nice preview of application features, knowing the technical tradeoffs in deployable settop software is crucial now and will soon be indispensable. The number of settop technologies—and software to support them—shows no signs of abating. i A paraphrased quote, ascribed variously to Beethoven, Picasso, and Goethe, among many others. ii Note this discussion presumes a standard, interlace-scan, analog display television. Televisions displaying a true digital or high definition signal—whether progressive- or interlace-scan—are outside the scope of this discussion. Stephen Johnson is technology consultant specializing in television interface design. He can be reached at [email protected].

“NOW A WORD FROM OUR SPONSOR” TV RATINGS MEASUREMENT IN A DIGITAL WORLD
Robert A Luff
Chief Technology Officer Nielsen Media Research, Inc Abstract Last year approximately $45 Billion dollars exchanged hands between programmers/ networks operators and the advertisers. The value of a particular 30 second commercial is directly related to the total number and demographics of the viewers that were tuned to and likely saw the programming segment that contained the ad. And in the US, one company, Nielsen Media Research, has had the primary task of independently measuring and reporting TV viewing statistics continuously since television broadcasting began more than 50 years ago. The Nielsen ratings has become the currency of the TV industry. The core technology used to measure TV viewing has been based on determining what frequency/channel the home TVs, cable settop or satellite receivers are tuned to using direct RF frequency measurement of the tuner’s local oscillator, or indirect channel segregates such as, reading LED or on-screen channel indicators, or a number of other channel determination based technologies. However, the adoption of digital transmission technologies plus new digital based consumer electronics equipment in the home are creating new challenges to frequency/ channel based TV measurement technology. Multiplexed program distribution, time-shifted viewing, xVOD, IPTV, and home wireless video networks are blurring the traditional concept of “channel” and are causing a Global obsoleteness of all channel based TV
measurement technologies requiring totally new TV measurement techniques to be developed and rapidly deployed. This paper will provide a brief historical TV measurement technology overview; detail the current measurement technology and issues caused by various digital over-the-air, cable, and satellite distribution techniques as well as the plethora of new digital consumer electronic devices. The paper will also describe the new Universal Metering Initiative (UMI) technology that is being deployed by Nielsen to measure all analog or digital over-the-air, cable-TV, and satellite viewing, including capability for all forms of time-shifted viewing.
IMPORTANCE OF TV RATINGS MEASUREMENT TECHNOLOGY
The extraordinary success of television, including the proliferation of broadcast and cable networks, TV stations, program suppliers, and the tens of billions of dollars in annual advertising expenditures and cable programming fees necessary to fuel this growth has had an invaluable tool-- an independent measurement system which directly samples the viewing audience and reports the information back to the marketplace on a daily basis. This information—the Nielsen ratings—is the currency of television. This year, more than $45 billion exchanged hands in the TV industry based on this currency.

While nearly everyone has heard of Nielsen ratings, few recognize the enormity of the task or the complexity of the overall measurement technology system. But now that the US and the rest of the World are shifting to a digital based TV system a totally new “digital friendly” Universal Metering Initiative (UMI) using active and passive audio (A/P) technology and new Nielsen Audio and Video Encoders (NAVE) must be rapidly deployed. The new A/P system will work equally well on analog or digital channels, including HDTV and time-shifted viewing. The new NAVE real-time encoder encode both the audio and the VBI just before over-the-air transmission or network distribution with an assigned constant source ID code and a time/date stamp about every two seconds in the active program audio using a patented technique that makes the codes non-auditable to the ear but easily detected by in-home monitor equipment and Monitor Plus sites. The NAVE encoder also encodes the standard AMOL codes that are necessary with the older measurement technology during the transition period and with the new system until a new all digital metadata standard is adopted and used by the industry. The new audio encoding technology is very robust and will withstand almost any normal “bad practice” that would still produce a reasonable picture and audio to the home. The new A/P system has for the first time in a TV measurement redundant measurement technologies in case of failure or operator error of the primary active audio encoding system. The new system will automatically default to the redundant passive signature mode.
The TV technical community will want to become knowledgeable about Nielsen’s new Universal Metering Initiative A/P system-- But first, some TV measurement basics to better understand TV measurement requirements and why a new system is necessary in the digital TV World. TV Ratings 101 In its simplest form, TV ratings require detailed measurement data of two equally important broad areas-- what is being viewed and the demographic detail of who is in the audience. While a full treatise on TV measurement definitions and methodically issues is beyond the scope of this paper a few basics are necessary in order to understand the current analog based system and why a completely new digital friendly system must be rapidly deployed. Four sections are presented as background information: Definitions; Sampling; Privacy, and; The Nielsen TV Diary (The Diary section comes later in the paper.) Definitions Universal Estimate (U.E.) Total persons or homes in a given population, e.g., TV households in the US. Rating Percentage (Average Audience) The percentage of the Universal Estimate (U.E.) viewing a TV program during the average minute: Audience Rating % = ________________ Universal Estimate

Share Percentage of TV sets (or persons viewing) tuned to a program: Rating Share = _________ HUT HUT Number of homes using TV PUT Number of persons using TV Total U.S. Rating (%) Average audience of total U.S. households Reach Number of different homes/people exposed at least once to a program or commercial. Also referred to as Cume. Average Frequency.Average number of times a home or person is exposed to a program or a commercial. Average Audience Projection/Impression The audience expressed in numeric rather than percentage form: Average Audience = Rating X Universal Estimate Gross Average Audience (GAA Rating) Sum of the percent of households tuning (or persons viewing) during the average minute of each telecast of the program, including repeat telecasts during the report interval. Gross Rating Points (GRPs) Sum of all ratings for a program in a schedule. Cost per Thousand (CPM) The cost to expose a commercial/ program to 1,000 people or homes: Media Cost CMP = ___________ X 1,000 Impressions
Hawthorne Effect Even the tiniest of inadvertent change to the overall measurement environment introduced by either the measurement equipment itself or just the impact of respondents knowing that they are being measured can cause bias or errors in the collected data. (For this reason, using “doctored remotes” or exchanging the household TV with similar pre-metered TVs is not a acceptable option.) Source Detection/ Reporting In today’s more competitive TV industry a program/ network can arrive and be viewed in the home from several alternative sources: direct-off-air reception; cable-tv; satellite, or perhaps the internet or telco based delivery options in the future. In addition, in order to accurately measure HUT nearly everything connected to the TV that could generate video must also be identified and reported, including video games, VCRs, PVRs, and DVD players. Automated Measurement of line-up (AMOL) A defacto Nielsen industry standard of inserted codes in the VBI for the purpose of electronically identifying the source and real-time/date stamp of its transmission. Monitor Plus Sites (M+) Nielsen maintained monitoring sites in 354 of the largest cites across the US and Canada. These sites collect and store 24/7 all audio and one frame per second of video from nearly all TV stations and cable/satellite networks. The stored audio and video are used (and augmented by stations line-ups) as the “as transmitted” data base and used extensively with both the current People Meter/ Mark-II and new Universal (Digital) Metering Initiative A/P system.

Designated Market Areas (DMAs) There are currently 210 individual “local” DMA markets defined by Nielsen. TV viewing behavior can vary between local markets, especially in early morning and late night viewing patterns. Sampling An accurate, projectable TV measurement system depends on a random audience sample that is representative of viewers as a whole. It is important that the random group mirror the behavior and characteristics of the overall population not only at the aggregate total level, but also within each of the narrower defined demographic breakdowns important to programmers and advertisers. By using random probability samples, Nielsen can project the viewing in its samples to the entire population and sub-classifications of viewers. This process can be quite complex in terms of practicable implementation. It starts by using the US Census Bureau’s decennial (updated annually) census counts of all housing units in the nation. Using this data Nielsen randomly selects more than 6000 small geographic areas (blocks in urban areas and their equivalent in rural areas) and dispatches surveyors to each area to enumerate and list housing units. Housing units are then randomly selected within each sample area. This process ensures that each household in the population has a known chance to be selected. Once a household is selected it is important to the sample quality that they agree to participate and stay as a sample household for the research period (one week for diaries; two years for People Meter and Local People Meters). While the overall process defines “alternates,” any deviation from the true initially randomly selected households detracts from the sample quality.
“I don’t watch enough TV for Nielsen,” or “I only watch…” are two often heard reasons selected viewers feel they shouldn’t participate. But inclusion of all randomly selected households/viewers is essential to have accurate projectable data. The homes are first contacted by phone. (Nielsen is exempted from the “Do Not Call” restrictions) and follow-up with letters and person-to-person contact as necessary, including using callers and field staff with special language/ dialect skills to properly communicate and put the person at ease. This is especially true in the case of some minorities or non-citizens who might be initially unfamiliar with Nielsen and the importance of this research to them and others with similar background that they will now represent in the sample. There is a very small monthly payment that is not tied to their amount of viewing. Privacy Privacy of viewing data is of utmost concern to all involved, especially to the sample households. Nielsen’s privacy record and privacy controls are unparalleled and surveys continue to show extremely high levels of public trust of Nielsen and its processes. Beginning with the first contact, it is explained how the viewing data is collected and that a particular household’s/ person’s viewing data is combined with the aggregate with no individual or household identity. All of Nielsen’s and industry TV viewing, including demographic breakdowns is derived from data processed from various aggregate buckets of data. The household members sign a release allowing Nielsen to use their viewing data in this way. This process adds to ensuring that all data collected meets state and federal privacy laws and regulations.

Households are also requested to maintain a low profile that they are a Nielsen sample household while they are actively in the program. This is to avoid any unlikely targeting of the household by media players of mailings or incentives that might influence the household’s viewing/ reporting data. People Meter
The heart of today’s National TV measurement system is the People Meter, an electronic metering technology that measures both programs viewed and logs who is in the home viewing audience. The People Meter is actually a combination of a People Meter which logs who is viewing and a Mark-II companion device that measures which channel is being tuned. The People Meter is a small relatively flat profile unit with a row of red and green LED indicator lights visible to the TV viewers which is used to log in/out who is in the room watching TV. The People Meter and its wireless remote has simple single buttons for inputting which family members are in the room viewing. There are also provisions for logging in visitors and their demographic data (age & M/F). The When the TV is turned-on all LEDs begin flashing signaling the viewer(s) to log-in which family members are viewing. Any family member can log in all others viewing. Periodically and after channel changes the LEDs will begin flashing for an up-date on which family members are still viewing. The People Meter is placed so the LEDs are visible while watching TV, generally right on the TV or the cable settop, during installation and is usually the only visible sign of Nielsen’s measurement equipment after installation. Because of the possible Hawthorne effect resulting from the current People Meter, various stealth people meter
alternative technologies are being developed that would require less or no involvement by the household viewers to maintain accurate audience data. A detailed discussion of these technologies is beyond the scope of this paper but include: Infrared, RF tags, Voice Print/ Recognition, as well as others. Currently there are People Meters installed in about 5000 randomly selected households across the US-- and the number of National Sample metered homes will begin to increase to more than 10,000 starting this year. Sample households agree to be a Nielsen sample household for a two year term and to allow Nielsen engineers come to their home and install People Meters and its associated Mark-II measurement equipment on every TV, and its associated peripheral devices in the house, including even small portable rabbit ear TVs on the kitchen counter or in the garage workshop. These installs can take up to two days and require that all Nielsen measurement equipment and associated wiring be completely hidden/ out-of-sight in order to minimize any long lasting Hawthorne effect. No data collected from a newly installed Nielsen sample household is used for the first thirty days to allow the impact and newness of the installation and being a Nielsen sample household dissipate. Research has shown that normal pre-installation viewing returns well within that period. MARK-II The companion measurement device installed in a National People Meter sample household is the Mark-II. The Mark-II was first engineered in 1978 and has remained the work-horse of measuring what program/channel is tuned for over 25 years! Indeed, it is hard the imagine a device

performing such a complex task still accomplishing its basic goal after so many years in such a dynamic industry. Its strength is its basic simplicity, and the forward thinking of its original designers. The Mark-II while having a power-supply, UART, dial-up telephone modem, and modest memory and processing capability- has survived so well because its visionary designers embraced a designed concept of supporting up to eight additional external specialized data collecting probes. Additionally, two Mark-IIs can be daisy-chained together for up to sixteen probes, if necessary. More than 120 specialized Mark-II probes have been designed over the years to allow for measurement of virtually every TV and peripheral device such as, VCRs, DVDs, dual decks, video games, etc. Full installation of a People Meter/ Mark-II in a typical sample household can take a full day and some homes with higher than average number of TV sets and/or peripheral equipment can take two full days. Obviously, a Nielsen service call must be scheduled anytime the household decides to move their equipment, add a new TV viewing location, or add any new component to their viewing systems.. The Local People Meter (LPM) The Local People Meter is a new Nielsen initiative to deploy essentially the same National People Meter technology within separate sample of homes starting in the largest of the Nielsen DMA local markets. It will use the People Meter to collect audience viewing data and the Mark-II technology to measure TV-tuning data.
The Nielsen TV Diary Mainly to address cost, diary measurement is used to collect viewing information from sample homes in every TV market in the US. Each year more than 2 million paper diaries from households across the country are processed for the sweeps ratings periods. The standard November, February, May, and July sweep months larger markets include; October, January, and March, as well.) In approximately 50 large local markets, not using the Local People Meter, Nielsen uses the Mark-II device to collect just set-tuning information on a daily basis. This daily household tuning data is cost effectively augmented at least four times a year with demographic viewing data which is collected from another sample of households which maintain a paper-viewing diary for one week. Each household member in the sample is asked to write down what programs and channels they watched over the course of that one week. Then the diary and the Mark-II set tuning information from the separate samples are merged to produce the standard “sweep” reports.
TECHNICALLY DIFFICUILT HOMES (TDs)
Despite the enormous flexibility of the People Meter/ Mark-II and its various probes, sometimes a home is encountered that has a new TV or peripheral device that does not yet have technical measurement solution. If even only one device can not be properly measured, the household is declared “Technically Difficult” and no data from the household can be accepted.

TDs would generally occur when new to the market devices with either very different circuitry or functionality are purchased and brought home. Obviously, systematic elimination “early adopter” households from the overall viewing database would possibly introduce a bias in the data if not addressed. Accordingly, close ties are maintained with program distributors, consumer electronics manufacturers, and regulators to gain early awareness and prototypes of new products that may challenge existing measurement solutions. Over the years Nielsen has maintained the percentage of Technology Difficult households to less than .5%. Digital Challenges to the Current System Even without the impact of digital TV, in recent years the friendly “cat & mouse” game of staying ahead of the challenges of measuring TV viewing and all the peripheral CE equipment (DVDs, Dual Deck devices) began to take on a significantly more complex, intrusive, and costly posture. The trend of CE equipment becoming smaller, multi-purposed, and feature rich as resulted in a general CE trend toward massive multi-purpose LSI silicon device-on-a-chip designs where access to critical TV measurement taps/ test points is not longer available. Development of special Nielsen software, reverse engineering, or ASIC solution development is very expensive, especially for the very small number of homes it would likely be used. Solutions for some new CE equipment are approaching in excess of $500K each with no upper end in-site. Further, while most new CE devices, regardless of popularity takes years after introduction to reach a penetration level sufficient to cause any impact with the Nielsen sample data thereby providing reasonable development time for a solution.
But today both cable and satellite TV industries are capable and have inadvertently downloaded Global software up-dates to all settop boxes in their local system or network that suddenly changed their channel line-ups or various internal settop settings enough to suddenly cause a market wide incompatibility with the current Mark-II measurement technology. As taxing as this trend has become, digital TV will over time completely break the current measurement channel-based system. It’s not that plain digital TV breaks the measurement system, its what the new digital TV domain supports as standard operating practice at the distribution and consumer level that breaks the system over time and forces a new system. The two primary causes are: Multiplexed Program Transmission The current measurement systems used almost universally are based on a core channel/ frequency determination measurement strategy. But in digital TV the FCC and economics encourages several separate content streams (programs) be multiplexed and transmitted over one frequency/channel. When the current measurement system is attached to a digital TV tuner tuned to a multiplexed channel it simply knows the channel, not which of the four or five multiplexed programs is actually being viewed. Accordingly, channel based measurement systems are not longer deterministic is a digital TV World where multiplexed program distribution will be commonplace. Time-Shifted Viewing And the second of the “one-two” digital TV punch is the meteoric raise time-shifting capabilities in the home either as a feature of

a stand-alone TiVO type CE device, built-in to an up-graded cable or satellite box, or as a virtual time-shift capability supported by the cable headend server. Indeed, it is cable’s unique ability to significantly accelerate deployment of time-shift capability in certain markets that has resulted in a corresponding acceleration of Nielsen new digital friendly Universal Metering Initiative and especially its ability to measure time-shifted viewing.
UNIVERSAL METERING INITIATIVE
More that seven years ago Nielsen accessed the direction of the TV industry and consumer electronics and determined that a completely new metering system would be necessary to address the capabilities and needs of a more digital empowered and completive TV industry. A complete and through review of all measurement technology options was considered. In addition to all the previously discussed concerns/ issues, Nielsen also was aware that significant segments of the industry desire Nielsen to develop the ability to measure “out-of-home” viewing. Active/ Passive (A/P) The result was the development of a totally new concept in TV measurement that relies primarily on audio to determine programs viewed. However, because of the reliability needs, a patented active and passive audio system (A/P) that supports a unique and first time redundancy in TV measurement was developed. The A/P system relies on active encoding using the Nielsen patented psychoacoustic masking technology that “actively” encodes a special code into the program audio in such a way that it conceals itself from normal hearing, yet easily detected by special monitoring/
decoding equipment in the home or Monitor Plus sites. Since the encoded data is in the active audio of the program it automatically rides along wherever the program and its audio goes. It is very robust and can survive almost any “bad practice” until the content itself is nearly un-viewable. The “back-up” redundant passive signature system does not add anything to the program audio. It simply uses the program audio itself to generate a corresponding thin data stream signature that is unique to that program audio. At the Nielsen Monitor Plus sites master signatures are generated as needed using a special algorithm and stored 24/7 for any TV station or cable/ satellite network, as needed. In the home, the A/P TV measurement equipment is connected internally to the TV audio line-level out and active codes containing its source ID and time/date stamps about every two seconds during the viewing are collected from all viewed programming. If the viewed programming is not properly NAVE encoded for whatever reason, the A/P home monitoring equipment automatically begins to generate and store its thin stream of passive signatures derived from the unidentified audio using the same algorithm as used at the Monitor Plus sites for a match when all viewing and audience data is forwarded to the central operations facility by dial-up modem later at night. Nielsen Audio and Video Encoder (NAVE) The NAVE encoder is a critical part of the new TV measurement system. Its purpose is to automatically insert a source ID and time/date stamp undetectable to the human 3hearing into the program audio. It also inserts the current AMOL VBI format source

and time/date stamp information to add in the transition period where both the current AMOL dependant and the new A/P system must be supported. The Nave encoder will on average insert a full psychoacoustic audio masked source ID and time/date stamp code about every two seconds. It is important that station and network engineering community understand the critical importance of maintaining the NAVE encoder in the active audio and video program stream. While the passive system can act as a failsafe emergency back-up, using the primary active codes for viewing detection is more accurate and requires less processing/memory resources. Cable channels where the original signal is either from off-air/ fiber delivered local TV stations or from national satellite feeds which will already be encoded will not need a NAVE encoder. At some point when cable desires to measure xVOD it will need to either require that the programming be already NAVE encoded or locally encode the material itself before delivery to viewers.
SUMMARY Digital TV is triggering a global shift to new TV measurement technology solutions. In the US, Nielsen Media Research, Inc. has Initiative (UMI) in which its audio based redundant Active/Passive (A/P) system is already being deployed. This system has the capability of measuring both analog and digital TV, including HDTV and time-shifted viewing. The new NAVE audio encoding is very robust and generally will survive all but the worst “bad practices.” Both the current AMOL used with today’s Mark-II metering technology and new NAVE audio coding will be required during a multi-year transition period. Since most of the programming carried by cable will already be encoded with the new NAVE psychoacoustic encoding technology by the original local TV station or TV, cable, satellite programmer/ network-- a cable system will not need to encode much if any of its programming. If cable operators eventually desire xVOD viewership measurements either the program supplier or the cable operator will need to NAVE encoder the content and provide Nielsen with the content name details.

ADVANCED VIDEO CODING FURTHERS HD SERVICES Carl Furgusson TANDBERG Television
Abstract
The use of Advanced Video Coding to enable bandwidth efficient HDTV Video on Demand and broadcast television is gaining in popularity as technological advancements in MPEG-2 compression continue to slow. While MPEG-2 has been the undisputed leader in video compression for the past decade, algorithms such as Windows Media 9 Video and MPEG-4 Part 10 are emerging at a time when consumers are requiring more broadcast channels and VOD services in HD.
As the subscriber volume grows, using MPEG-2 compression for HD will result in bandwidth bottlenecks in the networks. To solve this problem, increasingly efficient compression algorithms will be required to satisfy this consumer demand. Algorithms such as WM9V and MPEG-4 Part 10 have the potential to outperform MPEG-2 by up to 50%, meaning that a 50% data reduction to deliver the same quality picture is possible — taking full advantage of network bandwidth and increasing revenue generation possibilities. This paper will discuss advanced video coding techniques and how they apply to HD to enable bandwidth efficient deployment of HDTV for both broadcast television and VOD.
EVOLUTION OF MPEG-2 BIT RATES
The MPEG-2 standard [1] reached commercial deployability in 1994 and has since been widely adopted for standard definition television (SDTV) broadcast and on-demand services, becoming the defacto professional broadcast digital video compression standard. Since 1994 advances in technology, systems design, implementation efficiency and video pre-processing techniques
have reduced the bit rate required to digitize an acceptable broadcast quality picture into the home. Figure 1 shows this bit rate reduction over time for MPEG-2.
8 7 6 5 4 3 2 1
1994 1996 1995 1997 1998 1999 2000 2001 2002 2003
First Broadcast MPEG-2 Encoder
Enhanced Motion Estimation
Advanced Pre- processing
Statistical Multiplexer Enhancements
Noise Reduction
Year
B i t R a t e
(M b p s)
Figure 1 – MPEG-2 bit rate for standard definition broadcast quality picture over time.
A high definition television (HDTV) video
picture has 4-6 times more information to be processed than a standard definition picture (horizontal resolution x vertical resolution x frames per second), as the bit rate for a standard definition picture reached the 3-4Mbps (Megabits per second) range in 1998 then it became feasible to deploy HDTV digital video services within the bit rates available on terrestrial, cable and satellite transmission platforms.
We can see from the curve of Figure 1 that each new technique and technology leap has returned less of a bit rate efficiency improvement as we approach the fundamental limits of performance of the MPEG-2 compression algorithm. With continuing development we are likely to only achieve a

further 10% MPEG-2 efficiency improvement at a commercially viable cost. This places a limit on the potential bit rate of MPEG-2 based standard and high definition services in the future to achieve an acceptable broadcast picture - in the order of ~1.75-2.0Mbps for SDTV and ~8-10Mbps for HDTV.
Competition from satellite platforms, who are launching 30-40 channel HDTV services, in addition to increasing demands from the customer, for example HDTV Video-On-Demand (VOD) content, place continuing pressures on cable broadcasters. The bandwidth available to the home is limited on any system, including cable, and while “all digital” system upgrades and reducing the homes per node try to overcome the system capacity limits they carry with them an investment and infrastructure cost penalties. A major improvement in coding efficiency would enable many more services to be deployed across existing infrastructures, and this is the promise of advanced video coding techniques such as MPEG-4 part 10 [2] and Windows Media Player 9 Video [3].
BITRATES OF ADVANCED VIDEO CODING
The nature of the video compression
algorithms being used in any of these coding techniques being discussed means that the perceived picture quality of a constant bit rate video service will vary depending on the complexity of the picture. A “talking heads” sequence, typical in news programming for example, is relatively simple to encode – there is little motion or detail changes between frames – whereas sport material involves both high motion and high detail changes between frames, testing the limits of the coding algorithm implementation. The reverse of this is also true – a constant quality picture requires a variable bit rate. Other system techniques, such as statistical multiplexing, try to make advantage of this by flexibly sharing a pool of
bit rate between a number of channels to optimize picture quality verses bit rate. As the bit rate for a “broadcast quality” video is such a subjective matter a range of bit rates are indicated in figure 2.
It should also be noted that different performances can be achieved between real-time encoding products, required for live TV broadcasting, and products using non-real time encoding processes, that can be employed for the creation of stored assets, such as VOD movies.
MPEG-2,
today
Advanced Video Coding
techniques, 1st
deployments
Advanced Video Coding
techniques, promise
over time HDTV, real-time
10-16 Mbps
6-10 Mbps 4-6 Mbps
HDTV, non real-time
6-8 Mbps
3-5 Mbps(1) 2-4 Mbps
SDTV, real-time
2-4 Mbps
1-2 Mbps 0.5-1 Mbps
SDTV, non real-time
1-3 Mbps(2)
0.5-1.5 Mbps
0.5-1 Mbps
(1) As evidenced by content samples on Microsoft website, www.microsoft.com
(2) Note, 3.2Mbps transport (~2.8Mbps video) typically used for MPEG-2 VOD assets today Figure 2 – Advanced Video Coding Techniques vs
MPEG-2 bit rates, by service resolution.
While there are differences in the techniques used in the MPEG-4 part 10 and Windows Media Player 9 Video coding algorithms, resulting in some differences in video coding artefacts, it has been shown through subjective and objective testing [4]

that both these techniques produce averagely equivalent quality over a range of bit rates and programming material types, therefore no distinction between coding algorithms is made in figure 2. It should be noted that broadcast video applications are most likely to use the “Main Profile” of MPEG-2 part 10 or the “Advanced Profile” of Windows Media Player 9 Video.
TECHNIQUES THAT ENABLE THE SAVINGS
The new advanced coding techniques
achieve their efficiency improvements over MPEG-2 in a number of areas:
• More efficient syntax – saving of bits from fewer and shorter headers, greater range of allowable picture sizes, and carriage mechanisms within native IP and with MPEG based transport streams.
• Removal of more information from the picture – improvements in coding techniques and motion prediction tools, including the addition of a more flexible selection of block sizes.
• Hiding artefacts – as bit rates are pushed lower there is an increased likelihood of blocking artefacts on difficult scenes. Tools such as loop filtering hide the blocking artefact edges making them less perceptible to the viewer, therefore allowing the bit rate to be pushed lower.
In comparison to MPEG-2 some of the changes that yield the greatest savings are:
• Multiple intra-prediction modes for Field/Frame adaptive coding at picture level, and Field/Frame adaptive coding at macroblock level (MBAFF) – provides for more flexibility when a picture sequence exhibits a mixture of progressive and interlaces characteristics within a field/frame.
• Additional block sizes for intra prediction within I Picture.
• In-loop deblocking filter, provides no benefit at higher bit rates but has clear advantages at bit rates lower than traditional MPEG-2 operating ranges.
• Improvements in motion estimation including Tree-structured motion segmentation with a selection of block sizes and 1/4-sample motion compensation.
• Additional coding efficiencies from range of alternative integer transform block sizes, the definition of multiple variable-length coding (VLC) tables enabling Context-based Adaptive VLC-based entropy coding (CAVLC), and for MPEG-4 part 10 the option for Context-based Adaptive Binary Arithmetic Coding (CABAC).
CARRIAGE OF ADVANCED CODED VIDEO IN A CABLE SYSTEM
The advanced coding techniques have
several options of carriage mechanism for transmission. MPEG Transport Stream
The packetization of advanced coded video within the traditional MPEG transport stream carriage mechanism enables Advanced Coded services to be broadcast on any existing network carrying MPEG-2 services today. Using MPEG transport stream also provides a number of other advantages:
• Timing Reference - MPEG transport timing references ensure the synchronization of video, audio and time critical metadata services when the digitized services are presented to the customer to view.
• Ancillary data carriage - Other MPEG transport related standards also provide a

definition for the carriage of ancillary services such as vertical blanking interval data, such as Closed Captioning and V-chip information.
• Audio codec choices – there are multiple audio codecs defined within various standards and specification which utilize MPEG transport carriage today. Combined with the commonality of the MPEG timing reference this enables an operator to mix and match video and audio codecs to meet their needs.
IP Carriage
The packetization of Advanced Coded video services within a native IP transport removes unwanted overhead (header tax from Advanced Coded Video packets over MPEG transport encapsulated into IP frames) when Advanced Coded Video services are intended to be transported over Internet Protocol based networks.
CONCLUSION
The major improvement in coding efficiency that are being achieved with first generation MPEG-4 part 10 and Windows Media Player 9 video codecs will enable many more services to be deployed across existing infrastructures. The efficiency improvement will further improve as more research and development resources and time improve each generation of product implementation. While the support for MPEG transport stream carriage provides an answer for existing networks, the native IP carriage for next generation networks will become more prevalent over time. The IP carriage mechanism allows a migration to an IP based core network, or even a Switched Digital Video over QAM network to achieve infrastructure cost savings or provision a greater number of services over a bandwidth limited edge. The combination of compression
efficiencies over MPEG-2 combined with next generation transmission networks will enable cable operators to further provision advanced HDTV services to their customers.
REFERENCES
1. ISO/IEC 13818 International Standard, "Generic Coding of Moving Pictures and Associated Audio Information"
2. JVT, N5555: Draft Text of Final Draft International Standard for Advanced Video Coding (ITU-T Rec. H.264 | ISO/IEC 14496-10 AVC), Pattaya, March 2003
3. Microsoft Digital Media website: www.microsoft.com/windows/windowsmedia/
4. In-depth review of advanced coding technologies for low bit rate broadcast applications, J.Bennett & A.Bock (TANDBERG Television), IBC 2003 conference proceedings.
ACKNOWLEDGEMENTS The author would like to thank Ping Wu
and Alois Bock, TANDBERG Television, for their input and assistance with this paper. Windows Media 9 Series is a trademark of Microsoft Corporation.
CONTACT INFORMATION For further information regarding this paper please contact: TANDBERG Television Inc 12633 Challenger Parkway, Suite 250 Orlando, FL, 32826 Tel: +1 407 380 7055 Email: [email protected]

ADVERTISING INSERTION AND VOD: A MATCH MADE IN HEAVEN
Jay B. Schiller, Senior Vice President, Market Development nCUBE Corporation
Abstract
Video-on-demand (VOD) is now a standard 'must-have' service for cable operators. It is highly strategic in reducing churn and growing premium digital subscriptions. It also provides a great financial return on invested capital through movies on demand and subscription VOD (SVOD). Local ad sales, meanwhile, continue to provide cable operators significant cash flow and are an excellent promotional vehicle for cable operator’s various services including VOD. As viewers migrate to on-demand, local and national ad insertion must migrate as well in order to sustain and grow cable ad sales’ revenue. In addition, VOD and digital cable platforms offer unique opportunities to target advertising to households, as well as interact with ads, both of which have the potential to grow ad sales businesses for both operators and cable networks far beyond today's TV advertising market share.
ADVERTISING INSERTION AND VOD VOD streams are unique, one-to-one TV sessions with each household. VOD ad insertion is local ad insertion but in VOD content. VOD ad insertion appears to be unique and advantageous for advertisers and ad sales operations in that it has the potential to:
• Use local breaks in VOD content similar to traditional local breaks on broadcast cable (called ad replacement)
• Create new local breaks before and after VOD content (called playlists)
• Recapture digital viewers watching VOD and not watching broadcast cable
• Support geographically targeted and household addressable ads
• Provide 100% measurable advertising data
Historically, cable operator’s and cable networks’ ad sales businesses have not leveraged VOD although some have experimented with it. This is primarily due to multiple factors including: 1) most VOD content is pay-per-view movies and premium cable programming, which is not normally ad-supported programming and does not have local breaks; 2) a lack of critical mass of viewers; and 3) a lack of acceptable audience measurement data available (and the newness of the medium) to the advertising industry. However, these factors are all changing. Ad-supported cable networks such as ESPN are becoming VOD programmers themselves. In addition, a number of new programmers are appearing only on VOD services, such as MagRack, and may consider ad-supported models. The number of VOD households has rapidly increased as well, to 16.5 million of the 23 million digital homes (66.6 million basic homes) now, and is growing to more than 38.2 million by the end of 2008.1 VOD usage and VOD audiences are also growing weekly. For instance, nCUBE has seen on average 10-15 VOD session starts per digital subscriber per month in the field. Lastly, ad agencies, media buyers and advertisers are being exposed to the medium. However, they will need to value new audience measurement data and will need to be able to process it with their back office 1 Kagan VOD & iTV Investor, July 23, 2003

systems, which they rely on to plan effective ad campaigns and to value advertising. Nielsen Media Research, the leading audience measurement service, has published a VOD system interface specification, which is being implemented into VOD vendors’ systems and may address advertisers’ needs. This paper presents both technical requirements and an implementation for advertising insertion around VOD content (i.e. playlists) and in local breaks in VOD content (i.e. ad replacement). VOD content includes movies, SVOD, free VOD and network PVR. The solution leverages existing ad sales organizations, research, and traffic and billing systems as a starting point. However, the solution scales into the future with household level addressable advertising using newer traffic and billing, and research systems. There are several other advanced advertising applications being implemented, tested and speculated by nCUBE and others which are not discussed in this paper including:
• Advertiser-sponsored free VOD using long form ads and programming on the VOD service
• Interactive advertising for direct response, surveys, coupons, personalized messages and more
• Linking from traditional ads to long form programming on the VOD service
• Advertising on digital video recorders These applications may be the topics of subsequent papers. This paper will talk specifically about extending today’s ad insertion business and technical operations into VOD. Of particular relevance in combing ad insertion operations with VOD systems are:
• Organizational responsibilities, architecture and workflow
• Traffic and billing system configuration and back office integration
• Detecting local breaks • Inserting ads in VOD content • Targeting ads by geography • Household addressability in the future
An overview of today’s ad insertion technology and today’s VOD technology follows. These two sections are helpful for those unfamiliar with the technical aspects of each and also set the context for extending ad insertion into VOD. Today’s Ad Insertion Local cable ad sales is a mature and growing business in the U.S. contributing significantly to cable operators’ revenue and net income. Ad sales organizations sell TV commercial time designated for local insertion on cable networks to ad agencies and advertisers. Ads are sold for particular networks, day parts, programs, or groups of networks. Each cable network provides 2 to 3 minutes per hour for local insertion, or enough to run 96 ads each on average per day. Typically, 15 to 25% are used for cable operator marketing purposes. There are more than 80 ad supported networks with roughly 40 carried on analog and 40 carried on digital cable. Most ad sales revenue occurs on the top 20 networks carried in the analog domain. However, operators are rapidly moving toward 40 channels of ad insertion and are also beginning to migrate away from analog cable and toward all digital cable. Cable operators use traffic and billing (T&B) systems to enter orders, schedule spots and bill advertisers. T&B systems track the number of ads that are sold and thirty second ads available to be sold (called “avails”) for each network, and produce schedules for the ad insertion systems so it knows which ads to play. The schedules list ads to play during each local break on each network. Based on schedules, the ad insertion system determines which ads need to be encoded, distributed, and

removed, as well as whether any are missing. Once played, the ad insertion systems log each ad played and returns the logs to the T&B system so that advertisers may be billed. Nearly 100% of all ad insertion systems in use today use digital ad content based on MPEG 2 content locally encoded at 4 to 6 Mbps constant bit rate (CBR). Digital ads, mostly thirty seconds long, are distributed as data files and are stored on video servers’ hard disk drive arrays located in headends. During local breaks ads stream from the video servers and are switched in place of ads in the cable network feed. Local breaks in ad-supported cable programming (e.g. CNN) are identified by the presence of cue signals detected by the ad insertion system. Historically, cue signals consisted of DTMF tones carried in a second audio channel in each ad-supported cable network receive at each headend. Cable networks are migrating to newer MPEG cue packets specified by SCTE in the SCTE 35 (formerly SCTE DVS 253) standard. The SCTE 35 cue packets multiplexed into the MPEG 2 program stream along with other elements such as video, audio and data. The cue packets signal local break positions and insertion splice in and out points. Once the cue is detected, ads are streamed from video servers at the appropriate time. Today, they are typically decoded to analog and switched into analog broadcasts prior to distribution into the cable plant and distributed to viewers’ homes. With digital cable growing in popularity, and with cable operators migrating to all digital cable, ads may also be streamed from video servers and switched into digital broadcasts where decoding to analog occurs in digital set-top boxes in viewers’ homes. When digital ads are inserted into digital cable programming, as opposed to analog programming, it is called Digital Program Insertion (DPI). DPI represents the next significant wave of ad insertion
deployments, with both standard definition television (SDTV) and high definition television (HDTV) naturally supported for ads and programming. Analog and digital switching each have unique requirements. Analog switches must be accurate and fast time-wise such that the switch into the local break is not late so that the beginning of the network’s underlying ad is not shown or heard. And they must not switch out of the local break too late so that the network’s programming following the local break is not stepped over, although cues may also be sent to signal the end of the break which may prevent this; in which case the local ad would be cut short. They must also not switch too slowly such that black video results. Lastly, analog switches typically contain audio automatic gain control and level matching circuitry to ensure that audio levels of the networks and ads match. Digital switching is done by ad splicers which are statistical bitrate re-multiplexers typically located in headends for efficiently creating digital multiplexes with digital cable programming. Ad splicers have the same time accuracy requirements as the analog switches. Audio level matching is a more complicated issue however for DPI than for analog and cooperation among cable networks, splicer manufacturers and cable operators are required to ensure consistent audio levels before and after switching. Local cable is unique in that it can insert advertisers’ commercials across a metropolitan area (i.e. “market”), and can also “target” ads to geographic regions within a market (i.e. “zones”). This flexibility offers advertisers tremendous efficiency in reaching relevant viewers, while maximizing ad sales revenue for operators. With digital set-tops, local cable ad sales operators are experimenting with “addressable advertising” in which different

ads are played to different households (and individual set-top boxes) based on each household’s lifestyle segment. Addressable advertising offers tremendous efficiency since ads are directed to the most relevant households (e.g. has children) versus targeted advertising in which ads are played which are relevant to household characteristics of a geographic region (e.g. incomes >$100K) or just the geography itself (e.g. near Bob’s Ford) An example of today’s ad insertion system is depicted in Figure 1, below. In Figure 1, the SkyVision HQ manages the day-to-day
workflow and monitoring functions required to manage multiple ad insertion systems from a single location. The key functions are:
• Import traffic schedules from T&B • Encode and distribute new ads and
schedules to headend insertion systems • Alert of missing ads and system failures • Remove expired ads • Monitor breaks and insertions • Retrieve verification logs and export to
T&B
Head EndTraffic & BillingSystem
SkyVisionHE
Head EndKit
SatelliteBroadcast
Headquarters
SkyVisionHQ
File Distribution
Traf f ic &Billing
Reporting
Schedule
SkyVisionGUI
SkyVisionEncoder SplicerSplicerSplicer
Video (DVB-ASI)
SCTE/30 (TCP/IP)
Schedule
SplicerSplicerMDSVideo (SCSI)
SatelliteBroadcast
Digital Broadcast w/ SCTE35 Cue Packets
Analog Broadcast w/DTMF Cue Tones
Figure 1. A schematic diagram of nCUBE’s SkyVision digital ad insertion system deployed for both analog and digital cable. Analog MDS switch decoders and digital DPI splicers shown in a headend with nCUBE’s SkyVision HE ad server. Ad insertion servers and switches in multiple headends are managed centrally with the SkyVision HQ and MPEG encoder. Today’s Video on Demand With VOD, subscribers select programming from menus or their programming guides and request and control video streams. VOD
workflow is not too dissimilar from ad insertion and both workflows can be automated or performed manually, as the situation demands. An example of today’s VOD system is depicted in Figure 2, below. In Figure 2, the nABLE

HQ manages the day-to-day workflow and monitoring functions required to manage multiple VOD systems from a single location. The key functions are:
• Import asset metadata and content files from asset distribution systems (catchers mitts)
• Distribute new content to headend VOD systems
• Alert of missing content and asset metadata errors, and system failures
• Remove expired content • Publish asset metadata to VOD menus • Authorize subscribers and post charges
to subscriber management systems (billing)
• Monitor buys, sessions and bandwidth, and report data
Head End
Catcher's Mitt
VODSystem
Headquarters
nABLEHQ
nABLE GUInABLE
GUI
SMS / BillingSMS /Billing
nABLE RT
n4x Server SplicerSplicerSTBVideo
Session Set-up
StreamControl
Content FileDistribution
Reporting &Authorization
Billing /Authorization
AssetMetadata
Asset Metadata &Content Files
Figure 2. A schematic diagram of a typical deployed nCUBE nABLE VOD system. The n4x video server and nABLE RT session and resource manager are shown in a headend. (On demand application server and client that provide the subscriber user interface are not explicitly shown but the functionality is implied in HQ, RT and STB since actual configurations vary depending on the deployment.) VOD systems in multiple headends are managed centrally with nABLE HQ.
Before getting into the specifics of VOD ad insertion it’s important to understand the process of requesting a title and setting up a VOD session since this is when ads are selected and inserted in and around VOD content, in this implementation discussed below. Prior to selecting a title, the asset metadata and content files are imported from the catcher’s mitts. The content files are typically encoded at MPEG2 3.75 Mbps (CBR SPTS) as specified in CableLabs VOD content specification. They are distributed to the VOD servers in the
headends prior to each title’s availability start date, which are contractually set by the content provider and included in the asset metadata. The metadata is validated and published the on-demand application’s VOD menus and/or digital cable programming guides where subscribers can navigate and make selections. The metadata includes content provider, start date, end date, title, category, description, rating, actors, price and more. Other files such as DVD cover graphics may accompany a title and are also retrieved from catcher mitts, and

published as part of the menu information seen by subscribers along with the metadata. Content files are removed once their end date is past. Once a title is selected, the on-demand application in the set-top box (STB) initiates a session set-up request to the VOD system in the headend. The commonly used protocol choices implemented for session set-up (including teardown of a session) today are RTSP and DSM-CC. In the session set-up request message, the STB communicates the requested title’s asset ID, and the STB’s MAC address and its service group. The MAC address is unique to each STB. The service group identifies the population of STBs, which share the same group of 6 MHz VOD channels (QAM modulators and RF upconverters) each with a capacity of 10 VOD streams, or 10 simultaneous one-to-one TV sessions. Service groups are essential in economically setting up VOD sessions and streaming. They are also relevant to VOD ad insertion as explained later. In a cable plant there is a fixed amount of RF spectrum for video equal to a fixed number of 6 MHz video channels. Analog cable TV requires a 6 MHz video channel for each cable network broadcast on analog. With digital cable TV, ten or more cable network broadcasts share a single 6 MHz video channel. Digital and analog cable networks (e.g. CNN) are broadcast through the entire cable plant and are available, with varying service tiers, to subscribers simultaneously. For VOD, however, broadcasting all simultaneous viewers’ VOD sessions through the entire cable plant requires too much capacity and is not economically viable. Therefore, each 6 MHz channel assigned to VOD is assigned to a service group. Each service group serves a particular subset of the VOD capable homes in any given deployment. Service groups can be any size but 24 MHz or four 6 MHz channels each are common. A 24 MHz service group
has a capacity of 240 VOD streams. If each VOD stream can serve 10 digital subscribers, then a 24 MHz service group can serve at least 2,400 VOD enabled digital homes. In a market with 240,000 digital homes, there would be 100 service groups. The homes sharing a service group are typically clustered in the same geographic region making service groups relevant to geographically targeted advertising, as discussed later. A service group with 2,400 digital subs represents about 7,000 cable homes at 34% digital penetration and about 10,000 homes passed. Assuming that there are 500 homes passed for each optical node in an HFC plant, a service group consists of twenty optical nodes all sharing the same VOD video RF spectrum. As digital penetration grows and as VOD usage increases, service groups will either get larger in MHz or smaller in optical nodes or both. Using the STB’s MAC address the VOD system checks the household’s authorization for the requested content and posts any charges. Based on the service group passed to the VOD system from the STB, the VOD system’s session and resource manager determines the best way to route the video stream and allocates the required bandwidth (e.g. 3.75 Mbps) from the video server and through the digital cable plant. Then, using the asset ID, it instructs the video server to stream the requested content. Using the session set-up protocol (RTSP or DSM-CC), it provides the STB with both the frequency of the 6 MHz channel (RF channel of the QAM modulator) and the MPEG2 program number carrying the requested video. The STB tunes to the frequency and program number and the viewer sees the stream. The viewer can then pause, fast forward, rewind, stop and resume the stream. When doing so the on-demand application in the STB communicates a command to the VOD system using either RTSP or DSM-CC protocols.

VOD Ad Insertion There are two primary applications of VOD ad insertion applications: 1) playlists, and 2) ad replacement. With playlists, ads are inserted around VOD content such as movies, TV programming and other on-demand content. When ordering a title, such as a movie, the viewer sees ads prior to the movie itself. Ads may also be present at the end of the title and even after resuming from pause. Playlists are important for advertisers as well as for promotional purposes for cable networks and cable operators wishing to promote other products. Similarly, thirty-second ads can be sold and inserted ahead of and after their VOD programming. Today, VOD programmers and cable operators edit promotional ads and paid ads into the beginning and end of their VOD content making it part of the same content file. If they choose to change the ads for a title, the entire program must be re-edited and redistributed. Playlists, however, allow the ads to change dynamically on the VOD server and therefore do not require editing in advance or redistributing the entire program. Only the new ads need to be distributed. Ad replacement allows ads to be inserted in local breaks in VOD programming while it is streaming to a household. Ad replacement is similar to playlists in the way video segments can be sequenced and it leverages much of the same technology. For playlists and ad replacement to work there must be local breaks in content and there must be a way for local breaks to be detected. Very little VOD content today has local commercial breaks or any breaks at all. Many cable operators believe that that will change over the next few years as the number of cable programmers supplying VOD content grows. This is especially true if network personal
video recording (nPVR) succeeds with ad-supported programming. VOD ad insertion creates a viable business model for content providers’ ad sales operations and may be part of the business model that encourages cable networks to contribute content. Technically, both playlists and ad replacement are nearly identical. One main difference is that playlists can be applied to content that may or may not have pre-existing local breaks and embedded ads in those local breaks when it is loaded onto the VOD server. Ad replacement, on the other hand, specifically applies to those local breaks and replacing those embedded ads. In order to insert ads in and around VOD content, a number of operational and technical details must be implemented:
• Organizational responsibilities, architecture and workflow
• Traffic & billing system configuration and back office integration
• Detecting local breaks • Inserting ads in VOD content • Targeting ads by geography • Household addressability in the future
ORGANIZATIONAL RESPONSIBILITIES,
ARCHITECTURE AND WORKFLOW Organizationally, different people are responsible for ad sales and cable system operations. With VOD ad insertion, where the VOD system is also the insertion system, each groups’ roles and responsibilities may be unclear. The best way to manage this is for ad sales personnel to manage the workflow for schedules, ads and logs just as they do today but treating the VOD system as the ad insertion system along with their traditional ad insertion systems. However, cable system personnel should continue to own and manage the VOD system and the VOD programming. This is

very similar to how DPI ad splicers are dealt with today. The splicers insert the digital ads into digital programming but have another function with respect to the cable system. Simply put, ad sales personnel should continue to manage ads and cable system personnel should continue to manage the VOD system itself, including storage and stream requirements. Figure 3, below, shows an architecture for VOD ad insertion in which both the ad management and VOD management systems and headquarter facilities remain unchanged from today’s ad sales and VOD.
With this organizational and architectural arrangement, ad sales operations remain relatively unchanged. Using their existing ad management application in their HQ, they still:
• Import traffic schedules from T&B • Encode and distribute new ads and
schedules to headend insertion systems • Alert missing ads and system failures • Remove expired ads • Monitor breaks and insertions • Retrieve verification logs and export to
T&B
Head End
Catcher's Mitt
VODSystem
Headquarters
nABLEHQ
nABLE GUInABLE
GUI
SMS / BillingSMS /Billing
nABLE RT
n4x Server SplicerSplicerSTBVideo
Session Set-up
StreamControl
Content FileDistribution
Reporting &Authorization
Billing /Authorization
AssetMetadata
Asset Metadata &Content Files
Head EndTraffic & BillingSystem
SkyVisionHE
Head EndKit
Headquarters
SkyVisionHQ
File Distribution
Traf f ic &Billing
Reporting
ScheduleSkyVisionGUI
SkyVisionEncoder
Schedule
SplicerSplicerSplicer
SplicerSplicerMDS
Ad Sales Operations
Cable System Operations
File Distribution
ReportingSchedules
Figure 3. nCUBE’s VOD ad insertion architecture and management responsibilities with nCUBE’s SkyVision ad insertion system and nABLE VOD system and n4x video server. Ad sales operators view VOD as another inserted and manage ads, schedules and logs similar to traditional insertion systems.

Traffic & Billing System Configuration and Back Office Integration Today’s T&B systems and the existing schedule format could be used for VOD ad insertion initially. However, new formats and interfaces will be needed eventually. The schedule interface is a flat ASCII file today. The T&B system creates a daily schedule for each cable network in which ads are being inserted. The inserter uses that day’s schedule for encoding ads, distributing ads and playing ads in the correct program or day part. The schedule includes break windows and ad names (a.k.a. spot IDs) and ad positions in each break. From a T&B perspective, VOD does not have a fixed number of breaks in a fixed number of cable networks. With traditional ad insertion, the number of breaks and their break lengths are configured into the T&B system, in advance, for each program and day part of each cable network. That way the T&B systems and the ad sales organization can track the number of avails sold and the inventory available. With VOD, there are not a fixed set of avails to configure in advance; nor are there specific day parts. The best method to create and track inventory for VOD in T&B is to estimate the number of sessions, and hence impressions, expected in the future based on historic session reports from the VOD system. The estimate can be refined over time with regular reporting. Instead of cable networks, VOD virtual networks will need to be defined in the VOD system. The T&B system will publish a daily list for each VOD virtual network just as it does for each cable network today. The simplest case is to create a single virtual network (call it VOD1) for VOD. This may be sufficient in the beginning. More sophisticated virtual networks which could be implemented, and in any combination, include:
• VOD regions (e.g. East and West) • VOD categories (e.g. movies, SVOD) • VOD playlist and VOD ad replacement • VOD titles (e.g. Larry King Live) • VOD content provider (e.g. ESPN,
Warner Home Video) Each virtual network can be scheduled independently of the others and do not share inventory. With virtual networks, schedules can be created which vary by region, category, title, content provider and more. Since all VOD virtual networks are part of the same physical VOD systems, the total number of impressions is the sum of the impressions of each of VOD virtual networks configured. An impression report from the VOD system for each virtual network assists in predicting inventory for each. Day parts could be used in T&B and for impression reports, but initially a 24-hour day part probably makes sense. In the T&B schedule, all ads would occur in the same 24-hour break window each day. Once virtual networks and day parts are defined, and avail inventory estimates are entered, the ads can be priced and sold and orders can be entered into the T&B system. The current T&B schedule lists each ad to play during each day for each network, or virtual network in this case. That could be quite a long list if there are one or just a few virtual networks and a lot of playlists and ad replacement opportunities. This is an area of future optimization for T&B interfaces. Instead of repeating ads, specifying the frequency of occurrence for repeated ads would be more efficient and real time interfaces would be an even better solution. Once the schedules are published, the VOD ad insertion system plays and logs the ads for reporting and billing. With VOD today, each session is logged in the VOD system’s database

for later reporting. Advertising content on VOD is logged just the same. These logs may be returned to the billing system and used for billing and reporting to advertisers. The billing system can simply count the ads played against the ads ordered and determine if the contract was met. If not, it can schedule ‘make goods’ in the future in which it schedules enough additional ads to fulfill the commitment (sold for each virtual network) in the future within the flight of the contract. Alternatively, it’s conceivable that VOD ads can be sold on a per impression basis in which each time the ad plays the advertiser can be charged. The biggest billing issue with VOD ad insertion is determining the value of the ads in the first place. VOD is a new medium for ad sales managers, and advertisers and their agencies are used to TV measurement and traditional delivery methods. A number of reports will be needed from the VOD system for use by cable ad sales operators to show their customers what was delivered. Today’s T&B systems and ad agency back office systems may not make much sense of VOD’s one-to-one impression data given that they were designed for tradition TV advertising which is based on reaching a certain size and type of TV audience and is very much based by Nielsen’s measurement data. However, the data collected by VOD systems shows very detailed, exact viewer information about every individual impression. And, when combined with other research and measurement data presents a detailed view of the audience that can be inspected down to individual households. The data available from the VOD system for each ad in each VOD session includes:
• Name of advertiser • Name of ad • Spot ID of ad content viewed
• Viewer set-top ID (MAC address) • Viewer account number • Viewer service group • Session date • Session start and end times • Session stream activity and times (e.g.
pause, fast forward, resume, etc) By combining data from the VOD system with other quantitative and qualitative data, advertisers and ad agencies can learn about their viewers as a group, and cable operators can use the data for billing purposes. Nielsen’s involvement in VOD should help make ad agencies and advertisers more comfortable with the medium and its value in the future. Cable operators could use the STB ID and account number to obtain viewers’ home addresses and their zip codes. Zip codes are more specific than service group and yields more accurate information about viewers when combined with qualitative research data. A number of market research databases and applications, such as Claritas, provide qualitative characteristics about geographic areas by zip code, which enhances the VOD and Nielsen data. Further, numerous databases provide very specific information about particular households which can be generalized and made anonymous in such a way as to be permissible for use with advertisers when combined with the VOD data. Privacy law prohibits cable operators from sharing data about specific viewers, without their permission, with third parties. However, generalized qualitative and quantitative information about the characteristics of groups of viewers rolled up and made anonymous, can be shared with third parties. (Cable operators should check with their legal counsel regarding privacy law.)

Detecting Local Breaks Before local breaks can be detected, they need to be there in the first place. Breaks may be created differently for playlists and for ad replacement. Playlist breaks may be defined by VOD content providers or by cable operators or by both. Ad replacement breaks, however, are always defined by the VOD content provider. Both could use cue packets and metadata to define break positions and lengths. It is likely that playlist breaks would use metadata where as ad replacement breaks would use cue packets. This is because it is much simpler to use metadata when creating ad avails before and after content by either programmers or cable operators. In addition, CableLabs is considering support for playlists in the next release of the VOD metadata standard which today’s VOD content providers, cable operators and VOD vendors all support. Using metadata and supporting playlists is likely to evolve first because of the industry momentum as well as the fact that today’s content does not have local breaks. Since ad replacement applies to content, which already has local breaks in it, it is more likely to have cue packets already in the content when loaded onto the VOD server. For playlists, the metadata needs to identify and be applied to:
• Content provider, category, and title, hierarchically (e.g. all new releases)
• Break position (e.g. before and after) • Break length (e.g. 60 seconds) • Break owner (e.g. network, operator,
marketing, shared, etc.) The playlist metadata can be implemented by content providers in advance as part of what is pitched to the VOD system. The metadata can also be augmented locally by the cable operator after it is pitched using the VOD asset management system.
For ad replacement, using SCTE 35 cue packets, the standard is already in place and starting to be used in traditional ad insertion. The cue packets signal breaks through MPEG packets multiplexed into the program stream. In VOD, cue packets would be present in content loaded onto the server and used to identify local break positions and insertion splice points. The VOD system may use cue packets in real-time for ad insertion or may use them during content ingest and translate them to a proprietary internal metadata format or the standard future metadata format so that the VOD server does not have to filter for cue packets in real time; it can use metadata just as it does with playlists. Inserting Ads in VOD Content In order to support playlists and ad replacement, VOD systems need a way to assemble multiple MPEG video files and need to be able to switch in and out of MPEG video files seamlessly from viewers’ perspectives. nCUBE’s VOD video server leverages nCUBE’s Logical Content technology to dynamically assemble video files for playlists and ad replacement in video streams in real-time. nCUBE’s Logical Content technology supports seamless streaming of multiple MPEG2 files playing back-to-back with zero black frames and with fast forward and rewind across the boundaries. Logical Content also allows MPEG2 video files to seamlessly switch from in and out splice points switching from one MPEG2 video to another at any MPEG group of pictures (GOP) boundary in real-time while playing from the video server with zero black frames. The files are never compiled into a single static file but are assembled during streaming for each viewer’s session. That way an ad can be changed dynamically for targeting, addressability or new schedules. Logical Content is illustrated in Figure 4, below.

Figure 4. nCUBE’s Logical Content technology for dynamic VOD ad insertion with playlists and ad replacement applications. To create playlists or perform ad replacement, the VOD system needs to perform the following steps during play out after receiving the VOD session set-up request and requested asset ID (which is in the session set-up message):
1. From the asset ID, determine break positions and break length specified in the asset’s metadata and synchronize the breaks with the stream position (assuming any cue packets were translated into metadata when the title was loaded).
2. Determine the virtual network based on
the criteria discussed in the T&B section, above (e.g. category selected, region where STB is located, etc.).
3. Choose the proper T&B schedule based on the virtual network (e.g. action category in East San Francisco).
4. Select the next ad(s) on the T&B
schedules (or start with the first ad on the schedule) so that the ad lengths add up to the break length.
5. Play the ad(s) at the proper splice point
using Logical Content technology and return to programming after break (unless the break occurs at the end).
6. Log the ad verification and other
reporting data (e.g. advertising, ad name, time, etc.).
Lastly, it should be noted that VOD content is encoded at maximum of 3.75 Mbps with AC-3 audio as specified by CableLabs and that ad sales typically encodes at 4 to 6 Mbps and
ESPN Sports Center VoIP Promo Kraft Ad
A B C D E M N X Y
M N O A B C X Y Z G H
Content As Seen By Subscriber
G H
Old Ad

may or may not have AC-3 audio (DPI requires AC-3). Although VOD systems can accommodate multiple rates, ads at higher bit rates would require more VOD bandwidth than operators have budgeted in their plant design. Targeting Ads by Geography Since a single VOD server may serve a large geographic region, it may make sense to select different ads depending on the viewer’s location. It is very common for ad sales organizations to zone their operations today for this purpose. There are two primary applications for targeting ads to different geographic zones within a market: 1) some advertisers, such as a dry cleaner, are only interested in marketing to a particular part of town and do not need to advertise to a wider geographic region, and 2) some advertisers, such as an automobile manufacturer, want to advertise to a wide geographic region but want the ads themselves to be different in different parts of town. This second approach is branded AdTag and AdCopy by Adlink in the Los Angeles market, and others are deploying it now as well. Lastly, regions, or zones, will be defined hierarchically as well. Small zones can make up larger zones and the larger zones can make up an entire market. Targeting ads to zones can be accommodated in VOD ad insertion by determining the viewer’s location and matching it with a schedule for that region. In addition to the process outlined in the previous section about inserting an ad, the VOD system needs to determine the viewer’s region prior to step 3 and then use the regional information to select the proper schedule for the proper virtual network. Keep in mind that virtual networks can be defined for regions as discussed in the T&B section of this document. One way to determine the region is to use the VOD service group information passed to
the VOD system in the session set-up request message. The service groups represent geographic regions consisting of about 2,400 digital subscribers based on the example in the section discussing today’s VOD system, above. Using service groups, an ad zone can consist of as few as 2,400 digital subs although in practice the zone may consist of multiple service groups combined together. Once the service group is identified, the VOD system needs to associate it with a zone. The VOD system must hierarchically list the zones associated with each service group since smaller zones may be nested in larger zones. The VOD system then needs to choose the zone. This could be done randomly or sequentially. Targeting ads to geographic regions can be accomplished with VOD ad insertion and today’s T&B systems; however, the application pushes today’s T&B systems beyond their intent and it is cumbersome. Newer T&B systems, or enhancements to current systems, will surely be required to take full advantage of VOD ad insertion and targeting. Household Addressability in the Future Removing the geographic constraints of targeted advertising and addressing ads to specific households dramatically changes the dynamics of TV advertising. Household level addressability combined with the one-to-one TV sessions of VOD provides an ideal ad medium. Advertisers have the potential to deliver their message to households in which their product or service is most relevant (e.g. >$100K income, with kids). One house may receive a diaper ad and their neighbor may receive an ad for heart medicine. Advertisers can also measure the delivery to each set-top. Household addressability with VOD ad insertion could move TV advertising towards the highly lucrative direct mail business in future.

During a VOD session request, the VOD system receives the STB’s unique MAC address, which can be used to select the ad that best matches each household’s lifestyle. Existing T&B systems fall far short of supporting this application. Several companies have developed addressable advertising systems and databases for tracking household lifestyle information as part of or as extensions to T&B for household addressable advertising with DPI system. Using these new addressable advertising systems, the VOD system can request the ad to play for a particular STB in real-time through a new software interface. The format for a new real-time T&B interface is not yet standardized but is commonly understood as being needed for this and other applications. The addressable advertising systems can use a variety of data sources to determine a household lifestyle profile including:
• Qualitative data for neighborhood characteristics
• TV viewing including VOD (quantitative data)
• Household credit card usage • Grocery store shopping behavior
Based on a variety of factors, theses systems can determine a household profile and can simply tell the VOD system the ad to play. The VOD ad insertion system still needs to know in advance what ad content is needed in order to distribute the ads to the VOD servers, monitor ads and breaks and report back logs. However, today’s flat file daily ad schedule currently imported for T&B systems goes away. In addition, verification logs would likely be returned in real-time over a new interface as well.
CONCLUSION Local ad insertion is evolving to include VOD. This requires support for VOD ad insertion in both VOD systems and ad insertion systems. Local ad sales, cable marketers and content providers can take advantage of VOD ad insertion and both playlists and ad replacement can be used to create new inventory. VOD streams are unique, one-to-one TV sessions with each household giving it tremendous potential for targeting and household addressability. Operationally, VOD advertising should be an extension of today’s ad sales operations and has much of the same workflow, monitoring and general ad sales responsibilities. Existing T&B systems can be used in the beginning but will need to evolve in support of the new medium and make the most use of one-to-one TV. Methods for detecting and describing breaks need to be agreed to and standardized so that content may flow across different vendors’ systems and different cable operators. VOD ad insertion appears to be unique and advantageous for advertisers and ad sales operations in that it has the potential to:
• Use local breaks in VOD content similar to traditional local breaks on broadcast cable
• Create new local breaks before and after VOD content
• Recapture digital viewers watching VOD and not watching broadcast cable
• Support geographically targeted and household addressable ads
• Provide 100% measurable advertising data
VOD advertising and other advanced advertising technologies and business are unique to cable and should be fully exploited. nCUBE is a leader advertising insertion, VOD and advanced advertising today.

1
ALL-DIGITAL: WHETHER AND HOW TO GET THERE Nick Hamilton-Piercy
Rogers Cable Inc.
S.V. Vasudevan BigBand Networks, Inc.
Abstract
This year witnesses the first launches of “all-digital networks” by major cable operators. These initiatives can free abundant bandwidth to support hundreds of additional TV channels, faster Internet service and more rapid launches and scaling of advanced video services such as video on-demand and high definition. They also usher in less expensive set-top boxes and other subscriber devices, based only on digital tuning, and have promise for delivering better video quality.
However, the path to the all-digital network does not happen with a simple flip of a switch. Implementation can be quite disruptive to subscribers, as each one will now need to have every one of their television sets and possibly VCRs connected to a digital set-top box (unless these devices are digital cable-ready). This scenario has the potential to become an operational disaster, to say nothing of the imposition many subscribers are likely to feel with specific devices forced everywhere they want to watch television.
Consideration of all-digital cable certainly has merit, but methods and alternatives should also be weighed. There are other emerging techniques for conservation of bandwidth that can be employed before, in parallel with, or instead of going all-digital. And if all-digital is pursued, there are several options to minimize the cost and disruption of achieving it.
THE CASE FOR ALL-DIGITAL
There are three basic drivers most commonly cited by operators as their business motivations for eventually replacing all current programming distributed in analog format with all-digital content. These drivers cumulatively promise to save costs, increase per-subscriber revenues and enhance cable’s competitiveness. They are:
1) Bandwidth optimization: Reclaimed analog spectrum will be used by bandwidth-hungry HDTV, VOD, and other advanced video and data services. Analog broadcasting currently occupies more than half of all cable spectrum, so this saving will significantly alleviate the capacity constraints impeding cable operators’ abilities to scale up offerings across the full range of these services.
2) Set-top box cost reduction: Removing the analog tuner and conditional access from today’s hybrid analog/digital boxes significantly reduces the cost and complexity of the devices. Expanding this concept to today’s dual-tuner digital video recorders further expands savings with the elimination of two analog tuners as well as the MPEG-2 encoder chips required to digitally write the analog video to disk.
3) Improved picture quality: Although the level of compression utilized can make the claim dubious, competitive service providers like direct broadcast satellite (DBS) television have used “all-digital”

2
in marketing campaigns to claim superior quality over cable signals. The quality achieved in digital programming is determined by the quality of the encoder and how much bandwidth is allocated per stream, but converting to all-digital could provide sufficient capacity to in fact make an overall improvement in picture quality, including expanded HDTV carriage. Further, VSB-NTSC analog programming distributed by cable can have poor display quality on large-screen digital televisions, especially noticeable when tuning from digital services to analog services, further reinforcing subscriber perception problems versus DBS.
These drivers are indeed persuasive. Better picture quality would help cable retain and gain subscribers in the churn battle with DBS and other video service alternatives. Likewise, more innovative services available on a bandwidth-optimized plant keeps subscribers interested while driving incremental revenue gains such as on-demand program orders. The lower costs associated with a more efficient plant, as well as with less expensive subscriber devices, also of course contribute to an enhanced bottom line.
But as stated above, with the benefits, all-digital conversion brings challenges as well. In addition to massive churn of subscriber equipment, other current cable analog operations must be considered and transitioned, such as the current multi-billion dollar local advertising insertion practice of cable operators. There is increasing realization in the industry that all-digital conversion must be evolutionary more than revolutionary, and several alternatives can alleviate efforts and expenses.
DIGITAL SIMULCAST
Digital simulcast, simply put, is the replication of the analog tier as digital programming. Most systems, especially those upgraded to 750 MHz in the recent years, broadcast at least 80 channels of analog programming (basic and enhanced basic tiers) to their customers. Using advanced RateShaping bit-rate adaptation technology, these programs could be encoded and statistically multiplexed into as few as six 6MHz channels, or within 36 MHz of spectrum. Although having upgraded to 750 MHz does not guarantee that there is sufficient spectrum, especially with the contention of emerging services such as VOD and HDTV, the amount of spectrum required can usually be attained with some bandwidth engineering.
There are several perspectives regarding the optimal topology for digital simulcast programming distribution, from one of pure centralization on a national scale, to a very distributed methodology. In either case, the operator’s primary goal is to replicate the entire analog tier in digital form and utilize broadband transport networks such as Gigabit Ethernet to distribute this programming to the hub or zone level of the network. This transport technology will require that an adaptive switch or router be used to translate some, if not all, of the digital programming from an ASI transport protocol to a unicast IP protocol.
All digital feeds, including the insertable primary network feeds, are delivered to the hubs/zones where they can be received by a statistical multiplexer that supports Gigabit Ethernet input. All incumbent analog ad insertion equipment would need to be replaced or upgraded to support digital program insertion, and the multiplexer would splice the ads into the now-digital programs.

3
The multiplexer then duplicates all the digital streams that will need to also be distributed as analog programming over the last mile to those customers who only subscribe to the basic or enhanced basic tier, or who have additional televisions with no digital set top box. For each split pair of
programming streams, one will be subjected to RateShaping, placed into a multiplex and digitally delivered within QAM-modulated spectrum; the other will be decoded to analog baseband, NTSC-modulated and combined onto the spectrum reserved for the analog tier.
Digital simulcasting allows all-digital conversion while preserving utility of analog customer premises devices by combining both analog and digital versions of basic and expanded basic programming, with transport and splicing performed digitally.
Once simulcasting is implemented, any of the operator’s customers that are digital subscribers (and therefore use a digital set-top box or digital cable-ready television) could now receive all of their programming digitally including the digital versions of programming that is broadcasted in analog. They thus no longer require the expense of analog tuning in their set-top boxes and other television devices. Those customers
that only subscribe to the basic or enhanced basic tier would continue to receive their programming as they always have, but they can access the digital version of the same programming with a very inexpensive set-top box that only includes a digital tuner. The proposition of improved quality might be sufficiently compelling for a portion of these customers to adopt the use of such a set-top box. As more subscribers access the

4
digital versions of programming, legacy analog devices can be churned out of the system to achieve an effective transition to all-digital over time.
Simulcasting is a viable and controlled path towards the deployment of all-digital cable networks, and also provides the cable operator with ancillary benefits. In fact, some of these benefits are already being seen as sufficient to motivate several cable operators to engage in simulcasting for its own sake, whether or not an all-digital future is ultimately effected.
Simulcasting enables lower cost digital video recorders (DVRs) by eliminating the need for components that support analog programs. With greater familiarity and easier availability through service providers, more North American pay television subscribers are opting to own, and use, a DVR. 25% of all new DBS subscribers now receive a DVR and this has been an area of competitive advantage. But the cable industry has now introduced its DVR offerings, which are being well received. In large part due to the necessity of two analog tuners and two digital tuners to support simultaneously watching and recording either programming tier, and an encoder to digitize and store analog content, the DVRs as provided by traditional cable set-top box vendors are relatively more expensive than those being used by the DBS providers. Some experts in the industry, though, estimate that cable operators could save as much as $100 per set-top box if they, too, could provide a purely digital DVR. Using this potential saving, coupled with a set-top box (sans DVR) that is also purely digital could provide another $50 in savings. This could save millions of dollars in a cable system that has hundreds of thousands of homes passed.
Local cable advertising could also be more profitably operated by simulcasting, regardless of whether all-digital cable is eventually achieved. Cable operators currently derive multi-billion dollar annual revenues from local advertising, almost entirely on analog programming, but have plans for significant growth, as for one thing their stake is a disproportionately small share of all television advertising. Current and emerging digital splicing standards and Gigabit Ethernet transport of content can make the practice easier and more economical, flexible and scalable. All insertable programming can be digital, including analog-sourced content that is encoded in the headend. Once in digital form, programming can be centrally groomed and multiplexed and distributed by Ethernet transport to hub locations that correspond to the zones for insertion. Servers can be situated at those locations, and splice in the zone-specific advertising on receipt of the cue tone in the transported program stream. In simulcasting, at this point an analog copy of the program, with the inserted advertising, would be decoded and NTSC-modulated for plant transmission. There are alternative simulcasting and digital insertion models that can also be considered, and overall, the greater efficiencies of working with digital content for transport, storage and splicing also indicates savings of millions of dollars in a typical cable system.
Simulcasting presents an overall attractive means of gradually converting towards an all-digital cable network. It forestalls the disruption of a singular, massive digital switchover in favor of more gradual means. Ancillary benefits in areas such as DVRs and local advertising can drive economic benefits that make simulcasting worthwhile regardless of whether or when all-digital is eventually attained. Ironically, the goal of an all-digital

5
network is to liberate programming bandwidth consumed in its inefficient broadcast analog form, but the first step of simulcasting begins the process by placing an additional demand on cable spectrum. The primary hurdle is to free sufficient spectrum for both digital and analog versions of basic and advanced basic programming, and several techniques can accomplish this.
SWITCHED BROADCAST
Like all-digital, switched broadcast receives attention as a means of providing more programming and launching more services. Switched broadcast could be an alternative to all-digital, or an aid towards achieving all-digital by freeing up the spectrum required to implement analog-digital simulcasting. Switched broadcast can even play a valuable role in the infrastructure of an all-digital network once it’s fully realized.
Switched broadcast combines broadcast techniques of sourcing live programming along with on-demand techniques of distribution. Through a thin client
application that can be dynamically downloaded to any digital set-top box, the network detects subscribers’ channel selections. Among programs designated to a switched broadcast pool, only those requested from within a node or service group are distributed within it. When a subscriber switches to a locally unwatched program, this is recognized, and a headend-based server dynamically allocates a frequency within the viewer’s area will now carry that program, and instructs an MPEG-aware switch and the set-top box of how to transmit and receive this program. If a subscriber switches to a program already being watched in the node or service group, the existing transmission is joined. Once all subscribers in the area tune away from a given program, that program’s session can be dynamically discontinued and the bandwidth that was used now becomes available for other switched broadcast sessions. The mechanics of implementing switched broadcast are further explained in the paper Planning for and Managing the Rollout of Switched Broadcast Services presented by Time Warner Cable and BigBand Networks at the 2003 SCTE Conference on Emerging Technologies.

6
Switched broadcast is consistent with all-digital’s efficiency objectives, and can facilitate analog-digital simulcasting, by only carrying those digital
programs being watched in an area (1 and 3 in the illustration above).
A major cable operator has completed a field trial of switched broadcast on a contained pool of 10 specialized programs. In the analysis of channel requests during this trial, it was determined that the ten programs could have fit in the capacity for seven without suffering any blockage. If they were fit in the capacity for six, then 99% of the time all demand would be met whereas 1% of the time there would be one blocked program out of the six requested, which means that more than 99.8% of all demand would be met. And if enough capacity for 5 programs were provided (i.e.
50% of the number offered), then 94% of the time all requested programs would be provided, and over 99% of all demand would have been met. These specific trial parameters are not a representative sample and the nature of statistics will certainly make the results even better with a larger and more diverse set of programs than the 10 that are were used. Further detail on the results of this trial can be found in the paper Switched Broadcast: Statistics from the Field presented by BigBand Networks at the 2003 SCTE Cable-Tec Expo.

7
The initial results of the limited trial were encouraging enough to warrant larger scale trials with more programming and larger subscriber bases, which are being conducted as this paper is being written. While final analysis is not complete, the statistical indicators are that among the few hundred programs typically digitally broadcast, some subset of the most popular programs, perhaps approximately 100, could be conventionally broadcast and the rest could be most economically provided by including them in a switched broadcast pool. Based on knowledge of subscriber viewing behavior, this programming can most likely be provided at a bandwidth capacity reduction on the order of 50% with virtually no blocking of programs. Furthermore, with switched broadcast, cable operators could dramatically expand the selection of programming they provide to include worldwide international fare, increasingly niche programming topics, live events in sports, performed entertainment, education, professional gatherings and other genres. These are similar benefits to those of all-digital conversion. Switched broadcast could be considered as an alternative or a complement to the all-digital network.
Both carrying programs only in digital form and switching them dynamically so that they only use bandwidth where and when required provides dramatic bandwidth efficiency gains. This derived capacity expansion future-proofs the network for the migration of all programming to higher quality levels including HDTV, and the migration to all on-demand availability.
Confirming the bandwidth gain promise of switched broadcast, the paper Modeling Switched Broadcast Video Services presented by Cable Television Laboratories at the 2004 Winter Conference states:
Switched broadcast video services can be used to offer many more broadcast programs, using less bandwidth, than traditional broadcast services. A typical 750 MHz cable plant could theoretically offer over a thousand broadcast digital programs to subscribers, compared to a few hundred programs using traditional broadcast.
The benefits of switched broadcast can be amplified by extending the practice of dynamically allocating bandwidth and associated resources to all services according to subscriber use, not just the digital broadcasting pool. Plant protocols such as 256QAM modulation apply across digital services, so the same modulator and channel that is primarily used for digital broadcast programs at a time when they are popular, such as a weekend afternoon with many live sporting events, could be used primarily for VOD content when that is popular, as in the same day’s evening, when subscriber preferences switch to saved entertainment content such as movies, and likewise for interpersonal communications (including video conferencing) or business data services when their traffic demands peak.
While the long term benefits are enticing, in the near term, switched broadcast can assist in facilitating digital simulcast deployments. The basic and advanced basic programs are most likely too popular to sensibly fit in the switched broadcast pool, but freeing the six channels that may be required to digitally simulcast 80 programs, could be achieved by taking approximately the bottom third of digital programs and switching them. Switched broadcast should conservatively achieve a capacity gain of 50% when applied to such programming, so switching 160 digital programs should provide the bandwidth required to simulcast the 80 programs already carried by analog.

8
NEXT-GENERATION DIGITAL TECHNIQUES
Other trends in the handling and processing of digital video content are also worthy of consideration for their potential for bandwidth conservation. These can be used to further enhance the efficiencies from switched broadcast and all-digital, and aid in the implementation of digital simulcasting.
RateShaping techniques leverage statistical multiplexing benefits for variable bit rate video programs by observing cumulative bandwidth behavior, and when channel capacity is strained, selectively throttling back allocation to selected programs in order to maintain service while maximizing quality. RateShaping algorithms have progressed to gain 50-100% capacity gains with typical multiplexes of 15 SDTV programs or 3 HDTV programs per 6 MHz channel, or higher, with imperceptible compromise in picture quality if care is taken in selecting appropriate program content type in the multiplexed services. Current developments, including tools for more intelligent assembling of channel groups, should further boost these efficiencies, but at some point algorithmic limits will be reached for RateShaping of MPEG-2 video. An advantage of RateShaping is that it is MPEG-2 compliant, necessitating no changes to headend, plant or customer premises equipment, with algorithmic advances generally achieved by software upgrades to existing grooming and multiplexing equipment.
Further bandwidth efficiency gains beyond RateShaping may be achieved by utilizing different coding formats than today’s conventional MPEG-2 video over
256QAM modulation. MPEG-2 now exceeds a decade of useful service and more efficient video encoding techniques are emerging. H.264/MPEG-4 Part 10 promises to enable the carriage of as many as five HDTV programs per channel at constant bit rates, and presumably several more with conversion to variable bit rates and RateShaping practices. However, RateShaping of MPEG-4 encoded programs is unlikely to achieve the extent of bandwidth savings possible with MPEG-2 as MPEG-4’s encoding is already highly efficient. Moving to a new video encoding format or transmission format requires replacing digital access equipment, with the corresponding capital expenses. IP encoding and transmission schemes could be simulcast with MPEG-2 (and for some programs analog too if digital simulcast is being used). Switched broadcast architectures could also be applied so that an MPEG-4 stream of a program is only broadcast in an area when an MPEG-4 subscriber requests it, and likewise for other formats. The bandwidth efficiency gains of emerging encoding techniques do provide savings in requirements of equipment such as VOD storage, DVR storage, and transmission equipment, since more programs per channel means more channels per headend device. There are also benefits in extension of broadcast content to more subscriber devices, including PCs, and in abilities to leverage other IP practices such as flexible encryption for open conditional access and XML tags to profile subscribers, services and other entities.

9
Encoding technique advances promise
substantial near-term efficiency gains as all-digital complements or alternatives.
Like MPEG compression, QAM modulation is a practice that will continue to achieve bandwidth efficiencies in succeeding generations. Use of 1024QAM would improve channel capacity for digital content by 25% over 256QAM. Even greater bandwidth efficiencies would be achieved if used in conjunction with advanced encoding such as MPEG-4. Incompatibility with current subscriber equipment would, like advanced encoding, be disruptive but a migration is doable using the switched broadcast stream approach as previously described or through simulcast of formats if spectrum is available during the transition.
Techniques such as MPEG-4 encoding and 1024QAM ultimately dovetail well with other trends related to all-digital to achieve a network of much higher overall capacity with richer functionality available to subscribers. But, like other means to convert to all-digital, these come at some cost and effort, and their merits must be weighed in this light.
CUSTOMER PREMISES DECODING
Eventually an evolution to an all-digital distribution, likely with advanced video encoding, is inevitable. In the nearer term simulcasting may ease the transition and avoid forcing an accelerated conversion of customer premises equipment. At some point, the forced change in the home environment must be confronted. Television receivers tend to have 15 or more years of usage before they are discarded and most cable operators are loath to retire a customer provided STB until well past its depreciated life. Most customer-owned television receivers and VCRs require an analog signal.
Provisioning a digital set-top box for every analog cable client is complicated and expensive. From a cost standpoint, cable operators would prefer to avoid equipping every television in the household with the full functionality of digital tuning, recording, picture-in-picture, interactivity and other features unless the customer finds the added functionality sufficiently compelling to produce incremental revenue. Even the provision of relatively low-cost devices that only perform digital tuning can be prohibitive if several are required for each home. Subscribers can get antagonized as well. From their perspective, a change is being forced on them, perhaps placement of the CPE being incompatible with built-in furniture, and without any perceived increase in the service value proposition – no added services, just the same to that they were already receiving in analog. Some may argue that the digital transition introduces reductions in the quality of service as measured by a metric such as channel-change latency, which is historically slower

10
for digital programming. Offering additional services, such as VOD, and demonstrating improved picture quality of all channels
might provide enough benefit to offset at least some of this issue.
Use of a network interface unit to decode digital video preserves existing analog devices within customer premises while allowing for the functionality and bandwidth efficiency gains of
all-digital broadcasting and services in the cable facilities and plant.
Alternatively, migration to an all-digital plant with analog homes or at least some analog devices in homes might more economically be achieved if homes have a single point of digital to analog decoding and analog video distribution is effectively maintained just in the home environment. Much like how circuit telephony has been provisioned on cable plants, a video network interface unit (NIU) could be placed at a point of ingress to the home in order to
decode programs and distribute internally in analog form. This requires the provisioning of decoding equipment only once per home rather than at every device. The NIU device would need configuration for digital service transparency and to pass the 2-way interactive signals for services such as VOD, high speed data and voice over IP. The concept could be extended to a shared NIU in a multi-dwelling unit, gated community or neighborhood. Such consolidation

11
reduces equipment and maintenance costs. The distribution could be agile across multiple physical methods including wireless to further alleviate expenses.
Decoding digital video at or near customer premises enables the cable operator to use all-digital in order to gain effective capacity at the most constrained part of the network: the coaxial cable distribution plant. Alleviating that environment is the most important accomplishment towards avoidance of the most expensive technique of securing capacity expansion, namely embarking on further rebuilds and upgrades. Securing sufficient bandwidth is much more economical at the destination points of the plant, where decoding to analog can be supported. This practice could deepen penetration of all-digital to the neighborhood, curb, home or device while optimizing economics of subscriber retrofitting and minimizing disruption and annoyance for customers. As more digital televisions migrate into these homes and analog units cease to operate from age, the role of the video NIU becomes redundant, and all-digital the whole way through the network to the client device emerges as an eventuality.
CONCLUSION
Conversion to all-digital enables significant business and competitiveness gains for cable operators, but is on its surface a daunting proposition. Several techniques that leverage characteristics of digital content, described herein, can alleviate the process. Analog-digital simulcasting, switched broadcast, implementation of technical digital video advances, and decoding content at customer premises are all tools for gradual attainment of all-digital without significant service disruption or expense spikes. By implementing several or all of these alternatives, operators can enact an eventual migration towards truly all-digital cable services, from content origination to subscriber consumption, while attaining many of the goal’s promised benefits along the way.
BigBand Networks, Inc. 475 Broadway
Redwood City, CA 94063 650 995 5000
http://www.bigbandnet.com

ANALYSIS AND PREDICTION OF SET-TOP-BOX RELIABILITY IN MULTI-APPLICATION ENVIRONMENTS USING
ARTIFICIAL INTELLIGENCE TECHNIQUES
Louis P. Slothouber BIAP Systems, Inc.
Abstract We present an Artificial Intelligence based method for improving the reliability of soft-ware applications, especially in digital cable TV set-top-box and other embedded environ-ments. Initially a small finite state model of the software system and all relevant applica-tions is constructed to define all user input events and application states of interest. A small set of expert system rules is then defined that analyzes state transitions in testing data. When these rules are applied to actual testing data a quantitative measure of suspicion is assigned to all event transitions in the origi-nal finite state model. Analysis of this anno-tated model can then uncover the source of otherwise intermittent inter-application fail-ures.
INTRODUCTION
No amount of software testing can guaran-tee the quality of an application outside of the environment in which it is tested [4]. How-ever, it is often prohibitively expensive or dif-ficult to exactly replicate the software and hardware environment during testing that will be present once an application is deployed. This is especially true in some embedded en-vironments, like those found inside most digi-tal cable TV set-top-boxes (STB).
Software applications designed to operate in such constrained computational environ-ments must provide a highly reliable, quality, interactive user-experience while simultane-ously coexisting with other applications —usually from multiple vendors— and sharing
the limited computational resources available. In such environments, applications that oper-ate flawlessly by themselves may wreak havoc in a system where limited memory, CPU cycles or network bandwidth must be shared amongst several applications. Such software incompatibilities can occur inter-mittently and be difficult to trace. Often the actual source of a fault is elusive and may not be obviously related to the point of failure.
The results of such inter-application fail-ures can be disastrous in a highly distributed service-oriented industry, like the digital cable TV industry, where one software failure might be replicated throughout all devices in a sys-tem, rendering the service (i.e., TV) inoper-able for millions of customers. Despite the very real possibility of adverse interactions between applications, it is often logistically impossible or prohibitively expensive to test inter-application interactions prior to installa-tion in an actual deployment environment. In the case of digital cable TV applications, software vendors rarely have access to each other’s products, nor can they easily afford the cost of the hardware and software infrastructure required by another vendor’s product. Laboratory environments provided by a system operator do help this situation, but individual systems are often quite unique in terms of hardware and software versions, the mix of deployed applications, and other subtle but important differences.
Inter-application testing in an environment of many distributed, embedded devices —like that found in a digital cable TV system— in-volves a normal installation of the application

on a live system or lab. The actual testing process is rarely fully automated because —at least in the TV environment— application results are often visual, and human interpreta-tion is required to detect defects. Further, the services provided by such applications (e.g., TV programming) often have relatively long durations, so testing cycles may be prolonged. Given these limitations and the large variety of possible adverse interactions between ap-plications, no practical testing plan can be ex-pected to uncover all problems [4].
We present a different approach. Rather than attempting to design and execute large, comprehensive testing plans our method gath-ers test data from a series of random user events, and employs a combination of Artifi-cial Intelligence techniques to automatically analyze the data and deduce the likely sources of faults and defects.
The method we present has been employed successfully to identify the sources of inter-application failures and to predict system reli-ability during a recent software trial with a leading digital cable TV operator. The exam-ples presented below are abstracted from that real world case study.
METHOD
The method we present is designed to de-duce the sources of software failures from the sequences of user actions that are likely to induce those failures. It is composed of five distinct steps, as follows:
STEP 1 - Define a finite state model that abstracts the relevant software system, appli-cations, and user events.
STEP 2 - Define a set of IF-THEN rules with associated certainty factors that identify sequences of events and states that tend to lead to failure.
STEP 3 - Gather test data from a number of randomized testing trials.
STEP 4 - Apply the rules from step 2 to the testing data from step 3 to annotate the model from step 1 with certainty factors.
STEP 5 - Analyze the annotated model produced in step 4 to deduce likely sources of failure and problem user event sequences.
Each of these steps will be discussed in de-tail below.
STEP 1 - The Finite State Model
The first necessary element in this process is the definition of a simple finite state model1 that abstracts the relevant system and applica-tion states along with the user input events that cause transitions from one state to an-other. Initially, this model may be quite sim-ple, with only a handful of states representing the applications involved. Later, once the method deduces specific states as the sources of failure, these problem states may be ex-panded into more complex sub-models to fur-ther refine the source of the failures. Table 1 below depicts a finite state model that will be used later in Example 1.
In this table each row depicts a state with the state name in the first column followed by the state transitions for the five user key-press events named at the head of the columns. Events that have no effect in the various ap-plications have no transitions listed in the cor-responding rows of the model. Pictorially, this same finite state model can be depicted by the directed graph in Figure 1. The “Power Off” state is the start state of the model, but no states are identified as final states. The only final state is the “REBOOT!” or failure state,
1 Also known as a Finite State Automaton (FSA), Finite State Machine (FSM), or Deterministic FSA. [2]

which is accessible from all other states, and is therefore not shown.
Given a finite state model of a system, test results for that system may be represented by a sequence of (state, event, state) triples that
define the transitions from state to state caused by a sequence of user input events. For example:
(Power Off, Pwr Key, Watch TV ) (Watch TV, A Key, App1 ) (App1, Guide Key, IPG App ) (IPG App, A Key, App2 ) (App2, Exit Key, REBOOT! )
This depicts a sample transition sequence that culminates in failure. All sequences are as-sumed to start in the initial state (e.g., “Power Off”) and end in the final, failure state (e.g., “REBOOT!”).
STEP 2 - IF-THEN Rules & Certainty Factors
Next, a set of simple IF-THEN rules is de-fined that, when applied to a sequence of fi-
nite state transitions, will assign a numerical value to all transitions that estimates the like-lihood of that transition is plays a part in an inter-application failure. For example, using the finite state model of Table 1, one sample rule might be:
IF (transition doesn’t appear in a sequence) THEN likelihood is -0.8.
Notice that the state transition:
(PowerOff, Pwr Key, Watch TV)
appears in the testing sequence above. Thus, the sample rule above would not apply to that transition for that sequence. However, the transition:
(App3, Exit Key, Watch TV)
is not found in the test data sequence, and therefore it is highly unlikely that the transi-tion is involved in the failure. This reasoning is quantified and represented by the likelihood value of -0.8 in the sample rule.
A collection of IF-THEN rules defines a simple form of Artificial Intelligence expert system, a programming paradigm that is par-ticularly adept at encoding and applying im-precise expert knowledge about a very narrow topic [1,3]. In this case, the rules assess the likelihood that the transitions found in testing sequences play a part in software failures. Most real world expert systems contain hun-dreds or thousands of rules, and require spe-cialized software language support. However, the expert systems defined in this paper are quite simple, containing only a handful of simple rules, and are easily implemented by conventional programming languages.
Similarly, the “likelihood” numeric values in rules are actually certainty factors (CF), a mechanism for quantifying uncertainty [1,3,5]. Unlike probabilities, which are often difficult to apply to real world situations, cer-
Pwr Key A Key B Key Exit Key Guide KeyPower Off Watch TVWatch TV Power Off App1 IPG AppIPG App Power Off App2 App3 Watch TV Watch TV
App1 Power Off Watch TV IPG AppApp2 Power Off Watch TV IPG AppApp3 Power Off Watch TV IPG App
REBOOT! Power Off
User EventsModel States
Table 1. Simple finite state model for Example 1
App 3
WatchTV
Power Off
Guide(IPG)
App 1App 2
Power Key
ExitKey
GuideKey
GuideKey
BKey
GuideKey
AKey
ExitKey
ExitKey
GuideKey
AKey
ExitKey
Figure 1. Graph of finite state model of Example 1

tainty factors are quite easy to implement. In addition, certainty factors can also quantify a lack of knowledge, which probability values cannot. Certainty factors are real numbers ranging between -1.0, meaning total disbelief in a conclusion, to +1.0, which denotes total belief. Any value in between denotes some measure of uncertainty. For example, a cer-tainty factor of +0.5 means the corresponding conclusion is probably true, while a certainty factor of –0.9 means it is almost certainly not true. A certainty factor of 0.0 denotes no knowledge either way (i.e., unknown) and is used to initialize all CFs.
To combine two certainty factors CF1 and CF2, that are derived for the same transition by two different rules, we use the following formula [1,5]:
CF1 ⊕ CF2 = CF1 + CF2* (1 – CF2) if both are positive = CF1 + CF2* (1 + CF2) if both negative = CF1 +CF2
1−min(CF1 , CF2 ) otherwise.
One important reason for choosing cer-tainty factors to represent potentially inconsis-tent test data is that certainty factors are both commutative and asymptotic [1,3,5]. The for-mer means that it does not matter in what or-der we combine certainty factors, the same result is obtained. This implies that it does not matter what in order our rules are applied, which greatly simplifies implementation. The asymptotic property implies that as new evi-dence is found to support (or discredit) a con-clusion, we increase (decrease) the CF value incrementally. Fore example, if two distinct rules both generate a strong belief in a given transition (e.g., 0.7 and 0.8) we will tend to believe somewhat more strongly (e.g., 0.7+0.8*[1–0.7] = 0.94). The asymptotic property also keeps certainty factors nicely between -1.0 and +1.0.
Some of the rules that have been most use-ful to date appear to be generally applicable to
almost any type of failure. Two of the most important are:
RULE 1: IF (s1,e,s2) does not appear in a sequence THEN CF(s1,e,s2) = CF(s1,e,s2) ⊕ -0.9
RULE 2: IF a test sequence enters a state si N times THEN ∀j | (sj,e,si) is in the sequence CF(s1,e,s2) = CF (s1,e,s2) ⊕ (+0.2 / N)
Because we are only interested in transi-tion sequences that end in failure, and we as-sume that the number of inter-application problems is small, it is logical to assume that a transition that appears in the test data may be related to that failure. Unfortunately, this deduction doesn’t help much, because many transitions that are not related to the failure may also be in the test data sequences. How-ever, by reversing that same logic, a transition that does not appear in the test data is most likely not related to the failure. This is codi-fied in RULE 1, where the “most likely not related” translates into a CF of -0.9.
RULE 2 is based on the supposition that a state that appears many times in a test data sequence that ends in failure has more oppor-tunities to cause problems. A small CF value (i.e., +0.2) is thus distributed amongst the transitions in the test data that exit from the suspect state.
Other rules are more effective for certain types of failures. Multiple, different sets of rules may be applied to the same test data se-quences to deduce different types of errors. Consider RULE 3, which is effective when one application is suspected of starving an-other of a computational resource (e.g., a memory leak).

RULE 3: IF transition t appears in the test data THEN CF(t) = CF(t) ⊕ (+0.5 * (1 - P(t))
In this rule, P(t) denotes the probability esti-mate any random transition will be t. While a true probability value would be difficult to calculate, an acceptable estimate can be de-rived easily as follows:
Let t = (s1, e, s2). Let Tfsm be the number of non-empty transitions in the finite state model, and Ts1 be the number of transitions that lead to state s1. Finally, let Ts2 be the number of transitions that leave state s2. We then define P(t) as follows:
P(t) = Ts1
Tfsm *Ts2
Finally, consider RULE 4, which helps to de-duce the state in which an inter-application failure originates, even though the actual fail-ure may occur many transitions later.
RULE 4: IF transition t is one of the last N transitions in the test sequence THEN CF(t) = CF(t) ⊕ +0.5
This rule is predicated on the assumption that the detrimental situation precipitated by the first adversely interacting state is severe enough to produce a failure soon after. For example, if one digital cable TV application corrupts the video heap in a set-top-box, a crash will often occur the next time something changes on the screen.
STEP 3 - Gather Test Data
The next step is to gather test data in the form of state-event-state transition triples as defined in the finite state model. The actual testing may be performed at any time. Old testing results generated for other purposes
may also be converted to the necessary transi-tion triples, as long as the test data still repre-sents the current system and applications. It is understood that the initial model may be quite abstract and simplistic, and that many of the actual states and events exhibited by the sys-tem and applications are not represented by the model. But the test data must be modified to fit the model, removing extraneous transi-tions if necessary.
Ideally, no strict testing plan will be used to drive the sequence of user events that are input to the tested system. Rather, a random sequence of user input events is preferred. There are several reasons for this counterintuitive preference. First, a non-random test plan embodies an implicit bias toward one or more a priori results. While this is a good thing if the bias is in the right direction, test results would be useless if the bias is in the wrong direction; important state transitions might never be seen. Second, because the rules apply to a domain of uncertain data, and are statistical in nature, we suspect that many of the most effective rules work best with random test sequences. Finally, in some of the supplementary probability analyses performed on the test results, the mathematics require randomized test sequences.
Implicitly, all test sequences will begin in the start state. For all practical purposes only test sequences that end in a failure state are of interest. Because most failures are intermittent in nature, little useful information about fail-ures can be deduced from a sequence that does not fail.
STEP 4 - Apply Rules to Test Data
This step is a straightforward application of the rules from step 2 to the testing se-quences gathered in step 3. All certainty fac-tors are initialized to 0.0 before applying any

rules2. As rules are applied the certainty fac-tors associated with the various transitions of the finite state model (e.g., Table 1) are modi-fied accordingly. Once all rule processing is complete, two certainty factors should be computed for each state (e.g., s). The first combines the certainty factors for all transi-tions leaving state s for another different state. Similarly, the second certainty factor is a combination of the certainty factors of all transitions that are entering state s from other states. Ignore transitions from state s back to itself.
STEP 5 - Analyze the Results
This is a very interesting step, and at the time of this writing, we continue to find new and interesting results in the data produced by this process. However, several observations are generally applicable to all annotated finite state models:
(1) Positive CFs (e.g., ≥ +0.2) suggest that a transition is somehow associ-ated with a failure.
(2) Negative CFs (e.g., ≤ -0.2) suggest that a transition is not associated with a failure.
(3) Many transitions with positive CFs merely provide a path connecting the original source state of the failure to the state in which it fails. These states do not appear to contribute to the failure. Along such transition paths the transition CFs tend to increase. However, the corresponding entry and exit CFs of the states along this path tend to be nearly equal.
2 If substantial prior evidence exists to implicate one or more transitions, the initial certainty factors may be initialized accordingly. Regardless of the evidence small initial certainty factors are recom-mended.
(4) States that actually fail tend to have a high entry CF and a low exit CF, be-cause the likelihood of failure de-creases after passing through the state.
(5) Most importantly, states that are likely to be an original source of fail-ure, but seldom fail themselves, tend to have a much lower entry CF than exit CF, because the likelihood of failure increases after passing through the state. This type of result is often very hard to find using con-ventional testing techniques.
EXAMPLES
The examples in this section present results derived via the method presented above. The test data used has been generated by probabil-istic simulation software to simplify the prob-lem for purposes of example, while retaining the salient features of real world test data.
Example 1: Memory Leak
The test data generator was constructed to simu-late the system defined by the finite state model of Table 1 and Figure 1. Five applications of varying characteristics, including two system applications and three third-party applications were simulated. Each application had different memory usage patterns and requirements. Each exit from state “App2” to another state generated a small simulated memory leak of random size. The simulation was sensitive to both memory exhaustion and fragmentation, and would enter the “REBOOT!” state whenever insufficient memory was available for an application to func-tion.
Test data files containing 500, 1000, and 2000 legal transitions were generated by the simulation, each file containing a variable number of test sequences that end in failure states.

RULES 1, 2, and 3 were applied to these test files to annotate the states and transitions of the finite state model. Optimum results were obtained by the files containing 1000 transitions. Files with fewer transitions re-sulted in less clear distinctions between high and low CFs. Files with more than 1000 tran-sitions tended to wash out the CFs, so that all values were approximately +1.0 or -1.0, thus obliterating valuable information about rela-tive certainties.
The resulting annotated finite state model appears below in Table 2. Entry and exit CFs for the states are shown in Table 3.
Notice that the high CFs associated with transitions out of state “App2” (i.e., +0.98) indicate that this state is almost certainly re-lated to the failure. The “Watch TV” and “IPG App” states also have several substantial CFs associated with transitions. These transi-tions tend to be on the path from state “App2” to the actual failure transition. Because fail-ures happen in a variety of states and transi-
tions, CF values are distributed amongst the transitions on the paths from “App2” to the failing states. Additional evidence pointing at state “App2” as the source of the failure are the entry and exit CF values for that state. No-tice that the entry CF is significantly less than the exit CF. From this evidence we conclude that the memory leak originates in “App2”.
Additional simulations were generated that assigned the memory leak to random applica-tions to remove any experimental bias. The results were similar, clearly pointing to the offending state in each case.
Example 2: Adverse Interaction
Another test data generator was con-structed to simulate the system defined by the finite state model of Table 4, below. In this example, we expand the finite state model from Table 1 to add additional sub-states and transitions within the previous “App1” state. The simulation then generated random fail-ures with a 25% chance whenever state “App1.2” was entered sometime after exiting from state “App3”. In other words, the system simulates an inter-application failure with the source of the failure in “App3”, but the actual failure occurring eventually in “App1.2”.
Test data files containing 1000 valid transi-tions were generated by the simulation. Each file contained many actual test sequences end-ing in a failure state.
CF(s, e)Pwr Key A Key B Key
Exit Key
Guide Key
Power Off 0.000 N/A N/A N/A N/AWatch TV 0.000 0.766 N/A N/A 0.649IPG App 0.000 0.734 0.175 -0.604 -0.932
App1 0.000 -0.998 -0.982 -0.899 -0.980App2 0.000 N/A N/A 0.984 0.977App3 0.000 N/A N/A -0.934 -0.964
REBOOT! 0.000 N/A N/A N/A N/A
Table 2. Transition CFs for Memory Leak
CF(s) CF(s) ENTRY
CF(s) EXIT
Power Off 0.000 0.000Watch TV -0.999 0.917IPG App -0.999 -0.878
App1 -0.998 -0.998App2 0.734 0.998App3 0.175 -0.996
REBOOT! 0.000 0.000
Table 3. State entry and exit CFs
Pwr Key A Key B Key Exit Key Guide KeyPower Off Watch TVWatch TV Power Off App1.1 IPG AppIPG App Power Off App2 App3 Watch TV Watch TVApp1.1 Power Off App1.2 App1.4 Watch TV IPG AppApp1.2 Power Off App1.3 App1.1 Watch TV IPG AppApp1.3 Power Off App1.4 App1.2 Watch TV IPG AppApp1.4 Power Off App1.1 App1.3 Watch TV IPG AppApp2 Power Off Watch TV IPG AppApp3 Power Off Watch TV IPG App
REBOOT! Power Off
User EventsModel States
Table 4. Simple finite state model for Example 2

RULES 1, 2, and 4 as defined above were applied to this test files to annotate the states and transitions of the finite state model.
The resulting annotated finite state model ap-pears below in Table 5. Entry and exit CFs for the states are shown in Table 6.
Again, notice the higher CF values in tran-sitions for state “App3” the disparity between entry and exit CFs for this state. This evi-dence again correctly suggests that state “App3” is the original source of the inter-application failure.
CONCLUSION
Digital cable TV systems, and other simi-larly large, distributed computing systems present unique difficulties for application vendors and system operators. Time and re-sources for inter-application testing is often severely limited, even though the hardware and software resource constraints within these computing environments make them suscepti-ble to inter-application interactions and fail-ures [4]. We present a new method that ap-plies two simple techniques from the field of Artificial Intelligence to the problem. Rather than generating large complex test plans and lengthy testing programs, the sometimes in-consistent results from a relatively small quantity of randomly generated tests produces sufficient information for a small A.I. expert system to deduce various points of failure. In particular, we have demonstrated how the of-ten asymptomatic sources of inter-application failures can be deduced.
This method has been applied to a real world case in the digital cable TV industry, and has successfully discovered a previously unknown memory leak in another vendor’s application, and also identified an operating system anomaly that can cause exhaustion of video memory and a subsequent system crash.
CONTACT INFORMATION
Dr. Louis Slothouber Chief Scientist, BIAP Systems, Inc., www.biap.com [email protected]
CF(s, e) Pwr Key A Key B Key
Exit Key
Guide Key
Power Off 0.000 N/A N/A N/A N/A
Watch TV 0.967 0.151 N/A N/A 0.998IPG App 0.000 -0.220 0.179 -0.220 0.999App1.1 0.000 0.999 0.924 -0.166 0.040App1.2 0.000 0.998 0.147 -0.083 -0.083App1.3 0.000 -0.089 0.724 -0.111 -0.543App1.4 0.000 0.398 0.998 -0.468 -0.169App2 0.000 N/A N/A -0.104 0.106App3 0.000 N/A N/A 0.529 0.266
REBOOT! 0.000 N/A N/A N/A N/A
Table 5. Transition CFs for Memory Leak
CF(s) CF(s) ENTRY
CF(s) EXIT
Power Off 0.000 0.000Watch TV 0.999 0.998IPG App 0.998 0.999App1.1 0.563 0.999App1.2 0.999 0.998App1.3 0.998 0.254App1.4 0.916 0.998App2 -0.220 0.001App3 0.179 0.654
REBOOT! 0.000 0.000
Table 6. State entry and exit CFs

REFERENCES
1. Durkin, J., Expert Systems: Design and Development, Macmillan Publish-ing Company, New York, NY, 1994.
2. Hopcroft, J.E., and J.D. Ullman, In-troduction to Automata Theory, Lan-guages, and Computation, Addison-Wesley, 1979.
3. Rich, E., and K. Knight, Artificial In-telligence --2nd ed., pp. 231-239, McGraw-Hill, Inc., 1991.
4. Schulmeyer, G.G., and McManus, J.I., Handbook of Software Quality Assur-ance --2nd ed., Van Nostrand Reinhold Publishing, 1992.
5. Shortliffe, E.H., and B.G. Buchannan, A Model of Inexact Reasoning in Medicine, Mathematical Biosciences, vol. 23, pp. 351-379, 1975.

CAPACITY PLANNING FOR CABLE HIGH-SPEED DATA SERVICES✝ K. R. Krishnan, Martin Eiger, Arnie Neidhardt, and Tamra Carpenter
Telcordia Technologies, New Jersey
✝ Copyright 2004 Telcordia Technologies, Inc. All rights reserved.
Abstract
The engineering of cable networks for IP-based voice and data services presents new planning challenges to cable operators. Unlike the broadcast video services for which cable networks have traditionally been designed, the traffic of these new services is directed to individual subscribers. We describe algorithms for estimating capacity requirements to support IP-based services at acceptable levels of QoS as well as the traffic models on which they are based. The algorithms account for the efficiencies realized from the statistical multiplexing of independent traffic streams of different subscribers. We provide examples of their use in investigating various "what-if" scenarios. By combining the capacity estimation algorithms with methods for deriving the parameters of the traffic models from network measurements, one could create a monitoring and planning system for provisioning IP services on cable networks.
INTRODUCTION
The engineering of cable networks for IP-based voice and data services, as defined in CableLabs PacketCableTM and DOCSIS specifications, presents new planning challenges to cable operators, since the traffic of these new services is directed to individual subscribers, unlike the broadcast video services in traditional cable networks. To be successful in offering these IP services to subscribers,
cable operators need a new set of algorithms to determine the capacity requirements for providing acceptable levels of QoS for the services [1,2]. In this paper, we describe capacity-estimation algorithms for IP services and the traffic models on which they are based. The traffic models offer a mathematical description of the traffic of the IP services, and the capacity-estimation algorithms determine resource requirements, at various points in the network, to support traffic loads at specified QoS levels. The algorithms account for the efficiencies that are realized from the statistical multiplexing of independent traffic streams of different subscribers for each service (multiplexing the streams of heterogeneous services is fraught with problems, as pointed out later, and is not attempted). We show by means of examples the use of the algorithms for investigating various "what-if" scenarios, including the trade-off between QoS guarantees and network resource requirements, and the projection of network capacity requirements for various scenarios of demand growth.
The services considered in this paper are Voice-over-IP and High-Speed Data. We present mathematical models for the traffic streams of these two services and determine the bandwidth requirements (in the upstream and downstream directions) at various points in the network to meet specified levels of QoS. The mathematical models characterize the random

fluctuations of traffic rates in typical sessions of each service, and enable us to determine the capacity requirements as a function of traffic loads and QoS specifications. This capability lends itself for use in a “what-if” tool to answer various questions, e.g., what QoS levels that can be supported on the existing network, where would capacity augmentation be required, either for the current demand or forecast demand.
We consider the application of our algorithms to two examples. The first example shows the trade-off between capacity requirements and QoS constraints. In the second, we consider the evolution of demands over a 5-year horizon and show the capacity savings achieved by the proposed algorithms, which account for multiplexing efficiency, in comparison with linear extrapolations that fail to account for the multiplexing gain. In principle, the parameters of the mathematical models of traffic can be estimated from traffic measurements that are collected at a fine enough time-resolution. However, such detailed measurements may not always be practical or economical in all networks. If the model parameters can be estimated from the routine operational traffic measurements in a network, then the capacity-estimation algorithms could become part of an integrated monitoring and planning system. Such a system will enable a network operator to plan and install new capacity before existing capacity runs out. The integration of parameter-estimation methods with capacity-estimation algorithms is a subject for future studies.
NETWORK ARCHITECTURE
The architecture of a cable network is designed for the efficient distribution of broadcast television services. Figure 1 shows the typical two-level hierarchical structure of cable networks. For broadcast television, the signal feeds enter the network at the head-end, from which the traffic is transported over a high-speed backbone ring to various distribution hubs (each of which is the site of one or more Cable Modem Termination Systems (CMTSs)). Each hub sends the traffic to each of its subtending fiber nodes, which then distribute the signals to individual homes over coaxial distribution networks.
Figure 1: Architecture of Hybrid Fiber Coax (HFC) Cable Network
FN1 FN3FN2
Head-End Ring
Hub Hub
Hub
Head-End
Hub

The introduction of IP-based voice, data, and video services over this architecture raises new issues for consideration:
a) Since the traffic for these services is dedicated to individual subscribers, this portion of the system’s requirements for bandwidth is determined by the number of subscribers served and their traffic demands.
b) The routing of downstream traffic to the right subscribers is more complicated than in traditional broadcast television networks that offer tiered packages of video channels.
c) The routing of upstream traffic from subscribers on a shared medium is a new problem that is absent in traditional broadcast television networks (although some cable systems carry upstream traffic in support of pay-per-view video services). IP-based services are accommodated within the distribution network by dedicating some bandwidth spectrum for digital traffic. Typically, the upstream traffic occupies the spectrum from about 5 MHz to 42 MHz [3-4], while one, or possibly two, 6 MHz channels at higher frequencies are set aside for downstream digital traffic. At the distribution hub, analogue and digital traffic are combined in the downstream direction and separated in the upstream direction. Within the backbone network, analogue and digital traffic are carried on separate facilities. For the digital traffic of the IP-based services, each CMTS is a point of aggregation for the traffic of all the subscribers served by it, while the backbone ring aggregates the traffic of all the CMTSs at the various hubs. Designing
a cable network to support IP-based services requires that the traditional method of designing for signal integrity within a certain bandwidth range must be combined with a method for ensuring that the bandwidth at distribution hubs and on the backbone ring is sufficient to handle traffic loads and deliver a given set of services at desired levels of performance. We now turn to the methods for estimating these capacity requirements.
CAPACITY DESIGN
Load Estimation
The load of a service at a CMTS at a hub can be determined in two steps: In the first step, we estimate the average number of simultaneously active users for the service in the cluster of subscribers served by the fiber node or nodes associated with the CMTS. Typically, we consider the load during the network busy hour for the service. Given the number of homes served by the CMTS, the penetration of the various IP services for that cluster of homes, and the activity level for a typical subscriber for each service, we can determine the average number of simultaneous users. In the second step, we combine this estimate of the number of simultaneous traffic streams with information about the shape or intrinsic characteristics of the typical traffic stream generated by a user of that service, to determine the aggregated traffic of the service passing through the CMTS, in each direction, in the busy hour. Similarly, the aggregation of the traffic streams of all hubs gives us the aggregate traffic of the service on the backbone ring.

Capacity Calculation
For each service, the bandwidth requirements at the hubs and on the ring are determined on the basis of the required levels of QoS and the aggregated traffic at the corresponding points in the network, thereby taking advantage of the efficiency of capacity utilization arising from the statistical multiplexing (superposition) of the individual traffic streams. The algorithms for these calculations of bandwidth requirements are presented below for the two services considered in this paper: Voice-over-IP (VoIP) and Data. The traffic aggregation, however, is considered only for traffic streams of the same service and same levels of QoS, i.e., we multiplex only within each class of traffic, and not across traffic classes, because the multiplexing of streams of different characteristics and QoS requirements may offer no benefits, and, in fact, might require additional control mechanisms to ensure that each class of traffic receives its proper QoS. Therefore, we adopt the conservative rule of merely adding the separate bandwidth requirements of each class of traffic to arrive at the requirements of the combined traffic of heterogeneous streams.
IP SERVICES
We now present the traffic models, QoS parameters, and capacity calculations for Voice-over-IP and Data. The model and QoS parameters for these two services, together with some representative default values, are summarized in Table 1.
Voice-over-IP
a) Traffic Model
For the traffic produced by a single Voice-over-IP call, we use an ON-OFF model for the traffic rate, with the rate alternating between a constant peak value during ON-intervals (which correspond to talk spurts), and zero during OFF-intervals (which correspond to intervals of silence). The peak rate resulting from the standard digitizing of voice-samples at the Nyquist rate is 64 kb/s, and is then subject to modification by the coding rate, and by the overhead involved in forming IP packets from segments of talk spurts. The ON and OFF intervals are treated as random variables of exponential distribution. Thus, the parameters characterizing this model for Voice-over-IP traffic are:
ch
R
P
chR
off
on
+=
=
=
=
=
=
=
=
ratepeak payload-packet IP as collectedsegment spurt - talk ofduration
policy" gpacketizin" packet IPan ofheader oflength
rate coding
periodsilent a ofduration mean
spurt talk a ofduration mean
τ
τ
The first two parameters, onτ and offτ ,
pertain to the characteristics of voice traffic, for which extensive experimental studies have produced typical default values that can be used in the absence of user input. The coding rate R and the coding policy c (which affect customer-

perceived quality of voice-connections) are parameters of the coder, and thus assumed known. The header length h pertains to the IP protocol that is implemented.
b) QoS parameters
For VoIP, the QoS parameters are packet-loss rate and delay-jitter. In addition, since VoIP is a real-time connection-based service, subject to blocking if the network cannot meet the packet-level QoS constraints, the probability of such blocking becomes an additional, connection-level QoS constraint.
c) Load Calculations
Consider the calculations for homes (customers) subtending a given CMTS. We want to know the total offered load A in Erlangs due to these customers in the busy hour. Let C be the number of customers, and let θ be the penetration factor for the Voice-over-IP service. Then, θC is the number of subscribers to this service. If u is the utilization factor for a typical subscriber, i.e., the fraction of time during the busy-hour that a typical subscriber would spend on voice-calls if the subscriber suffered no blocking, then the offered load per subscriber is u Erlangs. Then, the total offered load equals uCA θ= Erlangs, which can also be viewed as the average number of simultaneous calls that would be in progress during the busy-hour, if there were no blocking. We assume that there is admission control for voice calls (i.e., a new call attempt would be blocked if sufficient bandwidth cannot be provided to it), and that the probability of a call attempt being blocked should not exceed a specified valueb . To meet the blocking criterion for the offered load A , the minimum number
of simultaneous calls that must be supported at the CMTS is the smallest integer N for which bANB ≤),( , where ),( ANB is the Erlang-B blocking function [5]. This is the number of calls for which the VoIP traffic model above would be used to determine the required bandwidth at a CMTS, for specified QoS constraints on packet loss, delay, and jitter.
d) Bandwidth Calculations
As an example of bandwidth calculations using the VoIP model, we present below the formula [6] for the bandwidth L required for supporting N simultaneous calls at a loss rate of r , given a buffer of size B . Define
+=
rBP
offon
offon 1ln)( ττ
ττφ ;
Pfm
foffon
on
=
+=
τττ
Then, ],[ 21 LLMinL = , where
( )
+−+−=
φφφφ
2411 2
1f
NPL
[ ] )()2ln(ln22 mPNmrNmL −−−+= π
Corresponding expressions can be derived for the bandwidth required to meet jitter constraints (often, the jitter constraint is treated as a bound on the maximum delay, experienced when the buffer allocated to the service is full). The maximum of the bandwidths determined by the loss and jitter constraints is then the bandwidth required to meet all the QoS constraints.

Data
a) Traffic Model
In pioneering studies at Telcordia Technologies, high-speed data traffic was shown to be characterized by burstiness over many time scales, a phenomenon known as "long-range dependence" [7-9]. A fluid model known as Fractional Brownian Motion (FBM) [6] was shown to be capable of representing the aggregated traffic of a large number of independent streams, such as those generated by users downloading files from the World Wide Web. The FBM model is a Gaussian model with stationary increments, and is specified by the parameters ),,( Ham , where
15.0 with parameter,Hurst parameter peakedness
rate arrival ficmean traf
≤≤=
=
=
HHam
The peakedness parameter a describes the variance of the fluctuations in traffic rate at the time scale used in the model description, and H characterizes the persistence of correlation in traffic rates with time lag, i.e., is a measure of long-range dependence, with 5.0=H corresponding to short-range dependence and 5.0>H corresponding to long-range dependence. It can be shown that the multiplexing of n independent FBM sources, each described by ),,( Ham , gives rise to the FBM process ),,( Hanm .
b) QoS parameters For data sessions, we assume that there is no admission control, and hence no blocking constraint to be considered. The QoS parameters are, therefore, packet loss rate and mean delay.
c) Load Calculations
The demand will be specified in terms of the requirements of the aggregate data stream that has to be supported. Then, just as in the case of voice calls, we arrive at
uCA θ= as the average number of simultaneous data sessions in progress, where the penetration and utilization factors now pertain to data service. If the traffic of a single session is described by the FBM process ),,( Ham , the aggregate traffic of A simultaneous and independent sessions is given by ),,( HaAm .
d) Bandwidth Calculations
As an example of bandwidth calculations with the FBM model, we present below the formula that determines the mean delay d when FBM traffic
),,( Ham is offered to a link of bandwidth L [6]:
+Γ=
−
θ
θ 11
1
LKd ,
where
function Gamma theis( and
,)1(2
)(),1(2 2)1(2
2
z) ΓHHam
mLKH HH
H
−−−
=−=θ
We can invert the formula to determine the bandwidth L required to achieve a given mean delay d by doing a binary search for L .
EXAMPLES
a) QoS and Capacity Requirements
This example illustrates how the capacity-estimation algorithms can be used as a “what-if” tool to determine the effect

of the QoS levels specified for the Voice-over-IP and Data services on the capacity requirements. Network We consider a symmetric network of 4 hubs, each with one CMTS. At each CMTS, the upstream traffic has a channel of bandwidth 2.2 Mb/s, with a buffer of 300 kbits, and the downstream traffic has a channel of bandwidth 27 Mb/s with a buffer of 3 Mbits. The bidirectional ring has a bandwidth of 24 Gb/s, with a buffer of 3 Mbits. Load
At each CMTS:
VoIP = 30 erlangs
Upstream data rate = 0.5 Mb/s
Downstream data rate = 0.5 Mb/s
The parameters for the traffic models for VoIP and data are taken to be those given in Table 1.
QoS We first consider the following choice of QoS parameters (QoS-1):
VoIP: Connection blocking = 0.1%
Maximum delay = 10 msec
Bit-loss rate = 5%
Data: Average delay = 50 msec
Bit-loss rate = 1%
For the loads assumed, the bandwidth required at each CMTS to support VoIP is 1.4 Mb/s, while the bandwidth required for the upstream data (which turns out to be
the bottleneck here) is 0.856 Mb/s. Thus, the total bandwidth needed for the upstream channel is 2.256 Mb/s, which exceeds the available upstream channel bandwidth of 2.2 Mb/s. Thus the network cannot support the services at the performance levels in QoS-1. We next consider the following set of less stringent QoS parameters (QoS-2):
VoIP: Connection blocking = 1.0%
Maximum delay = 10 msec
Bit-loss rate = 10%
Data: Average delay = 100 msec
Bit-loss rate = 5%
The bandwidth for VoIP is now 1.2 Mb/s, while that for the upstream data is 0.777 Mb/s, for a total bandwidth requirement on the upstream channel of 1.977 Mb/s, which is smaller than the given channel bandwidth of 2.2 Mb/s. Thus, the existing network can support the two services at the performance levels in QoS-2.
b) Multi-Year Capacity Planning
This scenario deals with capacity planning over a 5-year horizon, under a given forecast of load evolution, and shows the benefit of taking account of the statistical multiplexing that occurs in aggregating the traffic streams of different subscribers for the same service. The network is the same as in the previous example, and the forecast 5-year load evolution is given below in Table 2, along with the results of calculation for the total

upstream bandwidth at each CMTS, using the performance levels specified in QoS-1 above. Once again, the bottleneck is the upstream channel bandwidth, which remains adequate to support the loads for the chosen QoS parameters in Years 1-4, but becomes inadequate in Year 5, according to the results of the capacity-estimation algorithms appearing in Row 3 of Table 2. Suppose, on the other hand, that one merely looked at the loads and bandwidth requirements in Year 1, and estimated the bandwidth requirements in the future years by linear extrapolation of the bandwidth requirements in Year 1. The results of such extrapolation (Row 5 of Table 2) would lead one to the false conclusion that the network runs out of capacity even for Year 3. The comparison of bandwidth requirements determined by the capacity-estimation algorithms with those calculated by linear extrapolation shows that the penalty in failing to exploit multiplexing gain increases with increasing load. So, this scenario demonstrates the potential benefit of the algorithms in deferred capital investments, by the explicit accounting for multiplexing gain in calculating capacity requirements.
CONCLUSIONS AND FUTURE WORK
The engineering of cable networks for IP-based voice and data services presents new planning challenges to cable operators. The traffic of these new services is directed to individual subscribers, unlike the broadcast video services for which cable networks have traditionally been designed. To be successful in offering these IP services to subscribers, the network must have sufficient capacity to
provide acceptable levels of QoS. There is a need for a new set of algorithms for planning and provisioning new IP services on cable networks. In this paper, we have described traffic models and algorithms for estimating capacity requirements to support IP services at specified levels of QoS. We model the digital portion of the cable network in terms of resources and their capacities, along with mathematical models that capture the characteristics of the traffic of the IP-based services that these resources must accommodate. The capacity-estimation algorithms determine resource requirements at various points in the network to support traffic loads at specified QoS levels. Where sufficient resources are present, they are partitioned among the different types of traffic. Locations with insufficient resources are identified and the shortfall is determined. The capacity-estimation algorithms can be used for investigating a wide variety of "what-if" scenarios, including the trade-off between QoS guarantees and network resource requirements, as shown in the examples that we consider. The capacity estimation algorithms account for the efficiencies that are realized from the statistical multiplexing of traffic streams of different subscribers for the same service. By considering a scenario of multi-year evolution of subscriber demands, we demonstrate the capacity savings achieved by the multiplexing efficiency built into our algorithms, in comparison with the approach of linear extrapolation of capacity requirement in the number of subscribers, which could lead to gross overestimation of capacity requirements. More accurate estimates will lead to better strategic decisions on when, where, and how to offer new services.

For mathematical models of traffic to be useful, one must be able to determine proper values for their parameters, to obtain a reasonable fit to the traffic being described. In principle, the model parameters can be estimated from traffic measurements collected at a fine enough time-resolution. However, such detailed measurements may not always be practical or economical in all networks. If the model parameters can be estimated from the routine operational traffic measurements in a network, then one could derive the inputs to the capacity-estimation algorithms from traffic measurements and load projections, creating an integrated monitoring and planning system. Such a system will enable a network operator to plan and install new capacity before existing capacity runs out. The integration of parameter-estimation methods with capacity-estimation algorithms is a subject for future studies. It would also be desirable to expand the system to propose remediation when it finds that demand exceeds network capacity. We envision optimization algorithms that will propose ways that cable operators might add network capacity at minimal cost, determining appropriate QoS parameters for viable Service Level Agreements, and implementing controls to meet them. We also have to investigate whether other services such as Streaming Video, Video-on-Demand, and Video Games can be represented in terms of existing traffic models or will require the construction of new models and corresponding capacity-estimation algorithms.
REFERENCES
[1] P. Bates, T. Carpenter, Y. Chandramouli, J. DesMarais, M. Eiger, K. R. Krishnan, and A. L. Neidhardt, “Planning and Provisioning for Cable Internet Services”, National Fiber Optic Engineers Conference, September 2002, Dallas, Texas.
[2] J. T. Chapman, “Multimedia Traffic Engineering for HFC Networks,” White Paper, CISCO Systems, 1999.
[3] Cable Datacom News, Overview of Cable Modem Technology and Services,http://www.cabledatacomnews.com/cmic/cmic1.html.
[4] W. Ciciora, J. Farmer, and D. Large, Modern Cable Television Technology, Morgan Kaufman Publishers, Inc., San Francisco CA, 1999.
[5] R. B. Cooper, Introduction to Queuing Theory, 2nd ed., New York: North Holland, 1981.
[6] K. R. Krishnan, A. L. Neidhardt, and Y. Chandramouli, “Traffic Models for Cable Network Services”, Telcordia Technologies, 2001.
[7] J. Beran, R. Sherman, M. Taqqu, and W. Willinger, “Long Range Dependence in Variable Bit-Rate Video Traffic,” IEEE/ACM Transactions on Networking, 43, pp. 1566-1579, 1995.
[8] M. Garrett and W. Willinger, “Analysis, Modeling and Generation of Self-similar Video Traffic,” Proc. ACM SIGCOMM, London, September 1994, pp. 269-280.
[9] W. Willinger, M. Taqqu, W. Leland, and D. V. Wilson, “Self-similarity in High-speed Packet Traffic: Analysis and Modeling of Ethernet Traffic Measurements,” Statistical Science, 10, pp. 67-85, 1995.

Table 1: Traffic Model and QoS Parameters (with reasonable default values)
Table 2: Five-Year Evolution of Loads and Capacity Requirements
Y1 Y2 Y3 Y4 Y5
VoIP Load (erlangs) 15 20 25 30 35
Upstream Data Rate (Mb/s) 0.25 0.30 0.35 0.40 0.45
Upstream Bandwidth Requirement (Mb/s)
1.415 1.664 1.948 2.113 2.385 (X)
Linear extrapolation from Y1 (Mb/s)
1.415 1.821 2.228 (X)
2.635 (X)
3.041 (X)
Overestimate in extrapolation 0% 9.5% 14.3% 24.7% 27.5%
Entries marked with an “X” exceed the upstream channel bandwidth of 2.2 Mb/s
1 Traffic shape and intensity are given independently for upstream and downstream traffic. The parameters should assume the same values in the two directions for symmetric services, such as voice. 2 Peakedness is measured in bits/sec2H–1, where H is the value of the Hurst parameter.
Voice-over-IP Data
QoS
• Jitter tolerance (0.01 sec)
• Loss tolerance (0.5%)
• Blocking tolerance (0.1%)
• Loss tolerance (1%)
• Average delay tolerance (0.05 sec)
Traffic Shape1
• Talk spurt (1.004 sec)
• Silence (1.587 sec)
• Packet header (416 bits)
• Analogue-to-digital coding rate (6.4 kb/s – 64 kb/s)
• Voice frame size (0.010 – 0.030 sec)
• Peakedness2 (61000 bits/sec2H–1)
• Hurst parameter (0.85)
Intensity1 • Erlangs • Bits/second

CONTENT SUPPLIER’S PERSPECTIVE: HOME NETWORKS AND RIGHTS MANAGEMENT
Robert M. Zitter, Craig D. Cuttner
Home Box Office
Abstract Copyright Protection, Digital Rights Management, Home Networks and other buzzwords are all swirling around in a frenzy that has seemingly pitted content providers against operators and all seem to make consumers appear to be felons. This paper defines the scope of the issue and discusses the pro- and con-attributes of a Home Network. Beginning in the first-steps of initial implementation of “simple” Copy Control Information (CCI) and how that may evolve into sophisticated Digital Rights Management (DRM) systems.
BACKGROUND Content Value and Cable Value The ‘sale’ of access to video content has been a hallmark of the cable television industry since its inception. Technology used in the distribution, securing the distribution and the content itself has evolved over time as has the value of the content being distributed. Cable, and other forms of multichannel distribution (MVPDs), are actually the ‘tip of the iceberg’ related to a multi-faceted time-value food-chain that impacts all aspects of content. Time-value of content and distribution are not new concepts. Hard cover books become mass-market paperbacks and later motion pictures. Theatrical movies have
subsequent distribution windows such as home video, pay-per-view, etc. – each window and its attendant revenue stream is critical to the total revenue stream that makes theatrical movie production a viable ongoing business.
If video programs are available on the Internet at no charge, once the Internet is connected to a digital home network, consumers will be less likely to pay for the services MVPDs offer. Distribution Security Over time, cable distribution technology has evolved to thwart the capabilities of the “consuming public” to circumvent the collection of fees and protect revenues. Non-standard channel (“mid-band” placement for pay channel security in the ‘70s) was succeeded by block converter devices and, later, by the cable-ready TV, which necessitated trapping. Higher value premium TV led to channel scrambling and fixed (programmed) descrambling STB’s. Pay per view required addressability – and the consumer’s ability to record high-value content led to analog copy control (a/k/a Macrovision). Each of these steps was necessitated by an evolutionary requirement to continue to collect revenue to keep growing the cable and content industries. Likewise, the “robustness” of systems was driven to sophistication requirements by the day’s environment. Security evolved from virtually-none (since early TVs did not

generally tune RF non-standard channels), compromised by simple “orange wires” in set-top-boxes, to sync-suppression scrambling – and, in fact, it was not always clear that the consumer electronics products were designed to respect the necessity of cable security – early versions of digital-chassis analog television receivers were able to defeat very sophisticated sync-suppression scrambling. Although there were limited cases of “redistribution” of video programming (e.g. an apartment building with ‘channel-3 sharing’),. the physical audit capabilities of the cable operator, and simple physical limitations of single-premium-channel distribution, were adequate limits on the spreading of content redistribution.
TODAY’S LANDSCAPE Building on the premise that the “on/off” nature of conditional access (traps, addressability, or other forms of access denial) was appropriate to the consumer’s then-current abilities to circumvent those systems. Further building on the ability to use simple analog Macrovision as an appropriate means to prevent analog VCR copies in the PPV window – where does that leave us today? Digital cable-ready receivers will soon be able to be directly-attached to cable systems; digital VCR and DVD burning devices are growing in popularity, and the fastest-growing segment of the (IT) computer industry, the ‘Media Center PC’ – promotes a video program guide, Digital Video Recording and DVD-burning. Clearly, the next evolution in conditional access, content security – and potential new revenue streams are upon us.
Consumers increasingly want all of their home electronics products to integrate and provide a ‘greater good’ by using common control systems and making content available in different rooms, on different devices – including computers, portable devices, and, perhaps, vehicles. This need for integration means a network – and the “Home Network” connectivity promise soon available to consumers is both a potential revenue source for enhanced services, provisioning, management, and maintenance – and a threat to the distribution-revenue just as has occurred in decades past. The stakes today, unfortunately, are much higher. While a crude ‘channel-3 network’ might have provided a few like-minded apartment dwellers a single-channel of HBO in the 1970’s – one copy of a motion picture on the Internet has devastating impact on the revenue stream before, during and after the cable window. The impact will be more devastating now that the value of cable content has significantly increased – and more of that content is original-to- cable, as its first exhibition window. First Steps in Security – Basic Conditional Access The FCC and industry economics have dictated the first steps to continue the evolution of cable security – the one-way digital cable ready television is a reality. Using contemporary industry-standard digital encryption techniques, the CableCARD™ can take the best-of-breed conditional access systems deployed today and integrate it into a consumer-purchased host device. As required by the Digital

Millennium Copyright Act (DMCA), no consumer-accessible ‘in-the-clear’ streams are available courtesy of DFAST encryption. It is important to note that the current implication in the nature of consumer behavior is that “in the clear” is a direct tie to “distributed on the Internet” without recourse. It is the need to encrypt content securely to both maintain its value and retain legal protections under DMCA. CableCARD, however, is only the first-step evolution of an integrated TV / set top – and it alone does not provide functionality for the Home Network as consumers would deploy it. In a consumer environment, more connections than cable-to-host / display are envisioned. Modular components (set top to plasma display; recorder to display; media storage to display) begin to form the basis of a series of output to input links – all digital – hence all needing some form of copyright protection to prevent ‘unprotected copying and redistribution.’ Each type of interface has a defined and approved copy protection system and is a overall part of the ‘Plug-and Play Agreement’ tied to a set of principles and rules that govern access to and use of cryptographic keys that control system behavior. Second Step – (Protected Interfaces)
As secure digital interfaces require
copyright protection regimes, there are systems appropriate to the major interfaces:
1. The CableCARD itself – although
not intended for consumer access, the pins of the card interface could be intercepted during their transport of high-value content – thus, the DFAST encryption system is
used to ensure that the host device properly adheres to the PHILA principles.
2. Compressed Firewire (1394) – the ‘5C’ (DTCP) copy protection regime is specifically tailored for high-speed compressed applications.
3. Uncompressed DVI (also HDMI) – the ‘HDCP’ copy protection regime is specifically tailored for uncompressed digital signals such as might be transported between a host device and display device.
These copyright protection systems
protect, generally, a source-to-sink relationship and convey only ‘basic’ copy control states. (Generally, signals in this context, originate in a “source” device and are consumed in a “sink” device. A set top is an example of a source, a TV display is a sink.)
The ability to separately enable and
disable items 2 and 3 (above), is referred to as “selectable output control” which was a point of considerable discussion during the Plug and Play negotiation.
Second Step – (Unprotected Interfaces)
Analog video, in many contemporary
consumer devices today, is routinely converted from analog to digital in a very high-quality manner. Once that conversion has occurred, all of the concerns about copyright protection, Internet redistribution, etc. equally apply to the converted signal. This is the so-called “Analog Hole.”
NTSC composite analog video is
“protected” only to the extent that Macrovision may be applied as a part of the ‘copy never’ state. CGMS-A may also be present to signal other copy control states, but may be removed by some consumer

devices, thus it is not, by itself, sufficient for authoritative signaling. Further, the “low-quality” nature of NTSC limits the quality of copies that may be made from either the original analog or digital copies thereof.
Component analog video interfaces are
higher quality than NTSC, and can support very-high quality signals up to high-definition. Considering the weaknesses of CGMS-A noted above, and the fact that only certain resolutions and formats of component analog support a vertical blanking interval for carriage of copyright control information, there are concerns about very high-quality analog to digital conversions of component analog. When component interfaces are “unprotected” some content owners necessitate lowering the picture resolution to that of NTSC, so that analog to digital conversion is less effective – thus called “down-resolution” – which is also a point of discussion in the two-way negotiations.
Copy protection states are discussed
more fully below.
FUTURE NETWORK FEATURES
Third Step – Protected Home Network How do we evolve the current secure and
revenue-generating MVPD distribution infrastructure into a similarly secure (often called “trusted”) part of the content distribution infrastructure? Considering that it is a forgone conclusion that consumer home networks will exist, this is an important task at hand – as will be discussed for the remainder of this paper.
Home Network Topology
Secure Video
Home Network
“The Internet”
TV Display
DVR
There are two other “competitors” that currently are working to be the key providers of that home network:
1. Consumer Electronics (CE)
manufacturers that look at device connectivity as an extension of their devices’ functionality – and hope to leverage that product benefit into their offerings;
2. Information Technology (IT) manufacturers, recently growing into the traditional CE space by selling entertainment hardware, have looked at home networking as an extension of their data infrastructure – and the increased functionality is also a point of desired benefit.
3. Of course, it is desired that the MVPD be included in this list – as a very key provider with decades of expertise in the transport of high-value content – and a key participant in the revenue chain that benefits from the secure transport of content.
Currently, neither of these two non-cable
potential home network providers are involved in the revenue stream nor the protection of the time-value of the content in the food chain.

Although home networks will exist, it is essential that the home network be ‘trusted’ in the economic sense – and, in the technical realm, ‘robust’ in implementation – unlike the previous evolution from traps to scrambling, the stakes are much higher.
If three equal home networks were to
evolve, content companies need the same level of security – and already have experience with “trusted” cable networks. Content security is a “new” feature to the “other two” home network developers. Thus, MSOs have an advantage because of their participation in the revenue chain – and the attendant concerns to preserve security, and to evolve conditional access as they have before.
COPY PROTECTION BASICS
Access to Content
In the 1970’s ‘legacy’ consumer
environment, where “on and off” were sufficient business conditions – and there were no recording or distribution issues of concern – conditional access worked fine at a very simplistic level. As noted, when consumer copying of PPV became a potential threat, copy protection was added.
Today’s access to content, if the
environment was devoid of redistribution, copying and there was no desire to increase revenue by exploitation of the time value of content, then simple conditional access would be sufficient.
However, the home network implies
connectivity, copying for convenience and device portability – and the risk of uncontrolled redistribution of high-quality content beyond the subscriber is too economically devastating to ignore.
Copyright protection is necessary to augment conditional access. Copy Control Modes
Generally, there are but a few business
model concerns that need protection: No uncontrolled redistribution on the
Internet – this restriction is mandatory in every copy ‘restriction’ state – and also a requirement for the ‘Retransmission Control Descriptor’ (RCD) (also known as “broadcast flag”) if the content is not otherwise copy controlled. (Note that the RCD is currently under industry discussion and is not necessarily ratified in standards mentioned below.)
Copy Once – content marked copy once
is restricted to one copy (even on removable and archival material), but all playback devices must mark the playback output as “copy no more” to ensure that no subsequent copies are made. A copy on a device such as a Digital Video Recorder (DVR) might be ‘moved’ to an archive under the rules of Copy Once.
Copy Never – content marked copy never
is prohibited from having any recorded copies other than copies that are of short-duration (convenience-type) copies.
These three states are communicated by
two binary “bits” in several control messages that are either embedded in content or sent via control streams. Copy control information (CCI) bits can occur in some or all of the following forms:
• Setup in the configuration of set-top
boxes, control software and digital interface drivers. In this way permanent modes could be set via programmer (content provider) direction.

• Analog (Copy Generation Management System – Analog (CGMS-A)) bits are sent via Line-20 (International use, standardized by IEC); US VBI standardization of CGMS-A is included in CEA-608-B via Line-21. Note: The intent is not to restrict analog recording but identify copyrighted content to downstream Analog to Digital (A/D) devices or encoders to give instructions regarding redistribution and copying.
• Other signaling such as Program
Map Table (PMT) is under discussion and is proposed in some technology licensing agreements.
It is important to note that declaration of
copy control mode, the mechanism that sets the mode (whether that control is embedded in the content or ‘authoritative’ via secure channel such as an encryption system) and the type (category) of content that is copy-controlled is governed by the DMCA, FCC rules, and technology licensing agreements (so-called “Encoding Rules”).
Encoding Rules as proposed by the cable
and consumer electronics industries (and adopted by the FCC) propose the following ceiling levels (less restrictive levels are allowed for a particular content type, but not more restrictive) for copy control:
• Copy Never: PPV, VOD (on-
demand PPV), SVOD. • Copy Once: Linear premium and
basic television • Copy Freely: Over-the-air broadcast
television (however, the RCD may be applied).
BASIC COPY CONTROL STATES
Bits Control Mode RCD Redistribution
0 0 Copy Freely 0 Allowed1 Prohibited
0 1 Copy Once x Prohibited
1 0 Copy Never x Prohibited
1 1 Copy No More* x Prohibited
(* sometimes copy no more is flagged as copy never)
x = “don’t care”
HBO / Cinemax linear content is designated “Copy Once” and HBO / Cinemax on-demand content is designated “Copy Never.”
Fourth Step – Digital Rights Management
The next step in the evolution that
optimizes the trend in time-value content revenue optimization, secure distribution of content, copy management, portable device management and takes the role of conditional access to its, arguably, ultimate level – is to include digital rights management functionality into a ‘traditional’ conditional access system.
DRM will be the tool by which MVPDs
and content owners will be able to use copyright protection technology to create new consumer offerings rather than simply employing the technology in attempts to preserve the status quo.
Conditional Access systems, generally,
are ‘trusted’ for their security and have evolved from quite simple on/off gates to addressable, VOD-enabled, two-way session-based, transactional systems.
Digital Rights Management (DRM)
systems, now deploying for Internet-related content delivery, provide basic security (encryption) technology – but have very

complex on/off rules – sometimes embedded within the content (not necessarily requiring a two-way connection). On/Off rules can be soft descriptions of business cases (such as subscription, copying permission, quantity of viewing (e.g. x-views), duration of viewing (self-destruction of copy after y-days), etc.).
Signaling the DRM control states is an
ongoing industry discussion (“Extended CCI”) and is not yet embodied in cable standards or other rules.
The integration by a MVPD of an ‘trusted’ conditional access / DRM system into a whole-home-network environment that exerts authoritative control over content within the network, provides all protected outputs from the network under that control umbrella, is the genesis of a ‘Trusted Domain.’ Such a secure environment will be necessary to optimize the time-value revenue stream – that has served cable so well since its very first paying subscriber. But, that was a few hundred billion dollars ago, and there are plenty more to go around.

COPY PROTECTION STRATEGIES FOR THE DIGITAL HOME
Carmi Bogot NDS Technologies
Abstract
Digital entertainment content is the
driving force in the “digital home” revolution. Availability of content drives demand for consumer electronics devices and for the ability to interconnect these devices using a home network. At the same time, the new availability of digital content on a wider range of connected devices makes content protection an ever-more pressing issue for content developers and rights owners.
Content protection is a highly emotive
issue, which impacts all the players in the digital content distribution value chain. This paper defines both the technical and business terms critical to content protection in the digital home. It proposes the Secure Video Processor (SVP) — created by adding a small number of gates into an existing video processor chip design, creating a Secure Video Processor or SVP. The SVP Alliance is a group of interested parties committed to advancing the development of secure content distribution and the wide adoption of SVP technology. The paper also presents the business benefits that SVP brings to all the principal players in the content protection industry: operators, studios, chipset manufacturers, CE vendors and consumers.
INTRODUCTION
Digital entertainment content can take
any of a number of formats — it can be broadcast TV content, digital music, or movies. The content can be delivered to the home in any of a number of ways — broadcast via terrestrial, satellite or cable
transmission, downloaded from the Internet via broadband or uploaded from a digital camera or other recording device.
What makes the digital home appealing is
the high level of picture and sound quality and the ease with which consumers can access content on several devices, sharing and transferring high quality content throughout a home network. It is this same level of quality and flexibility which gives rise to worries about illegal reuse and redistribution of copyrighted content.
Today, it is technically possible for
digital content to move freely between storage and access devices, and to reside in many locations from the time it is distributed until the time it is finally rendered and consumed by consumers. In fact it is so easy to move digital content, that systems that try and prohibit the movement of content are easily hacked.
Rights owners and content providers, as
well as networks and platform operators, who generate revenues from reselling their content, do not care if an un-viewable / unusable copy of content is made. They are concerned with the uncontrolled viewing of content without proper content protection mechanisms in place.
The SVP Alliance proposes a solution
which balances the consumers’ demand for fair and flexible use of content throughout their home network — their “domain” — with the rights owners’ need to protect their business interests. SVP does this by creating an end-to-end chain of control over content from distribution until rendering.

Defining the Digital Home A digital home features any combination
of TV sets — analog and digital — DVD and MP3 players, DVRs, media centers, PCs, PDAs, cell phones and home video servers, all interconnected via a home network. The digital home consumer wants flexible access to high quality digital content, on demand, on any of these devices.
Digital TV content is playing an
increasingly important role in the digital home. According to Strategy Analytics, there were around 100 million digital TV households worldwide at the end of 2003. By 2008, this number is projected to pass the 300 million mark.
The massive appeal of digital TV content
creates an incentive for consumers to add another digital platform to their home — the digital set-top-box (STB). New STBs facilitate a two-way connection between the home and an external service. An increasing number of STBs also feature local storage (known as a PVR/DVR), allowing time-shifted viewing and archiving of digital entertainment. In addition, the existence of a digital STB stimulates consumers to use and look for convergence between the STB and other devices in the home, further driving the development of the home network
. Convergence, fair use, and flexible use
are all terms used when talking about consumers’ desire to access the same content easily on different electronics devices.
For example, most U.S. households
include multiple TV sets. Owners of advanced DVRs and STBs with local storage express strong interest in having time-shifted viewing capabilities on every TV in their household. As a result, some
DVR vendors offer consumers the ability to stream recorded content from a central DVR to client devices over a home network.
Implementing home networks allows
viewers greater convenience and flexibility since content can be consumed on multiple TV sets, DVRs, and DVD players within their homes as well as on portable devices such as PDAs.
SECURE CONTENT IS THE KEY
Appealing, timely, and high quality
digital content is the foundation of the digital home revolution. Without the content, consumers obviously don’t have the incentive to purchase devices which enable them to use and enjoy digital content. But the availability of content depends on more than the simple existence of consumer demand for access to it — it depends on the willingness of content owners to provide content and the service providers to offer it as part of a secure pay TV service.
One of the most significant issues content
providers face in the digital age is illegal use, distribution, and redistribution of content. Unprotected digital content can be copied, redistributed, and consumed at its original quality by anyone. Clearly, content owners and service providers whose business is based on selling content seek to prevent this by using content protection mechanisms. Without the means to control content rights in the digital home, content owners will limit their content offering for this environment. Furthermore, service operators are obligated to protect the rights of their content owners. Operators will hesitate to enable their digital STBs to interface with other devices in the home via high speed ports if they cannot control access to the content once it leaves the STB.

For these reasons, balancing the rights of the content providers with the needs and demands of consumers is critical to the future development of the digital home network. Flexible, low cost, user friendly, content protection mechanisms are required to satisfy the needs of consumers who should be able to enjoy greater access to and “fair use” of high-value content. Such mechanisms provide benefits to consumers as well, enabling dozens of new ways to purchase content, such as content rentals, video-on-demand, and other models made possible by content protection.
A FLEXIBLE, LOW COST SOLUTION The SVP-enabled chip ensures that
content is under control from the beginning of distribution until it reaches its final destination and is rendered. The content is always encrypted, and the rights are defined in a separate, standard, tamper-resistant license.
Every device that consumes digital video
must already have a digital video processing chip. SVP technology is embedded within this chip, turning the existing video processor into a “Secure Video Processor” chip. The SVP handles both the content and the license. The SVP is unconcerned with the physical distribution method and it is independent of the location or locations where content is stored and the networking or communications technology used to move content between locations.
Designing the SVP as a hardware-based
solution enhances security while making it easier to standardize — and therefore easier to produce inexpensively in mass quantities. The SVP-enabled chip can be implemented in any digital device, including STBs, TVs, DVD players and recorders, DVRs, PDAs and other portable devices — without requiring special customization for each type or model of
device. Upgrading any existing video processing chip into an SVP is a simple process that typically increases the existing gate count by less than 2 percent.
What does the SVP Protect?
The SVP is designed to protect any
scrambled digital content, associated with a valid license. The content is typically SDTV or HDTV MPEG-2 / 4) and any form of digital audio. Content can be delivered to the home via any existing method in use today — cable, satellite, DSL, or terrestrial — and protected by any existing conditional access technology. The scrambling algorithms used on the content are market-dependent, and could be, for example, DVB-CSA, DES, 3xDES, AES, DVS-042, Multi-2 or CSS.
Domain and Fair Use
To facilitate the fair use of content across
multiple devices within a consumer’s home, SVP enables definition of two types of domains, within which content may be consumed. A domain is essentially a consumer household, made up of a number of interconnected consumer electronics devices. Domains may be externally managed or autonomous.
• An externally managed domain is
managed using a gateway connected to an external network. An STB, connected to a service operator’s network and using the operator’s conditional access, would be considered an externally managed domain.
• An autonomous domain is a network
of consumer electronics devices where one of the devices on the network manages the domain and the network.

Any device in the domain that wants to access controlled content must have an SVP enabled chip. Under the proposed SVP solution, it is possible to limit the number and type (STB, mobile device, TV, DVD player, etc.) of devices within a domain. In addition, SVP can control access rights and specify how consumers may use content. Use of content can include any combination of: • Rendering (accessing the content) • Rendering content plus permission to
record and reuse the content for a short, defined time period, perhaps 90 minutes
• Permission to make and store
recordings of the content • Permission to copy the content and use
it within the domain • Permission to move the content, which
entails creating a copy and deleting or disabling access to the original, and using the copy within the domain or outside the domain
• Exporting the content to a different
content protection system. Such as transfer to 5C or HDCP control.
How SVP Protects Content
All content on an SVP-protected network is accompanied by a usage license. Content is never transferred between SVP devices in the domain “in the clear” — it is always scrambled either using the AES-based, SVP Native Scrambling Algorithm (NSA), or the original broadcast scrambling. In some cases both algorithms can be in use at the same time, resulting in super scrambling.
SVP provides a standard messaging format for defining content rights. Each movie should have one Content Segment License (CSL) and a set of Base Line ECM messages (BL-ECM). A new BL-ECM is required every time the control word (descrambling key) changes.
SVP FUNCTIONALITY
The SVP-enabled chip is capable of
receiving clear or scrambled content, and can descramble and re-scramble the content using various ciphers including an SVP standard cipher NSA that uses 128-bit control words. The SVP can also receive and transmit standard format licenses, consisting of a CSL and any number of BL-ECMs. All processing of content, whether in scrambled and compressed format or descrambled and decompressed format, and all of the processing of the license occurs in hardware within the confines of a single SVP-enabled chip.
Each SVP is associated with a public
certificate that uniquely identifies the SVP, and the properties of the device in which it resides — device type, whether it supports watermark detection capability, which decryption algorithms it supports, which video formats, and other properties.
At any given time, an SVP is linked to a
specific authorized domain. The maximum number of devices within the domain is limited by the certificate. SVP-equipped devices within a domain will mutually authenticate each other and establish a secure channel prior to exchanging content.

SVP and Conditional Access An SVP can work alongside and in
conjunction with a service provider’s conditional access system: 1. Content arrives at the STB under
conditional access system control. 2. Content is then transferred to the SVP so
it can be used by other standard devices within the domain.
3. To transfer or share control, the
conditional access system must be able to generate a standard content license, including a standard Content Segment License (CSL)1 and a standard Base Line Entitlement Control Message (BL-ECM)2, for the content.
Three conditional access systems are
available in the STB — embedded, smart card, CableCARD. Each can act as a gateway between the conditional access system and the SVP system. In addition, the conditional access system should be used by the network operator to perform actions such as setting up authorized domains, issuing and renewing certificates, and passing SVP certificate revocation lists.
BUSINESS BENEFITS OF SVP
The digital entertainment industry
comprises a range of players whose interests often seem to conflict. Content protection is an often-contentious issue which affects each of the principal players — network operators, content providers, chipset vendors, CE vendors, and consumers — differently. SVP offers a unique win-win situation where every player can realize
1 The attributes and usage rights for content are defined in a standard tamper-resistant message. 2 BL-ECM messages are used to securely transmit decryption keys.
benefits from the adoption of SVP as a standard approach for digital content protection.
Network Operators
The growth of pay TV businesses
demonstrates an increasing willingness of viewers to purchase the rights to view compelling content. However, along with that willingness is an expectation of being able to use that content in increasingly varied and personalized ways. Many, or most, viewer households include multiple TV sets, as well as a DVD, a VOD service, a DVR, and, increasingly, a home network that connects several home entertainment devices.
These viewers want to be able to access
their pay TV subscription on all the TV sets in the house, they want to make backup copies on DVD-R media, store content on removable USB keys, and use it anywhere that they are.
Network operators know that their
continued success depends on their ability to provide viewers with top content and flexible accessibility. At the same time, the operators won’t be able to obtain that content if they cannot demonstrate to content providers and rights owners their ability to protect the content and control access to it. They need a solution that offers viewers the fair use they demand, while protecting content and expanding the operator’s business models.
Current solutions require a second or
third STB for every location that content is used. This is not only an unattractive solution from the consumer’s viewpoint, cluttering up the house with numerous boxes and cables; it is expensive for the service operator. In most cases the service operator

pays for the development of the STB and supplies the boxes to subscribers at minimal or no cost. Furthermore, subscription fees for secondary devices are usually priced at very low rates. The result is that secondary STBs generate cost, not profit. Even if the operator implements a solution with a single high-end STB which communicates with numerous secondary, relatively inexpensive STBs, the operator still faces an enormous expense in developing, deploying, and maintaining large numbers of STBs.
Viewers would pay for off-the-shelf
consumer electronic devices to access content within the home, as long as these devices were and not linked to a specific service operator.
SVP solves these problems. SVP allows
any network operator to deliver content in a secure fashion to any SVP-enabled third-party device. With SVP-enabled chips included in each consumer electronics device on a viewer’s home network, the operator can extend access control throughout the home network and even to all devices — including portable devices — and realize dozens of new business models and program packaging options. This is accomplished at virtually no cost to the operator, since proprietary and conditional access components are required only in one “gateway” STB, not in all of the networked devices. Thus operators can enable access to stored content or video-on-demand (VOD) content on all TVs within a viewer household while deploying / subsidizing only one STB per viewer household.
On-demand content can be sent directly
from the network to any device using SVP content protection. Broadcast and On-demand content can also be sent via an operator controlled SVP enabled STB enabling redistribution to other SVP-
equipped TV sets, PDAs, DVDs, etc. in the home or domain. This enables new business models based on secure home network distribution to multiple viewing devices. Operators can offer extended content rental packages, for example, charging extra for the rights to view across the home network or on multiple TVs. Pay-per-view and Video-on-demand content is now truly available on demand to consumers, when and where they want to see it. Operators can determine which additional devices may be used to access content and for how long — and charge accordingly for these access rights. The operators also control copying and storage rights, providing even more opportunities for licensing fees. They can charge a certain amount to permit saving content for a limited time period with on-demand viewing, including the ability to pause, rewind, and fast-forward the content — and charge more for permission to make a permanent copy. The SVP license is even flexible enough to enable operators to charge for rights to view content in an additional domain or to “transfer” rights — canceling the viewing permissions in the original domain when a copy is made to be viewed elsewhere.
Furthermore, SVP protection extends
even to content which is archived onto D-VHS or DVD devices. The content license defines the access criteria as determined by the network operator. Operators can then enable viewers to record and keep content indefinitely, confident that the content can only be viewed within that viewer’s domain, not recopied and redistributed freely to friends and neighbors.
Content Providers
Content providers have a clear interest in
protecting their content and determining who may access it and when. They need to

protect content from piracy and other unauthorized use and redistribution, and to enforce business models.
Until now, only a few models have been
available for protecting content. One method of controlling access to content has been using limited packaging and distribution options, such as a CD for audio content or DVD for video content. These do not provide reliable content protection, and offer no flexibility in packaging and marketing.
Another method of content protection,
particularly for video content, is to work with network operators who use conditional access to protect content rights. This solution is being challenged by the proliferation of home networks — and is not satisfactorily meeting consumer demands for fair use access to content on these networks.
Historically, discussions of content
protection have focused on protecting interfaces / pipes and not on protecting content. For exmple using 5C for 1394, using DFAST for CIM, and using HDCP for DVI. These are all interface protection mechanisms that attempt to protect the transfer of content over specific media but do not provide an end-to-end method for controlling rights to content. In addition, new forms of digital copying and storage that are becoming easily available to consumers make it easier for consumers to evade restrictions on content.
SVP offers reliable protection for
content, wherever that content resides and however it is accessed. It can offer content providers the confidence to permit better viewing windows for new movie releases, opening up new business opportunities both for the content providers and the network operators who distribute the content.
Consumer Electronics Manufacturers Manufacturers of consumer electronics
devices might initially be inclined to argue that content protection is not their concern. However, it is clear that the ramifications of unlimited illegal distribution of digital entertainment media will ultimately affect their industry, as solutions are either legislated or imposed by content providers.
Proactive implementation of content
protection using SVP creates a situation where all players in the digital home entertainment arena benefit. SVP enables CE manufacturers and chipset vendors to offer a standardized, low-cost content protection solution which does not significantly increase their manufacturing costs. The security is placed in chips that are already an integral part of the CE device. The SVP solution offers CE vendors new business opportunities as well. SVP facilitates home networking while preventing unauthorized use and redistribution of content. If a content protection solution is in place, content providers will be more likely to enable the use of high value content across these networks. The availability of high value content will, in turn, drive the demand for newer and more networked devices, enabling CE manufacturers to create a wide range of SVP-compliant devices which can be used to consume content in increasingly sophisticated home entertainment systems.
For example, an new device and delivery
mechanism can be created by simply combing; a broadband connection, SVP and any existing viewing device like a DVD player. This would enable the device to receive video-on-demand directly from content owners — increasing the value of the device and providing room for additional revenue.

Thus, SVP presents the opportunity for CE manufacturers to participate in pay TV distribution on home networks. Without a standardized content protection solution, pay TV operators could only permit their own proprietary devices to be used to decrypt their programming. However, the ability to use SVP certificates and licenses to enforce the pay TV operator’s entitlements means that CE manufacturers can now enter this lucrative market with non-proprietary “horizontal” retail devices. This provides consumers with increased choice, while spurring development of and creating new markets for CE devices.
Consumers
It often seems to consumers that the
entertainment industry is putting a lot of effort into making it difficult for them to access content. If a viewer has paid for access to content, why shouldn’t that viewer be able to decide whether to view it in the living room or the bedroom? Consumers are increasingly willing to pay for access to top value content, but in return, expect to be able to access that content when they want to, and on a variety of consumer electronics devices.
SVP presents a way out of the confusion,
with a solution that protects the rights of content owners while making it easier for consumers to access content in more ways and in more locations.
As a standard chip component which
enforces the rules set by the pay TV operator who sells the content, SVP can be used in any type of consumer electronics device. The license defines where content may be
consumed — what types of devices, even which specific devices — and for how long. This ensures that rights owners get paid for their content while enabling viewers greater freedom of access and use than any solution previously implemented. Once consumers have purchased the right to access content, they can use it on any device in their home network, even in a second home, or on portable wireless devices. The SVP is designed to be inherently flexible, giving content providers and distributors more options for packaging and marketing content, further expanding consumer choice
. A SOLUTION FOR EVERYONE
The issue of content protection is not
going away; in fact as the digital home becomes more commonplace, content protection is becoming an ever-more complex problem. As proposed, SVP offers a win-win opportunity for all the players in the digital entertainment food chain.
The SVP solution addresses the issue of
end-to-end content protection in a wide range of devices, yet does not require a large financial investment. It creates new business opportunities for CE manufacturers, content owners and content distributors, while making it possible for consumers to access high quality digital entertainment on any of their home network devices. Adoption of SVP is a crucial step on the road to realizing the full potential of the digital entertainment revolution.
For further details, visit the SVP website
at www.svp-cp.org, or email us at [email protected].

DEPLOYING ENHANCED IP SERVICES USING PACKETCABLETM MULTIMEDIA QOS CONTROL
Gerry White
Motorola Broadband Network Infrastructure Solutions Group
Abstract As operators seek to deploy enhanced services, the PacketCable Multimedia initiative allows them to deliver high-volume multimedia services with committed QoS levels. PacketCable Multimedia allows operators to deliver QoS-enhanced multimedia services—including both residential and business video telephony and conferencing services over DOCSIS 1.1 access networks. This paper will discuss how the PacketCable Multimedia initiative builds on PacketCable 1.x to support enhanced IP multimedia services. It will explain how Applications Managers and Policy Servers on the network can act as proxies for clients to request QoS levels from the Cable Modem Termination System (CMTS) for multimedia sessions, and it will provide examples of several multimedia applications.
INTRODUCTION PacketCable Multimedia defines an architecture to deliver QoS-enabled services over an IP-based cable infrastructure. It enhances the original PacketCable telephony centric architecture to allow flexible support for a broad array of multimedia services. Thus operators can support a wide variety of applications and services beyond voice. The key aspect of this CableLabs specification is that it defines a multimedia architecture that is application-agnostic. Application managers and policy servers act as proxies to request QoS on behalf of client applications so that the client itself does not
need to be directly involved with the QoS signalling. This abstraction layer between the application and the QoS infrastructure simplifies the addition of new services. PacketCable Multimedia offers significant opportunities for enhanced services because operators can deliver QoS-enhanced multimedia services over DOCSIS� access infrastructure while using industry standards to ensure QoS control across metro and core networks. Multimedia applications present special challenges to broadband network operators, and evolving multimedia services will continue to present unique bandwidth, QoS, and latency requirements. The objective of the PacketCable Multimedia initiative is to define the core framework required to support QoS-base multimedia applications. It leverages the foundations established by the DOCSIS 1.1 and PacketCable 1.x specifications to allow network operators to efficiently deploy profitable IP multimedia services.
PACKETCABLE 1.X COMPARED TO PACKETCABLE MULTIMEDIA
The PacketCable specifications were originally developed for telephony services to provide a mechanism to establish IP flows over the HFC network with defined QoS levels. PacketCable Multimedia builds on the concepts of the PacketCable QoS architecture but rather than being targeted at a specific application (telephony) it is deliberately application-agnostic.

This enables features originally developed for VoIP (e.g. QoS authorization, admission control, event messages for billing, security) to be used to deliver enhanced multimedia services. Multimedia applications are bandwidth-intensive and sensitive to transmission delay within the network. The PacketCable Multimedia architecture was developed to allow operators to deliver a variety of IP-based multimedia services and applications that require committed QoS levels. This service delivery framework provides general-purpose QoS, event-based accounting, authentication, and security founded upon the PacketCable 1.x specifications. But PacketCable Multimedia generalizes and extends 1.x in order to support a broader spectrum of applications and services. It supports both peer-to-peer, client-based services as well as server-based services. The PacketCable Multimedia signaling framework provides applications with access to the full range of QoS capabilities defined in DOCSIS 1.1. This includes all scheduling algorithms including best effort, constant and variable bit rate services, and both symmetric and asymmetric upstream/downstream bandwidth characteristics. PacketCable 1.x supports telephony services using the Dynamic Quality of Service (DQoS) specification. The user has an intelligent endpoint that communicates with a Call Management Server (CMS) through an Embedded Multimedia Terminal Adaptor (eMTA).
With the PacketCable Multimedia approach, the client device may not be intelligent and client-to-server signaling is isolated from network QoS signalling. The client requests enhanced services from network-based servers, and services are delivered based on network policies. In the original PacketCable architecture the CMS both provided application-processing logic and implemented network policies. With PacketCable Multimedia, these two functions are separated and the interface between the components exposed and defined using the Common Open Policy Service (COPS) protocol. PacketCable used the concept of event messages to track telephony-specific events. The telephony specific messages have been replaced with generic policy events but the overall structure of the event messages is the same. In the PacketCable 1.x model the eMTA signaled directly to the CMTS to request QoS based on its understanding of the telephony application. In the PacketCable Multimedia framework, the Cable Modem Termination System creates the DOCSIS service flows associated with the client based on information received from the policy server. UNDERSTANDING THE PACKETCABLE
MULTIMEDIA ARCHITECTURE The major network elements within the PacketCable Multimedia Architecture include:
• Application Manager (AM) • Policy Server (PS) • Cable Modem Termination System
(CMTS) • Record Keeping Server (RKS) • Client

Application Manager The Application Manager (AM) is responsible for application or session control. It may be a general-purpose engine such as a SIP proxy server capable of supporting multiple SIP-based application types or may support a single application such as a gaming server accessed via a Web browser. In either case, the client talks directly to the AM (over the IP network) and either explicitly requests the resources to initiate a QoS-enabled service or simply requests a service which has implicit QoS needs known to the AM. The AM then formats a request to the Policy Server and attempts to reserve the QoS resources. Policy Server The PacketCable Multimedia architecture allows for and indeed expects multiple application managers to exist in a network. These managers must all use a pool of shared resources e.g. HFC bandwidth which can be made available by multiple devices. Thus any QoS requests are directed to a further intermediary device which mediates between the AMs and the CMTS/routers. This device is termed a Policy Server (PS) and is responsible for coordinating the QoS requests for multiple AMs and delivering the commitments necessary to the multimedia applications. In a typical network the AMs may be under the control of multiple application service providers whereas the PS would be under the control of the network operator. Thus the PS applies policy as defined by the network operator and manages the relationship between AMs and CMTS platforms at the edge of the network. The PS implements operator-defined authorization and resource management procedures.
The PS devices are located in the MSO’s managed network and are responsible for making QoS-related policy decisions based on rules defined by cable operators. Each operator can therefore establish its own network policies. For example, an MSO could establish policies for the number of concurrent authorizations for a particular subscriber or service.
PacketCable MultimediaNetwork Architecture
HFC Network
Client
DOCSIS 1.1Cable Modem CMTS
Application Manager
Record KeepingServer
Policy Server
MSO IP Network
Cable Modem Termination System The Cable Modem Termination System (CMTS) is responsible for enforcing QoS-related policy decisions. It performs admission control and manages HFC network resources through DOCSIS service flows. The CMTS is based at the edge of the HFC network and communicates with the Policy Server using the COPS/TCP protocol and with the Record Keeping Server using RADIUS/UDP. It supports a single-phase reservation model where access network resources are simultaneously reserved and committed for immediate use, as well as a two-phase reservation model in which access network resources are initially reserved and then committed for use as they are required at a later time. The CMTS also provides the boundary between the access and metropolitan networks so operators can implement end-to-end QoS for applications and subscribers.

Record Keeping Server
The Record Keeping Server (RKS) performs a mediation function between the PacketCable Multimedia elements and the back-office applications for billing purposes. It receives event messages pertaining to policy decisions from the PS, and receives notification of actual QoS grants from the CMTS. Client A multimedia client is a logical entity that can send or receive flows. The client can be any one of a diverse range of devices, such as a PC, gaming console, videophone, etc. It communicates with the AM via an application-specific signaling protocol. In many cases this will be a standard such as SIP but any protocol understood by both client and AM (such as PacketCable NCS) may be used. This protocol is not defined in the specification so application creators and operators have maximum flexibility; the client does not directly request QoS, the AM does so on behalf of the client. PacketCable Multimedia discusses three types of clients: Client Type 1 are endpoints that lack specific QoS awareness or signaling capabilities Client Type 2 supports QOS signaling based on PacketCable DQoS. It is aware of PacketCable Multimedia QoS and communicates with an AM to request service and obtain permission to obtain services from the access network. Client Type 3 requests QoS using the Resource Reservation Protocol (RSVP) without AM interaction The AM will request QoS for Type 1 clients based on its understanding of the
application. The client will not request QoS explicity. Type 2 and 3 clients are QoS aware and request explicit QoS parameters. Type 2 clients do this via the AM while Type 3 clients bypass the proxies and talk directly to the CMTS. Currently, only Type 1 clients are specified. SAMPLE PACKETCABLE MULTIMEDIA
MESSAGE SEQUENCE
It is helpful to view a simplified message sequence for requesting QoS for an application. In this example, an application running on a PC client requests bandwidth from the AM (step 1), which checks with the PS to ensure that business rules permit the allocation (step 2). The PS confirms availability of resources (to the best of it’s knowledge), authorizes the QoS grant and requests the CMTS to deliver the QoS required to support the application (step 3).
Sample Message Sequence
Client DOCSIS 1.1Cable Modem CMTS
Application Manager
Record KeepingServer
Policy Server
1 Š ClientRequestsService
2 Š Policy Request for QoS
4 Š DOCSIS 1.1
5 Š QoS Event Message
6 Š PolicyEventMessage
7 Š Service Activated
* Acknowledgements not shown
3 Š Policy Request for QoS
The CMTS determines whether the bandwidth is available, and if so it sets up a QoS enabled flow across the access network to the client’s cable modem using DOCSIS 1.1 signalling (step 4). If the CMTS can also act as a MultiProtocol Label Switching (MPLS) Label Edge Router (LER) it may also create a virtual path across the metro network to provide a QoS-enabled connection to centralized server resources. Thus resources can be reserved end-to-end between the client and the broadband

network operator’s server. (If the CMTS is not capable of acting as an LER, the PS may initiate setup of the virtual path in the metropolitan network). The CMTS sends a QoS event message to the RKS (step 5), and the PS similarly sends a policy event message (step 6) so the operator can bill the subscriber appropriately for its use of network resources. Finally the data path is set up and the service activated (step 7).
A FRAMEWORK FOR QOS CONTROL
The CMTS controls DOCSIS 1.1 QoS service flow mechanisms and the operator can support time-based and volume-based network resource authorization. The CMTS informs the PS, which informs the AM when a volume limit or time limit is reached. The event mechanism enables operators to implement event-based network auditing. Application-layer QoS requests are translated into DOCSIS QoS parameters by the CMTS. The CMTS creates DOCSIS service flows and determines the cable modem the client is connected to based upon the Subscriber ID (IP address). DOCSIS service flows are established on-demand based on policy and released upon session completion. With this framework, deploying new services and applications is simple and fast. The CMTS and the cable modem are unaware of any specific application—they simply provide the QoS. The PacketCable Multimedia specification therefore requires no QoS signaling capabilities in the client device. Policy—and the ability to deliver QoS—are pushed from AM-to-PS, PS-to-CMTS, and CMTS-to-CM. PacketCable Multimedia can co-exist with PacketCable 1.x telephony so operators can support telephony as well as enhanced multimedia services over the same infrastructure.
DATA PLANE
Two distinct mechanisms are required to provide QoS to multimedia traffic flows over large IP networks. At the edge of the network, bandwidth is typically scarce and devices deal with a limited number of traffic flows. In this region QoS can be provided most effectively on demand at a per-flow level. But on the metro network, bandwidth is relatively abundant but the infrastructure is shared between tens-of-thousands of clients. Thus, core switches and routers must support hundreds-of-thousands of flows. If these devices were to operate at an individual flow level the amount of data to be maintained would be massive and systems would simply not scale, so that an aggregation mechanism is needed. Current aggregated QoS mechanisms include IP-based differentiated services and MPLS-based traffic engineering. The CMTS/edge router must act as the transition point between the two QoS domains.
Data Plane Network Architecture
LSR
MPLS-BasedMetro NetworkGigabit and 10
Gigabit Ethernet
VOD ServerFarm
Internet Servers
IP Set-TopBox
LSRLER
LER
LSRLSRLSR
LER/CMTS
HFC
CableModem
Gateway
The data plane requires QoS control across both metro and access networks, with QoS on the access network delivered using DOCSIS 1.1 and QoS on the metro delivered using MPLS Operators can implement QoS in the HFC access network using DOCSIS 1.1 and intelligent edge router/CMTS platforms that support per-flow queuing. If the edge router can also serve as an MPLS LER, then it can

map packets from the per-flow QoS in the access network into aggregated traffic flows across the metropolitan network. MPLS defines a mechanism to set up Label Switched Paths (LSPs) between endpoints at the edges of the MPLS network. Packets entering the network are assigned to a particular path and a label added to the packet identifying the LSP to be used. This label is used by the MPLS routers in the core of the MPLS network to forward the packet to its destination endpoint. The core network does not need to examine the packet headers beyond the label and can therefore focus on switching traffic to its destination as quickly and efficiently as possible. Each LSP can be associated with a Forwarding Equivalency Class (FEC), which defines specific QoS parameters so that the MPLS network can provide a mesh of QoS-enabled paths. An intelligent edge router/CMTS platform at the edge of the network can therefore leverage the PacketCable Multimedia specification to deliver QoS across the HFC infrastructure using DOCSIS 1.1, and support QoS across metro and core networks using MPLS. The CMTS/edge router/LER provides the transition points between the two QoS domains so operators can deliver the QoS control necessary for enhanced multimedia services.
CONTROL PLANE The network requires a control plane to signal QoS requirements and to setup and tear down QoS-enabled paths. All multimedia applications have similar requirements for QoS. They all generate IP packet flows (each packet of which requires the same QoS) that can be identified using an appropriate classifier. Thus a common data path forwarding mechanism can be designed
and deployed to support them all (per-flow at the edge, aggregated in the core). However the end systems for the IP traffic streams are radically different in terms of user interface, programmability, and sophistication. PacketCable Multimedia clients range from gaming devices to video phones to application software running on PCs. Therefore, multiple mechanisms will be required to provide the control path signaling based on the capabilities of the client system. Operators use the control plane to establish the appropriate QoS between devices, and it enables resource reservation. The client device requests the appropriate QoS level, and the AM authorizes or rejects the request based on policies defined in the PS. Operators can therefore specify which applications or customers have the priorities to request resources. When a client requests resources, the AM will check with the PS to see if the client is entitled to those resources based on network policies. If the PS authorizes the services—and if those resources are indeed available—the QoS level will be assigned to the application. There are several ways to support signalling between the client and the AM. For example, a user could go to a Web site and request resources, or requests could be generated using the Session Initiation Protocol (SIP) or the Network Control Signalling (NCS) protocol, defined by PacketCable 1.x. Signaling from the AM to the PS and from the PS to the CMTS is conducted using COPS. The AM or PS can also use SNMP to check on the availability of resources within the network.

The CMTS will use DOCSIS 1.1 signalling to set up per-flow QoS reservations on the access network. It will aggregate multiple flows into the aggregated QoS mechanism of the MAN and set up aggregated QoS paths across the metropolitan network using MPLS Label Distribution Protocol (LDP) or the Resource Reservation Traffic Engineering (RSVP-TE) protocol. The key feature of the control plane as defined for PacketCable Multimedia is that it provides a common QoS control plane within the network, which can support multiple client-to-AM signaling options.
ENABLING ROBUST MULTIMEDIA APPLICATIONS
PacketCable Multimedia delivers the flexibility to efficiently support diverse applications over access, metro, and core networks. For example, MSOs can deploy VOD to residential subscribers. Signaling for VOD could be provided via SIP, with the Session Description Protocol (SDP) used for describing the multimedia sessions, including the QoS requirements. In this case, the client requests an application flow with committed QoS levels using the SIP protocol. The VOD AM will check video resources and may provide authentication of the client and ensure that business rules permit the flow. It will then pass on the QoS request to the PS, which in turn may check with local policy prior to requesting QoS from the CMTS. The CMTS then provides the required connection levels to the client’s cable modem.
Once the session is established, stream control can be implemented by the Real-Time Streaming Protocol (RTSP), a client-server multimedia presentation control protocol designed to leverage existing IP infrastructure. VOD signaling can be provided by SIP and SDP, and QoS can be provided on the access network using DOCSIS 1.1 and across metro and core networks using MPLS.
Multimedia and SIP
Client
DOCSIS 1.1Cable Modem
CMTS
Application ManagerPolicy Server
SIP
Authentication,Bandwidth
Control and QoSCOPS/TCP
Bandwidthrequest
Another potential SIP-based application is video telephony service that can establish peer-to-peer voice and video sessions across the cable infrastructure. In this application the caller issues an invite using the SIP protocol, and the AM and PS combine to provide a proxy server function. Once the call is authorized and connected, the data path is granted the necessary QoS and the voice and video call is established. Operators can also deploy 1:N multimedia applications between groups of users, such as multiplayer gaming services. Game players from leading vendors are increasingly network-enabled, and MSOs can leverage PacketCable Multimedia to offer high-performance experiences with QoS guarantees to gaming enthusiasts seeking an interactive, real-time multimedia experience.

SUMMARY
PacketCable Multimedia allows MSOs to deploy enhanced multimedia services over a common infrastructure. It is application-independent, so operators can deliver emerging multimedia services while retaining the flexibility to support evolving demand for new multimedia services not yet even imagined. They can take advantage of industry standards to enable end-to-end QoS across access, metro, and core networks, and they can swiftly develop enhanced multimedia services on their own or in conjunction with third-party application vendors. Cable operators can protect their investments in network infrastructure by policing traffic flows and ensuring they charge for the volume and time of consumed network resources. The PacketCable Multimedia specification allows broadband network operators to deploy enhanced IP services with the QoS control necessary to increase revenues and profits.
ABOUT THE AUTHOR
Gerry White is Senior Director of Advanced Technology for Motorola Broadband’s Network Infrastructure Solutions business and he has presented at NCTA several times. He is an experienced author and presenter, and has written papers and articles for many of the leading trade shows, industry exhibitions, and trade publications. Previously, he was CTO of RiverDelta Networks, a provider of next-generation edge routing/CMTS solutions. He also served as Vice President and CTO of Arris Interactive, a leading provider of voice and data equipment within the CATV market. While at Arris, and its predecessor LanCity, White assumed a leading role in the industry's efforts to define, develop, and deploy standards-based voice and data technology. Prior to LanCity, White held a number of senior technical positions at Concord Communications, Wang Laboratories, Hasler Ltd, and Cable and Wireless. White is the co-author of several patents and articles on data communications technology. He holds a BSc. (Honors) from University College in London.

DISTRIBUTED RESOURCE MANAGEMENT FOR ON DEMAND SERVICES Bruce Thompson Cisco Systems Inc
Abstract Today’s video-on-demand (VoD) systems are centralized in many respects – resource management, session management, and storage. However, there are many benefits from distributed architectures for some or all of the above. Many of the lessons that have been learned from widespread deployments of VoIP and other content-based networks can be applied to VoD networks. Today’s video servers in many cases actually perform several logical functions, including session based resource management, storage, video streaming, etc. Separating, at least at a logical level, many of these components can provide significant benefits in terms of scalability, cost, and performance. One candidate for breaking out from the components that actually store and stream the video is session and resource management. And beyond simply breaking out the different logical functions from each other, each individual function can be also done in either a centralized or distributed way themselves. It’s the “all knowing database in the sky and dumb edge boxes” vs. “smarter edge devices that manage their own capabilities” debate that has raged on for years in networking, most recently manifesting itself in the VoIP debates. To enable distributed resource management, network components responsible for allocating different classes of session-based resources can be separated from the session and resource manager. A component called the session manager is then responsible for determining the classes of resources required for a session request and communicating with the resource
managers responsible for allocating those resources. There are two predominate schools of thought on how the session manager interacts with resource managers. The first has the session manager responsible for the final decision on all resources. This model is a logical outgrowth of session resource management vendors who currently implement both session and resource management in the same node. In this model, the session manager would receive a session setup request, and then send individual messages to various resource managers to ask for the potential resources that are available for that session. Then having all of the information locally in one place, the session manager decides which resources should be used for that session. This model is similar to the centralized call manager model used in some VoIP networks. Alternatively, session resource allocation can be distributed in more of a flow-through. In this model, the session manager would receive a session setup request, determine the classes of resources needed for the session and then let the resource managers themselves determine the actual resources to be allocated for the session. Instead of the session manager communicating directly with each resource manager, it embeds a list of resource managers that must be used into a resource request and sends the resource request to the first resource manager on the list. Resource managers then communicate with each other to determine the optimal set of resources for the session. This threaded model of signaling, takes advantage of the concept of a signaling proxy which is common in Internet protocols such as HTTP, RTSP, SIP, and others. Internet deployments

of signaling proxies have shown that they are very adaptable to changes in services and that they scale to very large networks since functionality is distributed. This paper will go into detail on the pros and cons of distributed versus centralized control architectures for session and resources management. It will cover specific call flow examples, processing requirements, scalability concerns, and where possible real world examples of how this has been done in existing networks today. OVERALL FUNCTIONAL BREAK DOWN The DSM-CC defines a general architectural model and signaling protocol for client server applications. One of the architectural components the DSM-CC specification defines is the session and resource manager (SRM). The SRM is responsible for allocating resources for sessions between a client and a server. To enable distributed resource management, the function of the SRM can be broken into a component that is responsible for session management (the session manager) and multiple components called resource managers. In this architecture, each resource manager is responsible for allocating a class of resources for a portion of the video topology. For example, a resource manager called the edge resource manager is responsible for
allocating QAM resources for a population of set-top boxes connected to the HFC plant. Another resource manager called the encryption resource manager is responsible for allocating real time encryption resources for a population of set-top boxes. The on demand resource manager is responsible for determining the best video server to use for streaming a particular asset to a set –top box. The session manager provides the interface between DSM-CC session components and resource allocation components. In the session space, the session manager interfaces to the on demand client running on a set-top box and to service application which is typically bundled in the VoD server. In the DSM-CC architectural model, the session manager appears as the DSM-CC SRM, the on demand client appears as the DSM-CC client, and the service application appears as the DSM-CC server. The on demand client initiates session requests on behalf of subscribers and receives tuning information as the result of those requests. The service application implements service and business logic. It uses the service and business logic to specify the classes of resources required for a particular session. The session manager takes the classes of resources specified by the service application and interfaces with the resource managers to obtain the resources required for the session. Figure 1 illustrates the classes of components used to implement distributed resource management for on demand services.

SessionManager
StreamingServer
On DemandResourceManager
DSM-CC SRM
EdgeResourceManager
EncryptionResource Manager
QAMEncryptionEngine
ServiceApplication
DSM-CC ClientDSM-CC Server
On DemandClient
Session Components
Resource Components
Data Plane ComponentsFigure 1: Distributed resource management
components Session & Resource Management Functional Break Down
There are 3 major functions that need to be implemented as part of session and resource management for on demand services. They are: 1. Business Logic
Business logic is used to tie business rules to a particular service and to a particular session/resource request. Rules associated with business logic can be translated into parameters of a resource request. For example, resource requests for a pay per view service may have a higher priority associated with them than resource requests for a free on demand service. This priority can be carried as a parameter within a resource request. Rules associated with business logic can also be used to determine which resource managers should be used for a particular session request. 2. Video topology routing
The HFC network that set-top boxes and edge devices are connected to is divided into
multiple broadcast segments that are combined with RF splitters and combiners. In the resulting network, the combination of the RF segment that an edge device is connected to and the RFC frequency that the edge device uses as a carrier define which set- top boxes can be reached by that edge device. Resources allocated for on demand session requests generated by set-top boxes must take into account the connectivity of the HFC network. In addition, the IP transport network may not be fully connected or may have paths between components that are not suitable for carrying video. HFC and IP network connectivity will affect the selection of edge resources and may also affect the selection of encryption and streaming server resources. The session and resource management architecture must take the HFC and IP network topology into account when determining which resource managers as well as which resources should be used for a particular session. 3. Resource Allocation
Once the classes of resources required for a particular session are known and a set of resource managers are chosen to allocate those resources, the actual resources to be used for a session need to be chosen. The resources selected for a particular session need be optimized to take into account individual resource availability as well as the connectivity/availability of bandwidth in both the HFC and IP networks In both of the resource allocation architectures described in this paper, the session manager implements both business logic and video topology routing. The difference between the architectures is in how the actual resources to be used for the session are negotiated between the session

manager and the resource managers the session manager has selected for the session. The paper will also briefly describe a method by which the tables used for video topology routing can be populated dynamically using protocols similar to those used to implement dynamic routing in IP networks. Centralized Resource Allocation In centralized model for resource allocation, the logic for deciding which resources should be used for a particular session is homed on the session manager. In this architecture, the resource managers themselves simply report available resources to the session manager while the session manager looks at all resources from the resource managers and decides which resources should be allocated for a session. With centralized resource allocation, all resource requests for a session originate from
the session manager. The session manager sends a resource request message to each resource manager. Each resource manager then responds with a list of potential resources (QAMs, Encryption Engines, etc.) that may be used for the session. The IP transport address of each potential resource is included in the response. Based on the responses, the session manager picks a set of resources to be used for the session. In order to make an optimal choice of resources, the session manager should take connectivity and available bandwidth in the IP network into account as part of the algorithm for selecting the resources to use for the session. Once the session manager has picked a set of resources to use for the session, it informs each resource manager which resource was selected for the session. This second message exchange is also required to exchange IP transport addresses between data plane components selected for the session. Figure 2 illustrates the resource signaling flow for centralized resource allocation.
QAM
SessionManager
StreamingServer
On DemandResourceManager
EncryptionResource Manager
EdgeResourceManager
EncryptionEngine
Resource Request (1)
Resource Response (2)
Resource
Request (1)
Resource
Response (2)
Resource Select (3)
Select Response (4)
Resource
Select (3)SelectR
esponse (4)
Resou
rce R
eque
st (1
)
Reso
urce
Res
pons
e (4)
Reso
urce
Fixu
p(5
)
Sele
ct R
espo
nse
(8)
Figure 2: Signaling flow for centralized resource allocation

Pros and Cons of Centralized Resource Allocation Since the session manager makes the final decision for resource selection, the centralized resource allocation architecture provides the most flexibility in making tradeoffs between between business logic and resource allocation logic. While centralized resource management allows flexibility, there are a number of limitations associated with it. With centralized resource allocation, the session manager must implement all of the logic of resource allocation. In addition, it must coordinate all of the individual resource allocation transactions between each resource manager. Because of this, the session manager becomes the most complex component of the system to build. Also, since most of the per session processing falls on the session manager, it will be the performance bottleneck of the system. With centralized resource allocation, both session and resource state are shared between the session manager and resource managers. The amount of state that is shared between components complicates fail over and redundancy methods for the session manager and resource managers. When either the session manager or a resource manager fails over to a redundant system, both session and resource state must be resynchronized between the session manager and resource managers. Since the session manager must coordinate transactions between multiple resource managers, the process of cleaning up after failed resource requests can be quite
complex. If any request fails, it must abort all resource requests that have successfully completed along with all outstanding resource requests for that session. This greatly increases the complexity of the implementation of the session manager and may lead to software errors where the resources of sessions that have failed end up getting “orphaned”. Orphaned resources must be cleaned up by either rebooting the entire system or by running special processes that check for resource consistency between the components of the system. There are a large number of messages that must be exchanged between the session manager and resource managers in order to allocate resource for a session. At least 2 message exchanges (4 messages) are required between the session manager and each resource manager to allocate resources for a session. The first message exchange is needed to obtain the potential resources from each resource manager while the second message exchange specifies the selected resource and also provides IP transport address information for the data plane components to be used for the session. Distributed Resource Allocation The distribution of functionality and as well as the signaling model used for distributed resource allocation is similar to the model used for the Web as well as streaming and interactive audio and video services on the Internet. With distributed resource management, the session manager directs the resource managers to communicate between themselves to select the optimal set of resources to use for the session. Delegating

resource allocation to the resource managers off loads this function from the session manager and results in a more even distribution of functionality/processing load between the session manager and resource managers. Each resource manager appears as a signaling proxy in the signaling model used for distributed resource allocation. Each resource manager examines the parameters of an incoming resource allocation request and allocates resources based on the set of parameters it understands. Each resource manager then modifies the parameters of the request based on the resources that were allocated. Finally, each resource manager passes the request to the next resource manager based on a list of resource manager addresses that the session manager embeds in the initial resource allocation request. The proxy signaling model enables resource managers to efficiently negotiate the optimal set of resources to be used for a session using a minimal number of message exchanges.
The session manager includes an ordered list of resource managers to be contacted for a particular session in the initial resource request. The session manager determines the order that resource managers must be contacted based on the order that the MPEG stream must flow through the data plane components that each resource manager controls. The order that resource managers must be contacted is opposite of the order that the MPEG stream flows through the data plane components. For example, the MPEG stream associated with a VoD session that requires encryption will originate from a streaming server and pass through an encryption engine on the way to an edge device. The resource managers associated with these data plane components are the on demand resource manager, encryption resource manager, and edge resource manager. Because the video stream originates from the streaming server, its associated resource manager (the on demand resource manager) must be contacted last. Likewise,
QAM
SessionManager
StreamingServer
On DemandResourceManager
EncryptionResource Manager
EdgeResourceManager
EncryptionEngine
Setup (1)
Setup (2)
Setup (3)
Setup Response (4)
Setup Response (5)
Setup Response (6)
Network Resource Monitor
J1
J2
J3
J4 J5
Figure 3: Signaling with distributed resource allocation

since the edge device is the last component that the video stream passes through, its associated resource manager (the edge resource manager) must be contacted first. This ordering results in resource managers whose data plane components are adjacent being able to exchange IP transport parameters needed for the MPEG media stream very efficiently. IP transport network resources are also allocated in a distributed fashion. With distributed resource allocation, network resource allocation is broken into two logical functions. They are: network resource monitoring and network resource allocation. Network resource monitoring is a function that provides information on the available network bandwidth between data plane components while network resource allocation reserves network bandwidth between data plane components. The threaded architecture implements the network resource monitoring function in a component called the network resource monitor and implements network resource allocation in the IP transport network itself. RTSP can be used as the resource allocation protocol used between the session manager and the resource managers. RTSP is well suited for use in this architecture since RTSP was designed to support proxies as part of the signaling architecture. Figure 3 shows the order of signaling flow for distributed resource allocation using RTSP as the signaling protocol. In Figure 3, interfaces J1, J2, and J3 are interfaces the resource managers use to request information on available network bandwidth from the network resource monitor. Interfaces J3 and J4 are used to request resources from the transport network.
RTSP enables each resource manager to implement a 2 stage reserve/commit process for allocating resources. Figure 3 will be used to illustrate the 2 stage process. The first stage of the resource allocation process is triggered by a resource manager receiving an incoming RTSP setup(1) request from its down stream neighbor. The resource manager examines the parameters of the RTSP setup message it received to determine which resources it needs to allocate for the session. In Figure 3, when the RTSP setup(1) message is received by the edge resource manager, it allocates resources from one or more QAMs that can be used to service the session. Once the resource manager reserves resources it passes the data plane transport parameters associated with the resources it reserved to the next resource manager in an RTSP setup(2) message. The next resource manager in the chain allocates its resources based on the parameters of the RTSP setup(2) request. The resource manager may check to see if transport bandwidth is available between the potential data plane components it has selected and the data plane transport parameters it received in the RTSP setup message from its down stream neighbor. This check can be used to trim the list of resources that are reserved. In Figure 3, the encryption resource manager reserves resources associated with one or more encryption engines when it receives the incoming setup(2) message from the edge resource manager. The encryption resource manager may check to see if there is available network bandwidth between the rncryption rngines it has selected and the transport addresses it received from the edge resource manager in the setup(2) request.

Once the resource managers have reserved resources in response to the RTSP setup message, the resource commit process starts. The last resource manager in the thread commits a specific resource to be used for the session. This resource manager then requests the transport network to reserve network bandwidth between itself and its down stream neighbor and passes the data plane transport parameters for the chosen resource in the RTSP setup response(4). In Figure 3, the on demand resource manager picks a specific streaming server and output port to use for the session. The on demand resource manager passes the source IP address / port number that was selected for the session in the RTSP setup response(4). As the RTSP setup response is passed back through the thread, each resource manager examines the resources that were committed by its up stream neighbor. It uses this information to commit its own resource. In the process of committing its own resource, each resource manager requests the transport network to reserve network bandwidth between itself and its down stream neighbor and passes the data plane transport parameters for the chosen resource in the RTSP setup response. In Figure 3, the edge resource manager commits a single QAM resource when it receives the RTSP setup response(5). It passes the HFC parameters such as the modulation frequency and MPEG program ID back to the session manager in the RSTP setup response(6). Distributed IP Network Resource Allocation With distributed resource allocation, each resource manager takes IP transport network resources into account as part of the decision of which resource will be used for a session. Each resource manager may use the services of a component called the network resource monitor to determine which components/
resources to choose for a particular resource request based on available network bandwidth to downstream components already selected for that session. The network resource monitor (NRM) contains a map of the IP transport network topology and the amount of available bandwidth on every IP transport link in the VoD topology. The NRM is implemented as an internal routing protocol (IRP) listener (OSPF, ISIS, etc) and knows how much network bandwidth is currently available between any 2 IP endpoints. To allow the NRM to understand bandwidth availability, the IRP must include bandwidth availability as part of the link state attributes that are flooded. To obtain available bandwidth information on each link, the IRP must interface to the Network Resource Allocation subsystem in each router. With distributed resource allocation, IP transport network bandwidth is allocated by the routers in the IP transport network themselves. IP networks have traditionally used a distributed approach to both path selection (IP routing protocols) and managing network bandwidth (RSVP). Distributed resource allocation uses a combination of RSVP in the control plane and the DiffServ architecture in the data plane to allocate bandwidth and minimize jitter and latency for MPEG video in the IP transport network. RSVP messages are passed between the data plane components responsible for originating and terminating the MPEG video stream. The components from Figure 3 that originate/terminate RSVP requests are the streaming server, encryption engine, and edge device. RSVP messages pass through the routers of the transport network along the same path as the MPEG video stream. As

RSVP messages pass through the transport network, they are examined by every router along the path. When a router receives an RSVP request message, it first looks up the outbound interface that the packet will be routed to and then checks to see if that interface and its associated transport link have enough bandwidth to service the request. If it does, available bandwidth for that interface is decremented and the RSVP message is forwarded to the next router along the path. If any router along the path does not have enough bandwidth to service an RSVP request, the router fails the request and the message is returned along the same path that it was originated from, tearing down existing state long the way. When RSVP and DiffServ are used together in the network, RSVP is used to provide admission control functionality while DiffServ provides the per packet scheduling characteristics required for MPEG video. RSVP works together with DiffServ at the edge of the network to ensure that MPEG video flows admitted by RSVP are marked with the proper DSCP value to ensure proper QoS treatment through the rest of the network. Pros and Cons of Distributed Resource Allocation Distributed resource allocation resolves many of the issues associated with centralized resource allocation. Many of the performance issues and complexities associated with the session manager in centralized resource allocation are dealt with by moving the function selecting an optimal resource set of resources for an on demand session to the resource managers themselves. With distributed resource allocation, the session manager simply creates a list of resource managers
that need to be involved in the session and forwards a resource allocation request to the first resource manager in the list. The rest of the resource management processing is done by the resource management components specified in the list. This distributed model of signaling and synchronization more evenly distributes the processing load between the session manager and the resource managers involved in a session. Since the resource managers negotiate and communicate allocated resource information between them selves, the only state that is shared between the resource managers and the session manager is active session information. This simplifies failure / recovery mechanisms for the session manager and resource managers since the session manager and resource managers only need to have a consistent view of active session state. With distributed resource allocation, the ordering of resource requests greatly simplifies error processing when a request fails for any reason. When a resource request to a resource manager fails for any reason, it responds with an error to the resource manager that sent the request. Each resource manager then de-allocates the resources it allocated on the resource allocation request and forwards the error to its neighbor. This synchronous behavior greatly simplifies error processing logic. With distributed resource allocation, a single resource allocation protocol is used between the session manager and the resource managers. This allows each resource manager to be implemented using the same resource signaling state machine. It also enables new classes of resource managers can be added without having to modify any of the existing resource managers or the signaling state machine of the session manager.

The signaling model used for distributed resource allocation uses a minimal number of message exchanges to allocate resources for a session. This is because the proxy signaling mdoel used for distributed resource allocation only exchanges messages between the components that must exchange information in order to set up the session. Most of the information that needs to be exchanged in order to setup a session needs to be exchanged between data plane components that are adjacent in the flow of the media stream. .For example, to set up the media stream between an encryption engine and an edge device, the edge and encryption resource managers must exchange the IP source and destination addresses along with the UDP port numbers to be used for the session. The proxy signaling model uses a single message exchange between adjacent components to exchange transport information. With centralized resource allocation, 2 message exchanges are required. Dynamic Routing of Video Sessions When resource management functionality is distributed to multiple resource managers, each resource manager is responsible for allocating a class of resources for a portion of the video topology. One of the functions of the session manager that is common to both the centralized and distributed resource allocation models is the ability for the session manager to select a set of resource managers to use for aparticular session based on the constraints of the HFC and IP topologies. This function is called video topology routing. This section describes a method by which the tables used for video topology routing can be populated dynamically using protocols similar to those used to implement dynamic routing in IP networks. Using a
dynamic method for populating video routing tables allows the session manager to re route video sessions when resource managers fail or when new resource managers are added to a system. It also allows the session manager to choose the best set of resource managers to use for a particular session based on both static and dynamic cost metrics associated with individual resource managers. When a DSM-CC session request is sent from an on demand client to the session manager, it typically includes 1 or more identifiers that can be used by the session manager to determine where the clients Set Top is located in the HFC plant. The identifier may be statically provisioned in or it may be dynamically learned. One method to enable a set-top box to obtain topology identifiers dynamically is to configure each QAM with a unique identifier and then have the QAM send that identifier in the MPEG-2 transport stream it generates. The TSID field in the MPEG-2 transport stream is commonly used for this purpose. To obtain these identifiers, a set-top box periodically tunes to a set of pre defined “beacon” channels and stores the TSID information it receives on those channels. When multiple QAMs are fed into an RF combining network, their RF output is broadcast to all of the set-top boxes connected to the same RF network. The combination of QAMs and set-top boxes that can be reached in this RF network is typically referred to as a serving group or serving area. edge resource managers manage QAM resources for one or more serving groups. When an on demand client sends a DSM-CC session request to the session manager, it includes the list of TSIDs it has learned in the session request. When the session manager receives the session request, it must map the TSID information it receives in the session

request to the IP address(s) of one or more edge resource managers that can be used to service this request. The protocol described in this section enables the session manager to build a map that translates a set of TSIDs to the HFC serving group and the IP addresses of one or more resource managers responsible for allocating resources of that HFC serving group. This protocol is called the service registration protocol. In addition to providing topological information, the service registration protocol can be used to provide other operational information about QAMs or other video nodes such as encryption engine. For example, the service registration protocol should be capable of providing information about the capabilities of an encryption engine. Another important requirement for the service registration protocol is to support the ability to detect the failure of an QAM or an encryption engine in a timely manner. This capability will allow the session manager to reroute video streams from a failed QAM or encryption engine to QAMs or encryption engines that are still operational. It will also allow the SM to route new video streams to the EQAMs/encryption engines that are still operational. Finally, when more than one resource manager has resources capable of satisfying a session request, the service registration protocol can provide a static administrative cost associated with that resource manager as well as a dynamically updated cost that can be used to reflect information such as the amount of resources currently available from the resource manager.
RFC 3219[7] (TRIP) is an IETF protocol that deals with the problem of translating telephone numbers into the session signaling address of a telephony gateway that can be used to reach that telephone number. While TRIP was originally developed for telephony services, a subset of the protocol can be used to dynamically populate the tables the session manager uses to perform video topology routing. TRIP allows a telephony gateway to advertise the telephone numbers it serves along with its session signaling protocol address to other telephony gateways. A telephony gateway that sends TRIP advertisements is called a TRIP speaker and a telephony gateway that receives TRIP advertisements is called a TRIP listener. When TRIP is used distributed resource management, edge resource managers act as TRIP speakers and the session manager acts as a TRIP listener. Edge resource managers advertise the TSIDs and serving groups of the QAMs they manage as well as their IP address. The session manager uses this information to develop a the video topology routing map. When TRIP is used with other types of resource managers such as the encryption resource manager it will be used to advertise the IP address of the resource manager along with other properties such as the conditional access protocols supported by the encryption engines. Since data plane components such as encryption engines may not be directly connected to the HFC network, TRIP can be used to advertise an administrative cost to the different HFC serving groups that can be

reached by that component. Figure 4 illustrates the role of in a distributed resource management environment.
SessionManager
StreamingServer
OnDemandClient
TRIP
TRIPListener
TRIPSpeaker
TRIPSpeaker
EncryptionResource Manager
EdgeResourceManager
EdgeDevice
EncryptionEngine
TRIPTRIP
Figure 4: Role of TRIP in distributed resource management
SUMMARY
This paper described a few alternative methods for implementing distributed resource management in for On Demand Services. It described a model for breaking the Session and Resource Manager (SRM) used in current On Demand architectures into components responsible for session management and resource management.
Two alternative architectures for implementing distributed resource allocation were presented. In the centralized resource allocation model, the Session Manager is responsible for coordinating resource allocation between the resource managers selected for a particular session request. In the distributed resource management model, the the function of selecting an optimal set of resource for a particular session is distributed to the resource managers themselves. While the centralized resource allocation model is a natural fallout from existing SRM implementations, the distributed resource allocation model allows the implementation of the Session Manager to be greatly simplified and allows the network to scale by using protocols and architectural methods that have been widely deployed in the Internet. Finally, the application of a telephony routing protocol (TRIP) for distributed resource management in On Demand networks is described. The use of dynamic protocols such as TRIP in On Demand networks will allow these networks to scale as On Demand services become more popular.

DOCSIS SET-TOP GATEWAY (DSG): NEXT GENERATION DIGITAL VIDEO OUT-OF-BAND TRANSPORT
Sanjay Dhar
Cisco Systems, Inc
Abstract The cable industry has found a perfect weapon to create a sustainable competitive advantage against satellite operators and converge services over a common, standards-based network. Offering value-added services such as on-demand video and gaming creates much needed differentiation that satellite technology cannot offer. Due to the success of its high-speed Internet business, cable operators have built the largest IP networks ever assembled using DOCSIS technology. The industry is looking to extend the power of their DOCSIS data networks to the digital video part of their business. The current video network is based on a costly, proprietary architecture that does not scale to efficiently or cost-effectively support high-bandwidth, interactive services. It is essential that cable operators evolve their digital video networks to a high-bandwidth converged architecture that leverages prior investments in HFC cable plants and enables the video side of operations to benefit from open standards. DOCSIS Set-Top Gateway (DSG) technology promises a major step towards a converged data, voice, video network. DSG enables standardization of set-top technology and offers the potential to reduce set-top box (STB) costs by half. While Korea leads in the adoption of this technology, major U.S. MSOs are examining the technology and making plans to deploy DSG later this year. This paper covers constraints of the traditional digital video network transport architecture and discusses benefits to migrate to a next generation DSG-based network.
CURRENT CABLE NETWORK
Cable operators today maintain at least two distinct networks: one for standards-based
DOCSIS data IP services and a separate, proprietary digital video network.
Figure1: Current Cable Network Given investments made on the video network side for U.S cable operators, the migration to a standards-based, next generation architecture is expected to occur in phases. As shown in Figure 2, the three main aspects of the video architecture are the video services/application plane at the top that comprise the video application level supporting the infrastructure; i.e., application servers, broadcast video, VoD servers, conditional access servers (CAS), and billing. The middle level comprises the control plane that involves sending control messages such as entitlements, STB provisioning, control session and resource management, system information and program guide information to the STB. These control messages are UDP/IP encapsulated. The lowest level in the architecture is the network transport plane that carries video traffic and control messaging. The network architecture consists of separate transport for the video transport and messaging plane.
Cable Modem (CM)
PC
Set-Top Box (STB)
THF
DIGITAL VIDEO NETWORK
DATA NETWORK

Figure 2: Digital Video Network Architecture The video transport backbone is migrating from a point-to-point DVS-ASI network that has limited scalability to a switched Gigabit Ethernet backbone to a routed IP network from video servers up to the edge modulator. A future phase of video transport involves migrating to a converged data/video infrastructure. The control plane represents the next immediate logical point to migrate to a converged network. The legacy video messaging control transport is referred to as out-of-band (OOB) since this class of messaging is transported outside of the main video transport. Legacy Video Network Architecture At the core of the traditional digital video architecture is proprietary technology between the STB and the headend network architecture. Due to this proprietary technology, introducing innovations on the network side and in the STB have been slow. The network architecture can not be changed without changing the STB technology and vice versa. That has locked cable operators into older video architectures, hampered the introduction of high-bandwidth, interactive services and kept equipment and maintenance costs high.
Out-Of-Band (OOB) Transport Traditional STB technology relies on the use of a dedicated channel to transmit control messaging from the headend to each STB. Conditional access (CA), system information (SI), electronic program guide (EPG), emergency alert system (EAS) and other STB command and control messages are sent via a downstream RF channel that is separate from the channels actually being watched. A low-bandwidth upstream reverse channel is used for interactive messaging. The OOB carriers require separate, proprietary headend equipment such as out-of-band modulators and return path demodulators. The OOB channel is typically located in a reserved portion of the downstream HFC spectrum at 75.25 MHz and uses quaternary-phase-shift-keying (QPSK) modulation with 1.8 MHz of RF bandwidth. An OOB gateway in the headend system receives the content for the OOB channel over an IP/Ethernet connection from an application server, terminates the IP/Ethernet connection, and converts the content to ATM or MPEG-TS frames before passing the content down the OOB channel to the STB. Most of the signaling messages from the application server are fed through another software program called a carousel and broadcasted on the OOB channel. The carousel periodically sends out the messages from each application in sequence. The return path in such a system is typically operated through a polling mechanism over the OOB.
Video Services / Applications
Video Content MPEG-2
OOB (EMM/EPG/SI)
Video Transport DVB-ASI
OOB Transport (MPEG-TS/ATM)

The upstream is a low-bandwidth transport used to poll STBs for pay-per-view subscription information. The combination of the OOB downstream and the upstream return path resembles a first generation DOCSIS system. The OOB data is essentially broadcasted to all STBs in the legacy network path with the application level filtering the data that belongs to the STB. All data, regardless if it is Broadcast, Multicast or Unicast in nature, is broadcasted. This results in inefficient use of network bandwidth.
NEXT GENERATION VIDEO ARCHITECTURE As part of the CableLabs® OpenCableTM initiative, a number of vendors and cable operators have been working to specify an open architecture for cable headend equipment, application servers, and digital cable STBs. OpenCable, the standards organization laying the groundwork for traditional digital TV and new interactive video services, has developed the DOCSIS Set-Top Gateway (DSG) Interface Specification. This specification defines interface requirements for transport of out-of-band (OOB) messaging between a set-top network controller, application servers, and customer premises equipment such as residential gateways and STBs.
PC
ISP
Set-Top Box (STB)
TV
Figure 3: Legacy Digital Video Network Architecture
Video Servers/
EPG
CAS STB Controller
Internet
HFC
Cable Modem
Headend Facility D-Hub/Headend
Video QAM
OOB Mod/Dem
Mgmt Systems
CMTS
Video Servers/
EPG

The DSG specification moves away from proprietary OOB transport to widespread, IP-based technology, while at the same time, preserving the current control plane messaging. The control information is carried on an “always-on”channel that is separate from the video delivery channel. DSG is typically implemented on a CMTS which is the edge device facing the HFC network. DSG Benefits The first key benefit that DSG offers is that it provides a robust transport path over DOCSIS. DSG delivers OOB messaging in one-way plants. DSG provides downstream transport for OOB even in the presence of reverse channel impairments. In two-way plants, DSG continues to deliver OOB messaging even in case of reverse channel impairments, which otherwise would not be
possible with plain DOCSIS-based STBs. The second key benefit that DSG offers is that it allows cable operators to leverage DOCSIS networks and efficiently support new STB implementations. DSG consolidates control traffic from the video network onto the DOCSIS network, thereby reducing operational costs. OOB traffic can be sent using DSG over a dedicated downstream RF channel or piggy-backed on an existing channel used for high speed data. Analysis shows that consolidating OOB traffic with high speed data yields maximum cost savings. The third key benefit that DSG offers is higher downstream and upstream bandwidth that accelerates rollout of new interactive video services. This in turn leads to higher cable operator revenues. A DSG-interoperable STB with an embedded modem
Figure 4: Next Generation Digital Video Network Architecture
Routed IP Network
ISP
STB with CM
TV
HFC
PC CM
CAS STB
Controller
VideoQAM
Headend Facility D-Hub/Headend
CMTS
HFC Plant
Video Servers/
EPG

makes use of the higher DOCSIS bandwidth to transport interactive on-demand traffic such as VoD requests, and gaming. Delivering IP Multicast or Unicast OOB to Set-Top Boxes Efficiently DSG allows integration of OOB traffic that is sent via IP Multicast or IP Unicast from application servers on the network side to be delivered on a one-way HFC downstream to STBs. Although a STB may have an IP address, DSG acts as a proxy device to facilitate delivery of IP/UDP OOB traffic to the STB. In case of Multicast traffic, DSG maps the incoming traffic on a particular Multicast Class D address to a DSG tunnel that is characterized by a well-known MAC address. This MAC address is unique per CAS vendor and is either embedded on the STB SmartCard or OpenCable Point-of-Deployment (POD) module, enabling the STB to listen on the right tunnel. Alternatively, MAC addresses are dynamically passed on to the STB by the DSG client as defined in the DSG advanced mode specification. The DSG advanced mode specification is part of the next revision of the CableLabs DSG specification. Most of the OOB data, being Multicast in nature, requires DSG to support Multicast on the network interface and efficiently delivers data to a specific set of STBs. Since STBs are required to operate in a one-way mode, STBs can not make IGMP JOIN requests. DSG acts as a proxy Multicast host and creates a static IGMP JOIN of cable interfaces. To ensure only authorized application servers are allowed to send OOB to the STBs, Source Specific Multicast can be used.
SUMMARY
DSG not only offers cable operators cost savings from consolidation of OOB video and HSD networks, but it opens up a number of opportunities to generate additional revenue streams from rollout of high bandwidth-intensive services. DSG provides digital video networks a gateway to sustained innovations of DOCSIS, including advanced capabilities in spectrum monitoring, analysis, and network management. DOCSIS is the standard of compliance and fundamental approach adopted worldwide to enable IP data, voice, and video services on an HFC network. OpenCable and DSG pave the way for similar advancements in video. Using DSG, cable operators can overlay operation of legacy STB technology and migrate to open-standards-based STBs. Cable operators can leverage their HFC infrastructure and DOCSIS CMTSs to consolidate cable modem and STB data traffic on a shared DOCSIS channel. Korea is spearheading deployment of DSG. One of the main reasons Korea is leading in adoption of DSG is due to the greenfield cable video market and absence of legacy systems. The Korea Digital Cable Forum, along with TTA—the regulatory organization in Korea, announced DSG adoption last year. Broadband Systems Inc, a subsidiary of Powercomm Korea is the first digital video provider to deploy DSG. Using DSG, BSI hopes to lead in deploying high bandwidth interactive services like video-on-demand and popular video gaming services. U.S. MSOs are not far behind. They are defining solutions for their legacy networks and plan to evaluate and deploy the technology later this year.

DOCSIS® ACCESS NETWORK CONSIDERATIONS FOR CONVERGED IP SERVICES
Doug Jones
YAS Broadband
Abstract
This paper explores DOCSIS parameters that should be managed when offering multiple services over the access IP network, DOCSIS being defined as the connection between a CM and CMTS. When offering multiple services on a DOCSIS connection, there will be resource contention that needs to be accounted for.
INTRODUCTION Business Case
The cable industry is migrating from proprietary technologies to standard technologies based on the Internet Protocol (IP). DOCSIS is the method for moving IP packets over a Hybrid-Fiber Coax (HFC) network and within DOCSIS, the Cable Modem Termination System (CMTS) arbitrates bandwidth allocation. The IP infrastructure has proven to be both general purpose (supporting many different applications from web and email to VoIP and streaming media) and low cost. IP has stood up in the face of competition from other networking technologies such as AppleTalk and Novell Netware. IP technology just works, is widely deployed and available from multiple suppliers. The first service over DOCSIS was High Speed Internet (HSI). In 2003, several operators began offering telephone service over DOCSIS as well. Trials for a third
service over DOCSIS, the DOCSIS STB Gateway (DSG) are planned for 2004. With DSG, the migration of the video business to the common IP platform is underway. Not only will cost savings be realized by making use of the existing infrastructure, there is more innovation and less operational expense associated with the existing IP infrastructure. These three services (and others that will be offered in the future) have different traffic characteristics and system resource needs that place unique demands on the Cable Modem Termination System (CMTS). Any single service is easily accommodated because the specific demand on the system is more easily monitored. But when multiple services are offered simultaneously, the demands on the system develop more complex interactions. Said simply, Cable is getting to the point where the DOCSIS connection (CM-to-CMTS) should be engineered. This paper will describe several DOCSIS system parameters and resources that could be observed and managed as multiple services are deployed. Specifically with HSI, a system generally ran out of DOCSIS bandwidth before other DOCSIS system resources were exhausted. But when offering multiple services on a single DOCSIS connection, other DOCSIS resources may be exhausted before the total bandwidth of the system. If the DOCSIS network is not managed properly, services

offered over that network may not get the needed service assurance guarantees. Areas of Discussion
This paper will address several types of CMTS resources that may exhaust before the available bandwidth on the system is fully utilized. These are: 1. Bandwidth Resources, specifically just
the raw amount of bandwidth needed to offer services in addition to HSI on the DOCSIS connection.
2. How DOCSIS Quality of Service (QoS) can be used to “carve up” bandwidth for individual services such that bandwidth for a particular service can be exhausted while there is still bandwidth available on the channel.
3. DOCSIS Protocol Resources that could possibly exhaust before bandwidth runs out.
As the DOCSIS connection is used to carry more and different types of services, operators will need to implement systems to better manage the bandwidth and the services delivered to customers over the IP connection.
OVERALL SYSTEM VIEW A Cable IP network view is shown in Figure 1.
CM
Router CMTSCM
CM
IPBackbone
PC
PC
HomeNetwork
DOCSIS
Figure 1 – DOCSIS System
Whereas the DOCSIS protocol by definition exists only between a CMTS and a group of Cable Modems (CMs), the entire Cable IP network extends well beyond the DOCSIS network and includes both the regional and backbone networks. This paper focuses on the DOCSIS connection only.
1. BANDWIDTH RESOURCES Introduction
Bandwidth is a finite resource; the DOCSIS connection is no exception. As the number of subscribers and services increases they all have to share the available bandwidth. Figure 2 shows how bandwidth is allocated in a typical DOCSIS system.
0 %
100 %
100% of bandwidthallocated for HSI service
Tota
l Ban
dwid
th a
vaila
ble
Figure 2 As shown, all of the bandwidth on the CMTS is allocated to HSI. As the number of HSI subscribers is still growing, an operator has to decide how to get additional bandwidth in order to support additional services because adding new services will take bandwidth away from the growing number of HSI subscribers.

Figure 3 shows a hypothetical allocation of bandwidth in a system where more than just HSI service is offered.
0 %
100 %
40% of bandwidth allocatedfor Telephone service
40% of bandwidthallocated for HSI service
20% of bandwidth allocatedfor PCMM services
Tota
l Ban
dwid
th a
vaila
ble
Figure 3 In this example, the 40% of available bandwidth is assigned to HSI service, another 40% to telephone service and the final 20% to new services managed with PacketCable Multimedia. Looking back at Figure 2 where 100% of the bandwidth was available for HSI, either that amount of bandwidth is shrunk to 40% (having an impact on the HSI service) or the total amount of bandwidth available on the system is increased by 250% such that 40% of that new bandwidth is equal to the bandwidth assigned to HSI on the old system. These figures illustrate that as additional services to the DOCSIS connection, it may be necessary to add additional bandwidth. Adding additional bandwidth can be done several ways, including:
• Splitting nodes • Adding additional upstream and
downstream channels to nodes • Migrating to DOCSIS 2.0 for a higher
speed return path
• Migration to 256 QAM for a higher speed forward channel.
The choice should be made to fit the business needs of the services.
2. DOCSIS QOS RESOURCES Introduction
It is a fairly common experience to be on a network that is perceived to operate slowly. This is the result of having too much traffic and too little bandwidth which can happen on any network. There are technologies that allow premium services to receive premium service even when the network is congested. These technologies are broadly known as Quality of Service (QoS). DOCSIS 1.0 provides tools to prioritize traffic from particular CMs; however, these tools are not widely used. These tools provide only prioritization, not a guarantee of a certain amount of bandwidth. This is one reason why primary line voice deployment had to wait for DOCSIS 1.1 which included the tools necessary to offer a guaranteed experience for a service such as voice. DOCSIS 1.1 tools can guarantee a level of service for voice traffic (or any type of traffic) on the HFC connection. But QoS is not a panacea. On any network connection there is a finite amount of bandwidth and it is not possible to guarantee service for all comers. This is similar to having too many cars in a High Occupancy Vehicle (HOV) lane of a highway. The HOV lane has a finite capacity but as more cars enter it, it too begins to slow down.

Much like an HOV lane can slow down, if DOCSIS QoS is overused the channel can still congest and the customer may no longer be receiving the service guarantee needed for a pleasing experience. QoS can be used to ensure certain services get a service guarantee on a congested channel, but that only means another service on that channel may get less bandwidth. Figure 4 shows a DOCSIS connection that is allocated solely for HSI service. As is the business today, HSI subscribers are continually added to this channel until the available bandwidth on the channel no longer allows subscribers to receive their expected grade of service.
HSI
Figure 4 Similarly, Figure 5 show how QoS can be used to “carve up” the large pipe into a larger number of virtual pipes dedicated to individual services. The individual services can be constrained to the size of the virtual pipe even though there may still be available bandwidth on the channel. In this particular example, the HSI service is left to use whatever bandwidth is available on the connection.
The DOCSIS QoS rules are very flexible allowing the operator many configuration options. But QoS will not create bandwidth out of nothing; QoS only allocates bandwidth that already exists. The available DOCSIS bandwidth needs to be managed to ensure all services, from telephony to simple web surfing meet service guarantees. The availability of QoS technology in DOCSIS is necessary but not sufficient to ensure all services will receive service guarantees.
VoIP
PCMMOn-linegames
HSI
Figure 5 DOCSIS QoS Services
DOCSIS 1.0 is what started HSI and provides prioritized best-effort service with bandwidth limits. Bandwidth limits come into play when there is more available bandwidth on the system than traffic. When this occurs, a particular CM will be throttled to its bandwidth limits. As more and more users are added to a channel and the DOCSIS bandwidth becomes fully utilized, the CMTS will be fair to all users and it is possible that individual CMs will not be able to send and receive data at their limits. For DOCSIS, it is the CMTS that decides which CMs get to transmit and which will have to drop packets. There are many algorithms designed to drop

packets according to either fairness or business policy that can be implemented on a CMTS. The DOCSIS connection gracefully tolerates overload. HSI services such as email and web are tolerant to packet loss, unlike digital video or voice. In the case of email and web, if a packet gets dropped there are “higher layer protocols,” such as TCP, that cause the dropped packet to be retransmitted. So while there may be a delay of hundreds of milliseconds, the packet will eventually get through. Many Internet services are designed to be very forgiving and can recover gracefully from packet loss. However, as more services migrate from single purpose networks to IP networks, there may be challenges to meet service guarantees for all services. DOCSIS 1.1 can provide QoS guarantees for bandwidth, latency, and jitter. However, if that DOCSIS connection is oversold, it may not be possible to guarantee the delivery of all services intended to be sent over it, even if those services are assigned QoS. If the DOCSIS 1.1 upstream channel is configured to be 5 Mbps, then only 5 Mbps can be carried. The services guaranteed for delivery over that connection simply cannot total more than 5 Mbps; it’s not possible.
There should be some “wiggle room” on the connection to allow best-effort services such as web and email a chance to get through. These best-effort services can be degraded at certain time in order to meet peak QoS loads; however, users of Best Effort services may notice service degradation. PacketCable™ Multimedia
Whereas DOCSIS provides a QoS toolkit, PacketCable Multimedia (PCMM) provides the tools to manage QoS based on a set of business rules. As shown in Figure 6, PCMM exists as a layer that controls IP network QoS (including DOCSIS) based on information received from operator back-office systems. PCMM supports the deployment of general Multimedia services, online gaming, video-conferencing, streaming media, etc., over DOCSIS. These services can be enhanced by assigning QoS to them as opposed to services such as web browsing, e-mail and instant messaging where customers may tolerate some slowness. Note, even services such as simple web surfing can be enhanced using PCMM; the possibilities are limited only by what the operator chooses to implement.
Transport Plane
Network Policy Plane
Back-office Plane
CMTS MetroNetwork
BackboneNetwork
PacketCable Multimedia / QoS Policy
OSS Billing System Net Mgmt
Figure 6

While telephony or voice-based services are not specifically excluded from PCMM, the PacketCable 1.x specifications provide specific QoS management methods to this type of service. Therefore, those specifications should be consulted as appropriate. PCMM could also be used for voice as the PCMM framework was founded upon the mechanisms defined in PacketCable 1.x. Most importantly, PCMM provides the capabilities to manage the QoS tools available with DOCSIS 1.1 allowing operators to establish business rules for offering QoS on the DOCSIS network. Impact on HSI Service
When services requiring service guarantees (QoS) are offered on the same DOCSIS channel as HSI, tools will be needed to ensure the QoS services do not starve the HSI service of bandwidth. A system such as PCMM can be used to effectively manage the overall bandwidth on the channel especially as operators are offering higher-speed HSI tiers.
3. PROTOCOL RESOURCES Introduction
DOCSIS is a protocol which is a fancy way of saying DOCSIS uses defined formats and parameters to move IP packets across the HFC. Some DOCSIS parameters have finite amounts or ranges. It is possible that a particular parameter may exhaust before the available bandwidth on the system runs out. This situation is expected to be extremely rare if it could happen at all. With HSI service there has not yet been a case where a parameter other than bandwidth has been exhausted.
But DOCSIS is being used for more and more different types of services, with telephony being just one example. The DOCSIS Set-Top Gateway (DSG) effort allows DOCSIS to be used in STBs. PCMM will allow new uses for DOCSIS as well, including on-line games and video conferencing. As the cost of DOCSIS continues to drop, there is also more of a chance for lower bit rate applications such as monitoring and telemetry to come into play. So while it is not clear if a DOCSIS protocol parameter may ever exhaust, it is clear that DOCSIS is being used for more and more applications so it is worth a look at one such parameter that has recently been under discussion by engineers. Service Identifier (SID)
The parameter discussed in this section, the Service Identifier (SID), is an upstream resource that has a defined range; there are only so many SIDs that can be in use at one time. That number is just over 8,000 and is inclusive of all the upstream channels associated with a downstream channel. Therefore with a 1 x 4 CMTS card where there is one downstream and four upstream channels, there can be a combined 8,000 SIDs in use at one time across those four upstream channels. SIDs are associated with a CM and a DOCSIS 1.1 CM can have one or more SIDs assigned to it. DOCSIS 1.0 CMs use only a single SID. The SID can be active regardless of if data is being sent through the CM or not. . With HSI, typically between 2,500 and 4,000 SIDs will be consumed before the system becomes bandwidth limited and the subscriber experience degrades to the point where the operator would consider methods

to offer more bandwidth to those customers, such as splitting the node. But with a combination of lower bandwidth services (such as iTV and telemetry) and high capacity return channels such as DOCSIS 2.0, there is an outside chance that SID depletion could occur before the available bandwidth is depleted. Several factors would play into the situation and while theoretically possible, further study is needed to understand if this situation might actually happen. PCMM Example
PCMM, as well as PacketCable 1.x, contain methods to dynamically assign SIDs to services that need them. For instance when a PacketCable telephone call is placed over DOCSIS, an additional SID will be assigned for the duration of the call. This dynamic mechanism provides a method to ensure that additional SIDs are only used when needed, however, every active CM is consuming at least one SID. Telemetry Example
Telemetry in this usage assumes a persistent but low-bandwidth connection between a CM and CMTS. This connection could be used to signal the setting of a home thermostat or to poll a water meter. Such applications use only a small amount of bandwidth; however, as long as that CM is booted a SID is consumed even if there is no data being sent. Even though these CMs send and receive minuscule amounts of data, they still consume SIDs.
SUMMARY
More and more services are being moved to the common IP infrastructure. Managing the DOCSIS bandwidth will require tools that were not needed when just HSI was being offered. PacketCable Multimedia is a tool to manage that bandwidth based on operator business policies. But offering QoS-based services may require the addition of more overall DOCSIS bandwidth. As counter intuitive as it sounds, as additional low bandwidth services are added to a DOCSIS connection, it is possible that DOCSIS resources other than bandwidth may exhaust before the available bandwidth is exhausted. Author Contact Doug Jones YAS Broadband Ventures 1877 Broadway Boulder, CO 80302 voice: +1 303.415.9400 x303 [email protected]

DVRS—DRIVING THE DVR EXPERIENCE HOME: SOFTWARE AT THE WHEEL
Neil Jones Pioneer Digital Technologies, Inc.
Abstract Perhaps the most powerful TV evolution has been the ability to let viewers take total control of their viewing, particularly in recording whatever they want, whenever they want. It’s called DVR. And software is at the wheel, as set-top value is defined by its ability to support services and applications through its software. This paper will discuss the DVR software solution and the impact it is having on the cable industry and its customers.
Since their introduction, Digital Video Recorders (DVRs) have changed a consumer’s TV viewing experience—from pausing live TV to recording an entire series for playback according to the viewer’s schedule. The time shifting advantage of DVR is what makes it so valuable. Making it easy and convenient for the consumer is what will continue to drive the category and take it to new heights.
DVRs were projected to be what some
experts said would be a “life changing experience” and would drive TV viewers to a new user experience of time shifted programming that included controlling live TV with slow-motion, instant replay, pausing and re-winding, fast-forwarding, and recording from on-screen program guides, and more.
And most importantly, with the user interface software as the engine, DVRs will allow consumers to record and view their favorite programs or series of programs on their own schedules via time-shifting features with a simple click of a button on the remote control.
A life changing experience is probably a stretch, but DVRs are allowing cable subscribers to do what they want with their viewing experiences. And it is user interface software that’s driving DVRs. DVR models are in their infancy, but the stage has been set for DVRs as a valuable feature to cable’s digital offerings.
For example, data from Leichtman Research Group (LRG) reveals that as a cable set-top box feature, DVRs make good business sense, and have generated high interest among customers. Four times as many customers were interested in a DVR when it is charged as a monthly service, especially among the crucial 18-34 year-old age group.
In addition, 31 percent of current digital cable subscribers expressed a strong willingness to pay for DVRs as a monthly service, while experts predict anywhere from 15-37 million DVRs in consumers’ homes by the year 2007.
And, according to a Forrester Research study, the combination of VOD and DVR is

expected to reach half of US households by 2007, with customers paying $6 billion for on-demand content. Additionally, consumers now spend $13 billion per year for home video sales and rentals. Most experts agree a significant portion of that money will be channeled into the cable business once DVRs and VOD gain traction.
Getting there requires two crucial components to DVRs—usability and positive user experience. Those are the keys to DVRs’ success, beginning with the question: What does the consumer expect from this product?
By integrating software into set-top boxes, the one box/user friendly approach to DVRs has the attention of cable operators as an appealing feature to their expanding digital service. We know DVRs can record, pause live TV, accommodate a viewer’s own schedule, allow broadband connectivity for digital music and more. And all with a simple click of the remote. We also know it’s the user interface software that will allow all of this to happen, and create the user-friendly experience of time shifting, recording and pausing live TV that DVR delivers.
The User Interface (UI) is a crucial component to the DVR experience, including how the UI looks on the TV. DVR is a new product and service and it runs on a high-end set-top with additional capabilities over the standard digital set-tops we are all used to. Among these additional capabilities is increased graphics abilities and processing power. The UI (software) should take full advantage of those increased capabilities. Using high-resolution graphics, among other UI components, gives the user a more
pleasing experience that helps make them feel they are using an advanced, consumer oriented, and easy to use product and service.
The usefulness of the IPG is another key to a positive user experience. The UI should allow the recording of programs directly from the IPG, along with just watching TV or setting up recordings of TV series’ making it a completely seamless, integrated part of the overall navigation process. Recording part of the overall UI and not a separate piece is essential.
Timely, rich, and accurate program data is also a key to a positive user experience. In a typical cable TV headend system, the program data is updated each night. Efficient and intuitive DVR software should have the native intelligence to track this data and use it for series scheduling purposes, even if a series has been re-scheduled for a different time, channel or day.
Now that you can record, and you have a cache of stored programs on your DVR’s hard drive, how involved must the user be in managing and maintaining the contents on the hard drive? Since there is a finite amount of space to store recorded shows, an important element to usability is the ability of the software to manage hard drive space for the user. By simply pressing a few buttons, users should be able to select and see what’s been recorded and choose and modify the way they record a scheduled recording or a series of recordings—by time, day, category, etc. There is essentially a table of contents, where users can modify the parameters of the scheduled recordings of deleted shows they aren’t interested in.

The experience should be as easy and effortless as the user wants. Make it simple to record and to manage the hard drive. The user should not have to resolve all conflicts, but must be notified of conflicts if they arise while setting recordings. The software has to be smart enough to do most of the hard drive management. An efficient and effective default way to manage content on the hard drive is to maintain the content on a first-in first-out basis. The last show recorded is at the top of the list and the first one to go is at the bottom.
Each show is stored chronologically, but in an advanced process the users would be allowed to move shows up and down in the chronological hierarchy by identifying which show is next to be deleted if space is needed. That show being at the bottom of the list. The user can also choose to delete or tag the show so that it will not be deleted without the user manually deleting it. Each show has an estimated time that it will be available before being deleted so that something else can be recorded. The estimate is based on hard drive space and scheduled programs and series recordings.
This all goes back to the benefit of time-shifting. Even though the user may have several recordings scheduled and several TV series set to record, the user has an expanded window in which to watch those programs. They can decide, which puts them in control.
For example, a recent Forrester study found DVR viewers increasingly watch TV stored on their hard drives, and on-demand viewing will expand from 3.5 percent of all viewing today to 28 percent in 2007.
The result is that more DVR users go to see what is on their hard drive, not what is on TV, evidenced by a Forrester study which revealed current DVR viewers watch from the hard drive about 75 percent of the time.
Advancing developments are now making it easier to find what customers want to watch or in the DVR world, record. Yet there must be logic in the software to better identify program content. It’s all in keeping with simplifying and maximizing the user experience and managing the hard drive. The better the metadata, and keeping the data fresh will help take DVRs to the next level.
It’s no slam dunk, however. In fact, it is very difficult, especially with the increased demands on networks, particularly with the added demands of high definition television.
DVR hardware evolves as quickly as the market demands. DVR-capable set-tops must be able to evolve and stay current with other technologies and services offered by cable operators, like Video-On-Demand an High Definition TV. Some DVRs can record high definition, but the effect on the hard drive space can be significant.
This may require increasingly larger hard drives or the capability to have external, renewable hard disk drives.
In the meantime, UI software can help the user optimize the use of the hard disk drive by providing behind the scenes defaults for hard drive management. This can also be augmented by providing additional capabilities to allow the user to fine-tune their choices and take more control if they desire.

Having high resolution graphics on the UI is even more important when the user has a high definition television signal. Consumers have grown to expect more from the HD services and poor graphics in an HD environment leave much to be desired.
From a business perspective, DVR is a revenue generator that doesn’t require a huge capital investment, like a plant upgrade would, prior to getting the first customer. Operators can buy a DVR set-top and make their technology investment decision one box at a time. As in every business case, operators have to weigh the features and functions and how they affect their business. At the end of the day, DVRs are all about giving consumers options and control over their viewing experiences—controlling live TV and pausing a show for up to an hour;
using instant replay anytime, pre-scheduling an entire series of TV shows, creating a personal library of favorite TV shows or displaying two programs simultaneously on the screen. And all with a simple click of the remote control. DVRs are about usability, user experience, user interface and giving the customer what they want. And user interface software is leading the way.
AUTHOR CONTACT Neil Jones Senior VP Operations Pioneer Digital Technologies, Inc. 2210 West Olive Avenue, 2nd Floor Burbank, CA 91506 T 818.295.6686 F 818.295.6831 [email protected]

EMERGING SONET-BASED SOLUTIONS FOR CABLE NETWORK EVOLUTION Thomas Darcie, Eric Manning, Dale Shpak University of Victoria
Nick Tzonev Syscor R&D Inc
Abstract Approaches for the design of cable transport networks to support emerging services are compared. While SONET is established firmly for wide-area network (WAN) transport, a diverse set of requirements drives a correspondingly diverse set of choices for metro (MAN) and secondary/hub networks. We evaluate the performance of next-generation (NG) SONET and contemporary alternatives in meeting these requirements, identifying strengths and weaknesses with both. Requirements or opportunities for new capabilities are identified and used as guidance for a cable-friendly third-generation SONET technology.
INTRODUCTION Having made massive infrastructure investments in DOCSIS, 2-way plant, and digital video technology, the cable industry now holds an enviable position for the delivery of a broad range of emerging services. Yet with a growing pool of cable-modem and DTV subscribers, and the vast majority of homes passed or penetrated with broadband capability, impressively lucrative new-service revenues remain just out of reach. How can cable operators leverage the tremendous capability created by prior investments to improve return? Popular directions for new revenue potential include various incarnations of voice, data, and digital video services. Each of the many possibilities present specific, often stringent, requirements for QoS (bandwidth,
latency, delay, jitter, packet loss rate), and Wide-area or Metro-area Network (WAN or MAN) connectivity. In response, vendors have created a variety of transport network approaches, each of which has strengths and weaknesses, with no one approach serving all requirements well. Each approach presents a continually evolving progression of features. A central point of debate within the networking community surrounds the efficacy of SONET and next-generation (NG) SONET technology, in comparison to evolving native Ethernet alternatives. Numerous business and technical factors have propelled a recent wave of enthusiasm for NG-SONET technologies. Once an expensive and static technology supporting only TDM services, improvements in cost, proven product stability, a pervasive embedded base, and data-friendly enhancements (RPR, GFP, VC, LCAS (described later)) have made Next-Generation SONET (NG-SONET) the vehicle of choice for major telecom service providers in both WAN and MAN. Perhaps the strongest argument in its favour is the ability to capitalize on the enormous existing embedded base of SONET technology. However, the simplicity, flexibility, and utility of native Ethernet connectivity have driven its migration from access aggregation or local area network (LAN) to MAN. Special challenges like multicast video-on-demand have driven cable networks to transport-overlay alternatives (RPR, POS) or native Ethernet (GbE) in some portions of the network, but the resulting network may be less suitable for other high QoS services.

In this paper we discuss future directions for SONET, and how new, emerging SONET capabilities can address transport-network challenges within the cable industry. When we compare proposed networking approaches to delivery of key service opportunities, it becomes evident that NG-SONET plays a key role in providing transport for high-QoS and wide-area connectivity, while overlay techniques using other technologies are sometimes preferred for digital video delivery and local data aggregation. This unfortunate situation exacerbates network complexity, increasing both cost and technical risk. Finally, we suggest enhancements to NG-SONET, defined collectively as third-generation (3G) SONET, that add additional networking capabilities within the transport network. An example is SONET Frame Switching (SFS) [Shpak], which provides dynamic provisioning, multicast distribution, statistical multiplexing, and various tiers of QoS support, while retaining compatibility with the existing SONET infrastructure and transparency to existing data formats. This capability can be added incrementally to legacy SONET rings by adding low-cost switch hardware and simple (transport) network control.
REFERENCE ARCHITECTURE
Recognizing that there is a diverse assortment of network topographies in use in modern cable systems, we base our discussion on the reference architecture shown in Figure 1. This captures the general notion of a hierarchy of interconnected networks leading from access aggregation (HFC) to a WAN network (regional, national, global) spanning independent systems.
SERVICE OPPORTUNITIES To provide context for evaluating the suitability of various network approaches, we attempt to categorize voice, digital video, and data services that are most likely to have major market impact. We do this by service type, bandwidth, QoS requirements, MAN/WAN requirements, and other positive or negative attributes
Figure 1: Reference architecture of hierarchical cable network with distribution and aggregation through HFC (fiber nodes, DOCSIS, QAM, etc.), MAN connectivity through hub ring, and MAN/WAN connectivity through head-end ring. Gateways to other territories and networks are through the master head-end. Voice Voice services fall into various classes, depending on distribution (Voice-over-cable or DOCSIS) and network (PSTN, Internet, or managed IP network) methodologies. Voice-

over-Cable (TDM-based voice modems) provides complete alignment with legacy PSTN approaches, but overlooks the opportunity to make good use of the features of DOCSIS and the PacketCable initiative. We consider here the continued requirement to transport the resulting aggregated DSO/T1-level streams through MAN and MAN. This is referred to as Voice-Circuit-PSTN (or Voice-CP). We do not consider the use of this circuit-based voice distribution approach within Internet or managed IP networks. Voice over DOCSIS can be supported by all three network approaches, with or without invoking DOCSIS 1.1 QoS features. We consider only the specific important case of a high-QoS voice service that is desired through a managed IP network. This approach, referred to as Voice-DOCSIS-Managed IP (Voice-DM), is a next step towards higher quality that goes beyond the models of existing VoIP-over-cable providers (since DOCSIS 1.1 QoS capabilities are used.) Video Digital video services can be categorized as broadcast or demand- based. For delivery of broadcast digital video, a high channel count (e.g., 200) is distributed from a master head end to each head end, as illustrated in Figure 1. This is then converted to QAM channels and broadcast over analog fiber to hubs and distribution. Since this is a) business as usual and b) does not affect digital traffic on the hub ring, it is not considered further. Demand-based video can be defined by the location of the server or cache (hub, head end, or master head end) and the transport or distribution method (MPEG/QAM or DOCSIS/QAM). The analysis is not sensitive to the distribution method. However, since the
aggregate bandwidth in the hub network can become very large, especially as servers are pushed to the head end, cost per unit bandwidth becomes a key parameter. We assume that the tradeoff between server and transport cost pushes the servers towards the hub for popular content (e.g. top 10 hits or channels) and towards the master head end for customized or archival content. [A large amount of research on content networking [Cameron] examines ways to optimize the placement of content based on access patterns and frequency.] To cover this tradeoff, we consider three alternatives for the delivery of demand-based video. The first (Video Centralized, or Video-C) involves a centralized (master head end) VOD server delivering streams of video to individual customers over the IP-MPEG/QAM path from the hub. The second uses a VOD server located in the hub (Video Distributed, or Video D) to provide transport-efficient service to all subscribers sharing the hub. The third (Video Head-end, or Video H) takes the middle ground, placing servers in each head end to serve all subscribers sharing the hub network Data Data services include a large set of applications, bandwidths, service quality attributes, and MAN/WAN requirements. DOCSIS-based consumer-oriented Internet access (Data - Broadband Access, Data BA), represents the existing service as supported by most cable providers today. The industry seeks to exploit this base and expand into other opportunities. These include, in order of increasing sensitivity to delay and jitter: VLAN (including Ethernet Virtual Private LAN - EVPLan), Network Attached Storage (NAS), Ethernet Virtual Private Line (EVPL),

Storage Area Network (SAN), Ethernet Private Line (EPL), and traditional T1. EVPLan and EVPL represent the primary (in terms of likely demand) services recently defined by the Metro Ethernet Forum (MEF) [Clavenna1, Clavenna2]. It is important to note that these new Ethernet services need not be delivered by an Ethernet network: customer ports need only have Ethernet interfaces. While numerous other definitions could be explored, we feel that these seven types span a representative set of likely requirements. These will be abbreviated to Data-XXX in what follows. Many of the services discussed are supported on Layer 3 (L3) router-based networks. This adds another layer through which performance must be maintained. For the purposes of this transport-layer study, we recognize that these services require QoS from lower layers end-to-end, and do not consider the additional complexities of router evolution. Data-VLAN represents the class of Virtual LAN services offered typically across LAN or MAN, based on the IEEE 802.1q specification. With DOCSIS as the access vehicle, such services are clearly an attractive complement to existing broadband services. Included here are Ethernet LAN Services (E-LAN) as defined recently by the MEF. Data-T1 represents the vast majority of business services provided by the ILECs to provide Internet and PBX connectivity, and contributing roughly $23 B in high-margin revenue (In-Stat/MDR Research). A DOCSIS–based end-to-end means to attack this market would be a valuable capability.
Data-NAS describes remote data storage on centralized or shared network-based media. Peak transfer data rates can be high, while latency is not a prime consideration. Excessive latency is often an irritant rather than a failure to deliver the contracted service. Data-SAN describes high-performance networked storage, typically using a dedicated network (e.g., Fiber Channel) for this purpose. Although these networks commonly exist in data centers, it is often desired to extend the SAN for remote backups or for servicing remote locations. To retain high performance, the network must have low latency and negligible packet loss. In an attempt to define a data-centric evolution for T1 service, Data-EVPL specifies various service qualities, such as Committed Information Rate (CIR) and Excess Information Rate (EIR). This would support a combination of real time (voice) and data requirements across MAN and WAN. Also supported by EVPL is a wide class of interactive real-time applications (real-time interactive gaming or music, video conferencing/telephony, etc.), in which only a portion of the bandwidth must be allocated with high QoS. Finally, Data-EPL specifies a committed rate over a dedicated channel (essentially Ethernet over a SONET channel), effectively providing TDM-like guarantees, but over a data network. Data-EPL service is much like Data-T1 but has Ethernet interfaces. In summary, we have defined two classes of voice, three video, and seven data services, for a total of twelve spanning a wide variety of network requirements. All appear to be

within the opportunity space available to cable service providers. We now explore the networking technologies that can be considered in support of these services.
NETWORK TECHNOLOGY CHOICES
A daunting assortment of evolving network choices is available. We summarize the main approaches in Figure 2. Included in “other” are those approaches that have specific but narrowly-defined applicability, (e.g., Ethernet over SONET, Fiber Channel).
Figure 2: Layering of transport and overlay layer-2 networks on wavelength-division multiplexed (WDM) transmission. Transport Layer SONET is the backbone of telecom networks. SONET provides high reliability, QoS, scalability, and mature OAM capabilities. Accordingly, many carriers prefer to extend the lifetime of their SONET infrastructure. Next-Generation SONET (NGS) is currently defined as the combination of Generic Framing Procedure (GFP), Virtual Concatenation (VCAT), and Link Capacity Adjustment Scheme (LCAS). These technologies enhance SONET/SDH by adding flexibility to payload types and by supporting finer-grained provisioning of SONET channels. GFP is a simple framing method that can be used to encapsulate many different types of data. VCAT improves channel utilization by enabling finer-grained provisioning of point-to-point channels.
LCAS provides a mechanism for on-the-fly modification the capacity of these provisioned channels. Although Next-Gen SONET improves SONET utilization, it is still a point-to-point technology, and therefore requires numerous point-to-point channels when interconnecting multiple nodes. Each of these channels must be provisioned to support the peak data rate. Since the channels are not shared, it does not provide any statistical multiplexing gain to improve utilization when transporting bursty traffic. In recent years, Optical Ethernet (OE) has been proposed as a transport technology. The main argument supporting Optical Ethernet is that the large deployment of Ethernet in the enterprise helps to drive down the price of components. Ethernet has several attractive features, such as the ability to rapidly provision bandwidth with fine granularity and simple internetworking with enterprise networks. However, there are several reasons why Ethernet has not made major inroads into carrier networks. Firstly, carriers already have substantial investments in their SONET/SDH and ATM networks. They would often prefer to improve the performance of these networks rather than cap their existing networks and grow a completely new transport network. Much of the Ethernet traffic that is carried over transport networks is not transported natively: it is encapsulated in SONET/SDH. There are other concerns about using Ethernet in transport networks, such as standardized support for end-to-end QoS (perhaps using MPLS), rapid protection switching (non-standard proprietary approaches with interworking and/or performance issues), mature OAM capabilities, and scalability [MEF].
WDM
SONET/SDH Optical Ethernet
FR ATM PoS RPR TDM Ethernet Other GFP

Overlay Networks The most common methods for transporting IP data over SONET/SDH are Packet over SONET (PoS), Asynchronous Transfer Mode (ATM), Resilient Packet Ring (RPR), Frame Relay (FR), and Ethernet. All these technologies have strengths and weaknesses that make them suitable for some applications and less suitable for others. Packet over SONET (PoS) is a long-serving method for transporting packet data over SONET. A major weakness of PoS is that it uses provisioned point-to-point channels between each of the network elements. Because of the point-to-point nature of PoS, the interconnection of multiple nodes requires a mesh consisting of a provisioned channel between every node. This reduces network flexibility as each of these SONET channels must be provisioned to meet peak bandwidth requirements and there is limited opportunity to exploit statistical multiplexing to improve bandwidth utilization over the individual channels. Frame Relay (FR) is a very important commercial packet service that is somewhat like X.25 with cut-through forwarding. The nodes in a FR network switch packets over provisioned paths in the network (Permanent Virtual Circuits). A FR network may also support Switched Virtual Circuits that can be established on demand. With FR, each unidirectional link is established having a guaranteed or Committed Information Rate (CIR) (which may be zero) and a Peak Information Rate (PIR). Since FR uses shared channels, it has statistical multiplexing gain. An advantage of FR over VPNs is that a FR connection is truly private: no TCP/IP ports are exposed to hackers.
Asynchronous Transfer Mode (ATM) and SONET are the major transport technologies used by telcos. ATM can transport many different types of packet- and circuit-oriented traffic types. Notably, nearly all DSL traffic is aggregated using ATM-based DSLAMs. ATM uses a small, fixed cell size that results in two important hardware advantages: the resulting hardware has a simple and regular queue structure and ATM can have a low forwarding latency. However, ATM has a connection-oriented protocol that is not efficient for small data transfers that are typical for some Internet communications. It does not scale well and it is not well suited for carrying transient or best-effort traffic. It is more appropriate for establishing network services requiring higher levels of QoS (mainly voice). Other problems with ATM are high cost and excessive signaling overhead. Resilient Packet Ring (RPR) was designed to address many of the shortcomings of PoS. RPR introduces oversubscription into SONET. With RPR, the nodes are addressable, can share the capacity on a SONET ring, and any node can insert traffic into the shared channel. This helps to overcome the poor channel capacity utilization in PoS that results from having to use dedicated point-to-point channels. In addition, RPR supports differentiated QoS which can be used to offer tiered Service Level Agreements (SLA). RPR was designed to be media-independent and can currently be carried over SONET or Ethernet. Therefore, it requires its own protection switching mechanism. RPR’s most serious weakness is that it cannot natively span multiple rings. Typically, a router is used to interconnect RPR rings.

Ethernet: In a typical overlay deployment, Ethernet switches are connected over point-to-point SONET links by mapping Ethernet frames into the SONET payload. Each Ethernet switch in the overlay network must be capable of determining the required output port for Ethernet frames destined to any Ethernet address anywhere on the Ethernet network. Unlike RPR nodes, which simply forward packets that are not destined for that node, each Ethernet switch must resolve the destination port for every Ethernet frame that arrives on any of its interfaces. The advantage of this additional processing is that an Ethernet switch has the capability to forward traffic any output port, thereby giving it the capability to interconnect rings or meshes (unlike RPR).
As mentioned above, there are issues with the scalability of Ethernet, including the speed of network recovery when using spanning tree protocols.
TECHNOLOGY SUITABILITY
In evaluating the alternative networking approaches, we compare key attributes of the transport-layer and overlay networks, for each of the 12 classes of service we have defined, and for applicability in WAN and MAN networks. First, each service class has different degrees of tolerance for network impairments. Table 1 illustrates the tolerance to network outages, delay and/or jitter, and packet loss. There is a wide variation in tolerance for each impairment, ranging from low for Data-SAN, Data-EPL, Voice CP, and Data T1, to high for best effort data service (Data- BA).
Table 1: Tolerance to Network Impairments
Outages Delay/Jitter1 Loss Voice-CP Low Low Low Voice-DM Low Mod Low Video-C Low Mod Mod Video-H Low Mod Mod Video-D Mod Mod Mod Data-BA High High High2 Data-VLAN Mod High High2 Data-T1 Low Low Low Data-NAS Mod High Mod2 Data-SAN Low Low Low2 Data-EVPL Mod Mod Mod2 Data-EPL Low Low Low 1. Jitter is often accommodated by adding delay (jitter buffer) 2. Assumes higher-layer error recovery (TCP)
These network impairments are mapped onto the three transport layer alternatives (SONET, NG SONET, and Ethernet) on Table 2. Also included are transport efficiency and
scalability, characteristics that do not affect service directly, but are of direct concern to the service provider. Scalability is the ability to migrate to large networks and high speed,

particularly across WAN. SONET has the clear advantage in providing protected, low-delay, low-jitter, and low-loss service that is scalable across WAN, but with low transport efficiency. NG SONET takes a substantial
step in increasing this efficiency. Depending on the particular approach, Ethernet restoration time can be large or small, but difficulties can be encountered in scalability.
Table 2: Transport Network Characteristics
SONET NG SONET Ethernet Restoration Time Low Low Low-High1 Delay Low Low Mod Jitter Very Low Very Low High Loss Very Low Very Low Mod Transport Efficiency Low Mod Mod Scalability High High Low-Mod 1. Spanning Tree, Fast Spanning Tree, Proprietary Faster Methods
Overlay Networks Table 3 shows the strengths and weakness of the various overlay network approaches within the MAN. The point-to-point and static use of transport bandwidth limits the applicability of POS. ATM excels for most services, but has cost and scalability challenges. FR is not generally applicable for
high bandwidth (video or broadband data) broadcast or multicast services. RPR satisfies a broad set of MAN requirements, but its inability to span rings limits applicability in WAN. Ethernet has broad applicability in MAN, but struggles or fails for delay or jitter sensitive services and services requiring high availability.
Table 3: Suitability of Overlay Technologies for MAN
PoS ATM FR RPR Ethernet Voice-CP No1 Yes3 OK1 OK1,3 OK1,3 Voice-DM No2,4 Yes OK4 Yes Yes Video-C No4,5 No7,8 No5 No9 Yes Video-H No4,5 No7,8 No5 No9 Yes Video-D No4,5 No8 No5 Yes Yes Data-BA No2,4 Yes No4 Yes Yes Data-VLAN No2,4 Yes Yes Yes Yes Data-T1 No1 Yes3 Yes3 OK1,3,9 OK1.3 Data-NAS No4 OK8 OK4 OK9 Yes Data-SAN No1 OK8 OK1 OK1,9 No1 Data-EVPL NoA Yes Yes Yes Yes Data-EPL No2 Yes Yes OK1, OK1 1. Excessive latency or jitter 5. No multicast 9. Cannot span rings 2. Poor network utilization 6. Channel is not shared A. No QoS mechanism 3. Requires emulation 7. Scalability is an issue 4. Inherently point-to-point 8. Cost is an issue

A similar evaluation of overlay alternatives for WAN reflects a combination of the performance of the overlay approach in aggregating traffic and the capabilities of the underlying transport network. The inherent point-to-point nature of PoS is again a limitation, as is the inability of RPR to span rings. Ethernet’s inability to provide hard QoS and limited scalability are exacerbated in WAN.
FUTURE DIRECTIONS
Several conclusions are clear from the preceding discussion. - No one solution fits all requirements. - SONET and NG SONET, in conjunction
with the appropriate overlay technology, are the means by which WAN requirements will be met now and in the future.
- Ethernet (overlay and transport) has a strong place in MAN, but must invoke L3 for WAN.
Unfortunately, QoS mechanisms for L3 WAN data services remain a key challenge. Complexity of various alternatives (e.g. MPLS, flow-based routing) continues to plague economics, operations and general acceptance of these solutions. Therefore, we seek future directions for SONET and NG SONET that accomplish the following:
- Increase the transport efficiency for data, particularly in MAN (as per Table 3), while concurrently supporting low-latency TDM traffic. This requires increased flexibility in mapping different services into large (OC48-192) and small (OC3-12) streams, the ability to overprovision best-effort traffic on top of guaranteed, and broadcast/multicast support.
- Provide an efficient means (unlike PoS) to create multipoint connections across MAN and WAN. This requires increased flexibility in defining the connectivity between interconnected SONET nodes, preferably on a frame-by-frame basis.
- Provide a transport capability that dramatically simplifies the challenge of QoS-controlled routing. This requires sufficient flexibility, in terms of both bandwidth allocation and addressing, to be built into the SONET layer.
- Enable monitoring, policing, and billing of rate- or usage-based service level agreements.
An example of an approach to 3rd-Generation (3G) SONET that attempts to provide these features is SONET Frame Switching (SFS) [Shpak]. SFS introduces two main components:
1) a novel frame-based protocol, and
2) a network switching architecture that uses segmented, hierarchical MAC addresses.
A frame-oriented protocol is utilized in order to take advantage of SONET framing, rather than using an octet-stream-based protocol that requires additional synchronization to locate packet boundaries. Rather than layering legacy protocols on top of SONET, SFS uses a connectionless MAC-layer protocol. Hierarchical addressing provides minimum byte overhead while enabling straightforward switching and topology discovery. SFS is presented in the context of a ring-based architecture but other topologies such as linear or mesh can be readily realized.

To L3 protocols, all nodes connected through SFS appear to be on a contiguous L2 network (the SFS “cloud”). This allows for routing decisions to be made only at the ingress nodes. The traffic can then be switched between multiple SFS nodes without making further routing decisions. To a router connected to the SFS network, any other router connected to the SFS network appears to be separated by a single routing hop. SFS can be readily connected to legacy networks by extracting the IP packets and forwarding them to an existing router or, if the SFS node has a router, by making the routing decision within the SFS node and forwarding packets through one or more legacy-compatible ports on the SFS node.
SUMMARY
In summary, with its pervasive embedded base, unrivaled timing precision, and restorability, SONET provides the ideal foundation for transport of emerging cable services. NG-SONET and emerging 3rd-generation SONET capabilities like SONET Frame Switching (SFS) can provide the efficiency and flexibility previously derived from Ethernet and Layer-3 networks, but with the timing performance and reliability expected from SONET. It is anticipated that these capabilities will result in substantial simplification of cable networks and reduce dependence on complex layer-3 alternatives.
REFERENCES
[Cameron] C. Cameron. S. H. Lo, and D. Wei, “A Server Placement Algorithm for Content Distribution”, Pro. IEEE Information Theory Workshop, 2002, pp. 26-28
[Clavenna1] S. Clavenna, “Standardizing Ethernet Services”, Light Reading, Jan 9, 2004.
[Clavenna2] S. Clavenna, “Future Ethernet Standards Unveiled”, Light Reading, Dec 8, 2003.
[MEF] “Metro Ethernet Networks A Technical Overview,” Metro Ethernet Forum, 2003.
[Shpak] D.J. Shpak, P.-C. Tang, and E.G. Manning, “Supporting everything-on-demand in cable services,” 19th National Fiber Optics Engineers Conference, Orlando, Sept. 2003.

Abstract—The complexity and scope of present cable networks eclipse its analog predecessor. The demand for unimpaired service availability and network robustness has been elevated as customer acceptance and dependency has grown for new revenue opportunities such as telephony, broadband data services, video-on-demand and extensive channel offerings, all enabled by the digital revolution in cable television. These new services depend upon networks with high fidelity. The barrier separating error-free reception and complete loss of service is often less than a decibel.
Operators faced with the requirement for improved service, reduced downtime and 24/7 network availability are also facing the need to reduce capital expenditure, truck rolls and personnel costs. Current solutions for extensive network monitoring are both cost prohibitive and have limited scope of information as well as limited observability, often only providing data for a node or trunk and not to each subscriber tap or CPE.
Cable network infrastructures can vary from plant-to-plant, node-to-node and trunk-to-trunk. From mode hopping lasers and noisy amplifiers to ranging cable modems, operators are challenged by a diverse set of issues that may seem impossible to troubleshoot with any one existing technology.
Using only open-standards, Sony was able to create a unique and encompassing system monitoring tool with unlimited expansion capabilities that can in real-time analyze plant data and automatically report any instances where the quality of service is below established thresholds or suspected failures were found.
Index Terms—Digital Cable Television, Systems Integration, Open Cable, Network Management
I. INTRODUCTION
This paper presents an overview of technology and tool sets developed by Sony allowing operators to gather extensive metrics on their entire network, including transports and channels, all the way from the head end to each subscriber device. Information is aggregated and presented in a web-based tool providing operations staff at any level information with variable scope at the network, node, tap or device level. The system includes assignable watermarks for warnings and alarms that in turn automatically activates email, text messaging and paging systems. Trend data is obtained at selectable intervals and this data is stored indefinitely for future auditing, QA, analysis or other purposes. Because the granularity of scope is user selectable, quick determination of where a system fault has occurred can more easily be made, allowing
ENHANCED PLANT AND SYSTEM MONITORING USING OPEN-STANDARD DATA CHANNELS AND TOOLS
Aran Sadja, Eric Holcomb & Lee Pedlow
Sony Electronics Inc.

deterministic action to be taken before a call center is flooded with customer complaints. It also facilitates reduction of service labor costs and unnecessary truck rolls because problems can be pinpointed. Problems localized to wiring or other problems at a customer premises are determined without having to dispatch representatives on-site. In many cases, these issues, the source of which having been conclusively identified, may then be delegated to customer service agents and handled over the telephone with the subscriber.
All this capability comes without the need to purchase and deploy costly and complex specialized test equipment and the data server is hosted on an inexpensive PC. The information is made available using existing communications within the subscriber device and extensions to standard protocols.
II. OPEN-STANDARD DATA GATHERING
The first hurdle in creating a plant-wide monitoring system is gathering the appropriate data. Unfortunately, a typical digital cable plant may ultimately have equipment from a number of different vendors, each one possibly using their own proprietary remote monitoring system. In such circumstances, a comprehensive monitoring tool would require a lengthy and costly upgrade for each individual system, the difficulty of obtaining an API (Application Programming Interface) from the vendor to communicate with their equipment not withstanding.
Fortunately for MSOs, most manufacturers do not create their own remote data query system and protocols. Instead, they use one of two major open-standard systems.
The two most frequently used methods for gathering data are currently the open-
standard SNMP (Simple Network Management Protocol) and the open-standard HTTP (Hyper Text Transfer Protocol) using XML (eXstensible Markup Language) or HTML (HyperText Markup Language) both of which are also open-standards.
DOCSIS requires, and CableLabs ensures, that every cable modem is equipped with a simple SNMP agent and responds to a standard set of requests. This provides a uniform interface to the cable modem, regardless of manufacturer.
To our chagrin, the rest of a cable plant is not as simple to monitor. Luckily, SNMP is the prevailing choice for remote diagnostics due to its explicit design as a standardized method of “Network Management”. Any SNMP enabled device found in the headend will respond to SNMP requests, including all network infrastructures (CMTS, routers, etc) and most servers (Linux & Windows based).
Another common remote query method used by equipment manufactures is by performing an HTTP GET request and parsing the response data. The data is returned in either in XML or HTML format, which can easily be parsed and the appropriate data extracted, or the data is returned in HTML, as a diagnostics web page from which the appropriate data can also be parsed and extracted.
In rare cases, the manufacturer may not provide a remote diagnostics interface, in which case a simple network connectivity test can help infer whether the device has crashed, is hung-up or has lost power.
The use of open standards by manufacturers allows headend equipment to be remotely monitoring with a single tool that can then analyze and present the data.

III. OPEN-STANDARD DATA STORAGE
An important aspect of a large monitoring system is the ability to gather data over extended periods of time in order to examine trend information and detect possible future failures based on that data. This data needs to be stored in a conveniently accessible fashion. Enter the open-standard database query language, SQL (Structured Query Language).
The use of SQL allows the monitoring tool to communicate, sans modification, with any SQL standard adhering commercial or freeware database, providing the tool with a multitude of options for data storage.
IV. HEADEND REDEFINED
The advanced cable systems of today are vastly different from their analog ancestors. Advanced devices and infrastructure that provide digital video, video-on-demand content, and data services are replacing headends once solely populated with simple legacy analog equipment. The replacement equipment provides more than just a system upgrade to digital video services, but as an integral part of a networked multimedia architecture, this equipment is also capable of reporting on the status of the device and on the information flowing through it. This allows today’s system operator to monitor the equipment and meet the challenges of managing such an environment with its corresponding expansion of scope and complexity.
V. HEADEND EQUIPMENT
Effective monitoring begins in the headend, ensuring the core systems of the cable operator are functioning as expected and providing early detection of problems. The Sony system uses various communication paths to aggregate headend systems status. All SNMP (Simple Network
Management Protocol) and HTTP (Hyper-Text Transfer Protocol) enabled devices can be polled on scheduled intervals for status updates. Information about video/data delivery, device statuses and real-time log files can be stored on a centralized monitoring server thru the use of databases and the Linux syslog service. By monitoring and analyzing the incoming data, based on MSO defined criteria, the system can automatically take scripted response actions and/or alert appropriate personal through pagers, text messaging, email or other means. This allows efficient problem notification and resolution, minimizes downtime, and reduces maintenance costs. This data is also accessible via HTTP through any standard web browser for operators to examine at their convenience from anywhere in the private, or alternatively, in the public Internet.
Video services are protected by monitoring source devices such as satellite receivers, remultiplexers, rate-shaping groomers, modulators and upconverters. On-demand video systems benefit from the ability to monitor items such as server CPU loads, memory usage, as well as application specific metrics maximizing uptime and system availability for these advanced services. It is also prudent to monitor the programming to ensure that the premium channels are encrypted, while the clear channels remain in the clear.
Based upon the operators’ settings, the appropriate support staff will be notified when there is an ASI input failure on a modulator, an oversubscription on a transport passing through a grooming device, or excessive CPU load on a cluster of VOD servers. Using MSO defined thresholds, problems can be averted or corrected with early warnings triggered by a known pattern of events leading to system failures. In many cases, problems can be detected by effective application of

thresholds before they become service affecting from a subscriber perspective and corrective action taken prior to noticeable impairment being reported through a flood of calls to a call center.
Data services can be protected by monitoring network infrastructure and related provisioning servers. Everything from the core backend routers to edge devices such as the CMTS are monitored and the data displayed in a network centric web interface. Detailed information about the health of the HFC network as it relates to the data services is analyzed and presented as it is gathered via SNMP from a DOCSIS CMTS.
Bandwidth utilization, modems per node, metrics on upstream/downstream interfaces and modem RF power can be stored and analyzed providing real-time analysis or historical trend data for the delivery system. Alerts can be targeted to specific personnel specializing in the type of trouble or equipment reporting the malfunction, streamlining problem resolution.
VI. CUSTOMER PREMISES REDEFINED
With one-way technologies, determining the quality of signal at the customers’ premises required the customer to call in and complain. The operator then faced the challenge of determining whether the issue was confined to the customer’s location or if it was an area wide issue, affecting a branch, node or an entire hub. If no other customers complain, it could be assumed that the issue was localized but without further information, it impossible to conclusively determine without a truck-roll. A technician must then be dispatched to the location, costing the operator in both time and human resources, to determine the specific source and location of the problem.
With two-way technology, every customer device can play a role in monitoring the cable plant’s health. A cable modem can help ascertain the health of signal and assist in determining the physical location of the customer. Additionally, two-way capable STBs containing DOCSIS modems can provide more than just video and program guide services to the customer. The STB can keep the operator apprised of every aspect of the STB in the customer’s house, ranging from the current video PID to the CA security device ID. This enhanced use of two-way communications allows a revolution in the way cable operators monitor their plant, with a seamless logical extension of the plant past the tap to the actual devices in the subscriber’s home. Thus, for the first time operators are provided the opportunity to monitor the network through its endpoints, not just the infrastructure.
VII. CABLE MODEMS
The cable modem is the customer’s high-speed gateway to the internet. In order to stay online, a cable modem performs a continuous electronic repartee with the CMTS and in the process creates a plethora of useful network information stored on both the cable modem and CMTS and available thru the open SNMP standard.
The DOCSIS spec requires all cable modems to be SNMP capable and that the MIBs (Management Information Base) and OIDs (Object IDentifiers) comply with standardized values. Because of this, every CableLabs certified cable modem responds in a uniform way to a standard SNMP request. This provides the operator with the freedom to choose any (or multiple) cable modem manufacturer(s) and never have to change the method of acquiring data.
The type of data available on the cable modem ranges from simple to obscure. Whether the operator wants to know if a

cable modem is online, or a technician is concerned with the number of T3 Timeouts, this information is accessible thru the monitoring tool.
Of the data available, one of the most valuable pieces of information to the operator is the ability to get live reports on signal health, a key element of which is the upstream power as sent by an individual cable modem. When a cable modem has to “shout” to communicate with the CMTS, the monitoring tool can help differentiate whether the issue is indicative of a poor return path due to a problem at the customer’s site or a node wide issue.
In some ways, both cable modems and digital STBs are more finicky about signal levels and quality then their analog predecessors. In analog systems, picture quality degraded proportional to the degradation of the incoming signal quality. In contrast, the magic and curse of digital transmission is that it provides perfect, error free picture quality until the signal is degraded to a point and then the complete transmission is lost. In many cases, the transition between perfection and total loss may only be a fraction of a decibel. It is important to maintain proper levels across a plant to provide consistent service and margins. By polling cable modems at regular intervals and following trends in signal levels, it is possible to detect current and even predict future equipment failures on the delivery infrastructure.
Thru SNMP it is also possible to track a customer’s cable modem should it make its way to another part of the system. With our system and a network diagram, it is possible to determine with a fair degree of accuracy, where that cable modem is physically located, and from previous polls, where it should have been located, based on the time tick value, the upstream and downstream frequencies and which CMTS
interface it is communicating on. When linked to the billing system, the monitoring tool can provide the operator with specific customer information for each cable modem and STB.
The data available on the cable modem can help an operator at any level determine a problem with a single cable modem or with a whole trunk. This information is not only available remotely, but can proactively monitor, alert, and even maintain a cable plant’s health.
VIII. TWO-WAY CAPABLE SET-TOP BOXES
The digital STB is seen as the customer interface to the digital television realm, providing the user with a crystal clear image and an electronic program guide. However, with a two-way capable STB implementing the open TCP/IP standard, the box can also become a cable provider’s most reliable monitoring tool, irrespective of whether the television is on or off.
Unlike cable modems, there is yet to be a standardized interface for remote diagnostics on digital STBs, but the use of SNMP on a network-attached STB can provide a wealth of information. The Sony STB, which has an integrated DOCSIS cable modem and uses a proprietary MIB set was used in the design of our tool, but a standardized set of MIBs can be created to allow easy integration of any two-way STB onto a monitored cable plant.
Whether the STB has an integrated DOCSIS cable modem or uses an Ethernet connection, the data available from each subscriber’s STB is priceless to the operator. For example, thru the Sony system, a region-wide STB software upgrade can be scheduled and the tool can provide an upgrade report as well as schedule subsequent upgrade attempts for failed boxes. If a box repeatedly refuses the

upgrade, the tool will alert the operator, whom can then take appropriate action.
Information about the digital video signal is also available on the STB. A digital cable STB is essentially a debug tool embedded in the customers’ home. While decoding the video, the box is also monitoring various aspects of the signal and this information is available via SNMP. Mismatched audio & video PIDs can easily be detected by a poll of the system, QAM data, downstream power levels, bit error rates, SNR, mislabeled channel descriptors and any other information specified in the MIB can be monitored. In the event of a customer call, this information can be used to assist the support technician in determining the cause of the problem.
CA (Conditional Access) information is also made available thru remote diagnostics. Theft of service can be addressed through real-time monitoring of CA using the monitoring tool. When tied into the billing system, the monitoring tool can track PPV or VOD purchases, check when the last account report-back occurred, compare service tier to actual viewing, and in the case of a roaming or rogue access cards or devices, an alert can be sent out and the offending card then be deactivated.
Additionally, a cable operator may want to take advantage of the fact that real-time viewing statistics and habits can be gathered from the STB, within the privacy limits allowed by law. A system poll can tell the operator how many STBs are tuned to any particular channel, and stored data can be analyzed and used for marketing purposes.
IX. PRESENTATION, NOTIFICATION & RESPONSE
Collecting data is half of a monitoring system; the final challenge in creating a versatile solution is providing an interface,
notification and response system that is accessible, intuitive, customizable, and capable of filtering the massive quantity of data accumulated while monitoring a cable plant.
To make the data available to the widest audience possible it is advantageous to use an existing open-standard protocol that is already ubiquitous, so HTTP or the “web” was a natural solution. The use of HTTP allows worldwide access to the data thru any browser-enabled device, ensuring availability to technicians with a computer, cell phone, PDA, etc. The data presented can be filtered depending on the device and user, optimizing the time needed to diagnose a problem.
One aspect that has proven both attractive and effective for a major cable operator was to provide key field staff inexpensive laptop PCs and cable modems. This allowed these personnel to access the monitoring data in the field from any available cable network tap to evaluate, in real time, the effect of their corrective actions on the aggregate and individual downstream customers. Sometimes data was monitored in this manner even while climbing a pole!
A monitoring system is not effective without alarm and warning notifications. Gathering data for presentation is useful, but requires constant monitoring in order to repair problems as soon as they arise. To be a proactive monitoring system, definable alarms and subsequent notifications are necessary.
All the data is sorted and formatted for presentation; visual contrasts (colors, font, size etc.) are used to delineate sources of information and to indicate warnings and alarms. Additionally, personnel can have a customized view of the data that addresses their specific needs.

For security, the web interface can either be made publicly available, or a user authentication system can be used to protect the pages. Monitoring system administrators have a separate login and can adjust alarm watermarks, data sources, email recipients and other aspects of the tool thru the web.
Gathering data for presentation is useful, but requires constant monitoring in order to repair problems as soon as they arise. To be a proactive monitoring system, our system allows definable alarms and notifications as necessary. The use of the open-standard, SMTP (Simple Mail Transport Protocol) to email notifications allows a multitude of devices to receive the warnings.
Email alerts are fully customizable and can be sent to any number of recipients and different alarms can be sent to only the appropriate personnel. It is also possible to tailor the notifications to the receiving device; a terse version of the alert can be sent to pagers, cell phones and other mobile devices, while a fully detailed message is sent to standard email accounts.
The tool can also be configured to perform automated responses to failures that have definable remedies, e.g. When a device fails, the monitoring tool can switch the system over to a backup device or when a simple power-cycle is the accepted resolution to an issue, the monitoring tool will contact the network-attached power-switch to reset the equipment.
X. CONCLUSION
Cable Headends are complex and dynamic environments that may be difficult and costly for personnel to keep track of, but by incorporating open-standard monitoring solutions, we have created an automated system capable of monitoring an HFC network from headend to customer node.
This comprehensive monitoring solution saves time by freeing personnel from repetitive tasks that can easily be automated. By analyzing data and sending out notifications, repairs can be made before the customers’ viewing experience is compromised. This not only saves money by accelerating repair it also keeps the customer satisfied, reducing churn and disconnects.
Monitoring of backend networks in addition to the statistics gathered from advanced 2-way CPEs (Customer Premises Equipment) employing DOCSIS provides metrics on the entire HFC network. When this monitoring end-to-end paradigm is applied to the MSO’s network, the 100% uptime required by today’s demanding customer can be better realized.
REFERENCES
[1] Data-Over-Cable Interface Specifications: Radio Frequency Interface Specification (Cable Labs SP-RFIv1.1-I08-020301:2002)
[2] ANSI X3.135-1992, Database Language SQL
[3] ISO/IEC 9075:1992, Information Technology-Database Language-SQL
[4] Jonathan B. Postel, SIMPLE MAIL TRANSFER PROTOCOL, RFC 821, Information Sciences Institute, University of Southern California
[5] D. Harrington, R. Presuhn , B. Wijnen, An Architecture for Describing SNMP Management Frameworks, RFC 2571, The Internet Society (1999)
[6] Standard Generalized Markup Language (SGML) ISO 8879[SGML]

Aran Sadja is in Digital Platform of America (DPA) Tel: 858-942-1438 e-mail: [email protected].
Eric Holcomb is in Digital Platform of America (DPA) Tel: 858-942-6089 e-mail: [email protected]
Lee Pedlow is in Digital Platform of America (DPA) Tel: 858-942-2538 e-mail: [email protected].

EVOLUTION OF VIDEO ON DEMAND ARCHITECTURES
Weidong Mao, Kip Compton Advanced Engineering, Comcast Cable
Abstract This paper describes the architectural evolution of Video On Demand (VoD) infrastructures in supporting open interfaces and expandability to future on demand services. Key technology areas that are essential for the next generation on demand architecture are discussed. With the advent of new technologies in Gigabit Ethernet IP networking and high performance storage/streaming as well as software, it becomes feasible to evolve the current VoD architecture from a vertically integrated and proprietary system to an open and modular architecture. Significant economic advantages are realized as a flexible and open environment makes it possible to deploy new technologies much more efficiently, facilitating the rapid proliferation of new services while controlling the associated capital and operating expenses. This paper presents a reference architecture that describes logical components and interfaces. In addition, it provides a detailed discussion on several key areas of architectural evolution. They include:
• Standardized asset propagation and management interfaces
• Better utilization of resources via dynamic session and resource management
• Secure content delivery via session based encryption and/or pre-encryption techniques
• Edge device management and configuration
• Shared infrastructure with other services, including IP-based streaming media services
• Expansion to multiple services such as networked PVR and interactive advertising
ISSUES WITH EXISTING SYSTEMS
Cable operators currently offer Video On Demand (VoD) services through the interactive video systems that feature tight integration and customization across several system components, such as: asset management, session and resource management, billing and entitlement, network transport, and set-top client applications. While today’s monolithic system architectures helped cable operators bring a compelling product to market very quickly, there are several issues in the current VoD architecture that must be addressed going forward:
• Open Interfaces: In many of today’s VoD architectures, the interfaces and protocols between different components are poorly defined and proprietary. Without standardized and open interfaces, significant effort is required to integrate any new vendor into the architecture. Earlier standardization efforts such as Time Warner’s ISA and CableLab’s VoD Metadata project have addressed some of these issues. However, the interfaces related to key components, such as Session and Resource

Management and Edge QAM, remain largely un-addressed.
• Multiple Service Support: Today’s architectures are typically customized for a very limited set of services (e.g. Movie on Demand and Subscription VoD). Unfortunately, a significant re-engineering effort is required to support the addition of new services, like Switched Broadcast Video, or networked PVR. An extensible, on-demand platform that allows multiple services to share the same underlying infrastructure will create significant cost efficiencies and make it possible to provide new services more quickly and easily.
• High Performance, Scalability, and Redundancy: The existing VoD system deployments are typically designed for 10% simultaneous usage. Content is typically duplicated on each video server system at each server location. In addition, the network and edge resources are typically “hardwired” or associated with a specific server. To support services such as HDTV on demand and networked PVR, which will produce higher bit rates and viewing concurrency, a high performance and highly scalable distributed approach with fail-over capability is needed.
The following sections provide a VoD reference architecture and discussions around how today’s VoD architecture might evolve to address these issues.
REFERENCE ARCHITECTURE
Figure 1 provides a Next Generation VoD reference architecture that supports Video On Demand services and can be expanded to
support other on demand services such as Switched Broadcast Video or networked PVR.
The architecture is partitioned functionally into a number of logical components. Each component is defined in such a way that the interchangeable module implementing the common interfaces can be introduced to work with the rest of the system. It is possible that implementations may integrate several components into a single product or solution.
Each logical entity described in the reference architecture may represent one or many physical entities in an actual implementation. For example, multiple servers may be utilized to provide load balancing and scalability for the Session Manager (SM) component.
The On Demand Client is typically located at the customer premises in a digital set-top box. Any gateway server that is communicating with other headend components on behalf of the digital set-top box will be considered part of the On Demand Client. All other components are located at cable operators’ master headend, secondary headend, or remote hub, depending on the specific deployment configuration and network topology.
Key logical components include:
Asset Distribution System (ADS) – distributes assets from content providers’ or aggregators’ premises to the network operators.
Asset Management System (AMS) – validates and manages the life cycle of assets and their associated metadata.
Real Time Source – generates assets from real time encoders and / or broadcast feeds. Billing System – manages customer billing and service subscriptions.

Entitlement System (ES) – manages entitlements and transactions.
Navigation Server – presents assets and service offerings; manages navigation from the subscribers.
Purchase Server – receives purchase authorization check from the subscribers and validates via the Entitlement System.
On Demand Client – provides interfaces with the headend components and enables end user applications.
Asset Propagation Manager – manages asset propagation across multiple streaming servers.
On Demand Resource Manager – manages resources required from the Streaming Servers.
Streaming Server – stores and outputs contents and manages stream control.
Session Manager (SM) – manages session life cycles for on demand video services requested by subscribers.
Conditional Access System (CAS) – performs Conditional Access for the on demand video services.
Encryption Resource Manager – manages encryption configuration for each session.
Encryption Engine – performs encryption of video services associated with the session. It can be located anywhere between video server and edge device.
Network Resource Manager – manages resources required in the transport network for each session.
Transport Network – transports video services from streaming servers to the edge.
Edge Resource Manager – manages resources required at the edge for each session.
Edge Device – performs re-multiplexing and QAM modulation.
Network Management System (NMS) – provides network management for all the components in the headend.
SESSION AND RESOURCE MANAGEMENT
In order to achieve the goal of managing and sharing resources dynamically across all services, the reference architecture separates Session Management and Resource Management. The Session Manager (SM) is responsible for managing the life cycle of individual sessions for each on demand service. The Resource Managers (RM) manage shared resources (streaming, network, encryption, and edge) on the system. The Session and Resource Management (SRM) reference architecture and interfaces are described in Figure 2. Typically, the SM will perform the following functions:
• Communicate with the subscriber device regarding session setup, session status, and session tear down.
• Interface with the corresponding Purchase Server to authorize the session requested by the subscriber.
• Allocate the resources required for the session by negotiating with the resource managers for appropriate server and network components.
• Dynamically add, delete, or modify the resources associated with the session to support integration of multiple on demand services.
• Manage the Quality of Service for the session.
• Manage the life cycle of the sessions.

One of the main functions of the SM is to obtain the required resources for each session by negotiating with resource managers for the relevant server and network components. These tasks typically include the following:
• Interface with On Demand Resource Manager to determine the Streaming Server resources such as asset location, allocated streaming server and output port. (Interface S3)
• Interface with Encryption Resource Manager to determine encryption resources required for the session. (Interface S4)
• Interface with Network Resource Manager to determine the uni-directional path that will transport the requested video stream to the edge devices that cover the service group in which the subscriber resides. (Interface S5)
• Interface with Edge Resource Manager to determine the resources used at the edge devices such as bandwidth required and MPEG tuning parameters. Digital set-top boxes can then tune to the MPEG program that carries the requested content. (Interface S6)
The session and resource management process may follow any of several possible implementation models: In a centralized model, the SM will retrieve and aggregate the topology and resource information from each resource manager. The SM then updates this information as necessary, assigns resources, and communicates with each resource manager to configure those resources. In a distributed model, each resource manager is responsible for maintaining and updating the topology and resource state of the devices it manages as well as allocating the resources for the session on behalf of the
SM. In this model, the SM collects the choices provided by each resource manager and selects an appropriate combination of resources to enable the session. Several optimizations of this model are possible to reduce latency and increase the throughput of session and resource management.
MULTIPLE VoD SERVERS
Another key area of evolution in the VoD architecture allows multiple video servers to operate in the same headend environment. This enables multiple video server vendors using the common open interfaces and helps facilitate the over-subscription of VoD storage and streaming resources within or across service groups. A reference architecture and interface diagram using the multiple servers is shown in Figure 3. The On Demand Resource Manager is responsible for allocating and managing the resources that are required from the Streaming Servers. Upon the session setup request from the client, the Session Manager (SM) will request resources from the On Demand Resource Manager (via Interface S3), in conjunction with the resources of other components in the overall system. The resources allocated by the On Demand Resource Manager may include:
• Asset location: This includes the locations of the requested asset that has been determined by the propagation service. This information may be retrieved from the Asset Propagation Manager (via Interface R1).
• Server resource: This includes the
availability of the Streaming Server that contains the asset and covers the

service group in which the requested subscriber resides (via Interface R2).
• Network resource: This includes the
network resource allocated at the selected Streaming Server output port (via Interface R2). They may include the UDP port number and IP address that carries MPEG SPTS.
The Session Manager (SM) will need to negotiate with the On Demand Resource Manager as well as the resource managers for any other components which allocate resources to enable streaming video from any server to any edge. For example, the asset files may not be available in the streaming server that is connected to a selected network path to the edge, creating the need for an alternate server and network path. In this case, the SM will need to negotiate with the On Demand Resource Manager and other resource managers to reconcile the differences. Single or multiple Streaming Servers may be deployed across the network. Streaming Servers may be deployed at a centralized headend or at distributed remote hubs or both. The choice of deployment architecture will ultimately be driven by a number of factors, such as: operational feasibility, network transport availability, scalability, content caching and propagation, and the overall cost. The Asset Propagation Manager is responsible for propagating the assets coming from the AMS to the appropriate Streaming Servers. The policies in the Asset Propagation Manager may be determined by a number of factors. For example:
• Storage capacity: determine if there is enough storage for content files.
• Content duplication: determine whether the content needs to be duplicated in a distributed manner.
The interface between Asset Propagation Manager and Streaming Server (Interface A3) is defined so that Streaming Servers from multiple vendors can be introduced to work within the same propagation service framework. It is essential that this interface hides the internal implementation of each Streaming Server’s storage system. The interface may include parameters such as the required storage capacity, the available storage capacity, service group coverage, and whether to duplicate a content file. The On Demand Client interfaces with the Session Manager for session signaling (Interface S1) and with the Streaming Servers directly for stream control (Interface C1).
SHARED EDGE RESOURCES
Another key area of evolution of the VoD architecture is the availability of a common, open interface that enables multiple services to share multiple edge devices on the same network at the same time. This can be achieved by introducing standardized interfaces between the Edge Resource Manager, the Session Manager, and the Edge Devices. The Edge Resource Manager is responsible for allocating and managing the resources that are required from the Edge Devices. Typically, the Edge Resource Manager needs to know the topology of the service groups that Edge Devices are serving. When the Session Manager requests resources for a specific session, the Edge Resource Manager needs to determine which Edge Device to use, specify input UDP port and IP address to be

utilized, define output MPEG program parameters, and set the output RF frequency. Other functionalities of the Edge Resource Manager may also include bandwidth management and quality of service. For example, additional edge bandwidth may be required from a QAM to dynamically add content to an existing session. Quality of Service can also be provided by using techniques like MPEG bit rate reduction. The main function of the Edge Devices is to receive the multiple MPEG Single Program Transport Streams carried over UDP/IP from the IP transport network, multiplex them into MPEG Multiple Program Transport Streams, and generate QAM modulated signals. The other features of Edge Devices may include:
• MPEG PID (Packet ID) and / or TSID (Transport Stream ID) remapping
• PCR (Program Clock Reference) re-stamping
• Statistical multiplexing • Bit Rate Reduction
SESSION BASED ENCRYPTION
Session based encryption is the ability to dynamically encrypt on demand content in real time using a Conditional Access System (CAS) that the set-top box supports. This makes it possible to enable multiple conditional access systems to support legacy as well as next generation set-top boxes. The encryption of digital services can be achieved by using the Entitlement Control Messages (ECM) and Entitlement Management Messages (EMM). ECMs are used to secure the control words that are
required to scramble the packets. EMMs are used to enable specific users to retrieve the ECMs that are required to decode the control words and de-scramble the packets. In the case of pre-encryption, ECMs/EMMs are generated a manner that enables a group of digital set-top boxes to access content that has been pre-encrypted and stored at the server ahead of time. In case of session based encryption, ECMs/EMMs are generated and assigned to a particular session. The content has to be scrambled on the fly at the Encryption Engine. Whether the content needs to be encrypted may be determined by a number of factors. Content providers can require the asset to be encrypted by enabling the “Encryption” field in the corresponding asset metadata file as defined by Content Specification 1.1. Network operators can also require the specific service to be encrypted. In addition, the system shall be able to identify which CA system to encrypt the content in case of multiple CAS headend. The Encryption Resource Manager is responsible for managing the Encryption Engines and provisioning the encryption resources required by sessions. The Encryption Engine performs real time encryption of the MPEG-2 packets carrying on demand content. It can be located anywhere between Streaming Servers and edge devices. For example, the encryption engine may be embedded in a multiplexer or edge QAM device. In order to perform the session based encryption, the Encryption Engine needs to retrieve the appropriate parameters such as the ECMs from the corresponding CA system.

MULTIPLE SERVICES
In order to enable multiple services over the same on demand platform, a service architectural model is proposed (see Figure 4). In this model, each service will be able to use one type of the Session Manager. Several different types for Session Managers can be defined to further optimize the protocols and actual implementation for a variety of applications. Networked PVR Networked PVR (nPVR) services allow the subscriber to watch broadcast programming on demand and interact with a live broadcast programming (e.g. pause or rewind). To effectively achieve this goal, the network operator must record, manage, and stream broadcast programming content in real-time based on each subscriber’s requests. The reference architecture and associated interfaces can be extended to support these features by adding a few more capabilities. In particular,
• Real time asset ingest must be supported to the Streaming Servers. In particular, this includes the ability to import metadata, like programming schedule information, into the Asset Management System.
• The segmentation of the digital video
programming (start and end of the programming segments) needs to be addressed. An operationally friendly scheme is also required to address programs that start late or overrun their original schedule.
• The subscriber will be able to perform
asset query, purchase authorization request, and session setup / teardown
for time-shifted content, just as any video on demand service.
• For live broadcast, the subscriber will
automatically trigger a Networked PVR session by issuing a command such as Pause or Rewind.
The Networked PVR services impose significant challenges on the performance of the overall system. For example, the Streaming Server will be required to handle large amount of real time stream ingest. The Session Manager and Resource Managers will be required to manage a large number of simultaneous sessions in cases such as a popular live broadcast. The architecture and interface design must take these issues into consideration. Interactive Advertising The Next Generation On Demand Video Architecture opens new opportunities for providing innovative interactive advertising. For example, advertisement can be inserted at the beginning of a VoD session. The advertisement can be either determined statically based on the asset metadata or dynamically targeted to a particular subscriber based on a set of business rules. From an architectural perspective, there are several areas of interest surrounding interactive program insertion services. They include: where the digital insertion will happen, how it can be done, and what determines the advertising play list. A digital program can be inserted either at the Streaming Server location or at the Edge. Insertion at the Streaming Server provides an integrated approach and can leverage the existing storage and streaming infrastructure. Insertion at the Edge will allow separately managed Ad content servers to interface with

Edge Devices, eliminating the need for a given Ad to be stored on the same server as the content it is being inserted in. In both cases, CableLabs Digital Program Insertion standards can be used to define the cueing messages that are required for splicing MPEG-2 streams. In addition, digital program insertion into encrypted streams should be handled properly. Switched Broadcast Video The architecture can be extended to support Switched Broadcast Video services. A switched broadcast system only sends the digital broadcast video streams that are being watched to their corresponding service groups. In addition, a subscriber can join an existing multicast that is available to its corresponding service group. In more precise terms, Switched Broadcast Video is a tool to save bandwidth rather than a new service. From the subscriber’s perspective, he or she still receives the same broadcast video service when switched broadcast is used. In fact, an ideal switched broadcast implementation would make it impossible to tell that the stream was switched at all. If each one of the digital broadcast channels is being watched by a subscriber in the same service group, the Switched Broadcast Video approach does not yield any bandwidth savings. However, the more likely situation is that several channels in each service group would go ‘unwatched’ at any given time. This “concentration ratio,” (i.e. the percentage of all available channels that are watched by each service group) is the primary driver of any bandwidth efficiency that can be realized through a Switched Broadcast Video solution. One way to extend this architecture to support Switched Broadcast Video is to utilize the Session Manager to manage broadcast
sessions. For each channel change, the subscriber will send a message to the Session Manager, which, in turn, determines if the requested channel is already being sent to the subscriber’s corresponding service group. If the requested channel is already being sent to the service group, the session manager will instruct the subscriber to join the existing broadcast session. A new broadcast session is assigned if the requested channel is not already being sent to the service group. The Session Manager will negotiate with the Resource Managers to allocate resources required for the session. The Edge Device needs to dynamically retrieve the MPEG single program transport stream that carries the requested broadcast program (likely via IP multicast) and generate the MPEG multiple program transport stream. As part of the session setup response message, video tuning parameters, such as frequency and MPEG program number, are sent back to the subscriber to access the requested broadcast channel. Switched Broadcast Video imposes specific requirements on the performance of the overall system. For example, the broadcast session setup/channel change latency needs to be minimized to achieve desired channel change response time. In addition, frequent channel hopping in peak time can cause significant upstream traffic required to carry session messages. It is necessary that the architecture and interface design take these issues into consideration. Streaming Media to PC It is desirable to share the on demand video service infrastructure among multiple services and multiple devices, including the Streaming Media services to PC and other video enabled devices.

There are several aspects which should be considered when expanding the architecture to support shared Streaming Media platform.
• Shared asset distribution and asset management system.
• Shared session and resource management.
• Shared streaming servers. • Shared entitlement and billing system.
Future digital set-top boxes may support advanced codecs, such as MPEG-4/AVC or Window Media 9 in addition to MPEG-2. They might also be able to receive video content over IP/DOCSIS. The VoD architecture evolutions discussed in this paper can be extended to support these capabilities in the next generation all digital platform.
SUMMARY
This paper describes a next generation VoD architecture model and its associated interfaces that will enable multiple services to be provided through multiple servers, multiple edge devices, and multiple customer premise equipments using the same underlying infrastructure. Open interfaces among the various components are the key to achieving this goal. Work is on-going to finalize the interface specifications and creating a deployment migration strategy from today’s VoD architectures to the next generation framework.
REFERENCES
[1] CableLabs Video On Demand Content Specification Version 1.1, April 15, 2003
[2] CableLabs Asset Distribution Interface
Specification Version 1.1, April 15, 2003
[3] Pegasus Session Setup Protocol, Version
1.0 and Version 2.1, Time Warner Cable [4] Pegasus Lightweight Stream Control
Protocol, Version 1.0, Time Warner Cable
[5] Pegasus Interactive Service Architecture
Version 1.3, Time Warner Cable [6] ISO/IEC 13818-6: MPEG-2 Digital
Storage Media – Command and Control (DSM-CC)
[7] ISO/IEC 13818-1: MPEG-2 System [8] ISO/IEC 13818-2: MPEG-2 Video [9] IETF RFC 2326, Real Time Streaming
Protocol (RTSP) [10] Insertion Cueing Message for Cable
Television System [11] ANSI/SCTE 30 2001, Digital Program
Insertion Splicing API

HIGH AVAILABILITY CONSIDERATIONS FOR AN END-END CABLE IP NETWORK
Navin R. Thadani
Cisco Systems, Inc.
Abstract As Cable MSOs start deploying PSTN replacement voice services (over IP), availability and reliability become important considerations. However, there is a lot more to high availability than the number of nines on a certain network device. In addition to looking at device level availability, it is also important to understand the availability of the end-end network taking into consideration the various system level inter-dependencies. Further, it is even more important to understand, evaluate and design a network keeping in mind “service availability”. In the case of a voice service, two popular service availability metrics are the number of calls dropped and the number of ineffective attempts. This paper reviews the availability requirements of a “primary line” (PSTN replacement) voice service, dispels some of the popular five 9s myths about the PSTN; and then establishes a framework by which to analyze and design a network to achieve the required level of service availability. The paper also outlines some of the modifications in terms of redundancy as well as routing optimization that may be required on the edge, in the regional networks as well as the backbone networks in order to support PSTN equivalent voice over IP networks. In other words, it reviews some of the changes that need to be made for transport at the edges and between distribution networks in order to support
highly available and reliable services such as voice over IP and digital broadcast video. It outlines the evolutionary path of the current High Speed Data IP networks to highly available service delivery platforms in the future.
PSTN AVAILABILITY MYTHS The issue of availability is surrounded by several myths and misconceptions. Three of the popular myths are mentioned below … 1. The PSTN provides 99.999% (five 9s)
of availability and reliability end-end. 2. One needs fives 9s level availability on
every platform in order to achieve PSTN equivalence.
3. Every failure in the network is recovered in less than 50 milliseconds.
THE FIVE NINES MYTH.
PacketCable (VoIP Availability and Reliability Model for the PacketCable™ Architecture - PKT-TR-VoIPAR-V01-001128) does an excellent job in dispelling some of these myths. It notes that the idea of PSTN reliability being FIVE 9s is incorrect. It clearly breaks down the different subsections of the PSTN network and draws a direct analogy to an equivalent IP network. As per these requirements, the end-end availability of a VoIP network should be greater than 99.94% to achieve equivalence with the PSTN. In addition, PacketCable also specifies some “service availability” metrics. These include the number of calls dropped and the number of ineffective attempts.

As per the report, there should not be more than 1 in 8000 calls dropped (or cutoff calls), and no more than 5 in 10,000 ineffective attempts. These are exactly the same as the PSTN requirements on availability and service availability as set forth in Bellcore GR series specifications. Cutoff calls arise due to failures in the bearer path of the voice call. At the two end points of the bearer path (that is the CMTS facing the customer and the PSTN gateway facing the PSTN in the case of an on-net to off-net call) a cutoff call may occur due to a failure on a line card and a failure to copy call state information to the standby line card (in the event that there is redundancy). However, in the rest of the network, there is no concept of call state (being IP). Let’s say there is a failure, in a core router in the network, and it takes 40 seconds to reroute traffic to the alternate path. One has to imagine that an end-user would get frustrated and hang up the phone after a certain period of time. This should also be considered to be a cutoff call. Hence in the realm of IP, a cutoff call could occur due to two reasons. Inability to maintain call state at the end-points in the event of a failure, and/or, inability to recover traffic within a certain cutoff call threshold in the event of a failure at the end-points or in the core of the network. In reality, the cutoff call threshold is user dependent, but most IP telephony providers are settling on 3 seconds as that threshold. That is, if there is a failure in the network, and the user experiences “dead air” for more than 3 seconds, they would hang up and it would be counted as a cutoff call. Cutoff calls are sometimes referred to as “Calls Dropped” and can also be measured as defects per million. For example, 1 in 8000 cutoff calls could also be referred to as 125
Defects Per Million DPM(Calls Dropped) or DPM(CD). Ineffective attempts arise due to failures in the signaling path of a voice call. As per the PacketCable definition, “an ineffective attempt occurs when any valid bid for service does not complete because of a fault condition (e.g., hardware or software failure)”. That means, if a user is trying to make a call but cannot due to a signaling path failure, it is counted as an ineffective attempt. However, here again we have to define a threshold. The popular ineffective attempts threshold that exists in the industry today is 30 seconds. Hence if a user is trying to make a call, it doesn’t get through, he/she tries again and the call is completed the second time, as long as the whole process completes in less than 30 seconds, it is not counted as an ineffective attempt. Ineffective Attempts could also be expressed as Defects Per Million or DPM (Ineffective Attempts) or DPM(IA). So 5 in 10,000 ineffective attempts could be stated as 500 DPM(IA).
THE 50 MSEC MYTH Originally the 50 msec threshold was established in the 1980s because the voice channel banks that were used in carrier networks could not tolerate failures that lasted more than 200 msec. When failures exceeded that threshold, a Carrier Group Alarm (CGA) would be activated causing the channel bank to perform a “trunking condition” procedure that would terminate all connections on that particular T3 line. Since the outage budget had to be less than 200-300 msec, 50 msec emerged as the de facto standard. This decision was ironic because by the time the de facto standard was actually adopted, newer technology allowed a CGA timer of 2 secs. We must bear in mind that this is for circuit switched

technology. In the case of IP, all signaling is message based. Hence there is no hard and fast requirement for 50 mesc recovery. Rather, a more practical “user perceived threshold” of 3 secs can be adopted for a “dropped call”. Given the findings in PacketCable, it is clear that … 1. The PSTN does not offer 99.999% end-
end. Although certain components in the PSTN network may be five 9s (as is also the case with IP equipment) the end-end network meets a specification of > 99.94%.
2. It follows that all devices in the network do not have to be five 9s, rather, the end-end network should be > 99.94%.
3. All failures do not have to be recovered in less than 50 milliseconds. Failures should be recovered within the calls cutoff and ineffective attempts threshold and the end-end network should cause no more than 1 in 8000 calls cutoff and no more than 5 in 10,000 ineffective attempts. The industry accepted practical thresholds for calls cutoff is 3 seconds and that of ineffective attempts is 30 seconds.
These three metrics together (availability/downtime, cutoff calls and ineffective attempts) are required to define an operating range. We can’t use only availability to understand end-user service experience. The end-end availability budget as specified by PacketCable is 99.94% and this translates to 315 minutes of downtime per year. Now, consider for example, a network that has one major failure and a user sees an outage for 500 mins. That means he/she cannot make a call for more than 8 hours. Is this acceptable? If they were on the phone at the time of failure, it would constitute only 1
dropped call, but exceed the downtime budget. At the same time, there could be repeated failures in the network, each of 3.1 seconds in duration. This would allow us to have 6096 Dropped Calls but still be within our 315 minute downtime budget.
DPM (Calls Dropped)
125
315 Mins of downtime
X (315,6096)
X (500,1)
Acceptable Range
Similar logic can be used to see why we need the third metric – Ineffective Attempts. Let’s say for example, that the call control server is down, but the data path is up. This would mean 100% availability as per our downtime definition but the user will still not be able to make any calls.
CALCULATING AVAILABILITY AND SERVICE AVAILABILITY METRICS
In this section, we will cover some basic theory around calculation of these metrics, but will not get into too many details around the math. The main focus of this paper as mentioned earlier is to establish a framework by which to analyze and design networks for High Availability. Availability: Availability is commonly defined as MTBF/(MTBF+MTTR). Such a definition for availability is good for a simplex system (a system comprising one box). However, in a network that consists of a number of trunks and routers, most failures are partial failures. As a result of a partial failure some customers will not receive service, while others have un-interrupted service. Also, even within a router or a switch only one line card may go down, and users connected

to other line cards may not see any disruption in service. Hence availability is defined with respect to a customer of the network. To compute availability, we only need to consider the components along the path needed to provide service to a single customer and then average this over all customers. In addition to partial failures described above, we also have to take into consideration redundancy. For example, certain components such as line cards may be configured in terms of 1:N Active standby or 1:N Load sharing. In order correctly calculate the availability of a single part such as a line card or route processor; one has to take into account several factors such as … a. Switchover time – the amount of time
taken to switchover from the active component to the standby component.
b. Active Coverage Factor – the probability that a failure is successfully detected and switched over
c. Standby Coverage Factor – the probability that the standby is in working condition and can successfully take over.
We can use a Markov State definition for each component like a route processor, line card etc within a router or a switch. This is illustrated in Figure 1 for 1:N redundancy. Given the value of the parameters in the legend, the above Markov chains can be solved giving the probabilities in all the different states in the chain. For a given type of redundant part, the combined part availability, combined part MTBF and combined part MTTR are calculated as shown in the equations in Figure 2.
Based on the above equations, once we calculate the availability of each and every component along the path of a voice call we take a product of these individual availability numbers to get the availability of the overall system or network. It is important to note that this gives us just the availability and downtime of the system or network and does not provide us any insight in terms of whether the service (in this case voice) is available or not. For that we need to examine two other “service availability” metrics; calls dropped and ineffective attempts.
CUTOFF CALLS/ CALLS DROPPED / DPM(CD)
From a high level, based on the definition of dropped calls, it is easy to see that this metric is a function of the MTBF. The Calls Dropped contribution by each component (line cards, route processor, chassis, power supplies etc) along the path of a single user needs to be calculated. For each component, we calculate the DPM(CD) as shown in Figure 3 (all parameters are assumed to be in hours) … For an average 3 minute call. This can also be expressed more generically as shown in equation A in figure 3… Where for each failure, the switchover time (in case of a redundant part) or the repair time (for a non redundant part) is greater than the calls dropped threshold of 3 seconds.

INEFFECTIVE ATTEMPTS / DPM(IA) We follow a similar process to calculate the Ineffective Attempts contribution per component along the path of a single user. Again, we only count each failure where the switchover time or repair time is greater than the ineffective attempts threshold of 30 seconds.
TREATMENT OF PLANNED DOWNTIME
From the derivation of the equation of Calls Dropped, we see that the term “in-coming call rate” appears, but is cancelled from the numerator and denominator. This means that the DPM(CD) (and DPM(IA) for that matter) is for a uniform call rate. Since in the previous section we were calculating unplanned DPM(CD) and DPM(IA) the implicit assumption is that it was for the mean call rate over a 24 hour period. However, when equipment is upgraded or we have to perform any kind of scheduled or planned maintenance, there is also a certain amount of downtime and associated loss of service in terms of calls dropped and ineffective attempts. To calculate the effect of scheduled outages on service availability, we can use a similar method as above with the exception that instead of a summation across a number of random failures (as is the case with unplanned outages), we look at only calls dropped or ineffective attempts that are caused due to the outage time during the upgrade (say twice a year). Most often, scheduled maintenance is done late at night (say 3am) to minimize the impact of downtime on service availability. Now, the incoming call rate at 3 am is significantly lower than the mean call rate. Hence we would have to factor down the DPM(CD) and DPM(IA) by the ratio of the
call rate at 3am to the mean call rate, to arrive at terms that are comparable and additive. In fact an analysis of the average call volume to the call volume at 3 am (maintenance window) shows a 10-15% night factor. Please see figure 4. EXAMPLE OF USING THE OUTLINED
FRAMEWORK TO ESTIMATE THE AVAILABILITY AND SERVICE AVAILABILITY OF A CERTAIN
NETWORK DESIGN We will now use the theory outlined above and work through an example of how to estimate the availability and service availability of a certain network design. In working through this example we also highlight the importance of a systems view, and the system level interdependencies that come into play. Further, we also stress the role that the layer 3 routing architecture plays in high availability in a network. Consider the network shown in Figure 5. It consists of a non redundant CMTS connected to a non redundant aggregation router. This then connect to a pair of redundant core routers which then connect to a pair of redundant switches in the data center behind which are the voice components like the Softswitch, PSTN gateway, provisioning servers etc.
The “Night” FactorThe “Night” Factor
6 am 6 am3 am
50%Unplanned Call Rate (mean)
Daily Call Rate
This is a very conservative assumption
The “Night” FactorThe “Night” Factor
6 am 6 am3 am
50%Unplanned Call Rate (mean)
Daily Call Rate
This is a very conservative assumption

Step 1: Reliability Block Diagram The first step in understanding the availability and service availability characteristics of a network is to lay out a detailed reliability block diagram of all the components involved in the path of the voice call. Please refer to figure 6 for more details. In our basic example, the CMTS consists of 3 components; the RF line card, the route processor and the FE uplink card. This is a simplistic scenario because in reality there are a lot more components including power supplies, timing cards, software (on the route processor and line cards) etc. So our 3 components are shown in series in the reliability block diagram below, because they are single points of failure. The aggregation router is also assumed to have 3 components; the FE line card, the route processor and the GE line card. The FE line card is shown in series because it is a single point of failure, but the route processor and the GE line card are shown in parallel because they are assumed to be intra-chassis redundant in our hypothetical configuration. Similarly, one has to define the detailed RBD for the rest of the network as well. This includes the core router (in which all components will be in parallel), the Data Center switch, the PSTN gateway and the IP Softswitch. Figure 6 represents the hardware components. However, we also need to model software as series or parallel components. We assume the CMTS has software on the route processor and line card. In this case since they are non redundant, they are modeled as serial components. Similarly software on the aggregation switch
and core router route processors have to be modeled in parallel as they are set up in a redundant fashion. Step 2: Failure scenarios – Estimating MTTR and switchover time. The second step in this process is to evaluate in detail the potential outage for a voice call in the event of failures for each component along the path of the voice call. In order to do that, we have to evaluate the upstream and downstream outage for each failure. Further, we need to take into account system level dependencies such as routing. For example if a line card fails, the outage time may be dependent on how fast layer 3 can detect the failure and route around it, both in the upstream and downstream directions. In addition to the unplanned failures described above, we also need to estimate the outage caused due to planned upgrades. The table shown in Figure 7 outlines the possible outage times due to various possible failures in the network. As mentioned above, this takes into consideration (where applicable) the routing system interdependencies. Further, at this stage, we also need to estimate the outage time due to software upgrades. For example, in the case of the CMTS it may take from 5-11 minutes (including reboot time and routing table set up time) for a CM/MTA to register with the provisioning system and then start passing traffic. In the case of the aggregation router, this time will also be dependent on the route table establishment time. This can be anywhere from a few seconds to a few minutes depending on the complexity of the routing setup.

Step 3: Estimating MTBF and failure rates Having laid out the reliability block diagram and the failure scenarios, we need to estimate the MTBF of each component (hardware and software). Hardware MTBF is usually obtained from manufacturers databases. Software MTBF typically is collected from network operations be measuring the unplanned software reboots or other failures over a period of time for a sample set of devices. With each of these assumptions in place we now use the theory described in the previous section to calculate the availability, calls dropped and ineffective attempts contribution per element (such as CMTS RF line card, route processor etc). The idea is to reduce the above diagram to its serial equivalent components by calculating the combined MTBF and combined MTTR of each of the components involved. This is done using the Markov States described in the previous section. The overall availability, DPM(CD) and DPM(IA) for the entire network are calculated using the formulas shown in figure 8. The availability/downtime results for Case 1 are represented by the first bar in figure 10. The DPM(CD) and DPM(IA) results are shown in figure 11. Now, in Case 2, we make some modifications to the network design and add some High Availability features to the network devices. Some of these are listed below.
• Redundancy at the edge of the network (on the CMTS). Line card,
route processor and WAN card redundancy.
• Inter-chassis redundancy on the aggregation routers. The CMTS is then dual homed to the redundant pair of aggregation routers.
Please refer to figure 9 for more details on the network topology for case 2. In addition to the topology modifications from Case 1, in Case 2 we are also assuming some form of routing optimization for High Availability. Since this is a simple directly connected Ethernet network, we would need to reduce the SPF computation hold timer to about 1 second (default value being 5 seconds) so as to reduce some of the failures in case 1 (which were about 6 seconds) to <3 seconds so as to avoid any dropped calls. In cases where the network is more complex, with say Layer 2 SONET (or any multi-access) connectivity between the aggregation routers and a distribution layer, the routing optimization can get significantly more complex. In this case we may need to reduce the OSPF hello and dead timers in addition to the SPF computation timer. The default values of hello and dead timers in OSPF are 10 seconds and 40 seconds respectively; and were set more than 10 years ago keeping in mind data applications that did not need fast convergence. As a result, without optimization it is possible to see some failures causing outages in the region of 40-45 seconds. However, reducing the dead timer to say about 1.5 seconds and setting the hello timer to 0.5 seconds with three hellos per dead timer will get the detection time down to about 1.5 seconds. Hence it would be possible to see total outages in the region of less than 3 seconds. In certain cases depending on the complexity of routing in the network, static routing in

certain parts of the network and reduced timers in others can lead to even sub second convergence. There is however a tradeoff in this case where if the timers are set too low, it may cause instability in the network. This can cause serious problems as a failure on one line card which would have otherwise affected service only to a set of customers, has now propagated to the rest of the network taking down service for a far grater number of subscribers. In addition to the routing architecture modifications, we also assume certain basic HA features on the network elements. For example in the CMTS, if the route processor fails, the cable line cards are not reset and the CMs are not dropped. We also assume that call state in maintained during switchover to the standby route processor (whether it is within the same chassis or implemented in an inter-chassis fashion). Given the discussed enhancements from case 1 to case 2, we have to re-define the Reliability Block Diagrams and the failure scenarios and redo the mathematical analysis. The results for Case 2 are shown in figures 10 and 11. In case 3, we assume no additional network topology changes. However, we implement advanced HA features which enable us to upgrade software or hardware with interruption to service. For example, we can switch off one route processor, have all CMs/MTAs be serviced by the standby route processor (without dropping calls or losing call state), upgrade software on the primary RP, and then switch back over again.
In addition, implementation of advanced monitoring and early warning (especially on the RF side) HA software on devices will help further reduce downtime and improve service availability. The results for case 3 of the network are also shown in figures 10 and 11.
COMPARISON OF RESULTS As can be seen from figures 10 and 11, the base case network can be expected to be down for about 102 minutes per year for the average customer. This consists of about 56 minutes of unplanned failures (that can happen at any time of the day) and about 46 minutes of planned downtime (that occurs at 3 am in the morning, when the likely-hood of a call in progress is extremely low). The PacketCable availability budget for this portion of the network is 71 mins of downtime per year. Hence the base case network is about 71% over the PacketCable budget. By introducing redundancy on the CMTS and the aggregation routers, optimizing the routing architecture and implementing HA features that maintain calls sate even in the event of RP failure, enabling the line cards to continue forwarding traffic we can reduce these numbers by 60%. This brings us to a total of about 41 minutes of downtime per year, which is significantly better than the PacketCable guidelines. By further adding more advanced HA features like the ability to upgrade software without service interruption and advanced HA monitoring features, this number can be driven down to 15.5 minutes of downtime per year.

In the case of Calls Dropped, we see that the base case network will have about 26 calls dropped per million and by making the recommended enhancements, this can be reduced to about 9 DPM(CD). Similarly DPM(IA) can be reduced to about 20 from a current 128. It is important to note that PacketCable does not break down the DPM(CD) or DPM(IA) budget by network component, so it is difficult to derive a ‘budget’ for this portion of the network. However, it is important to note, that this portion of the network (the CMTS, Local IP network and voice components) can contribute only about 5-7% of the end-end DPM(CD) budget. This means that even if the CM, the HFC plant, and the IP backbone (or PSTN network depending on the mode of transport) contribute about 90% of the 125 DPM(CD) budget, the network will still meet the guidelines. Cable MSOs must conduct a similar analysis for the CM and the HFC network to determine whether the end-end network meets the PacketCable guidelines for PSTN equivalent voice service.
CONCLUSION There is much more to availability than the number of nines on a box. In order to design a highly available network, one has to keep in mind end-end network availability and more importantly the *service availability*. In the case of voice, these are calls dropped and ineffective attempts.
When analyzing and designing a network for availability, there are complex system level dependencies and interaction between devices that need to be considered. Routing plays a critical role in highly available networks. In addition, for an IP network to be equivalent to a PSTN in terms of availability, it does not have to be five 9s end-end; rather, it needs to be greater than 99.94%. It should also meet the end-end service availability metrics of < 125 DPM(CD) and <500 DPM(IA). It follows that all failures do not need to be recovered in less than 50 msec as long as the number of dropped calls and ineffective attempts do not exceed the above requirements. The framework established in this paper can be used to evaluate the availability and service availability of an IP network, study the effect of redundancy at different points in the network, and make an economic based decision in terms of the increase in availability for a certain amount of capex. Lastly, it is possible for a well designed IP network to meet and in certain cases exceed the availability of the PSTN.
ACKNOWLEDGEMENTS
The author would like to thank the following people from Cisco Systems for their invaluable guidance and contribution to this paper – John Chapman, Jim Forster, Madhav Marathe, Henry Zhu, Alvaro Retana, Paul Donner, and Latha Vishnubhotla.

6
sec3
6
sec3
6
sec3
6
sec3
101603
24365)__min(
10)243651()____min(
____
10))_____(__
10__
(
××
××
×××××
×
×
∑
∑
∑
∑
>−
>
>−
>−
×
scenariosfailureall
scenariossfailureall
scenariosfailureall
incidentsall
MTBF
ratecallgInco
MTBFcalloflengthrateCallgInco
yearoneincallsTotal
scenariothatoffailuresofnumberfailureoftimeatcallsExistingAttemptedCallsTotal
droppedcallsExisting
6
sec3
6
sec3
6
sec3
6
sec3
101603
24365)__min(
10)243651()____min(
____
10))_____(__
10__
(
××
××
×××××
×
×
∑
∑
∑
∑
>−
>
>−
>−
×
scenariosfailureall
scenariossfailureall
scenariosfailureall
incidentsall
MTBF
ratecallgInco
MTBFcalloflengthrateCallgInco
yearoneincallsTotal
scenariothatoffailuresofnumberfailureoftimeatcallsExistingAttemptedCallsTotal
droppedcallsExisting
Figure 1 (1:N Active Standby – Markov State Diagram)
statesfailuretostatesfailurenonfromratestransitionofsumMTBFcombined
1=
statesmarkovfailurenoninarepartsredundantthethatiesprobabilitofsumtyAvailabili combined =
combinedcombined
combinedcombined MTBF
tyAvailabilityAvailabiliMTTR ×
−=
1
statesfailuretostatesfailurenonfromratestransitionofsumMTBFcombined
1=
statesmarkovfailurenoninarepartsredundantthethatiesprobabilitofsumtyAvailabili combined =
combinedcombined
combinedcombined MTBF
tyAvailabilityAvailabiliMTTR ×
−=
1
Figure 2: Availability Equations
Figure 3: Calls Dropped Equations
(N+1) λ(1 − C) 1
(N+1) λ c
β
µ
2µ
2 3
45
µ
÷(N+1) ÷ N
÷ (N+1)
N λ
State Descriptions 1 All units working 2 One of the units failed, detected. 3 N units have taken over the traffic from the failed unit.
4 Second unit failed before the first failed unit is repaired.
5 One unit failed, undetected
Legend
λ = Failure rate of individual unit
β = Rate of traffic switchover from the failed unit to other healthy unit(s)
µ = Repair rate of part failures
C = Switchover coverage
N = Number of units out of the total of N+1 load - sharing units ÷(N+1) because each unit handles only 1/(N+1) traffic.
(N+1) λ(1 − C) 1
(N+1) λ c(N+1) λ c
β
µµ
2µ
2 3
45
µµ
÷(N+1)÷(N+1) ÷ N÷ N
÷ (N+1)÷ (N+1)
N λN λ
State Descriptions 1 All units working 2 One of the units failed, detected. 3 N units have taken over the traffic from the failed unit.
4 Second unit failed before the first failed unit is repaired.
5 One unit failed, undetected
Legend
λ = Failure rate of individual unit
β = Rate of traffic switchover from the failed unit to other healthy unit(s)
µ = Repair rate of part failures
C = Switchover coverage
N = Number of units out of the total of N+1 load - sharing units ÷(N+1) because each unit handles only 1/(N+1) traffic.

0%
20%
40%
60%
80%
100%
120%
140%
160%
180%
200%
0:00
1:00
2:00
3:00
4:00
5:00
6:00
7:00
8:00
9:00
10:0
0
11:0
0
12:0
0
13:0
0
14:0
0
15:0
0
16:0
0
17:0
0
18:0
0
19:0
0
20:0
0
21:0
0
22:0
0
23:0
0
% Ratio of Call Rate at a given time to average call rate across the day –Calculated for weekdays (Monday through Thursday) based on sample market
data
% Ratio of Call Rate at a given time to average call rate across the day –Calculated for weekdays (Monday through Thursday) based on sample market
data
Field experience shows that ratio of call rate at maintenance time to average call rate is 15%-17%.
This means that there is a 15% impact of downtime during a maintenance window.
PacketCable does not break down planned to unplanned budgets, but clearly there is less of an impact.
Figure 4: Example “Night Factor” – average call rate across a 24 hr period
CMTS Agg Router (A)
Agg Router (B) Router (B)
FE GE/OC-48
GE/OC-48
OC-192
GE/OC-48
IP Backbone
Hub site
1 2 3 4 5
Router (A)
Switch (A)
PSTN Gateway / Softswitch and other ser vers
6 7
9
8
10
11
Switch (B)9 10
Master Head-end
Master Head-end
Hub site
Figure 5 : Case 1: Network diagram

Cable Line Card
Route Processor
WAN Interface
FE InterfaceRoute
Processor1:1 Intra-chassis
GE Interface 1:1 Intra-chassis
MTBF (hrs) 120,000 150,000 250,000 250,000 400,000 250,000
MTTR 3 hrs 3 hrs 3 hrs 3 hrs 3 hrs 3 hrs
Switchover Time
NA NA NA 6 secs 6 secs 6 secs
Active Cove rage Factor
NA NA NA 98% 98% 98%
Similar Reliability diagram for the
rest of the network
RELIABILITY BLOCK DIAGR AM (RBD)
MTBF, MTTR, Switchover time and coverage assumptions for every component in RBD
Similar Assumptions for
the rest of the network.
CMTS AGG R OUTE R (A)
Figure 6: (Reliability Block Diagram and Markov Parameter Assumptions)
Upstream Down-stream
Upstream Notes Downstream notes Total Outage
Calls Dropped ?
CMTS 1 Route Processor 3 hrs 3 hrs This is a Single point of failure. Once this
component fails, there is no path upstream and the outage time depends on someone physically going to change the card. According to PacketCable this time will be in the region of 4hrs
Same as upstream 3 hrs YES
2 Cable Line Card 3 hrs 3 hrs Same as above Same as above 3 hrs YES 3 WAN Card 3 hrs 3 hrs Same as above Same as above 3 hrs YES
Aggregation Switch4 Route Processor 2 secs 2 secs Lets say the switch has dual route
processors, but is not running any specific HA software. The route processor failure resets the line cards. The directly connected core router detects the failure within 1 sec and takes 1 sec to recompute its routes via the second aggregation switch. The outage in this direction would be 2 sec.
Once the FE line card is reset, the CMTS detects it within 1 sec and takes 1 sec to recompute its routes via the second aggregation switch
2 secs NO
5 FE Line Card 3 hrs 3 hrs This is a single point of failure This is a single point of failure 3 hrs YES 6 GE Line Card 0 secs 2 The CMTS continues forwarding traffic to
Agg router 1 because its is the only path available
The core router detects the failure of the GE card on Agg Router (A) almost immediately, and then delets that route from its table. It then starts forwarding traffic intended for the CMTS through Agg Router (B) via the OC192 interface. Agg Router (B) still has a valid path for the CMTS because it is connected to a different line card on Agg Router (A)
2 secs NO
Example Network - BASE CASEUnplanned Failures
Similar FAILURE SCENARI OS for t he rest of the net work
Figure 7: (Failure Scenario Examples for Base Case 1 Network)

Figure 8: Formulas to calculate end-end network and service availability
Agg Router (C) Core Router (B)
GE/OC-48
GE/OC-48
OC-192
GE/OC-48
IP Backbone
Hub Site
Core Router (A)
Switch (A)
PSTN Gateway / Softswitch and other ser vers
6 79
8
10
11
Switch (B)9 10
Master Head-end
Master Head-end
Hub site
CMTS
Agg Router (A)
FE
1 2 3
4
4 5
Agg Router (B)
Figure 9: (Case 2 – Network enhanced for HA)
∏=com ponentsequivalentseriesall
com ponentnetwork tyAvailabilityAvailabili
∑=pathbearerincomponentsequivalentseriesall
componentCDDPMCDDPM )()(
∑=pathsignalingincomponentsequivalentseriesall
componentIADPMIADPM )()(
∏=com ponentsequivalentseriesall
com ponentnetwork tyAvailabilityAvailabili
∑=pathbearerincomponentsequivalentseriesall
componentCDDPMCDDPM )()(
∑=pathsignalingincomponentsequivalentseriesall
componentIADPMIADPM )()(
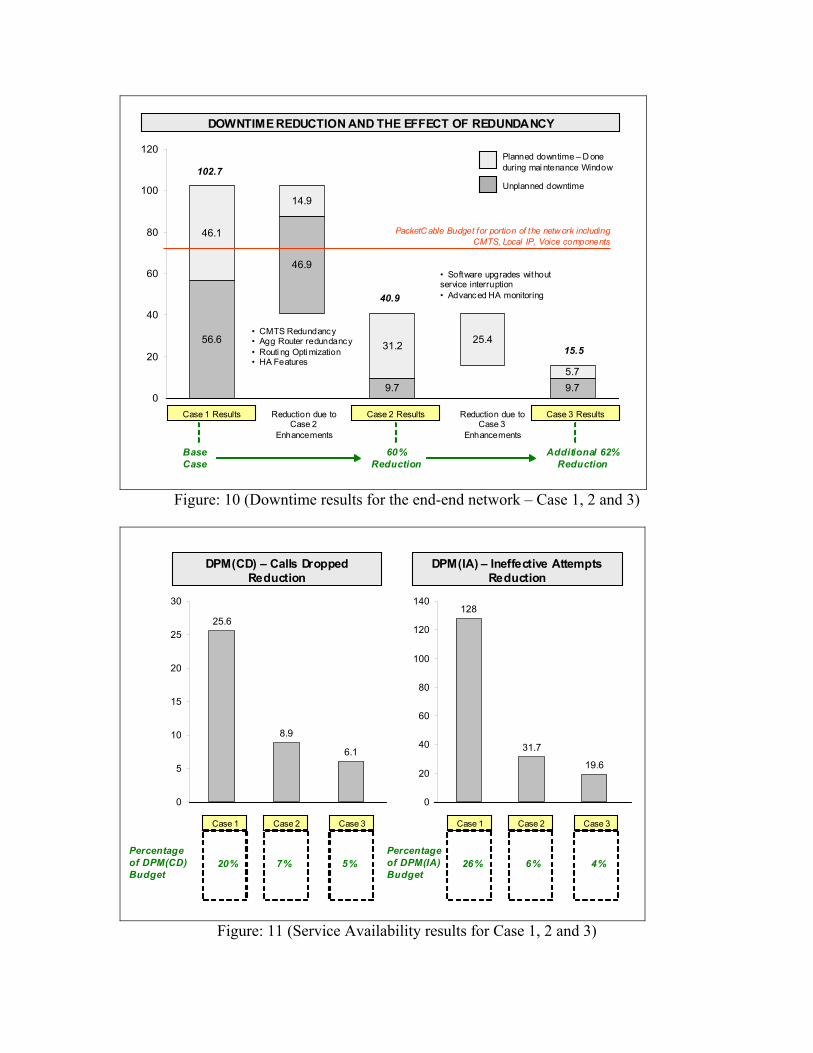
DOWNTIME REDUCTION AND THE EFFECT OF REDUNDANCY
56.6
46.9
9.7 9.7
46.1
14.9
31.2 25.4
5.7
0
20
40
60
80
100
120
Case 1 Results Reduction due to Case 2
Enhancements
Case 2 Results Reduction due to Case 3
Enhancements
Case 3 Results
• CMTS Redundancy• Agg Router redundancy• Routi ng Opti mization• HA Features
Unplanned downtime
Planned downtime – D one during mai ntenance Window
• Software upgrades without service interruption• Advanced HA monitoring
102.7
40.9
15.5
PacketC able Budget for portion of the netw ork including CMTS, Local IP, Voice components
60% Reduction
Additional 62% Reduction
Base Case
Figure: 10 (Downtime results for the end-end network – Case 1, 2 and 3)
DPM(CD) – Calls Dropped Reduction
Case 1
Percentage of DPM(CD) Budget
25.6
8.9
6.1
0
5
10
15
20
25
30128
31.7
19.6
0
20
40
60
80
100
120
140
Case 2 Case 3 Case 1 Case 2 Case 3
20% 7% 5%Percentage of DPM(IA) Budget
26% 6% 4%
DPM(IA) – Ineffective Attempts Reduction
Figure: 11 (Service Availability results for Case 1, 2 and 3)

IS MPEG-2 OUR NEW LEGACY? Yasser Syed, Ph. D., Mukta Kar Ph.D. Cable Television Laboratories
& Vinay Sathe, Ph.D. Multirate Systems
Abstract Cable operators have been looking at advanced video codecs in order to make more bandwidth available to meet ever-growing user demands on cable networks, This paper investigates the issues related to introduction of a new video compression format in cable networks and how it can co-exist with “legacy” MPEG-2 deployments.
INTRODUCTION The introduction of digital cable services using MPEG-2 over 10 years ago was done to meet several objectives: ability to provide hundreds of television programs, reduce capex and opex related to acquisition and distribution, to name a few. The transition from analog to digital required plant upgrades, new encoders, and new STBs along with a revolutionary way of thinking. Today, MPEG-2 set of standards forms the core of audio, video and transport protocols used in the digital cable delivery system [1,2]. Over this same decade, user requirements have changed along with advances in video compression technology. Recently, several new video codecs have been introduced (e.g. WM-9 and MPEG-AVC/H.264). The powerful message of these codecs is hard to ignore: 2-to-3 times the compression efficiency, Digital Rights Management support and increased interactivity with the
content. End users are now interested in “my 500 channels” rather than the standard “500 channels” on their cable networks. Proliferation of new digital services such as VOD, HDTV, DOCSIS, VOIP has increased the need to be able to send more bits on the same pipe. Does the bandwidth crunch necessitate moving to new video compression technologies? Yes and no. In this paper, we present the case that new compression formats should be looked at as complementing the MPEG-2 based deployments in the near term, not replacing them. The introduction of new video (and audio) codecs can act as a part of a bandwidth reclamation strategy instead of a complete overhaul of a cable network. In this paper we first list some bandwidth savings strategies in cable networks that can help reduce the bitrate needs without abandoning MPEG-2 based deployments. Next, we take a look at the issues involved in introduction of new video compression formats. Unlike the analog to digital transition, only new encoders and STBs are required, but plant upgrades are not necessary. This allows for new and old video technologies to co-exist and many of the ideas originated in the earlier transition can be leveraged again.
HOW FAR CAN MPEG-2 GO? MPEG-2 video standard specifies syntax for compressed video bitstream, but does not

standardize an encoding algorithm to generate it. Over the years, better encoding schemes have yielded superior picture quality at a given bitrate using techniques such as improved pre and post processing, smoothing of motion vectors, better rate control (bit allocation) multi-pass encoding and so on. Compared to the early days of MPEG2, the typical bitrate required for broadcast quality video compression has gone down significantly through competitive processes built into developing advances in video encoding marketplace. However, it is interesting to note that certain applications such as VOD have associated business agreements that dictate the bitrate to be constant (e.g. 3.75 Mbps) irregardless of the advances in encoding techniques. Video compression experts generally agree that current state of the technology is such that new encoding techniques to produce MPEG-2 video streams will probably not produce too much further improvement for entertainment quality television programs (See Figure 1). Due to the maturity of the MPEG-2 codec, most significant coding efficiencies at the main profile/main level (MP/ML) have already been explored through the competitive encoder development marketplace .
Figure 1: MPEG-2 Generational
Encoder Improvements
There are ways to extend the coding potential of MPEG-2 by adding new tools and creating new profiles. In the last few years, researchers have been looking at compression techniques beyond MPEG-2. By way of example, some of the potential new additions to the existing tool-kit of video compression techniques include: • Multiple reference frames for prediction. • Variable block size for motion estimation • Special prediction modes for fades • 1/4th pixel motion estimation. • Multiple directions of prediction for I-
macroblocks, • Loop filter to control propagation of error, • Usage of arithmetic coding. Adding these new tools, requires extensive modifications of the MPEG-2 standard and the creation of new products. In essence it would be almost equivalent to creating a new coding standard to handle these changes. In fact, some of the coding gain in advanced codecs come from including these tools [3]. It should be noted that various alternatives exist to reclaim bandwidth other than changing the video compression codec, and may be easier to deploy. A quick list includes: 1. Higher QAM constellations (64 to 256:
~33%/QAM) 2. Shift analog PPV services to digital
(10X/QAM) 3. Switched broadcast Service (~1x/QAM)[4] 4. Stat mux MPEG-2 VOD (~25%/QAM) 5. Convert all (most) analog to digital
(10X/QAM)
STATE OF COMPETITION Not surprisingly, the need for bandwidth is felt by DBS operators too. Due to the need to carry local programming, offer HD services and making bandwidth available for personalized 2-way video services, satellite operators have been looking at various
01234567
1995 1996 1997 1998 1999 2000 2001 2002 2003
Year
Mbp
s
01234567
1995 1996 1997 1998 1999 2000 2001 2002 2003
Year
Mbp
s

options including migration to higher constellation modulation, use of turbo codes and adoption of advanced video codecs. Satellite operators have very little margin left in reducing per-channel bandwidth used by their MPEG-2 video programming and it is inevitable that they have to commit to a new compression standard in near future. However, to date, there are no announced plans of migration to a new video codec. With MPEG-2 technology, DSL providers have not been able to establish a firm foothold in the video delivery market. The desire to adopt an advanced video codec for video delivery has also been reported in the DSL industry because it can open up these markets. Recently approved ADSL-2 standard enables transmission of data at 1.5 Mbps over existing existing phone networks [5]. This channel rate is not enough for entertainment quality video transmission if one is using MPEG-2 compression, but is plenty for advanced codec based transmission. However, High Definition programming still poses a problem because 1.5 Mbps is not enough bandwidth for HD transmission, even for advanced video codecs. Clever attempts have been made to meet that need by a very fancy arrangement of multiple phone lines. For example, UK based Net-to-Net Technologies and Tandberg TV experiment using two lines ADSL loop bonding, as referenced in an Internet report [6]. Another recent shift in business model due to availability of high bandwidth DOCSIS is the content providers directly doing business with consumers by bypassing the need to have business relationship with network operators. Currently, there are only a couple of high profile (and many smaller) TV-over-the-Internet type services available. Two things to note here – decoders used for these services are typically software-based (WM9 or Real), with DRM enhancements to the liking of each content provider, and video compression
algorithms used do not need to be standardized (the exception to this is targeting to portable personal devices). Over time, as the average bitrate needed to deliver entertainment quality video decreasesthe take rate on these services will rise. Whether or not this is an opportunity or threat to cable operators remains to be seen [7]. Wireless network operators have also recognized the new market opportunities in being able to offer video services. Recently, there is a renewed interest in MMDS technology (e.g. WiMAX consortium) that provides fixed wireless broadband access to subscribers. At the bitrates of transmission (1.5 Mbps), advanced video codec will be the logical choice for entertainment quality video services. It is too early to speculate if the wireless operators will provide data and voice only or if they will provide data, voice and video with broadcast television quality video services. In terms of ability to offer converged services (streaming, video conferencing, video cellphone, and traditional video using same codec and protocols) MPEG-2 transport and video technology is at a disadvantage. Migration to advanced codecs and new standards potentially gives a competitive edge to the above network operators by enabling converged service offering.
IMPLEMENTATION COSTS Due to the broadcast nature of the video signal, and number of decoder units; the cost of equipment on the decode side far outweighs the costs associated with upgrading encoding equipment. We therefore only talk about cost of implementation related to the set-top box side. In anticipation of a future move away from MPEG-2 technology to another video codec, several IC manufacturers have already started

building their decoder ICs based on flexible platform (e.g. TI, Equator, ST, Philips etc.) Obeying Moore’s law, providing backward compatibility becomes a less pricey option. As an example, MPEG decoder ICs are sold at approximately <$12 price range. Current MPEG4 decoder pricing is very high (almost a $15 premium over MPEG2 (MP@ML) only decoders), but the premium is expected to go down to less than 7 dollars in 3-4 years [8].
0
5
10
15
20
25
30
2003 2004 2005 2006 2007
H.264 w/MPEG-2
Figure 2 Average Sale Price of decoder IC (Courtsey: In-stat/MDR)
New design and advances in hardware such as Media processors, VLIW processors are changing the traditional “hard-coded” nature of video decompression platform, making it more flexible to adapt to new video codecs.
IS MPEG-2 VIDEO REALLY LEGACY?
The transition to a new digital video codec is not the same as the earlier transition from carrying just an analog Cable TV signal to using a new digital transmission platform. The earlier digital migration was much more physically involved than just replacing a video codec; fortunately this time there is no need to rebuild the digital platform. The network infrastructure put in place for establishing MPEG-2 technology is still useable; the cables, connectors, amplifiers, and transport mechanisms are already in place
and can be used to support carriage of both codecs. The concepts of modulation, multiplexing, buffering, insertion, and caroseling can be reused and intermixed with the new video codec. The real analog legacy that still exists today is not the plant and equipment upgrades; but the reluctance of a sizeable group of people (approx. 63 million paying in 2003 [9]), who get basic cable service to all the TVs in their household for one low fee, to switch to a digital service that requires a box for each TV. The fear is that they may opt out of cable altogether. Alternatively there is constant pressure to shift from analog due to extensive piracy, bandwidth demands, and less robust security mechanisms. This ‘analog’ legacy is what in one part is creating the bandwidth crunch on plant systems and much study through the “all-digital efforts”, including using new digital video codecs, are being considered for resolving this problem. The important thing to realize is switching from an MPEG-2 Digital Video platform to a new type of digital video codec does not create the same type of legacy and may, in part, actually be a solution to this analog one. The challenges created by switching to a new digital video codec are buying new encoder equipment at headends or regional centers and replacing the millions of digital STBs already deployed. The most significant cost is replacing these STBs (approx 29 million in 2003 [10]), but this could be argued as not insurmountable and actually somewhat less of an effort than what has been launched in the past. There are a number of strategies that can mitigate and justify these costs, but much of this depends on being able to carry both types of codecs in the same cable plant and developing new boxes that can decode both MPEG-2 and the candidate digital video codec. With this and the inherent advantages of the local distribution in cable systems,

cable service providers can take several steps to ease the burden of this transition:
• They can deploy new services on a region-by-region basis using an ROI to justify the deployment of new STBs.
• The type of video service is agnostic to kind of digital codec used. This means that MPEG-2 can initially be used with a deployment of service to build up demand to justify a box upgrade and then switch the codec used for the service.
• Alternatively new codecs can be introduced in new tiers of services.
• Initial deployment of a few STBs to be used in a slow rollout can help decrease the new STB costs for future larger rollouts.
• Existing MPEG-2 only STBs can be redeployed in other parts of the system to assist in digital upgrades.
New advanced codec products can be designed to decode both the new codec and MPEG-2 given an additional 10-15% extra performance in the chip. Though the new codecs are not backwards compatible with MPEG-2, the product can effectively support both. The STB can be deployed to operate on traditional MPEG-2 systems. As the new codec gets deployed on the plant, the same box can be used to decode these new services. This strategy can allow MPEG-2 to be complemented by the newer codec and can allow services to exist before a decision is needed to switchover the codec. There are already a large number digital MPEG-2 STBs out there, but this number will continue to grow due to a dramatic increasefrom demand of MPEG-2 HD Boxes. Given that new product deployments will be at least 1-2 years away, there will be a significant installed base of MPEG-2 boxes. Any new codec will have to work in complement with the MPEG-2 existing
technology and services for a cost-effective transition. Some factors to consider for this would be:
• New boxes need to bring in additional revenue
• Room for bandwidth needs to be made. This can happen through bandwidth reclamation strategies as mentioned previously.
• Analog PPV services must be phased out by replacing these boxes with MPEG-2 STBs
A place on the cable plant where a total replacement of MPEG-2 with the advanced codec could be beneficial, and less of a hardship, is in the backend storage and transport systems. With the projected increases of Video-on-Demand (VOD) cable services, larger amounts of content will need to be stored, replenished and distributed in the backend plant. A content catalog of 10,000 hours with 25% of it being replaced once a week would require at least a continuous 56 mbps transport link to the headend along with 17,000 GB of storage (this does not include storing multiple copies or transport to edge servers). To deal with this, more server farms will need to be added along with leasing of more bandwidth to transport content to one or many headends. These costs can be reduced through the use of advanced codecs that will effectively halve the storage and transport needs. To take advantage of these cost savings real-time transcoding technologies between the new codec and MPEG-2 should be encouraged.
EXAMPLE USAGE SCENARIO: NEW VOD SERVICE TIER
The introduction of a new video codec needs to be part of an overall bandwidth reclamation strategy. A single RF QAM Channel can have a tremendous range in

video capacity depending on how it is being used (see Figure 3). Effective management of this bandwidth can lead to new services as well as a cost-effective way to deploy an advanced video codec. There are many ways to accomplish this, but this section will attempt to describe one possible approach.
Figure 3: Codec Video Program Capacity for Single 256 QAM Channel Presently VoD services (projected to be a 4-5 billion dollar market by 2007 [11]) contain several different types of streams that have radically different bandwidth behaviors. Two potentially bandwidth intensive services are High Definition (HD-VOD) deliveryand Subscription Video on Demand (SVOD). A High Definition program in MPEG-2 requires approximately 4 times the bit rate of the same channel in SD format. Besides needing a larger bit rate, HD-VOD creates a demand on bandwidth resources by effectively blocking potentially 4 or more SD streams for each HD stream in use. The SVOD service also creates a demand on bandwidth resources by effectively blocking pay-per-transaction SD streams especially when ‘channel surfing’ behaviors occur. As the take-up on these services becomes more popular, a need to create a bandwidth resource policy based on these different behaving streams will be necessary.
There are several new revenue sources to cable being captured by the on-demand services: One is replacing the local video store (“watch a movie without the late fees”), the other is competing against the burgeoning PVR market but with some extra features like an unlimited hard drive, access to unaired content, and never needing to record a show. The High Definition offering basically provides a “gotta have” service that can increase customer loyalty (“I gotta have a feed for my new HD set and cable has it”). The problem is on the cable plant, the bandwidth is disproportionately dished out. An HD request can replace 4 or more SD requests, but the price is not that much different. The SVOD service can take up bandwidth that could have been used by someone who didn’t want to go to the video store to see the latest movie releases. These situations can create either more contention or a disproportionate increase in bandwidth demand on the node level to accommodate peak use. Some ways to deal with this is to limit the amount of HD requests and constrict the size of the content catalog of an SVOD service to allow enough take-up rates in the traditional MOD service. An alternative to this is to create a new tier of on-demand services. This new tier would have a combined local SVOD offering with an HD-VOD service that requires a new STB capable of doing both MPEG-2 and the new codec. The lower on-demand tier for renting SD movies would be supported by MPEG-2 and the new tier would be supported by the new codec. With the doubling of bandwidth from the new codec, the SVOD service can have an expanded and localized content catalog with a predictable monthly income source. Additionally enabling HD-VOD on this tier provides incremental income other than the monthly fee as well as freeing up bandwidth on the lower on-demand tier for the SD MPEG-2 movie rental market.
0
5
10
15
20
25
30
35
SD SD-VoD HD HD-VoD
RF 256-QAM Channel
Vide
o Pr
ogra
ms
MPEG-2 Adv. Codec

By creating this tier, a new box with the advanced codec can be deployed with a trackable ROI instead of a pure capex expense. A tier becomes identified which offers a value to the customer worth the additional monthly upgrade fee whether the subscribers has an HD set or just wants the additionally content on SVOD. In effect it ties the deployment of the new boxes with a new revenue source while reducing the bandwidth demands on the lower MPEG-2 tier. Consequentially, this frees up the lower MPEG-2 tier for capturing more of the SD video rental market whose customer base will be largely those with existing MPEG-2 only STBs. Since this is a node-based service, the new tier (and new replacement boxes) can be targeted to specific areas or rolled out region-by-region. Furthermore it creates a type of bandwidth policy that can relieve some of the future pressure on a mixed on-demand tier. Lastly, the deployment strategy addresses the on-demand segment rather than the broadcast segment which for cable is more of an area for future growth. Again this is only one type of usage scenario for initially deploying a new codec, but there are others.
CONCLUSION
In this paper, we have discussed issues and challenges related to the introduction of advanced video codecs in MPEG-2 based digital cable networks. One of many possible deployment scenarios is discussed in details.
REFERENCES
[1] ITU-T H.222.0 (2000) | ISO/IEC 13818-1:2000, Information technology – Generic coding of moving pictures and associated audio information: Systems.
[2] ITU-T H.262 (2000) | ISO/IEC 13818-2:2000, Information technology – Generic coding of moving pictures and associated audio information: Video.
[3] “Overview of the H.264/AVC Video Coding Standard,” T.Wiegard, G.Sullivan, G. Bjontegaard, and A. Luthra. IEEE Trans. On CSVT, pp.560-576.
[4] “Modeling Switched Broadcast Video Services,” J.Weber, and J. Gong, NCTA Show 2004, May 2-6, 2004.
[5] ITU Standards G.992.2 and G.992.4 [6] http://www.rethinkresearch.biz [7] Modern Cable Television Technology:
Video, Voice, and Data Communications, W. Ciciora, J. Farmer, and D. Large, Morgan Kaufman Publishers Inc, San Francisco, 1999.
[8] E-mail correspondence with Michelle Abraham, Senior Analyst, In-stat/MDR.
[9] Basic Cable Subs 2004 Estimate Deutsche Bank Securities & Jupiter Communications (2004 Outlook for Cable Jan 27, 2004).
[10 Press Release for Digital Set-Top-Boxes Outlook for 2003 www.tracestrategies.com/ docs/ pr/ 10012003PR.html
[11] Morgan Stanley & Co. 2003 revenue estimates cited in 9/8/03 Multichannel News article, "Demanding DVDs: Recordable Discs Could Pinch VOD Sales."

LARGE-SCALE ON-DEMAND DELIVERY ARCHITECTURES – TOWARDS AN EVERYTHING-ON-DEMAND FUTURE
Cliff Mercer, Ph.D., Director of Technology
Satish Menon, Ph.D., Chief Technical Officer Kasenna, Inc.
Abstract
Pioneering technologists and business leaders have been driving our industry toward new ways of watching and interacting with our televisions, that is, toward an “everything-on-demand” future. Accomplishing this lofty goal requires the cost-effective implementation of “extreme narrowcasting” techniques, which in turn demand coordinated use of network technologies, powerful server architectures, and intelligent software design.
The early Video-On-Demand (VOD)
solutions of the past with their proprietary interconnection technologies and custom hardware designs fail to scale cost-effectively with the new demands for flexible integration with new services, delivery performance and storage capacity. Advances in commercial off-the-shelf computing and networking products along with smart software design meet these current and future challenges cost-effectively and without the obsolescence problem experienced with historical solutions.
INTRODUCTION
Since the early 1990s, technologists and visionary business leaders from a group of pioneering companies in the content, computer, networking, consumer electronic, broadcast and cable TV businesses have been working to change the way we watch and interact with our television. They have been working towards an everything-on-demand (EOD) future:
• News-on-demand: news you want to watch, when you want to watch it – without being limited to rigid broadcast times at 6am, 6pm, and 10pm.
• Music-on-demand: any tune ever recorded from Hillary Duff’s latest to Rachmaninoff.
• Education-on-demand: listen to Feynmann’s physics lectures at your convenience.
• Sports-on-demand: re-live the memories of Pele’s most famous goal in the 1962 World Cup.
Realizing such a vision requires
commercially viable implementation of delivery techniques commonly referred to as “extreme narrowcasting” – the ability to deliver a unique stream of rich media (such as audio or video) from the content source (typically video servers) to an end user’s TV, PC, mobile phone, or PDA. Extreme narrowcasting requires novel system designs, such as distributed network topologies, powerful server architectures, and intelligent software design, that can take advantage of “localities of reference,” predict future usage patterns, manage a variety of bandwidth requirements and resource needs, etc. More importantly, these designs must make for a cost-effective system, allowing operators to deploy these services without breaking the bank and allowing them to realize returns on their investment quickly.

In the past, proprietary servers, proprietary interconnection technologies, and custom designs were employed to solve these problems of extreme scale in an initial application area: delivering movies over cable plants to TVs. However, the advances in mainstream server technologies and intelligent software designs can solve these problems much more cost-effectively, while avoiding obsolescence associated with proprietary technologies. Furthermore, these new technologies enable the delivery of a plethora of additional video and rich media applications and services to a broader range of end-user devices as the full vision of EOD comes within reach.
In this paper, we highlight the technical and economical challenges involved in the deployment of an extreme narrowcasting network. We begin with a discussion of modern trends in high-performance computing, which leverage commercial off-the-shelf (COTS) hardware combined with intelligent software management to scale to very high performance levels. Next, we relate those techniques for high-performance computing to the particular application area of concern: VOD and other video and rich media delivery applications. We discuss typical growth of a narrowcasting video network from a centralized system to a potentially decentralized system as the number of subscribers grows and the amount of content in the system increases. We introduce the concept of “hierarchical storage” – an implementation of storage systems (from RAMs to disks) to address the requirements inherent in scaling up the number of subscribers and amount of storage. Intelligent software techniques help to solve these problems of extreme scale within the entire video network. Finally, we offer quantitative comparison between common architectures for VOD and EOD deployment.
Modern Techniques for High Performance
COTS cluster systems have become the most cost-effective way to satisfy high-performance computing requirements. Real-time media streaming, VOD streaming, and on-demand delivery of rich media require the best and most cost-effective high performance computing techniques available. According to Thomas Sterling of the California Institute of Technology, “Cluster systems are exhibiting the greatest rate in growth of any class of parallel computer and may dominate high performance computing in the near future.” [Sterling 2001]
We define a COTS cluster as a collection of server-class computers built completely from commercial off-the-shelf components and which themselves are built using commodity off-the-shelf chips and components. The interconnecting network technology must use COTS components as well, the most cost-effective technology right now being Gigabit Ethernet.
The latest COTS components have such increased price performance that using high-performance COTS servers connected by GigE interfaces yields a very high performance computing system. For example, a COTS cluster might consist of 10 commonly available dual-Xeon (> 2.2 GHz) servers, each with 2 GB of DRAM, up to 16 disk drives at 146 GB each, and up to three Gigabit Ethernet NICs. Such a cluster would have:
• Processing capacity of 20 Xeon
processors, • 20 GB of DRAM, • 23 TB of disk storage and • 30 Gbps of networking capacity.

Moore’s law has continually increased the price performance of COTS computing components for the past 40 years. Intel and others spend billions of dollars on research and development to drive this technology and the price performance forward, and COTS clusters benefit directly in terms of price performance as a result.
The Fall of Proprietary Hardware
Hardware designed for specialized applications use the best currently available technology at design time, but by the time the hardware design goes through prototyping, bug-fixing, revision and finally manufacture, the design is already outdated. Even before the product ships, it is behind the technology curve. The specialized hardware design itself is costly and negatively impacts the solution’s price performance. Furthermore, maintaining a hardware design for a specialized market is extremely costly as well. Bug fixes and upgrades required for any hardware design must be done by a small team employed by the single vendor. In contrast, COTS computing systems leverage the design expertise of many competing companies and benefit from the significant investment these companies make for the broader computer equipment market.
Over time the hardware design ages quickly. Within a year or two after initial product shipments, the hardware technology is outdated, and the price performance is significantly behind current technology and products. Moore’s Law cannot be exploited effectively to drive down costs over time for a proprietary hardware design targeted toward a specialized application.
COTS Clusters for Price Performance
Vendors that bring COTS servers to market are under constant pressure to leverage improvements of new components in their server product lines. Vendors of motherboards, NICs, and complete servers spend billions of dollars in research and development to incorporate the latest underlying hardware technologies and provide standards-based products to the market as fast as possible. COTS NIC vendors are under similar constant pressure to improve the price performance of their products. As a result, COTS servers and network products track Moore’s law very closely.
Commodity cluster techniques dominate
specialized hardware designs in terms of price/performance. In fact, a cluster of COTS servers connected by fast Ethernet won the Gordon Bell Prize for Price/Performance awarded in conjunction with the Supercomputing Conference in 1997 [Karp 1998]. COTS clusters enable a “trickle up” effect, whereby technological improvements and better price performance characteristics developed and perfected for standalone applications in the mainstream computer industry are leveraged to provide significant advantages in the area of high-performance computing applications such as real-time, high-bandwidth video, and audio streaming. Figure 1 shows the COTS value chain, which starts with processors, chipsets, and other semiconductor products at the bottom. From those parts, components are developed and those move up into COTS servers, which can then be combined, to form COTS clusters.

Figure 1 COTS Price Performance Chain
Since COTS clusters are built from COTS
servers, the component servers are flexible in terms of configuration. They can be configured with more or less processing power, DRAM for main memory, and buffering and storage for content. Since the cluster itself is composed of smaller, high-performance building blocks (the individual servers), the clusters can scale from small capacity to large capacity requirements.
In addition to scaling conveniently to appropriate requirements for initial installation and deployment of a particular application, the clusters are flexible in that additional capacity requirements that come in after the system has been in service for some period of time can easily be accommodated by the addition of new servers and storage capacity into the existing cluster.
Clusters are becoming so popular that some vendors are beginning to provide not only the individual servers and network devices needed to construct a cluster, but also
products that are themselves pre-packaged clusters with all the components priced together as a single bundle.
As an extension of the cluster concept, blade servers are the next, high-density incarnation of the commodity cluster. Blade servers do not yet have the same level of standardization that yields the benefits of interoperability and competition for performance. Therefore, the price at this point is higher for blade server solutions.
With the benefits provided by COTS products and their application to high-performance computing applications, the trend in the VOD market is toward open hardware systems rather than expensive, difficult-to-maintain proprietary hardware systems.
Applying COTS Clusters to VOD
VOD applications and more generally EOD applications have a structure that is well-suited to parallel processing and to COTS cluster techniques in particular
Mapping the VOD Application to the Cluster
For example, if we first consider a centralized network architecture using COTS clusters for VOD, the cluster must satisfy certain requirements including the maximum simultaneous subscriber sessions, each with an associated bitrate that may be 3.75 Mbps for standard definition (SD) content or much larger for high definition (HD) content. The cluster must also satisfy requirements for maximum content storage capacity. This application breaks down into the following primary compute or communication bandwidth intensive parts:
COTS Servers
Computer Industry Driving Price Performance
Commodity Chips
COTS Clusters

• Business logic that allows a subscriber to request content and pay for it.
• Session resource management that takes requests and identifies resources needed to fulfill them, including the content itself, processing capacity, and network bandwidth available to stream the rich media.
• Computing capacity to actually stream the high-bandwidth content.
• Low latency communication channels from subscribers back to the server to control the streams (with pause/fast-forward/rewind).
The business logic and processing can be
achieved using modern, flexible integration technologies that power the web’s still-burgeoning e-commerce activities.
Session resource management is a very important piece where intelligence and accurate information about the current system load and currently available resources are very important. This activity, however, does not take a lot of processor resources or bandwidth - merely timely information.
The bulk of the work, in terms of processor cycles and network bandwidth consumed that is required to provide rich media on demand, is the job of streaming out the media. Streaming can be anywhere from 30 seconds to 3 hours in duration, for a quick video commercial or a long-running movie, respectively.
The latency required for responsive trick mode transitions places more requirements on network bandwidth and availability between the subscriber and the server site without putting a significant additional computation burden on the VOD server (unless fast-forward/rewind content are not computed in advance and must be computed on the fly).
The upshot is that most of the computational load associated with VOD is in the streaming of independent content to independent viewers. Thus, computations do not interact with each other, so as a high-performance computing task, relatively little network bandwidth is consumed in coordinating within a cluster on the execution of these tasks. The fact that tasks are independent makes them particularly well suited to the COTS cluster technique for high-performance computing.
Smart Cluster Management Software
To ensure that cluster resources are used most effectively, the cluster must look at incoming requests and determine the best way to service the request. The cluster management software must decide which node in the cluster is best suited to stream a request for a particular piece of content. This software handles the load balancing, availability and failover requirements for the cluster. This software uses distributed algorithms such that each server is capable of performing this management function, and therefore no single point of failure exists in the cluster management.
In order to make resource management decisions, the cluster management software must collect information from each node in the cluster describing the content available on the node, the performance characteristics of the node, and the current load on the node. With this information, the cluster manager has information about available capacity to service new requests for specific content on various nodes in the cluster. It can then make the appropriate load balancing decisions and assign the request to a particular node.
The cluster management software also keeps track of server or node availability in the cluster. For example, if a particular node is taken out of service or suffers from some

type of hardware failure, the cluster manager detects this condition and makes the appropriate adjustments to its resource management policies for the period when the server is not available. Likewise, when a new server is added to a cluster, it automatically participates in the cluster and coordinates with the other nodes in the cluster to make its performance capabilities and availability known.
Driving Price Performance for VOD
The performance advantages of using COTS clusters for high-performance computing described above drive price performance for VOD as a specific application. Scalability for the COTS cluster translates directly into scalability of streaming capacity for a VOD cluster. VOD clusters can scale smoothly from small numbers of streams (a few hundred SD streams using single dual Xeon class servers) to much larger numbers of streams (tens of thousands of SD streams when these single server building blocks are racked up in quantity in larger COTS clusters).
Additionally, COTS clusters for VOD can accommodate different storage configurations that may be required for different types of VOD storage requirements, performance requirements, and usage patterns. For example, a VOD deployment that must support large numbers simultaneous users (greater than 10,000) may benefit from a shared storage model that enables each of the nodes in the cluster to share access to content on a single large SAN-type storage unit. A flexible software solution for COTS clustering can accommodate appropriate COTS hardware configurations and reap the benefits of lowering storage costs in cases where large amounts of storage accessible by each individual node is needed.
Content Management Within the Cluster
Part of the job of the cluster management software is to make sure the streaming resources for particular content expand as the demand for that content expands. One technique is to divide the storage available on each node into a unique content partition and a cached content partition. The cache then temporarily holds content that has become popular.
To utilize the cache partition of storage, one technique is to identify content that is becoming popular by monitoring the request rate in real-time. Once a piece of content is becoming popular, the cluster manager can copy the content to another node to increase the capacity of the cluster and create streams for that content.
Another technique is to bring new content directly into the cache partition of storage on the assumption that fresh, newly released content is more likely to be popular. The caching policy then keeps the content for as long as it is popular and replaces content in the cache based on policies that take into consideration usage characteristics. On an ongoing basis, the number of content copies that are stored in the cluster can be adjusted up and down based on usage characteristics of the content over time.
The content management UI for the cluster must allow the cluster to be managed as a single entity with the information from individual nodes aggregated into whole-cluster totals. This includes information about the current number of streams being served, a content list as well as number of copies of each piece of content, etc.

EXPANDING THE VIDEO NETWORK
High performance in the COTS cluster and effective cluster management provide the essential foundation for a complete, scalable VOD rich media delivery system, but additional techniques concerned with the distribution of clusters, the effective communication of information and content between them, and the efficient use of network bandwidth are also very important for large deployments.
Transport Network Architecture for VOD
More sophisticated techniques for content placement and management extend the idea of caching to a general storage hierarchy that overlays the network topology hierarchy as depicted in Figure 2.
Figure 2: Hierarchical Network Architecture
A typical network topology includes:
• A master headend, which is a central
site where many of the entire network’s operational services such as transaction processing and billing are housed,
• The headend that acts as a point of origin for various video, data and voice services,
• Primary hubs that are closer to the subscriber and allow for effective aggregation of transport functionality and services for the subscriber, and
• Nodes that reside closer still to the subscriber.
Master Headend
Local Headend Primary Hub
Primary Ring Secondary Ring
Access Network

Network architectures vary in terms of how much bandwidth is available through the backbone between regional headends and how much bandwidth is available from headends down to primary hubs. These bandwidth-provisioning factors impact the degree to which streaming can be centralized and how much motivation there is to decentralize streaming.
Storage Hierarchy Mapping to Network
The storage hierarchy can be designed to mirror the network hierarchy for purposes of cost-effective use of bandwidth in the backbone and in the access network and for effective us of network equipment at appropriate locations in the network. illustrates how this storage hierarchy would map onto a typical network hierarchy.
Figure 3: Storage Hierarchy
This storage hierarchy consists of levels
that include: • Library servers, which act as large
content repositories for a wide range of different content, located at the master headend.
• Centrally located popular content repository and source for content flowing toward the subscriber on a day-to-day basis, typically from the headends.
• Localized “caching” servers, located perhaps in the primary hubs.
• Smaller hubs and nodes that would not typically contain active streaming on-demand servers but might house elements of the transport network associated with rich media delivery.
Content Propagation in a Video Network
The video network architecture described provides for a great deal of flexibility in terms of network configuration. A typical usage scenario for the video network would have content coming into the network through a combination of content aggregators that distribute via satellite and real-time
Master Headend
Local Headend Primary Hub
Primary Ring Secondary Ring
Access Network
Library Cluster
Headend Cluster
Caching Cluster

content capture and ingest. This new content is stored initially in the library server cluster in the master headend, perhaps using a shared storage hardware configuration to accommodate very large amounts of content such as those generated through real-time ingest applications.
The library cluster provides archival storage for content that has the appropriate licensing for long-term storage. The content for which a licensing window applies is also stored during the appropriate window and the copy of such content in the library clusters serves as the master copy of that content for the entire system.
The library cluster makes the content available, not for streaming directly to subscribers, but for transfer to streaming servers in other parts of the hierarchical video network.
The closest set of streaming servers belongs to the VOD clusters located at headend sites. These clusters are expected to store only content that is expected to be popular or that has been dynamically discovered to be popular. The headend cluster will pull content from the library cluster in cases where a request comes in for the content but that content is not currently resident in the headend cluster. Latency associated with copying the content is minimized through the use of streaming mechanisms that allow for content streams to be played out from the beginning while the later parts of the content are still being transferred in to the headend cluster.
Mechanisms for monitoring content usage and making copies of popular content in clusters closer to the subscriber, are based on the algorithms for dynamically creating copies of content within a single cluster as described above.
Moving down one level in the hierarchy, the VOD clusters located in the primary hubs economize on network bandwidth in the higher trunks of the hierarchy by allowing for very popular content to be cached in the closest possible location to the subscriber. Assuming an “80-20” rule where 80% of the content requests can be serviced by 20% of the actual content available, these caching clusters in the primary hubs serve a relatively large percentage of streams with a relatively small percentage of available content stored locally. Thus, the bandwidth required to service all of those streams is only consumed from the primary hub down to the individual subscribers rather than the same amount of bandwidth being required (and the amount compounded by adjacent primary hubs) in the higher-level trunks for the distribution network.
Streaming Bandwidth in the Video Network
The streaming bandwidth savings possible in the trunk links of the network when VOD clusters are distributed deeper into the network qualitatively justify the content propagation techniques as described above. However, a more quantitative analysis of those savings is even more convincing. The following analysis compares a centralized VOD cluster approach and the bandwidth required through the network to stream against a standard set of requirements to a distributed VOD cluster approach and the network bandwidth required in that case. The requirements of higher-bandwidth content such as HD video streams must be considered as part of the quantitative modeling of the bandwidth requirements looking toward changes we are likely to see in the near future.

QUANTITATIVE ANALYSIS
Let us consider the bandwidth requirements for a group of systems that require a total of 40 Gbps of simultaneous streams (equivalent to more than 10,000 SD streams at 3.75 Mbps) to be delivered to subscribers during peak load time, a total of 20 TB in archival storage and a total of 4 TB of unique content readily available to subscribers. Suppose that these subscribers are served by 5 systems which need to support 12 Gbps, 12 Gbps, 8 Gbps, 4 Gbps and 4Gbps for System A, B, C, D and E, respectively. To compare the aggregate network bandwidth required in the case of the centralized video network and the distributed video network, we will consider the typical network architecture described above and look at bandwidth required in each case for the 3 levels of the network: primary ring, secondary ring, and access network. System Number
of Hubs Bandwidth (Gbps)
Storage (TB)
A 4 12 20 B 4 12 20 C 3 8 20 D 2 4 20 E 2 4 20
Centralized Video Network
Bandwidth: Assuming that central site is different from any of the five headends: Requires full 40 Gbps across each of the three networks (Primary ring, Secondary ring, and Access network), which is 120 Gbps. If the central site is co-located with one of the headends, say one of the largest ones, which supports 12 Gbps streaming, the result is a savings of 12 Gbps since bandwidth for that headend does not need to go over the Primary ring. Therefore, total bandwidth required is 108 Gbps.
Storage: One copy of the entire content collection is required at the single central location, so the total requirement is 20 TB.
Decentralized with Duplication
Bandwidth: Streaming for each headend starts at that headend and traverses the Secondary ring and the Access network. Therefore, we have the total of 40 Gbps crossing two networks for a total aggregate bandwidth requirement of 80 Gbps.
Storage: The content is fully duplicated
at each of the five headends. With a content requirement of 20 TB at five systems, the total storage requirement is 100 TB.
Distributed Video Network
Bandwidth: Assuming minimal streaming traffic from the Library cluster across the Primary Ring, we focus on the traffic across the Secondary ring and Access network. Assuming that 80% of the streams can be addressed with 20% of the content from the Caching clusters in the primary hubs, the bandwidth required for that 80% is only in the access network and totals 80% of 40 Gbps or 32 Gbps. The other 20% of the streams are served from the headends; 20% of 40 Gbps is 8 Gbps and those streams must traverse both the Secondary rings and the Access network for a total of 16 Gbps of network bandwidth required for the 20% of streams. The grand total for all 100% of streams is therefore 32 Gbps + 16 Gbps = 48 Gbps.
Storage: Firstly, the Library cluster
requires storage for the entire system at 20 TB. Assuming a working set of approximately 400 titles at the headend and assuming each title is approximately 1.5 hours, the headend clusters require 600 hours of content. At 2 GB/hour that would be 1.2 TB of storage required at each of the five

headends; grand total is 6 TB at the headends. In the caching clusters, we need the 20% most popular content of the 400 titles in the working set, so the requirement is for 80 titles or 120 hours (assuming 1.5 hours/title). At 2 GB/hour, we require 240 GB per primary hub. In the entire system, we have 15 primary hubs each requiring 240 GB of storage, so the total hub storage is 3.6 TB. The grand total for all storage in this scenario is therefore: 20TB + 6 TB + 3.6 TB = 29.6 TB.
SUMMARY
The summary of bandwidth and storage requirements for the three scenarios addressed in the analysis above appears in the following table.
Bandwidth: 108 Gbps Centralized Storage: 20 TB Bandwidth: 80 Gbps Decentralized
with Duplication
Storage: 100 TB
Bandwidth: 48 Gbps Distributed Storage: 29.6 TB
Clearly, the Distributed Video Network
with Library cluster for archival storage and Caching cluster near the network edges yields substantial savings in both aggregate network bandwidth and in storage required. In comparison, the Centralized Video Network leans heavily on network bandwidth and the major expense is in that area. The Decentralized with Duplication architecture, with duplicate content at each headend, leans heavily on additional storage, which contributes greatly to the high cost of that solution.
CONCLUSION
We have summarized the requirements for the large-scale delivery architectures
required for the fast-approaching EOD vision of coming services. Novel techniques for high-performance computing platforms and efficient video network architectures are necessary to realize this vision.
The COTS clustering approach to high-
performance computing has proved to be successful in virtually all high-performance computing applications since the late 1990’s and addresses the needs of VOD delivery very cost-effectively. This approach leverages all of the research and development investment in the computer industry, which amounts to billions of dollars, for the benefit of driving price performance in the VOD and EOD application arena.
Smart content management in the cluster management software as well as in the larger scale distributed video network context help to reduce costs elsewhere in the complete end-to-end system by using the network bandwidth and storage resources associated with the video network most effectively. A representative analysis of a typical multi-system VOD deployment quantifies the savings in bandwidth and storage that is possible with this approach. And as the requirements of the future scale toward extreme narrowcasting of everything-on-demand, the cost optimization available through these techniques becomes essential.
REFERENCES
1. Sterling, Thomas. “An Introduction to PC Clusters for High Performance Computing” The International Journal of High Performance Computing Applications, Volume 15, No. 2, Summer 2001, pp. 92-101.
2. Karp, Alan H., Lusk, Ewing and Bailey, David H. “1997 Gordon Bell Prize Winners.” IEEE Computer, January 1998.

MODELING SWITCHED BROADCAST VIDEO SERVICES Joseph Weber, Jiong Gong Cable Television Laboratories Abstract Switched broadcast video services can be used to offer many more broadcast programs, using less bandwidth, than traditional broadcast services. A typical 750 MHz cable plant could theoretically offer over a thousand broadcast digital programs to subscribers, compared to a few hundred programs using traditional broadcast. We have developed a model to predict average and peak usage of bandwidth for a switched broadcast system given service area size and expected popularity of various programs. This model can be used to plan for the equipment and capacity needed to offer a switched broadcast service.
INTRODUCTION Cable operators continue to increase the number of broadcast channels they offer their subscribers. In a broadcast network, the number of channels that can be offered is limited, however, by the bandwidth capacity of the last mile of the hybrid fiber coax (HFC) plant to the home. Operators will encounter this limitation as they begin broadcasting more channels, and more high-definition content. While more efficient codecs can increase the number of channels offered to subscribers, with traditional broadcast services the number is ultimately limited by available network bandwidth. In reality, as the number of programs being offered grows, fewer subscribers are actually watching some of the more obscure programs. A switched broadcast network gives the operator the ability to offer an almost unlimited number of new programs to
subscribers by taking advantage of the finite number of simultaneous programs actually being watched by subscribers on an individual network. In this paper we develop a mathematical model for predicting the network capacity necessary to deliver a given number of video programs to a network of a given size. The model could be used for predicting capacity requirements, or determining when it is economically advantageous to use a switched broadcast service over a traditional broadcast service. We also extend the model to identify which channels are eligible for adding to a switched broadcast tier, and which should remain on traditional broadcast. OVERVIEW OF SWITCHED BROADCAST Traditional broadcast video services transmit all available programs to all subscribers on the network all of the time. Given the variability in content across channels, it is highly likely that during some parts of the day many programs or channels are not being watched by any subscriber. With digital services, the number of possible programs carried by the network increases dramatically, and therefore, so does the probability that programs are being broadcast but no subscriber is actually watching. In a switched broadcast model, programs are broadcast on the local network only when requested by a subscriber. When a subscriber selects a program for viewing via their interactive program guide, the application determines if that program is currently being

broadcast on the local network. If so, the consumer premises equipment (CPE) simply tunes into that broadcast. If the program is currently not on the network, the CPE makes a request to the server application to begin broadcasting that program on the network. When the subscriber switches to another program or is no longer watching the selected program, the server application is again notified. When the server application determines that there are no more subscribers on the node viewing a particular program it can remove it from the network and, thus, free the bandwidth for other uses. Switched broadcast, therefore, has the potential to reduce the amount of bandwidth required to support large numbers of broadcast programs. With normal broadcast service, the amount of bandwidth required grows linearly with the number of programs. For analog services this requires 6 MHz of spectrum for every program, while digital services require about 0.6 MHz of spectrum per program. With switched broadcast the bandwidth grows much slower with the number of channels.
Like VOD, a switched broadcast video service requires a two-way cable plant. Using their remote controls, subscribers select a program from an interactive program guide (IPG). In switched broadcast services, only those programs that other subscribers on the local network are currently watching are present on the local network. Therefore, a request for a new program not currently on the network must make its way back to the cable headend so it can be added to the local network. At the headend, the new program is loaded onto the local network, and the location of the new program is added to the local channel map. The Potential of Switched Broadcast Video The model developed in this paper can be used to estimate the bandwidth required to offer a given number of switched broadcast programs, given the network size. With traditional broadcast service, a 750 MHz plant typically can broadcast about 250 programs (a mix of analog and digital services). Even if all video services are broadcast in digital, the maximum number of programs the operator could offer is about 700. With switched digital services, the model presented here predicts that an operator could offer over a thousand broadcast programs on that same network (See Table 1).
Tier Present Broadcast
Allocation All-Digital Broadcast Allocation
Switched Broadcast Allocation
Programs 6 MHz Channels
Programs 6 MHz Channels
Programs 6 MHz Channels
Basic (always analog)
26 26 26 26 26 26
Standard 50 50 130 13 140 14 Premium 8 8 200 20 500 15 Digital 120 12 340 34 1000 25 HD 8 4 14 7 40 20 Total 212 100 710 100 1706 100 Key: Digital HD Switched
Table 1. Example Spectrum Allocations for Present, All-Digital and Switched Broadcast Systems

Video-on-Demand (VOD) and network Digital Video Recording (network DVR) are a form of switched broadcast sometimes called unicast or narrowcast. For these services, each subscriber can request a unique program received only by the subscriber. But both services require significant network bandwidth because a stream would be dedicated to only a single user. Switched broadcast, on the other hand, uses a multicast approach. If more than one subscriber has requested a particular program, they all share a single broadcast stream, therefore using the same bandwidth for one viewer as for one hundred. Only in the unlikely case that a large number of subscribers on the network each request a unique program would capacity limitations come into play. Events such as Thursday night primetime and the Super Bowl, which could cause concerns for a network DVR service because of the large number of users on the system, actually place a lower demand on switched broadcast since most viewers can be served with only a few multicast streams (although users do not have the same pause, rewind, and other recording features available with VOD and network DVR services). Network Requirements Implementing a switched broadcast system can require a significant addition of hardware into the network, as well as software in both the CPE and the network. In particular, with traditional broadcast service a single QAM modulator can be used for the entire network. The same QAM-modulated signal is sent to every service group on the network. With switched broadcast, each service group would need its own QAM modulator since the services available on each service group’s local network is different depending on usage.
A MODEL FOR SWITCHED BROADCAST Switched broadcast takes advantage of the fact that the popularity of various programs is non-uniform: some shows are more popular than others. Therefore, in a network with a finite number of active viewers at any particular time, some of the more popular programs will be watched by multiple viewers, while some of the less popular programs will not be watched by any viewers. Thus, if the operator offered m different programs to viewers, most likely less than m of those programs are actually being viewed at any one time. With traditional broadcast, as the operator increases the number of programs offered for viewing, the bandwidth requirement grows linearly with the number of programs regardless of the number of subscribers on the network. With switched broadcast, the bandwidth requirement grows slowly with both the number of viewers on the network and the number of programs being offered. As a trivial example, if the network has only one viewer, then only one program needs to be broadcast. If there are two viewers, a maximum of two, but sometimes only one program needs to be broadcast at any one time. As the number of viewers grows, many will be watching the same popular programs, so the number of programs required will be less than the number of viewers. We developed a model to estimate the number of simultaneous programs that are being viewed by at least one subscriber, and the amount of bandwidth needed for switched broadcast delivery on a network as a function of the number of programs offered and the number of subscribers on the network. The model uses rating information to identify the relative popularity of each channel on the network. This is combined with the variation in the number of active viewers during the

day to produce estimates of the number of unique programs being watched as a function of the number of channels being offered, the number of subscribers on the network, and the time of day. Program Ratings The popularity of various cable and broadcast channels clearly changes with time. Weekday primetime might show a large number of viewers tuned to network broadcast channels, while Saturday evenings might have a preponderance of viewers tuned to cable movie channels. Nielsen uses the following terms for identifying the relative popularity of various channels:
• HUT = number of households watching TV / total number of TV households
The HUT measure varies throughout the day, with a peak around primetime and a low early in the morning. HUT is always a number between 0 and 100%. We designate the variable HUT by )(th where t is the time of day.
• Rating = number of households tuned to a particular channel / total number of TV households
Rating numbers also range from 0 to 100%. Ratings give the relative popularity of individual channels. They can also be used to estimate the number of households watching a particular channel by multiplying by the total number of TV households. We designate the ratings for a series of m program channels by ir for mi ,...,2,1= . Note that at any
particular time 1)(1
≤=∑=
thrm
ii .
• Share = number of households tuned to a particular channel / total number of households watching TV
Share numbers also range from 0 to 100%. They indicate what fraction of households actively watching TV are tuned to that particular channel. We designate the shares for a series of m program channels by is for mi ,...,2,1= . Note that at any particular
time 11
=∑=
m
iis and
)(thr
s ii = .
Effective Channel Capacity Given the ratings curve, ir , and HUT values as a function of time, )(th , we can estimate the number of unique programs being viewed on a particular local network (service group). This model is independent of the method used to obtain the probabilities. They can be either empirical or estimated using a Geometric distribution. Given a service group in a network with n′ homes passed, the number of customers within households actively watching television is given by the product of n′ and the HUT, or
)(* thnn ′= . We extend the definition of HUT beyond that used by Nielsen, since a household might have multiple televisions and VCRs, resulting in a HUT above 1.0. Typically, HUT remains well below 1.0 during the early morning hours. The n customers watching television on the network can choose any of the m switched programs being offered. The key to switched broadcast video economics is the fact that at any one time, many programs are not being viewed by any subscriber. The number of those customers watching a particular channel depends on the popularity, or share, of that channel at that time. In switched broadcast systems, the exact number of customers watching a channel is not important, only if

there is at least one customer watching. Although a channel has to be provisioned in real-time even when only one customer is viewing a channel, the probability of such an event occurring is still affected by the popularity of a channel program. For our purpose, the state of a particular program channel i, which we denote as ix , can be characterized as either on or off, with “on” meaning at least one person is viewing that program channel (requiring a corresponding channel to be provisioned), and “off” meaning otherwise. ix is then naturally a Bernoulli random variable that can be defined as taking one value [1, 0] with the associated probabilities ])1(,)1(1[ n
in
i ss −−− . The first probability characterizes the event that at least one customer is watching channel i, and the second probability characterizes the event that no one is watching channel i at all. As a result, the efficiency of turning the program channel i into a switched program channel is entirely driven by the probability of its state being off, which is in turn determined by the channel’s popularity, or share, is . The total channel usage over all the m channels, which we denote as l, is then the sum of m Bernoulli random variables
∑=
=m
iixl
1 (E2.2)
For sufficiently large m, the Central Limit Theorem says that this summation series can be approximated by a Normal distribution.1 1 For a comprehensive treatment of Central Limit Theorem, see for example “Probability Theory”, by M. Loeve, p 268-383, D. Van Nostrand Company, Princeton, New Jersey, 1963. Central Limit Theorem applies to the mean of a series of random variables. It can also apply to the sum of a series of random variables, provided that the summation series is bounded. Since m, the number of program channels in our case, cannot go to infinity, the summation series is thus bounded.
As a result, the actual number of channels needed, which we call effective channels and denote it by q, is then a selected integer number where the probability of l exceeding q is pre-specified for this normal distribution. That probability is commonly known as the blocking probability p. Under these conditions, the effective channel bandwidth required is as follows:
)()( lVaralEq += (E2.3) where
(1) a is such that ∫ ∞−−−= a y dyep 2/2
211π
(E2.4)
(2) ∑=
−−=m
i
nismlE
1)1()( (E2.5)
(3) ∑∑==
−−−=m
i
ni
m
i
ni sslVar
1
2
1)1()1()( (E2.6)
The first part of the equation E2.3 above gives the expected number of channels being watched. Because channel watching is a stochastic process, not only the expected value but also the variation in the number of channels being watched is important. Knowing that total usage follows a Normal distribution allows us to calculate the upper bound of that variation given a pre-specified blocking probability as defined in the second part of equation E2.3. In practice, (E2.4) can be calculated by using a standard Normal distribution table.2 For example, setting 2=a yields a blocking probability %28.2=p . Setting 3=a yields a blocking probability %13.0=p . Conversely, given a p value, a can also be easily found from the table.
2 One commonly used table is from P.G. Hoel, “Introduction to Mathematical Statistics, “ 4th ed., New York, Wiley, 1971.

The capacity requirement equation can be further simplified if we make the share uniformity assumption that all the program channel shares are the same. For example,
suppose m
ssss miµ
==== L21 , where µ
represents the total share of these m programs. Then the above capacity equation can be simplified to:
])1(1[)1(])1(1[ nnn
mmma
mmq µµµ
−−−+−−=
(E2.7) The share uniformity assumption should be a good approximation for several reasons, aside from the benefit of simplified calculation. First, the tail of the program share distribution curve, which most likely represents the channels which are candidates for switching, is indeed close to forming a uniform distribution in reality. Second, E2.7 gives the upper boundary of the expected usage of channels regardless of the share distribution of the viewing profile. Consequently, this approximation also gives the least amount of bandwidth savings in a switched broadcasting environment. Or stated differently, this approximation provides the most conservative estimate to channel capacity provisioning, especially useful in the absence of accurate data on program share numbers. Expected Channel Usage Expected channel usage plays a dominant role in the effective channel capacity requirement equation. Generally, as we increase the number of switched channels, the bandwidth efficiency gain from switching tends to increase. Figure 1 below shows the expected number of unique channels being viewed with 250 and 500 subscriber groups as a function of the number of channels offered.
As expected, the number of actively viewed channels grows slowly as the number of channels increases beyond the number of subscribers. However, the concave nature of these curves means that capacity requirements do not increase linearly with program channels, but at a much slower rate, especially when the service group size is small. As a result, the bandwidth efficiency gain increases as the number of switched program channels increases. Traditional broadcast bandwidth requirements are linear in the number of channels offered and are shown for comparison.
Bandwidth Usage vs. Number of Channels Offered
0
50
100
150
200
250
0 50 100 150 200 250
Number of Channels Offered
Ban
dwid
th R
equi
red
Switched Broadcast (250 subs)
Switched Broadcast (500 subs)
Traditional Broadcast
Figure 1 Number of Channels Broadcast on Switched and Traditional Broadcast Services as a Function of the Number
of Channels Offered
We would expect that the number of channels being actively watched would grow along with the number of subscribers on the network. This is because the probability of the state of a program channel being “on” increases exponentially as the size of the service group increases. The number of independent channels being watched will also depend on the shape of the program ratings curve. In Figure 2 we graph the expected number of channels as a function of the number of subscribers on the network for the average ‘Primetime’ ratings curve, and a

typical Monday night football curve. The number of channels actively being watched approaches the total number of 200 channels as the service group size increases.
0
50
100
150
200
250
100 300 500 700 900 1000
Service Group Size
Num
ber o
f Act
ive
Cha
nnel
s
Total Number of ChannelsAverage PrimetimeMonday Night Football
Figure 2 Number of Channels Actively Being Watched as a Function of
Service Group Size during Primetime and Monday Night Football Nights
Bandwidth Savings The primary benefit of switched broadcasting video is saving bandwidth so that more program channels can be provisioned. Figure 3 shows the extent of bandwidth savings based on our effective channel capacity requirement, as a function of service group size and the number of channels switched, respectively. The percentage of bandwidth savings is defined as one minus the ratio between the provisioned effective channel capacity and the number of actual
available program channels. For example in Figure 3 when 100 program channels are switched for a service group size of 500 customers, percentage of bandwidth savings reaches 36%, meaning that only 64 channels are needed to offer 100 programs. If the service group size is further reduced to 250 customers, percentage of bandwidth savings increases to 58%, meaning that only 42 channels are needed for offering 100 programs. Here we assume 1% blocking probability, 25% total viewership share for the switched channels, and HUT=0.6, which is a typical weekday primetime HUT value.
Percentage of Bandwidth Savings
0.0%
20.0%
40.0%
60.0%
80.0%
100.0%
50 75 100 125 150 175 200
No. of Switched Channels
Ban
dwid
th S
avin
gs125
250
500
1000
Service Group Size
Figure 3 Bandwidth Savings Versus Service Group Size
Figure 4 shows the extent of bandwidth savings as a function of variations in the probability of blocking, while assuming service group size is 500. As can be seen, there is not a large effective channel capacity variation between 1% and 2% blocking probability. But achieving 0.1% blocking requires considerable more capacity.

Percentage of Bandwidth Savings
0.0%10.0%20.0%30.0%40.0%50.0%60.0%70.0%
50 75 100 125 150 175 200
No. of Switched Channels
Ban
dwid
th S
avin
gs
0.1%1%2%5%
Blocking Probability
Figure 4 Bandwidth Savings Versus
Blocking Probability
Adding a Time Element The HUT value varies throughout the day, peaking usually during primetime. We can model the variation in HUT as a sinusoid with a period of 24 hours, and peaking around 10 pm. Adding the time-varying HUT to our model, we can simulate a node throughout the day. It is, therefore, possible to dynamically predict the peak usage as a function of time during the day, and dynamically allocate bandwidth resources appropriately. This would allow a switched-broadcast tier to use even less bandwidth during off peak times freeing bandwidth for other uses.
OPTIMAL DEPLOYMENT MODEL
Not all channels are candidates for inclusion in a switched broadcast service. Deploying a switched broadcast service is more expensive than traditional broadcast because it requires additional QAM modulators and two-way CPE. With
traditional broadcast, a single QAM device can serve an entire cable system, while with switched broadcast each service group needs a dedicated QAM device. In this section, we create a model for determining which channels are candidates for being included in a switched broadcast service. Selection of Switched Channels We assume adding switched broadcast capability to a cable network incurs a fixed cost in terms of additional QAM modulators, new software on existing digital set top boxes (STBs), and switching controllers within the network. The total additional system cost for a service group is divided by the number of customers within that service group to obtain a per-subscriber cost. We assign the variableC as the cost per subscriber of adding a channel to the switched broadcast service. Moving a group of channels to a switched broadcast service frees up bandwidth that can be used for other services, including additional channels. We assign the variable R to the additional per-subscriber revenue that can be obtained by the additional free spectrum. This can also be seen as an opportunity cost for not freeing up the spectrum by remaining on a traditional broadcast service. The model states that the number of channels freed by using a switched broadcast service is:
∑=
−=−−=−m
i
nislVaralEmqm
1)1()()(
∑∑==
−−−−m
i
ni
m
i
ni ssa
1
2
1)1()1(
(E3.1)

From this equation the incremental savings in bandwidth of adding program channel k to a program portfolio consisting of 1−k switched program channels is:
∑∑==
−−−−−k
i
ni
k
i
ni
nk ssas
1
2
1
)1()1({)1(
})1()1(1
1
21
1∑∑
−
=
−
=
−−−−k
i
ni
k
i
ni ss
(E3.2) The first term above captures the first order difference in usage of moving from a portfolio of k program channels to that consisting of 1−k program channels. That is essentially the expected usage for program k . The second term in parenthesis above captures the second order difference. That is the difference in standard deviation of usage between k program channels and 1−k program channels. In reality, the second order difference is actually very small and can be ignored. Under that assumption, the incremental savings in bandwidth of adding a program channel k can then be simplified as (1− sk )n . When the incremental revenue, in terms of saved bandwidth, exceeds the incremental costs of adding a channel to switched broadcast service, then that channel should be added to the switched broadcast service. This is equivalent to CRs n
k >− )1( or RCs nk /)1( >− (E3.3)
If the ks are rank ordered from largest to smallest, n
ks )1( − is an increasing function of k . Therefore, at some channel K , the value of n
Ks )1( − will become larger than RC / , meaning that all channels from K to m should
be placed on the switched broadcast service, while channels 1 to 1−K should remain on traditional broadcast tier. Channel K is the first channel where n
k RCs /1)/(1−< . Note that since every ks must be between zero and 1, adding switched broadcast service is only viable if 1/ <RC , that is if the incremental revenue of the freed bandwidth exceeds the costs of creating the service. Partitioning Channels Example As an example of how channels can be partitioned, we take the model approximation of prime-time share values using a Geometric distribution and assume a 250-subscriber service group. QAM device costs are set at $600 for the service group, and hardware and software costs are set at $3 per subscriber. Consequently, the value ofC is $600/250 + $3 = $5.40 per subscriber. These numbers are for illustrative purposes only and do not represent actual pricing. The present value of all future cash flows for a single channel worth of bandwidth is taken be to $8, which is equivalent to $0.80 per year revenue stream discounted at 10%. The value of R is therefore $8. Again this number if for illustrative purposes and does not represent any typical expected revenue for bandwidth. Given these values ofC and R , equation E3.3 predicts that channels 1 through 37 should remain on traditional broadcast, while channels 38 and higher should be put on the switched broadcast service. Figure 5 illustrates the result.

0.0%
2.0%
4.0%
6.0%
8.0%
10.0%
12.0%
14.0%
16.0%
Ch 1 Ch 5Ch 1
5Ch 2
5Ch 3
5
Traditional Broadcast Service Switched Broadcast Service
Figure 5 Identification of Which Channels Should be Migrated to Switched Broadcast Service Based on Economic Model
CONCLUSIONS
In this paper we developed a model for estimating channel capacity requirements for a switched broadcasting video service. This model uses the expected household television viewership and program share data from Nielsen to approximate the likelihood of cable customers tuning to a particular channel. Given a desired level of blocking probability, the total channel capacity requirement is then derived as a function of the service group size and the number of channels on the switched service. This model can be further used to derive the optimal number of program channels to be switched, given a valuation of the bandwidth savings as a result of moving some channels from traditional broadcast to switched broadcast tiers. We further validate our model against simulated empirical data from a real cable system. The data collected from the live system indicates that the model appeared to predict an upper bound on the service usage, and the bandwidth required to ensure minimal blocking of the service.
Switched broadcast video can be a valid
element of the next generation cable network architecture.
Our model appears to provide an accurate estimate of the amount of bandwidth that can be saved by adding programs with low viewership shares to switched broadcast service instead of traditional broadcast. Because typical channel lineups have 75 to 80% of viewership share concentrated in the top 30 channels, the remaining channels can have very low viewership shares. As a result, many of the channels with low share are not being watched for extended periods of time. Switched broadcast can be used to deliver many of those remaining channels using significantly less bandwidth than traditional broadcast methods. If the saved bandwidth can be used for other revenue generating services, switched broadcast can economically offer many more channels to subscribers. Bandwidth savings can be at least 36%, and go over 60% for a service group size of 500
digital subscribers

The channel capacity model we developed provides a very conservative upper bound of channel usage given a blocking probability. Even under conservative assumptions and blocking probabilities at 1%, bandwidth savings from a switched broadcast service can be substantial. In a realistic example of a service group size with 500 digital subscribers, bandwidth savings during peak hours can be 36% when 100 channels are placed on the switched tier, and go over 60% when 200 channels are switched. By reducing the service group size, bandwidth savings can be even higher. Bandwidth savings is an increasing function of the number of switched channels, and a
decreasing function of the service group size Bandwidth savings in a switched broadcast environment is driven by the service group size, and the number of switched channels. In one example where 100 channels are switched, bandwidth savings jumps from 36% to 58% as the service group size is reduced from 500 subscribers to 250 subscribers. However, reducing service group size incurs a cost in terms of more QAM equipment and possibly the need for node splitting.
The efficiency gain from switched broadcast video also increases as the number of switched program channels increases. The more channels in the service, the greater the probability that some of those channels are not being watched. However, efficiency gain tends to diminish marginally as we move up the rating curve to include more popular channels into the switched channel lineup. Switched broadcast video provides a strategic competitive advantage over DBS providers in
terms of adding program channels and efficiently using bandwidth
Switched broadcast video is an ideal architecture for broadcasting hundreds of new program channels if each of those channels has a small rating share. The switched broadcast architecture may be viewed as an interim step towards full on-demand television. Switched broadcast is a competitive advantage for cable, due to the interactive nature of the cable network architecture. It is unlikely to be matched by DBS providers.

MOVING BEYOND THE STANDARD: CREATING ADDITIONAL BANDWIDTH THROUGH EXTENDING DOCSIS 2.0
Jack Moran, Distinguished Member of the Technical Staff
Motorola Broadband Communications Sector
Abstract Advanced spectrum management can
allow operators to understand the nature of the inevitable impairments on HFC networks so they can compensate appropriately for these impairments and create maximum billable bandwidth. This presentation will discuss how operators can more carefully monitor performance in a non-intrusive manner. It will show how operators can automatically correct for impairments and deploy extensions to the DOCSIS 2.0 specification to create more bandwidth for DOCSIS 1.0, 1.1, and 2.0 cable modems. It will also explain how post equalization techniques can allow operators to nearly double the throughput of their installed basis of DOCSIS 1.0 modems by enabling them to run 16 QAM modulation virtually anywhere that QPSK is currently running. By implementing noise cancellation simultaneously over diverse populations of cable modems, operators can provide throughput levels beyond that offered by the specifications to increase revenues while efficiently migrating to DOCSIS 2.0.
DOCSIS: A HISTORICAL PERSPECTIVE
Over just a few short years, the Data over Cable Service Interface Specification (DOCSIS) has evolved as the industry standard for ensuring interoperability between cable modems at the subscriber location and Cable Modem Termination System (CMTS) platforms at the operator’s headend.
DOCSIS 2.0 (SP-RFIV2.0-I02-020617) was specified by CableLabs and approved by the International Telecommunications Union (ITU) in December of 2002 as Recommendation J.122. DOCSIS 2.0-certified equipment is now entering the market.
The primary advantage of DOCSIS 2.0 is upstream performance. DOCSIS 1.X offers a maximum 3.2 MHz upstream channel width and a maximum of 16 QAM modulation. The new 2.0 cable modems will allow operators to migrate to 32 or 64 QAM across a channel width of 6.4 MHz. With extensions to DOCSIS 2.0, operators now have the ability to double the bandwidth available to legacy modems while concurrently deploying DOCSIS 2.0 modems that triple the bandwidth available today to 1.X modems.
DOCSIS 2.0 doubles the channel width and triples the upstream capacity when compared with DOCSIS 1.X cable modems.

This requires selecting the appropriate technologies and solutions for taking advantage of the many benefits of DOCSIS 2.0. But the rewards for Multiple System Operators (MSOs) that successfully deploy DOCSIS 2.0 while leveraging existing network assets are highly appealing. They will be able to immediately deploy higher-performance services over existing infrastructure, and capture new revenues from premium services.
At the same time, they will be able to
extend the life of legacy cable modems while increasing throughput. They will be able to more efficiently utilize existing infrastructure and deliver higher-speed services over existing Hybrid Fiber Coax (HFC) networks.
DOCSIS 2.0: INCREASING PERFORMANCE, THROUGHPUT
DOCSIS 1.1 provided the QoS control
and enhanced security lacking in DOCSIS 1.0, so the main focus of DOCSIS 2.0 became the improvement of performance and the more efficient use of network capacity.
Upstream Capacity
DOCSIS 2.0 triples the maximum upstream capacity when compared to DOCSIS 1.1. It enables transmission across a 6.4 MHz channel and increases upstream throughput to 30.72 Mbps by using 64 or 128 QAM and Trellis Coded Modulation (TCM).
DOCSIS 2.0 cable modems utilize fewer
timeslots to transmit a given amount of bandwidth than DOCSIS 1.X cable modems. This frees timeslots that can then be shared by other modems, which increases their throughput.
The asymmetric nature of DOCSIS 1.1 results in limited ability to support services that are more symmetric, such as video conferencing or packet telephony. But the new DOCSIS 2.0 specification focuses primarily on the upstream path from the subscriber to the network. It provides significantly increased capacity and improved robustness to the upstream path, thus helping operators make maximum use of their existing infrastructure.
Higher Modulation
Higher upstream bandwidth is enabled by adding a higher symbol rate and higher-order modulations. Operators can create a greater range of tiered services with graduated pricing plans, and thus have the ammunition to better compete with incumbent carriers for small- and medium-sized business accounts.
Providing modulation rates above 16 QAM does of course come at a price, because higher modulation rates require a higher SNR from the network. Fortunately, improved signal processing technology can allow operators to avoid the need for expensive plant upgrades, and DOCSIS 2.0 includes the ability to capitalize on advanced signal processing technology.
Impairment Protection
The new specification provides better protection from impairments on the CATV network. DOCSIS 2.0 enables operators to support up to 16 correctable symbols, rather than the ten symbols available in the previous specifications.
Operators can understand the various
impairments present in their infrastructure through the use of advanced spectrum measurement. This is particularly critical because in real-world environments, most—if

not all—of the following impairments are present at some level the majority of the time. Ingress Noise, which is significant
everywhere in the return path.
Impulse Noise, which is not significant above 18 MHz.
Common Path Distortion (CPD), which is significant everywhere in the return path.
Micro-Reflection, which is a significant impairment everywhere.
Amplitude Distortion, which is significant only above 35 MHz in 42 MHz systems, 48 MHz in 55 MHz Systems and 55 MHz in 65 MHz systems.
Group Delay Distortion, which is also significant only above 35 MHz in 42 MHz systems, 48 MHz in 55 MHz systems and 55 MHz in 65 MHz systems.
DOCSIS 2.0 allows operators to improve
the Signal-to-Noise Ratio (SNR). However, operators need the ability to more efficiently manage spectrum and improve noise cancellation simultaneously over diverse populations of DOCSIS 1.0, 1.1, and 2.0 modems.
This requires a CMTS that not only
supports DOCSIS 1.0, 1.1, and 2.0 but also offers a system architecture designed to improve the SNR of both legacy and new DOCSIS modems.
Pre-Equalization
The DOCSIS 2.0 specification offers increased support for transmit pre-equalization. It enhances micro-reflection (multipath) protection by increasing the length of the equalizer to 24 taps—which is three times longer than the DOCSIS 1.1 eight-
tap equalizer. With pre-equalization, the CMTS receiver equalizer convergences on a periodic burst and then sends the equalizer coefficients to the cable modems for implementation in their transmitters. This enables increased modulation and faster performance.
Advanced PHY
DOCSIS 2.0 includes advanced Physical Layer (PHY) modulation techniques that allow operators to run higher modulation levels. DOCSIS 2.0 enables enhanced management of RF spectrum so that operators can more efficiently cancel out or avoid noise impulses. This allows increased throughput and more reliable service delivery. The DOCSIS 2.0 specifications includes two separate technologies for achieving these goals:
Advanced Time Division Multiplexing
(ATDMA) Synchronous Code Division Multiple
Access (SCDMA)
UNDERSTANDING DOCSIS 2.0 PROTOCOLS
These protocols allow operators to
increase the channel size to 6.4 MHz and they support statistical multiplexing to optimize bandwidth utilization. They enable the use of a higher symbol rate and can deliver up to triple the capacity of a DOCSIS 1.X channel. Both protocols can coexist on the same channel because each logical channel type is assigned non-overlapping timeslots, and these timeslots are interleaved based on demand.
DOCSIS 2.0 supports immunity to
Ingress Noise for both protocols, though ATDMA is more robust against this impairment and it supports enhanced channel

equalization for both protocols to protect against system linear impairments. It enables improved immunity against Impulse Noise through the use of an improved Forward Error Correction (FEC) that includes the technique of Byte Interleaving for ATDMA and Frame Interleaving for SCDMA, though SCDMA is more robust against this type of impairment.
Both protocols support extended
modulation formats up to 64-QAM for ATDMA and 128-TCM for SCDMA. Operators can implement either or both protocols, depending on their requirements and preferences.
ATDMA Supports: A maximum channel width of 6.4 MHz
and a minimal channel width of 200 kHz
A maximum modulation rate of 5120 ksym/s and a minimum rate 160 ksym/s
Increased modulation orders, including QPSK and 8, 16, 32, and 64 QAM
Enhanced transmit pre-equalizer (24 taps)
Enhanced Reed-Solomon error correction with byte interleaving
Ingress noise cancellation with both DOCSIS 1.X and DOCSIS 2.0 cable modems is possible.
SCDMA Supports:
A maximum channel width of 6.4 MHz and a minimal channel width of 1600 kHz
A maximum modulation rate of 5120 ksym/s and a minimum rate 1280 ksym/s
Trellis Coded Modulation—QPSK and 8, 16, 32, 64 and 128 TCM
Enhanced transmit pre-equalizer (24 taps)
CDMA spreading to provide some immunity to impulse and ingress noise
Interleaving of SCDMA frames to provide impulse noise immunity similar to that provided by byte interleaving on the ATDMA protocol DOCSIS 2.0 specifies that the CMTS
receiver must support DOCSIS 1.1, ATDMA, and SCDMA modulation technologies on the same carrier frequency, which is referred to as mixed mode operation.
INTEROPERABILITY WITH .X CABLE MODEMS
DOCSIS 2.0 is backward-compatible
with the earlier specifications, and since it allows more subscribers and services on a single channel, operators can increase revenues from existing infrastructure while supporting symmetrical applications and leveraging the QoS features of DOCSIS 1.1.
DOCSIS 1.X cable modems of course do
not support DOCSIS 2.0, so the new specification provides for mixed mode operation for supporting 1.X and 2.0 cable modems. Unfortunately, this results in additional overhead of roughly 5-15 percent for ATDMA mode and 15-35 percent for SCDMA. This means that the existing customer base of installed DOCSIS 1.X cable modems will experience a degradation in throughput performance as 2.0 is deployed.
However, there is an innovative approach
to transitioning to DOCSIS 2.0 without incurring this performance overhead. Operators can implement ATDMA receiver technology that is by definition directly compatible with DOCSIS 1.X systems and is

capable of operating in a true DOCSIS 1.X mode.
Operators can transition to 2.0 without providing a performance burden to legacy subscribers because the ATDMA CMTS can operate in DOCSIS 1.X mode.
The ATDMA receiver technology provides post-equalization support that can increase throughput for existing customers by at least 50 percent by using DOCSIS extensions that enable virtually all DOCSIS 1.0 cable modems to operate in 16 QAM mode where they could previously operate in QPSK.
When there is a significant number of DOCSIS 2.0 cable modems installed, the cable operator can begin the ATDMA Logical Channel Operation in which the Symbol Rate remains the same (2560 ksym/s) but the DOCSIS 2.0 cable modems can begin to transmit in a pure ATDMA mode of operation, i.e. with extended FEC correction, byte interleaving (if necessary) using higher constellation rates such as 32 QAM or even 256 QAM.
When the number of 2.0 modems exceeds the number of 1.0 modems, then the full logical channel operation of using ATDMA mode in a 5120 ksym/s operation can be implemented while the remaining 1.0 modems operate at 2560 ksym/s.
The financial benefits of this migration approach are compelling. Operators can accelerate revenue from 2.0 services, and they can implement gradual migration at the pace that makes the most economic sense for them. They can continue to support legacy modems while introducing new services to these subscribers, and they can concurrently support
DOCSIS 1.X and 2.0 operation across the same infrastructure.
Cable operators can double the upstream bandwidth for a large population of modems, thus creating increased billable bandwidth without further network buildout. They can create upstream bandwidth that supports higher-speed services and enables new broadband services that command premium pricing.
ADVANCED SPECTRUM MANAGEMENT TO EXTEND DOCSIS 2.0
Efficient migration to DOCSIS 2.0
requires the effective management of impairments on the HFC network
Spectrum management is essential so that
operators can identify impairments and make the necessary adjustments to improve performance. The most problematic impairments—ingress noise and impulse noise—can be measured using the established Fast Fourier Transform (FFT) measurement technique.
However, FFTs alone cannot accurately
assess the total impact of noise on network performance.
The fundamental challenge is that
measurement time directly impacts throughput, because in the typical scenario operators cannot send data while taking measurements. Operators trying to improve performance are therefore hard-pressed to impose increased demands on the infrastructure by performing continuous testing that degrades the bandwidth being tested.

But the implementation of advanced spectrum management on an extra receiver avoids the performance burden and allows operators to collect the performance information they need to optimize the use of network infrastructure.
The addition of an extra receiver on the CMTS allows operators to monitor
performance on any one of the upstream ports without impacting performance. Operators can therefore non-obtrusively gain access to all of the return nodes connected to one of the receiver ports and perform tests on any available modem on any one of the receiver port’s supported nodes.
MSOs can use the extra receiver to identify the diverse types of noise and then implement spectrum management enhancements that can process this information and take measures to cancel it out in real time. The extra receiver can be effectively connected in parallel with a live receiver port so the operator can measure traffic and performance in real-time on any given live receiver port.
It can access all of the mapping information as well as a full list of cable modems available to whichever receiver port is currently being evaluated. Therefore, while the receiver port being monitored is performing its function at full capacity, the ninth receiver has the luxury of time to perform detailed, lengthy, and coherent SNR measurements. This architectural approach to the CMTS enables continuous monitoring and adaptation so that cable operators can

aggressively implement advanced noise cancellation in environments where the types and degrees of impairments change frequently.
Sophisticated Noise Cancellation for ATDMA and SCDMA
Extensions to the DOCSIS 2.0 protocol can leverage the DOCSIS ATDMA specification and add value by including advanced noise cancellation techniques that work with all DOCSIS 1.X and 2.0 cable modems to help operators increase throughput. Cable operators can double the performance of legacy modems while concurrently deploying DOCSIS 2.0 modems that enable new services and increased performance levels. Rich noise cancellation capabilities allow operators to optimize performance while operating in DOCSIS 1.X/2.0 mixed mode.
For example, operators can benefit from
upstream transmission speeds that exceed DOCSIS 2.0 specifications by 10.24 Mbps using ATDMA technology and 256-QAM, which is enabled by proprietary extensions beyond DOCSIS 2.0. Therefore, while DOCSIS 2.0 has opened an opportunity for a standard cable modem to operate up to an information rate of 30.72 Mbps (64-QAM or 128-TCM QAM), operators can leverage extensions to offer significantly higher throughput beyond the capabilities of a standard implementation.
The advanced spectrum management
capabilities, superior monitoring and measurement, and rich noise cancellation allow operators to achieve higher modulation rates. Cable operators can achieve 128 and 256 QAM for ATDMA implementations. These higher modulation schemes allow operators to achieve even greater throughput than offered by the DOCSIS 2.0 specification.
Post-Equalization
Post-equalization capabilities offer the operator the ability to increase the throughput of DOCSIS 1.0 cable modems by allowing them to operate in 16 QAM mode virtually anywhere that it is possible to operate in QPSK. The CMTS performs per-burst equalization which enables the receiver to equalize—and thus correct for—the effects of micro-reflections, amplitude distortion, and group delay distortion.
These impairments have historically been
the limiting factors in achieving QAM modulation higher than 4 QAM (QPSK). The combination of post equalization and superior ingress noise cancellation capabilities results in a DOCSIS 1.X system today where 16 QAM, error-free operation is achievable virtually anywhere in the return path.
POWERFUL MONITORING, MEASUREMENT, AND MANAGEMENT
Sophisticated algorithms can be
implemented on a CMTS to determine which cable modems are most representative of the return path under evaluation can use these modems to make signal quality measurements for the cable plant. This detailed monitoring is non-intrusive to the subscriber while enabling the operator to continuously monitor noise and improve performance.
Operators can give performance
guarantees and implement flexible and automated means of continuously minimizing noise and increasing performance. For example, a cable operator can monitor performance and implement frequency hopping to a carrier frequency that will support guaranteed, error-free 16 QAM operation.

With advanced spectrum management capabilities on a robust CMTS platform, operators can optimize performance across network infrastructure that consists of DOCSIS 1.0, 1.1, and 2.0 cable modems. They can monitor and manage the use of spectrum in real-time without affecting performance so that cable operators can carefully measure the factors impacting spectrum utilization and compensate in real time to optimize throughput. Operators can implement a smooth transition from DOCSIS 1.X to 2.0 while gaining the ability to improve the performance of the existing installed base so they can increase revenue during the transition.
ABOUT THE AUTHOR
Jack Moran is a distinguished member of the technical staff for the Network Infrastructure Solutions (NIS) business for Motorola Broadband. He is responsible for DOCSIS Physical Layer performance over an HFC RF network system.
For the past four years, Moran has been modeling the return path for DOCSIS 1.0, 1.1, and now 2.0 performance capabilities. This modeling effort has included several live plant characterizations in an effort to simulate on a repeatable basis the type of real-world impairments that DOCSIS systems must overcome.
He is also a member of the DOCSIS 2.0 Technical Team PHY Layer Issue as well as a member of the former IEEE 802.14 Cable Modem Group.

MOVING SET-TOP BOXES TO THE IP INFRASTRUCTURE
Doug Jones YAS Broadband
Abstract Moving the STB to the IP infrastructure is a whole lot more than just delivering video over IP. In fact, of the five areas of consideration discussed in this paper, video over IP is probably the furthest from happening. When migrating STBs to the IP infrastructure, the first steps will include solving embedded CM provisioning and moving OOB transport and interactive applications to the IP infrastructure. Video over IP will follow when the economics prove viable.
INTRODUCTION Business Case The near-term drivers for moving the STB to the IP infrastructure are neither Internet access nor delivering video over DOCSIS. Rather, moving the STB to the Cable IP infrastructure is about reducing both capital and operations costs by placing all services (data, voice, and the video platform) on the same network infrastructure. The cable industry is migrating from proprietary technologies to using standard technologies based on the Internet Protocol (IP). It started when Cable operators began building an IP infrastructure to provide high-speed access to the Internet. Most recently this IP infrastructure will be used to provide telephone service using Voice over IP (VoIP) technology. Running a second service on top of a single infrastructure provides many business advantages. Specifically, the network is already there and does not have to
be build from scratch. Equipment is available from multiple suppliers. Technicians are already trained for the network equipment. What remains to happen is the migration of the video business to the common IP platform used by these other Cable services. Not only will additional cost savings be realized by making use of the existing infrastructure, there is more innovation and less operational expense associated with the existing IP infrastructure. The move does not include Internet access; rather, the move will have the STB business running on IP networks. The IP infrastructure has proven to be both general purpose (supporting many different applications from web and email to VoIP and streaming media) and low cost. IP has stood up in the face of competition from other networking technologies such as AppleTalk and Novell Netware. IP technology just works, is widely deployed and available from multiple suppliers. Areas of Discussion Providing either HSI or VoIP service through the STB is not discussed in this paper. Rather this paper discusses five areas when considering moving the STB to shared IP infrastructure. These are: 1. Embedded CM Provisioning 2. Out-of-Band Transport 3. Interactive Applications 4. Video Delivery 5. CMTS considerations

The section on CMTS considerations is include because items 2, 3 and 4 place traffic on the CMTS which could also be carrying HSI and Telephone service.
OVERALL SYSTEM VIEW A system view with the five areas of discussion is shown in Figure 1.
1-way OOB traffic (DSG)2-way interactive traffic
HFC
CMTS
STBcontroller
Interactiveapplications
STB & interactiveservers
eCMProvisioning
QAM
RFcombiner
eCM
STBVOD
Figure 1 – IP STB system view
Note that in addition to the embedded CM (eCM) in the STB, a large portion of the diagram deals with integrating the Cable IP network with the headend STB systems. The five areas of the paper are represented in this view. eCM provisioning is shown by the connection through the CMTS to the eCM provisioning servers. OOB transport is show by the connection from the STB controller, through the CMTS as a one-way stream of information to the STB. Interactive applications are shown in the headend via an IP connection to the STB through the CMTS. Video delivery is show through a QAM modulator and not the CMTS as this is the most cost effective means to deliver digital video at this time. There is no technical reason why digital video could not be delivered through the CMTS, however at this time the economic reasons are not there. Finally, with all the
connections through the CMTS, a section is included to discuss the traffic engineering impacts of this device.
1. eCM PROVISIONING Introduction Because the STB is being added to the IP network infrastructure, the STB will use a DOCSIS® embedded Cable Modem (eCM) for both one-way OOB traffic and interactive traffic over the HFC. The eCM does not have to be used for either Internet access or for video delivery, just for OOB and interactive traffic. Having an eCM in a STB provides an interesting choice for operators. The STB is traditionally provisioned by the STB headend controller. DOCSIS CMs are provisioned by a set of HSI servers. These two worlds have not met before and as a result, the operator has the following choices when it comes to provisioning. 1. Both STB and eCM provision from the
STB controller, which means the eCM may follow STB-supplier proprietary provisioning instead of defined HSI provisioning steps.
2. Provision the STB from the STB
controller and the eCM from the HSI provisioning servers
3. Provision both the STB and the eCM
provisioning from the HSI complex (which means the STB provisioning migrates to a single complex that is also provisioning DOCSIS, PacketCable and CableHome devices.
This paper will assume that option 2 is used because this allows continued use of the deployed STB controller while using

standard eCM provisioning. In the longer term, since both HSI and VoIP are provisioned from the “data” side of the house, it is expected that STB provisioning will also migrate in this direction toward (option 3); however, this is a future topic. eDOCSIS™ There is an industry specification for Embedded DOCSIS, called eDOCSIS. The first DOCSIS specifications were created for stand-alone cable modems that provide high-speed Internet services. The emergence of a class of devices that embeds additional functionality with a Cable Modem, such as packet-telephony, home networking and video, has necessitated the creation of this specification to define additional requirements such as interfaces, management and provisioning models. This is necessary to insure the eCM will function and interact properly with both the network and the device in which it is embedded. The goals for eDOCSIS are described in the following list: • To preserve functional separation of the
DOCSIS cable modem entity from the device in which it is embedded. This ensures existing DOCSIS cable plant integrity, cable modem configuration, management and provisioning security are not compromised.
• To isolate DOCSIS cable modem functionality so that specification compliance can be tested for the eCM component independent of device in which it is embedded.
• To enable the service provider to enable or disable forwarding traffic between each application and the eCM within the eDOCSIS Device.
• To maximize compatibility with existing back-office management and provisioning infrastructure so that new services enabled by eDOCSIS devices can be deployed rapidly.
• To architect eDOCSIS devices in such a way as to scale to new services and applications, and to take advantage of technology innovations to achieve low cost and high functionalities.
An eCM has special requirements placed on it beyond a standalone CM (the kind used for HSI service). Specifically when the eCM is provisioned it includes information that identifies the device it is embedded in. eDOCSIS currently specifies how to embed a CM inside of two devices, a PacketCable Media Terminal Adapter (MTA) and a CableHome Residential Gateway. eDOCSIS does not specify how to embed a CM inside a STB; however, it seems reasonable to follow the blueprint already devised for these other devices. For the purpose of provisioning, Figure 2 is one possible logical diagram of a STB with an embedded DOCSIS CM and it shows three separate elements within the STB that need to be provisioned: 1. eCM 2. eSTB 3. CableCARD™ The eCM will be provisioned by the HSI servers as a separate entity from the rest of the STB. The embedded STB (eSTB) is provisioned by the STB controller over the DSG connection (described in a later section). CableCARD provisioning depends on operator policies and is beyond the scope of this document.

CableCARDRF
eSTB
eCM
RF
A/V portsApp ports
LAN ports
video
2-way comm
1-way DSG
Figure 2
eDOCSIS provides guidelines for how the eCM should be provisioned, including DHCP options. In addition, eDOCSIS provides a blueprint for defining the logical connections within the STB to the CableCARD and the eSTB for consistent headend management practices.
2. OUT-OF-BAND TRANSPORT Introduction OOB Transport enables a control-plane connection to the STB, even when there is an outage on the return path (and only the forward path is available to the STB). Traditionally this connection is from the STB controller over a QPSK modulator on the forward cable plant; a network completely separate from the IP infrastructure as shown in Figure 3.
1-way OOB traffic2-way interactive traffic - data - STB
HFC
STBcontroller
Interactiveapplications
STB & interactiveservers
QAM
RFcombiner
STB
VOD
OOBQPSK
CMTS
eCMProvisioning
CM
Figure 3
An industry specification, DOCSIS Set-Top Gateway (DSG), provides a method to migrate the legacy STB OOB channel to the common IP infrastructure. DSG supports retaining the legacy OOB transport for already deployed STBs but allows newly deployed boxes to operate on the infrastructure. DOCSIS Set-Top Gateway (DSG) The DOCSIS Set-top Gateway function resides in the CMTS and is called the DSG Agent. The DSG Agent provides reliable and transparent transport for Out-Of-Band messaging that has traditionally been carried on dedicated legacy OOB channels, specifically those defined in SCTE 55.1 and SCTE 55.2, over a DOCSIS forward channel. A DSG configuration is shown in Figure 4 reflecting how as part of DSG the STB controller is networked to the CMTS.
1-way OOB traffic (DSG)2-way interactive traffic
HFC
CMTS
STB & interactiveservers
eCMProvisioning
RFcombiner
STBcontroller
eCM
STB
Figure 4 To support operation during return path outages, DSG uniquely modifies the eCM to continue receiving downstream information in the event of a return path outage. Receiving the OOB information through

DSG takes precedence over registering as a two-way CM. Legacy OOB messages from the STB controller arrive at the CMTS where the DSG agent encapsulates them into Ethernet frames which are delivered over the DOCSIS forward path. DSG further describes how to address these Ethernet frame to allow an eCM in a STB to find them on the DOCSIS channel. The eCM passes the DSG information to the CableCARD or eSTB depending on how the system architecture is defined. DSG supports a minimum of 8 tunnels per STB Conditional Access system (CAS). In this way, information can be segmented onto individual tunnels for easier management. For instance, System Information (SI) and Emergency Access System (EAS) information could be placed on one tunnel while Electronic Program Guide (EPG) information could be placed on a second tunnel and CAS information such as Entitlement Management Messages (EMMs) can be placed on a third tunnel. The operator has the flexibility to configure the DSG tunnels based on their needs and preferences. DSG Basic Mode In DSG Basic Mode the destination Ethernet address of the DSG Tunnel may be either a multicast (group) MAC address or a unicast (individual) MAC address. The DSG Client in the STB recognizes a DSG Tunnel solely by the uniqueness of the DSG Tunnel Address. The tunnel addresses are known by the STB ahead of time. The tunnel addresses are either included in the software image of the STB or they are learned from a CableCARD™ when it is inserted into the STB.
DSG Advanced Mode DSG DSG Advanced Mode provides several benefits over Basic Mode. First, DSG Tunnel Addresses are learned dynamically from the network; in this case the DOCSIS downstream. This provides the operator with more flexibility when associating STB controller information to DSG Tunnels. Second, Advanced Mode provides additional options for identifying DSG tunnels. In addition to Ethernet addresses, both CA_system_ID and Application_ID are included. These two IDs still map to Ethernet MAC addresses on the DOCSIS forward path, but using the IDs allows a more seamless integration with existing STB operations. Third, Advanced Mode provides a keep-alive message on the DOCSIS forward path. In the event of a backend network outage when STB controller messages may stop appearing on the DOCSIS downstream, this keep-alive message provides a mechanism to keep the embedded CM on that downstream channel so when the network is restored the STB will begin receiving OOB information as quickly as possible. Fourth, Advanced Mode provides additional security features achieved through a combination of techniques. First, the destination MAC address of the DSG Tunnel may be replaced dynamically. If the MAC address of a tunnel ever becomes widely known, it may provide the opportunity for a PC to spoof that MAC address and snoop the DSG Tunnel. DSG Advanced Mode also provides a downstream filter which will further qualify the DSG Tunnel based upon destination IP address, source IP address, and destination UDP port.

3. INTERACTIVE APPLICATIONS Introduction Interactive applications require a method for 2-way communication between the STB and the application server on the back-office network. Since the network has migrated to IP, supporting the end-to-end connection over IP is not unreasonable. And since the method for Cable to offer IP over the HFC network is DOCSIS, having an embedded CM in the STB provides a means for communications between the STB and application server to be over common infrastructure. Three areas relating to interactive applications are discussed: • OCAP • network topology and services • security All relate to support for IP networking and connections. OCAP OCAP, the OpenCable™ Application Platform, provides Application Programming Interfaces (APIs) that support two-way IP networking. Specifically OCAP 1.0 provides support for the basic forms of IP transport (unicast and multicast) as well as obtaining an IP address using the Dynamic Host Configuration Protocol (DHCP). While the existing APIs are sufficient for basic IP communication, additional APIs could be used for more advanced forms of IP communication.
Network Topology The back-office IP network is generally very specific to the operator. There are numerous protocols and connectivity choices available that can be used to meet business objectives. Important considerations include: • address plans that incorporate STB
application servers in the network with HSI and VoIP servers.
• prioritizing STB interactive application traffic relative to HSI and VoIP traffic.
• designing and sizing network connections • routing protocols for a resilient network. Interconnection of the Video and HSI networks should use common protocols and links designed from a systems perspective. Security Figure 5 shows an additional connection not included in Figure 1.
CMTS
Interactiveapplications
VOD
STB & interactiveservers
eCMProvisioning
QAM
RFcombiner
Internet
STBcontroller
Figure 5

Specifically the CMTS connection to the Internet is shown for HSI and VoIP services, providing an indirect connection between the Internet and the STB platform. This is not a cause for concern for a well-engineered network. The HSI and VoIP service elements also have this indirect connection and are kept safe through prudent networking practices. The operator needs to be aware of the threats and take appropriate measures to secure the STB platform.
4. VIDEO DELIVERY Introduction Video delivery over IP is not a question of when but how far to take it. Video is delivered from the video server to the edge QAM modulator over Ethernet connections (typically Gigabit Ethernet, GigE) as IP packets today. Therefore arguably video is being delivered over IP today. But it is also technically possible to deliver video over IP all the way to the STB by delivering the video to a CMTS. Both scenarios are show in Figure 6.
Video Servers
QAM
...
GigabitEthernetSwitchfabric
CMTS
CMTS
QAM
QAM
HFCEdge
devices
...
Figure 6
Video Delivery will be discussed in two segments: from the video server to the HFC edge and from the HFC edge to the STB. The HFC edge can either be a QAM modulator that delivers video over native MPEG transport or the HFC edge can be a CMTS that delivers video over DOCSIS. Technically both work, economically there are differences. Server To HFC Edge Backbone and Metropolitan Area Network digital video transport (broadcast and on-demand) is already using MPEG-2 framing over User Datagram Protocol (UDP)/IP carried over Gigabit Ethernet. Both Single Program Transport Streams (SPTS) and Multi-Program Transport Streams (MPTS) are carried this way. An example of SPTS is a VoD stream at the streaming server’s Gigabit Ethernet output. An example of MPTS is the multiplexed broadcast streams from a multiplexer. Current industry practice is to encapsulate seven MPEG-2 transport frames into a single UDP/IP packet. Both constant bit rate (CBR) and variable bit rate (VBR) encodings can be supported. The IP-based video transport is directed to an edge termination that may be either a QAM modulator or a CMTS. HFC Edge To The STB The debate about video over MPEG or video over IP should be about video over the most cost effective HFC transport. MPEG and IP are both digital technologies that deliver content in the form of 1’s and 0’s; however the current costs of the technologies are different. To determine which is the most cost-effective, the cost of MPEG QAM

modulators should be compared to the cost of IP QAM modulators. An IP QAM modulator is the QAM modulator in a CMTS. Count the number of downstream ports in a CMTS (each is a QAM modulator) and divide that number into the cost of the CMTS to get a rough estimate of the cost of an IP QAM modulator. Compare this to the cost of the QAM modulator being used for VOD. While there are other considerations, this provides a rough estimate. The decision is a matter of economics, not technology.
5. CMTS CONSIDERATIONS Introduction Two considerations will be discussed that illustrate issues when carrying multiple services over a DOCSIS consideration. The first is ensuring each class of traffic receives the proper delivery guarantees. The second is ensuring overall that the CMTS does not run out of other resources before becoming bandwidth limited. These issues need to be solved when a second service is added to the CMTS, such as adding VoIP when already offering HSI. With DSG and possibly other traffic types on the horizon, solving these issues becomes even more important. Traffic Classes The CMTS may be carrying several types of traffic including: • DSG traffic • STB interactive application traffic • HSI traffic • voice traffic • video traffic • on-line game traffic, etc.
All of these traffic types can be carried over IP; however, each traffic type may demand different resources from the CMTS. Simply mixing these traffic types on the DOCSIS channel may result in the jitter or delay of all packets or in the worst case dropping some packets. DOCSIS 1.1 provides tools that can guarantee the delivery of traffic types, not all traffic, but some types of traffic. The operator will need to apply these DOCSIS Quality of Service (QoS) tools, along with proper network engineering, to meet service guarantees. The PacketCable™ Multimedia project (PCMM) describes one method to apply and manage DOCSIS QoS tools. A discussion of PCMM is beyond the scope of this paper; however, it will provide a valuable method to manage QoS on the DOCSIS network. CMTS Resources The DOCSIS protocol has certain design limits that should be respected when engineering a network. With HSI service the CMTS usually runs out of bandwidth before it runs out of other DOCSIS resources; however, as different types of services are added to the DOCSIS network, it is possible that other DOCSIS resources will come into play before available bandwidth is exhausted. One such limit within the DOCSIS protocol is the pool of available Service Identifiers (SIDs). Each upstream connection between a CM and CMTS requires a SID. Within a DOCSIS domain, defined as the group of upstream channels associated with a downstream channel, there are approximately 8,000 available SIDs.

Field experience shows that with HSI a DOCSIS domain will run out of available bandwidth before 8,000 CMs are present; however, the addition of DSG to the network will increase the number of low bandwidth CM connections. DSG is assumed to be low bandwidth at the start because current two-way STB connections are much more concentrated than HSI connections. With the addition of low bandwidth connections to the already existing HSI connections, it is possible the CMTS SID limit could be approached. Theoretical calculations show that even with multiple low-bandwidth connections the industry has a low probability of reaching the SID limit; however, further field experience is needed to fully understand the issues.
SUMMARY
Moving the STB to the IP infrastructure involves more than just delivering video over IP. Nor is Internet access from the STB a prime concern. Rather, there are fundamental provisioning and traffic engineering issues to address as more services are added to the IP infrastructure.
AUTHOR CONTACT
Doug Jones YAS Broadband Ventures 1877 Broadway Boulder, CO 80302 voice: +1 303.415.9400 x303 [email protected]

MPEG-2 VIDEO STREAMS ON A DATA NETWORK (or What Happens when Video gets the Jitters)
William Garrison Motorola, Inc., Broadband Communications Sector Abstract This paper will review the issues involved in using standard wired and wireless IP data networks to carry MPEG-2 Transport Streams. Transport within the headend and within the home will be covered. IEEE 802.11a/b/g, HomePlug, 100BaseT Ethernet, Gigabit Ethernet and proprietary IP network protocols will be covered. The difference between carrying Constant Bit Rate and Variable Bit Rate streams will be examined. New revisions of data networking standards are including provisions for carrying video traffic. Will these enhancements be enough? What can we do until they are here?
INTRODUCTION MPEG-2 Transport Streams as used in broadcast networks were designed to be delivered as a continuous flow of bits on a HFC (Hybrid Fiber Coax) plant. This is quite different from what you find on a data network, where bit streams are broken into packets and then sent in discrete bursts. There also is another fundamental difference between data and video traffic. Data delivery is focused on accuracy while video delivery is focused on timeliness. Video decoding is designed to conceal errors while data transfers require perfection. Can both of these coexist on the same network? Although there are other potential issues when carrying MPEG-2 Transport Streams on
a data network, this paper will focus on the issue of jitter. Also this paper will focus on MPEG-2 Transport Streams as traditionally carried on HFC plants and decoded by standard settops.
What is Jitter? For MPEG-2 Transport Streams, jitter is the “short-term non-cumulative variations of the significant instants of a digital signal from their ideal positions in time.“[1]
MPEG 1 MPEG 2 MPEG 3 MPEG 4 MPEG 5
Perfect World
Real World
-1 -2
MPEG 1 MPEG 2 MPEG 3 MPEG 4 MPEG 5
0 +1
Figure 1 – Jitter Timeline
For the purposes of this paper, jitter is the time difference between when a MPEG-2 packet should arrive and when it actually does arrive. A packet might arrive early or late. In the Real World Timeline in the figure above, packets 2 and 3 arrive late and packet 5 arrives early. Packets arriving early could overflow the MPEG decoder buffer, resulting in lost information. Packets arriving late could result in MPEG decoder buffer underflow, resulting in a packet that was not available when it was scheduled for presentation.

If you observe these arrival time variations over a long period, you can characterize the jitter. The greatest positive arrival time jitter minus the greatest negative arrival time jitter is called the "peak to peak jitter amplitude". It also may be of interest to see if the distribution of the jitter is completely random or correlated with other events. Correlated jitter might be due to a protocol that packs multiple MPEG-2 packets into a single transport unit. Random jitter might be due to random noise that causes packet loss and therefore packet retransmission. While the type of jitter does not matter to the MPEG-2 Transport Stream specification, knowing the type helps us select the best way to mitigate jitter.
MPEG-2 JITTER REQUIREMENTS The MPEG-2 PCR (Program Clock Reference) jitter tolerance is ± 500 nanoseconds.[2] The MPEG-2 standard does not define a jitter budget on a per-device basis. The standard instead places an absolute limit on packet jitter as received by the MPEG-2 decoder. Unfortunately, some device manufacturers see this number for the first time and conclude that they may add up to ± 500 nanoseconds of jitter. However, the MPEG-2 PCR jitter tolerance is a system level specification, not a device level specification. By the time a MPEG stream reaches your home, the devices along the way may have “spent” all but 50 nanoseconds of the MPEG-2 jitter budget. And why not? Every device along the distribution chain is trying to perform its function with the greatest efficiency and at the lowest cost. The lowest cost often results in the maximum allowable jitter. So, as a practical matter, any in-home redistribution system is limited to adding no more than ± 50 nanoseconds of jitter.
An Alternate Jitter Requirement? Some people read the MPEG-2 Annex D and get excited because it says “4 milliseconds is intended to be the maximum amount of jitter in a well behaved system.” [3] What happened to the ± 500 nanoseconds? The jitter they are describing in this Annex is something completely different from the PCR jitter we have been discussing. This jitter is called multiplex jitter. Multiplex jitter is often caused when packets are moved around to create or modify a MPEG-2 MPTS (Multi-Program Transport Stream). After you reposition a MPEG-2 packet, you are still required to re-timestamp the PCRs in the packets to within the original PCR jitter tolerance of ± 500 nanosecond. Jitter Allocation Most currently deployed VOD (Video on Demand) systems that use MPEG-2 Transport Streams allocate:
• a small portion of the jitter budget to the MPEG encoder (no device is perfect!)
• a portion to VOD servers • a slightly larger portion to the output
multiplexing and QAM (Quadrature Amplitude Modulation) processing
• a bigger portion to possible in-line remultiplexers/re-encoders that may be present (there could be 2-3 of these)
• a negligible amount to the HFC distribution system
Notice that there are quite a few devices in the path which are “spending” from a very small jitter budget.

NOT ALL MPEG-2 PACKETS ARE EQUAL
Previously, it was mentioned that packets arriving:
• early could overflow the MPEG-2 decoder buffer
• late could underflow the MPEG-2 decoder buffer
This is true for all MPEG packets. Because there is some buffering at the MPEG-2 decoder, underflow and overflow are infrequent occurrences unless the jitter is quite severe. However, there is another effect that is more likely to cause problems replaying a jittered MPEG-2 transport stream – but only for certain MPEG-2 packets. MPEG-2 requires a PCR bearing packet at least once every 100 milliseconds. This means that most packets will not have a PCR. Excess jitter between PCR bearing packets will typically disrupt the MPEG-2 decoder’s timing recovery process. The maximum tolerable PCR jitter is a function of the decoder’s PLL (Phase Lock Loop) design. The PLL design affects acquisition time. So, there is a tradeoff that every vendor must make between acquisition time and jitter tolerance. Different vendors have made different choices. You may send a MPEG-2 Transport Stream with more than ± 500 nanoseconds of PCR bearing packet jitter to a settop and it may play without errors. Some decoders will operate properly when fed a MPEG-2 Transport Stream that does not meet all of the MPEG-2 specifications. However, you must remember that ± 500 nanoseconds is the MPEG-2 requirement. This is all any MPEG-2 decoder is required to support and this needs to be your design requirement.
DATA NETWORKING JITTER A data network is normally shared among many devices and supports different types of traffic. There is no concept of a continuous stream of bits. Bits are packed into groups which are then sent in discrete bursts. The protocol used by the data network determines when these bursts can be sent. No widely deployed data networking technology adds less than 50 nanoseconds of jitter when carrying a MPEG-2 Transport Stream. Let me back up this rather sweeping assertion by an example. Let’s look at the time required to send MPEG-2 packets over a common 100BaseT Ethernet. Most systems try to minimize IP (Internet Protocol) overhead by packing seven MPEG-2 packets into one IP frame. This is the maximum number of MPEG-2 packets that will fit into a single IP frame. To send one of these MPEG-2 bearing Ethernet frames requires:
• 12 Bytes for the InterFrame Gap • 8 Bytes for the MAC Preamble • 20 Bytes for the IP header • 8 Bytes for the UDP header • 1316 Bytes of data (7 MPEG-2
Packets) • 4 bytes for the CRC (Check Sequence) Total = 1368 Bytes
At 100 Mbps, each bit takes 10 nanoseconds. Therefore:
• 1368 bytes * 8 bits/byte = 10,944 bits • 10,944 bits * 10 ns/bit = 109,440 ns

As you can see, the jitter caused by packing these MPEG packets together is far more than ± 50 nanoseconds. Fifty nanoseconds represents only 5 bit times! Most other widely deployed Ethernet based systems, such as IEEE 802.11a/b/g and 10BaseT are slower and some of these have even more overhead. Step up to Gigabit Ethernet and the numbers get 10 times better than 100BaseT, but still far from ± 50 nanoseconds. Even at Gigabit Ethernet speeds, one bit takes one nanosecond, so 50 nanoseconds represents 50 bit times. The InterFrame Gap required by the Ethernet protocol between every transmission is 96 bits, which equals 96 nanoseconds! In addition, many data networks provide reliable service by continuing to retransmit a packet until it is successfully received. This is the correct approach to use for delivering data but makes things worse for MPEG-2 Transport Streams. If video data is not delivered by its presentation time, it is better to skip this packet and move on to the next. But if a packet contains a PCR, discarding the packet may mean there is no PCR within the 100 milliseconds required by the MPEG-2 specification. ATM (Asynchronous Transfer Mode) has an encapsulation protocol with a concept of “PCR Aware”, but I have not seen this proposed for any other system.
QUALITY OF SERVICE IEEE 802.11e is currently being developed as a standard QoS (Quality of Service) mechanism for wireless systems. It promises to provide a QoS which meets entertainment video requirements. IEEE 802.11p provides a prioritized QoS for wired LANs and HomePNA 2.0 includes a prioritized QoS, but these schemes do not support entertainment
level QoS. While HomePlug 2.0 does not support entertainment level QoS, HomePlug AV (the next version of HomePlug) will support entertainment level QoS. So, will 802.11e or any of the other QoS initiatives meet the MPEG-2 Transport Stream requirements? No. In all fairness, how could they? As shown in the previous example, the physical transport network just does not have the timing resolution required to meet a ± 50 nanosecond jitter specification. But I See it Work All the Time! When a protocol claims to support entertainment quality video, they usually are referring to “Streaming Media”. Streaming Media is a different kind of MPEG-2 delivery system. The big difference is in Streaming Media, the decoder works from a “pull” model. In a pull model, the decoder requests blocks of MPEG-2 packets as soon as it has the buffer space to store them. Streaming Media decoders usually have a much larger buffer, so jitter is less of a problem. In addition, they also run their display clock from a local source so that they don’t have to worry about timing recovery. In contrast, a MPEG-2 broadcast decoder is at the end of a fire hose of bits that keep coming at it, whether it is ready or not! A broadcast receiver may need to either drop a frame when its buffer overruns or repeat a frame when its buffer underruns. This is how the broadcast model can use one source to feed millions of decoders. In the Streaming Media model, every decoder is making its own requests. So, if you replaced a broadcast system that served millions with a Streaming Media system, it would require a video server farm that supported millions of sessions.

RECOVERING FROM JITTER Archimedes said that he could lift the earth if you gave him a firm enough fulcrum and a long enough lever. Similarly, given a large enough buffer and a large enough delay allowance, you can remove any amount of jitter. However, if you have a large jitter buffer, you must wait for the buffer to fill before you can view the video. This requires a patient viewer. Infinitely long levers and infinitely patient viewers are equally unlikely. Most current PC Streaming Media players use this buffering approach. They normally buffer 5-10 seconds of video prior to playing the first frame. However, entertainment video is often interactive, so “solving” the jitter problem with a large buffer at the receiver will result in a system that seems sluggish. Channel changes would become quite lengthy. Again, this sluggish response is the typical experience we have come to accept with streaming media on a PC. Even with a large buffer, video glitches are common today in the streaming environment. The proposed QoS initiatives will take care of these problems for Streaming Media, but won’t help our case of broadcast style MPEG-2 Transport Streams. To use a standard data network to deliver MPEG-2 Transport Streams, you need to use whatever network features are available (such as QoS) to minimize the jitter added by the network. Then you will need to add de-jittering equipment at the edge of the data network. Constant and Variable Bit Rates There are two kinds of MPEG-2 Transport streams. Constant Bit Rate streams are, as their name suggests, a steady stream of MPEG-2 packets delivered at an steady rate. Variable Bit Rate streams deliver just enough
MPEG-2 packets to present the content at the specified quality – and no more. So, while a Variable Bit Rate stream may be specified as having an “average” bit rate of 3 Mbps, there may be intervals of time where the short term bit rate peaks at 9 Mbps – or more! The MPEG-2 specification allows standard definition rates as high as 15 Mbps. Most MPTS (Multi-Program Transport Streams) delivered from a satellite feed are a constant 27 Mbps, but the individual program streams that it contains are Variable Bit Rate. If you separate out a single program stream from a MPTS and then send it over a data network, you must be prepared to serve the stream at its peak rate, not its average rate. What is the difference between Constant Bit Rate and Variable Bit Rate streams when it comes to de-jittering? With a Constant Bit Rate stream, you can buffer the incoming packets and then play them back at the same rate as the rate at which they were encoded. With Variable Bit Rate, you never quite know when to send them to the MPEG decoder. In this case, you need to time stamp every MPEG-2 packet when it arrives in the network so you will know when to play it out. This adds quite a bit of complexity to the protocol plus the added timestamp adds transmission overhead to every packet processed.
PROPRIETARY SOLUTIONS
Two proposed architectures, one wired and the other wireless, claim to have solved the MPEG-2 Transport Stream jitter problem. Air5 is the wireless solution and MoCA (Multimedia over Coax Alliance) [4] is the wired solution. Both these solutions are chip sets that accept and deliver MPEG-2 Transport Streams. How do they do it? Both use a network protocol that guarantees there will be no collisions plus they have some de-jittering built into the receiving chip.

Unfortunately, as of the time of this writing the Air5 developer, Magis Networks, has suspended operations and its future is uncertain. However, MoCA is going strong and MoCA products are expected to reach the market by the end of 2004.
CONCLUSION Traditional broadcast MPEG-2 Transport Streams are not easily carried on a traditional data network. The broadcast MPEG-2 Transport Stream model is based on an unstoppable stream of bits directed at potentially millions of decoders. Strict timing rules are required to make this broadcast system work. If you follow the rules, the system works beautifully. Streaming Media MPEG-2 systems were designed to be carried on traditional data networks. Therefore they work just fine on current data networks and the coming QoS initiatives will allow them to work beautifully. However, these systems put quite a load on the MPEG-2 source and the transport system because each decoder has a private session with the ongoing video source. If you must carry broadcast MPEG-2 Transport Streams on a data network, use the best QoS that you can get. Then add a de-jittering device either at the edge of your data network or as a part of your MPEG-2 decoder.
[1] American National Standard Dictionary of Information Technology (ANSDIT), available at http://www.ncits.org/tc_home/k5htm/Ansdit.htm
[2] ISO/IEC 13818-1 Generic Coding of
Moving Pictures and Associated Audio: Systems, 13 Nov 1994, section 2.4.2.2.
[3] ISO/IEC 13818-1 Generic Coding of
Moving Pictures and Associated Audio: Systems, 13 Nov 1994, Annex D.0.4 SCR and PCR Jitter.
[4] More information on MoCA is available
at www.mocalliance.org

OPTIMAL AVAILABILITY & SECURITY FOR VOICE OVER CABLE NETWORKS Chun K. Chan, Andrew R. McGee, Martin J. Glapa, and Uma Chandrashekhar Bell Laboratories, Lucent Technologies Abstract
The Lucent Bell Labs Security model has now become the foundation of the newly ratified ITU-T Recommendation X.805 "Security Architecture for Systems Providing End-to-End Communications." The X.805 standard was developed as the framework for the architecture and dimensions in achieving end-to-end security of distributed applications. In this paper, we introduce the X.805 standard and describe how it can be applied to the PacketCable™ Security Specification (PKT-SP-SEC-107-021127) and the DOCSIS BPI+ specification (SP-BPI+-I10-030730) for Voice over Cable (VoC) networks. We identify areas of conformance and gaps that the current PacketCable standards have with respect to the X.805 Security Model and examine the effect on end-to-end availability of VoC networks. The PacketCable™ reliability models (PKT-TR-VoIPAR-V01-001128) are generalized to include downtime due to security vulnerabilities and attacks. Our analysis shows that the traditional reliability models produce results that are optimistic if we do not consider both availability and security within a network dependability framework. The X.805 standard can be used to augment these models to provide optimal availability and security for Voice over Cable networks.
INTRODUCTION
The advent of next generation IP networks carrying converged voice and data traffic obliterates the inherent, built-in security of traditional telecommunications networks with their unintelligent end-user devices and out-of-band signaling and management networks.
Now powerful, intelligent devices under end-user control are potentially able to access signaling and network management information. Hobbyists have hacked into cable modem hardware, tricking it to accept custom code. As a result, the end user has complete control of the cable modem and can surmount the bandwidth imposed by the service provider [1]. In Voice over Cable network, it is conceivable that hackers can also modify and gain control of the MTA. Rolling out VoIP services over cable automatically inherits some of the vulnerabilities associated with VoIP. A recent CERT advisory states that a number of vulnerabilities have been discovered in various implementations of the H.323 protocol [2] [3]. Even though Voice over Cable does not use H.323, we expect similar vulnerable implementations of relatively new protocols.
Given that a Voice over Cable network is vulnerable, cable operators can benefit from a comprehensive, end-to-end security framework to guide their network planning and the ongoing security assessments performed against their networks. The recently ratified ITU-T Recommendation X.805 "Security Architecture for Systems Providing End-to-End Communications" [4] was developed to provide such a framework.
VOICE OVER CABLE NETWORK
Figure 1 represents a simplified functional view of the PacketCable™ based VoIP network architecture. VoIP builds on a DOCSIS high-speed data infrastructure. The CMTS (Cable Modem Termination System) provides DOCSIS IP connectivity on the RF
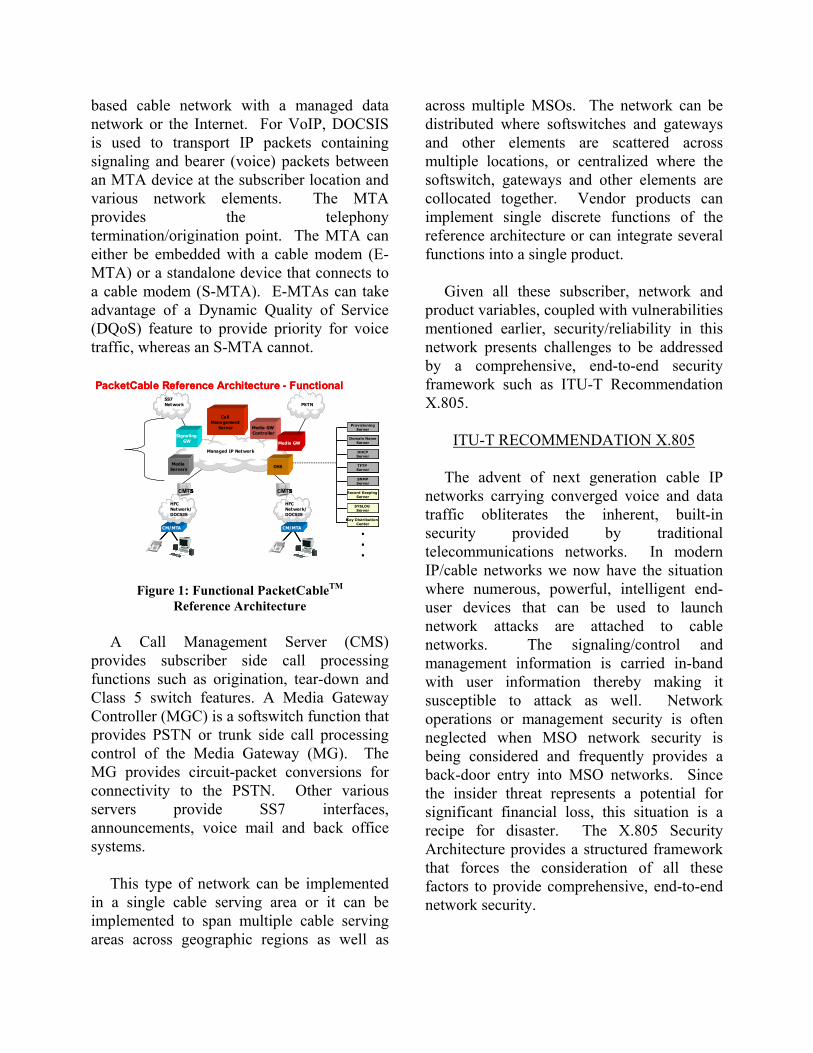
based cable network with a managed data network or the Internet. For VoIP, DOCSIS is used to transport IP packets containing signaling and bearer (voice) packets between an MTA device at the subscriber location and various network elements. The MTA provides the telephony termination/origination point. The MTA can either be embedded with a cable modem (E-MTA) or a standalone device that connects to a cable modem (S-MTA). E-MTAs can take advantage of a Dynamic Quality of Service (DQoS) feature to provide priority for voice traffic, whereas an S-MTA cannot. PacketCable Reference Architecture - Functional
CMTS
CM/MTA
HFC Network/DOCSIS
CMTS
HFC Network/DOCSIS
SS7 Network PSTN
Managed IP Network
Call Management
Server
Signaling GW
Media GW Controller
Media GW
Media Servers
CM/MTA
OSS TFTP Server
SNMPServer
Record Keeping Server
SYSLOG Server
DHCPServer
Domain NameServer
Key Distribution Center
ProvisioningServer
TFTP Server
SNMPServer
Record Keeping Server
SYSLOG Server
DHCPServer
Domain NameServer
Key Distribution Center
ProvisioningServer
TFTP Server
SNMPServer
Record Keeping Server
SYSLOG Server
DHCPServer
Domain NameServer
Key Distribution Center
ProvisioningServer
•••
PacketCable Reference Architecture - Functional
CMTSCMTS
CM/MTACM/MTA
HFC Network/DOCSIS
HFC Network/DOCSIS
CMTSCMTS
HFC Network/DOCSIS
HFC Network/DOCSIS
SS7 NetworkSS7 Network PSTN
Managed IP NetworkManaged IP Network
Call Management
Server
Signaling GW
Media GW Controller
Media GW
Media Servers
CM/MTACM/MTA
OSS TFTP Server
SNMPServer
Record Keeping Server
SYSLOG Server
DHCPServer
Domain NameServer
Key Distribution Center
ProvisioningServer
TFTP Server
SNMPServer
Record Keeping Server
SYSLOG Server
DHCPServer
Domain NameServer
Key Distribution Center
ProvisioningServer
TFTP Server
SNMPServer
Record Keeping Server
SYSLOG Server
DHCPServer
Domain NameServer
Key Distribution Center
ProvisioningServer
•••
Figure 1: Functional PacketCableTM
Reference Architecture
A Call Management Server (CMS) provides subscriber side call processing functions such as origination, tear-down and Class 5 switch features. A Media Gateway Controller (MGC) is a softswitch function that provides PSTN or trunk side call processing control of the Media Gateway (MG). The MG provides circuit-packet conversions for connectivity to the PSTN. Other various servers provide SS7 interfaces, announcements, voice mail and back office systems.
This type of network can be implemented in a single cable serving area or it can be implemented to span multiple cable serving areas across geographic regions as well as
across multiple MSOs. The network can be distributed where softswitches and gateways and other elements are scattered across multiple locations, or centralized where the softswitch, gateways and other elements are collocated together. Vendor products can implement single discrete functions of the reference architecture or can integrate several functions into a single product.
Given all these subscriber, network and product variables, coupled with vulnerabilities mentioned earlier, security/reliability in this network presents challenges to be addressed by a comprehensive, end-to-end security framework such as ITU-T Recommendation X.805.
ITU-T RECOMMENDATION X.805
The advent of next generation cable IP
networks carrying converged voice and data traffic obliterates the inherent, built-in security provided by traditional telecommunications networks. In modern IP/cable networks we now have the situation where numerous, powerful, intelligent end-user devices that can be used to launch network attacks are attached to cable networks. The signaling/control and management information is carried in-band with user information thereby making it susceptible to attack as well. Network operations or management security is often neglected when MSO network security is being considered and frequently provides a back-door entry into MSO networks. Since the insider threat represents a potential for significant financial loss, this situation is a recipe for disaster. The X.805 Security Architecture provides a structured framework that forces the consideration of all these factors to provide comprehensive, end-to-end network security.

The X.805 Security Architecture defines the framework for the architecture and dimensions in achieving end-to-end security of distributed applications. The general principles and definitions apply to all applications, even though details such as threats and vulnerabilities and the measures to counter or prevent them vary based upon the needs of the application [5]. How each standard fits together in the end-to-end security picture emanates from X.805. ITU-T Recommendation X.805 also forms the foundation for the proposed ISO/IEC 18028 standard "Information technology - Security techniques - Network Security - Part 2: Network Security Architecture," which has recently completed Committee Draft balloting in preparation to becoming an international standard.
We provide a brief description of the X.805 Security Architecture before demonstrating how it can be applied to Voice over Cable networks.
Acce
ss C
ontro
l
Infrastructure Security
Applications Security
Services Security
End User Plane
Control Plane
Management Plane
THREATS
VULNERABILITIES
8 Security Dimensions
ATTACKS
Dat
a Co
nfid
entia
lity
Com
mun
icat
ion
Secu
rity
Dat
a In
tegr
ity
Avai
labi
lity
Priv
acy
Destruction
Disclosure
Corruption
Removal
Auth
entic
atio
n
Non-
repu
diat
ion
Security Layers
Interruption
SecurityPlanes
Figure 2: ITU-T Recommendation X.805
"Security Architecture for Systems Providing End-to End Communications"
The X.805 Security Architecture was
developed as part of the ITU-T X.800 series of recommendations [6] to provide a methodical, organized way of addressing the five threats to telecommunications networks. The X.800 series identifies these threats as:
• Destruction of information and/or other resources,
• Corruption or modification of information,
• Removal, theft, or loss of information and/or other resources,
• Disclosure of information, and • Interruption of services.
Figure 2 depicts the X.805 Security Architecture, which provides a systematic way of countering these five threats for large, complex networks such as today's MSO networks. X.805 provides a comprehensive, multi-layered, end-to-end view of network security across eight security dimensions. The X.805 standard defines a hierarchy of network equipment and facility groupings into three Security Layers: (1) the Infrastructure Security Layer, (2) the Services Security Layer, and (3) the Applications Security Layer. • The Infrastructure Security Layer consists
of the basic building blocks used to build telecommunications networks, services and applications, and consists of individual communication links and network elements including their underlying hardware and software platforms. Examples include the cable modem, CMTS, CMS, Signaling/Media Gateways, Media Gateway Controllers, and Media Servers depicted in Figure 1.
• The Services Security Layer consists of services that customers/end-users receive from networks. Example services range from basic connectivity and transport (e.g., Internet access) to service enablers (e.g., authentication, authorization, and accounting – AAA services) to value-added services such as VPN, VoIP, and Voice over Cable services.
• The Applications Security Layer focuses on network-based applications that are accessed by customers/end-users. These applications are enabled by network

services and are characterized by the end-user interacting with remote hardware or software in order to access information or perform a transaction. Example network-based applications include basic applications such as file transport (e.g., FTP) and web browsing, fundamental applications such as directory assistance (e.g., 411) and e-mail, as well as high-end applications such as e-commerce, network-based training, and video collaboration.
These Security Layers provide
comprehensive, end-to-end security solutions and identify where security must be addressed in products and solutions because each layer may be exposed to different types of threats and attacks. For example, a Denial of Service (DoS) attack can be performed at the Infrastructure Layer by flooding a router's physical port with bogus packets, thus preventing or impeding the transmission of legitimate traffic. A DoS attack can also be performed at the Services or Applications Layer by deleting user account information, thus preventing legitimate users from accessing the service or application. One can readily see that components of Infrastructure Security, Services Security, and Applications Security must be addressed in order to provide a comprehensive, end-to-end network security solution, and that different counter-measures must be applied at each Security Layer.
Three types of activities are performed on any network, which are represented by the three Security Planes: (1) the Management Plane, (2) the Control Plane, and (3) the End-User Plane. Different security vulnerabilities may exist in each of these planes – in fact each of these planes might be implemented by separate networks for a given network or service architecture. Each Security Plane along with the three layers must be secured in order to provide an effective security posture.
The eight Security Dimensions contained in recommendation X.805 represent classes of actions that can be taken, or technologies that can be deployed, to counter the unique threats and potential attacks present at each Security Layer and Plane: • Access Control is concerned with
providing authorized access to network resources.
• Authentication is concerned with confirming the identity of communicating parties.
• Non-repudiation is concerned with maintaining an audit trail, so that the origin of data or the cause of an event or action cannot be denied.
• Data Confidentiality is concerned with protecting data from unauthorized disclosure.
• Communication Security is concerned with ensuring that information only flows between authorized end-points without being diverted or intercepted.
• Data Integrity is concerned with maintaining the correctness or accuracy of data and protecting against unauthorized modification, deletion, creation, and replication.
• Availability is concerned with ensuring that there is no denial of authorized access to network elements, stored information, information flows, services, and applications.
• Privacy is concerned with protecting information that might be derived from the observation of network activities.
Table 1 indicates how the Security Dimensions relate to the X.800 threats described previously; the cells marked with 'Y' indicate the Security Dimensions that are applicable to each of the five threats. In particular, through this mapping, we can begin to identify the right security mechanisms needed to thwart potential threats.

Table 1: Applying Security Dimensions to
Security Threats
The X.805 Security Architecture can also be addressed in a modular form, as illustrated in Figure 3, to provide a systematic, methodical approach to network security. Figure 3 shows the intersection of a Security Layer with a Security Plane. This represents a unique perspective for consideration of the eight Security Dimensions and can be considered a component, or module, of end-to-end network security. Each of the nine modules in Figure 3 combines the eight Security Dimensions that are applied to each security perspective. The Security Dimensions of different modules have different objectives and consequently comprise different comprehensive sets of security measures. The tabular form gives a convenient way of describing the objectives of the Security Dimensions for each module.
Access Control
Authentication
Non-repudiation
Data Confidentiality
Module NineModule SixModule ThreeUser Plane
Module EightModule FiveModule TwoControl Plane
Module SevenModule FourModule OneManagement Plane
Applications LayerServices LayerInfrastructure
Layer
Module NineModule SixModule ThreeUser Plane
Module EightModule FiveModule TwoControl Plane
Module SevenModule FourModule OneManagement Plane
Applications LayerServices LayerInfrastructure
Layer
Communication Security
Data Integrity
Availability
Privacy
Eight Security Dimensions
Figure 3: Modular form of X.805 Security Architecture
APPLYING X.805 TO VOICE OVER CABLE
CableLabs has developed a security specification for providing security to VoIP communications over the PacketCable reference architecture described above. The PacketCable Security Specification [7] was defined to provide confidentiality to user information flows (voice and data) across the PacketCable network and to protect cable MSOs against theft of service. The PacketCable Security Specification defines the security architecture, protocols, algorithms, functional requirements and technological requirements that force any user with the intent to steal or disrupt network services to spend an unreasonable amount of money or time to do so.
CMTS
pkt
-s20
: TG
CP
pkt-
s4: :
RTC
P (I
PS
e c /
CM
S-b
ase d
KM
)
pkt-
s4: :
RTC
P (I
PS
ec /
CM
S-b
ased
KM
)pk
t-s3
: RTP
(Cip
her
+ H
MA
C /
CM
S-b
ased
KM
pkt-
s3: R
TP (C
iphe
r +
HM
AC
/ C
MS
-bas
ed K
M
pkt-s16: CMSS
pkt-s16: CMSS
pkt-
s16:
CM
SS
pkt-
s1: T
FTP
(CM
S)
pkt-
s0 :
SN
MP
pkt-s18: IntServ+ RSVP
pkt-
s21:
UD
P
pkt-s
8: C
OPS
(IPSe
c / I
KE-)
pkt-s10: TGCP pkt-s11: ISTP
pkt-s
9: T
CA
P/IP
pkt-s24: UDP
pkt-s22: UDP
pkt-s
12: P
KINIT
pkt-s23:UDP
pkt-s6: Radius
pkt-s7: Radius
pkt-s14: PKCROSS
pkt-s5: NCSpk
t-s1
7:K
erbe
ros
Issu
e K
erbe
ros
Tic
kets
MTA
TFTPSERVER OSS
CM
CMS
pkt-s
15: G
ate
Coor
dina
tion
Msg
s
RemoteMTA
MG SG
MSOKDCPROV
SERV
TELEPHONYKDC
pkt-s13: PKINIT
EBP
CMS
RemoteTelephony
KDC
EdgeRouter
EdgeRouter
pkt-
s19:
Diff
Ser
v+A
ggre
gate
d R
SV
P
MPC
MP
DF
DF
CMSMTA
MG
IPSec / IKE+
IPSec / IKE- IPSec / IKE-
IPSec / IKE-
IPSec / IKE-
BPI+
/ BP
IKM
RKS
IPSec / Kerberos + PKINIT
IPSec / IKE-
IPS
ec / IKE
-
IPS
ec /
IKE
-
Rad
ius a
uthe
ntica
tor /
CM
S-ba
sed
KM
Issue Kerberos Tickets
Issue
Ker
bero
s Tick
ets
SN
MP
v3 S
ecur
ity
IPS
ec /
IKE
-
IPSec / Kerberos
IPSec / Kerberos
IPS
ec /
Ker
bero
s
RSVP Integrity Object
pkt-
s17:
Ker
bero
sIs
sue
Ker
bero
sT
icke
tsR
SV
P In
tegr
ity O
bjec
t
IPS
ec /
IKE
+
MGC
pkt-s25: Radius
IPS
ec / IKE
-
pkt-s
2:
J.11
2
Figure 4: PacketCable Security Architecture

Figure 4 depicts the security architecture specified by the PacketCable Security Specification, which provides device authentication and authorization as well as encryption for the PacketCable network. The PacketCable Security Specification relies on DOCSIS 1.1 [8] and BPI+ [9] to secure the information flow across the HFC portion of the PacketCable network. The PacketCable Security Specification extends encryption to the Call Management Server (CMS), Media Gateway (MG), Signaling Gateway (SG), and remote Multimedia Terminal Adapter (MTA).
In order to provide confidentiality for user information flows and protect against theft of service, the PacketCable Security Specification contains detailed requirements for encryption algorithms as well as authentication algorithms to be used in the PacketCable network. In summary, the PacketCable Security Specification provides: • Confidentiality of the user voice/data
streams across the PacketCable network, • Secure bearer, signaling and management
channels across the PacketCable network, • Protection against CPE
cloning/tampering/uncapping, • Protection against identity theft.
The X.805 security framework can be used to augment the Packet Cable Security Specification to provide comprehensive end-to-end security by including additional portions of the PacketCable network architecture and the X.805 Security Dimensions, Layers and Planes. When the scope of the security analysis is extended to include the end-to-end PacketCable network architecture and the entire X.805 security framework, vulnerabilities are identified in every layer, plane and dimension, even when the analysis is limited to the transport of packetized voice across the MSO network. For example, cable MSO networks must be protected against unauthorized access
achieved by bridging unprotected user networks (e.g., WiFi networks) into the PacketCable environment.
Protecting the MSO network against Denial of Service attacks is another area where X.805 augments the PacketCable Security Specification. Denial of Service attacks are attacks on the Availability security dimension and are probably the most widely publicized type of security vulnerability. Denial of Service can be achieved in many different ways including: (1) an unauthorized user logging in as a system administrator causing a critical network element to crash, (2) deletion of user account information thereby preventing authorized users from accessing a service, (3) flood attacks like "smurf" that consume network resources to the point that no one can access it, (4) viruses and worms such as "Code Red" and "NIMDA" that exploit system vulnerabilities to gain access to vulnerable machines and then propagate themselves to other vulnerable hosts, which also results in the consumption of network resources.
The emphasis placed on Access Control and Authentication by the PacketCable Security Specification protects against Denial of Service attacks accomplished via unauthorized access to network elements, with the exception of End-User devices, which are considered out of scope.
Cable MSOs can use the X.805 security
architecture to identify mechanisms that can be used to augment the PacketCable Security Specification to protect against the additional types of DoS attacks. As evidenced by the recent Code Red attack's ability to cripple CMTS devices throughout the world [10], every PacketCable network element (CMTS, MG, SG, CMS) as well as the Operations Support System servers, the back-office servers, etc. are potentially vulnerable to flood attacks and network worms. X.805 also

indicates that cable MSOs must also develop mechanisms to address Denial of Service attacks achieved by attacking the user information, etc., which is critical to the Voice over Cable service.
Availability Security Dimension X.805 Security Layer X.805 Security
Plane Infrastructure Services End-User Not Applicable Missing Control Not Applicable Missing Management Incomplete Missing
Table 2: PacketCable Coverage for Availability Security Dimension
The Privacy Security Dimension is another
example of how X.805 augments the PacketCable Security Specification to provide comprehensive end-to-end security. This dimension is concerned with protecting information about activities that take place on the network. For the Voice over Cable service, the source and destination of a communication flow would be an example of this type of information. For example, it may be important to protect the fact that two parties are communicating with each other over and above the actual contents of the communication. The PacketCable Security Specification utilizes the IPSec ESP protocol in transport mode [11], which does not encrypt the original IP packet header. Therefore, the Privacy Security Dimension is not addressed by IPSec ESP transport mode per se. The NCS messages that contain dialed numbers and other customer information are carried as IP packet payloads which are encrypted via IPSec ESP transport mode; however, once the call is established, the IP addresses of the communicating end-points are visible. The tunnel mode for the IPSec ESP protocol would provide complete coverage of the Privacy Security Dimension for these messages.
Privacy Security Dimension X.805 Security Layer X.805 Security
Plane Infrastructure Services End-User Incomplete Incomplete Control Not Applicable Missing Management Missing Missing
Table 3: PacketCable Coverage for Privacy Security Dimension
This section has provided some key results
of applying X.805 to a portion of the PacketCable network architecture in order to demonstrate how the PacketCable Security Specification can be augmented to achieve optimum security for the Voice over Cable service. A complete analysis of the end-to-end Voice over Cable network architecture utilizing X.805 has produced comparable results for the remainder of the VoC network architecture and remaining X.805 Security Layers, Planes and Dimensions.
IMPACT OF SECURITY VULNERABILITIES & ATTACKS ON
END-TO-END AVAILABILITY
The X.805 analysis in the preceding section briefly addresses the key security challenges that need to be addressed when looking at the eight dimensions of network security. When we look at supporting key applications on a cable infrastructure such as voice we need to think about availability. In this section, we focus on the availability dimension. The standard reference for Voice over Cable availability is the Cable Labs specification, PKT-TR-VoIPAR-V01-001128 [12]. We begin with a brief review of the PacketCable™ VoIP availability allocation process.
The PacketCable™ VoIP models allocate availability budgets to network elements so that the end-to-end availability of a voice-over-packet network is the same as that of the

PSTN. For instance, the MTA is allocated an availability budget of 99.9975%, which is equivalent to an average annual downtime of 13 minutes. An MTA is expected to be built to this specification using standard reliability engineering practices such as thermal management and component derating [13]. If all the network elements in the PacketCable™ based VoIP network architecture are built to meet their respective availability budgets, then the end-to-end VoIP availability is expected to be the same as that of the PSTN. Even if all these budgets are met, we argue that it is unlikely that the end-to-end goal of PSTN availability will be met because the PacketCable™ VoIP availability/reliability models do not include downtime due to security vulnerabilities and threats. Theft of services such as MTA tampering does not have a direct impact of end-to-end availability, so such vulnerabilities and threats are not modeled here.
Denial-of-service attacks such as Code Red and NIMDA have brought down CMTS devices [10]. According to PKT-TR-VoIPAR-V01-001128, the CMTS is allocated a downtime of 10 minutes per year. To meet this downtime budget requires redundant hardware, which is represented by a generic parallel system shown in Figure 5. This redundant system is fault tolerant with respect to hardware and software faults; when the active fails, the standby takes over. However, if security vulnerability is present, it will be in both the active and standby software. A denial of service attack will bring down both the active and the standby subsystems. This common-mode failure [14] is pictorially represented by a DoS block in series with the redundant system, as shown in Figure 6.
Active CMTS
Standby CMTS
Active CMTS
Standby CMTS Figure 5: Active-Standby CMTS System
Denial of Service
Active CMTS
Standby CMTS
Denial of Service
Active CMTS
Standby CMTS Figure 6: Denial of Service as a Common
Mode Failure
To estimate the downtime due to DoS, we use the measurements from [15]. According to [15], 12,805 attacks were observed in one week on 224 Internet protocol (IP) addresses. Since these 224 addresses represent a theoretical maximum, we assume the number of active IP addresses to be two orders of magnitude below 224. Then, the mean attack rate per IP address is estimated to be 5×10⁻⁴ per hour. This implies an attack frequency of about 5 per year. Combining this with the average attack duration of 10 minutes [15], this simple model shows that DoS adds an annual downtime of 50 minutes to the CMTS system. Figure 7 shows simplified Markov models to illustrate the impact of DoS on system downtime. The state transition diagram on the left shows the scenario with no DoS. The system fails where both the active and standby units fail at the same time (duplex failure) due to hardware and/or software faults. The duplex failure rate is λ and the system restoration rate is µ. For a CMTS system that is compliant with the CableLabs specification, the system spends less than 10 minutes per year in the duplex failure state. If we include DoS, then there

will be an additional failed state labeled as the DoS state in the state transition diagram on the right in Figure 7. It is seen the system is expected to spend 50 minutes/year in the DoS state. The total system downtime is 60 minutes/year.
DuplexFailure
(10 min/yr)
Normal
λ µ
DOS(50 min/yr)
λDoS
µDoS
DuplexFailure
(10 min/yr)
Normal
λ µ
DuplexFailure
(10 min/yr)
Normal
λ µ
DOS(50 min/yr)
λDoS
µDoS
DuplexFailure
(10 min/yr)
Normal
λ µ
DuplexFailure
(10 min/yr)
Normal
λ µ
Figure 7: Simplified Markov Models Showing the
Impact of DoS on System Downtime
A more detailed Markov model that takes into account of attack frequency, security vulnerability arrival rate, security vulnerability removal rate, and system restoration rate is given in [16]. The detailed model in [16] is applicable to a softswitch (such as an MGC) that uses an off-the-shelf server cluster for fault tolerance. Compared to a traditional circuit switch, which uses proprietary hardware for fault tolerance, a softswitch relies mainly on software for fault tolerance. As a result, a softswitch is more prone to security attacks [17] because it is virtually impossible to have bug-free software. An attacker could exploit well-known OS vulnerabilities to gain control of a softswitch. When the softswitch is in a compromised state, the attacker could erase critical system files so that a system re-installation is needed, then the mean time to restore service could be hours. Based on the detailed Markov model in [16], we estimate that the downtime due to this type of DoS is of the order of 100 minutes per year. This is about two orders of magnitude higher than the downtime allocated by the Cable Labs specification. As pointed out in the X.805
analysis, all PacketCable network elements (CMTS, MG, SG, CMS) as well as Operations Support System servers, back-office servers, etc. are potentially vulnerable to DoS attacks. In the remainder of this section, we show the impact on end-to-end availability if we add a DoS downtime of 100 minutes per year to the CMTS, MG, SG and CMS in the call path.
Figure 8 shows the reliability block diagram for a local on-net call between two subscribers served by the same Call Management Server (CMS). Each block contains the unavailability budget given in the Cable Labs specification. If all the network elements meet their respective unavailability or downtime budgets, then the end-to-end availability is 99.97%, which is the same as its PSTN counterpart of 150 minutes of downtime per year.
CM/MTA0.0025%
HFC0.01%
CMTS/ER 0.0025%
CMS0.001%
HFC0.01%
CM/MTA0.0025%
End-to-End Availability = 99.97%End-to-End Downtime = 150 min/yr
CM/MTA0.0025%
HFC0.01%
CMTS/ER 0.0025%
CMS0.001%
HFC0.01%
CM/MTA0.0025%
End-to-End Availability = 99.97%End-to-End Downtime = 150 min/yrEnd-to-End Availability = 99.97%End-to-End Downtime = 150 min/yr
Figure 8: Local On-Net Single-Zone Availability
If we include unavailability due to DoS, then the end-to-end availability is likely to degrade from 99.97% to 99.935% (Figure 9) resulting in a downtime of 340 minutes/year. It should be noted that unavailability due to CM/MTA power outage is not included in the end-to-end calculation. If we include the downtime due to power outages [18], the degradation in end-to-end availability due to DoS is less pronounced (from 99.88% to 99.84%), because power outage alone contributes 240 minutes of downtime per year to each of the CM/MTA at both ends.

CM/MTA0.0025%
HFC0.01%
CMTS/ER 0.02%
CMS0.02%
HFC0.01%
CM/MTA0.0025%
End-to-End Availability = 99.935%End-to-End Downtime = 340 min/yr
CM/MTA0.0025%
HFC0.01%
CMTS/ER 0.02%
CMS0.02%
HFC0.01%
CM/MTA0.0025%
End-to-End Availability = 99.935%End-to-End Downtime = 340 min/yrEnd-to-End Availability = 99.935%End-to-End Downtime = 340 min/yr
Figure 9: Local On-Net Single-Zone
Availability with DoS
The impact of DoS is larger if we consider an off-net call path with more network elements that are vulnerable to DoS attacks. An off-net call is defined as a call between an endpoint on a PacketCable network and an endpoint on the PSTN. An example is given in Figure 10. This scenario shows a call where the calling and called parties are served by a CMS and a Class 5 switch with a baseline of 215 minutes of downtime per year in its normal state (without DoS attack).
CM/MTA0.0025%
HFC0.01%
CMTS/ER 0.0025%
CMS0.001%
Local IP0.005%
End-to-End Availability = 99.96%End-to-End Downtime = 215 min/yr
CMS0.001%
MGC0.001%
SG0.001%
Copper Loop0.01%
Circuit Switch0.005%
PSTN Gateway0.002%
CM/MTA0.0025%
HFC0.01%
CMTS/ER 0.0025%
CMS0.001%
Local IP0.005%
End-to-End Availability = 99.96%End-to-End Downtime = 215 min/yrEnd-to-End Availability = 99.96%End-to-End Downtime = 215 min/yr
CMS0.001%
MGC0.001%
SG0.001%
Copper Loop0.01%
Circuit Switch0.005%
PSTN Gateway0.002%
Figure 10: Local Off-Net Availability
If we include unavailability due to DoS, then the end-to-end availability is likely to degrade from 99.96% to 99.83% (Figure 11). If we also include the impact of CM/MTA power outage, the degradation in end-to-end availability is from 99.91% to 99.78%. The impact of CM/MTA power outage is less than that of the on-net scenario because we have only one CM/MTA in the call path, and the call path has more vulnerable network elements.
CM/MTA0.0025%
HFC0.01%
CMTS/ER 0.02%
CMS0.02%
Local IP0.024%
End-to-End Availability = 99.83%End-to-End Downtime = 900 min/yr
CMS0.02%
MGC0.02%
SG0.02%
Copper Loop0.01%
Circuit Switch0.005%
PSTN Gateway0.02%
CM/MTA0.0025%
HFC0.01%
CMTS/ER 0.02%
CMS0.02%
Local IP0.024%
End-to-End Availability = 99.83%End-to-End Downtime = 900 min/yrEnd-to-End Availability = 99.83%End-to-End Downtime = 900 min/yr
CMS0.02%
MGC0.02%
SG0.02%
Copper Loop0.01%
Circuit Switch0.005%
PSTN Gateway0.02%
Figure 11: Local Off-Net Availability with DoS
The following table summarizes our results.
End to End Availability (Annual Downtime) Scenario Baseline Baseline +
DoS Baseline + Power Outage
Baseline + DoS + Power Outage
Local On-Net
99.97% (150 min)
99.935% (340 min)
99.88% (630 min)
99.84% (840 min)
Local Off-Net
99.96% (215 min)
99.83% (900 min)
99.91% (470 min)
99.78% (1160 min)
Table 4: Summary of the End-to-End Availability (Downtime) Calculations
The baseline calculations in Table 4 are based on Cable Labs allocations [12]. From the end user’s perspective, these numbers appear optimistic because they do not include downtimes due to DoS and power outages. For a local on-net call, the impact of power outages is larger than that of DoS, because there are two CM/MTAs in the call path and they are both affected by power outages, whereas DoS only impacts the CMTS and the CMS. For a local off-net call, the impact of DoS is larger than that of power outages, because there is only one CM/MTA in the call path and there are many network elements that are vulnerable to DoS.
Since we expect that there are more off-net calls than on-net calls, the overall (weighted) impact of DoS is larger than that of power outages. Whereas extended power outages are events that are out of the Cable MSOs’ control, the impact of DoS can be mitigated by implementing software reliability engineering practices [19]. Following the downtime

allocation process in [12], the MSOs should work with their equipment vendors to allocate downtime budgets for software in addition to the existing hardware budgets. This will in turn drive the equipment vendors to improve their software development process to reduce the number of bugs and patches.
CONCLUSION
In this paper, we introduced the X.805 standard and showed how the current PacketCable™ Security Specification (PKT-SP-SEC-107-021127) and the DOCSIS BPI+ specification (SP-BPI+-I10-030730) for Voice over Cable (VoC) networks alone do not address end-to-end network security in a manner that allows cable operators to have a secure and reliable network. From the examples, we noted that in order to support VoC and other value added services, the cable operators need to have their cable network designed, maintained, and able to support an ongoing security program with controls to prevent, detect, and correct vulnerabilities resulting in maximum availability for the end-users. In particular, the controls should address the gaps noted in the security dimensions - non-repudiation, privacy, communication security, data integrity, data confidentiality, access control, availability, and authentication. By implementing these changes, and updating the models, the cable network can be designed to support VoC and the next generation of services for the end-user.
The global cost of cyber-attacks is
estimated to be in the $145 billion range for 2003 alone, with 2003 also being regarded as the "worst year ever" for viruses and worms. Unfortunately, there is no end in sight to the continued onslaught of threats to network security. Clearly in today's environment, network security can no longer be treated as an afterthought and must be implemented
using a continuous, systematic, methodical, end-to-end approach that has been missing until now. ITU-T Recommendation X.805 provides such an approach by providing a comprehensive, end-to-end, multi-layered view of network security across eight security dimensions.
ACRONYMS
AAA Authentication, Authorization & Accounting
BPI+ Baseline Privacy Plus Interface CM Cable Modem CMS Call Management Server CMTS Cable Modem Termination System CPE Customer Premise Equipment DOCSIS
Data over Cable Service Interface Specification
DQoS Dynamic Quality of Service DoS Denial of Service E-MTA Embedded Multimedia Terminal
Adapter ER Edge Router ESP Encapsulating Security Payload FTP File Transfer Protocol HFC Hybrid Fiber Coax IP Internet Protocol IPSec Internet Protocol Security MG Media Gateway MGC Media Gateway Controller MSO Multi-System Operator MTA Multimedia Terminal Adapter NCS Network Call Signaling OS Operating System PSTN Public Switched Telephone Network RF Radio Frequency S-MTA Standalone Multimedia Terminal
Adapter SG Signaling Gateway SS7 Signaling System 7 VoC Voice over Cable VoIP Voice over IP VPN Virtual Private Network

REFERENCES
[1] K. Poulsen, “Cable Modem Hackers Conquer the Coax,” SecurityFocus, February 5, 2004.
[2] http://www.kb.cert.org/vuls/id/749342 [3] http://www.cisco.com/warp/public/707/
cisco-sa-20040113-h323.shtml [4] International Telecommunications Union,
Telecommunications Standardization Sector, "Security Architecture for Systems Providing End-to-End Communications," ITU-T Rec. X.805, 2003, http://www.itu.int.
[5] International Telecommunications Union, Telecommunications Standardization Sector, "Security in Telecommunications and Information Technology," pg 1, December 2003, http://www.itu.int.
[6] International Telecommunications Union, Telecommunications Standardization Sector, "Security Architecture for Open Systems Interconnection (OSI) for CCITT Applications," ITU-T Rec. X.800, 1991, http://www.itu.int.
[7] Cable Television Laboratories, Inc., "PacketCable Security Specification," PKT-SP-SEC-107-021127, 2002, http://www.packetcable.com.
[8] Cable Television Laboratories, Inc., "Data-Over-Cable Service Interface Specifications DOCSIS 1.1, Radio Frequency Interface Specification," SP-RFI-v1.1-I10-030730, 2003, http://www.packetcable.com.
[9] Cable Television Laboratories, Inc., " Data-Over-Cable Service Interface Specifications DOCSIS 1.1, Baseline Privacy Plus Interface Specification," SP-BPI+-I10-030730, 2003, http://www.packetcable.com.
[10] J. T. McKelvey, “Combating Security Risks on the Cable IP Network,” IBC 2002 Conference, http://www.broadcastpapers.com/ ibc2002/ibc2002.htm
[11] S. Kent and R. Atkinson, “Security Architecture for the Internet Protocol,” IETF RFC 2401, Internet Engineering Task Force, Nov. 1998, http://www.ietf.org/rfc/rfc2401.txt.
[12] Cable Television Laboratories, “VoIP Availability and Reliability Model for the PacketCableTM Architecture,” PKT-TR-VoIPAR-V01-001128, 2000.
[13] P. D. T. O’Connor, Practical Reliability Engineering, John Wiley & Sons, 1985.
[14] R. Billinton and R. N. Allan, Reliability Evaluation of Engineering Systems: Concepts and Techniques, Pitman Publishing Inc., 1983.
[15] D. Moore, G. Voelker, and S. Savage, “Inferring Internet Denial-of-Service Activities,” Proc. of the 10th USENIX Security Symposium (Washington, DC, 2001), http://www.usenix.org/events/ sec01/moore/moore.pdf.
[16] C. K. Chan and H. Pant, “Reliability and Security Modeling in Upgrading Wireless Backbone Networks,” Bell Labs Technical Journal, 8(4), 39-53, 2004.
[17] Security Vulnerability in Sun Cluster 2.2, May 20, 2003, doc id 51340.
[18] Allen L, Black, James L. Spencer and Douglas S. Dorr, The Impact of Commercial Power Quality on Fiber-in-the-Loop Service Availability, Ninth Annual NFOEC Conference Proceedings, June 1993.
[19] John Viega and Gary McGraw, Building Secure Software: How to Avoid Security Problems the Right Way, Addison-Wesley, 2001.

REDUCING CAPEX AND OPEX THROUGH CONVERGED OPTICAL INFRASTRUCTURES
Duane Webber
Cisco Systems, Inc.
Abstract
Today's Cable Operator optical infrastructure designs are becoming more important as customers are increasingly demanding high-bandwidth services such as residential and commercial data and VoD. The network must be able scale to increasing service requirements and customers, be flexible to deliver new services, and be cost effective to lower CapEx and OpEx. At the same time the solution must offer investment protection. To accomplish this, optical equipment vendors are offering a wide array of solutions to allow Cable Operators flexible service offerings while reducing CapEx and OpEx through network convergence. New infrastructure platforms offer a breadth of options for delivering an optical infrastructure based on two primary architectures. Transponders-based solutions integrate DWDM intelligence including auto topology discovery, wavelength provisioning, and auto power management. These platforms can converge the network at multiple layers including DWDM, SONET/SDH, Ethernet, and IP. Passive-based solutions integrate optics into the switch/router via gigabit interface connectors (GBICs) while using passive optical solutions to support native gigabit Ethernet solutions. Both solutions enable the Cable Operator to offer new revenue generating services while optimizing network efficiency, lowering CapEx, and lowering OpEx.
PAPER
This session will focus on the capabilities of Optical infrastructure options, when and where to use them, and highlight real world analysis derived from implementation by several Cable Operators deploying deliver voice, video, and data services to residential and commercial customers. To help ensure future profitability, leading cable operators are exploring how best to deliver new revenue-generating services while lowering capital and operational expenses (CapEx and OpEx). Many operators looking to converged networks to improve efficiencies, especially when delivering new services and applications Figure 1 shows an example of an unconverged network that comprises five individual fiber networks. The network requires a total of 1960 fiber miles in order to deliver digital broadcast video, voice over IP (VoIP), high-speed data (HSD), SONET for analog video, and video on demand (VoD). This approach incurs the high CapEx of installing new fiber, especially in metropolitan areas where cable operators are reaching fiber capacity limits.

Figure 1 An Unconverged Network Running Multiple Services
Convergence Benefits
Convergence at different layers can bring significant savings. For example, the Cisco® ONS 15454 with the ML-Series card allows convergence at layer 2, and further convergence at the optical layer, layer 1,brings greater savings. With an optically converged architecture, the network described above would save US$5.7 million in fiber
installation costs alone—all of the services could be carried over a single fiber pair, requiring only 380 fiber miles. This is based on an estimate that the cost to lay each fiber mile is $3615, factoring in fiber, amplification and regeneration equipment, and trenching costs. The $5.7 million figure is derived by multiplying the extra fiber of 1580 miles required (1960 minus 380) by the per-mile fiber cost of $3615 (Figure 2).

Figure 2 Optical Convergence Saves Fiber
In addition, management becomes increasingly complex with multiple networks, where each network has separate management systems and processes that must be maintained. Rather than running each service application in a separate network silo, a flexible, adaptable converged infrastructure
gracefully combines networks with different quality-of-service (QoS) requirements, bandwidth needs, protection, topology, and protocol requirements (Figure 3). A properly designed converged optical network is transparent for all higher-layer protocols that transit the network, and provides simple manageability of the optical layer.

Figure 3 A Fundamental Challenge is Migration to a Converged Network
Cisco Optical Architecture Options
Cisco Systems® offers two primary architectures for implementing converged optical networks. The first architecture is an active, intelligent, auto-adjusting DWDM solution based on the Cisco ONS 15454 Multiservice Transport Platform (MSTP). The second architecture takes advantage of the fact that many client devices (multiservice provisioning platforms [MSPPs], switches, and routers, for example) can source ITU-grid optics directly. This architecture couples these
native dense wavelength-division multiplexing (DWDM) sources with the DWDM components of the Cisco ONS 15216 product line (filters, amps, and dispersion compensation units (DCUs), for example). The emergence of ITU-grid pluggable optics for switches, routers, and optical transport platforms has made this architecture an attractive and lower-priced alternative to the MSTP-based design for less complex networks.

Figure 4 Optical Architecture Options
Intelligent Auto-Adjusting DWDM Solution
The Cisco ONS 15454 MSTP delivers an intelligent, auto-adjusting DWDM solution. It brings capital and operational efficiency by converging many disparate networks at multiple layers, including the optical layer. The Cisco ONS 15454 MSTP features all of the familiar capabilities of the Cisco ONS 15454 MSPP, delivering time-division multiplexing (TDM), Ethernet, and SONET services, but adds support for numerous standards-based, auto-adjusting wavelength services within the same platform. The converged network can deliver several optical wavelength services, as well as sub-rate multiplexing. Video transport is typically
accomplished with unidirectional Gigabit Ethernet (GE) or 10-GE wavelengths. Data networks can be connected with GE, 10-GE, SONET/SDH, or other signals. Voice network transport can be handled with the standard DS-1 or DS-3 signals or with SONET/SDH connectivity. Storage networking can be delivered with 1-G and 2-G Fibre Channel interfaces, Fibre Connection (FICON), Enterprise Systems Connection (ESCON), or GE. Each wavelength can be customized as to bit rate, protocol, protection scheme, and direction (uni- or bidirectional).
The Cisco ONS 15454 MSTP is the optimal choice when a separate, dedicated optical platform is required to provide a

demarcation between the optical and data domains, and is ideal for optical networks of significant complexity in terms of topology, distance, protection schemes, and management requirements
Technology Innovation
The Cisco ONS 15454 MSTP uses advanced photonics technologies, combined with innovative engineering, to address the unique requirements for both metro and regional networks:
• Scalable 1 to 32 wavelengths in a single network for superior cost-versus-growth trade-off.
• Transport of 150 Mbps to 10 Gbps per wavelength, as well as sub-rate multiplexing of TDM and data services, for maximum service flexibility. The Cisco ONS 15454 MSTP supports G.709 standard encapsulation, allowing wavelength transport independent of the transport protocols embedded in the wavelength.
• Transmission distances from tens to hundreds of kilometers (up to 600 km) without regeneration through the use of advanced amplification, dispersion compensation, and Forward Error Correction (FEC) technologies. Enhanced FEC on future products will extend this range further without the need for regeneration.
• “Plug-and-play” card architecture for complete flexibility in configuring DWDM network elements––hub nodes, terminal nodes, and optical add/drop nodes––within amplified or un-amplified networks.
• Flexible 1- to 32-channel optical add/drop multiplexer (OADM) detail, supporting both band and channel OADMs, for greater ease in network planning and reduced reliance on service forecasting.
• Integration of pre- and post-amplification.
• Multilevel service monitoring—SONET/SDH, a G.709 digital wrapper, and an optical service channel for unparalleled service reliability.
• Network topology discovery, automatic power control, automatic node setup, and wavelength path provisioning to simplify DWDM network management.
Asymmetrical and Bidirectional DWDM Transmission
The Cisco ONS 15454 MSTP supports both asymmetrical and bidirectional wavelength transmission. Wavelengths can be routed independently, allowing for asymmetrical and bidirectional applications (Figure 5).
Figure 5 Asymmetrical and Bidirectional Applications Over a Converged MSTP Network

Wavelength Protection
The MSTP also offers optical path redundancy using three wavelength protection schemes. Y-cable protection protects against both wavelength path and transponder equipment failures, splitter protection reduces costs but only protects the optical path, and
client protection provides protection of all fibers and equipment in both the working and protection path by allowing protection switching to be performed on the client device. Figure 6 highlights the protection schemes supported by the Cisco ONS 15454 MSTP.
Figure 6 Protection Schemes on the Cisco ONS 15454 MSTP
New Advances for Managing Wavelengths in the Metro
Traditional DWDM solutions have rigid network architectures and require considerable manual interaction to manage, particularly when new sites are added or network capacity is upgraded. Traditional solutions are optimized for low-cost, per-bit, fixed topologies that cannot efficiently address the operational constraints of metro and regional networks. Metro networks face unique challenges, such as the inherent
difficulty in predicting demand. Furthermore, complexities are involved in managing metro DWDM network architectures. These include dynamically adding and dropping wavelengths, controlling in real time the power across wavelengths on the fiber, and setting up and provisioning the DWDM network. The Cisco ONS 15454 MSTP deals with these complications through several innovations, including network topology discovery, wavelength path provisioning, automatic power control, and automatic network setup.

Network topology discovery, based on the industry-standard Open Shortest Path First (OSPF) protocol, enables the auto discovery of nodes in a layered network without the provisioning of neighboring nodes, and provides network topology information for amplifier power control and wavelength path provisioning. Wavelength path provisioning enables the same “A-to-Z” provisioning that is widely used on the Cisco ONS 15454 MSTP for SONET/SDH circuits to be used for wavelength provisioning. The application tunes transponders to the correct wavelengths and prevents the provisioning of unavailable wavelengths. Automatic power control dynamically monitors and controls optical power across all wavelengths. This enables constant per-channel power as channels are added and dropped and constant per-channel power under span loss degradation due to changing conditions, fiber aging, or laser aging. It also provides automatic provisioning of amplifier parameters (gain, for example) during network installation. Finally, automatic network setup equalizes the optical power of all channels prior to amplification by controlling the ingress power level of each channel as it is added to the network, further simplifying network management. Equalization is necessary because individual channels will hit the ingress point of the network at differing power levels, and may take different paths through the network and thus experience different amounts of
attenuation—yet at any given point in the network, particularly prior to amplification, it is crucial that the individual wavelengths in the fiber be at a uniform power level.
Lambda Management
In order to perform lambda management, cable operators can make use of Cisco Transport Controller, a powerful craft interface tool resident on the Cisco ONS 15454 platform, and Cisco Transport Manager, a workstation-based element management system (EMS) capable of managing thousands of elements. Cisco Transport Controller and Cisco Transport Manager monitor the power of wavelengths as reported by the network elements. Typically, individual wavelength powers are monitored at ingress to or egress from the network, and composite signal power is measured as the composite signal enters and leaves active components. Monitoring of the composite signal is an efficient and cost-effective way to maintain the network—failure of an individual wavelength, once it is aggregated within a composite signal, is extremely unlikely. Typically, impairments to the system at the composite signal level will affect multiple wavelengths and be detectible via composite signal monitoring. Individual wavelength monitoring of a composite signal at every point in the network clutters the management interface, adds cost, and does not provide additional value. It is sufficient to monitor each individual wavelength as it enters and leaves the composite signal, and to monitor the health of the composite signal at all points between a given wavelength’s ingress and egress from that composite signal.

Figure 7 Monitoring DWDM Power Levels
The Cisco ONS 15454 MSTP also has the ability to set thresholds and triggers on monitored parameters at DWDM and electrical levels. This enables the system to proactively set off alarms or to take other pre-programmed actions when signals cross the pre-set thresholds. To interface with other management systems, the Cisco ONS 15454 MSTP supports the following management protocols: • TL1 from the network element with full
fault, configuration, accounting, performance, and security (FCAPS) features
• Simple Network Management Protocol (SNMP), for fault management and Remote Monitoring (RMON) statistics, from the network element
• Common Object Request Broker Architecture (CORBA) gateway with full FCAPS from Cisco Transport Manager
• TL1 gateway with full FCAPS from Cisco Transport Manager
• SNMP gateway with trap forwarding from Cisco Transport Manager
Finally, multiple network management views are enabled through Cisco Transport
Controller and Cisco Transport Manager, including lambda layer and fiber layer views, and the ability access the port level of Cisco ONS 15454 equipment to isolate problems. The lambda layer view provides a snapshot of logical connectivity and the health information between edge devices. The fiber layer view shows which lambdas are running on which fibers, filters, splitters, and amplifiers.
Cisco ONS 15216 Product Line
The Cisco ONS 15216 product line includes both unidirectional and bidirectional DWDM filters, as well as erbium-doped fiber amplifiers (EDFAs) and DCU units. The Cisco ONS 15216 product line is designed for solutions where the wavelength generation function is separate, such as when a pluggable ITU optical module is integrated within the switch or router itself. A Cisco Catalyst® 4500 Series system, for example, configured with 1- or 10-G pluggable optical modules, enables 32 wavelengths to be delivered over the passive optical network. Voice, video (including VoD), and data services can be converged over this network with the switch or router providing a scalable and flexible aggregation point.

In Figure 8, primarily passive building blocks are used to build unidirectional distribution trees for VoD. The solution is
scalable, enabling as few as two channels to be deployed on day one and scalable up to 32 DWDM channels.
Figure 8 Example of an ITU DWDM Pluggable Optical Layer
Integrated ITU DWDM Pluggable Wavelength Management
Network administrators can manage the passive optical network through active components in the network, including the EDFAs and the 100-GHz OADMs. For example, the EDFAs implement automatic gain control and variable optical attenuators that allow software control of power at the input of the amplifier. Information from these active devices flow up to both Cisco Transport Controller and Cisco Transport Manager, allowing both management of and visibility into the network.
Optical Infrastructure Roadmap
The Cisco optical infrastructure roadmap is being implemented in three phases. The current phase, described in this document, includes the development of a robust network infrastructure. This includes an intelligent auto-adjusting DWDM network solution
using the Cisco ONS 15454 MSTP or an integrated ITU DWDM pluggable solution via the Cisco ONS 15216 product family. Phase 2, targeted for the second half of 2004, will provide increased network design flexibility and management. It will include improved aggregation for lower-cost transport with 10-Gigabit ITU pluggable optics moving to switches and routers. These pluggable optics will provide optical monitoring to improve manageability of the integrated solution. Phase 2 will also focus on improved lambda distribution and flexibility through reconfigurable OADMs (ROADMs), allowing lambdas to be turned up remotely as traffic demands increase. As wavelengths may change at the transport layer via ROADMs, the EMS will maintain an association between the client port and the wavelength for management visibility.

Phase 3, targeted for the first half of 2005, will provide sub-rate multiplexing of multiple protocols (ESCON, IBM Fiber Connection [FICON], Fibre Channel, and GE) onto 2.5-G or 10-G lambdas, giving improved efficiencies and removing cost from the network.
Future of Optical Convergence
The combination of rich new capabilities included in Cisco platforms such as the ONS 15454 MSTP and the ONS 15216, combined with the ability to converge at multiple layers, is laying the groundwork for converged optical networks in the cable market. These will offer increased revenues from new services as well as the reduced CapEx and OpEx that naturally results from building and
maintaining only a single optical network to meet all transport needs. Cisco is uniquely positioned to offer all of the components of the converged optical network. For more information on Cisco networking solutions for the cable services network, visit www.cisco.com/placeholder or view the datasheets of the products featured in this paper: • Cisco ONS 15454
http://www.cisco.com/en/US/products/hw/optical/ps2006/index.html
• Cisco ONS 15216 http://www.cisco.com/en/US/products/hw/optical/ps1996/index.html

SECURITY AND SAVINGS: GOING DIGITAL AND GETTING BOTH Alec Main Cloakware Corporation Abstract Achieving cost savings while converting the analog television ecosystem to digital continues to be a difficult problem. The revenue opportunities available through the conversion of the analog bandwidth to digital are well identified, but with the continued prevalence of analog legacy systems, the path to conversion is a significant challenge. How can the industry leverage the potential revenues of digital bandwidth, while continuing to provide service to those who may not want or need the digital experience? This paper examines a cost effective path to conversion which proposes developing a basic service set-top box (STB) that would include replacing hardware-based security solutions with a lower cost tamper-resistant software solution. This change would allow subsidized digital STB roll-out and electronic provisioning of basic services, while enforcing the rights of content providers and owners.
INTRODUCTION The move from analog to digital networks allows cable operators to offer more services to more customers than ever before. With digital cable, multiple service operators (MSOs) can offer a host of new services such as video-on-demand, interactive television and commercial-free CD-quality music, giving subscribers greater choice, quality and control. Taking the network all-digital frees up bandwidth to offer these new, exciting services. While subscribers report good
satisfaction from digital services, the challenge for cable operators is switching over the installed base of analog users. Those reluctant to switch – who could represent the next potential wave of adopters – complain about too few digital channels, while some subscribers have no intention of switching. In the meantime, the base of subscribers who do upgrade from analog to digital can experience reduced quality on analog channels due excessive conversion (i.e., analog to digital to analog). Consider the following broad categories of cable subscribers:
1) Premium service subscribers using digital services on a set-top box with a smart card and two-way modem.
2) Potential new digital subscribers considering upgrading to a digital STB.
3) Basic service subscribers using analog services, who may never switch to digital.
Until all of the basic subscribers switch over to the digital service, the MSO must continue to provide analog services as well as digital. The fastest way to accomplish the digital conversion – and to reap the benefits – is to entice subscribers to make the leap by lowering the price of the STB to such a point that it is easy for consumers to switch – say, $35 – or at least, to a point where an MSO can economically subsidize the box. In order to achieve a cost-effective box, we propose boxes without smart cards or CableCARDs™ that are targeted at the basic

service subscriber. Security will be handled by secure software which is lower cost compared to hardware. The set-top box would have a unidirectional cable modem, analog TV output (converted from digital input) and use a standard remote control. There would be no hard drive or personal video recorder (PVR) capabilities and no additional outputs for home networking. It would be compatible with existing TVs and VCRs. This paper presents the challenges and benefits of going digital using secure software:
• Dealing with currently accepted piracy levels during the transition
• Reducing the manufacturing and on-going support costs
• Realizing additional benefits of a software approach including electronic provisioning
• Making the software secure • Dealing with legacy CAS systems
It concludes that a software-based solution is cost effective, while continuing to prevent subscription fraud.
GOING DIGITAL Analog services tie up a significant percentage of bandwidth. Once the analog services are no longer required, bandwidth is freed up for additional premium service offerings. However, making the switch requires some planning. Many MSOs have already moved some channels to digital, but the network infrastructure must be set to handle all-digital. The switchover must be well communicated and coordinated to ensure minimal disruption of service. The actual
adding of the STB to the subscriber’s premises should be very simple. The next issue is whether to scramble basic services – the goal being electronic provisioning and eliminating truck rolls to activate or deactivate subscribers. To answer this question, we need to consider existing piracy and subsidy strategies. A certain level of subscription fraud is tolerated today. Many subscribers have a splitter in their basement and feed multiple TVs on one subscription. Going all-digital – whether the basic service is scrambled or not – requires a STB per TV. If the low-cost STB is not available through retail channels, then the MSO needs to consider piracy in conjunction with their subsidy strategy. The low-end STB has a one-way cable modem and an analog output. It provides only basic services and the keys for delivering premium services are never downloaded to the box. The threat against such a box is low. However, by not addressing existing piracy, a market for grey market hacked devices will develop. A strategy is needed to consider subsidizing one or even two low-cost boxes per home, plus providing additional boxes for sale. Subscriptions can charge for multiple TVs at a reasonable price – but not so high as to stimulate a grey market. Most subscribers will want to stay legitimate given reasonable options. Under this scenario, users would need to upgrade to another box for premium services. The basic STB could still support the Open Cable Applications Platform (OCAP), but offer a limited set of capabilities (e.g. no interactive functions). The MSO may want to consider giving subscribers the option of the

basic box, with a credit on a premium box when taking the network all-digital. Proper planning and a strategy to address existing piracy must be in place prior to making the transition to an all-digital network in order for subscribers to legitimately obtain the services they want.
SAVINGS How can we get the price down low enough to enable the transition to all-digital input for the basic service subscriber? We propose cutting manufacturing costs by replacing the security hardware with secure software. Software can deliver identical functionality to hardware with other added benefits. Cost savings are realized by eliminating the CableCARD, as well as the reader within the STB. A CableCARD is a PCMCIA-like card with a smart card slot or smart-card functionality embedded. While these prices are expected to drop, they are currently very expensive. The cost of the card is covered by the MSO, and may be recouped by a small incremental monthly charge. If these cards are hacked, which is likely if satellite TV is any indication, then they need to be replaced periodically by the MSO. By eliminating these cards on a basic STB, the MSO saves initial and recurring costs, while minimizing the threat – it is very difficult for a basic services box to be upgraded via hacks to full service. The additional major cost savings comes from using a basic unidirectional cable modem over a bidirectional DOCSIS® modem. By running the secure software in a Linux® environment, there are no additional operating system costs.
There will, however, be additional costs for the CPU and memory, but it’s money better spent: this is the more practical place to add cost, since these processors support a wider variety of software and applications. The CPU could also support Open Cable Application Platform (OCAP) and this know-how can be leveraged on premium boxes where more functionality is CPU intensive, such as DTCP-IP (Digital Transport Copy Protection mechanism for use on IP networks) and PVR functions. Also, expect some additional cost for hardening the software running on the box. The last additional cost relates to the legacy conditional access system (CAS) in place on the MSO’s network. This cost is discussed later in this paper. We believe that the savings will be greater by moving to a secure software implementation, plus there are added benefits to a secure software approach.
BENEFITS OF SOFTWARE SECURITY In consumer electronics, cost reductions typically involve the replacement of soft parts with hard parts. Integration is usually the name of the game. Security is an exception. Conditional access security is provided by an external component such as a smart card. The smart card is not integrated because it needs to be specific to an MSO, but also because it needs to be renewed periodically. Software security can also be renewed, but at significantly lower cost. In addition, it is much harder to remove software from a closed box, hack it and then insert it into other boxes. Smart cards arguably help create a pirate network because of the ease of removal and distribution.

Secure software – or more specifically a secured software-oriented STB – has other benefits:
1) New revenue opportunities – operators can create new service bundles based on the ability of subscribers to download new technologies and features, even for low-end STB owners.
2) Increased flexibility – operators can
meet different standards as they emerge.
3) Increased renewability – new security
countermeasures can be deployed quickly and as frequently as required to the entire existing installed base faster, reducing subscription fraud and piracy. Software can be renewed selectively, proactively, or reactively.
4) Ability to upgrade – subscribers don’t
have to buy a new set-top box to benefit from new technologies and new features that can be downloaded.
All of these benefits can be achieved without the use of smart cards and the added costs of replacing them.
SECURITY The rewards of the secure software-oriented STB extend well beyond reductions in cost to the MSO, but what kind of new risks are introduced to the MSO and how are they best mitigated? Any discussion on software security should include a description of the threat model. The STB scenario is called a “hostile user threat”, where the legitimate user of the system may want to hack it for the purposes of subscription fraud, piracy or theft of services.
Do we even need to protect the box? Certainly the threat is not as severe as in a PC environment where the hostile user has complete control of the CPU and applications that are loaded. However, software protection steps are needed as the box will likely run a known operating system like Linux for cost savings. Regardless, tools exist to attack most computer systems, so some level of protection is prudent. Can we just encrypt the data? Data confidentiality is only one component of the solution. The software also needs protection. Content protection standards, such as DTCP-IP, CPRM (Content Protection for Renewable Media) and HDCP (High-bandwidth Digital Content Protection), all recognize the need for software robustness.1 The requirement for software protection is mandated by these standards. In this case, the primary goal is to prevent subscription fraud. Since this box is for basic services only, the simplest mechanism is to make sure the box does not have the content descrambling keys or functionality required for premium services. We assume some scrambling is performed on the content and the goal is to decrypt only the appropriate channels. Secondly, the attacker can always convert the analog output to digital (known as the “analog hole”), whereas our security goal is to prevent siphoning-off of the digital content. Again, a basic service box reduces this risk since premium content is never descrambled or available on the internal busses in the clear. Lastly, we want to prevent the box from being used for other purposes – a form of subscription fraud common with high-end media devices such as Xbox®2. Since this is a basic service box with limited outputs, such threat of service is also low risk.

Since we have control of the operating system installation and software upgrades, we can consider numerous techniques to harden the system. First let’s look at how software is attacked. A software attack follows this general framework: 1) Analysis – Classic reverse engineering and analysis of the software and protocols to identify vulnerabilities. This can be static analysis when the code is not running, such as disassembly and decompilation, or dynamic tracing of the executing code using debuggers and emulators. There are some more advanced and powerful forms of analysis such as collaborative and differential analysis, which we will discuss later. 2) Tampering – Modifying the code and/or data such that it performs according to the attacker’s objectives. 3) Automation – The creation of scripts or code to apply the tampering attack to multiple copies of the application. These are also known as “class attacks” or “global breaks”. In some cases, the tampered application must be distributed, which is less desirable from an attacker’s perspective as it is more detectable and prosecutable under legal measures. 4) Distribution – Once the automated attack is created, it must be distributed in an effective, confidential means. Often bulletin boards, Internet Relay Chat (IRC) and peer-to-peer networks (P2P) are used for this purpose. The first goal is to make analysis and tampering difficult, time-consuming and/or expensive. The obvious approach to prevent static analysis is to encrypt the binary. However, there are many techniques to extract these decrypted executables from memory. However, there are also techniques that prevent static analysis such as control flow flattening which introduces pointer aliasing
that can only be resolved at runtime. There are specific decompilation and disassembly prevention techniques that target these tools. Note that while very powerful disassembly tools exist, most low-level code written in C or C++ is very difficult to decompile with only a few tools available. Software protection is about using multiple layers of defense and all these techniques should be considered. Runtime analysis of a system can be prevented or made very expensive by the use of anti-debugger and anti-emulation techniques. A range of techniques unto themselves, these can be effective on platforms where the operating system and applications are known in advance – such as with our basic STB. In this case, the code can be tied to the platform via node locking and loading of new applications controlled by secure code signing techniques. Advanced just-in-time decryption (or self-modifying code) techniques also raise the bar against dynamic analysis. Authentication of components on the machine and encryption of communication channels with protocol not subject to replay attacks also prevent analysis. In addition, data transformation techniques can be used to hide and randomize data values even when operated on within main memory. White-box cryptography refers to specific cryptographic implementations designed to prevent key extraction even when the operation can be viewed by an attacker. Static tampering is prevented with binary encryption techniques, as well as by introducing data dependencies in the code to change an easy branch jamming attack into tampering – increasing the effort required and involving multiple changes to the code. An important technique to prevent tampering is code signing, but the code signing mechanism itself will be subject to attack and so must also be suitably hardened. Integrity

verification of applications should be done statically (on-disk) as well as in-memory to prevent dynamic tampering attacks. Prevention of automated attacks is best achieved by deploying code and data diversity such that a successful attack will only work for a sub-set of users. Diversity of code is a result of most software protection techniques outlined above. It is similar to having different keys (diversity of data) for different users. Diversity of code recognizes that attacks will be on the software in addition to the data. Automated attacks are also mitigated by software renewability, which can be made low cost – if designed in upfront. Conversely with hardware based security, renewability is a major cost. Software can be renewed selectively, proactively, or reactively – depending on the strategy and the attacks to the specific system. Diversity is a prerequisite for successful renewability; otherwise attackers will perform differential analysis. This is a powerful attack used to quickly determine the changes made to software upgrades and shorten the time to successful hack.
LEGACY CONDITIONAL ACCESS In North America, the vast majority of conditional access systems for cable are provided by Motorola or Scientific-Atlanta. In order to integrate a software based low-end STB, there are three options:
1) License the CAS system from Motorola or Scientific-Atlanta (e.g. as done by Digeo3 and others)
2) Utilize Sony Passage4 to run an additional
CAS over top the legacy CAS.
3) Roll-over to a new CAS during the all-digital transition.
The disadvantage of Sony Passage is that the MSO must make changes to their head end. The Sony Passage system consumes 2% to 10% additional bandwidth, but this will be amply compensated for by going all-digital. There are a number of new players5 providing software-based CAS that can work with Sony Passage or independently.
CONCLUSION This paper has described a secure and cost effective path to migrate analog cable users to digital services. For the basic service subscriber, we can achieve a cost-effective box without smart cards or CableCARDs. The set-top box would have a unidirectional cable modem, analog TV output (converted from digital input), and would be compatible with existing TVs and VCRs. Secure software can effectively address the challenges of going digital and provide additional benefits. These challenges include legacy conditional access systems, dealing with piracy and reducing overall cost. Proper planning and a strategy to address existing piracy must both be in place prior to making the transition to an all-digital network. The other benefits of implementing a low cost STB employing secure software include new revenue opportunities, increased flexibility, increased renewability, and a cheaper upgrade path. All of these benefits can be achieved without the use of smart cards and the added costs of replacing them. We conclude that a software-based solution is cost effective, while continuing to prevent subscription fraud.

TRADEMARKS CableCARD is a trademark of Cable Television Laboratories, Inc. DOCSIS (Data Over Cable Service Interface Specification) is a registered trademark of Cable Television Laboratories, Inc. Linux is a registered trademark of Linus Torvalds. Passage is a trademark of Sony Corporation. Xbox is a registered trademark of Microsoft Corporation.
END NOTES 1) See: Hitachi, Ltd., Intel Corporation,
Matsushita Electric Industrial, Co., Ltd., Sony Corporation, Toshiba Corporation; “5C Digital Transmission Content Protection, White Paper”; July 14, 1998; http://www.dtcp.com/data/wp_spec.pdf
2) See: xbox hackz Website; http://www.xboxhackz.com/; 2002
3) See: Digeo Inc. Website ; http://www..digeo.com; 2004
4) See: Sony Passage Website; http://www.sonypassage.com; 2004
5) See: Latens Systems Ltd. Website; http://www.latens.co.uk/html/cable.html; 2004.
REFERENCES 1) Bar-Haim, Pam and Wald, Stephanie,
NDS Ltd.; “The NDS Guide To Digital Set-Top Boxes: Third Edition”; 2002. See: http://www.broadcastpapers.com/ data/NDSGuideSetTopBoxIndex.htm
ABOUT THE AUTHOR Alec Main ([email protected]) is Cloakware’s Chief Technology Officer. He has spoken at key forums and conferences including Copy Protection Technical Working Group (CPTWG), Media Summit, RSA, the Intel Developer Forum, Information Highways, and Certicom – PKCS.

STORAGE: THE FUTURE OF CABLE
Bob Van Orden Scientific-Atlanta, Inc.
Abstract
By definition, all new technologies redefine what can be done in a given medium. Faster processors enable increasingly complex and sophisticated computing activities to take place, at lower and lower cost. Improvements in video/graphics technology enable more colors and greater clarity. Certain key technologies, however, do more than support evolution. They change everything. This paper will look at the present and projected impact of one such revolutionary technology – storage – on the cable industry. It will examine how storage enables new capabilities beyond DVR. It will posit ways in which the storage-based paradigm can offer operators opportunities to generate new revenues, dramatically enhance consumer relationships, create new leverage with broadcasters and content providers, ensure content and subscriber security and benefit from new advertising models.
EVOLUTION AND REVOLUTION: ADVANCES IN CABLE TECHNOLOGY
Without question, the cable industry is undergoing tremendous change. We’ve advanced from a few channels to hundreds of channels. Content is becoming increasingly specialized (e.g., sports channels, movie channels, home improvement/decorating channels, etc.). Image and sound quality continue to improve as transmissions migrate from analog to digital to HDTV. The speed of broadband traffic is also on the rise, as we move from dialup to high-speed cable – to virtually unlimited bandwidth for a variety of data- and video-oriented cable
applications. These advances are evolutionary, as they continue to build on existing technologies and trends. Other advances are more revolutionary. For example, Video-on-Demand (VOD) and Digital Video Recording (DVR) technologies give consumers unprecedented control over television viewing. Instead of watching TV shows at scheduled times, people can watch whatever they want, whenever they want, with the power to start, stop, pause, rewind and fast forward the action. Similarly, one must recognize the current trend toward increasingly customized content. Correlative systems can make individualized recommendations based on consumer viewing patterns. For example, if someone records every episode of Survivor, the system might recommend other, similar shows that the viewer might enjoy, enabling consumers to receive specialized programming based on their specific interests, likes and dislikes. These advances are more than mere improvements on what people already know and expect. They completely transform how people think of TV – and they are possible because of revolutionary changes in storage.
STORAGE CHANGES EVERYTHING
The ground-breaking effect of storage technology on consumer capabilities is not new. The computer industry saw a similar shift in what people could – and would expect to – do with computers as storage technology became less expensive and able to fit on a smaller footprint. The industry evolved from mainframe computers that took up entire rooms to “dumb client” environments in which multiple terminals

could tap into individual mainframes. The first PCs were limited by the amount of data that could fit on a floppy drive. When storage technology enabled PCs to incorporate hard drives, however, the capabilities of PCs increased dramatically – as did people’s interest in and need for computers. First, the hard drive enabled increased personalization of the software environment and the ability to save vast amounts of content. Then, when these storage-empowered computers were connected in a distributed network paradigm via the Internet, people could do even more. Email, the ability to get content and information via Internet downloads, and the ability to buffer content downloaded from the Internet for a more seamless “streaming” experience became the norm. The effect of storage on the cable environment is quite similar. Storage in the network enables video-on-demand services, including Movies on-demand, Kids programming on-demand, Subscription on-demand (e.g., Starz/Encore on-demand, HBO on-demand, etc.) and Free on-demand (e.g., HGTV on-demand, DIY on-demand, etc.). Currently available to an estimated 16.5 million U.S. homes1, these types of services give cable subscribers the ability to access specific programs without regard to a pre-defined programming schedule. Storage in the set-top, of course, enables DVR services, through which viewers can watch what they want, when they want and create personalized libraries of preferred content. Likewise, DVR services enable viewers to control live TV, just as if it were on a DVD recording. Now widely deployed throughout North America, DVR has proved to be a dramatic success. Consumers love DVR. Research shows that 75% of cable DVR subscribers rate DVR very highly and are willing to pay
monthly fees for the service which are typically $9.95 monthly in most cable systems.2 More significantly, it appears that the people who are embracing DVR services are not those who fit the “early adopter” profile.3 DVR appeals to virtually everyone who tries it. BEYOND DVR: HOW STORAGE WILL
TRANSFORM CABLE NEXT Beyond the DVR technology readily available today, storage in the set-top opens the door to even more services and capabilities. DVR Throughout the Home Consumers are also making it clear that once they have DVR service on one TV, they want it throughout their home. With that in mind, operators will be able to benefit from services that enable consumers to save content on one set-top, then share that content with multiple televisions in the home. This is similar to the trend we have witnessed in multi-PC homes with home networking in a client-server like architecture to share data. In this case, the DVR essentially turns into a home entertainment server. While content sharing brings up security issues, a viable system (such as Scientific-Atlanta’s Explorer 8000 Multi-Room DVR system), should store only one copy of any given program recording and use existing wiring in the home. The result simplifies installation and ensures that content can’t be shared between subscribers within a given cable service area. “Cable Anywhere” Just as storage in the PC evolved to include CD and DVD recording capabilities, we can expect similar developments in the cable environment to make it possible for people to take the cable programming they

love with them wherever they go. This “Cable Anywhere” concept can create a new distribution model for cable operators. Again, security would need to be ensured so that DVD copies of programming could not be re-copied or distributed. With secure DVD recording capability built into the DVR set-top, however, consumers can be offered the opportunity to own a DVD recording of any program for, say, $9.99. Likewise, it enables operators to expand the VOD paradigm by following any VOD stream with the opportunity to own the program for only, a small surcharge. The Personalized TV Environment Customized Look/Feel. Advanced storage in the set-top enables subscribers to personalize their TV environment for a simplified, highly relevant entertainment experience. Users will be able to build a unified, individual interface, based on subscriber preferences for channels and content, as well as overall look and feel of interactive/information screens. Simply put, users gain the ability to group the functions they want within the interface where those functions are most convenient, much like a programmable remote controls do today for linking disparate audio/visual components together. Personalized Programming and Targeted Advertising. Advanced content search capabilities would allow a set-top to automatically find programming based on a given genre, actor, director, subject, etc. Such a system would use individual subscriber recording habits and/or information voluntarily given by the subscriber to deliver more relevant programming recommendations than those available on systems today. Similarly, the system could use viewership and other subscriber information to create individual advertising profiles, in which advertising is targeted directly at subscribers who are
likely to want information about a given product or offering. The Complete Entertainment Experience. A hard drive in the set-top can enable storage of all kinds of content, in addition to cable video programming. Subscribers could “lease” a section of the hard drive to store home videos, family photos, MP3s and games that could be played against other people in the home – or other subscribers in the cable system. Ultimately, the set-top hard drive could house all this, as well as other downloadable applications and programs that have yet to be imagined. In this way, the cable operator enables the family room TV – or every TV – to become a complete, integrated entertainment center for the household. All of these features and capabilities would be able to be customized, configured and updated remotely by the subscriber.
THE NEW STORAGE PARADIGM CAN HELP OPERATORS
Generate New Revenues from New Services Clearly, operators can take advantage of new revenues generated by these storage-based services and capabilities. DVR throughout the home is a prime candidate to be a fee-based service. “Cable Anywhere” services fit a per-program model, similar to the iTunes, Rhapsody and Music Match services for MP3 music downloads over the Internet. Enhance Relationships with Consumers In the storage-based cable environment, the cable service becomes far more than a pipe for programming. If you are a cable operator, you become the must-have source for trusted, relevant recommendations, as well as all kinds of video entertainment. Moreover, you become the reason why consumers prefer to receive all their

entertainment – including home videos, photos, music, etc. – on the TV. In short: the relationship between the operator and consumer goes from an impersonal consumer-vendor model to a more personalized relationship of greater depth and much greater value. Create New Leverage with Broadcasters and Content Providers In the storage-based paradigm, even more than today, it is reasonable to assume that people watch programs more than they watch specific channels. When there is a large, personalized library of programs from which to choose at any given time, the value of a broadcaster or content provider’s time slot to the consumer and/or advertiser is diminished. At the same time, the cable operator’s value to broadcasters and content providers as the direct connection to the consumer – and that consumer’s preferences – goes up. As a result, operators may be able to leverage that consumer relationship and key information about how consumers interact with different programming to drive more favorable relationships with broadcasters and other content providers. Ensure Content and Subscriber Security As previously mentioned, services that involve distributed content (i.e., cable programming that can be accessed from multiple set-tops in the home or the “Cable Anywhere” concept), raise security issues. Indeed, such services essentially dictate that the cable operator become a major factor in the protection of content and subscriber information. Therefore, it will be essential that operators employ systems that protect this information. Systems that deliver content sharing in the home must also protect content from being shared between households on the cable network. Set-tops with a built-in DVD recorders must ensure that content is paid for and cannot be re-copied or re-distributed. Engines that gather
information about subscriber viewership must be designed to protect subscriber identity while providing useful information. Take Advantage of New/Different Kinds of Advertising Clearly, there are good reasons for the advertising community to be opposed to technologies that enable consumers to bypass commercials. At the same time, when people can control their programming, they expect to control it completely. The ability to skip or fast-forward through traditional commercials is hardly the death of advertising. Programmers, broadcasters and cable operators have the opportunity to sell program sponsorship, badging and bannering opportunities to advertisers. The industry can expect to see an increase in more sophisticated product placement within programming. Research shows that DVR users exercised the instant replay feature during the Superbowl to replay ads more than plays in the game. With that in mind, advertisers may choose to invest in more creative and engaging ads to be shown during a variety of events and shows. Perhaps the most significant opportunity for cable operators to have new, more lucrative relationships with advertisers stems from the fact that storage-based capabilities and services give the operator the ability to narrowly and directly target specific subscribers. As such, cable operators can provide opportunities for advertisements that also function as programming (e.g., the BMW ads by famous directors, featuring famous actors). After all, when time-slots are no longer an issue, the length of a show is irrelevant. Will people actively choose to watch a three minute ad with adrenaline-pumping action and/or emotion-tearing story-lines? Will people get hooked on ads that tell a serialized story over time? Will people want to watch performances of their favorite actors or learn more about a product for which they’ve expressed interest? Don’t be surprised if the answer is yes.

STORAGE PROVIDES THE OPPORTUNITY
It is important to remember one of the key lessons taught by the computer industry: For the most part, the companies who rapidly and eagerly embraced the complete combination of local storage and distributed connectivity have survived and thrived. Those who ignored these opportunities have not. It is easy to see that the trend toward storage in a distributed environment is inevitable for cable. Likewise, this trend indicates there are many opportunities for cable operators who embrace the storage-based paradigm. New services and advertising models can generate new revenues. Equally important, however, is the opportunity presented by the deeper relationship between the operator and the subscriber. It has already been shown that DVR in its most basic form is very “sticky.” Once subscribers have the service, they do not want to give it up. Increase the amount of relevant content that the subscriber can watch, the degree to which different capabilities are integrated into the cable service, and the degree to which people become accustomed to getting “what they want/ when they want/where they want/the way they want it” and the service becomes even more deeply ingrained into the subscriber’s life.
ENDNOTES
1Kagan World Media, a PRIMEDIA Company, Broadband Financial Databook 2003, as cited in National Cable & Telecommunications Association 2003 Year End Industry Overview.
2Leichtman Research Group, Study of
900 Explorer 8000 households, November 2003.
3Business Week Online, New Analysis, “A Cable Lifeline for DVR Technology,” April 2, 2003. Also Canada Newswire, “DVD breakthrough underscores appetite for interactive entertainment,” April 8, 2003. "Forward-looking statements," as defined in the Private Securities Litigation Reform Act of 1995, may be included in this paper. A variety of factors could cause Scientific-Atlanta's actual results to differ from the anticipated results expressed in such forward-looking statements. Investors are referred to Scientific-Atlanta's Cautionary Statements (Exhibit 99.1 to the Company's most recent Form 10-Q), which statements are incorporated into this paper by reference.

SUPPORTING LARGE SCALE VOD THROUGH COMMON METADATA
Yasser Syed, Ph.D. Cable Television Laboratories Abstract This paper explores the challenges in video services and plant operations that the operator has to undergo to support on-demand services. In particular, the paper describe how, a common set of metadata tags will be needed to manage, describe, and present programs to the customer. Without a common set of metadata, there will be limits on the size of content catalogues, types of on-demand services, and search tools for these services.
This paper first describes what is metadata and what are some of the types of metadata (Application, Association, Presentation, etc.) that are used today or considered for use. The next section describes how metadata supports an on-demand service in acquiring content, asset management, navigation, and user interfaces through the existing approaches enabled by CableLabs VOD Metadata specifications or through new approaches. Lastly this article describes how common metadata mechanisms can also be used to increase consumer demand for VoD content & services through guide-like interfaces and other approaches.
INTRODUCTION
The cable industry has traditionally been a broadcast-oriented environment. With digital broadcast services, cable has over a hundred channels transmitted 24 hours a day for viewing. In reality, very few of these channels are watched by a sizeable audience for more than a short period of time. Most of the viewers do not pay for viewing content, but pay instead for the availability of a variety of content that can be viewed. When a cable operator decides on a new channel, it
must consider whether the target audience of potential viewers is large enough to support the costs of channel acquisition and resources in the cable plant. Increasingly, this becomes a hard decision because newer channels have smaller target audiences or are repurposing content shown on other channels.
Given this, cable operators have been allocating more bandwidth for video-on-demand (VoD) and Subscriber Video-on-Demand (SVoD) services that provide customers a direct way to view content of their own choice. VoD customers, in turn, need access to simple descriptions of the expanding video library content in order to select videos to view on demand.
This paper explores the changes in plant operations that the operator has to undergo to support on-demand services. In particular, we describe how a common set of metadata tags will be necessary to manage, describe, and present programs to the customer. Without a common set of metadata, there will be limits on the size of content catalogues, types of on-demand services, and search tools for these services.
WHAT IS METADATA?
Metadata is descriptive data associated with a content file or application. A content file in this case could be a Moving Pictures Experts Group (MPEG) video file, a still image file, or an audio file. The metadata may vary from merely identifying the package title, to information for populating an electronic program guide (EPG), to providing a complete index of different scenes in a movie, to supplying business rules detailing how the content package may

be displayed, copied or sold. An asset is an identifiable set of metadata plus its associated content file if it exists.
The information from metadata allows cable operators to distribute, manage, track and present the described content or application to customers. The metadata itself is just text that can be used or ignored. The value in metadata is creating and standardizing common and accepted text fields that can be used to build content.
Categories of Metadata
Metadata can be organized in following categories:
Intrinsic Content Metadata Metadata that is directly associated with only the content and does not change. This information allows for the content to be useable and routable, but does not necessarily dictate how it can be played or presented. It could be encoding, file size, file type, genre, rating or other information. Identifying what metadata belongs in this category allows for the content to be repurposed for different applications and services without retransmitting the entire collection assets.
Non-Intrinsic Content Metadata Metadata that is associated with only the content that does not usually change, but is not directly required for use of the content. This is helpful but non-critical information that would assist in playing and understanding the content. Some types of metadata that fall in this category are chapter indexing, actors, language and studio.
Asset Management System (AMS) Metadata Metadata needed to deliver, distribute, identify and place assets within a headend distribution system. With the proper metadata management wrapper for the asset,
it does not become necessary for the headend to fully understand the exact content or metadata it is handling, but just the pertinent information for its asset management routines. An important concept at this level is to be able to uniquely identify the asset such that updates to assets after distribution can be feasible. Types of metadata for AMS are Asset_ID, Provider_ID, Asset_Class, Version, and Product_Offering.
Application Specific Metadata Metadata associated with applications like VoD/Subscription Video-on-Demand (SVoD) and can span more than one asset for information applicable to a collection or package. Application metadata is required in order to put a collection of assets into a service. Examples of this metadata include association metadata, license metadata and presentation metadata. A key item in this category is the ability to perform operations (e.g., close) on the entire collection of related assets. Specific types of metadata for this are license windows, sequence number, series title (e.g., used to form groups of television episodes), and royalty_ID.
Association Metadata Metadata on how a group of assets are related to each other. This can be expressed as explicit metadata information or implicit structural information through references or associations. It can show that assets are dependents of other assets or shared among a group of assets. For instance, a VoD Title asset can have as dependent assets: a movie asset, poster asset, license asset and preview asset. The concept of unique identifiers for assets allows for relationships to be easily created.
License Metadata Metadata of contractual nature for the application. Having license metadata asset for a content provider to create one group of assets for many service

providers. It can then update the group of assets with a unique license asset that dictates the contractual agreement for that particular provider. Some examples of license metadata are license window, contract name, display_as_new, movie preview_period, royalty_percent and billing_ID.
Presentation Metadata Metadata that involves presentation of the video offering to the consumer through a user interface. This information can change often according to display constraints and marketing strategies. Some examples include summary, title_brief, and category. For example, category is a marketing field for the assets that can change over time (e.g., $1 movies, Christmas Movies, Weekend Blockbusters). This is different from genre, which are permanent fields that can categorize the content and can be used for navigation purposes. Other aspects of presentation are display characteristics. Common Metadata formats needs to also consider character limitations, Multilanguage aspects, scripts and symbols that can simplify displaying the information on the user interfaces for all types of STBs.
User Metadata Metadata that can be used to target content to the right type of consumer. In a passive way, metadata fields in the application and content assets can be used to allow the user to easily identify content they want to see. It can also allow the service provider to target ads for users watching a particular type of content (e.g., advertising a blender for those watching a cooking show). In a more active way, metadata can be created for a user that can indicate preference for particular content. This then can be used by the application or service to display content that the user prefers, and would be more likely to order (e.g., a personal barker channel for the user).
HOW METADATA SUPPORTS AN ON-DEMAND SERVICE
Metadata can be used to support all key processes of an on-demand service and can enhance performance as these services become more heavily used. This section describes how broadcast services use these functions in the headend, and how this usage changes as on-demand services become more popular. Lastly, it shows how metadata could improve the performance of these functions for on-demand services and, in general, headend operations.
Acquiring Content
In broadcast, content is usually a retransmission of a program channel from either a local broadcast (ABC, NBC, CBS) or a premium-branded channel (HBO, Showtime, TNN, MTV). Other types of content that are directly acquired by the headend are local advertisements and pay-per-view movie content, which are placed in ad insertion and video servers. The arrival of this type of content is negotiated in advance and delivered in batches (often by tape and now more frequently by closed satellite link) to the headend in a timely manner.
In a VoD/SVoD system, content, which is typically movies, is similarly negotiated beforehand and delivered in batches to the headend in a timely manner. The catalog of movies is often a magnitude larger than pay-per-view selections, but still limited (~200-300 selections). Content is acquired via tape delivery or over closed satellite link.
In true on-demand services, the consumer expects the equivalent of a personal program channel. To acquire content in a scaleable fashion, content delivery will necessitate the following behaviors in content acquisition:

• It will incorporate different types of content (Movies, TV episodes, Daily news, Sports, Instructional Video);
• It will happen more often because the size of the content catalogue will greatly expand and be actively modified (e.g., Sony’s content library contains over 6,500 movies and 35,000 TV episodes!1);
• It will be distributed in a manner where the complete package will be delivered over time starting with previews, continuing with asset updates, and finally the primary content file;
• It will allow for reuse and repurposing of content for different types of applications and services after initial offering.
The collection of assets can be delivered over a variety and combination of mechanisms including satellite, tape, IP network, and e-mail (see Figure 1). In most types of network delivery systems for assets, there is a “pitcher” and “catcher” function that are aggregation points for transmitting and receiving the assets. The “pitcher” aggregates metadata and content from studios and encoding houses, makes corrections to the assets when required, and usually acts as the business entity responsible for content negotiations and scheduled delivery. The “catcher” is the aggregated receiving point that validates the delivered asset, communicates with the pitcher, and instantiates and distributes the assets internally to multiple headends in the cable network. An important function of the catcher is to validate the delivered assets such that mistakes are not propagated 1 “Broadband and VoD Come of Age: Sony Exerts its’ Enormous Influence”, Multichannel News, March 4th, 2002
throughout the cable system, and then to communicate with the pitcher in case a “repitch” of the asset is needed.
Figure 1: Cable Content Acquisition Process
Metadata can assist in this process by uniquely identifying content assets and re-associating them with intended applications and product offerings. Additionally, it will allow for reassembling the collection of distributed assets such that content (the most time-consuming element in the transfer process) can be sent separately from metadata and other assets.2 Furthermore, validation and corrections (another very time-consuming process) can be automated.3 Licensing details for a particular piece of requested content can also be automatic once the overall contract negotiations for services between the content provider and cable operator are established. As on-demand
2 Metadata is a small fraction of the size of the content file (KB vs. GB). Resending content with metadata whenever a metadata update is required can be a time consuming process especially overlossy networks. Separation of content and metadata can allow for easy updates of metadata while enabling content to be sent over other mechanisms that are more suitable and secure for transferring large files. 3 It can be very time consuming tracking and determining mistakes in the metadata fields once the assets have been ingested into the system because corrections are usually manually inputted. Savings in time can happen if the asset can be validated before ingestion and rejected. This allows for the content provider to correct the mistakes and repitch.
Satellite(s)
Shipping
Internet/VLAN
Studio(s):- Content- Internal/External
Content Provider:- MSO Contracts- QC/ Packaging- Metadata Authoring
Pitcher(s):- Program- Scheduling- Transport
Regional Data Center(s)
Catcher: - Program - Scheduling - Transport - Distribution - Admission
Asset Distribution Server:- Instantiating package- QC/ Packaging
Internet/VLAN
Content Provider Package Transport Cable System

services grow, the content catalogue also grows and becomes more active on a scale that is magnitudes above what is currently done. Automating and distributing some of these processes to acquire content is absolutely necessary at this scale. Having the appropriate metadata fields allows for automation of these processes.
Asset Management
In broadcast, asset management was limited to simple support of initial set-ups for retransmission and remultiplexing of broadcast channels, pay-per-view servers, and local ad-insertion servers. Broadcast asset management was also limited to determining the program channel line-ups on the plant’s physical spectrum. In VoD systems, asset management functions become more complicated because content is stored on distributed servers in the cable plant, and physical spectrum is a resource that is actively managed to service movie requests and peak-usage estimates. Furthermore, the billing system in VoD moves more towards a real-time function that can handle single VoD requests and subscription VoD models.
As on-demand services scale to larger volumes, there will be more application/content servers and distributed storage devices. An elaborate internal distribution system to continually redistribute content and assets via a combination of central distribution and edge-caching servers will need to be supported. The billing and reporting interfaces will need to validate and calculate bills in real-time, taking into account time of day, local marketing offers, subsidized packages (e.g., on-demand with commercials), historical data, order reports, and customer profiles. Lastly, scheduling, determining available plant bandwidth, and call admission strategies will need to be determined on-the-fly in accordance with the volume of requests.
Standardized metadata is absolutely necessary to handle the multitude of asset management and business functions within a headend system on a large scale (see Figure 2). Metadata, such as asset class, can be used to route assets to the appropriate application or content server. Resource allocation algorithms can be developed using metadata fields like “year” to determine whether content should reside at a central server or be allocated to local edge-caching systems. Licensing information can be used to determine availability of content and place this content in service at the appropriate time. Royalty information and user metadata combined with marketing offers would be needed to determine in real-time actual validation and purchase price to the customer. Lastly, for the call admission, or session set-up, bandwidth allocation algorithms that know the runtime of metadata would be helpful in predicting near-term bandwidth capacities. There are numerous other examples. These are just some of the ways a common set of metadata can assist in asset management in the cable plant, especially on a scale that requires automation in its processes.
Figure 2: AMS within a Cable Network
Cable Company:- Contracts
Internet/VLAN
Local Headend(s) AMS Server:- Package -ContentDatabase
- Package ingestion/lifecycle- Announcing PackageQC/ Packaging
VOD Application: - Product Presentation - Guide
VoD Server: - Video Streaming to STB - Support PPV & SVoD - Asset Storage
Headend Operations:- Asset Management- --
BillingReporting
Regional Data Center(s)
Catcher:- Program- Scheduling- Transport- Distribution- Admission
Asset Distribution Server:- Package QC/ Storage- Instantiating package- Announcing Package- QC/ Packaging
Internet/VLAN
Cable System
HFC Network To STBs
Internal Cable Network

Navigation
There is little search capability in the broadcast environment. The EPG serves as the navigator to the consumer. The customer basically looks on the EPG, sees the possible content with some small descriptive information, and the time/channel it will be shown. It is up to the customer to view in person, or to schedule a recording device, when the content is played.
The initial VoD systems are slightly better by allowing an interactive program guide interface. The customer can search for a movie alphabetically and by predetermined categories (e.g., just available, action, comedy, HBO movies). The customer then can see a description of the movie, and maybe the preview, to determine if he likes it. This type of approach can work for limited-size catalogues (under 200 selections) and becomes less friendly as the size of the content catalogue grows.
As the size of the content catalogue and services grow, a better navigation system is necessary. An interactive query device to a database that correlates metadata fields with content becomes necessary. Having the proper metadata fields and elements are required to create a user-friendly search tool for the customer.
With common metadata tags in place, different types of query needs can be easily accommodated with the only restrictions being the type of fields defined, and the way the search tool is set-up. For instance, if someone wanted to watch Spanish-speaking shows to learn more Spanish, they could do a query that would look for country of origin or language option field. In another example, if a customer wanted to watch only Bob Villa instructional videos on building a porch, they could do a combined query on actor, description, application title, and genre. This
ability to query a database for a particular request becomes a useful feature as the size of the on-demand content catalogue becomes unmanageable for traditional navigation interfaces.
Presentation Interface
Printed media is an early form of an on-demand service. Books need to be presented in a manner to the customer such that he/she wants to buy it. If someone does not realize a book exists, chances are that book will not be read. But there are numerous presentation mechanisms that make the user aware and want to read that book. This comes in the form of book lists, print and media advertising, and in word–of-mouth.
Broadcast uses similar mechanisms to advertise its own content. Broadcast channels are a good place to promote content since the chances are a sizeable audience may watch a promo for another show while seeing their favorite program. The drawback is there are only a minimal number of spots with sizeable exposure and some of those spots are needed to sell as advertising spots. As the amount of content increases, there is less opportunity to present each one. But in broadcast as a program grows in popularity, it in turn can become a vehicle to advertise for other content because there is a known viewer audience. This is hard to replicate in an on-demand model and could be one of the reasons broadcast will still exist even though an on-demand service may become the preferred way to deliver most content in a cable network.
For present-day VoD, this presentation mechanism is not fully developed. Typically exposure happens through the EPG, a barker channel showing movie previews and, rarely, a spot on the broadcast. The VoD or SVoD services (not content), on the other hand, may

have lots of exposure via local ad insertion on some of the cable broadcast channels. The only constant mechanism that exposes customers to an unknown particular piece of content is the barker channel. As the content catalogue increases, it would be increasingly hard to give the right exposure to content without targeting first the content to the user.
Metadata can be used to present the content to the intended targeted audience. Using the concept of barker channels, category barker channels could be created based upon genre or a designed market offering. For instance, there could be a barker channel for action movies [genre], $1 offerings [category], or what’s the latest on HBO SVoD [display_as_new and product_offering]. Looking at more integrated solutions, metadata can be used to insert relevant previews for other content [based on genres] within a content that is currently being viewed by the customer (this is like trailers being shown in movie theatres).
Combining this with user metadata, there are even more dynamic ways of targeting content to the viewer. For instance, user statistics can be utilized to indicate those people who like this movie also liked these following movies (this approach is similar to what Amazon.com or some of the Internet audio-on-demand services do). Another approach is to use the customer’s history file, or inputs, to search through a content catalogue and present selected previews that might suit the customer’s preference. This can then be presented on the customer’s navigation or Graphical User Interface (GUI) screen as he is looking for something to watch.
The key idea is that a common, agreed upon set of metadata can enable targeting of content to the user in a passive or active
mannar by presenting the right content for selection to the user. This becomes more valuable as the amount of content prevents the user from making a complete search on his own. In this case, instead of searching, he is presented with a selection of content that might be preferred. This is even more efficient than creating another niche channel in a broadcast environment.
CREATING CONSUMER DEMAND
The mechanisms for creating consumer demand for content in Broadcast are well established. It involves creating program channel brand identity (e.g., American Movie Classics, HBO, Showtime). There are also advertising promo spots in other shows that already have an audience share, as well as advertising in print and media. Lastly, one popular show can lead the audience into another show by simply scheduling it right after (e.g., “Must See” Thursdays on NBC). These various types of methods to create consumer demand capture an audience by:
• Creating an interest in the content through advertising spots that consumers are likely to see;
• Creating a brand for the program channel that will draw an audience that believes any content on this channel will be interesting;
• Using the program order to lead an audience into another piece of content.
Most of the devices to create consumer demand for content in these cases are heavily reliant on the broadcast model.
For an on-demand service, new ways to create consumer demand needs to be developed since a schedule-driven programming approach does not exist. These

new ways will be heavily reliant on making use of metadata for both the content and user. Some possible new concepts are:
Video Magazine This is like having a video version of a National Geographic, Teen Beat, Rolling Stone, MustSeeNBC. Each magazine would contain pieces of content that would be of interest to users drawn towards the brand. The brand of the magazine would create the consumer demand. Some of the brands or indexing in the brands would be assisted by metadata information.
Personal GUI Interface The user would have a personal interface that would suggest content of possible interest for viewing. This content can be acquired by user metadata or by user inputs on content metadata like genre. Similar concepts are already being used in services like TiVO. There are several levels of complexity dealing with managing multiple users (family, individuals in family, etc.) as well as developing a proper user model (i.e., avoiding misinterpretations like my TiVO thinks I’m bilingual when I’m really not). Alternatively, the GUI can also be customized based on region/ethnic information of content and user (e.g., show option for a Yankees baseball game in NYC and a Giants Game in San Francisco).
Spot-Insertion For the right price, even viewers of on-demand content could tolerate promos for other pieces of content while viewing something they ordered. These promos can be selected based upon the metadata of the current content they are viewing. For instance, if a user was watching an action movie, they can be shown promos for other action movies. Promos can also be presented based upon the preferences of the user.
Marketing Offers This could be similar to a lead-in and could be used for recurring series types of content. For instance, a viewer could order the most recent episode of an up-and-coming series and maybe get to view an unaired episode of a popular series Like the Supranos that the same studio is producing. Creating these offers and personalizing them would necessitate knowledge and use of the metadata fields in lots of creative ways.
Availability Windows The on-demand service can support previously made content, but could also support content just becoming available (e.g., 1st release of movies, current episodes of TV series, content direct to on-demand). To automate services based upon availability, this will require knowledge of the license metadata as well as metadata related to types of assets.
Broadcast Target-Insertion The broadcast channel will still hold the largest audience for a single viewing session. The promo spots can be used to promote on-demand content or services. In one approach, the entire audience can view the same promo spot. In a second approach, a different promo spot (but paid by the same studio) can be sent to different viewers based on user metadata and content metadata. A product advertisement can also use a similar approach in both broadcast and on-demand environments.
Search Engines The ability to search for content in as many intuitive ways as possible is highly desirable. To do this, developing user-friendly search engines based on common metadata fields are necessary. This allows the user to tailor individual requests that can query a database (e.g., a Robert Redford fan can locate all movies he starred in as well as directed). Without a search tool, the only other recourse is to develop a guide based upon general, anticipated types of

requests (this will still also need metadata to keep the guide current).
Subscription On-Demand Services A subscription service can create demand by allowing users to sample different pieces of content without paying for each individual item. The user feels that he is paying for a service rather than an individual selection. This concept uses similar viewing habits as developed in broadcast where the user ‘surfs’ the channels for content, and can integrate the users towards trying on-demand services. This can also be a way to promote non-subscription content that needs to be purchased because the subscription service has only a limited choice (e.g., a Sci-Fi subscription service can advertise for the season premier of “Quantum Leap” while offering last year’s episodes on its menu).
CONCLUSION In each of these cases, applications to create consumer demand can be developed around metadata. This process can come from a cable operator, content provider, or third party, but an agreed upon set of common metadata fields are required to develop consistent demand creation applications. An underlying substructure for maintaining constant customer demand is a sizeable content catalogue and service request availability. Common metadata can help in both these back office functions by creating powerful asset management systems that can maintain a large content collection, as well as management of bandwidth resources to minimize denial of service on VoD requests. Lastly, common metadata from both the user and licensing assets would be needed to automate billing functions and data to support these new types of demand-creation opportunities.
REFERENCES
[1] Cablelabs Asset Distribution Interface Specification Version 1.1, www.cablelabs.com/projects/metadata
[2] Cablelabs VoD Content Specification Version 1.1, www.cablelabs.com/projects/metadata
[3] Cablelabs VoD Content Encoding Profiles Specification, www.cablelabs.com/projects/metadata
[4] “Wrestling with On-Demand Services: How to Make VoD a Common Household Name,” D. Defrees, CED, Nov.2002.
[5] “Managing On-Demand: The Impending Challenges of Ramped Up Content,” Y. Gorden-Kanouff, Communications Technology, Sept. 2002.
[6] A Heavenly Collision: when the HD and VoD worlds come together, will operators be ready?,” G Hardin and J. Matarese, CED, Oct. 2003.

TECHNOLOGY TO THE RESCUE – OPTICAL ARCHITECTURES FOR INCREASED BANDWIDTH PER USER
Oleh J. Sniezko, Scott Hunter, Richard D. White
Aurora Networks, Inc., Rogers Cable, Cox Communications, Inc. Abstract The requirements for segmentation levels (or segmentation granularity) have been continuously evolving and have changed significantly since the first HFC networks were deployed. At that time, the main reasons for building HFC networks were amplifier cascade reduction for improved reliability, better EOL performance and improved network level stability. In the second half of the 1990s, a majority of HFC networks were upgraded to 550 MHz and higher badnwdith. However, after the first fiber deployments, the demand for increased interactive bandwdith per user grew significantly due the success of high-bandwidth interactive services.
This paper describes recent progress in some areas of optical and digital technologies that allow a significant increase in interactive bandwidth per user. These technologies enrich the toolbox available to HFC network engineers to increase available bandwidth per user by providing several segmentation alternatives that eliminate the need for additional optical cable construction while reusing existing fibers. Further, we describe some of the optical components that permit significant reduction in the cost of segmentation, the components having been developed for these applications with emphasis on their robustness and flexibility.
This paper also presents segmentation alternatives that take advantage of these new technologies. Several scenarios are possible. Nodes in areas previously upgraded can be segmented to allow independent forward and
upstream paths without the need for upgrade in the fiber and RF coax part of the network. Hence, the capacity per user can be increased without significant capital expenditures. In areas where nodes with a large number of homes per node were deployed earlier, or in new communities growing outside of the existing boundaries, the capacity per user can be readily increased by adding new nodes without adding new fibers on the existing fiber routes and without costly bandwidth upgrades in the RF coax part of the network. Yet in other areas when the network is newly built or rebuilt for the reasons of inadequate cable, bandwidth or components, and in some areas of extensive upgrades, a node architecture with superior capacity per user can be deployed.
This paper presents capital cost savings realized by deploying these solutions with real life examples. Finally, we describe some feedback from field deployments of the segmentation alternatives and the enabling features of the node technology that allow easy alignment and maintenance.
INTRODUCTION
HFC Network Status
Most older tree and branch networks have
been upgraded to HFC networks with 550 MHz and higher bandwidth, with this upgrade process having accelerated over the last decade. The upper limit of bandwidth upgrades has been limited to 870 MHz. There is currently no pressure on or trend toward expanding RF technology beyond 870

MHz. HFC networks have proved their ability to support a multitude of services ranging from traditional broadcast entertainment to telephony services that successfully compete with the services provided by traditional voice service providers.
Traditional Broadcast Entertainment Services
After initial fiber deployments, however,
the demand for increased capacity per user accelerated as well. Because the HFC networks were upgraded over a period of at least 10 years, the node sizes in the networks upgraded in the mid-nineties were significantly larger (on the order of 3,000 to 5,000 households per node) than the node sizes in the networks upgraded in more recent years (on the order of 500 and fewer households per node). Moreover, many communities grew within their boundaries or outside of their original boundaries. In many cases, for today’s segmentation requirements, additional optical nodes would have to be added to the existing nodes. In outlying areas, additional nodes would have to be added to serve new communities. And in many situations, fibers on the existing optical cable routes have been depleted to serve the existing nodes or for other services.
All these segmentation levels have
proven adequate to support broadcast services. Even after the introduction of digital TV, 550 MHz RF bandwidth (even in 5,000 HP nodes) was sufficient to support hundreds of video services. Moreover, even following initial deployments of high speed Internet access services, the node sizes and forward and upstream bandwidth per user could support highly assymetrical high speed data services (given very low P2P traffic and typical customers’ behavior and applications characteristic to dial-up Internet connections).
New Services and Increased Bandwidth per User Needs
With a change in behavior of high speed
Internet access service subscribers, P2P traffic explosion, introduction of VOD and other one demand services (including the possibility of high definition video-on-demand), as well as additional symmetrical telecommunication services (voice), nodes larger than 1000 homes became a liability. Even very coarse calculation shows that VOD with 5% contention (in the number of households served) would result in 50 digital streams in a 1000 HP node (five 64QAM channels for SDTV with 10 streams per channel). After accounting for other interactive services, 6-8 QAM channels may be needed for such a 1000 HP node. Similarly, upstream bandwidth was not sufficient to support the myriad services, especially when shared by more than 500 homes.
All these factors contribute to continous
segmentation activities, especially in those HFC areas that were upgraded in the beginning of the HFC upgrade cycle with large size nodes. Moreover, population growth within the covered area as well as outside its boundaries also requires continous addition of bandwidth capacity per user.
EMBRACING THE TECHNOLOGY
Fortunately, progress in several optical
and digital technologies supported development of optical architecture design tools that result in lowering the capital cost of upgrades to the optical part of the HFC network while taking advantage of the vast bandwidth provided by the RF coax segment of recently upgraded HFC networks.

Optical Passive Components
To fully utilize the optical fiber bandwidth capacity, many independent streams are being transported over fiber deep into the plant. New passive optical modules enable selection of narrowcast information to be forwarded to a dedicated node. These components are located as close as possible to the final node location in order to preserve fiber between their location and the signal origination (hub or headend) point. Only recently, a wide range components from:
• DWDM filters • CWDM filters • Dual-window optical passives
have become available for outdoor applications. The following environmental specification of these components permit their application in the most demanding environments.
Table 1: Environmental Specification of Field-deployable Optical
Components
Parameter Specification Operating Temperature Range
-40°C to +85°C
Vibration Strand Mount Nodes Wind Load
Humidity Up to 95% of relative humidity
The importance of selecting and
maintaining the required quality for these components cannot be underestimated. The plots in Figure 1 show how some components, not properly specified and screened, can behave in the field over the required temperature range.
Insertion Loss (including connectors) vs. Temperature
-10
0
10
20
30
40
50
60
70
-60 -40 -20 0 20 40 60 80 100
Temperature [C]
Inse
rtio
n Lo
ss [d
B]
Brand X: 80 Brand X: 20 Brand X: 95 Brand X: 5 Brand Y: 85 Brand Y: 15 Brand Y: 95 Brand Y: 5
Note:Connector splice joints for Brand X couplers are kept outside of the temperature chamber. Connector splice joints for Aurora couplers are kept inside of the temperature chamber.
Numbers at the legend represents the coupling ratio.I.e. 80 represents the insertion loss curve at 80% output port
Figure 1: Thermal Behavior of Optical Passives of Two Different Brands

2 ¼”2 ¼”2 ¼”
Figure 2: CWDM Wavelength Filters and 1310/CWDM Filters
Pre-Split BC Input
DWDM INP
Out (BC +NCn)
DWDM OUT
BC + NCn
Drop NCn
NCn
Insertion Loss (max)BC to OUT 0.5NC to OUT 1.6NC pass-through 0.5
Operating Temp -40C to 85C
Pre-Split BC Input
DWDM INP
Out (BC +NCn)
DWDM OUT
BC + NCn
Drop NCn
NCn
Insertion Loss (max)BC to OUT 0.5NC to OUT 1.6NC pass-through 0.5
Operating Temp -40C to 85C
Pre-Split BC Input
DWDM INP
Out (BC +NCn)
DWDM OUT
BC + NCn
Drop NCn
NCn
Insertion Loss (max)BC to OUT 0.5NC to OUT 1.6NC pass-through 0.5
Operating Temp -40C to 85C
Pre-Split BC Input
DWDM INP
Out (BC +NCn)
DWDM OUT
BC + NCn
Drop NCn
NCn
Insertion Loss (max)BC to OUT 0.5NC to OUT 1.6NC pass-through 0.5
Operating Temp -40C to 85C
Pre-Split BC Input
DWDM INP
Out (BC +NCn)
DWDM OUT
BC + NCn
Drop NCn
NCn
Insertion Loss (max)BC to OUT 0.5NC to OUT 1.6NC pass-through 0.5
Operating Temp -40C to 85C
Pre-Split BC Input
DWDM INP
Out (BC +NCn)
DWDM OUT
BC + NCn
Drop NCn
NCn
Insertion Loss (max)BC to OUT 0.5NC to OUT 1.6NC pass-through 0.5
Operating Temp -40C to 85C
Figure 3: Dual Filtering NC Wavelength Separator/BC-NC Combiner
In parallel to the increased robustness of
components, innovative packaging allowed their miniaturization. Figure 2 shows the size of some CWDM filters and 1310/CWDM combining or separating filters, while Figure 3 shows a functional
diagram and the relative sizes of some integrated dual DWDM filters used to separate (or combine) discrete DWDM wavelengths with a shared wavelength carrying a broadcast signal (with dual filtration to eliminate ASE components and to achieve increased wavelength isolation).
Digital Technology
Digitization of the upstream bandwidth
has allowed significant performance improvement in link CNR, dynamic range, thermal stability (refer to Figure 4), loss budget and link length (up to 200 km fiber length). Practically, digital links allow for constant level and performance over the entire operational link loss budget and fiber length. This significantly simplifies the link alignment process.
Digital technology also allows for
significant signal processing capability. Two or more independent signals, whether local or remote, can be digitized and time division multiplexed to utilize fiber bandwidth more efficiently and to share transport components (1310 nm and 1550 CWDM or DWDM lasers). Similarly, several digitized signals can be simply added together in a digital domain, thus simulating RF combining (or RF amplifier cascading). Moreoevr, manipulation of the bit stream allows for selective attenuation of the upstream path, thus improving problem troubleshooting granularity and enabling level-fine ingress mitigation without the intrusion of “wink-switches”. These are examples of only the simplest types of signal processing capabilities that can be implemented within digitized upstream bandwidth. Additional benefits include the capabilities of dedicating a communication channel for equipment monitoring and of adding traffic other than the legacy RF upstream (e.g., native Ethernet).

Figure 4: Thermal NPR Performance Stability of Cascaded Digital Links
(8 Links Cascaded)
First5 - 50 MHz
Second5 - 50 MHz
SFF SFF
Second5 - 42/50 MHz
First5 - 42/50 MHz
First5 - 50 MHz
Figure 5: An Example of Signal Processing Capability Inherent to Digitized Upstream Signals
Integration and Miniaturization
Packaging progress and equipment
integration also contribute to the capability of unorthodox expansion of bandwidth capacity per user. Two examples of higher packaging density and integration are presented in Figures 6 and 7.
Figure 7 depicts a module that integrates several modules previously available only as discrete parts. Moreover, it adds a significant functionality for level monitoring and level management for remote single-person level alignment and DWDM balancing. This integration eliminates the need for at least three modules of significantly lower functionality, six optical jumpers and 12 optical connectors, thus
0
1
2
3
4
5
6
0 5 1 1 2 2 3 3 4 4 5
Signal Strength -- - +25 +65

lowering the cost and increasing the reliability of the system. All of this is achieved under the assumption that level monitoring and level management components are also eliminated from the setup with discrete modules. To match completely the functionality of the integrated module (including dual-filtering adavantages discussed previously), significantly higher numbers of discrete modules, jumpers and connetors would be needed.
Miniaturization and integration trends, as well as progress in optical components (environmemtal robustness), obviate costly OTN installations by integrating entire OTN functionality inside a single node enclosure. The OTN-on-the-Strand shown in Figure 7 is capable of feeding 16 nodes with dedicated narrowcast signals while amplifying other signals for more distant locations.
DWDM INP
BROADCAST INP A
DWDM OUT
BROADCAST INP B1
BROADCAST INP B2
Tap#5/Pd #5
Tap#7/Pd #7
Splitter #1
Splitter #3
Splitter #2
Tap#6/Pd #6
#1 OUT
ADD
DR
OP
#2 OUT
ATT#1
Tap#1/Pd #1Tap#8/Pd #8
ADD
DR
OP
#3 OUT
ATT#2
Tap#2/Pd #2Tap#9/Pd #9
ADD
DR
OP
#4OUT
ATT#3
Tap#3/Pd #3Tap#10/Pd #10
ADD
DR
OP
ATT#4
Tap#4/Pd #4Tap#11/Pd #11
Figure 6: Integrated BC Splitting, DWDM Filtering and BC-NC Combining Module
with Level Monitoring and Level Management Capabilities

FA4517S
+7.5 dBm
DT4010-SDX4505-31
FA4517S
Hub on the Strand
OP4508-C-7.1
Dig
ital 1
x1 N
ode
(cas
cada
ble)
Dig
ital 1
x1 N
ode
(cas
cada
ble)
Digital 1x1 Node(cascadable)
Digital 1x1 Node(cascadable)
2.9
km/
0.8
dB
0.4 km/0.15 dB
1.6 km/0.45 dB
0.5 km/0.15 dB
2.4 km/0.65 dB
3.8 km/1 dB
FA4517S
OP31S2D-90-0.9
-10.2
FA4517S
+6.8 dBm
OP31S2D-55
-3.1
-3.8
OP31S2D
-70
-2.1-5.6
8.65 dB
8.2 dB
8.4 dB
8.5 dB
OP31S2D-85
-1.1
-8.5
OP31S2D-55
-3.1
-3.8
+1.25dBm
+1.7dBm
+1.5dBm
+1.4 dBm
OP31S
2D-70
-2.1-5.6O
P31S
2D-8
5
-1.1
-8.5
Padaccordingly
Node 1
Node 2 Node 3
Node 4
DWDM NC Signalsfrom Remote
Headend
1550 nm BC Signalfrom Remote
Headend
DWDM UpstreamSignals from Remote
Nodes to Headend
DWDM UpstreamSignals from LocalNodes to Headend
To and FromRemote Nodes
Figure 7: An Example of a Hub-on-the-Strand Configuration
TECHNOLOGY FACILITATES
INCREASED CAPACITY PER USER
The technology capabilities so far described translate into capability for increasing bandwidth per user at significant capital and/or operational savings. The architectural implementations described below confirmed the saving estimates.
Upstream Bandwidth Segmentation
In areas of large nodes with reasonably
balanced buses, the simplest segmentation option is to segment the upstream bandwidth. Digital technology supports two- to up to four-play segmentation without the need for
additional fiber or wavelength as long as the node platform can be provisioned for separate upstream paths. If the platform does not allow this, one alternative could be to replace the platform while preserving the investment in optical cable and RF coax network. This translates easily into significant capital savings. Figure 8 shows a conceptual diagram of node segmentation with application of digital technology. This segmentation option becomes more complicated when node buses are not balanced. In such cases, a different approach must be applied. One option is to segment the buses with express coaxial cable. Another option is to push fiber deeper and add a node.

MU
X
A/DA/D
HL
HL
HL
HL
BUS1
BUS2
BUS3
BUS4
BUS 1 + 2
BUS 3 + 4
HL
HL
HL
HL
BUS1
BUS2
BUS3
BUS4
BUS 1 + 2 + 3+ 4
From Single Upstream Segment toTwo Upstream Segments
Figure 8: Upstream Segmentation with Digital Technology
From Fiber Scarcity to Fiber Plentiful One of the node segmentation options
would require a separate node. However, with a separate node, additional fibers are needed between the node and the hub or headend if a traditional 1310 nm technology is used. Most of the operators’ HFC design guidelines include rules on the permitted number of fibers per node and per household count. While fiber availability may not be a problem if only few nodes are to be added, in an area previously upgraded with large nodes or in areas growing rapidly within or outside their boundaries, the additional node count for interactive services may easily double the existing node count and so put excessive requirements on fiber count. An example of such a system is presented in Figure 9.
The statistics for the example of Figure 9 are presented in Table 2. With this number of new nodes added and provisioned for future growth of services, the number of fibers required in the main route with the existing optical cable significantly exceeded the number of available fibers when designed with a traditional HFC architecture based on 1310 nm laser technology. Two areas (the one depicted in Figure 9 and a second adjacent area extending on the same cable route) were redesigned with “fiber-save” architecture (distributed DWDM, or “D2WDM” architecture). The required number of fibers on any of the routes dropped to between 3 to 5 with full planned segmentation. The fibers used to feed the existing nodes were actually recovered and available for other services.
Table 2: Upgrade Area Statistics
Summary Statistics for the Implementation Area Number of
Nodes Number of Segments
Shortest distance / lowest loss (1550) from
Keswick
Longest distance / highest loss (1550)
from Keswick Near Future BC from area Headend
22 30 34 0.4 km (0.1 dB) 19.4 km (5.8 dB)

Keswick Headend
139323New
8.2 km
125262Future6 km
125264New
4.2 km
125260Existing5.6 km125258
New6.4 km
125256New
7.9 km125254
New8.5 km
125272Future5.3 km
125266New
4.4 km
125274New
1.7 km
125276New4 km
125268New
3.9 km
125270New
3.5 km
125296New
16.3 km
125298New
19.2 km
125280New
1.2 km
125282New
2.1 km
125278New3 km
143076Existing24.8 km
125304Existing24.3 km
125294Existing12.5 km
125292Existing8.7 km
125290Existing5.6 km
125288Existing4.3 km
125286Existing2.3 km
125284Existing0.5 km
125302New
22.4 km
125300New
21.3 km
125294Future
11.1 km
25.2 km
Legend: headend
existing node
abandoned existing node
future node
new nodes
old cable
new aerial cable
new underground cable
splice enclosure (new to old cable)
125294Future
13.7 km
Expanded Area
Figure 9: Upgrade Area Node and Fiber Route Configuration
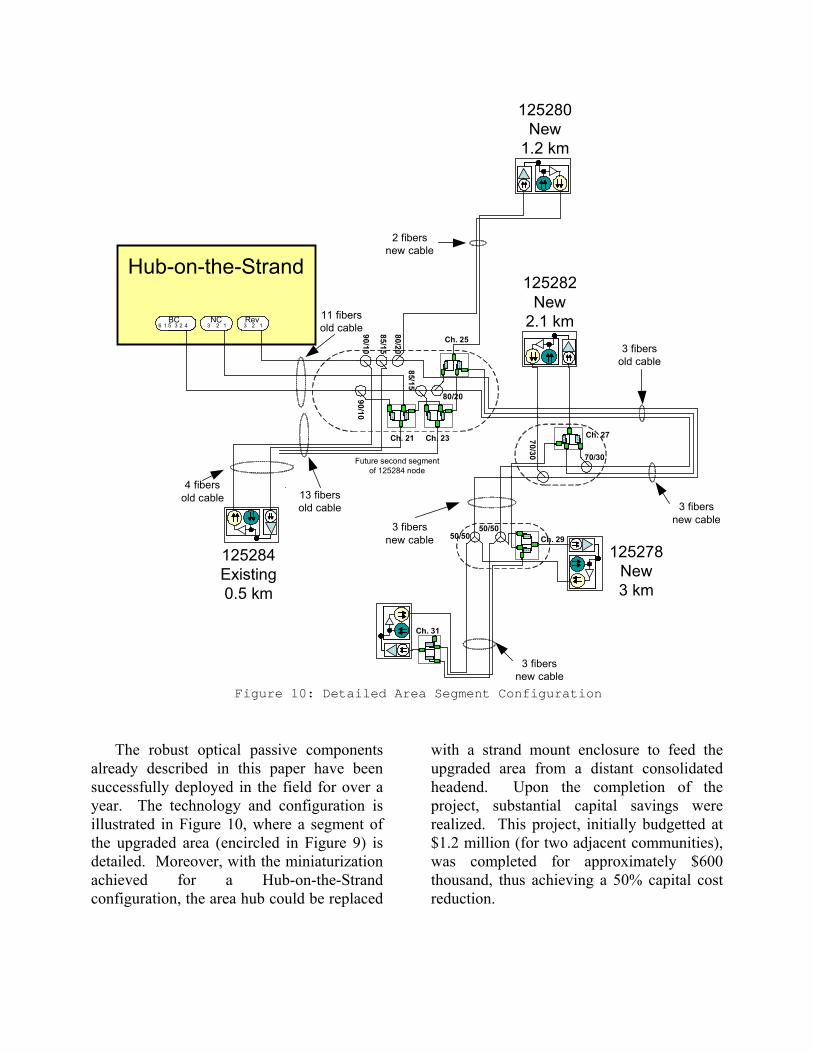
Hub-on-the-Strand
125280New
1.2 km
125282New
2.1 km
125278New3 km
125284Existing0.5 km
BC +NCn
DropNCn
BC +NCn
DropNCn
BC + NCn
Drop NCn
BC + NCn
Drop NCn
BC +
NC
n
DropN
Cn
BC +
NC
n
DropN
Cn
13 fibersold cable
4 11BC NC Rev
3 fibersold cable
2 fibersnew cable
3 fibersnew cable
3 fibersnew cable
BC
+N
Cn
Dro
pN
Cn
BC
+N
Cn
Dro
pN
Cn
4 fibersold cable
3 fibersnew cable
11 fibersold cable 90/10
85/15
80/20
70/30 70/3090/10
85/15
BC +
NC
n
DropN
Cn
BC +
NC
n
DropN
Cn
BC +
NC
n
DropN
Cn
BC +
NC
n
DropN
Cn
Future second segmentof 125284 node
80/20
50/5050/50
2 22 33351
Ch. 21 Ch. 23
Ch. 25
Ch. 27
Ch. 29
Ch. 31
6
Figure 10: Detailed Area Segment Configuration
The robust optical passive components
already described in this paper have been successfully deployed in the field for over a year. The technology and configuration is illustrated in Figure 10, where a segment of the upgraded area (encircled in Figure 9) is detailed. Moreover, with the miniaturization achieved for a Hub-on-the-Strand configuration, the area hub could be replaced
with a strand mount enclosure to feed the upgraded area from a distant consolidated headend. Upon the completion of the project, substantial capital savings were realized. This project, initially budgetted at $1.2 million (for two adjacent communities), was completed for approximately $600 thousand, thus achieving a 50% capital cost reduction.

Bandwidth Wealth The same technological wonders can be
applied to new builds, rebuilds and extensive upgrades areas when the upgrade activity is driven by the need to upgrade the coaxial part of the network from sub-450 MHz to 600+ MHz bandwidth. In this case, the digital and optical technologies permit driving fiber-to-the-last-active (FTLA) at lower cost than or at cost parity with traditional HFC new-build, rebuild or upgrade, and several areas have been built with this approach in mind. An example of the optical design for FTLA architecture is presented in Figure 11.
Several implementations in North America and abroad have confirmed the model numbers and expectations. An example of a system upgraded with this architecture is presented in Figure 12, with a detail design of a selected area presented in Figure 13. Table 3 details cost comparison between the deployed architecture and the HFC architecture after project completion. The final cost was within a few percent of the cost estimates.
1,277 Ft 1,261 Ft
361 Ft
483 Ft
1,685 Ft
2,050 Ft
2,007 Ft
1,276 Ft
Grp A
Grp B
s
s
ss Splice
Closure
s
LegendBroadcast FiberReturn Fiber
Optical Couplers Fusion Splice
Fiber Node
1,277 Ft 1,261 Ft
361 Ft
483 Ft
1,685 Ft
2,050 Ft
2,007 Ft
1,276 Ft
Grp A
Grp B
ss
s
ssss Splice
Closure
ss
LegendBroadcast FiberReturn Fiber
Optical Couplerss Fusion Splice
Fiber Node
Figure 11: An Example of Optical Design for Fiber-Deep or FTLA Architecture

Figure 12: An Area Upgraded with FTLA Architecture

Figure 13: Detail Design of the Framed Segment
Table 3: Cost Comparison after Impelemntation Category HFC700 FD50 HFC$/Mi FD$/Mi HFC$/HP FD$/HP
Headend Optics $45,385 $135,773 $319 $955 $7 $21 Field Optics $39,050 $425,818 $275 $2,996 $6 $65 Fiber Cable $197,314 $410,813 $1,388 $2,890 $30 $62 Power Supplies $105,000 $89,554 $739 $630 $15 $14 RF Electronics $492,358 $14,450 $3,464 $102 $74 $2 Passives $93,323 $84,853 $657 $597 $14 $13 Coax $842,737 $864,260 $5,929 $6,080 $127 $131 Hardware $469,331 $422,770 $3,302 $2,974 $71 $64 Labor $418,410 $329,638 $2,944 $2,319 $63 $50 Subtotal: $2,702,908 $2,777,938 $19,015 $19,543 $407 $421
Variance $75,031 $528 $15

The following list summarizes the experience of the local crew during the first year of operation: • capital expenses at or close to cost parity
with traditional HFC-1000 network • remote monitoring from all nodes at no
additional cost • higher B/W per home passed than in
HFC-700 network • lower power consumption results in
lower operating cost • lower number of actives results in
increased reliability • remote ingress mitigation on all
individual nodes (approximately 100 homes granularity)
• digital return from all nodes.
In this architecture, segmentation steps are practically limited only by the bus size of tens of homes. Figure 14 shows the segmentation steps that allow segmentation of the node cluster down to the individual node, thus increasing the already expanded bandwidth per user by a factor of 5 to 8. Again, the technological advances presented earlier in this paper are applicable. The segementation can be staged in any order (downstream or upstream separately or in parallel) and with any granularity, and can be implemented on an as needed basis without any intrusion into the coaxial part of the network or network powering.
Digital 1x1 Node(cascadable)
Digital 1x1 Node(cascadable)
Digital 1x1 Node(cascadable)
Digital 1x1 Node(cascadable)
Digital 1x1 Node(cascadable)
Digital 1x1 Node(cascadable)
Digital 1x1 Node(cascadable)
Digital 1x1 Node(cascadable)
OP31S2D-xxOP31S2D-xx OP31S2D-xx
-3.4
OP31S2D-EQOP31S2D-xx OP31S2D-xx OP31S2D-xxForward 1550 BC + ITU
1550 NC, or 1550 BC +1310 NC or 1310 (BC+NC)
Reverse is either 1550(ITU DWDM< or ITUCWDM or 1310 or 1550digital
Digital 1x1 Node(cascadable)
Digital 1x1 Node(cascadable)
Digital 1x1 Node(cascadable)
Digital 1x1 Node(cascadable)
Digital 1x1 Node(cascadable)
Digital 1x1 Node(cascadable)
Digital 1x1 Node(cascadable)
Digital 1x1 Node(cascadable)
OP31S2D-xxOP31S2D-xx OP31S2D-xx
-3.4
OP31S2D-EQOP31S2D-xx OP31S2D-xx OP31S2D-xxForward 1550 BC + ITU
1550 NC, or 1550 BC +1310 NC or 1310 (BC+NC)
Reverse is either 1550(ITU DWDM< or ITUCWDM or 1310 or 1550digital
One spare fiber used forsegmenting forward
Digital 1x1 Node(cascadable)
Digital 1x1 Node(cascadable)
Digital 1x1 Node(cascadable)
Digital 1x1 Node(cascadable)
Digital 1x1 Node(cascadable)
Digital 1x1 Node(cascadable)
Digital 1x1 Node(cascadable)
Digital 1x1 Node(cascadable)
Forward 1550 BC or 1310BC
Reverse is either 1550(ITU DWDM< or ITUCWDM or 1310 or 1550digital
Forward ITU 1550 NC(number of wavelengthsincreases withsegmentation)
BC
+N
Cn
Drop
NC
n
BC
+N
Cn
Drop
NC
n
BC
+N
Cn
Dro
pN
Cn
BC
+N
Cn
Dro
pN
Cn
BC +
NC
n
DropN
Cn
BC +
NC
n
DropN
Cn
BC +
NCn
Drop
NC
n
BC +
NCn
Drop
NC
n
OP31S2D-xxOP31S2D-xx OP31S2D-xx
-3.4
OP31S2D-EQOP31S2D-xx OP31S2D-xx OP31S2D-xx
BC
+N
Cn
Drop
NCn
BC
+N
Cn
Drop
NCn
BC
+N
Cn
Dro
pN
Cn
BC
+N
Cn
Dro
pN
Cn
BC
+N
Cn
Drop
NC
n
BC
+N
Cn
Drop
NC
n
BC
+N
Cn
Drop
NC
n
BC
+N
Cn
Drop
NC
n

Digital 1x1 Node(cascadable) with TDM module
Digital 1x1 Node(cascadable)
Digital 1x1 Node(cascadable)
Digital 1x1 Node(cascadable)
Digital 1x1 Node(cascadable)
Digital 1x1 Node(cascadable)
Digital 1x1 Node(cascadable)
Digital 1x1 Node(cascadable)
Forward 1550 BC or 1310BC
Reverse is either 1550(ITU DWDM< or ITUCWDM or 1310 or 1550digital
Forward ITU 1550 NC(number of wavelengthsincrease withsegmentation)
BC
+N
Cn
Drop
NC
n
BC
+N
Cn
Drop
NC
n
BC
+N
Cn
Drop
NC
n
BC
+N
Cn
Drop
NC
n
BC
+N
Cn
Dro
pN
Cn
BC
+N
Cn
Dro
pN
Cn
BC
+N
Cn
Drop
NC
n
BC
+N
Cn
Drop
NC
n
OP31S2D-xxOP31S2D-xx OP31S2D-xx
-3.4
OP31S2D-EQOP31S2D-xx OP31S2D-xx OP31S2D-xx
BC
+N
Cn
Drop
NC
n
BC
+N
Cn
Drop
NC
n
BC +
NC
n
Drop
NC
n
BC +
NC
n
Drop
NC
n
BC
+N
Cn
Dro
pN
Cn
BC
+N
Cn
Dro
pN
Cn
BC
+N
Cn
Drop
NC
n
BC
+N
Cn
Drop
NC
n
OP31S2D-xx
Digital 1x1 Node(cascadable)
Digital 1x1 Node(cascadable)
Digital 1x1 Node(cascadable)
Digital 1x1 Node(cascadable)
Digital 1x1 Node(cascadable)
Digital 1x1 Node(cascadable)
Digital 1x1 Node(cascadable)
Digital 1x1 Node(cascadable)
Forward 1550 BC or 1310BC
Reverse is either 1550 ITUDWDM or ITU CWDMdigital
Forward ITU 1550 NC(number of wavelengthsincrease withsegmentation)
BC
+N
Cn
Drop
NC
n
BC
+N
Cn
Drop
NC
n
BC
+N
Cn
Dro
pN
Cn
BC
+N
Cn
Dro
pN
Cn
BC
+N
Cn
Drop
NC
n
BC
+N
Cn
Drop
NC
n
BC
+N
Cn
Drop
NC
n
BC
+N
Cn
Drop
NC
n
OP31S2D-xxOP31S2D-xx OP31S2D-xx
-3.4
OP31S2D-EQOP31S2D-xx OP31S2D-xx OP31S2D-xx
BC
+N
Cn
Drop
NC
n
BC
+N
Cn
Drop
NC
n
BC
+N
Cn
Drop
NC
n
BC
+N
Cn
Drop
NC
n
BC
+N
Cn
Drop
NC
n
BC
+N
Cn
Drop
NC
n
BC
+N
Cn
Dro
pN
Cn
BC
+N
Cn
Dro
pN
Cn
OP31S2D-xxOP31S2D-xx OP31S2D-xx
-3.4
OP31S2D-EQOP31S2D-xx OP31S2D-xx OP31S2D-xx
Figure 14: Staged Segmentation of Fiber Deep (FTLA) Node Cluster from Single Downstream and Upstream Segments to 8x8 Downstream and Upstream Segments
CONCLUSIONS
The optical and HFC designer toolbox is full of wonder tools. Although these tools certainly amuse us, they have very practical applications in broadband HFC networks where the need for increased bandwidth per user is looming. Whether for significant capital expenditure avoidance or for significant operational benefit, these tools can be used by the designer to the benefit of broadband service customers and hence to
the benefit of service providers. This paper described but a few examples of how today’s optical and digital technology can help in increasing bandwidth per user (resulting in increased customer satisfaction and the continuing competitive advantage of HFC network operators) while lowering capital and operational expenses and taking full advantage of the investment borne during bandwith upgrades of the RF coaxial part of HFC networks.

THE EFFECT OF OCAP MIDDLEWARE ON ITV APPLICATION DEVELOPMENT
Eric Miller Vidiom Systems Corporation
Abstract Cable networks have been active in laying the groundwork for the interoperability of applications for interactive television. By upgrading their physical plants, deploying more powerful set-tops, and pushing for both hardware and software standards through CableLabs, networks are poised to launch OpenCable/OCAP systems in the US. OCAP and the OpenCable standards will have a powerful effect on the development of applications for these networks in addition to building a strong market for the creation of application development tools.
INTRODUCTION For the past 15 years, we have seen the promise of Interactive Television looming on the horizon. Cable, Satellite, and Telecom companies have each, in turn, experimented with different transmission technologies, hardware platforms, and software environments. Each successive generation of trials has provided valuable insight and experience so that the next step down this road seems not quite so insurmountable. Lest we, as technologists become enamored with technology advancements for their own sake, it is important to remember that consumers don't know or care anything about the technology that we are deploying. They care about the services that are offered to them and how using those services changes the way that they think of and interact with their television. That said, we stand on the brink of a radical new transformation of television as a
vehicle for the delivery of entertainment and information in our homes. Having a nationwide standardized platform for the development and deployment of new services promises to fundamentally alter the economics of deploying those services to the public, as much as the standardization of home personal computers created the basis for the internet to explode during the 1990s. This paper will address the historic and emerging forces that have shaped this evolution, focusing on the OpenCable standards in general, and the OpenCable Application Platform (OCAP) specifically. STANDARDS AND INTEROPERABILITY
Historically speaking, the development and adoption of technology standards are essential for the successful deployment of consumer electronics. Open standards create the conditions for many companies to develop products which are fundamentally interoperable with each other. This competition drives down the costs of manufacturing as well as the cost of publishing software and multimedia content for those products. Although some aspects of cable television networks are currently standardized, US cable operators have, with only a few small exceptions, built their networks on proprietary (non-interoperable) systems designed and manufactured exclusively by two companies: Motorola and Scientific-Atlanta. This is about to change due to the OpenCable standards being developed by CableLabs. These publicly available standards specify an end-to-end architecture which will

allow any number of companies to develop truly interoperable products for the US cable networks.
THE COMPONENTS OF INTEROPERABILITY
There are several key components to the interoperability of products and services in the US cable network: transmission systems, set-top hardware platforms, and set-top software environments (or middleware). From an infrastructure point of view, these components are intertwined, yet each has a fundamental dependency on the others. Building a digital two-way network was necessary before advanced service set-tops could be deployed. Similarly, set-tops with a minimum, standardized feature set were required before a consistent software environment could be built which takes advantage of those features. And finally, a common software programming environment is required in order to support the wide scale deployment of applications throughout the country. To bring it full circle, the deployment of those applications is what will, in the end, pay for the network build-out which was necessary to support them. Transmission Systems When I first got CableTV in my house, in 1985, my cable company (TCI) broadcast analog video straight to my "cable-ready” TV. There was no set-top box involved and ordering a premium channel involved sending out a technician to remove a filter from the cable demarcation box set on the side of my house. Those days seem quite remote. Now, we take for granted a digital, bi-directional network. Premium tiers of service are authorized remotely. Digital keys for decryption of those services are sent through the network, to target my specific set-top box(es). The increase in bandwidth has made
it cheaper to broadcast what might be considered a plethora of niche programming, such as the History Channel or HGTV. Although there are different encryption schemes available for use, most aspects of the video broadcast are very highly standardized. MPEG-2 transport streams using QAM modulation schemes combine several digital broadcast channels into the same 6 MHz band that previously carried only one analog channel. Organizations such as the ATSC and SCTE have dozens of standards which govern everything from the wireline protocols for delivery of data over that network, to the size and shape of the F-connector on the back of the set-top box. While interactive services such as those being deployed today would have seemed unthinkable 20 years ago, the cable industry as a whole has done a good job of upgrading their physical plant to the point where bandwidth no longer seems to be a critical barrier for new service deployments. These improvements required a very large capital investment over the last several years, but were fundamentally required in order to support the tier of services which are even now being deployed. Hardware Platforms The second critical element for interoperability is the set-top box. In the mid-1990s, Motorola and Scientific-Atlanta each selected a specific CPU for their respective set-top boxes and, in turn, designed several custom processors for control of the graphics and video displays. Applications, such as the EPG, were written in C and compiled specifically for those processors and their capabilities. This choice of processors and the associated choice of operating systems and API libraries has locked application

developers (not to mention Motorola and S-A themselves) into a compatibility straight-jacket. The vast majority of set-tops currently deployed are based on 8-10 year old designs, with a feature set that is deficient considering the types of applications that we want to deploy today. And while each of those companies has begun to innovate based on those early designs, each incremental improvement implies the need to rewrite all of the applications which run on those platforms, while also maintaining all of the old versions that run on the installed base of legacy set-tops. It is this installed base which represents the next large infrastructural investment required of the network operators, but which, thus far, has proven insurmountable. The cable operators currently own all of the cable set-tops deployed in America, leasing them to subscribers for a monthly fee, built into our cable bills. With tens of millions of set-tops deployed, it would cost billions of dollars to replace them all; an investment which has, so far, been deferred in preference for the upgrade in the physical plant. This has created somewhat of a stalemate. Hardware capabilities, in general, have evolved considerably over the last several years, reflecting continual incremental improvements in CPU speed and the cost of RAM, not to mention greater competition in the business of developing powerful integrated multimedia components. But much of this power remains out of reach. Software Platforms The last element of interoperability for interactive television is the software application development environment, or middleware. The ability of the set-top box to run sophisticated applications is the key to differentiation between broadcast television and the advanced services that we wish to deploy.
And even though the investment in network infrastructure and hardware platforms is significant, it is fundamentally time limited. Once the initial investment is made to build a digital network, the costs of maintaining that network are relatively minor. Similarly, the costs of buying a new set-top will pale in comparison to the cost of writing software for the box, especially when there are dozens, or even hundreds of applications which will run on that box. This comparison is illustrated by the chart below.
Time
Investment
Network Infrastructure H/W Platforms Applications
While this chart is not meant to connote specific dollar values for these activities, the essential message is that investment in developing new applications for a given platform continues long after the investment for building and deploying that platform. One may ask why we don't see this investment taking place today. Even without a completely standardized environment, there are surely sufficient numbers of set-tops in the market to justify the development of applications for those platforms. One factor is the high cost of entry into the application business. Most network operators have a mix of different set-tops in their networks, sometimes upwards of a dozen

different models. And even though there are only two primary operating systems which run on those boxes, older set-tops have not always been updated at the same rate as the new ones are being deployed. This, combined with new features available on the newer boxes, makes for a non-trivial number of hardware/software combinations to target. A second barrier is that an ITV application developer must install a very expensive headend in order to create and test their applications. This initial investment can often approach a million dollars, an insurmountable barrier to most companies. To be fair, however, one could argue that we are, in fact, seeing an increase in the deployment of applications. As the network build-out in support of two-way data traffic has been completed and more headends are being upgraded with Video On Demand servers, a growing number of subscribers are being offered their first taste of interactive television. The limiting factor for wider deployment of advanced services is increasingly the base of set-tops on which those applications must run. OpenCable The OpenCable standards being developed by CableLabs promises to break the interoperability gridlock by lowering some of the key barriers to the development of a mature cable software environment. The most basic element of OpenCable is the standardization of the cable data transmission network. This includes both in-band (IB) and out-of-band (OOB) traffic, as well as refer-ences to industry standards (ISO, DVB, SCTE, and ATSC). The second element of this strategy was the definition of standard hardware platforms. OpenCable defines 3 tiers of set-tops, or more specifically "host devices" (since some newer
TVs have even more processing power than many older set-tops). At the heart of each of these OpenCable hosts is the concept of removable/replaceable security. Any discussion of hardware platforms would not be complete without a reference to Conditional Access (CA) technology. CA is the basis for digital video encryption and creates the fundamental basis by which Motorola and S-A maintain control over the cable network architecture. The FCC has mandated that by July 2006 set-top manufacturers must move the video decryption circuitry off of the motherboard and onto a removable card. CableLabs calls this a Point-Of-Deployment module, or POD. The POD would contain all of the network-dependent circuitry and software, thus creating the possibility of competition in building set-tops or other host devices. OCAP The third component of the solution is, naturally, a definition for a common software environment that the mid- and high-tier devices are required to run. This environment is the OpenCable Application Platform (OCAP). OCAP is based on the Java programming language. This basis has two very strong advantages. First -- there are thousands of Java programmers who will come "pre-trained", as it were, without having to learn a fundamentally new programming language and environment. Second -- Java is machine-independent. A Java application will run on any set-top box, regardless of the CPU or operating system; a key to interoperability. Other advantages of Java include the more general efficiencies of Object Oriented Programming. OOP is proven to reduce software development and testing cycles, especially in the second or third generation of applications, as developers build up the

library of Objects that they can re-use and re-purpose. Similarly, Java applications are much less likely to "crash" a set-top. Null pointers or other software errors are caught by the interpreter, before they cause catastrophic failure. This is especially important for consumer electronics, such as a television, where users have a much higher expectation for reliability. In short, OCAP combines the best features of having a powerful programming language, with the reliability demanded for use by unskilled users.
THE EFFECTS OF OPENCABLE Hardware Design Innovation Defining a standard set of OpenCable hosts has several immediate effects, some of which may, at first, seem contradictory. First, and most radically, separating the Conditional Access circuitry from the core set-top box sets the groundwork for a highly competitive retail market in host devices. European, Japanese, and Korean consumer electronics companies will be able to aggressively enter the US set-top business. This will result in lower prices and more innovation in design. Although standardization and design innovation may seem incompatible, they really are not. There are still many features which are only optional in either mid- or high-tier OpenCable hosts, such as:
• High Definition Support • DVR • External I/O and storage devices • DVD players or writers • Home Networking Interfaces
This is not meant to be an exhaustive list, but represents a number of extensions which are likely to be found in set-tops. Beyond the simple equation of competition, is the notion that set-tops will no longer be bound to maintaining CPU compatibility with older hardware designs. They will be able to make processor decisions based on emerging technologies much more easily, instead of worrying about the cost of upgrading and maintaining different binary versions of every application. This has a rip-ple effect through to the cable operators as well, who will need to maintain and distribute only one version of each application. Consumer-Driven Upgrades One aspect of the retail market effect which is often overlooked, is the fact that people are used to buying new consumer electronics at a fairly high rate. The average computer owner, especially the coveted high end customers, will buy a new computer every few years. The same is true of DVD players and increasingly, even televisions. Ironically, they may have the same cable set-top box that came with their cable service when they moved in to their house. There has been no rationale to upgrade even if they had the opportunity to do so. The availability of advanced set tops at retail, and the attraction of new services which require those set-tops for operation, will act to purge the networks of the lowest end set-tops, without the network operators having to spend the money directly to do so. Better Platforms for Applications In terms of software development, the primary benefit of OpenCable and OCAP is that OpenCable hosts are, as a whole, far more capable than the vast majority of cable set-tops deployed today. Better hardware means that software can do more. There is so little RAM available in most set-tops that

most optional or creative application features are, by definition, impossible to implement. Creative Innovation When the resources of a platform are limited, much of a developer's time is spent trying to figure out how to fit in to the constraints of the environment, not creating innovative new designs. Not only does this result in less interesting or compelling applications, it also drives up the cost of deploying an application. With a common, more powerful platform for the deployment of services, the application developer community can start to build on the successes of each other instead of continually solving the same problems over and over. This acts to drive down their costs, and thus increase the number of applications available. Better Application Development Tools Developer tools become much less expensive to build and maintain when they have only one target, instead of two or three. Knowing that the network operators are all committed to the same platform will increase the confidence of tool developers to invest in this development. Having an open network architecture and a larger number of set top platforms will also drive the development of mini-headends for developers to use. Compared to the cost of a full Motorola or S-A headend today, a developer should be able to get by with spending a small fraction of that amount. Key to this is having open interfaces between the network and set-top, and increasing the potential customer base for those mini-headends. Reducing the Testing Cycle Java applications, as with all applications written in high level, interpreted languages, are inherently more secure and less prone to catastrophic failure. Most real problems are
trapped by the underlying Virtual Machine, long before they spiral out of control by crashing the machine. As well, the use of higher level tools and data-driven application templates means that applications will be “pre-tested”, again shortening the development cycle tremendously. Niche Applications Next, having a larger user base will allow more niche programming. When there is a larger pool of users, even a small percentage of those users can support the deployment of a profitable service. This again, should act to increase the number of applications being written, by broadening the scope of acceptably profitable services. This effect ultimately results in more subscribers electing to upgrade their set tops for access to services, since they are more likely to want the services that are available.
CONCLUSION The groundwork has been laid for the deployment of ITV applications. The network infrastructure is in place and advanced set tops are being built for deployment. OCAP and the underlying OpenCable standards, coupled with consumer demand for more powerful set-tops and services (e.g. VOD and PVR), are the crucial foundations for building a dynamic application developer community. The development of these applications will start slowly, but gain a lot of momentum as more advanced set-tops are deployed. More applications means more tools. More tools, in turn, drive down the cost of producing applications, allowing for more companies to become involved. The bottom line is that application development for ITV will rapidly become much less expensive, which will lead to many new applications and services.

THE TECHNICAL REQUIREMENTS FOR MULTICHANNEL QAM RF MODULATORS
By Ron D. Katznelson, Ph.D. CTO, Broadband Innovations, Inc., San Diego CA
ABSTRACT
This paper addresses the technical requirements and implications for multichannel QAM RF modulators and upconverters and the factors that affect their proposed RF specifications. RF output power levels per channel, adjacent channel noise and broadband noise levels of such a class of multichannel modulators will be discussed. A spectral noise specification mask that is equivalent to that obtained from a combination of multiple identical masks of a standard single channel noise specifications based on power addition will be presented. The power back-off required for maintaining the proposed distortion mask levels as a function of the number of adjacent channels supported by these devices will be presented. A proposed multichannel downstream RF specification standard based on these results will be presented for consideration for a new DOCSIS™ class of high-density RF modulators.
1 Introduction The advent of new digital services such as Cable IP Telephony, Video On Demand (VOD) and other Interactive TV applications places further demands on HFC’s digital spectrum and, in particular, the ability to increase the number of Narrowcast channel modulators deployed in head-ends and hubs. In an effort to save scarce rack space and costs per channel, the cable industry is well on its way on deploying downstream RF modulator devices that incorporate dual adjacent channel QAM signals at a single RF output port. Prototypes having four contiguous channels per RF output port have also been introduced. However, the technical requirements for such multichannel modulators have not received wide scrutiny or published analysis. The following sections will address these matters. Since RF specifications for single QAM channel devices are contained in the DOCSIS
RF Interface specifications [1] (“DOCSIS RFI”), these specifications will form a basis for deriving proposed requirements for the multichannel devices. The basic premise underlying the construction of the proposed noise and spurious specifications for N contiguous channels is that the resulting composite noise performance be no worse than that obtained by combining the allowed noise degradations from N single channel devices that are compliant with the current DOCSIS RFI for a single channel. In the second part of this paper, the required power levels from such multichannel QAM modulators are addressed.
2 Noise and Modulated Distortion Specifications
The current DOCSIS RFI specifications for a single channel are contained in its Table 6-15 under various categories. In what follows, general specification requirements that in this author’s view should be modified even for a single channel operation are addressed and the appropriate changes to account for multichannel operation are subsequently provided.
2.1 In-band (In-channel) Noise and Spurious
DOCSIS RFI entries for this category are given in Table 6-15 as follows:
Total Discrete Spurious Inband (fC ±3 MHz) < -57dBc
Inband Spurious and Noise (fC ± 3 MHz)
< -48 dBc; where channel spurious and noise includes all discrete spurious, noise, carrier leakage, clock lines, synthesizer products, and other undesired transmitter products. Noise within ± 50 kHz of the carrier is excluded.

Unfortunately, both items specified above cannot be measured in practice without actually disabling the QAM modulation. Because much of the in-band noise, (direct spurious, aliased spurious and distortion components) is a result of the actual modulated signal activity, a “clean bill of health” on these unmodulated measures is mostly irrelevant as an indicator for actual performance. Rather, In-channel noise degradations are best measured with QAM modulation turned on. Moreover, in testing DOCSIS QAM sources for In-Channel downstream QAM compliance with ITU-T J.83 standard [2], CableLabs’ Acceptance Test Plan calls for evaluating and measuring I/Q Phase Offset, I/Q Crosstalk, I/Q Amplitude Imbalance and I/Q Timing Skew [3]. It is generally recognized that, in of themselves, none of these attributes including the two In-Channel DOCSIS RFI specifications in the table above, can predict alone the overall In-Channel performance of the QAM transmitter. While careful characterization of each of these individual attributes may be of interest in diagnosing a particular deficient design that may have otherwise shown to fail an overall QAM link performance, they do not provide an efficient overall single measure for satisfactory In-Channel performance. Furthermore, the proof of compliance with each (rather arbitrary) specification value of these attributes is time consuming and expensive, particularly for multichannel devices, wherein each channel in the group would have to be so tested. It is for that reason that the industry embraced the Modulation Error Ratio (MER) measure as the operative criteria that encompasses all the In-Channel attributes in one relevant measure (see, for example, the tutorial in [4]). Degradations in each of these In-Channel attributes will degrade the MER and the amount of such degradation in dB is essentially the ultimate relevant criteria for QAM source performance. In fact, the current DOCSIS RFI already makes use of MER
measures in the upstream channel specifications in its Section 6.2.21.3. We therefore propose that regardless of the number of channels in the device, In-Channel specifications in the DOCSIS RFI for downstream channels be replaced by a single MER specification. The MER value to adopt for such specification is that which would result from the currently permitted degradation factors found in the DOCSIS RFI. Factors we consider as affecting the MER that are already specified directly or indirectly in the DOCSIS RFI are: (a) Inband Spurious and Noise. (b) Phase Noise. (c) I/Q Phase Offset, I/Q Crosstalk, I/Q
Amplitude Imbalance and I/Q Timing Skew.
Item (a) above is specified at -48 dBc in the current DOCSIS RFI and as such, it is one component that would contribute to the overall MER. Similarly, because the I and Q symbol components are assumed to be statistically uncorrelated, the I/Q Crosstalk limit of –50 dB specified by ITU-T-J.83 is another component that would contribute to the overall MER. The other factors are addressed below:
2.1.1 Phase Noise Effects on MER We now need to account for the effect of the permitted DOCSIS RFI phase noise on MER. DOCSIS RFI specifies the permitted phase noise levels in its Table 6-15 as follows:
Frequency Offset Band Double Sided
Integrated Noise Power
Band 1 1 kHz - 10 kHz: -33 dBc Band 2 10 kHz - 50 kHz: -51 dBc Band 3 50 kHz - 3 MHz: -51 dBc
By its very nature, the lack of a specific functional dependence on offset frequency

precludes this type of integrated phase noise specification from uniquely predicting the effect on MER. However, under certain assumptions discussed below, realistic estimates can be obtained. The dependence of MER on Phase Noise statistics is analytically treated in detail elsewhere [5], wherein results were derived for MER measuring systems that computationally derive parameter estimates that account for a linear phase trajectory, as expected in ideal modulation sources having no phase noise. It is shown in [5] that the contribution to measured MER from a source having a stationary phase noise with zero mean is designated by and is given by
)(tϕ
ϕMER
∫ τττ−τ−τ−−=
=
ϕϕϕϕ
−ϕ
T
dRTTTT
R
MER
0
24
1
)()]()([4)0(
(1)
where T is the duration of the observation period having consecutive symbols (often called ‘Result Length’) assumed to be large compared to the symbol time TS and
is the autocorrelation function of the phase noise that can be obtained from the two sided phase noise spectral density by the inverse Fourier transform:
)]()([)( ttER ϕτ+ϕ=τϕϕ
)(ωϕϕS
(2) )2/()()( πωω=τ ∫+∞
∞−
τωϕϕϕϕ deSR i
It is shown that for practical purposes, a relatively tight upper bound for can be obtained by using values of the integrated phase noise over frequency offsets that exhibit an inverse square density decline in frequency. Such square law spectral density decline is exhibited by the Lorentzian density, for which the single sided noise power density at the offset frequencies of interest can be approximated by
ϕMER
(3) 20 )()0(
)(ω−ω
α≅ω ϕϕ
ϕ
RS ;
where 0ω is the carrier frequency and αϕϕ(R )0 is a constant that can be determined by integrating Equation 3 over the frequency band of interest and equating it to a specified (or measured) integrated phase noise value in that band. It is shown in [5] that for such Lorentzian approximation of the phase noise spectral density, the approximate value so derived is given by
(4) TRMER α≈ ϕϕ−
ϕ )0(1521
It is generally observed that in the DOCSIS phase noise Band 2 (10-50 kHz) the spectral density is dominated by a decline in accordance with Equation (3). By integrating Equation 3 over the 10-50 kHz range and equating the dB result to –51 dBc, the value of
αϕϕ )0(R is calculated to be 1.96 sec-1. For a typical MER measurement condition, a result length of 1024 symbols is selected and at a symbol rate of 5.3 Msps, the observation record time is 193 microseconds. Inserting these values in Equation 4 and expressing it in dB, we obtain (5)
dB 43
])0(152[log10)log(10
MERLimit NoisePhaseDOCSIS
10
=
=α−≈
=
ϕϕϕ TRMER
While this result was based only on the data of DOCSIS’ phase noise Band 2, it includes effects from all other bands assuming the behavior depicted in Equation (3) is also present in the other bands. In reality, however, at lower offset frequencies, the

phase noise profile is slightly steeper than a square law, although such lower frequency phase noise deviations are mostly tracked out and thus actual results are likely to be only slightly worse than that derived in Equation 5. Moreover, this limit must be used with considerable judgment, as it depends on the observation period T. Nevertheless, for the purposes of this paper, we shall use the 43 dB result.
2.1.2 I/Q Phase Offset and Amplitude Imbalance effects on MER
We now account for the effect of the permitted DOCSIS RFI I/Q Phase Offset and Amplitude Imbalance on MER. The dependence of MER on such factors is analytically treated in detail in [5], where results were derived for a composite degradation of QAM modulators’ deviation from ideal phase quadrature and I/Q gain balance. It was obtained by assuming that the MER measuring instrument finds the regular undistorted reference constellation that minimizes the mean square errors of the distorted received symbols over the entire reference constellation. For distorted signals having small deviations from the ideal constellation, it is given by
(6) 2
)cos()21(1 21 θδ−−
≈−DMER
where θ is the full axis-to-axis angular deviation from precise phase quadrature and where the I/Q gain imbalance in dB is defined by as follows: δ
(7)
−+
=δδ
11log20 ImbalanceGain I/Q 10
For the worst-case deviations permitted by ITU-T-J.83, one obtains for θ =10 an MERD of 41.18 dB and for =0.00289 (a gain imbalance of 0.05 dB) a value of 50.8 dB is obtained for MERD . When both degradations
exist simultaneously, the worst-case composite MERD is calculated to be 40.73 dB.
δ
2.1.3 Other MER degradation Factors Other factors that generally may affect the observed MER on a given channel within a multichannel setting containing DOCSIS compliant QAM channels are as follows:
2.1.3.1 Nonlinear modulated distortions from adjacent channels
These permitted modulated distortion and noise components that invade the test channel arise out of Band I and II (treated in Section 2.2). Because the test channel demodulator’s Nyquist filter provides appreciable roll-off attenuation within the band-edge where the power density of these components is the highest, these weighted components from two adjacent channels are unlikely to exceed –60 dBc and are therefore negligible for our analysis. However, this observation is by no means a reason to forgo MER measurements in the presence of these adjacent channels, as their nonlinear interaction with other channels within the QAM device generates additional in-channel intermodulation components that are not accounted for above and that must be included in the evaluation.
2.1.3.2 Linear modulator distortions including frequency response and group delay variations
To that end, ITU-T-J.83 specifies a maximum frequency response ripple in the Nyquist band of 0.4 dB peak-to-peak and a group delay not to exceed 0.1TS 1. The DOCSIS ATP2 provides for an "expected" spectral flatness of +0.3/-0.5 dB at the Nyquist flat-band edge, 1 See Figure A8 in J.83, wherein the ripple requirement is set for Annex A, which is included in the Euro-DOCSIS. However, none of the ripple or group delay requirements were incorporated in Annex B. 2 See Section 2.1.6 "CMTS Output Spectrum (PHY-06.1)" of the DOCSIS ATP cited in [3]

although it is not an express requirement of the DOCSIS RFI. Uncorrected, or unequalized, these linear distortions can degrade the composite MER by a few dB. However, unlike the other factors described in the previous sections that cannot be corrected by adaptive equalization available in the decoders, the linear distortion effects of the magnitudes permitted above can be virtually eliminated by the decoder’s adaptive equalizer with negligible loss of noise margin associated with the equalizer’s deviation from nominal response. It is for this reason that the MER measures recommended herein must be performed with adaptive equalization engaged3.
2.1.3.3 MER measurement instrument residual MER and noise floor.
This factor relates to the dynamic range limitation of the measurement receiver and demodulator itself. The residual MER is the value measured by the instrument when feeding it with an ideal QAM source. Although an ideal QAM source does not exist, MER instrument manufacturers specify their product’s residual MER in the 40-43 dB range, depending on product. Actual values normally encountered are in the range of 46-52 dB.
3 The practice of characterizing QAM RF modulators using unequalized MER has recently received some industry acceptance because it has the advantage of providing a single measure for the composite degradations due to channel frequency response and group delay variations. However, this measure includes the test measurement receiver distortions that are difficult to separate from the overall result. Because the frequency response specifications of MER test receivers are of the same magnitude as those permitted for QAM modulators and because instrument distortion that occur in opposite direction to that of the QAM device under test can result in actual measured improvements, these measures are mostly non repeatable among different instruments.
2.1.3.4 MER measurement instrument’s linear and nonlinear degradations due to adjacent channels
This factor is not insignificant because, as we note in Section 2.1.3.1, multichannel QAM devices are best evaluated with all their channels ‘on’. Unfortunately, the adjacent channel filtering and the dynamic range limitation of the measurement receiver cause some MER degradations. Experience with multiple independent single channel modulators has shown that these degradations exhibited by high-end MER measurement devices can reach 0.5-0.7 dB when MER in the range of 43 dB are measured.
2.1.4 Composite MER - Adding it all up By accumulating the MER degradations accounted for in Sections 2.1.1 - 2.1.2 and including the permitted I/Q Crosstalk degradations discussed in Section 2.1 above, we obtain a composite MER of approximately 38 dB as given in Table 1.
Degradation Factor dB Relative Power
In-band Spurious and Noise -48.00 1.58E-05Phase Noise -43.00 5.01E-05
I/Q Phase error & Gain Imbalance -40.73 8.45E-05I/Q Crosstalk -50.00 1.00E-05
Total Relative Power 1.60E-04Composite MER 37.95
Table 1. Accumulation of worst case permitted DOCSIS degradations forming a composite MER.
This means that a single channel QAM source that just meets the current DOCSIS RFI requirements cannot exhibit an MER higher than 38 dB. However, it should be noted that in today’s full digital implementation of quadrature modulation, I/Q Phase Offset, I/Q Crosstalk, I/Q Amplitude Imbalance and I/Q Timing Skew errors are virtually non-existent. On the other hand, Table 1 does not include the MER measurement device’s residual MER floor as

discussed in Sections 2.1.3.3 and 2.1.3.4. Therefore, it would be reasonable to expect that digitally implemented QAM modulators that otherwise just meet the current DOCSIS RFI requirements and that are measured with a typical laboratory MER instrument having a 45 dB residual MER, would exhibit the MER value shown in Table 2 below.
Degradation Factor dB Relative Power
In-band Spurious and Noise -48.00 1.58E-05Phase Noise -43.00 5.01E-05
Meas. Instrmnt. Residual MER -45.00 3.16E-05Total Relative Power 9.76E-05
Composite MER 40.11 Table 2 Accumulation of residual MER and permitted DOCSIS degradations except I/Q degradations.
It is for this reason that, in summary, we propose a single Inband noise and spurious specification to replace those in the current DOCSIS RFI as follows: In-channel Spurious and Noise
40 dB MER, measured with equalized demodulator
2.2 Adjacent Channels In order to provide the DOCSIS RFI equivalent noise mask for multichannel QAM RF modulators, we now account for accumulation effect of the permitted noise levels from multiple contiguous channels.
-15 -9 -3 3 9 15
Frequency Offset from Center Channel (MHz)
Power Density (10dB/Div) Linear filter residual skirt Linear filter residual skirt
750 KHz, Band I
5.25 MHz
Band II 5.25 MHz
Band II 6 MHzBand III6 MHz
Band III
Third Order Regrowth Fifth Order
Regrowth & Noise
Figure 1. Adjacent noise components of a single QAM channel and their DOCSIS mask boundaries.
Figure 1 shows the actual measured power spectrum of a single 256 QAM channel and its related noise components impinging on its adjacent channels. The nearest adjacent region (band I) contains the highest spectral density which in most cases is dominated by the steep residual spillover of the linear Root-Nyquist transmit filter at the band-edge. Digital transmit filters having longer impulse response (more taps and higher gate count) can produce lower side lobe levels. As a consideration for the implementation realities and costs, as shown below, the DOCSIS RFI specifications for this band permits appreciably higher spectral density than that over the next adjacent band, and it has been shown that such allowance produces virtually no degradations to adjacent digital or analog channels. Band II in Figure 1 is dominated by ‘spectral regrowth’ due to nonlinear modulated distortion associated with third order RF gain compression. Band III is dominated by higher order odd order distortions and flat RF noise. DOCSIS RFI specifies the permitted noise and spurious levels for a single channel in each of these three bands in its Table 6-15 as follows:
Adjacent channel (fC ± 3.0 MHz) to (fC ± 3.75 MHz)
< -58 dBc in 750 kHz
Adjacent channel (fC ± 3.75 MHz) to (fC ± 9 MHz)
< -62 dBc, in 5.25 MHz, excluding up to 3 spurs, each of which must be < -60 dBc when measured in a 10 kHz band
Next adjacent channel (fC ± 9 MHz) to (fC ± 15 MHz)
Less than the greater of -65 dBc or -12dBmV in 6MHz, excluding up to three discrete spurs. The total power in the spurs must be < -60 dBc when each is measured with 10 kHz bandwidth.
Figure 2 shows graphically a summary of these specifications wherein, for clarity, the mask does not include the –12 dBmV alternatives or the specification language on –60 dBc discrete spurs.

Desiredchannelsignal
Power in6 MHz isthe 0 dB
Reference 'Other Channels' -Broadband noise
-12 dBmV(- 62 dBc to - 73 dBc)
Band II- 62 dBc
PowerSpectralDensity
Frequency
Band I- 58 dBc
Band III- 65 dBc
Figure 2. DOCSIS spectral mask for a single QAM channel.
2.2.1 Channels Adjacent to Multichannel Sources
Adjacent channel noise specifications are best provided in dBc, as argued below. For multiple channel operation, we adopt an underlying construction of the proposed noise and spurious specifications for N contiguous channels by combining the allowed noise degradations from N single channel devices that are compliant with the current DOCSIS RFI for a single channel.
As discussed below, we adopt the appropriately conservative requirement that ignores the absolute –12 dBmV relaxing alternatives and thus all specifications are in dBc including the Other Channels’ specification that is assumed to be –73 dBc with an output power level of 61 dBmV for a single channel. We denote by N the number of channels in the QAM group and obtain the following noise and spurious specifications in dBc for in the three bands: 2≥N Band I: (Channel Group edge) to (Channel Group Edge +(-) 0.75 MHz):
−+
+<
−−−
•1073
1065
1058
10 10)2(10675.010log10 N
dBc in 750 kHz Band II: (Channel Group edge +(-) 0.75 MHz) to (Channel Group Edge +(-) 6 MHz) :
−+
+<
−−−
•1073
1065
1062
10 10)2(10625.510log10 N
dBc in 5.25 MHz. Band III: (Channel Group edge +(-) 6 MHz) to (Channel Group Edge +(-) 12 MHz) :
{ }10/7310/65 10)1(10log10 −−•−+< N
dBc in 6 MHz. It is also proposed that for practical purposes related to testing and documentation, rounding the results derived above to the nearest integer dBc value would be beneficial. An example for the noise band superposition and calculation results for two channels is shown in Figure 3 while calculated and rounded results up to 6 channels are shown in Table 3.
- 65
- 62- 58
- 65- 73
- 60.24 - 64.36 - 70
- 73 - 73
- 60 - 64 - 70
- 57.9
- 58
Band II Band III AggregatingBroadbandBand I
Figure 3 A dual channel example of adjacent channel noise mask addition and subsequent rounding.
N = 1 2 4 6
ComputedBand I -58 -57.89 -57.86 -57.83Band II -62 -60.42 -60.02 -59.65Band III -65 -64.36 -63.31 -62.47
RoundedBand I -58 -58 -58 -58Band II -62 -60 -60 -60Band III -65 -64 -63 -62
Table 3. Adjacent channel spurious and noise masks in dBc for multichannel QAM RF modulators having N contiguous channels.

It is therefore proposed that these specifications in the form of a table or the equations provided above be adopted for amending DOCSIS for multichannel QAM devices. The language allowing up to 3 discrete spurs of –60 dBc may be kept as in the existing DOCSIS specifications.
2.2.2 Other Channels and the ‘spectrally non-aggregating’ noise exclusion
In its Table 6-15, the DOCSIS RFI specifies the permitted noise and spurious levels for a single channel in channels other than the three bands specified above. The single channel specification is given by:
Other channels (47 MHz to 1,000 MHz)
< -12dBmV in each 6 MHz channel, excluding up to three discrete spurs. The total power in the spurs must be < -60 dBc when each is measured with 10kHz bandwidth.
Because the output power level required by DOCSIS RFI can be as low as 50 dBmV and as high as 61 dBmV, the above noise specification for other channels corresponds to relative noise levels of –62 dBc down to -73 dBc. Even for single channel purposes, it is argued that the above specification is fundamentally flawed and requires amendment. As discussed below, while the -62 dBc noise specification would be adequate for spectrally non-aggregating noise components (defined below), it is much too relaxed for spectrally aggregating noise components. Furthermore, while the –73 dBc was probably intended for spectrally aggregating noise components, it is over-specified by more than 10 dB for spectrally non-aggregating noise components. First we note that maintaining the legacy absolute –12 dBmV limit does not make much sense based on the recognition that even the original DOCSIS specifications’ rationale that gave rise to the absolute level specifications is now unsustainable. Because network combining practices for broadcast and narrowcast services, result in requirements for
absolute levels of QAM signals that can assume a range of levels and may be much lower than 61 dBmV (see comments in Section 3 below), adopting an arbitrary absolute noise floor specification lacks any basis. In fact, doing so would result in rather punishing noise levels, particularly in conditions under which power level settings below the maximum capability are encountered. For example, if a single channel QAM devices is used at a power level setting of 50 dBmV, the resulting allowed relative noise level will be at (–12) – (50) = -62 dBc. For QAM channels that are set 6 dB below NTSC peak sync, this corresponds to –68 dB relative to the NTSC channel. If one assumes that there are 50 such combined devices supporting 50 digital channels in frequencies above the analog tier, the resulting aggregate broadband noise floor impinging on the analog channels will be approximately at -68+10log(50) = -68+17 = -51 dBc, - clearly an unacceptable head-end noise aggregation adversely affecting the NTSC channels. Clearly, a relative specification in accordance with -73 dBc improves the situation in this example by 11 dB. Because relatively flat broadband noise components typically aggregate from multiple combined modulators or upconverters, the modulated distortion components can be at substantially higher level but, by their discrete nature, they spectrally peak on frequencies proportional to the operating frequency and thus do not spectrally aggregate from multiple upconverters tuned to distinct channels. Since no two modulators that are combined to feed a single RF transmission link operate on the same channel, by definition, their harmonics are spectrally non-aggregating. Noise or spurious components that have power levels that do not vary much as the RF modulator device is tuned over frequency are defined as spectrally aggregating components.

For ‘Other Channels’, the current DOCSIS RFI unconditionally excludes up to three discrete spurs in a 6 MHz channel wherein the total power in the spurs must be < -60 dBc. Clearly, such exclusion can be devastating if the allowed components are produced on frequencies that are independent of the device tuning frequency (i.e., spectrally aggregating) because the use of identical modulators on distinct channels would cause these noise components to aggregate. Thus, these components cannot be excluded unless they are spectrally non-aggregating. Similarly, it can be shown that the current noise specification of –62 dBc for ‘other channels’ encountered in low power settings can be accepted for spectrally non-aggregating spurious and noise components. For aggregating spurious and noise components, a –73 dBc specification for a single channel would naturally translate to -73+10٠log10(N) dBc for an N channel QAM RF modulator device. Notwithstanding, this specification might be argued to still be marginal for protecting the analog NTSC service. While reducing (tightening) this specification level further on every channel would achieve the protection goal, it will, no doubt, raise substantially the cost and size of QAM RF modulators and upconverters. Rather, while maintaining the –73 dBc requirement, broadband noise in ‘Other Channels’ should also be specified in the aggregate not to exceed certain levels when aggregating multiple identical devices tuned to distinct frequencies. It has long been an industry practice to specify broadband noise of CATV modulators and upconverters in such a manner [6]. Most MSO’s have adopted head-end guidelines for such aggregate noise floors at NTSC SNR of 65 dB [7]. The NTSC SNR is defined with noise over a 4 MHz bandwidth per NCTA’s recommended practice. To protect the analog channels accordingly, QAM channels inserted
at –6 dB with respect to NTSC peak sync level would have to exhibit corresponding aggregate noise levels in 6 MHz not exceeding –65+6+10log(6/4) = -57.24 dBc. The rationale, the basis, the specification and measurement methods for such 'Self Aggregate' noise attributes in digital channels have been presented elsewhere [8]. For the DOCSIS RFI amendment, our proposal will be based on a very common analog channel boundary of 550 MHz and on having 50 digital QAM channels above that frequency. Thus, the aggregation specification for 50 channels tuned above 550 MHz would become an additional requirement for ‘Other Channel’ noise specifications as proposed below:
Other channels (47 MHz to 1,000 MHz):
Less than -73+10٠log10(N) dBc in each 6 MHz channel, where N is the number of QAM carriers in the group, excluding second and third harmonics, the power in each excluded harmonic must be –62 dBc, and excluding up to three discrete spectrally non-aggregating (carrier frequency related) spurs. The total power in the spurs must be <-60 dBc when each is measured with 10kHz bandwidth. Noise in such Other Channels self-aggregated from 50 equal power contiguous channels situated above 550 MHz produced by the subject device on any 6 MHz channel below 550 MHz shall not exceed –58 dBc.
3 RF Power Levels In adopting standards for the RF power levels of QAM devices that can transmit up to N contiguous channels, we make the following assumptions: (a) The unit may be configured to operate in
fewer than N channels and even in a single channel mode. It should be power efficient in each of the channel setting configurations.
(b) The unit must comply with the multichannel specifications proposed

herein including the adjacent channel modulated distortion noise mask.
(c) The output levels supplied by the unit at each channel number configuration should be sufficient for most head-end and hub configurations.
Thus, it is assumed that proper QAM RF modulator design would fully utilize the available dynamic range subject to the constraints imposed by the DC power consumption, and that such full utilization leaves no excess margin for operating in the single channel mode. It follows that in order to be able to use the same hardware platform under multiple channel settings, the required power back-off from that used in a single channel would have to be that which preserves the relative distortion as indicated above. Unfortunately, the required power back-off as a function of the number of activated channels is more than that which is loss-neutral when compared to practical binary passive combining. Based on extensive experimental results, it was found that the power back-off rate that preserves the relative distortion levels in most active RF stages, is up to 5 dB back-off in going from 1 to 2 channels and up to an additional 4 dB is required for another doubling from 2 channels to 4 channels. Thus, dual channel operation should be set at a maximum level of 56 dBmV and 52 dBmV for 4 channels, providing an optimal DC power consumption under both channel number configurations as well as a single channel.. The proposed power levels are shown in Table 4 below.
1 2 3 4 5 6Output Power Per Channel
(dBmV)61 56 54 52 51 50
# of QAM Carriers per Electrical RF Output
Table 4. Power level per QAM Carrier
In order to further evaluate the adequacy of the resulting levels we propose, we will be well advised to consider two factors relating to (i) actual products having multiple channels and (ii) actual levels required in combining networks. Addressing the first factor above, an indicator for a need of a product category or class is its prior vetting and adoption by MSO's through product purchase decisions and deployment. For example, many of the single channel current RF specifications of DOCSIS were based on the then existing and deployed upconverters' capabilities. As currently proposed the power limits for 1 and 2 channels appear to match that of generally accepted dual channel QAM product specifications that have been recently approved and deployed by MSOs. The majority of these offer a maximum level not exceeding 56 dBmV per channel. It is argued that there have been substantial investments in design and optimization of such dual channel products that can benefit from such standard. In order to address factor (ii) above, it will now be shown that the slightly lower power levels we propose in our table would still leave sufficient margin for all multiple channel configurations when applied in actual head-ends and hubs. Multiple channel devices are predominantly deployed for Narrowcast digital services and not Broadcast digital services. As such, unlike Broadcast RF modulators, signals from RF modulators configured for Narrowcast applications traverse much less combining losses and are subject to very little splitting losses. Given that Narrowcast laser transmitter drive levels for digital QAM carriers are between 10 dBmV to 20 dBmV (see Table 5 below), most reasonably configured Narrowcast combining networks would require RF QAM levels that are no higher than 50 dBmV for single channel uncombined sources.

DFB Laser TX Input level (Per NTSC Carrier)
Input Return Loss
Scientific-Atlanta 6473 Prisma 14 dBmV 16 dBHarmonic PWL 4908/4910 15-22 dBmV 16 dBHarmonic PWL 4912/4914 21-25 dBmV 16 dBMotorola GX2-LM1000B 15 dBmV 16 dBC-COR TA3xxA-xx-3 15 dBmv 16 dB Table 5. RF Interface Characteristics of commonly used Nodal DFB Laser Transmitters. Note that for digital 256 QAM channels, the drive level per channel for all these laser devices is in the range of 10-20 dBmV.
For example, Figure 4 shows a Narrowcast combining network serving service groups split for two nodes (each driven by one DFB laser transmitter) wherein 16 Narrowcast RF sources are combined per service group. In this case, the required RF level from such Narrowcast sources is in the range of 40-50 dBmV, leaving significant margin if a 56 dBmV per channel device is employed. These margins will include a couple of dB for signal monitoring taps and/or general cable losses. The 16-way Narrowcast combiner that can supply 32 channels (assuming a Dual Channel device is feeding each port), provides ample future expansion potential considering that most Narrowcast operations today involve no more than 4-6 channels per service group. In systems having low Narrowcast penetrations, one can employ an 8-way Narrowcast combiner (a total number of 16 Narrowcast channels per service group) permitting replacement of the two-way splitters serving the zones by a 4-way splitter, thereby doubling the number of nodes per serving zone, without changing the RF levels. Thus, it can be appreciated that certain invariance in total loss budgets exist over a wide variety of Narrowcast applications. While other configurations for network combining can be found that differ from that illustrated in Figure 2, their deviations mainly pertain to the treatment of (multiple)
broadcast tiers [9] and much less to the treatment and loss budgets for the Narrowcast services.
Spl
itter
BroadcastAll Zones
Combiner Combiner
Narrowcast Zone 1
To OtherNarrowcast
Zones
To Zone1
To Zone2
To ZoneN
OtherNarrowcast
Zones
Combiners- 4
- 16 - 16
- 28
16Way
- 4
- 3
- 3
- 3- 4
- 4
- 3
Splitters
Narrowcast Zone 1
Broadcast
Narrowcast
TypicalLaser feed
requirementper QAMcarrier
10 - 20dBmV
40 - 50dBmV
55-60dBmV
Figure 4 The RF Level Requirements for Narrowcast QAM Downstream. Numbers shown next to passive devices are their respective insertion loss in dB
Although we have occasionally encountered demands for levels exceeding 56 dBmV per channel in dual channel Narrowcast applications, upon closer examination of the purported applications, it was found that they were mostly due to the expediency of not having to rewire cables and that there appeared to be no sustainable system basis for such requirements. While legacy wiring preservation has some operational benefits, Generally, our experience is that in virtually all stable Narrowcast applications, the total combining loss budget from the QAM modulator to the laser transmitters' input does not exceed 35 dB on a single channel basis. In any event, the DC power savings and the resultant density improvements associated with maintaining the power levels outlined in Table 4 can be instrumental in sustaining very high density Edge QAM systems.

References [1] “DOCSIS Radio Frequency Interface Specification”, SP-RFIv2.0. Available at
http://www.cablemodem.com/downloads/specs/SP-RFIv2.0-I04-030730.pdf . [2] ITU-T Recommendation J.83 Annex B. “Digital Multi-Programme Systems for Television
Sound and Data Services for Cable Distribution”. (April 1997). [3] See Section 2.1.4 CMTS ITU-T J.83 Annex B Compliance (Except Interleaving) (PHY-04.1)
of “DOCSIS 1.1 & 2.0 RFI Acceptance Test Plan”, TP-RFI-ATP. Available at http://www.cablemodem.com/downloads/specs/TP-RFI-ATP-I04-030716.pdf .
[4] Gérard Terreault. “QAM Signal Impairments and Their Effects on MER and BER”. Sunrise
Telecom, (2003). Available at http://www.sunrisetelecom.com/broadband/QAM_Impairment_Effects_on_MER_BER_104.pdf
[5] Ron D. Katznelson, “The dependence of MER on Phase Noise and other Modulator
Impairments in QAM Channels”, Submitting to IEEE publication (2004). Available at http://www.broadbandinnovations.com/pubs/frm-pubs.html.
[6] See the 65 dB aggregate SNR on the front page of Motorola’s Commander® 8 modulator
specifications at http://broadband.motorola.com/catalog/product_documents/C8M_Commander_Modulator_NTSC.pdf) and that of Scientific-Atlanta’s Continuum® modulator at http://www.sciatl.com/customers/Source/750885.pdf
[7] Oleh Sniezko, “Multi-Layer Headend Combining Network Design for Broadcast, Local and
Targeted Services”. NCTA Technical Papers, pp. 300-315, (1997). [8] S. I. Rubin, A. Basovich, B. Petrovic and R. D. Katznelson, "Specifying and Measuring
Aggregate Broadband Noise of CATV Modulators and Upconverters" SCTE Cable-Tec Expo®, San Antonio, TX, June 5-7, (2002). Available at http://www.broadbandinnovations.com/pubs/frm-pubs.html.
[9] See, for example, the configurations described by: Jerry K. Thorne, “Using RF Amplifiers
to Optimize Headend and Hub Site Isolation”. Quality RF Services, Inc. Available at http://www.atxnetworks.com/WhitePapers/RFAmp_OptIsolation.pdf
###
Author contact: For downloading any revisions or corrections of this paper go to:
Ron D. Katznelson http://www.broadbandinnovations.com/pubs/frm-pubs.html Broadband Innovations, Inc. Tel: (858) 395-1440
Email: [email protected]

1
THE TRIPLE-PLAY NETWORK PLATFORM
Ran Oz BigBand Networks, Inc.
Abstract
The convergence of cable services towards IP has been an evolution in multiple steps building upon each other. IP technology is of course end-to-end for high-speed data services, is increasingly driving network transport for all services and media, and is keying the industry’s expansion of voice offerings. There are serious plans in place for increasing the relevance of IP to video as well, even in the home.
The author proposes the emergence of a new triple-play platform that consolidates all processing and communications functionality required for video, voice and data services, by combining the best elements of headend video services platforms and DOCSIS cable modem termination systems (CMTSs). This platform will be standards-based with particular proficiency in IP technologies, but also support for legacy services and devices maintained in the network. The platform promises to key the emergence of far greater service functionality and resource efficiency, and boost the cable industry’s competitiveness, propelling it towards being the leading provider of all services and media to its subscribers.
TRIPLE-PLAY SERVICE NETWORKS
Operator Competition
The operators of different types of access networks including cable, telecommunications, wireless, and satellite, all face steep financial pressures. They are expected to leverage the investments they’ve made in their plants by increasing subscribership and expanding revenue streams.
It is inevitable that operators will pursue growth by confronting each other and expanding into what had been each others’ legacy businesses. In cable’s case, operators are engaged in competition with satellite and telecommunications entities to sustain leadership in video and high-speed data services, respectively. And, cable is expanding its competitive sphere with its voice-over-IP efforts, while, at the same time, rural carrier experiments and fiber access planning by larger carriers indicate the coming intensification of video competitiveness by telecommunications operators.
As each type of operator pursues all growth opportunities, they evolve towards being complete providers of video, voice and data triple-play services, which leads to further advances by emerging innovative services that combine use of the different media. Subscribers have indicated a willingness to accept all electronic services from a single access network and service provider, especially if it holds promises of lower overall costs, functional enhancement and more convenient, consolidated billing and customer care.
Subscriber Diversification
The subscribers to access networks are ushering in the triple-play era by exhibiting interest in diversifying their media consumption experiences. The last few years have seen music go from physical constraint on CDs towards portable MP3 files used by the same person on an array of storage media and personal devices; gaming on both PCs and dedicated consoles move towards wide area connectivity including voice chat among

2
players; and increasing numbers of viewers liberating their television watching from program schedules with time shifting achieved by VOD and DVRs.
Subscriber empowerment trends are proceeding to increasingly address the long-considered question of whether the natural domain for all content and services is the television, the PC, or one for certain applications and the other for others. The long-held stereotype of the TV for “lean back” consumption and the PC for “lean forward” is now being challenged. Some subscribers might prefer one of the devices for all media, whereas for others their preferences vary with time. PC video might be the right medium to accompany routine PC-based tasks like checking email, whereas the TV suits family viewing. Likewise, while the PC is suited for intensive data consumption, viewers are increasingly accustomed to accessing program-relevant data by EPG on TV, and other information, like full cast and crew listings for movies or statistics for sports is a logical extension, and is consistent with many people’s conduct on an Internet-connected PC simultaneous with watching TV. Personal mobility brings into play even more considerations of devices for subscribers, who become increasingly empowered to drive their own experiences. Cable Positioning for Triple-Play With video and high-speed data leadership and good empirical evidence on capabilities to market voice, the cable industry has strong prospects to flourish in triple-play service competition. Advantages include the technical combination of a high bandwidth access medium along with the networking sophistication of the addressable headend-hub-node hierarchy.
This puts cable in good stead to leverage already-made plant investments versus telecommunications handicaps in access bandwidth, and thus richness of media carried, and satellite challenges in two-way addressability, and thus the personalization and interactivity of applications. Another key element positioning cable for triple-play success is the industry’s effective implementation of various standards to assure interoperability among components and enable the emergence of specialized best-of-breed vendors. Several still-proprietary domains remain, as in video conditional access, but the embracing of DOCSIS, PacketCable, MPEG-2 video over MPEG-2 transport, and MPEG over Gigabit Ethernet for VoD, have spurred a more innovative industry providing more choice and richer experiences to subscribers.
INCREASING ROLE OF IP IN CABLE
IP for All Media IP’s role in cable is well established for cable modem Internet access. The industry developed DOCSIS to further standardize the offering, which led to ubiquitous availability, rapid subscriber growth, and open entry by vendors of a range of innovative hardware, software and service offerings . DOCSIS 1.1’s quality-of-service provisions have sparked cable activity in voice over IP. Subscriber interest in the service is also keen, given promise of reduced costs and expanded functionality, while maintaining the quality and reliability expected of voice service. To this point, video has been the one medium over cable least palpably touched by IP protocols. However, on closer inspection, cable has begun to realize the benefits of IP for video. Consolidation has expanded headend service areas, in terms of both population and geography, and transport between facilities has

3
been key. This had been previously done by legacy protocols for video sensitivity considerations, but development of robust de-jittering algorithms has enabled UDP/IP video over Gigabit Ethernet to be used for transport between facilities, even at long distances. Gigabit Ethernet transport has multiple benefits for video, most especially the continuing steep downward sloping of the technology’s cost curve, and the scalability enabled by optical multiplexing and faster Ethernet protocols. There is also an advantage gained in efficient plant management as voice and data IP services are also commonly carried over Gigabit Ethernet. And, Gigabit Ethernet’s IP functionality can be leveraged, as in gauging video at the transport destination, and if there are problems with availability or quality, seamlessly switching by Gigabit Ethernet to an alternative source location.
While IP has yet to move beyond the transport network for television consumption of video, DOCSIS-driven video is also promising. Major League Baseball has demonstrated the viability of premium video offerings to the PC with its providing access to any game for a subscription. The Internet-accessed MovieLink offering from several major studios also commands attention of cable operators considering the availability of titles for their own TV-centric VOD services.
The diversification of cable data services to different speed tiers increases the imperative for more compelling video content available to PCs, in order to justify the subscription expenditure. IP video access also democratizes video production, as people can post their personal clips online for friends and family, or even to try promoting more broadly.
Remaining Convergence Hurdles
While data-to-television and video-to-PC services are becoming increasingly available,
it still remains the case that different devices are predominantly utilized to access particular media and services. Broadcasters desire control over branding, advertising and access and litigiously resist any attempts for their content to move to the PC domain. Interactive television struggles that go back over a decade indicate difficulties that few are prepared to confront in order to bring data to the television, especially when emerging, primarily-video services like VOD and HDTV are providing new growth.
Upstream of the client access devices, convergence also has yet to meaningfully impact the cable transmission plant either. Once content arrives at distribution hubs by converged transport networks, the different services are still de-multiplexed from each other and each session is delivered to the resources and spectrum permanently (and consequently, inefficiently) assigned to it. High speed data, video broadcasting, VOD and other services are assigned to their permanent resource and frequency homes, and IP and MPEG-2 content never co-mingle in the same portion of spectrum.
This arrangement has ever-harsher consequences with increasing variety of services available over cable. Finer and finer assignments are made for nichier services, and there is a high likelihood that when traffic is high, there is excessive demand for some offerings (ex: popular, newly available VOD titles) at a time when it’s lower for others (ex: little voice traffic late at night).
Such phenomena can create denials of service or compromised quality of service, concurrent with poor spectrum utilization. It drives the ongoing consideration of more plant upgrades and other intensive capital expenditure initiatives despite the competitive advantage cable should have in bandwidth availability. More dynamic allocation of spectrum to demand, perhaps through more

4
convergence of video, voice and data increasingly utilizing IP, promises to remedy this. Cable Initiatives
Cable’s long-standing innovative history is currently in a particularly rich period of advances across a range of services driven both by the industry as well as by subscribers. Digital video recording is progressively altering how television is watched and enhancements to this service are coming along, such as multi-room provisioning throughout the home from a single device. DVDs, home video and digital photography drive multimedia PC purchases, which themselves are increasingly engineered to act as server for multiple devices, including televisions. And this is also a trend in which cable is involving itself, as a consideration of the CableHome initiative.
PacketCable is expanding the industry’s device activities towards more involvement with telephones. Within this, PacketCable Multimedia expands the leveraging of DOCSIS 1.1’s quality of service for IP content from voice to greater overall richness and interactivity, including implications for gaming.
And the industry is also considering the use of IP for video, even to televisions, by leveraging the installed, expanding and improving DOCSIS infrastructure. MPEG-4 and related encoding techniques may become the next method of digital video broadcasting and other video services, with better device economics, enhanced even more by the techniques’ bandwidth efficiency gains over MPEG-2.
Interest is increasing in the DOCSIS set-top gateway, or DSG, which could further improve economics and out-of-band spectrum
efficiencies by consolidating all tuning to DOCSIS, receiving video compressed by advanced encoding, and transmitting upstream to the plant, both over IP. This will require headend equipment that delivers content to all video clients, beyond the scope of just the traditional set-top box.
The proliferation of IP technologies from transport to transmission network and through to the home devices is beginning. Yet the legacy installation of MPEG-2 equipment throughout networks and homes, and the high investments made, necessitate that they and their associated techniques be maintained, even as IP spreads further. The carriage of content and services MPEG-2 and IP formats presents key management and efficiency challenges that must be addressed through networks that are more flexible, intelligent and powerful across all media, while enabling increasing leveraging of IP’s inherent advantages over time.
TRIPLE-PLAY NETWORK PLATFORM
Accruing IP Advantages
As cable operators expand their use of IP, further potential advantages arise. For example, UDP/IP over Gigabit Ethernet is already commonly used for the scalable pumping of content from VOD servers, and further IP evolution could lead to use of the protocol end-to-end for VOD, resulting in more server and equipment options emerging from the open standards orientation.
XML is an IP technology that determines and utilizes profiles of subscribers, content and other relevant entities. This could flexibly set profiles on access rights to premium services or pay-per-view / VOD sessions. XML parsing and data transformation techniques spawned by its Internet origins can be carried into the

5
cable subscriber management space, allowing access, visibility and manipulation of information in a way that was previously cumbersome or unenvisioned.
In addition to operator cost savings, subscribers also can benefit from more IP utilization. Some might desire more high performance gear that provides storage and advanced functionality locally while others may desire least expensive, or most portable, customer premises equipment that leverages the service functionality occurring upstream in the network. And subscribers might switch among methods including alternating television and PC consumption of video depending on their situation at a moment.
This diversity of access methods could benefit operators too. As subscribers take more control and responsibility over what they use to access services, they are increasingly likely to take retail ownership of their own devices for this access, and to alleviate operators from current lease arrangements, which bear expensive amortization consequences.
Subscribers diversify the services they access, the media within those services, and the devices they use. Doing so is facilitated by expanding IP utilization and empowerment of the network. Overall benefits are accrued by both the cable network operators and the subscribers they serve.
Responsive Network for IP Triple-Play
Key to emergence of a triple-play network for all media, all services and all devices is the emergence of an intelligent network platform that combines switching and routing with intensive media processing. This platform should be IP-based to take advantage of the protocol’s accruing advantages, but also capable of supporting MPEG-2 and other legacy techniques, to assure that transitions are economical and manageable.
Such a platform can terminate distant or local Gigabit Ethernet links feeding content, and when located at the edge, perform QAM modulation for the accessing subscriber device. At first this could be done in separate QAM outputs for MPEG-2 versus DOCSIS, but these can be combined over the same QAMs. Dynamic downstream spectrum allocation between MPEG-2 transport and DOCSIS, as well as with other service, will allow the operator much more efficient use of spectrum. Trends towards lower cost, lower power, higher density edge QAM technology can be leveraged over DOCSIS and for all services. The inefficiencies of fixed channel allocation by service are overcome.
The resource allocation to achieve any service is simplified on a network employing the triple-play platform. Communications, media processing and physical transmission elements are consolidated in this platform. They are programmable and incrementally available as open pools of resources, to any requiring service, so that those services are deployed with much less pre-set vertical integration of functionality. They can be launched without necessity to precisely plan for take rates, creating risks of wasting resources or exhausting capacity.
A network deployed with all-IP equipment, centralized by the triple-play platform, becomes much more capable of management by highly proven techniques such as SNMP. The platform can also integrate openly into back office and customer relationship software packages to simplify and automate management. Best-of-breed OSS tools that may currently provision cable modems will be able to provision set-top boxes and other future client access devices.
More use of IP also advances better resource management through to customer premises equipment. The network can monitor

6
devices and download necessary capabilities to maintain manageable subscriber environments.
Improved Efficiency
The triple-play platform will combine the best elements of headend digital video platforms and CMTSs to maximize the efficiency of a cable plant that drives increasingly personalized and high quality content. For example, agile transcoding capabilities could allow all content to be accessed from a single source, and adapted on the platform for any subscribing device.
Another technique which could conserve bandwidth through the triple-play platform’s support, is extending RateShaping techniques for bit rate adaptation of video streams to any format or service. Currently this technique is only economically applied to live broadcast content (in which one stream goes to many thousands of subscribers), but with hardware and algorithmic improvements, it should be applicable to any video content, whether live or off of a server, broadcast or unicast, SDTV or HDTV, MPEG-2 or IP. Bursty, best-effort data traffic is ideal to be statistically multiplexed together with variable-bit video streams in order to maximize capacity utilization.
A more IP-controlled plant can dramatically liberate conditional access to all of these types of content. Established IP techniques like RSA key exchanges can be efficiently performed as another boost to plant performance. Authenticated firmware downloads to end-user devices assure long lives and reduce requirements for expensive field visits by the operator. Over time, necessary functions like decoding schemes can be configured from the network.
More resource efficiency gains can be achieved by output QAMs that dynamically allocate their use to any service in demand at
the moment to dramatically boost plant bandwidth efficiency. This can extend to having bandwidth available for commercial data and voice services during business hours and then for various sorts of home use during evenings and weekends. IP’s power and emerging DOCSIS controls can also dynamically balance the allocation of upstream ports to downstream ports, which can become very valuable in consideration of trends like peer-to-peer traffic and multiplayer gaming.
Consolidation of switching and media processing for all services on the triple play platform also can enhance the efficiencies associated with enhancement of service reliability. Powerful flexibility of the platform’s components means that N+1 redundancy schemes, available to any service, can be achieved within the platform very economically. One spare resource could apply to any service, rather than having spare resources within each one.
An intelligently designed triple-play platform can itself be a seat of complete deployment efficiency, by disaggregating its three basic stages of functionality: ingress processing, Ethernet switching and egress processing. Each of these can be scaled in isolation so that the network’s resource allocation conforms to exactly how it’s used. And each can be modified in isolation as well, by software upgrade or modular expansion when possible, generally without disrupting investments in the other elements. For example, a non-blocking Ethernet switching fabric can be enhanced for continuing improvements in speed, scale and reliability, while preserving investments already made in well configured ingress and egress resources. Or, at egress over time QAM technique could be modified from 256 to 1024 while preserving the other two stages. Downstream, upstream and processing enhancement can be

7
by simple blade addition as required to better fit the specific areas’ traffic needs.
Functional Enhancement
The triple-play platform as an anchor for more IP deployment generally throughout the network facilitates ongoing enhancement to the service functionality available. An early illustration, achieved differently, is in the current collaboration between satellite and telephony operators that displays incoming caller ID to the television set. All-IP networks can do this even more robustly, able to distribute such information to any connected device in the home. Viewers could use the open standards and rich functionality available on their television and/or its associated devices to browse any information from the Internet that’s relevant to what’s being watched. And interaction no longer needs to involve the disruption of picking up a telephone – remote controls or other devices can drive ordering something that’s advertised, or voting on a reality television show. From the network side, IP-related standards like IP MAC addressing could better personalize distribution, as in a demographically oriented, precisely targeted advertisement, with anonymity maintained.
New services can be rapidly launched and experimented with, either throughout the operator’s network, or by the subscriber in the
home. These can be dynamically scaled up if popular, or down if not. Video conferencing, unified messaging and telemetry are examples of new services, driven through a triple-play platform infrastructure on which cable operators could enhance subscriber loyalty and drive new revenues.
Overall, a more IP network driven through a triple-play platform, vastly expands functional possibilities for subscribers. This is largely, but not exclusively, driven by the operator’s own services that it makes available. There is also an attractive democratization in that subscribers can leverage open, available protocols to set their own service environments, including retail-purchased elements, and even embark on their own service provisioning towards other subscribers, in partnership with their cable operator
AUTHOR CONTACT
Ran Oz Chief Technology Officer [email protected]
BigBand Networks, Inc. 475 Broadway Redwood City, CA 94063 650 995 5000 http://www.bigbandnet.com

Yield Management: Turning Bandwidth into Bucks
Robert F. Cruickshank III Daniel J. Rice
Stargus, Inc. Abstract This technical paper examines how analyzing customer bandwidth consumption and optimizing MSO RF network capacity can provide detailed insight and actionable information to increase the yield (i.e. utilized traffic carrying capacity) and profitability of DOCSIS™ networks. This paper begins with a discussion of current bandwidth measurement approaches and their challenges. An alternative is then discussed and results are presented—from a software-based approach that uses the deployed cable modems and CMTSs as network 'sensors' to collect and analyze the upstream and downstream usage (and many other variables) on a per-subscriber level in hourly increments. This information is critical for enabling cable operators to assess the impact of Peer-to-Peer (P2P) and other applications and overall network performance for Voice over Internet Protocol (VoIP). This paper then provides a detailed overview of the process for optimizing DOCSIS networks to improve network capacity, performance, availability, and reliability by recommending and setting the appropriate configuration parameters for each CMTS RF Interface. Given the dynamic nature of HFC networks, deployment experience demonstrates that a single channel width, modulation and error correction configuration (i.e. a single modulation profile) is not effective for all RF interfaces. Field results show that network optimization has at least a doubling effect on the capacity and performance of DOCSIS networks.
INTRODUCTION
Cable Operators (MSOs) around the world have built a far-reaching DOCSIS-based infrastructure that increasingly supports voice, video and data services. In the first quarter of 2003 about 1.5 cable modems were installed every second during business hours worldwidei. By the end of 2003 there were over 30 million modems deployed worldwide.ii As an industry, to maximize yield and profitability, we must understand the Customer Experience, what our customers’ do to our networks, and how our networks react to our customers’ actions.
CURRENT BANDWIDTH MEASUREMENT APPROACHES AND
THEIR CHALLENGES Consumption monitoring in DOCSIS networks describes the process of measuring the amount of bandwidth resources consumed by each subscriber in the network, then processing those measurements in order to support operational, accounting or other business practices. There are four general steps common to any Internet-based consumption monitoring technology: Collection: The process of accurately and reliably harvesting bi-directional consumption data from the network element layer on a per-host or per-subscriber basis. Processing: The application of algorithms to the raw collected data to ensure data-integrity, remove measurement protocol overhead and compress element data into a processed consumption detail record.

Persistence: The data storage required for consumption information in order to support business practices. This persistence timescale can range from the order of minutes to years. Presentation: The ability to present consumption information to various organizations or facilities within the OSS infrastructure. This includes the automated distribution of consumption records in order to enable billing mediation, traffic engineering, capacity planning, marketing research, abuse detection and other accounting management practices. Although some technologies currently exist to address these requirements in the Internet today, almost all of them fail to meet the unique technical challenges inherent in the monitoring of large-scale DOCSIS networks. This section compares three methods for the monitoring of per-subscriber, bi-directional data consumption in order to determine the optimal method for DOCSIS networks. The three methods include:
1. Intrusive packet capture 2. Non-intrusive packet capture 3. Non-intrusive element polling
Intrusive Packet Capture
The intrusive packet capture method collects network usage data by use of passive "probes" inserted directly into the data path. All packets passing through the probes are captured and processed in order to determine per-host or per-user consumption. Strengths: DOCSIS protocol independent: The DOCSIS 1.0 protocol does not include a mechanism to furnish the capture of application type (by port number). Intrusive packet capture does not rely on the DOCSIS protocol and therefore provides application
layer visibility in pre- DOCSIS 1.1 and proprietary cable modem networks. Vendor independent: Does not rely on any proprietary functionality in the CMTS or backbone network elements (switches, routers). Data can be collected without interfacing to network elements. Weaknesses: A lot of missed traffic: Although much of DOCSIS network traffic is forwarded to/from the Internet, a majority of traffic may remain local to the CMTS, forwarded either within the same MAC domain, or to other MAC domains contained in the CMTS (e.g. on college campuses). This local traffic will only increase as next generation DOCSIS CMTSs evolve to higher densities (up to 100,000 CMs) and more applications, such as IP telephony, peer-to-peer, and video conferencing, run over the network. Because the intrusive probe typically captures traffic upstream of the CMTS, it cannot see this local intra-CMTS traffic. Scalability: Because intrusive capture is typically based on inserting a probe in all possible paths to each CMTS, a 1:1 relationship between CMTSs and probes results. This leads to a very high number of additional network elements making this an operationally complex and economically unattractive method. Point of failure: Because the intrusive probe is inserted directly into the data path, installation requires a scheduled network outage. After installation, network availability becomes dependant on the availability of the probe. Any redundancy or hot-standby solution for high availability would double the number of probes, resulting in two probes per CMTS.

Dynamic addressing: Because the packets are captured by the probe beyond the DOCSIS segment, only a CPE's IP address can be used to determine the packet's origin. Due to the nature of DOCSIS networks, CPE IP addresses are generally dynamic which does not create an authoritative relationship between packets and their CM origin (Hardware Address). In order to resolve this, integration with the provisioning system is required, adding additional cost to the solution and creating an opportunity for poor usage-data origin integrity. Physical co-location: This method requires that packet capture probes are co-located with each CMTS. If the MSO supports a distributed HFC architecture (digital hubs, micro-head ends) additional rack space, installation and maintenance costs are incurred. Port unknown. Although application layer visibility is provided through this method, a large percentage of packets are not associated with well-known ports. In addition, popular peer-to-peer applications use configurable ports making the application type invisible. DOCSIS unaware: Because the packet capture is conducted upstream of the DOCSIS segment at layer 3 and above, this method does not provide any layer 2 (DOCSIS MAC) visibility. Both Service Identifiers (SID, DOCSIS 1.0) and Service Flows (SF, DOCSIS 1.1) are invisible to the probe. As a result, each packet cannot be associated with a DOCSIS service profile or packet classifier in order to determine the quality of service it has been assigned. While it is possible to move the intrusive packet probes further upstream in the network to minimize the number of probes required, this drastically increases the amount of traffic that the probes miss and defeats the purpose of consumption monitoring. It is also not clear
whether the probes’ I/O cards can handle the faster line speeds upstream in the network without turning into a bottleneck. Non-Intrusive Packet Capture
The non-intrusive packet capture method assumes that all CMTS traffic is aggregated at an edge switch or router. The probe is attached to a port on the switch or router and promiscuously captures packets passing through all interfaces (i.e. port spanning). Note that probes could be attached to the CMTS devices themselves, but this configuration would result in a 1:1 relationship between probes and CMTSs, offering a solution that is not economically viable. Strengths: DOCSIS protocol independent: Has the capability to capture application layer traffic independent of DOCSIS protocol version. No point of failure: Unlike the intrusive approach, this method does not introduce a point of failure into the network. Weaknesses: A lot of missed traffic: Like the intrusive packet capture method, the non-intrusive method is unable to view the traffic local to the CMTS. As stated, a configuration capable of capturing all packets would require a single probe provisioned for each CMTS. Again, this would prove economically unfeasible. Third party vendor dependent: Assuming the probe is attached to the edge switch aggregating CMTS traffic for a headend, the probe depends on proprietary functionality in the switch that forwards all CMTS traffic to the capture probe. The extent to which all CMTS, router and switch vendors implement and support a proprietary form of this functionality is not certain and introduces the

possible need for further development and integration work. Network performance impact: The additional resource burden on the aggregation switch to direct all inbound packets to the capture port is not negligible. This effort may impact the performance of the switch or router's packet forwarding capability in large-scale production networks. Scalability: Although this method requires fewer boxes than the intrusive approach, there are still a high number of probes required to ensure that all inter-CMTS traffic is captured. Dynamic addressing resolution: Like the intrusive approach, the mapping of traffic to source CM requires integration with the provisioning system and introduces potential data integrity issues. Physical co-location: This method requires that the packet capture probe is co-located with the aggregation switch or first upstream router. If the MSO supports a distributed HFC architecture (digital hubs, micro-headends) additional rack space, installation and maintenance costs are incurred. Port unknown: Although application layer visibility is provided through this method, a large percentage of packets are not associated with well-known ports. In addition, popular peer-to-peer applications use configurable ports making the application type invisible. DOCSIS unaware: Because the packet capture is conducted upstream of the DOCSIS segment at layer 3 and above, this method does not provide any layer 2 (DOCSIS MAC) visibility. Both Service Identifiers (SIDs, DOCSIS 1.0) and Service Flows (SF, DOCSIS 1.1) are invisible to the probe. As a result, each packet cannot be associated with a DOCSIS service profile or packet classifier in
order to determine the quality of service it has been assigned. While it is possible to move the non-intrusive packet probes further upstream in the network to minimize the number of probes required, this drastically increases the amount of traffic that the probes miss and defeats the purpose of consumption monitoring. It is also not clear whether the probes’ I/O cards can handle the faster line speeds upstream in the network without turning into a bottleneck. Non-Intrusive Element Polling
Because of the limitations of both intrusive and non-intrusive Packet Capture, we propose a new method known a non-intrusive element polling. Non-intrusive element polling leverages the network management instrumentation already embedded in the DOCSIS network and the remote collection of consumption data through the use of the Simple Network Management Protocol (SNMP). Strengths: No missed traffic: Unlike both intrusive and non-intrusive packet capture methods, the polling method derives consumption data directly from the entire DOCSIS network down to the individual CPE device (CM, MTA, etc.) level. As a result, there are no missed intra-CMTS packets. No point of failure: Unlike the intrusive approach, this method does not introduce additional points of failure into the network. Scalability: Relative to the other methods, a small number of probes are required to collect data from the entire network. No physical co-location: Remote polling is conducted over IP allowing for the probes to exist at any location within the network

infrastructure. This results in reduced configuration, operations and maintenance costs. Vendor independent: Non-intrusive element polling is independent of vendor infrastructure (CMTS, switches, routers) and does not rely on proprietary vendor functionality to monitor consumption. DOCSIS aware: Unlike both packet capture methods, the element polling method has been adopted by the cable industry for the monitoring of DOCSIS networks. As a result, polling provides visibility into layer 2 of the DOCSIS network and can monitor service flows and quality of service in the DOCSIS segment. With the adoption of DOCSIS 1.1, application layer visibility will be embedded in the CMTS.
Functionally extensible: Because of the nature of SNMP and the extensibility provided by MIBs, the polling method can be used to gather other operationally significant data from the DOCSIS network related to traffic consumption (interface utilization, etc.). Weaknesses: DOCSIS protocol dependent: Application-layer visibility is introduced in DOCSIS 1.1 networks. Meanwhile, because DOCSIS 1.0 limits traffic visibility to layer 2 (octets in/out by SIDs), Performance impact: If not engineered properly, management traffic generated through polling the DOCSIS network can negatively impact network performance.
Figure 1: Bandwidth Utilization of Top 5 Most Congested of 88 Downstream Interfaces
Figure 2: Bandwidth Utilization of Top 5 Most Congested of 450 Upstream Interfaces

CURRENT BANDWIDTH MEASUREMENTS
Once Consumption data is collected with non-intrusive element polling, analytics may be applied to determine which downstream and upstream interfaces are most congested. Figures 1 & 2 show an MSO’s most congested channels; note how much of the time the channels are way underutilized! Notice the daily peaks and valleys in utilization. During the hours after midnight and before sunrise the DOCSIS network is way underutilized. Considering that Figures 1 & 2 show the most congested channels, every other channel is even less utilized than the ones shown here. In summary, there certainly is a lot of “fallow” capacity throughout this network (empty transmission opportunities that are not being used to transport customer data). Surely the
pipes can be “filled up” more often and yield management increased. It would make business sense to find ways to “fill the pipes” during off-peak periods, as Telephone Companies did years ago when they used to discount, incent and encourage off-peak usage (in their case after 5 PM).
OTHER IMPORTANT FINDINGS Non-Intrusive element polling may be used to collect other DOCSIS parameters (in addition to consumption) that further show how the network reacts to customers’ actions. For example, every packet traveling upstream from the customer typically has Forward Error Correction (FEC) redundant coding applied which attempts ensure that bit-wise packet errors (due to noise, etc.) can be “recovered” without retransmission.
Figure 4: Uncorrectable Error Rate of Top 5 Most Errored of 450 Upstream Interfaces
Figure 3: Correctible Error Rate of Top 5 Most Errored of 450 Upstream Interfaces

The derived DOCSIS parameter known as Correctible Codeword Error Rate (CCER) shows the percentage of packets that have been “recovered” from an errored state. Figure 3 shows the worst upstream CCER interfaces. Notice that at times as many as 40%–60% of all packets on certain channels were being recovered automatically by the DOCSIS network. Another derived DOCSIS parameter known as Uncorrectable Codeword Error Rate (CER) shows the percentage of packets that have been “unrecovered” and are forever lost in the VoIP case (or possibly retransmitted for other TCP/IP applications). Figure 4 shows the worst upstream CER interfaces. Any time that any of the interfaces peaks above 3% CER, VoIP call opportunities are lostiii. Notice that the interface indicated by the top (red) line in Figure 4 would not have been able to support any VoIP calls for any subscribers during most of the first half of the week.
OPTIMIZING DOCISIS NETWORKS
Today many last mile networks are operating with impairments and inefficiencies that are tolerated by email, web surfing, and other less data intensive or less time critical applications. Because of the FEC built into DOCSIS and the resilience of Transmission Control Protocol (TCP), these errors are largely unobserved by and unaffecting to broadband customers that are unaccustomed to the intermittent start-stop nature of web surfing and email. However, advanced, IP-based services such as VoIP, video-conferencing and streaming audio/video are rendered inoperable by such errors and inefficiencies. Error levels often get worse over time and are typically associated with transient noise and interference due to HFC plant problems. While email and web surfing mask these low
error levels, these latent and worsening HFC plant problems are often undetected for months until customers become exasperated with the performance of their applications. A degraded subscriber experience results in operating inefficiencies such as heightened customer care and network maintenance costs, as well as subscriber churn. By using the capabilities built into DOCSIS, the errors and inefficiencies can be minimized through configuration optimization, thereby allowing MSOs to defer capital expenditures, reduce operational expenses, and ready their infrastructure for advanced IP-based services, particularly VoIP. Optimization Goals When designing or operating digital data communication systems, there are several goals that help drive system optimization: Goal 1: Transmit as much data in the shortest amount of time possible through the system. Goal 2: Transmit this high rate of data using as little of the physical resources (spectral bandwidth and power) as possible. Goal 3: Transmit this data reliably at a much lower rate of errors than will impact the performance or reliability of any of the services. Goal 4: Develop and operate this system with as little expense and complexity as possible. The challenge is that these four goals are not completely independent. The error performance and the capacity of the network are interdependent and must be managed together for a quality customer experience.

Method for Optimization DOCSIS Cable Modems (CM), Multi-media Terminal Adaptors (MTA), Advanced Set Top Boxes (ASTB), and Cable Modem Termination Systems (CMTS) can all be utilized to detect and manage errors while providing bandwidth intelligence data. In so doing, the DOCSIS network can be configured to "four wheel drive" through most service affecting errors – errors that otherwise result in degraded or complete loss of service to subscribers - while maintaining optimal bandwidth capacity. This can be accomplished while notifying operators of degraded network quality before it becomes service impacting, as it occurs, and also providing isolation and identification of the faults. CMTS vendors ship their equipment with default modulation profiles that are extremely conservative, and significant opportunities exist to reap additional capacity and error protection from DOCSIS networks based on actual network conditions. The DOCSIS 1.0 – 1.1 – 2.0 specifications compromise a progression of features that result in ever-increasing efficiency and capacity, but configuring these networks’ elements has become increasingly complex. As a result, capacity and error protection optimization techniques have become increasingly critical to successful deployments of VoIP services. The technical expertise required to manually adjust DOCSIS parameters is significant. Moreover, RF levels within HFC networks are prone to fluctuations, both periodic and random, and continual use of an automated system to monitor levels can reduce the operational expense of attaining and maintaining optimal configurations. There are many different “knobs” and “levers” that are available in DOCSIS networks that can be tuned to enable capacity optimization and
packet error protection, including many parameters for the downstream and upstream signal path. All these parameters are dependent on one another and optimizing them needs to be considered as a collective task. For example, increasing the symbol rate without optimally setting the mini-slot size and codeword structure will result in much less capacity gain than would be expected. Additionally, setting the mini-slot size incorrectly can make large PDUs impossible to transmit. This process is iterative and continual – certain parameters such as FEC (“k” codeword size and “t” correctable bytes), SLC (Shortened Last Codeword), and max burst size should be adjusted and the results analyzed over a period of days. After the results are known, further adjustments can be planned, including the analysis of modulation order, minislot size, and symbol rate. Over time as RF levels fluctuate, periodic adjustments will ensure optimal network performance. Using this technique of methodical and measured change, an optimal network configuration can be reasonably and cost-effectively attained and maintained without undue risk of network instability, but is necessary to constantly collect and analyze network data.
PROTECTED TRAFFIC AND NEWLY AVAILABLE TRAFFIC CAPACITY
Adjusting the many DOCSIS configuration “knobs” and “levers” in an automated way results in the right level of packet error protection for all traffic and a huge gains in overall traffic capacity. Field experience shows that small portions of the HFC network require extreme error protection and low transmission speeds – while the vast majority of the network can run at extremely high speeds. Figure 5 shows a relatively noise-free interface whose configuration, over the course

of a month, was changed from QPSK @ 1.6 MHz to 16QAM @ 3.2 MHz. The upper jagged (pink) line represents the channel utilization, indicated on the right hand vertical axis, which initially peaks at 80%-90%. With the added capacity from optimization utilization is reduced to routinely below 25%. Moving downward, the flat (thin light blue) line represents the unique CMs (subscribers) on this upstream, the jagged (thick dark blue) line shows latency due to high utilization (peaking every evening as expected), and lastly the lower oscillating (thick red) line shows the number of CMs (subscribers) active over time. Experience shows that virtually all upstreams can be optimized to operate error-free for high-quality, high availability VoIP service. In addition, as much as 2/3 of all HFC upstreams can be optimized to operate at much higher transmission speeds—which further incents MSOs to consider ways to increase yield management.
CONCLUSION In order to maximize yield and profitability, we must understand what our customers’ do to our networks, and how our networks react to our customers’ actions. Non-intrusive element polling is the best way to measure the impact of customer traffic— and the corresponding response of our networks. Measurements show that our networks are often underutilized and that we as an industry have opportunities to increase yield management. Non-Intrusive polling can also collect DOCSIS performance metrics that can be utilized by an automated system that optimizes HFC packet error protection and network capacity so that VoIP works reliably throughout the network. This optimization results in overall double or better capacity gains—resulting in even greater opportunities for yield management. i Source: Cable DataComm News Report, 2003 ii Source: In-Stat/MDR Report, 2003 iii "Network Tolerance of Highly Degraded Conditions for an H.323-based VoIP Service", Peter Holmes, Lars Aarhus, Eirik Maus, Norwegian Computing Center, P.O. Box 114, Blindern, Oslo, Norway
050100150200250300350400450500
1/28
1/29
1/30
1/31 2/1
2/2
2/3
2/4
2/5
2/6
2/7
2/8
2/9
2/10
2/11
2/12
2/13
2/14
2/15
2/16
2/17
2/18
2/19
2/20
2/21
2/22
2/23
2/24
2/25
2/26
2/27
2/28 3/1
3/2
3/3
3/4
3/5
3/6
0102030405060708090100
latency active-cms unique-cms util
Opt1
Opt2
Opt3
Opt4
Opt5
Opt6
ServiceSlowdownsEliminated
Peak UtilizationReduced to 25%
HTT
P R
espo
nse
Tim
e (m
sec)
% B
andw
idth
Util
izat
ion
Figure 5: Bandwidth Utilization (right), HTTP Response Time, Unique & Active CMs (left)of a Typical Optimized Upstream Interface Undergoing 6 Iterative Optimizations
050100150200250300350400450500
1/28
1/29
1/30
1/31 2/1
2/2
2/3
2/4
2/5
2/6
2/7
2/8
2/9
2/10
2/11
2/12
2/13
2/14
2/15
2/16
2/17
2/18
2/19
2/20
2/21
2/22
2/23
2/24
2/25
2/26
2/27
2/28 3/1
3/2
3/3
3/4
3/5
3/6
0102030405060708090100
latency active-cms unique-cms util
Opt1
Opt2
Opt3
Opt4
Opt5
Opt6
Opt1
Opt2
Opt3
Opt4
Opt5
Opt6
ServiceSlowdownsEliminated
Peak UtilizationReduced to 25%
HTT
P R
espo
nse
Tim
e (m
sec)
% B
andw
idth
Util
izat
ion
Figure 5: Bandwidth Utilization (right), HTTP Response Time, Unique & Active CMs (left)of a Typical Optimized Upstream Interface Undergoing 6 Iterative Optimizations

ZERO CONFIGURATION AND THE FUTURE HOME NETWORK William Garrison Motorola, Inc., Broadband Communications Sector Abstract This paper will review the state-of-the-art in Zero Configuration initiatives as it applies to an in-home network. The IETF Zeroconf, UPnP (Universal Plug-and-Play), Apple Rendezvous and IPv6 Stateless Address Autoconfiguration initiatives will be covered. In addition, from a MSO’s perspective, does Zero Configuration represent a lost revenue opportunity or a lost headache opportunity? How will the Zero Configuration home network connect to the internet?
INTRODUCTION Consumers do not want to own a home network. Instead, they want applications and services to simply work, as if by magic. If this magic requires a network, then it should be easily invoked with, at most, a simple incantation. This is how the consumer sees it. This is how we need to see it to get consumers to deploy applications that rely on home networks. The purpose of a home network is to enable new services by combining the capabilities of both new and existing elements. Why can’t I view a program that happens to be stored on my PVR downstairs on my TV upstairs? Why can’t I listen to the music stored on my iPod on my home theater without hooking anything up? Well, with a Zero Configuration home network, you will be able to do all these things and more! Zero Configuration is not a new idea. In the past, AppleTalk handled Zero Configuration for Macs and NETBIOS provided similar features for small networks
of Windows PCs. However, these protocols were completely separate from any WAN (Wide Area Network) Protocol and served a limited range of devices. They did not allow a wide variety of appliances, PCs and Macs to interoperate. An additional Zero Configuration networking benefit will be the creation of new kinds of networked products. These products will become commercially viable only when the inconvenience and support costs of traditional networking technologies are removed. This paper will cover the Zero Configuration of IP (Internet Protocol) based networks. IP was selected because it is the native protocol for the ubiquitous Internet.
COVERAGE A whole home network should be comprised of all of the data paths available between devices. These data paths include wired and wireless technologies. Wired technologies include power line, phone line, coax and dedicated CAT5 wiring. Wireless includes 802.11a/b/g, Zigbee and UWB (Ultra Wide Band). These technologies have significantly different data rate, delay and jitter characteristics. However, we need them to interoperate seamlessly and with zero user intervention.
REQUIREMENTS As described in the internet draft entitled “Requirements for Automatic Configuration of IP Hosts” by Aidan Williams [1], Zero Configuration requires that we:

• Distribute IP addresses without a DHCP (Dynamic Host Configuration Protocol) server
• Provide name resolution without a DNS (Domain Name System) server
• Find and list services • Distribute multicast addresses
In addition, while the system must operate in the absence of DHCP and DNS, it also must operate properly in their presence. Zero Configuration must not thwart their normal function.
ApplicationName Resolution / Find Services
Presentation
Session
Transport
NetworkIP unicast/multicast addresses
Data Link
Physical
Figure 1 – The OSI Reference Model The OSI Basic Reference Model divides a networking system into seven layers. This layering system enables an entity in one host
to interact with a corresponding entity at the same layer in a remote host. Zero Configuration applies to the Application and Network layers, as outlined in Figure 1.
SECURITY Security is also a Zero Configuration requirement. In the wired world, there is some physical security in a local network. In the wireless world, it is a challenge to tell the difference between your wireless device and your neighbor’s. Zero Configuration may bring tighter security requirements. You cannot depend on the user noticing an intrusion because the user is further removed from what is actually going on. At the very least, the protocols used on a Zero Configuration network must be as secure as a non-Zero Configuration network. Does Zero Configuration degrade security? Not really, a cracker can find out the same network information as offered by Zero Configuration using standard tools. There are plenty of tools floating around that let the unsophisticated “script kiddies” get into lightly protected networks. Zero Configuration’s most likely security effect is to increase the number of networks that someone might try to intercept and increase the number of devices connected to those networks. ZERO CONFIGURATION APPROACHES
Many people are currently trying to solve the Zero Configuration problem. Current initiatives include:
• Apple Rendezvous • IETF Zeroconf • UPnP™ (Universal Plug-and-Play) • IPv6 Stateless Address
Autoconfiguration

Each of these will be covered in its own section.
IETF ZEROCONF The Zeroconf Working Group of the IETF (Internet Engineering Task Force) was chartered in September, 1999. Its goal is to “enable networking in the absence of configuration and administration.” Their goal is so inclusive that it goes as far as to include allowing “impromptu networks as between the devices of strangers on a train.” [2] Zeroconf is a link-local technology. This means that the link-local addressing and naming are only meaningful to devices directly connected to the local network. Because these addresses and names are not unique globally, Zeroconf only applies to small wired or wireless networks. Zeroconf is appropriate for:
• Home and small office networks • Ad hoc networks at meetings and
conferences • Two devices needed to share
information Inappropriate applications of Zeroconf would potentially result in serious networking problems. Security Zeroconf security is primarily based on the requirement that all included devices must be connected to a single link. Therefore, a Zeroconf connection can only be hacked by a device that is close by and easier to detect. However, if you are indeed going to wirelessly network with the stranger on the train, you will want some way to prevent networking with the stranger in the next train compartment. A Zeroconf network is relatively vulnerable to some fairly standard attacks.
Vulnerability to denial of service attacks is probably unavoidable. Even a simple ploy, such as a rogue device responding to every ARP (Address Resolution Protocol) so as to claim all available IP addresses, could shut down a Zeroconf network. However, is this any worse than being unable to speak to the person next to you on the train due to an unruly child? Given local nature of a Zeroconf network, the universe of people who could interfere with your network is small. Given the local nature of the network, in the case of a network interruption you could simply search for the scoundrel. Industry Support A standard needs industry support to have real-world relevance. Support for Zeroconf has been announced by:
• Apple • Canon • Epson • HP • Lexmark • Philips • Sybase • Xerox • World-Book
Working Group Status The Zeroconf Working Group could not reach a consensus on security and service discovery issues. Therefore, it is not going to produce a specification on those issues. The Working Group is producing a protocol specification, describing automatic generation and assignment of link-local IPv4 addresses in environments lacking host configuration (static or using DHCP). This document is in draft form and will be submitted in the spring of 2004 for consideration as a Standards Track RFC.

Further information on the IETF Zeroconf Working group can be found at http://www.zeroconf.org/.
APPLE RENDEZVOUS Rendezvous is Apple’s name for IETF’s Zeroconf. You might want to think of it like Rendezvous is to Zeroconf as Firewire is to 1394. Rendezvous is an open protocol, which Apple has submitted back to the IETF as a part of the ongoing standards creation process. Apple is using Rendezvous to transition from AppleTalk to an all-IP network. Rendezvous matches the Apple customer’s expectations of a friendly, easy to use system. Apple added Rendezvous services in the Jaguar release of the Mac OS X Operating System and is using those services in its own applications. Rendezvous uses three technologies
• Automatic IP addresses (IPv4) • Name to Address Translation (DNS
queries via IP Multicast) • Service Discovery
A Rendezvous device first tries to obtain an IP address by a standard DHCP request. If there is no DHCP response, it:
• picks an address at random in the 169.254/16 range
• Checks to see if this IP address is used via an ARP (tries another IP if it is)
• Periodically checks for DHCP server
The device periodically checks for a DHCP server because it wants to participate in the network with the widest possible reach.
Figure 2 – A Rendezvous Assigned IP Address
In the above figure, you can tell the IP address came from Rendezvous both by the 164.256/16 address and the annotation “Self-assigned”. Apple then uses mDNS (multicast DNS) to handle DNS requests. In mDNS, each device runs their own mDNS responder. The mDNS responder provides traditional domain name services by having every device respond to the name queries that they know how to answer. Traditionally, devices contact a single known DNS server for name lookups. In mDNS, when a host needs to look up a name, it sends the query out to a local multicast group that includes all of devices that have locally registered Rendezvous services. Rendezvous also uses a DNS-based Service Discovery called mDNS-SD. Essentially, services are resolved to devices similar to the way host names are resolved using mDNS. Rendezvous Applications Apple uses Rendezvous in its iChat instant messaging application. Besides working with AOL Instant Messenger, it also works with Rendezvous-enabled Macs. So, if the stranger on the train has a Mac, you can easily chat.

And if you change your status from “Available” to “Away”, all Rendezvous clients are notified of the change automatically as a part of the Rendezvous mDNS Service Discovery. Further information is available at http://developer.apple.com/macosx/rendezvous. UPnP™ UPnP is being developed by the UPnP Forum. The Forum was formed in 1999 and now consists of over 650 member companies. The primary purpose of this Forum is to produce DCPs (Device Control Protocols) that describe standard methods for device interaction. UPnP is based entirely on open standards such as IP, TCP, UDP, HTTP and HTTPMU (a variant of HTTP that works on top of UDP multicast). What is universal about UPnP? UPnP uses common protocols rather than vendor-specific device drivers. UPnP is independent of the physical media and can be implemented in any programming language and on any operating system. The basic foundation of UPnP is a client-server architecture, where the client is called a “Control Point” and the server is called a “Device.” Operation UPnP covers the following device operations:
• Obtaining an IP address • Discovering other devices • Controlling other devices • Receiving state change notifications
(Eventing) • Presenting User Interface for other
devices
A UPnP device obtains an IP address the same way as described for a Rendezvous device in the previous section. Once it has an IP address, a device will use the IETF’s SSDP
(Simple Service Discovery Protocol) to find an interesting device with an interesting service on offer. This is accomplished using a multicast search message (HTTP over UDP over IP). Replies are unicast to the requestor. The multicast address, as well as the mechanism for advertising, searching, and revoking, are defined by the SSDP. If a Control Point wants to know more about the services offered by a device, it requests an XML format description document. The XML document describes the device and all its embedded devices. The description includes services supported by the device, manufacturer information, version of the device, device web site, serial numbers and other relevant information. The Control Point can now access the advertised services on the destination device via the SOAP (Simple Object Access Protocol). For a control point to invoke an action on device, it must get the device address, discover the device, retrieve descriptor, get URL for control and then send actions. UPnP is somewhat unique in that control is included as a part of its Zero Configuration standard. UPnP also supports Eventing, where a Control Point will be notified of device state changes. In order for a Control Point to register for Eventing, it must get the IP address of the device, discover the device, retrieve the device description, get the URL for Eventing and then subscribe to the events from device. The subscription must be for all events on the device. There is no way to subscribe to just a single type of event. While Rendezvous does not explicitly support Eventing, similar features are provided through its mDNS-SD service.

Security UPnP does not directly specify any security measures in the basic protocol. The basic protocol relies on the security features in the standards-based protocols on which it is based. In addition, UPnP is seen as relatively secure because it sends only data and keeps the implementation private. Because no executables are exchanged, there are fewer security concerns. UPnP has recently (Nov 2003) added a Device Security standard. UPnP security adds Access Control Lists and a Security Console which runs on Control Points that lets you edit Access Control Lists. Security is controlled down to the Service level. So, a Control Point might be able to set a clock’s alarm but not its time. While this adds security, it requires significant manual intervention and therefore does not qualify as part of Zero Configuration. Compatibility UPnP and Apple Rendezvous use essentially the same link-local address specification. In both protocols, the IP address 192.164/16 is understood to be a link-local address. The Rendezvous version is based on a slightly newer version of the RFC than the one used by UPnP. Therefore, UPnP and Rendezvous devices can exist on the same network. The differences are Rendezvous can communicate with devices with routable addresses and Rendezvous uses a packet TTL (Time to Live) of 255 while UPnP (as implemented by Microsoft Windows) uses 128. The routable address feature is just an added benefit and the TTL can be handled by changing the default TTL value.
Windows XP and Windows ME provide various levels of UPnP support. More information on UPnP is available at http://www.upnp.org.
IPv6 Stateless Address Autoconfiguration
IPv6 is a redesign of the original Internet protocols. Most often you hear about how IPv6 supports a larger (128 bit addresses vs. 32 bit) address space. This removes the need for NATs (Network Address Translations) and private addresses, so you have end-to-end transparency. However, it also includes a number of Zero Configuration features that are well suited for the home environment. In addition, IPv6/IPv4 translation mechanisms let us take advantage of these features before the whole world transitions to IPv6. IPv6 Autoconfiguration requires a multicast-capable link and begins when a multicast-capable interface is enabled. When a device interface is enabled, the host will generate a link-local address. The link-local address is sufficient for communication among nodes attached to the same link. The Link-local address is constructed by appending the well known local prefix fe80:0000:0000:0000:0000: to the device’s 64 bit interface ID. For Ethernet, the interface ID is based on the 48 bit MAC address and generated according to IEEE EUI-64 (Extended Universal Identifier). Before any address can be assigned to an interface and used, however, a node must attempt to verify that this "tentative" address is not already in use by another node on the link. To do this, it sends a Neighbor Solicitation message containing the tentative address as the target. If another node is already using that address, it will reply with a Neighbor Advertisement.

One unfortunate part of this specification is that if a duplicate address is found, the device must be configured manually. However, given that the interface ID should be unique, you should never have a duplicate address. Once an interface has a link-local address, it can use this address to obtain site-local and/or Global-scope addresses, if desired. To get these addresses, the link first tries a DHCP request. If it does not get a response, the stateless mechanism allows the host to generate its own addresses using a combination of its interface ID and the subnet prefix advertised by a router. An address created this way will be a proper Site-local or Global-scope address, depending on the router configuration. IPv6 is designed for interfaces to have multiple IP addresses. IPv6 also supports the easy renumbering of an entire site. This means that if a home is suddenly connected to the Internet, there is a simple way to change all the device addresses from local addresses to global addresses. Security So, a device can use a Link-local address that limits its traffic to inside the home or a link level address to limit communication to devices to which they directly attach. A clock radio might select a Site-local address to make sure only people within the radio’s household can set the alarm. Or, it may select a global address so you can set it from the office. All IPv6 nodes support the IP Security protocols (IPSec) standard for cryptographic authentication and encryption. So, all devices can send and receive packets with some confidence that the packets are from the expected source and their contents have not been modified. .
LOST REVENUE OR LOST HEADACHE? This is an easy answer. Zero Configuration is a lost headache opportunity. A service provider can bill for services, but it is hard to bill for support of the backbone network. You could charge a per-hour or a per-incident fee, but in the end the call center will not be a profit center. Zero Configuration is a revenue generator because the “lost headache” of configuration will allow the roll-out of new and profitable services.
CONNECTING TO THE INTERNET Zero Configuration is designed for link-local connections. This means that you connect to devices on the same wire (if a wired network) or same channel (if a wireless network). In order to connect a Zeroconf/Rendezvous device to the Internet, you will need a DHCP server or a bridge device to go from the link-local domain to the Internet. UPnP explicitly allows a single device interface to have multiple IP addresses. So if a DHCP server became available, a UPnP device could seamlessly connect to the Internet. IPv6 allows a device to get a Global address from DHCP or create one based on a router advertisement.
CONCLUSION The biggest remaining question is “When will Zero Configuration become commonplace?” Zero Configuration is more difficult to roll out than many other services because it requires wide adoption before it has significant value. Metcalfe's Law says that the value of a network grows in proportion to the square of the number of users. By analogy, the value of Zero Configuration will grow rapidly as the number of devices which offer it grow. Connecting one device that supports Zero Configuration and one device

that does not will not leave you with two devices that are half configured! It unfortunately leaves you with two devices to configure, one of which may not have been intended to be user configured. When will we get to the tipping point? When will people refuse to buy a device unless it has Zero Configuration? Well, first one of the Zero Configuration approaches must become the clear winner. Or some combination of approaches will become the clear winner. Why not use Zeroconf for the link layer and then above that use an evolution of UPnP which has evolved to support IPv6? This certainly sounds like a practical and powerful combination. We will have to wait for the market to decide this one.
Because of its support in Microsoft Windows, and the widespread deployment of Windows, UPnP looks like it could be the winner. However, IPv6 is certainly a very vendor neutral option and it too is supported in the latest versions of Windows. The race is far from over. When the market decides the winner (perhaps in a matter of 2-3 years), the winner will rapidly become ubiquitous.
REFERENCES [1] Aidan Williams, “Requirements for Automatic Configuration of IP Hosts”, draft-ietf-zeroconf-reqts-12.txt. [2] Erik Guttman, “Zeroconf Host Profile Applicability Statement”, draft-ietf-zeroconf-host-prof-01.txt.

ISBN 0‐940272‐01‐6; 0‐940272‐08‐3; 0‐940272‐10‐5; 0‐940272‐11‐3; 0‐940272‐12‐1; 0‐940272‐14‐8; 0‐
940272‐15‐6; 0‐940272‐16‐4; 0‐940272‐18‐0; 0‐940272‐19‐9; 0‐940272‐20‐2; 0‐940272‐21‐0; 0‐940272‐
22‐9; 0‐940272‐23‐7; 0‐940272‐24‐5; 0‐940272‐25‐3; 0‐940272‐26‐1; 0‐940272‐27‐X; 0‐940272‐28‐8; 0‐
940272‐29‐6; 0‐940272‐32‐6; 0‐940272‐33‐4; 0‐940272‐34‐2; 0‐940272‐35‐0; 0‐940272‐36‐9; 0‐940272‐
37‐7; 0‐940272‐38‐5; 0‐940272‐39‐3; 0‐940272‐40‐7; 0‐940272‐41‐5; 0‐940272‐42‐3; 0‐940272‐43‐1; 0‐
940272‐44‐X; 0‐940272‐45‐8; 0‐940272‐46‐6; 0‐940272‐47‐4; 0‐940272‐48‐2; 0‐940272‐49‐0; 0‐940272‐
50‐4; 0‐940272‐51‐2; 0‐940272‐52‐0; 0‐940272‐53‐9; 0‐940272‐54‐7
© 2015 National Cable and Telecommunications Association. All Rights Reserved.