110700 Complete
211
Volume 13 Number 2 July, 2011 INSTITUTE OF BUSINESS MANAGEMENT MANAGEMENT EXCELLENCE CENTRE KORANGI CREEK, KARACHI-75190, PAKISTAN UAN (9221) 111-002-004, FAX: (9221) 509-0968, 509-2658 E-mail: [email protected], [email protected] http://www.iobm.edu.pk PBR ISSN 1561-8706 PAKISTAN BUSINESS REVIEW Indexed and Abstracted by ECONLIT, Journal of Economic Literature Indexed by EBSCO New York. HEC Approved Journal Research Incoherences in Neo-Classical Economic Theory Muhammad Zahid Siddique, Haleema Sadia Assessing the Relationship between Leadership and Conflict Management Styles in the Banking Sector of Pakistan Humayun Zafar Assessing the Service Quality of Some Selected Hospitals In Karachi Based on the SERVQUAL Model Rizwan Ahmed, Hina Samreen Business Psychology Seminar Papers Gender Difference: Work and Family Conflicts and Family-Work Conflicts Sadia Aziz Ansari The Relationship between Work Motivation and Job Satisfaction Nadia Ayub, Shagufta Rafif Effectiveness of Brief Counseling Sessions for Employee Development: A Qualitative Study Zainab F . Zadeh, Samia Ahmad, Halima Ghani Role of Popularity in Being Bullied at the Work Place Qudsia Tariq, Saima Masoom Ali Personality Job-Fit Khalida Rauf Market Report Business Intelligence: A New Dimension to Business Azimuddin Khan , Karunesh Saxena Conference Report Workshop on Environment and Energy: An Overview Shahid Amjad
Transcript of 110700 Complete

Volume 13 Number 2 July, 2011
INSTITUTE OF BUSINESS MANAGEMENTMANAGEMENT EXCELLENCE CENTRE
KORANGI CREEK, KARACHI-75190, PAKISTANUAN (9221) 111-002-004, FAX: (9221) 509-0968, 509-2658
E-mail: [email protected], [email protected]://www.iobm.edu.pk
PBRISSN 1561-8706
PAKISTAN BUSINESS REVIEWIndexed and Abstracted by ECONLIT, Journal of Economic Literature
Indexed by EBSCO New York.HEC Approved Journal
ResearchIncoherences in Neo-Classical Economic TheoryMuhammad Zahid Siddique, Haleema SadiaAssessing the Relationship between Leadership andConflict Management Styles in the Banking Sector of PakistanHumayun ZafarAssessing the Service Quality of Some Selected Hospitals In KarachiBased on the SERVQUAL ModelRizwan Ahmed, Hina SamreenBusiness Psychology Seminar PapersGender Difference: Work and Family Conflicts and Family-Work ConflictsSadia Aziz AnsariThe Relationship between Work Motivation and Job SatisfactionNadia Ayub, Shagufta RafifEffectiveness of Brief Counseling Sessions for Employee Development:A Qualitative StudyZainab F . Zadeh, Samia Ahmad, Halima GhaniRole of Popularity in Being Bullied at the Work PlaceQudsia Tariq, Saima Masoom AliPersonality Job-FitKhalida RaufMarket ReportBusiness Intelligence: A New Dimension to BusinessAzimuddin Khan , Karunesh SaxenaConference ReportWorkshop on Environment and Energy: An OverviewShahid Amjad
Volume 13 Number 2 July, 2011
PAKISTAN BUSINESS REVIEW JULY 2011
CONTENTS
209
243
266
315
332
348
367
379
394
410
ResearchIncoherences in Neo-Classical Economic TheoryMuhammad Zahid Siddique, Haleema SadiaAssessing the Relationship between Leadership andConflict Management Styles in the Banking Sector of PakistanHumayun ZafarAssessing the Service Quality of Some Selected Hospitals In KarachiBased on the SERVQUAL ModelRizwan Ahmed, Hina SamreenBusiness Psychology Seminar PapersGender Difference: Work and Family Conflicts and Family-Work ConflictsSadia Aziz AnsariThe Relationship between Work Motivation and Job SatisfactionNadia Ayub, Shagufta RafifEffectiveness of Brief Counseling Sessions for Employee Development:A Qualitative StudyZainab F . Zadeh, Samia Ahmad, Halima GhaniRole of Popularity in Being Bullied at the Work PlaceQudsia Tariq, Saima Masoom AliPersonality Job-FitKhalida RaufMarket ReportBusiness Intelligence: A New Dimension to BusinessAzimuddin Khan , Karunesh SaxenaConference ReportWorkshop on Environment and Energy: An OverviewShahid Amjad

Volume 13 Number 2 July 2011
PAKISTAN BUSINESS REVIEW JULY 2011
Editorial CommitteeAmna Abbas, Humeira Jawed Abidi, Syed Aijaz Ahmed, Ejaz Ahmed, Javaid Ahmed, MaqsoodAhmed, Samin Ahmed, Ch. Sohail Ahmed, Naseem Akhtar, Ghayyur Alam, Khalid Amin, JavedA. Ansari, Sadia Aziz Ansari, Linah Askari, Nadia Ayub, Sharique Ayubi, Mirza Aqeel Baig, SahibKhan Channa, Aslam Dossa, Shazia Farooq, Syeda Mahtab Fatima, Sameena Hasan, NasreenHussain, Fareeda Ibad, Samra Javed, Fauzia Kanwar, Talib S. Karim, Faisal Kazi, Shahida Kazi,Urfi Khalid, Fazal Anwar Khalidi, Muhammad Asif Khan, Muhammad Massarra t Ali Khan,Shamim Ahmed Khan, Krishan Lal Khatri, Ali Asghar Malik, Bismah Malik, Shahnaz Meghani,Mujtaba S. Memon, Abdul Qadir Molvi, Mehboob Moosa, Fakhir Musharraf, Sarwat Nauman,Munazza Owais, Abdullah Patoli, Tauseef Ahmed Qureshi, Kamran A. Rabbani, Ajaz Rasheed,Wajdan Raza, Farheen Razzak, Syed Maqboolur Rehman, Samina Riaz, Owais Riaz, Syed ZiaAbbas Rizvi, Bettina Robotka, Sadiyah Saeed, Kausar Saeed, Syed Imdad Shah, Asad Shahzad,Nida Shaukat, Asiya Shirazi, Lubna Siddiqi, Shama Siddiqi, Khalida Tanweer, Ejaz Wasay,Shahida Wizarat, Sobia Younus, Humayun Zafar, Madiha Zeest, H.Jamal Zubairi.
Muhammad Ashraf Janjua: Chief EditorSabina Mohsin: Managing EditorMs. Fareeda Ibad: Literary EditorsMuhammad Asif KhanSheikh Muhammad IrfanGhulam Dastagir: Production AssociateShahzad Ali: Editorial Co-ordinator
International Advisors (Referees)Prof. Izlin Ismail, Faculty of Business and Accountancy, University of Malaya, Kuala LumpurProf. David L. Jones, Indiana University Center on Southeast Asia, USAProf. Dennis R. Briscoe, University of San Diego, USAProf. Angelo Santagostino, University of Brescia, ItalySyed Z. Arshad, NICTA - Australian Technology Park, New South Wales 2015, AustraliaMr. Thomsas Winter, University of Rostock, Rostock, GermanyDr. Ishrat Husain, Institute of Business Administration, KarachiProf. Gerald D. Huston, Arizona State University, USAProf. Mehtab Karim, John Hopkins University, USADr. Geoff Kay, City University, LondonDr. Khalid Nadvi, IDS, University of SussexDr. Peter O’ Brien, SADCC, South AfricaProf. Sarfaraz Qureshi, IslamabadDr. T.M. Roepstorff, UNIDO, ViennaDr. Shahid Hasan Siddiqui, Research Institute for Islamic Banking and Finance, KarachiProf. Charles J. Teplitz, University of San Diego, USADr. Arshad Karim, FC College, LahoreProf. Munir Wasti, University of Karachi, KarachiDr. Javed Iqbal, University of Karachi, KarachiDr. Rashid A. Naeem, Allama Iqbal Open University, IslamabadProf. Dr. Shafiq ur Rahman, University of Karachi, KarachiDr. Rizwana Zahid, Government APWA College for Women, KarachiDr. Arshi Ali, Federal Urdu University, KarachiProf. Dr. Rafique Ahmed Khan, PAF-Kiet, KarachiDr. Ayub Ali Meher, KarachiMr. Amir Hussain Siddiqui, Trade Development Authority, KarachiSyed Zeeshan Arshad SZABIST, KarachiDr. Abdul Wahab Suri, University of Karachi, KarachiProf. Dr. Abdul Waheed, University of Karachi, Karachi (Cont’d)
PAKISTAN BUSINESS REVIEW JULY 2011
Volume 13 Number 2July 2011
RefereesDr. Naveed, Institute of Business Administration (IBA), KarachiDr. Moazzam Khan Sherwani, Institute of Environment Studies, University of KarachiDr. Samiuzzaman, Global Environmental Lab (Pvt) Ltd. Korangi, KarachiDr. Anila Ambar Malik, University of Karachi, KarachiDr. Seema Munaf, University of Karachi, KarachiDr. Nabeel A. Zubairi, University of Karachi, KarachiDr. Sabira Sultana, Foundation for Advancement of Science and Technology (FAST), KarachiDr. Zainab F. Zadeh, Bahria University, KarachiDr. Ziasma, University of Karachi, KarachiProf. Asim Jamal Siddiqui, University of Karachi, KarachiProf. Dr. Mudassir-ud-din, University of Karachi, KarachiMs. Yasmin Zafar, Institute of Business Administration (IBA), KarachiDr. Muhammad Zubair, University of Karachi, KarachiDr. Uzma Parveen, University of Karachi, KarachiMs. Nighat Bilgrami Jaffery, Applied Economics Research Centre, University of Karachi, KarachiMr. Mohsin H. Ahmed, Applied Economics Research Centre, University of Karachi, KarachiProf. Syed Afrozuddin Ahmed, University of Karachi, KarachiProf. Ghulam Hussain, University of Karachi, KarachiMr. Mahboob-ul-Hassan, University of Karachi, KarachiDr. Muhammad Mahmood, Khadim Ali Shah Bukhari Institute of Technology, KarachiDr. Nargis Asad, Aga Khan University Hospital, KarachiDr. Abuzar Wajidi, University of Karachi, KarachiMr. Mohammad Umar, Takaful Pakistan Limited, KarachiMs. Rubina Feroz, University of Karachi, KarachiProf. Dr. Talat Wizarat, Institute of Business Administration (IBA), KarachiDr. Muhammad Zaki, University of Karachi, KarachiMr. H. Jaleel Zubairi, Allied Bank Ltd. , KarachiDr. Zaira Wahab, Iqra University, KarachiDr. Ismail Saad, Iqra University, KarachiMr. Naim Farooqui, Pak-Kuwait Investment Company Ltd. KarachiDr. Sara Azhar, University of Karachi, KarachiProf. Ahmad Farooq Shah, Bahauddin Zakarya University, MultanMr. M. Mazhar Khan, State Bank of Pakistan, KarachiDr. Tariq Yousuf Khan, KarachiDr. Fauzia Shamim, University of Karachi, KarachiMr. Mohammad Soliman, University of Sciences and Technology Chittagong, BangladeshProf. Abdul Mannan, School of Business, University of Liberal Arts BangladeshDr. Fatima Imam, Federal Urdu University, KarachiProf. G.R. Pasha, Bahauddin Zakariya University, MultanMr. Shameel Ahmad Zubairi, University of Karachi, KarachiMr. Imran Naveed, Joint Director., State Bank of Pakistan, KarachiMr. Qaisar Mufti, Chief executive, Qaisar Mufti Associates, Shahra-e-Iraq Saddar, Karachi.Ms. Afra Sajjad, Head of Education & Policy Development, ACCA Pakistan, Lahore 54660Dr. Khan Brohi, Director, Institute of Environmental Engineering and Management, JamshoroMr. Amir Hussain, Economist WTO Cell, Trade Development Authority of Pakistan, KarachiMr. Tanveer Anjum, Department of Business Communications, Iqra UniversityDr. Arifa Farid, Department of Philosophy Ex-Dean Faculty of Arts, University of KarachiMr. Mushammad Asim, Department of Business Administration, KarachiMr. Kamal Udin, KarachiMr. Bhagwan Bharvani, Retired Internal Auditor, Pakistan International Airlines, KarachiMr. Muhammad Zubair, Department of Islamic History, University of Karachi, Karachi

Research
PAKISTAN BUSINESS REVIEW JULY 2011209
Refreshing Incoherence in Neoclassical Economic Theory
INCOHERENCESIN NEO-CLASSICAL
ECONOMIC THEORYMuhammad Zahid SiddiqueNational University, Karachi
Haleema SadiaInternational Islamic University, Islamabad
Abstract
Neoclassical economic theory is often criticized for neglectingsome essential elements in models of economic decision making.These criticisms can be categorized into external and internalones. This paper summarizes a number of incoherence built intothe models of neoclassical economic theory. One of the majorweaknesses of standard teachings of economics is that studentsare often exposed to sanitized and uncritical exposition ofeconomic theory as if its ‘imaginary world models’ aretheoretically coherent and empirically congruent to real worldcapitalist order. The paper will provide a refreshal of usuallyneglected part of standard neoclassical economic teaching.
Interestingly, despite all these criticisms, economic theory hasnot only been able to survive but also dominate the academicintellectual world. The concluding section will argue that theanswer to this puzzle lies neither in the fact that there is ‘somedeeper truth’ hidden behind economic theories nor that thesetheories have been shown to explain the empirical realties of capitalistorder, rather major reasons for the sustainability of neoclassicaleconomics rests on the facts that (i) it continues to provide ajustification for the agenda of liberal capitalism against religioussocial order and (ii) there is no grand alternative competing theoryto microeconomics.
Key Words: Bounded rationality, monopoly capital,equilibrium, methodological individualism, capital controversy
JEL Classification: B3, B5, D6, P2, P4,
Research
PAKISTAN BUSINESS REVIEW JULY 2011
Research
210
Refreshing Incoherence in Neoclassical Economic Theory
1: Introduction
Neoclassical economic theory is often criticized forneglecting some essential elements in models of economic decisionmaking. These criticisms can be categorized into external andinternal ones. This paper summarizes a number of incoherencebuilt into the models of neoclassical economic theory. One of themajor weaknesses of standard teachings of economics is thatstudents are often exposed to sanitized and uncritical expositionof economic theory as if its ‘imaginary world models’ aretheoretically coherent and empirically congruent to real worldcapitalist order. The paper will provide a refreshal of usuallyneglected part of standard neoclassical economic teaching.Interestingly, despite all these criticisms, economic theory hasnot only been able to survive but also dominate the academicintellectual world. The concluding section of the paper arguesthat the answer to this puzzle lies neither in the fact that there is‘some deeper truth’ hidden behind economic theories nor thatthese theories have been shown to explain the empirical realtiesof capitalist order, rather major reasons for the sustainability ofneoclassical economics rests on the fact that (i) it continues toprovide a justification for the agenda of liberal capitalism againstreligious social order and (ii) there is no grand alternativecompeting theory to microeconomics.
However, it is important to have an idea of the kind ofcriticism that can be leveled against neoclassical economic theory.This will greatly help understand not only the forthcoming criticismof neoclassical economics but also demonstrate how to formulatean effective criticism of any economic theory. The first sectionoutlines the nature of criticism as outlined by Boland (1992).
2: Criticism: Its Nature and Types
Criticism of any argument could take two generalapproaches depending upon whether or not one is ready to acceptthe aim of the argument for the purpose of discussion.Instrumental criticism is targeted at the methodology of anargument accepting its general objective. It could be internal andexternal. Internal criticism can be given if we accept the aim of the
Research
PAKISTAN BUSINESS REVIEW JULY 2011211
Refreshing Incoherence in Neoclassical Economic Theory
argument. This type of criticism examines the internal logic ofthe argument without having any external considerations byanalyzing either the truth status of its assumptions or bychallenging the sufficiency of the argument. If a person is able torefute at least one of the assumptions, he claims to criticize theclaim to understand the phenomenon in question with thatargument. The assumption (or a behavioral postulate) can bechallenged either by arguing against the possibility of thehypothesized behavior or by arguing against the empirical truthof the premise of the hypothesis. Even when an assumption isnot directly refutable, it is possible to criticize the adequacy ofthe argument by proving that it is possible to have a falseconclusion even when all of the assumptions are true, that is theargument is logically insufficient.
However, an external criticism does not accept the aimof an argument. For example, an external criticism of the universalmaximization is extended from some corners, such as Simon (1979)has argued that individuals are not maximizers of anything, ratherthey are ‘satisficers’ (we discuss it in detail below). Similarly,Leibenstein (1979) presented a ‘micro-micro theory’ arguing thatprofit maximization is not the objective of the firm and a completeexplanation of the decision in the firm requires an intra-firmbehavior. These critics do not accept the aim of the argument ofmaximization hypothesis; that is the challenge of showing theexplanation of any phenomenon as a logical consequence ofmaximization behavior.
It is important to note at the outset that it is not of ourinterest to evaluate the logical validity and the degree of successof the forth-coming internal and external criticisms of neoclassicaleconomics since that falls outside the scope of this work.1 Thepoint that is of our interest is that all these criticism, either internalor external, are instrumental in their nature, that is the critiquesaccept the commitment to the fundamental beliefs of individualliberty and welfare maximization by satisfying human desires.Such criticisms are classified as instrumental ones because, giventhe objective of individual liberty and welfare, they serve to
1 For an excellent discussion on this issue, see Boland (1992)
PAKISTAN BUSINESS REVIEW JULY 2011
Research
212
Refreshing Incoherence in Neoclassical Economic Theory
provide the best technology of obtaining these objectives. Noquestion of the form “why is it that we should honor individualliberty or why human wants are to be satisfied at all” are everraised since these questions form the metaphysics of moderneconomic thoughts and, hence, not open to objection. Someseventy years ago, metaphysics2 was considered a meaninglessword, but today it has been realized that every explanation has itsmetaphysics.3
3: External Critiques: Methodological Problems3.1: Marxists Attack
Karl Marx visualized capitalism in a different frame ofmind and proposed a scientific investigation of it. To him, thecurrent economic and social problems have their roots in thefundamental structure of capitalist system and uprooting thoseproblems requires digging up those roots and moving towards adifferent sort of economic system.
Marx refused the assumption that any aspect of humanactivity can be treated as given, such as taste and technology,and yet still manage to say something about the nature ofvaluation as society changed [Cole, Cameron and Edward (1983)].He starts from the fact that the material environment in everysociety is shaped by that society’s dominant “mode of production”[the way people get together to produce means of livelihood andcontrol and allocate the resulting surplus product] of commoditiesthat individuals wish to use. This formulates the basis forhistorical materialism or economic determinism, the view thatthe way we think and live is transformed by prevailing materialstructure of production, distribution and exchange.
2 Metaphysics is the branch of philosophy that studies the nature andfundamental features of ‘being’ and ‘existence’. It attempts to understandthe fundamental nature of all reality whether visible or invisible, that iswhat anything must be like in order to be at all.3 Kuhn (1970) argues why metaphysical foundations are necessary for anyscientific explanation.
Research
PAKISTAN BUSINESS REVIEW JULY 2011213
Refreshing Incoherence in Neoclassical Economic Theory
“The mode of production of material life conditionsthe social, political and intellectual life process ingeneral. It is not the consciousness of men thatdetermines their being, but, on the contrary, theirbeing that determines their consciousness” [Marx:with reference from Carter (1988)]
A particular type of technology determines not onlythe technical division of labor, but also determines classrelations of control over the means of production which is thesource of power over the use of economic surplus. One form ofthese relationships is commodity-exchange which relates peopleto each other through markets via money, called capitalism. Sucha mode of production necessitates a large majority of people insociety to be wage-earner-laborers who are forced to gainsubsistence through selling their time and ability to those whocontrol the means of production and surrender all rights of theproducts of their labor. It is this commodity production as socialrelationship in the historical context of capitalism that was sostrongly emphasized by Marx. To him, the problem with theneoclassical economic theory is that it only takes into accountthe social relations of exchange and neglects the wider structureof production within which these exchanges take place [Cole,Cameron and Edward (1983)]. Because neoclassical economiststake this social structure as given, this allows them to postulatea system in equilibrium. The relations of exchange may becharacterized by freedom under capitalism, but the relations ofproduction are determined by coercion that leads to conflict.
For Marx the social structure is never static [Marx andEngels (1967)]. The social life can only be studied in terms of therelationships between the forces and relations of productionand the internal conflicting forces within this relationship. Marxoutlined a theory of history by which the relations of productioncorrespond to a definite stage of development of the materialproductive forces. But then, after further development of thoseforces of production, a conflict arises between them and theexisting relations of production. These relations had formerlyhelped the development of the productive forces, but now theystart fettering further progress. Revolution then occurs, but only
PAKISTAN BUSINESS REVIEW JULY 2011
Research
214
Refreshing Incoherence in Neoclassical Economic Theory
after all the productive forces in the old society that can develop,have developed. This conflict in capitalism between privateappropriation and social production is revealed in the theory ofrate of profit to fall, that gives rise to capital-labor conflict. Marxclaimed that labor has the capacity to produce more use valuethan its exchange value and the difference between the two iscalled exploitation, but disguised as profit by capitalist [Marx(1898)].4 Therefore, the source of profits, according to Marx, undercapitalism is value added by workers but not paid out in wages.Once the wage is covered, the capitalist, owners of the means ofproduction, always has an incentive to force workers to worklonger and harder than the workers are themselves likely to do.The capitalist is to compete with other businessmen to stay incompetition by improving the product and cutting down the costof production. But this attempt to increase labor productivity andthereby improve profit creates a tendency for the profitability ofcapital as a whole to fall. This further puts pressure by capitaliston labor force to increase profitability, a move that createscompetitive instability and furthers class struggle.5 Therefore, classstruggle for power, the control over the means of production, isfundamental to capitalism and, therefore, capitalism is always in dangerof destroying itself which lays the foundation of a new social order.
4 For an exposition of Marxist’s Theory of Value, see Weeks (1981)5 For a detailed analysis of the rate of profit to fall and abstract labortheory of value, see Cole, Cameron and Edward (1983)
The conflict is rooted in the essential structure of capitalism as asystem: “those who own the means of production and those whoperform wage labor are bound together but have significantlydifferent needs about the intensity of production and the distributionof its proceeds” [Gordon (1987)]. In Marx’s own language, theconclusion is:
“The modern laborer…instead of rising with the progressof industry sinks deeper and deeper below theconditions of existence of his own class. He becomes apauper, and pauperism develops more rapidly thanpopulation and wealth. And here it becomes evident,that the bourgeoisie [capitalist class] is unfit any longerto be the ruling class in society….It is unfit to rule
Research
PAKISTAN BUSINESS REVIEW JULY 2011215
Refreshing Incoherence in Neoclassical Economic Theory
because it is incompetent to assure an existence to itsslave within his slavery, because it cannot help lettinghim sink into such a state, that it has to feed him, insteadof being fed by him. Society can no longer live underthis bourgeoisie…” [Marx and Engels (1967): p. 93].
Finally, workers are brought together into revolutionaryassociations which ultimately overthrow the bourgeoisie.
If it is the dynamics of capitalist system that createsproblems, then according to socialists, we need to think ofpossibilities moving somewhere else than capitalism. Many Marxisthave suggested the following charter for moving beyond capitalism.
Fairness: People must be treated fairly, that is theyshould not be penalized for their families, colors or skin. Capitalismviolates social fairness in one fundamental aspect at least, thatis a kind of power and control enjoyed by the owners of capitalthat is denied to the rest. “Nature does not produce on the oneside owners of money or commodities, and on the other menpossessing nothing but their own labor power…it is clearly theresult of a past historical development” [Marx (1970): p. 169).The top 10 percent richest people in any country are many timeswealthy as the bottom 10% percent of its people. Did they workso many times as hard as their income levels suggest? Rather,this huge difference is driven due to the concentration of capitalgoods ownership in a few hands legitimized by the capitalistsystem. Much economic fairness can be achieved by movingtowards a system in which the ownership of capital goods iscommon.
Efficiency: People do not want to work harder thanwhat makes their life comfortable. Heavy investment in socialstructures and economic systems, on the armies of managerialand supervisory personnel, on resolving continuing laborconflicts and on ever-present over production of dangerous andwasteful products necessitated by inter-firm competition makecapitalism a remarkably wasteful kind of economic system. Abetter efficient system can be constructed if we move towardscooperation and control in the organization of production andgreater social participation and control in the planning andallocation of economic resources.
PAKISTAN BUSINESS REVIEW JULY 2011
Research
216
Refreshing Incoherence in Neoclassical Economic Theory
“…in communist society, where nobody hasexclusive sphere of activity but each can becomeaccomplished in any branch he wishes, societyregulates the general production and thus makes itpossible for me to doone thing today and another tomorrow, to hunt inthe morning, fish in the afternoon, rear cattle in theevening, criticize after dinner, just as I have mind,without ever becoming hunter, fisherman, herdsmanor critic” [Marx and Engel (1967), p. 54]
This passage contains two crucial facts [Carter (1988)]:(i) it is the individual who decides his/her own activity asexpressed by ‘just as I have mind’, and (ii) ‘society regulatesthe general production’. The question is to reconcile theantagonism between (i) and (ii).6
Capitalist Defense against MarxismMarx was surely a profound thinker who won legions
of supporters around the world. But his predictions have notwithstood the test of time. Although capitalist markets havechanged over the past 150 years, competition has not devolvedinto monopoly. Real wages have risen and profit rates have notdeclined. Nor has a reserve army of the unemployed developed.We do have bouts with the business cycle, but more and moreeconomists believe that significant recessions and depressionsmay be more the unintended result of state intervention (through
Community: According to Marxists, capitalismpromotes profits without any concern for developing people. Ifthe capital and infrastructure of a community is aging, capital willdecide to move away without any concern for the lives ofcommunity workers. People are unessential and communities areignored. Relations destroy but goods are produced andworshipped. It makes sense, therefore, to develop a system thatplaces higher weight on developing people and promoting strongcommunities.
However, the serious problem for Marxists lies inmaintaining the social planning along with the individual freedom,the ultimate end to be achieved by Marx:
6 See Carter (1988) for a discussion on this issue.
Research
PAKISTAN BUSINESS REVIEW JULY 2011217
Refreshing Incoherence in Neoclassical Economic Theory
monetary policy carried out by central banks and governmentpolicies on taxation and spending) and less an inherent feature ofmarkets as such.
Socialist revolutions, to be sure, have occurredthroughout the world, but never where Marx’s theory predicted—in the most advanced capitalist countries. On the contrary, socialistrevolts have occurred in poor, so-called Third World countries.The apparently higher standards of living and technologicaladvancements in capitalist social system are regarded as a primafacie evidence of the supremacy of capitalist reality over Marxismby neoclassical economists [See Friedman (1980) and (1982) forample examples]. But, when the defenders of capitalism frequentlycompare the Socialist East with the industrialized West, theychoose the richest capitalist countries for comparison. This isanalogous to defending feudalism by drawing attention to thehappy condition of the nobility, while forgetting that their wealthand leisure are the results of the poverty of their serfs. SimilarlyWest, when viewed as far from self-sufficient and a part of aninternational economic system, includes the exploitation of theThird-World as a basis for the high standards of living experiencedin the developed nations, or at the very least is seen to induceunderdevelopment in other parts of the world [Carter (1988)]. Whenthis whole international exploitive capitalist system is comparedwith socialism, capitalism does not sound so well.
Most troubling to present-day Marxism is the ongoingcollapse of socialism. Revolutions in socialist countries today areagainst socialism and for free markets. In practice, socialism hasfailed to create the non-alienated, self-managed, and fully plannedsociety. Real-world socialism in the twentieth century wasunsuccessful in emancipating the masses. In most cases,neoclassical economists believe, it merely led to new forms ofstatism, domination, and abuse of power. Marx’s theory of value,his philosophy of human nature, and his claims to have uncoveredthe laws of history fit together to offer a complex, yet grand visionof a new world order. If the first three-quarters of the twentiethcentury provided a testing ground for that vision, the end of thecentury demonstrated its somewhat utopian nature and apparent
PAKISTAN BUSINESS REVIEW JULY 2011
Research
218
Refreshing Incoherence in Neoclassical Economic Theory
unworkability. Neoclassical economists usually equate the fall ofSoviet Russia with the failure of socialism.
It is important to highlight the instrumental nature ofMarxist criticism on neoclassical economics. Both ClassicalLiberalism and Orthodox Marxism are the out products ofEnlightenment belief that the natural order produces perfection[Moore and Bruder (2002)]. Both looked forward to a future ofever-increasing human freedom and placed great faith in humanhappiness. Though, according to Marxists, all economic and socialproblems have their roots in the fundamental structure of freemarket economic system and they proposed a different kind ofeconomic system to avoid the reappearance of the same problems,yet they do not see any problem with the metaphysical objectivesof neoclassical economics. It differs from it not on the basis of itsmetaphysics, rather on its approach to reach those presupposedobjectives. Individuals left free to choose their self interest,according to this school of thought, will necessarily lead to clashin self-interests and a class struggle for power and, as a result,will impede the very objective of individual liberty and welfare.They offer an alternative social order which, they think, can bestserve to achieve these metaphysical objectives: nothing wrongwith those objectives is associated; these are to be attainedanyhow. The matter of disagreement is how to get to them.
3.2: Origins of Economies: Pitfalls of MethodologicalIndividualism
Neoclassical economics is based on the ideology ofmethodological individualism—the idea that all social and politicalinstitutions can / should be reduced to and understood in termsof autonomous self-interested individual’s preferences andchoices. Communitarian philosophers [e.g. Sandel (1982), Raz(1986), Taylor (1990)] have argued that the isolated individualcannot be a viable analytical starting point to understandsocieties. In fact, even if we take the individual as given, the rulesof their interaction cannot be explained in terms of the individual’sterms. For example, standard economic theory traces back moneyto market exchange hypothesizing that money originated asindividuals’ voluntary cost-minimizing innovation to replace
Research
PAKISTAN BUSINESS REVIEW JULY 2011219
Refreshing Incoherence in Neoclassical Economic Theory
barter, but the orthodox economic theory cannot explain howindividual utility maximizers settled on a single numeraire (Gardiner2004). In fact to present the higgling and haggling of marketprocess as support for evolutionary development of moneypresupposes a fairly high degree of specialization of labor andresource ownership—but this pre-market specialization is itselfhard to explain. The critics of methodological individualism pointthat in order to explain the origins of social institutions; onealways has to presume individuals acting in a specific context.For example, game theory presumes a set of rules and constraintsregarding the behavior of individuals at the very outset. Thestandard economic assertion that economies take the form byvirtue of millions of individual human actions is misleadingbecause ‘interaction requires accepted rules, practices, customsand language understanding’ (Mayhen 2005). Institutions aredurable systems of established and embedded social rules thatstructure and constrain social interaction among individuals. Thevery institutions of private property, exchange and job-marketsseem so basic in the modern world that people assume them to be‘natural parts’ of human existence. But in most parts of the worldbefore the sixteenth century, this was not the common way oforganizing life and distributing income—e.g. most food wasproduced not for exchange but for family consumption,production was organized by family unit and wage labor was rare.Neoclassical economic theory does not recognize the need todeal with processes whereby rules and practices are created.
One reason why modern economics dismissesunderstanding individual behavior in terms of social collectivitiesis because it calls forth incorporating Classical economists’(Malthus, Ricardo, Marx) idea of class-conflict as a permanentfeature of the capitalist system. These economists maintainedthat capitalist economies are structured by classes (such asworkers, landlords and holders of ‘stocks’) and the share of eachgroup is determined largely by social and political conditions.For example, Malthus and Ricardo conceived that the wage shareof workers is determined not in accordance with their contributionto output, but by the principle of ‘subsistence wages’—i.e. workersreceive out of the total output only what is required to reproducetheir labor services and their family. The exact amount of this
PAKISTAN BUSINESS REVIEW JULY 2011
Research
220
Refreshing Incoherence in Neoclassical Economic Theory
‘subsistence wage’ may differ as it is dictated by the level ofdevelopment that has taken place in any society at any specifictime (e.g. subsistence wage in Pakistan will be far lower than thatin the US). Marx took this ‘class-based’ analysis to its logicalconclusion by showing that capitalism is a system of productionwhere workers are exploited by the capitalist class. Neoclassicaleconomic theory of income distribution was developed to refutethe ‘class-based’ theoretical analysis put forward by the Classicaleconomists in the early and middle parts of the 19th century.Neoclassical economics sets itself the task to prove that thefundamental characteristic of the market economy is ‘harmony’and not ‘class-conflict’; and that the market is not a source ofexploitation but of welfare maximization. The response to theClassical heritage came in the form of ‘equilibrium based analysis’which asserted that competitive markets generate prices whichleave all market participants in a state which cannot be improvedupon by any other means—no one can be made better off bymeans other than participating in the market. Hence, toneoclassical economists, ‘market equilibrium’ is not only efficientbut also welfare maximizing for all agents.
But as pointed out above, this harmonized projectionof capitalist social reality is based upon erroneous conceptionof asocial and ahistorical individuation—which is itself a specificconception of human self as a natural disposition of humannature. The idea of methodological individualism presumes thatmen could exist before the establishment of societies—an ideawhich is quite implausible. Ferguson (1776) attacked such anasocial and ahistorcial conception of human being (used, forexample, by Rousseau or more recently by Rawls) as:
“if we would know him (man), we must attend tohimself, to the course of his life, and to the tenor ofhis conduct. With him the society appears to be asold as the individual…If there was a time in whichhe has his acquaintance with his own species tomake and his faculties to acquire, it is a time ofwhich we have no record, and in relation to whichour opinions serve no purpose and are supportedby no evidence” (p. 9)
Research
PAKISTAN BUSINESS REVIEW JULY 2011221
Refreshing Incoherence in Neoclassical Economic Theory
Methodological individualism takes people to be distinctfrom their ends and embodies a mistaken view that peoples’ endsare formed independent of or prior to society which is seen merelyas the outcome of contract between individuals whose ends arealready given. This involves a mistaken relation betweenindividual with his society because it is the kind of society thataffects peoples’ understandings both of themselves and of howthey live, argue communitarians.
3.3: Maximization Hypothesis and Bounded Rationality
The assumption of maximization behavior is the cornerstone of neoclassical economics, and it has become an openavenue for criticism of this school of thought. The theory of“rational choice” has central place in economics. In themainstream economics, explanations are regarded as “economic”to the extent that they explain the relevant phenomenon in termsof the rational (utility / profit maximizing) choices of the economicagents. Theories which do not have this structure—such asGeneral Theory of Keynes with its reference to psychologicalpropensities and animal spirit—are treated as suspect until theirmicro foundations have been constructed. Rationality meansoptimization of any objective for the attainment of utility and,therefore, is equivalent to the ‘consistency’ for economists: aperson is rational to the extent that his choices are consistentwith one another; i.e. his choices can be predicted by some theory.However, in recent years a new paradigm within economics hasdeveloped which has challenged the rationality hypothesis asassumed by traditional economists.
First, the traditional rationality hypothesis has beencriticized on philosophical grounds. Robert Sudgen provides areview of current state of rationality hypothesis, as presented inSavage’s The Foundations of Statistics, and argues that neitherof the two axioms of rationality, that are completeness andtransitivity of choices, can be defended from the view point ofrationality as presented by economists. Similarly, Fullbrook (2005)provides a number of situations (e.g. social being, reciprocalimitation, self-referential goods, spontaneity, adventure etc.) inwhich a consumer clearly violates neoclassical axioms of
PAKISTAN BUSINESS REVIEW JULY 2011
Research
222
Refreshing Incoherence in Neoclassical Economic Theory
rationality. He emphasizes that ‘rather being obscure or far-fetched exceptions to the general rule, they characterizemainstream economic practice’ of modern consumer society (p.83). His criticism seriously undermines the context-independentaxioms of rationality.
Apart from these considerations, it has been argued bypsychologists that individuals are not rational as proposed byeconomists. Rather there are many obstacles to being rational inthis sense. Simon (1979) says that human being have cognitivelimitations (the limited processing capabilities of human being,the lack of knowledge of alternatives in the choice) which are asource of bounds in their rational decision-making. Hediscovered that when we ourselves confront a puzzle, we rarelyreach a solution in a neat, linear fashion. Rather, we search in ahaphazard way for potentially relevant facts and information,and usually quit once our understanding reaches a certainthreshold. In Simon’s terms, we are “satisficers” not maximizes.Our conclusions are often inconsistent or even incorrect.Kaufman (1999) extends emotional arousal (the idea that highemotional intensity prevents optimal human performance) asanother source for bounded rationality. These theories borrow alot from psychological research which asserts that individualsmake systematic errors by using decision heuristics (biases) orrules of thumb which fail to accommodate full logic of a decision,as when a person makes systematic errors by using adaptiverather than rational expectations. Equipped with the above ideasof bounded rationality, there is a fast growing field in economics,called experimental economics, designed to do research in thefield of economics [Kahneman and Tversky (1979), Looms andSugden (1982), Tversky and Thaler (1990), Kahneman andTversky (1991). For the extension of bounded rationality in macromodels, see Akerlof (1982), Akerlof and Yellen (1985a) and(1985b)].
Multiple answers are extended to this criticism.Neoclassical economists argue that it is implausible for an agentto forgo opportunities for gain; therefore, unbounded rationalityidentifies an agent’s likely action because it describes the best
Research
PAKISTAN BUSINESS REVIEW JULY 2011223
Refreshing Incoherence in Neoclassical Economic Theory
opportunity for gain. Further, utility maximization has been apowerful generator of successful hypotheses. Without thediscipline of optimizing models, economic theory would degenerateinto a hodge podge of ad hoc hypotheses which covers everyfact but lacks scientific methodology. Using well-understoodmathematical tools, unbounded rationality confers definiteoutcomes.7 It is also important to note that theory consists ofthree parts: hypothesis, deduction and empirical testing.Maximization hypothesis cannot be ruled out as a logicalimpossibility because direct testing of this hypothesis is almostimpossible. The only way to reject this hypothesis is to applyindirect test by examining the implied patterns of observablechoices based on the assumption of maximization hypothesis. But,as Boland (1992) notes it, “the fundamental methodological problemof refuting any behavioral hypothesis indirectly is that of constructinga convincing refutation”. The objection that a number of anomaliescan’t be explained from utility maximization hypothesis can be metfrom the direction that the theorizing process is still not complete.Deductions from assumptions are crude and the project is to refinethe argument by the use of more sophisticated mathematics. Lastly,until a strong competing theory is created which is better in test,neoclassical economists are uninterested in a priory discussion ofthe realism of assumptions. Neoclassical economists followFriedman’s (1953) instrumentalism which presumes that the truth ofthe assumptions does not matter and the objective of research ineconomic theory is solutions to practical problems. Thus, neoclassicaleconomics seems to be able to defend itself on methodologicalgrounds.
4: Internal Critiques: Theoretical Problems4.1: Monopoly Capital
A standard economic declaration in favor of competitionis based upon an unsound description of the dynamics of marketmechanism. This argument is explicated with most clarity in themicroeconomics textbook by Schotter (1997) which tries toprovide a reassuring link between perfect competition and thereal world: that profit-maximizing behavior converges to the
7 For detailed discussion of the arguments on bounded rationality, seeConlisk (1996)
PAKISTAN BUSINESS REVIEW JULY 2011
Research
224
Refreshing Incoherence in Neoclassical Economic Theory
perfectly competitive ideal as the number of firms in the industryincreases—i.e. if we begin with monopoly business and leavethe world alone to the individual’s self-interest, it wouldautomatically converge to the unique solutions of perfectlycompetitive model. However, this image of market dynamicspresents an opposite description of what actually happens incapitalist order—i.e. when we begin with perfect competition,the market mechanism tends towards monopoly (one large firmprevailing) or at best towards oligopoly (few large firms operatingin the whole market).
The formal treatment of economic process neglects theimplications of technological advancements for the breakdownof competition. In fact, the very nature of competition itselfinduces changes that undermine competition [Henry (1990)].Under the given structure of competition, firms are in socialpressure to introduce new innovations quite rapidly in productionprocess. Because a single firm has to face market price as aconstraint as it cannot affect it in competitive conditions, theonly way to increase profit is the reduction in costs. The cost-reducing and output-increasing innovations help make more profitto those firms who introduce them first, but the very act ofinnovation tends to reduce competition. It is because of tworeasons: first, the growth of output due to technologicaladvancement decreases market price as long as market pricesare not dictated by any single firm. This reduction in priceeliminates those firms from the market who are slow in innovatingbecause prices have fallen lower than their minimum unit cost ofproduction. Secondly, the higher technological inventionincorporated in production process also means a higher fixedcost of production which implies higher entry cost. Thisconstraints and limits the potential increase in the number offirms within the market. Moreover, since technology usuallytranslates into higher production, therefore, the introduction ofhigher technology means that fewer, much larger, producers areneeded to satisfy the requirement of any given market. Accordingto Veblen [1904 (1967)] the result of the historical power hasbeen the transformation of industry from a larger number of smallproducers to that of a few larger producers. Standard economictheory assumes away the potential entrepreneurial threat to

Research
PAKISTAN BUSINESS REVIEW JULY 2011225
Refreshing Incoherence in Neoclassical Economic Theory
competition by assuming that profits attract entirely new entrantin the market. But in reality, a great deal of the new entry in capitalistmarkets takes place in the form of expansion in the scope ofexisting firms—i.e. through diversification and integration byalready established firms.
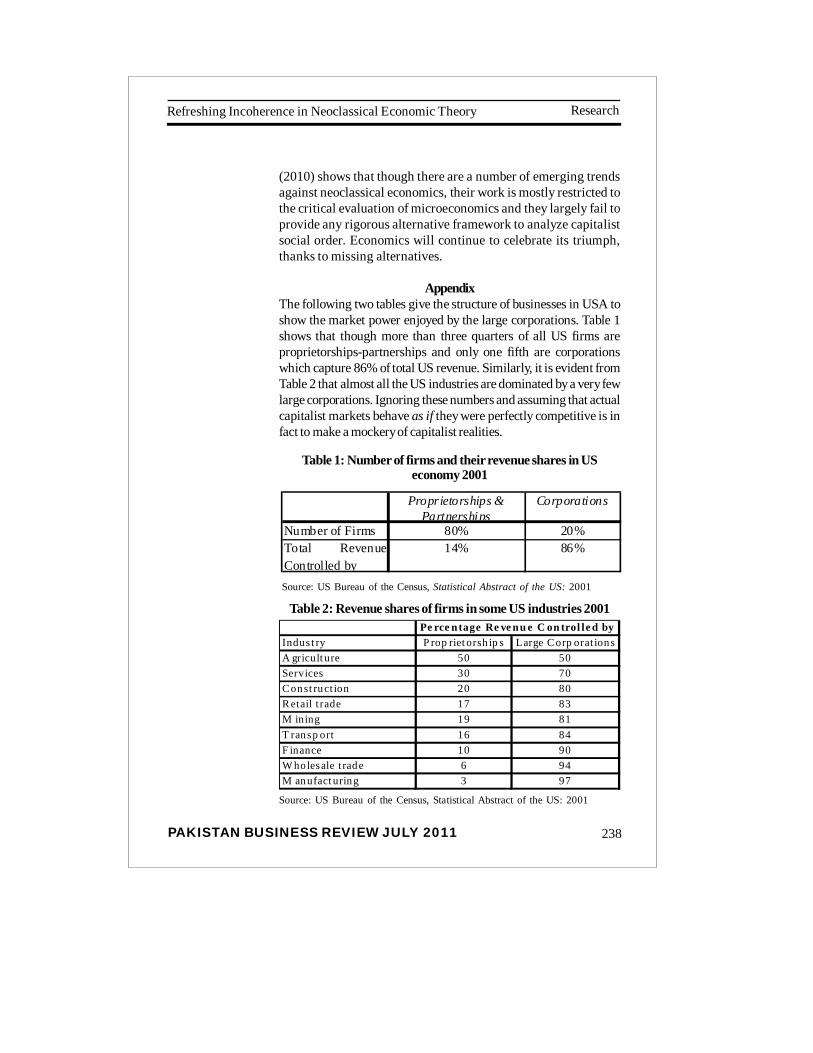
The above detrimental tendency for competition isfurther enhanced by the existence of increasing returns to scale.The standard economic theory usually assumes that monopolyhas no scale-advantages over a perfectly competitive firm. But, ingeneral, this assumption of scale-invariant costs is invalid becauselarge firms do benefit from returns to scale. Increasing returns toscale occur when the cost of production rises less rapidly thanthe output as the scale of production increases. If large firms dohave cost advantages over small ones, then given free competition,the large firms will drive the small ones out of the business. Inreality, no capitalist market can sustain hundreds or thousands ofcompetitive firms for a long time because economies of scale arealways there to be exploited. Hence, increasing returns to scalemeans that the perfectly competitive market is unsustainable. Itwill, over time, break down to a situation of either monopoly oroligopoly. The theoretical response of economists to this dilemmahas been to presume constant returns to scale. With constantreturns to scale, the size of the firm does not matter; a small firmwill be as effective as a large one. But the reality is that size doesmatter because economies of scale are an important part of thereason that most capitalist industries are dominated by a smallnumber of large firms (Tables 1 and 2 in the appendix provide ahighlight of concentration in US economy).
Similar to the technical advancements are the problemsof indivisibilities in production. Once an entrepreneur controlsmore and more resources, the size of that firm increases relative tomarket and one entrepreneur may become powerful enough toaffect the price of a good by varying output rather than acceptingit as a fact for decision making; the situation called imperfectcompetition. The argument is further strengthened if the givenfirm can constraint entry either by manipulating information; sayby advertising to influence consumer motivation, by havingpatents on production technology or by using limit pricing
PAKISTAN BUSINESS REVIEW JULY 2011
Research
226
Refreshing Incoherence in Neoclassical Economic Theory
strategy. The result of this anti-social behavior is the inefficiencyand inequity similar to the one discussed in section 4.6 for thesocial abuses of entrepreneurship.
The neoclassical response to the above criticism holdsthat sustained imperfect competition is difficult, if not impossible,for many reasons. Firstly, it is argued that even the largest firmshave their competitors in producing substitute goods, if not theidentical ones. Second, if a firm needs large scale investment projects,it usually needs to raise funds from financial institutions whichbring them under a critical and informed eye that judges itsperformance by its return to savers and not to its owner. This helpsspread of rewards over a wider group of consumers and not to theentrepreneur alone. Therefore, “pressure exists even on the largestfirm to keep prices down, distribute economic rent widely andmaintain productivity in line with smaller, specialist firms” [Cole,Cameron and Edward (1983): p. 77].
4.2: Markets without Stability
One of the important predictions of neoclassicaleconomic theory is the stability of markets; that is markets havean inherent tendency to return to equilibrium. This prediction isvulnerable to changes in the underlying assumptions about thestructure of the market. In a number of cases, markets go unstable.First, when economies of scale for the expanding firms at themarket level are present and no individual firm is able to achievethem the on its own. Since these economies are external to thefirm, it appears at the market level as a downward sloping supplycurve; i.e. the larger the output, the lower the minimum averagecost of production and, hence, the break-even price. However,the instability arises in this case if the supply curve slopesdownward faster than the demand curve. Another case whenthe supply curve can be negatively sloped without internaleconomies of scale is decreasing cost industry. The increase indemand causes industry output to increase but as industry growslarger; it can take advantage of its size to obtain some of its inputsmore cheaply. Here also the firm’s average cost curve shifts
Research
PAKISTAN BUSINESS REVIEW JULY 2011227
Refreshing Incoherence in Neoclassical Economic Theory
downward and the market price of the output falls. Second, instabilitycan arise even in the face of normal demand and supply curves iftime lag is assumed in supply responses, say due to the fact thatdecisions regarding production are to be made at the start of theperiod as in agricultural goods. This assumption will involve a processof adjustment over a time which turns out to be unstable if the slopeof the demand curve is steeper than that of supply curve. The modelthat studies this process is called cobweb model.8
However, the observation of these instabilities in termsof large variations in prices is no longer conclusive evidenceagainst economic criterion of falsification. A number of variablesare held constant to reach the demand and supply curves. Thevariations can be explained by extending reasons that shifts eitherdemand or supply or both of them. And, after all, formal empiricaltesting is not an essential element for the survival of neoclassicaleconomics, as stated by Cole, Cameron and Edward (1983):
“the criterion of success within subjectivepreference theory (neoclassical economics) is notin statistically valid observations, but is selfevident in the relative material well-being of thecitizens of those societies where governments haveappeared generally to act as if subjective preferencetheory were true” [p. 81, explanation added inbracket]
This takes us close to what Blaug (1980) has stated as:“economists do not practice what they preach”. The acceptedPopperian criterion for knowledge by prominent marginalists thatknowledge is scientific only if it is put into falsification in theface of observation is honored in principle, not in practice.9
8 See any good textbook on mathematical economics for it, such asChiang (1985).9An all important case of market instability arises by relaxing the assumptionof ‘representative agent’. However, this discussion would require a somewhatdetailed discussion about economic methodology which is beyond the scopeof this paper.
PAKISTAN BUSINESS REVIEW JULY 2011
Research
228
Refreshing Incoherence in Neoclassical Economic Theory
4.3: Capital Controversy
The theory of Investment is central to neoclassicalgrowth theories. These growth theories treat ‘capital’ as aseparate input in the production function to obtain the downwardsloping labor demand curve. The assumption of diminishingmarginal productivity implies decreasing returns to scale if laboris the only available input. Since decreasing returns to scale isthe assumption that is not compatible with the overall plan ofneoclassical production theory, the alternative assumption ofconstant returns to scale is made by introducing another inputthat is substitutable with labor if wages increase so as to offsetthe fall in output. The introduction of capital as a separate inputplays multiple roles: as a collection of machines it leads towardsgrowth theory, as a source of a form of reward, called interest,leads to aggregate distribution theory and as a result of technicalknowledge and natural resources leads towards internationaltrade theory as an expression of unequal endowments [Cole,Cameron and Edward: p. 94]. With downward sloping demandcurve for labor, the natural laws for unemployment, economicgrowth, international trade and income distribution betweeninputs could be shown to exist at the aggregate level as anextension of the laws of any single market.
But the major problem is the measurement of capitalstock of the economy. Adding up machines with warehousesrequires a common index and for neoclassical economics thatindex is the system of relative prices that reflect the value ofgoods and services. Unfortunately, this index inherits a built-inproblem because relative prices include interest paid out as partof the cost of goods included in capital stock. Capital isirretrievably a value quantity. In that case, if the price of capitalrises, then demand for it will decrease, however, the value ofcapital stock might rise or fall depending upon the demanders’intensity for capital. It is the treatment of capital being put onone axis in text books without even suggesting its problem thatallows neoclassical economists to reach rigorous logicalconclusions. But the Cambridge Capital Controversy that becameknown in the 1960s did have significant effects in the theoreticaldefeat of neoclassical economics. Cambridge Capital
Research
PAKISTAN BUSINESS REVIEW JULY 2011229
Refreshing Incoherence in Neoclassical Economic Theory
Controversy was a major theoretical controversy arising out ofthe work of Sraffa (1960). This controversy concludes that it isimpossible to deduce unambiguous predictions of any crucialvariables from aggregate capital models if capital is measured byusing prices to add up all types of manufactured inputs and rawmaterial. Even more counterintuitive conclusions can arise in muchmore complicated models with many techniques, many morecommodities, land-like natural resources, and fixed capital. In fact,these complications create surprising difficulties for traditionalneoclassical theory. An important negative implication of thisanalysis concerns the marginal productivity theory ofdistribution—that is, there is no such thing. At least one of thetwo special assumptions is necessary to obtain any meaningfulproposition: either the rate of interest should be zero which implieslabor only economy or the relative price between a unit of capitalinput good and a unit of final output good should remain rigidlyfixed which leaves no economic difference between the two goodsand we effectively live in a world where single good is consumedand stored to be used with labor to produce more of itself.Marginal productivity theory based on aggregate productionfunctions relies on too restrictive assumptions to have any hopeof being descriptive of capitalist reality. The Cambridge CapitalControversy showed that an abundance of traditional modelsimplicitly relied on special and unstated assumptions.
Neoclassical economists had no way out of this defeatand came out with the preservation that such cases either don’texist or are rare in practice and can be neglected so as to treat thewhole economy as if the price of an input was inversely related toits demand. Solow (1983) realized the negative consequences ofthe Cambridge criticism for his growth model; he proposed analternative basis for capital theory. He argued that the centralconcept of capital theory should not be capital, but the rate ofinterest as expressing a rate of return. Interest reflects a paymentfor deferring present consumption. By deferring presentconsumption, one can redirect the resources set free to producetools that will result in a greater stream of consumption in thefuture. Interest rates measure this supposed return on investment.He claims that the market rate will converge to this value in long-term equilibrium. However, no aggregate measure of capital seems
PAKISTAN BUSINESS REVIEW JULY 2011
Research
230
Refreshing Incoherence in Neoclassical Economic Theory
to appear in this formulation of interest rate theory. The interestrate appears to be purely a technocratic notion independent ofall considerations of pricing. It is still open to debate whetherneoclassical long-run equilibrium theories can survive without acentralized capital market equating investment and savings orthe demand and supply of capital. It is also a subject of discussionwhat, if anything, has been abandoned in such models. Capitalcontroversy apparently ended as a theoretical defeat ofneoclassical economics, at least to its critics.
Underneath the apparently technical debate of theCapital Controversy lies the clash of ideological and politicalviews of the two combating groups regarding the functioning ofmarket capitalist system. The Cambridge-England critics ofneoclassical economics regard market capitalism as an inherentlyantagonistic social order where different classes (such as workersand managers of capital) are trying to dominate each other. Theyargue that the distribution of surplus value cannot be understoodindependent of the political institutional structures of the marketcapitalist system. These critics, having rejected the marginalproductivity theory of income distribution, argue ‘for a return tothe Classical method of analysis in which pricing is an aspect ofdistribution’ instead of ‘distribution being but an aspect of pricing’(Harcourt: 1972). The Cambridge critics, following Mill,distinguished between the analysis of production and that ofdistribution. They reinforced Mill’s view that: ‘the laws andconditions of the production of wealth partake of the character ofphysical truths. There is nothing optional or arbitrary in them’,whereas, ‘It is not so with the Distribution of wealth. That is amatter of human institution(s) solely’.
Neoclassical economists, on the other hand, have someother beliefs. They struggle to show that capitalism isfundamentally characterized by harmony where each individualmakes voluntary choices as a market participant—this is thereason they employ the ‘equilibrium methodology’ to analyzethe market system. To them, the basic unit of a market capitalistsystem is ‘a self-interested individual’ and not ‘social classes’.Hence, in the neoclassical theory of income distribution there isno room for the analysis of ‘class-struggle’. Their theory pretends
Research
PAKISTAN BUSINESS REVIEW JULY 2011231
Refreshing Incoherence in Neoclassical Economic Theory
to show that the supply of inputs is determined by a great massof self-interested individuals and both production as well asdistribution is dictated by the ‘laws of nature’ (such as the lawsof demand and supply). The symmetric incorporation of ‘capital’as a factor of production alongside ‘labor’ in the neoclassicalproduction function is actually intended to incorporate the ideaof ‘social and political equality’ of labor and capital in marketcapitalism.
4.4: The Social Choice Dilemma
All societies do make social choices, the NationalAssembly passes the budget, university faculties establishcurricula, etc. A normative question that has taken much attentionis how to make such choices in a socially optimal way. In thestandard literature of welfare economics, social choice theorydeals with the problem of aggregating individual preferences overdifferent alternatives to construct a social welfare function sothat the alternatives could be evaluated in terms of their welfarefor the society.10 In principle, the same structure that is used toanalyze individual choices [i.e., maximization] should also beapplied for making social choices since society is merely a sumtotal of individuals. Further, since the social outcomes [i-e. thevalue of each activity] are the function of sum total of individualpreferences; the social choices should also be representative ofthose individual preferences [i-e. they should be democratic].
Keeping these reservations in view, the standardtreatment of social choice theory regards society’s welfare as nomore than the aggregate of individual utilities as perceived by theindividuals themselves. This aggregation takes the form of amajority voting mechanism whereby the weights of eachalternative project are obtained on the basis of the number ofvotes in favor of that project. The social choice theory has thecharacteristic that the social planner, usually an institution, mustconstruct its objective function from the information gathered.The decision context in the social choice theory is the set ofpossible individuals’ cardinal utility functions. If these utility
10 See Sen (1986), Jhele & Reny (1998) and Gravelle & Rees R. (1994)for details.
PAKISTAN BUSINESS REVIEW JULY 2011
Research
232
Refreshing Incoherence in Neoclassical Economic Theory
functions are interpersonally comparable, we should be able tochoose the exact social ordering without any ambiguity. Thisrelationship between decision context and preference orderingis called performance correspondence. For any decision context,the performance correspondence tells which ordering will satisfythe performance criterion. However, the planner cannot use thisknowledge to construct an ordering over the social statesbecause there are certain non-comparability restrictions imposedon his frame; that is utility levels are non-comparable acrossindividuals. Therefore, he must take an indirect route and specifya voting institution for the people in a society to use. He canonly work with a set of individual ordering over states revealedby that voting mechanism to form the social ordering. Thus, thesocial choice theory is concerned with the existence of a functiontransforming or aggregating individual orderings into socialordering under these non-comparability assumptions.
Arrow (1963) demonstrated that under certainrestrictions on knowledge received by the social planner, anoverall ordering possessing some reasonable properties cannotexist [those properties are consistency, transitivity, unrestricteddomain, non-dictatorship, weak Pareto preference andindependence of irrelevant alternatives]. This negative theorem,called Arrow’s Impossibility Theorem, states that no decisionrule based on individual preferences can be completelysatisfactory to choose among different alternatives. Any socialdecision rule that is chosen on majority voting basis must bedominated; that is we must relinquish either the desire fortransitive preferences (the very basis for rationality) or democracy(the very basis for society).
There have been various attempts to rescue socialchoice theory from the grip of Arrow’s impossibility theorem.One focus of attention has been the restrictions on the type ofpreferences that are allowed. An important result discovered byBlack (1983) which says that equilibrium voting outcomes alwaysoccur if the issue being voted is one-dimensional (i. e., alternativesdiffer only in one characteristic) and voters preferences are‘single-peaked’. But if the issues of public choice are ofmultidirectional, as they normally are, then Black’s result is of
Research
PAKISTAN BUSINESS REVIEW JULY 2011233
Refreshing Incoherence in Neoclassical Economic Theory
little importance. Another attempt to rescue social choice dilemmahas been to relax the restrictions on the type of information that isconveyed by individual evaluations. In the above-mentionedArrow’s framework, if the restrictions on knowledge are relaxedand evaluations are assumed to be measurable and characteristicsare comparable to certain extents, interesting possibilities emerge.The basic references for this line of work include Hammond (1976),Roberts (1980) and Sen (1976). However, those relaxations requireso much information to be conveyed that they become implausibleand unobserved in practice. The social choice remains a dilemma.
Sen (1970) took up the social choice dilemma andpresented an impossibility result that has even more disturbingconsequences for the principles of social choice. He, unlikeArrow’s theorem, neither required the transitivity of socialpreferences, but merely required the existence of a best alternativein each choice situation, nor the assumption of independence ofirrelevant alternatives. Even with this mild formulation, it turnedout to be the case that “liberal values even in a very mild formcannot possibly be combined with the weak Pareto principle,given an unrestricted domain…While the Pareto criterion hasbeen thought to be an expression of individual liberty, it appearsthat in choices involving more than two alternatives it can haveconsequences that are, in fact, deeply illiberal” [Sen (1970): p.155]. The framework of rational choice does not allow even theminimal liberalism. “The society cannot let more than oneindividual be free to read what they like, sleep the way they prefer,dress as they care to, etc., irrespective of the preferences ofothers in the community” [Sen (1970)]
4.5: Social Abuses of Rationality
The choice between an individual’s best interest andthe group’s best interest is a choice we all must make constantly.As explained previously, standard neoclassical economicsassumes that there is an invisible hand that guides self-interestmaximization to the well-being of society. Nash (1928-)demonstrated that social exchanges involve games in whichseveral agents interact with actions of each usually affecting thevalued results for all and players must often make guesses about
PAKISTAN BUSINESS REVIEW JULY 2011
Research
234
Refreshing Incoherence in Neoclassical Economic Theory
the actions of other agents in order to choose their own bestresponse. Game theory attempts to explain exchange results ofsuch complex interactions. The problem raised by this analysiswas that we don’t always choose what is best for society andourselves even though we make rational choices! The classicexample in game theory, called the prisoner’s dilemma, originatedby Nash (1950) illustrates this problem. In the Prisoner’s Dilemma,a situation is described in which rewards are in amounts suchthat it would be in the mutual best interests of the participantsfor both to cooperate but the best interests of an individual is todefect. In particular, if you played the game over and over andyou added up everyone’s score, the total would be a maximum ifeveryone cooperated all the time. Yet a rational player is presenteda payoff matrix that pays most for defection in every single play.Even communication cannot help maintain cooperation in oneshot Prisoner’s dilemma game; only changing the payoffstructure can maintain cooperation. The essence of the story isthat self-interest seeking behavior is not the best policy in allcases, not only for society but also for individuals.
Following the above arguments, we should have noproblem accepting the argument that most crime is a direct resultof the ‘individual over individual’s group choice’. That is, crimeis usually committed based on the individual’s assessment thathis/her benefit will exceed the personal cost. Similarly, politiciansas well as policemen generally do what is in their own best interestswith disastrous impact on society in general by replacingexchange with ‘theft’—even though they are a member of thatsociety. Why should a politician do what is best for theircommunity when much greater personal rewards can be achievedin other ways? Why should politicians return control to thestates or the individuals? If all individuals are maximizers of theirown interest, this same principle should logically be applied totheir elected representatives. The question of who controls thecontrollers is generally not faced by the economists.11
There are two major aspects to this paradox, both ofwhich present enormous difficulties for a society based onexchange interaction. First, while it is true that a particular
11 See Stigler (1941) for some discussion on this issue.
Research
PAKISTAN BUSINESS REVIEW JULY 2011235
Refreshing Incoherence in Neoclassical Economic Theory
endeavor would return a benefit to all members of the groupwhere each individual would receive rewards that more thancompensate for each individual’s contribution, it is also true thatany particular individual would receive an even greater net returnby not contributing anything. Good examples are elections, roads,water supplies, and other large investments. Yet, at the same time,it is obvious that for a particular individual, his/her maximumreturn is obtained by making no contribution—that is, free-riding.The second major component is that of the “Voter’s Paradox”,that is while it is true that the outcome of a group effort is made upof the sum of the individual efforts, in many cases a particularindividual’s contribution makes no significant and/or measurableimpact on the outcome. On a national election, one vote cannotpossibly determine the outcome of the election. Massive non-cooperation results in a breakdown of many group activities thatwould be useful. The massive growth of the welfare roles, crime,government spending, government waste, etc., are examples ofindividuals maximizing their own return at the expense of thegroup. The paradox is that they are acting rationally.
How might cooperation be maintained? One answer isto have some sort of enforcement of contracts that changes thepay-offs so that reneging is no longer profitable. But this involvescomparing the benefits from gains against the costs of stateresources from the existence of such an institution. Another wayto induce cooperation is creating the shadow of future. If theplayers may be involved in the contracts other than the onediscussed in future times, then the incentive of each party changesbecause cheating will cause loss of value in future plays. Similarly,reputation developed from past honoring of contracts or renegingcan also affect the behavior of future trading partners. Despitethese possibilities of cooperation, neoclassical economistsassume that these adverse cases are not widespread in practiceand exclude them by assumption. After all, that society functionsat all is a testimony for marginalist methodology to the fact that alarge part of society does cooperate. Fortunately, it does notrequire 100 percent cooperation for most group efforts to succeed.Many public projects function with only a small percentagecontributing. Voting is a good example in this regard. Moreover,this criticism has left limited impact because “the general principle
PAKISTAN BUSINESS REVIEW JULY 2011
Research
236
Refreshing Incoherence in Neoclassical Economic Theory
that market prices do reflect the real scarcity or abundance ofgoods and services is not fundamentally challenged” [Cole,Cameron and Edward (1983): p. 99].
5: Conclusion: Why Economics?
One would wonder why, despite after so much criticalexposition, neoclassical economics has not only survived but alsodominated the academic circles of economics. The answer to thisquestion lies neither in the fact that there is ‘some deeper truth’hidden behind microeconomic theories nor that these theories havebeen shown to explain the empirical realties of capitalist order, rathera major reason for the sustainability of neoclassical economicsrests on the fact that it continues to provide a justification for theagenda of liberal capitalism against religious social order. Economicsas a distinct academic discipline arose at a time when Europe wasundergoing a social transformation—a transformation fromChristianity to capitalism. The new capitalist class was asking forthe removal of political and social controls on individuals and societywhich were justified on the grounds of religious doctrine. Since areligious social order seeks to structure all social institutions so asto maximize the opportunities for the fulfillment of the Will of God,it necessarily imposes restrictions to discourage the immoralimpulses of ‘accumulation and competition’ (i.e. greed and envy)—the impulses which ultimately commit an individual to ‘rivalry inworldly goods’ as an end in itself. In the social environment ofEurope during the 18th century, economic theory provided a counterto the religious way of thinking about individual, society and state.The emerging capitalist class faced social and political barriers andrestrictions and whenever they objected to these barriers, theywere reminded that these controls were needed to maintain thesocial order. At this critical juncture, economic theory armed thecapitalist class with an effective rejoinder against the priests: itbrought forth the idea that a system of government was not neededto maintain social order, instead social order and harmony arisespontaneously and naturally in a market economy where eachindividual is guided by only his or her self-interestedness. Theecho of this idea was also found in Smith’s famous ‘invisible hand’doctrine which played a key role in the transformation taking placeduring the 18th century in Europe. Economists, since that time,
Research
PAKISTAN BUSINESS REVIEW JULY 2011237
Refreshing Incoherence in Neoclassical Economic Theory
proposed that the essential feature of a market social order was‘equilibrium’—reflecting a state of social harmony. They preachedthe assumption that a market system necessarily and inherently tendstowards equilibrium. If markets automatically and spontaneouslyattain equilibrium, then everything happens in equilibrium, hence inharmony, in a market system. This impersonal, spontaneous, naturaland automatic ‘market equilibrium’ was presented to replace thelegislative order of the European Christendom. Keen (2004) has rightlypointed out that ‘if, instead of equilibrium, economists had promisedthat capitalism would deliver chaos; if, instead of meritocracy,economists had said that capitalism could concentrate inequality,then economists could have hindered rather than helped the transitionto capitalism’ (p. 162). It is specifically due to the service of this‘economic vision’ that economics has been able to resist all itscritics—though, over the last century, it has been proved thateconomic theory is full of incoherence, but over the years thecommitment to the ‘economic vision’ has become stronger. Contraryto the neoclassical economists’ assertion that ideology plays no rolein the development of positive economic theory, it is in fact thedefense of this core economic ideology that has made economictheory so resistant to change because the heterodox critics ofeconomic theory have asked it to abandon the core belief of‘equilibrium’. It is rightly pointed out that ‘equilibrium’ is more thanjust a concept in neoclassical economics, it is a sweeping ontologicalpronouncement on the nature of capitalist social reality and, therefore,it is not open to direct conformation or refutation [Fullbrook (2005)]—it is presented as an apriori article of faith. Thus, the resistance tostick with economic theory is deeply embedded in ideologicalreasons. By using economics doctrines, economists try to rationalizethe belief that capitalism is a rational system—in the sense thatmaximizing utility / self-interest / freedom maximizes social welfare orfreedom. In this sense, economics is the religion of modern orenlightened man who treats its ‘belief system’ as unshakable dogmatictruths. This explains Stiglitz’s assertion that economics has sufferedfrom the ‘triumph of ideology over science’ [Stiglitz (1941)].
Another reason why neoclassical economics hasmanaged to survive despite its incoherence is the absence of anygrand alternative competing theory to microeconomics. The surveyof alternative schools of thought given by Siddique and Ansari
PAKISTAN BUSINESS REVIEW JULY 2011
Research
238
Refreshing Incoherence in Neoclassical Economic Theory
(2010) shows that though there are a number of emerging trendsagainst neoclassical economics, their work is mostly restricted tothe critical evaluation of microeconomics and they largely fail toprovide any rigorous alternative framework to analyze capitalistsocial order. Economics will continue to celebrate its triumph,thanks to missing alternatives.
AppendixThe following two tables give the structure of businesses in USA toshow the market power enjoyed by the large corporations. Table 1shows that though more than three quarters of all US firms areproprietorships-partnerships and only one fifth are corporationswhich capture 86% of total US revenue. Similarly, it is evident fromTable 2 that almost all the US industries are dominated by a very fewlarge corporations. Ignoring these numbers and assuming that actualcapitalist markets behave as if they were perfectly competitive is infact to make a mockery of capitalist realities.
Table 1: Number of firms and their revenue shares in USeconomy 2001
Proprietorships & Partnerships
Corporations
Number of Firms 80% 20%Total RevenueControlled by
14% 86%
Indus t ry P rop riet orsh ip s Large C orp orat ionsA gricult ure 50 50Services 30 70C onst ruct ion 20 80R etail t rade 17 83M ining 19 81T ransp ort 16 84F inance 10 90W holesale t rade 6 94M anufact uring 3 97
Pe rce ntage Re ve nu e C on trol le d by
Source: US Bureau of the Census, Statistical Abstract of the US: 2001
Table 2: Revenue shares of firms in some US industries 2001
Source: US Bureau of the Census, Statistical Abstract of the US: 2001
Research
PAKISTAN BUSINESS REVIEW JULY 2011239
Refreshing Incoherence in Neoclassical Economic Theory
References
Akerlof (1982), “Labor contracts as partial gift Exchange,”Quarterly Journal ofEeconomics, Vol. XCVII, 543-69
Akerlof and Yellen (1985a) “A near rationality model of thebusiness cycle, with wage and price inertia”, Quarterly Journalof Economics, supplement, 1985, 823-838
Akerlof and Yellen (1985b) “Can small deviations from rationalitymake significant difference to economic equilibrium?” AmericanEconomic Review, Sep 1985, 75, 708-20
Arrow K. J. (1963), “Social Choice and Individual Values”, 2nd
Ed., Wiley, New York
Black Max (1983), “Why Should I be Rational”, in The Prevalenceof Humbug and Other Essays, Cornwell University Press
Blaug M. (1980), Methodology of Economics, CambridgeUniversity Press, New York
Boland A. Lawrence (1992), The Principles of Economics: somelies my teachers told me, Routledge, London and New York
Carter A. (1988), Marx: A Radical Critique, Westview Press,Boulder, Colorado
Chiang A. C. (1985), Mathematical Economics, 3rd Ed., McGrawHill
Cole K, J. Cameron, and C. Edwards (1983), Why EconomistsDisagree, The political economy of economics, Longman GroupLimited
Conlisk J. (1996), “Why bounded rationality?”, Journal ofEconomic Literature, 1996, Vol. XXXIV, 669-700
Friedman Milton (1953), Essays in Positive Economics, ChicagoUniversity Press, Chicago
PAKISTAN BUSINESS REVIEW JULY 2011
Research
240
Refreshing Incoherence in Neoclassical Economic Theory
Friedman Milton (1982), Capitalism and Freedom, Chicago,University of Chicago Press
Friedman Rose and Friedman Milton (1980), Free to Choose,Harcourt Brace Jovanovich, New York and London
Ferguson Adam (1776), An Essay on the History of Civil Society,[Alex Callinicos 1969, Social Theory, p. 26, Polity Press]
Fullbrook Edward (2005), “Are You Rational?”, A Guide to Whatis Wrong with Economics, p. 71-83, Edward Fullbrook London
Gardiner G. W. (2004), ‘The primacy of trade debts in thedevelopment of money’, in L.R. Wray (ed.), Credit and StateTheories of Money: The contributions of A. Mitchell Innes, 128-172, Cheltenham, UK
Gordon David M. (1987), “Left, Right and Centre: An introductionto Political Economy”, in Imperiled Economy edited by RobertCherry et al. New York, Union for radical political economics
Gravelle H. and Rees R. (1994), Microeconomics, 2nd ed., AddisonWesley Longman, USA
Hammond P. J. (1976), “Equity, Arrow’s conditions and Rawls’difference principle”, Econometrica, 44: 793-804
Harcourt (1972), Some Cambridge Controversies in the Theoryof Capital Cambridge University Press, London
Henry J. F. (1990), The Making of Neoclassical Economics,Boston, Unwin Hyman, London, Sydney, Willington
Jhele A. and Reny P. (1998), Advanced Microeconomic Theory,Addison Wesley Longman, USA
Kahneman and Tversky (1979), “Prospect Theory: An analysisof decision under risk”, Econometrica, March, 47(2), 263-91
Kahneman and Tversky (1991), “Loss aversion and risk lesschoice: A reference dependent model”, Quarterly Journal ofEconomics, 1991, 1039-1061
Research
PAKISTAN BUSINESS REVIEW JULY 2011241
Refreshing Incoherence in Neoclassical Economic Theory
Kaufman (1999), “Emotional arousal as a source of boundedrationality”, Journal of Economic Behavior and Organization,38, 1999, 135-44
Keen Steve (2004), Debunking Economics, Zed Books, Londonand New York
Kuhn, T. S. (1970), The Structure of Scientific Revolutions, 2nd
ed., Chicago University Press
Leibenstein H. (1979), “A Branch of Economics is Missing: Micro-Micro Theory, Journal of Economic Literature, 17: 477-502
Looms and Sugden (1982), “Regret Theory: An alternative theoryof rational choice under uncertainty”, Economic Journal,December: 92, 805-24
Marx K. (1898), Value, Price and Profit, Swan Sonnenschein andCo., London
Marx K. (1970), A Contribution to the Critique of PoliticalEconomy, Progress Publishers, Moscow (1971, InternationalPublishers’ Co., New York)
Marx K. and Engels F. (1967), Communist Manifesto,Harmondsworth: Penguin Books
Mayhin Anne (2005), “Where Do Economies Come From? TheMissing Story”, A Guide to What is Wrong with Economics, p.46-55, Edward Fullbrook London
Moore and Bruder (2002), Philosophy: The Power of Ideas,McGraw Hill, USA
Nash John (1950), ‘The Bargaining Problem’, Econometrica
Raz J. (1986), The Morality of Freedom, Oxford University Press
Robert Sudgen (1991), “Rational Choice: A Survey of contributionsfrom Economics and Philosophy”, Economic Journal, Dec 1991,101, 751-85
Roberts K. W. S. (1980), “Interpersonal comparability and socialchoice theory”, Review of Economic Studies, 47: 421-439
PAKISTAN BUSINESS REVIEW JULY 2011
Research
242
Refreshing Incoherence in Neoclassical Economic Theory
Sandel M. (1982), Liberalism and the Limits of Justice, CambridgeUniversity Press
Schotter A. (1997) Microeconomics, 2nd ed. Addison WesleyLongman, USA
Sen A. K. (1970), “The impossibility of Paretian Liberty”, Journalof Political Economy, 72: 152-157
Sen A. K. (1977), “On weights and measures: informationalconstraints in social welfare analysis”, Econometrica, 45: 1539-1572
Sen, A. K. (1986), “Social Choice theory”, in: K. J. Arrow and M.D. Intrilligator, eds, Handbook of Mathematical Economics, Vol.III (North Holland, Amsterdam): 1073-1181
Siddique Zahid and Javed Ansari (2010), Microeconomics inPakistan: Theory, Practice and Evaluation, unpublished book(shortly to be published)
Simon H. (1979), “Rational Decision Making in BusinessOrganizations”, American Economic Review, papers andproceedings, 69, 493-513
Solow R. and Carry Brown (1983), “Modern Capital Theory”, inPaul Samuelson and Modern Economic Theory, McGraw Hillcompany, New York
Sraffa P. (1960), Production of Commodities by Means ofCommodities, Cambridge University Press, Cambridge and NewYork
Stigler J. (1941), “The Theory of Economic Regulation”, BellJournal of Economics 2, (Spring 1941), 3-21
Taylor C. (1990), Sources of the Self, Cambridge University PressTversky and Thaler (1990), “Anomalies: Preference reversal”,Journal of economic perspective, 1990, 4(2), 201-11
Veblen Thorstein (1904 [1967]), The History of BusinessEnterprise, New York: Charles Scribner’s Sons
Weeks John (1981), Capital and Exploitation, PrincetonUniversity Press
PAKISTAN BUSINESS REVIEW JULY 2011243
Research Assessing the Relationship between Leadership and Conflict Management Styles
ASSESSING THE RELATIONSHIPBETWEEN LEADERSHIP AND
CONFLICT MANAGEMENTSTYLES IN THE BANKING
SECTOR OF PAKISTAN
Humayun ZafarDepartment of Management
College of Business Management, Karachi
Abstract
The purpose of this paper is to assess the relationship of Blakeand Mouton’s leadership grid with the conflict resolutionstrategies of the leaders. These strategies categorized byBernardin and Alvares (1976) are: accommodating, avoiding,compromising, competing and collaborating.
The purpose of this article is to study the positive relationshipof the Blake and Mouton (1964) leadership styles with thesestrategies in Pakistan. Three categories of executives in thebanking industry were chosen, comprising of 19 employees ineach category and the categories were those of managers, seniormanagers and top executives.
The results of the study show that a growing number ofexecutives in all the three categories perceived themselves to bepracticing the team management style, and the proportion ofthis was found to be highest in the category of top executives.
Keywords: SAMS (self assessment management skills) conflictresolution strategies, collaborating, accommodating, concern forproduction and concern for task
JEL Classification: M 1100
Research
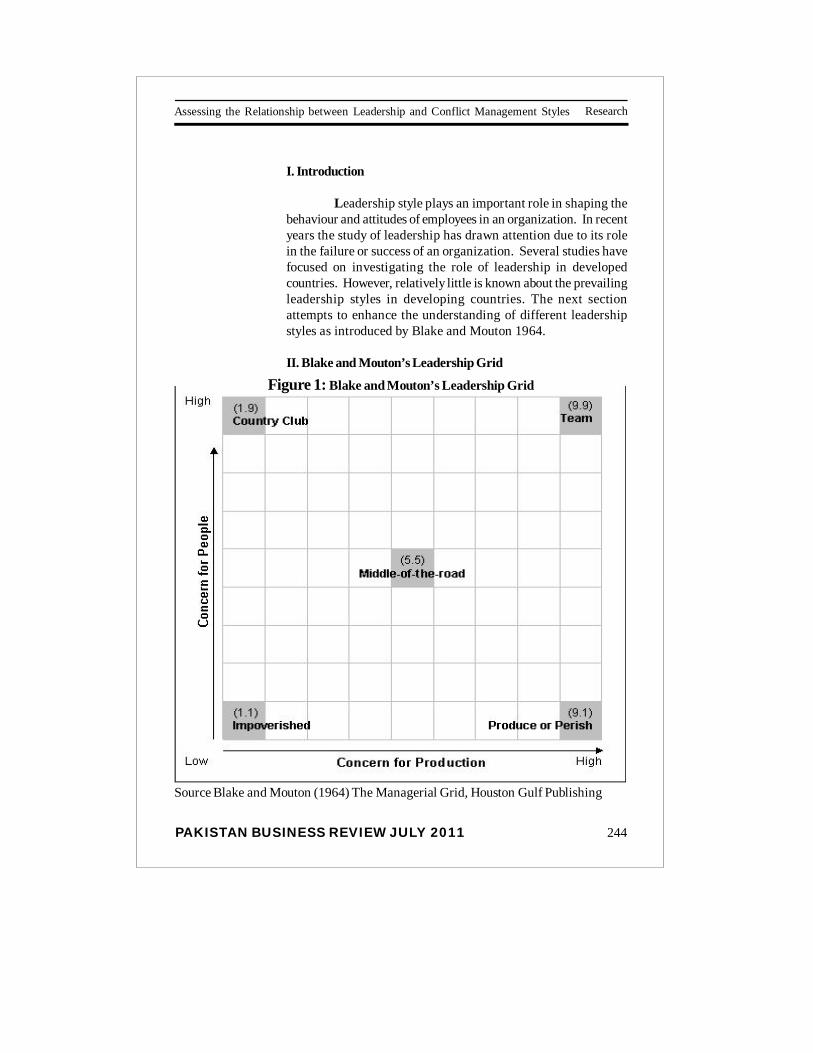
PAKISTAN BUSINESS REVIEW JULY 2011
Research
244
Assessing the Relationship between Leadership and Conflict Management Styles
I. Introduction
Leadership style plays an important role in shaping thebehaviour and attitudes of employees in an organization. In recentyears the study of leadership has drawn attention due to its rolein the failure or success of an organization. Several studies havefocused on investigating the role of leadership in developedcountries. However, relatively little is known about the prevailingleadership styles in developing countries. The next sectionattempts to enhance the understanding of different leadershipstyles as introduced by Blake and Mouton 1964.
II. Blake and Mouton’s Leadership Grid
Figure 1: Blake and Mouton’s Leadership Grid
Source Blake and Mouton (1964) The Managerial Grid, Houston Gulf Publishing
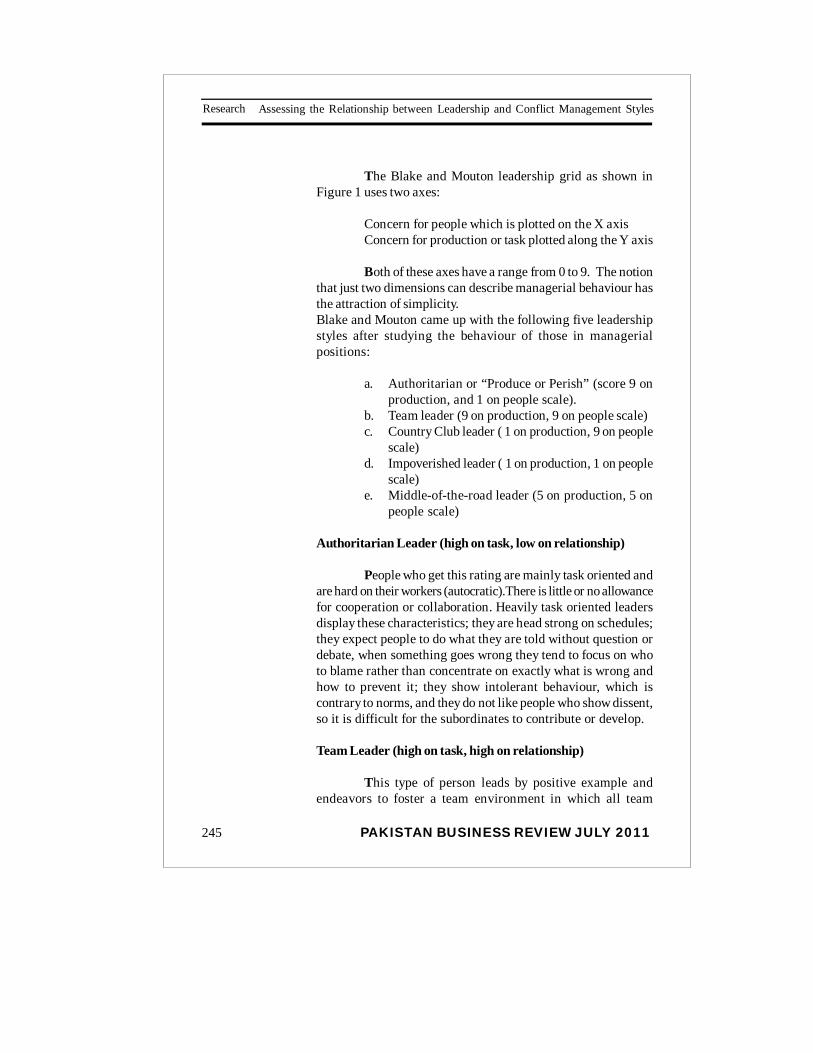
PAKISTAN BUSINESS REVIEW JULY 2011245
Research Assessing the Relationship between Leadership and Conflict Management Styles
The Blake and Mouton leadership grid as shown inFigure 1 uses two axes:
Concern for people which is plotted on the X axisConcern for production or task plotted along the Y axis
Both of these axes have a range from 0 to 9. The notionthat just two dimensions can describe managerial behaviour hasthe attraction of simplicity.Blake and Mouton came up with the following five leadershipstyles after studying the behaviour of those in managerialpositions:
a. Authoritarian or “Produce or Perish” (score 9 onproduction, and 1 on people scale).
b. Team leader (9 on production, 9 on people scale)c. Country Club leader ( 1 on production, 9 on people
scale)d. Impoverished leader ( 1 on production, 1 on people
scale)e. Middle-of-the-road leader (5 on production, 5 on
people scale)
Authoritarian Leader (high on task, low on relationship)
People who get this rating are mainly task oriented andare hard on their workers (autocratic).There is little or no allowancefor cooperation or collaboration. Heavily task oriented leadersdisplay these characteristics; they are head strong on schedules;they expect people to do what they are told without question ordebate, when something goes wrong they tend to focus on whoto blame rather than concentrate on exactly what is wrong andhow to prevent it; they show intolerant behaviour, which iscontrary to norms, and they do not like people who show dissent,so it is difficult for the subordinates to contribute or develop.
Team Leader (high on task, high on relationship)
This type of person leads by positive example andendeavors to foster a team environment in which all team
PAKISTAN BUSINESS REVIEW JULY 2011
Research
246
Assessing the Relationship between Leadership and Conflict Management Styles
members can reach their highest potential, both as team membersand as people. They encourage the team to reach team goals aseffectively as possible, while also working tirelessly to strengthenthe bonds among the various members. They normally form andlead some of the most productive teams.
Country Club leader (low on task, high on relationship)
As the name suggests, this person uses predominantlyreward power to maintain discipline and to encourage the team toaccomplish its goals. Conversely, they are almost incapable ofemploying punitive, coercive and legitimized powers. Thisinability results from the fear that using such powers couldjeopardize relationships with the other team members, and thuswould render them unpopular in their respective domains. Thistype of leader which was described by Lewin, Lippit and White in(1938) as a”Laizzez-Faire” leadership style.
Impoverished leader (low on task, low on relationship)
This is a leader who uses a “delegate and disappear”management style. Since they are not committed to either taskaccomplishment or relationship maintenance; they essentiallyallow their team to do whatever it wishes and prefer to detachthemselves from the team process by allowing the team to sufferfrom a series of power struggles and failures. Source: BartolKathryn Tien Margaret Mathews Graham Martin David 4th ed.Management: A Pacific Rim focus
Middle-of-the-road (equal concern for task, equal concern forpeople)
Such a leader is a compromiser, a politician who wantsto maintain the status quo. B.J. Avolio, (2002)has identified thiscriteria of leadership as being that of a transactional leadershipstyle, enforcing the notion that this type of leader perform up tothe minimum expected level of performance, which is required inorder to justify their stay or tenure in the organization.
PAKISTAN BUSINESS REVIEW JULY 2011247
Research Assessing the Relationship between Leadership and Conflict Management Styles
Leadership styles depend upon conditions, which aretypical of certain organizations. Furthermore, they also dependupon the situations in which people are performing in theirrespective organizations. These include working conditions, payscales, fringe benefits, hygiene conditions, etc.
A survey was carried out by Blake & Mouton (1964) inthe United States to identify leadership styles, in manufacturingindustry and for that purpose a questionnaire was developed,which served as the research instrument for subsequent analysis.
A valid criticism of the Blake & Mouton model is that itis a weak indicator for judging managerial behaviour or style ofleadership, because the results solely rest upon filling out asimple questionnaire without using other sophisticated researchinstruments, so anyone can deceive the researcher by filling outthe questionnaire, citing all the examples and traits which pointto the welfare of people, and project himself as a “people –oriented leader” Answers to the questionnaire, reflect only theself perception of the respondents and are not, therefore, anobjective assessment of their managerial characteristics.
According to Blake & Mouton, although most managersadmire and see themselves as operationalising a teammanagement style, this style is not easily achievable in practice.There have been instances in the past, where leaders have attainedthe team management styles in their respective organizations,but were unable to sustain them over the long run.
Blake and Mouton’s Managerial Grid (1964) still servesas the basis for research in the areas of leadership studiesbecause the pivotal point in leadership studies is thedetermination of leadership styles, and the focus is often ondetermining to what extent a leader adjusts his style to changingsituations and circumstances.
The managerial grid is widely used to gauge leadershipeffectiveness and it has been adopted extensively by severalmajor industrial organizations throughout the world in order toimprove interpersonal effectiveness and develop leadershipskills.

PAKISTAN BUSINESS REVIEW JULY 2011
Research
248
Assessing the Relationship between Leadership and Conflict Management Styles
III The Bernardin – Alvares conflict resolution stylecharacterization
John Bernardin and Kenneth M. Alvares (1976) arguethat despite the claims made by Blake and Mouton the grid theoryhas been subjected to relatively limited empirical testing. However,the companies which adopted the grid methodology did reportchanges in their profits and productivity, whether the changeswere in part due to the team management style practiced by theirsupervisors, or due to other factors remains questionable.
Bernardin and Alvares have placed strong emphasis onconflict resolution strategies, and their hypothesis testing is alsoaccordingly based:
The following hypotheses have been generated byBernardin and Alvares:
1. SAMS (self assessment management skills) asidentified by Blake and Mouton’s managerial gridshould predict preferred conflict resolutionstrategies. The 9.9 team oriented supervisor shouldprefer the collaborating resolution strategy, the 5.5middle of the road supervisor should prefer acompromise strategy and the 9.1 task orientedsupervisor should prefer a forcing strategy. Thishypothesis is tested by Bernardin and Alvares fortwo managerial levels It is posited that therespondents exhibit the above predicted correlationbetween leadership and conflict management styles.
2. On the other hand, Blake and Mouton would predicta significant relationship between scores on theSAMS and effectiveness ratings from subordinatesand superiors. More particularly, they predict thatthe team-oriented supervisor would be ratedsignificantly higher in effectiveness thansupervisors with other orientations.
PAKISTAN BUSINESS REVIEW JULY 2011249
Research Assessing the Relationship between Leadership and Conflict Management Styles
One hundred twenty-nine employees of a largeAmerican Midwestern manufacturing company participated inthe Alvares (1976) study on determining the relation betweenleadership and conflict resolution styles. The employees camefrom construction and maintenance departments of the firm.Participants had received no previous formal managerial training.The sample included all general foremen in the department, atleast four first line supervisors in each section of the department,and at least one subordinate working under all supervisors. Ofthose receiving requests to participate, forty one out of fiftygeneral foremen, forty six out of fifty five first line supervisors,and forty two out of seventy three subordinates returned usablequestionnaires. All supervisors had to have occupied theirpresent position for at least three months and all subordinateshad to have worked under the same first line supervisor at leastfor three months.
Participants were asked to rank paragraphs ofbehavioral descriptions from most to least typical of themselvesand then to select from groups of statements those that bestdescribe their own behaviour. The conflict situation sectionconsisted of various situations and this can be defined by usingthe following example:
“A job deadline is approaching that a foreman’ssupervisor has emphasized to be met. The foreman, however,feels his men’s safety may be jeopardized if work is speeded upto assure meeting the deadline. What should the foreman do?”Following strategies are available to a supervisor:
1. Forcing —— he makes what he himself feels is theappropriate decision and emphasizes that theworkers have no choice but to comply (Blake andMouton’s)authoritarian style (9.1)
2. Compromise —— he looks for a compromise; hetries to find some sort of common ground andattempts to please everyone Blake and Mouton’smiddle of the road style (5.5)
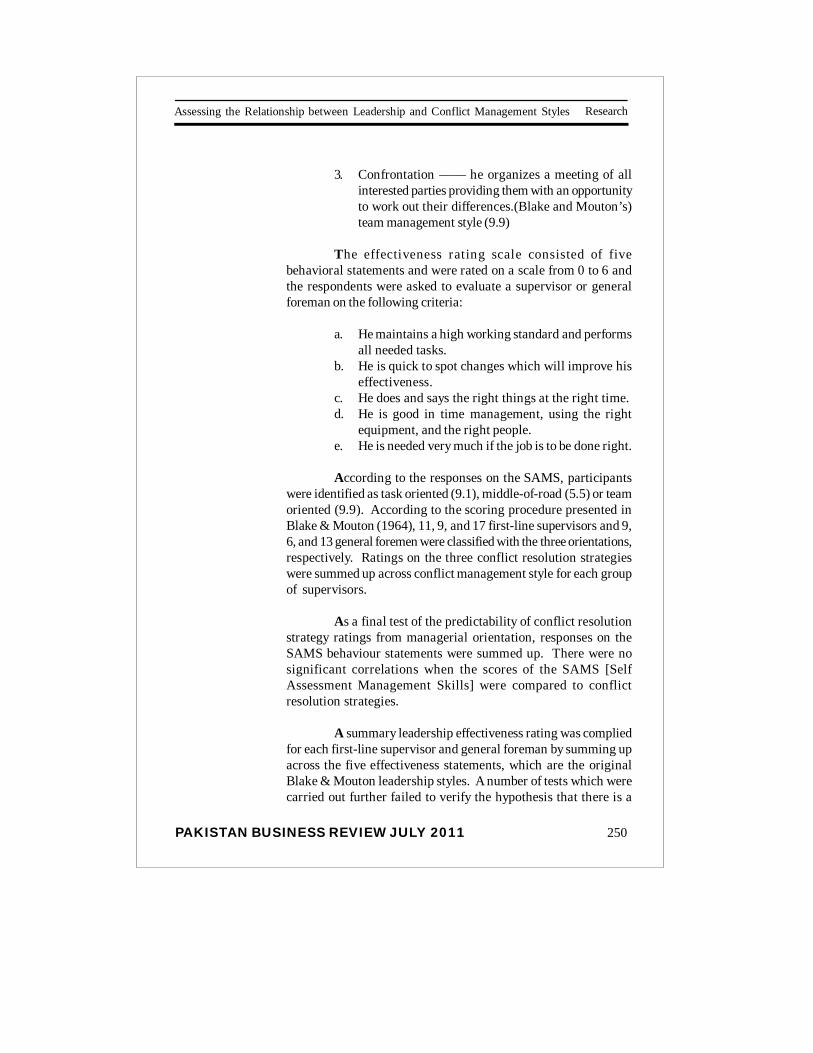
PAKISTAN BUSINESS REVIEW JULY 2011
Research
250
Assessing the Relationship between Leadership and Conflict Management Styles
3. Confrontation —— he organizes a meeting of allinterested parties providing them with an opportunityto work out their differences.(Blake and Mouton’s)team management style (9.9)
The effectiveness rating scale consisted of fivebehavioral statements and were rated on a scale from 0 to 6 andthe respondents were asked to evaluate a supervisor or generalforeman on the following criteria:
a. He maintains a high working standard and performsall needed tasks.
b. He is quick to spot changes which will improve hiseffectiveness.
c. He does and says the right things at the right time.d. He is good in time management, using the right
equipment, and the right people.e. He is needed very much if the job is to be done right.
According to the responses on the SAMS, participantswere identified as task oriented (9.1), middle-of-road (5.5) or teamoriented (9.9). According to the scoring procedure presented inBlake & Mouton (1964), 11, 9, and 17 first-line supervisors and 9,6, and 13 general foremen were classified with the three orientations,respectively. Ratings on the three conflict resolution strategieswere summed up across conflict management style for each groupof supervisors.
As a final test of the predictability of conflict resolutionstrategy ratings from managerial orientation, responses on theSAMS behaviour statements were summed up. There were nosignificant correlations when the scores of the SAMS [SelfAssessment Management Skills] were compared to conflictresolution strategies.
A summary leadership effectiveness rating was compliedfor each first-line supervisor and general foreman by summing upacross the five effectiveness statements, which are the originalBlake & Mouton leadership styles. A number of tests which werecarried out further failed to verify the hypothesis that there is a
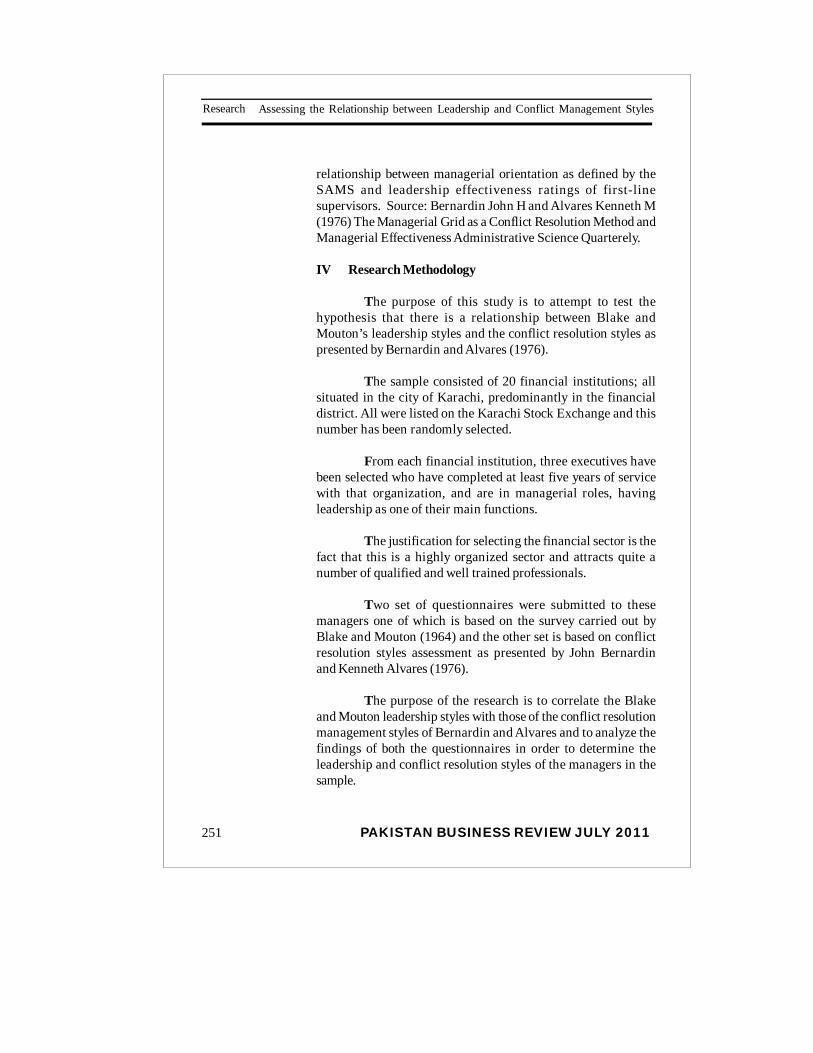
PAKISTAN BUSINESS REVIEW JULY 2011251
Research Assessing the Relationship between Leadership and Conflict Management Styles
relationship between managerial orientation as defined by theSAMS and leadership effectiveness ratings of first-linesupervisors. Source: Bernardin John H and Alvares Kenneth M(1976) The Managerial Grid as a Conflict Resolution Method andManagerial Effectiveness Administrative Science Quarterely.
IV Research Methodology
The purpose of this study is to attempt to test thehypothesis that there is a relationship between Blake andMouton’s leadership styles and the conflict resolution styles aspresented by Bernardin and Alvares (1976).
The sample consisted of 20 financial institutions; allsituated in the city of Karachi, predominantly in the financialdistrict. All were listed on the Karachi Stock Exchange and thisnumber has been randomly selected.
From each financial institution, three executives havebeen selected who have completed at least five years of servicewith that organization, and are in managerial roles, havingleadership as one of their main functions.
The justification for selecting the financial sector is thefact that this is a highly organized sector and attracts quite anumber of qualified and well trained professionals.
Two set of questionnaires were submitted to thesemanagers one of which is based on the survey carried out byBlake and Mouton (1964) and the other set is based on conflictresolution styles assessment as presented by John Bernardinand Kenneth Alvares (1976).
The purpose of the research is to correlate the Blakeand Mouton leadership styles with those of the conflict resolutionmanagement styles of Bernardin and Alvares and to analyze thefindings of both the questionnaires in order to determine theleadership and conflict resolution styles of the managers in thesample.

PAKISTAN BUSINESS REVIEW JULY 2011
Research
252
Assessing the Relationship between Leadership and Conflict Management Styles
First of all, a matrix is developed to describe thetheoretically posited relationship between Blake and Mouton’sleadership styles match with the conflict resolution styles ofBernardin and Alvares (1976). Secondly, using the questionnaireof Blake and Mouton, questions are identified on the basis of theleadership styles that the respondents are applying, however, itwill also show how different management styles are estimatedfrom the questionnaire.
Questionnaire for assessing Blake and Mouton’s ManagerialGrid Rating scale
1.———— I encourage my team to participate when it comes todecision making time and I try to implement their ideas andsuggestions..2.———— Nothing is more important than accomplishing a goalor task.3.———— I closely monitor the schedule to ensure a task orproject will be completed in time.4.———— I enjoy coaching people on new tasks and procedures.5.——-— The more challenging a task, the more I enjoy it.6.—— I encourage my employees to be creative about their job.
Blake & Mouton’s leadership styles
Conflict resolution strategies of Bernardin & Alvares (1976)
1, Impoverished (1.1) 2. Country Club (1.9) 3.Middle of the road (5.5) 4.Task management (9.1) 5.Team management (9.9)
Accommodating Avoiding Compromising Competing Collaborating
Never sometimes always 0 1 2 3 4 5
Table 1: Matrix showing hypothesized relationship between Leadership and ConflictManagement Styles
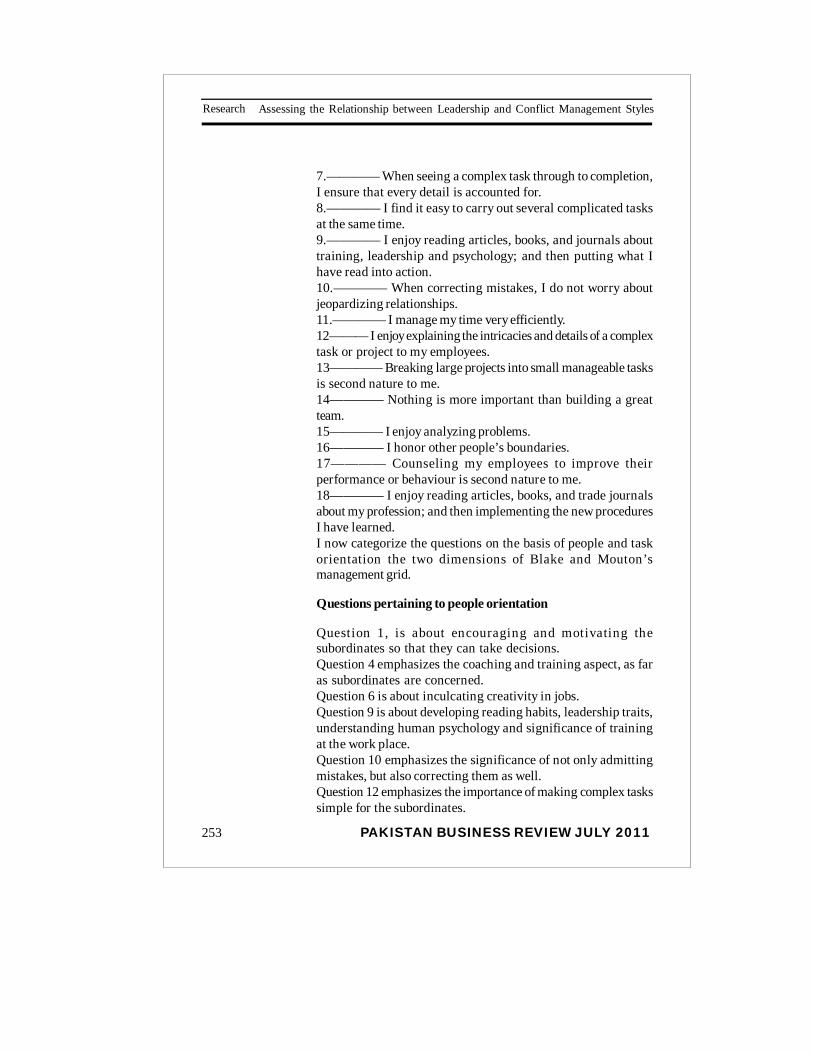
PAKISTAN BUSINESS REVIEW JULY 2011253
Research Assessing the Relationship between Leadership and Conflict Management Styles
7.———— When seeing a complex task through to completion,I ensure that every detail is accounted for.8.———— I find it easy to carry out several complicated tasksat the same time.9.———— I enjoy reading articles, books, and journals abouttraining, leadership and psychology; and then putting what Ihave read into action.10.———— When correcting mistakes, I do not worry aboutjeopardizing relationships.11.———— I manage my time very efficiently.12——— I enjoy explaining the intricacies and details of a complextask or project to my employees.13———— Breaking large projects into small manageable tasksis second nature to me.14———— Nothing is more important than building a greatteam.15———— I enjoy analyzing problems.16———— I honor other people’s boundaries.17———— Counseling my employees to improve theirperformance or behaviour is second nature to me.18———— I enjoy reading articles, books, and trade journalsabout my profession; and then implementing the new proceduresI have learned.I now categorize the questions on the basis of people and taskorientation the two dimensions of Blake and Mouton’smanagement grid.
Questions pertaining to people orientation
Question 1, is about encouraging and motivating thesubordinates so that they can take decisions.Question 4 emphasizes the coaching and training aspect, as faras subordinates are concerned.Question 6 is about inculcating creativity in jobs.Question 9 is about developing reading habits, leadership traits,understanding human psychology and significance of trainingat the work place.Question 10 emphasizes the significance of not only admittingmistakes, but also correcting them as well.Question 12 emphasizes the importance of making complex taskssimple for the subordinates.
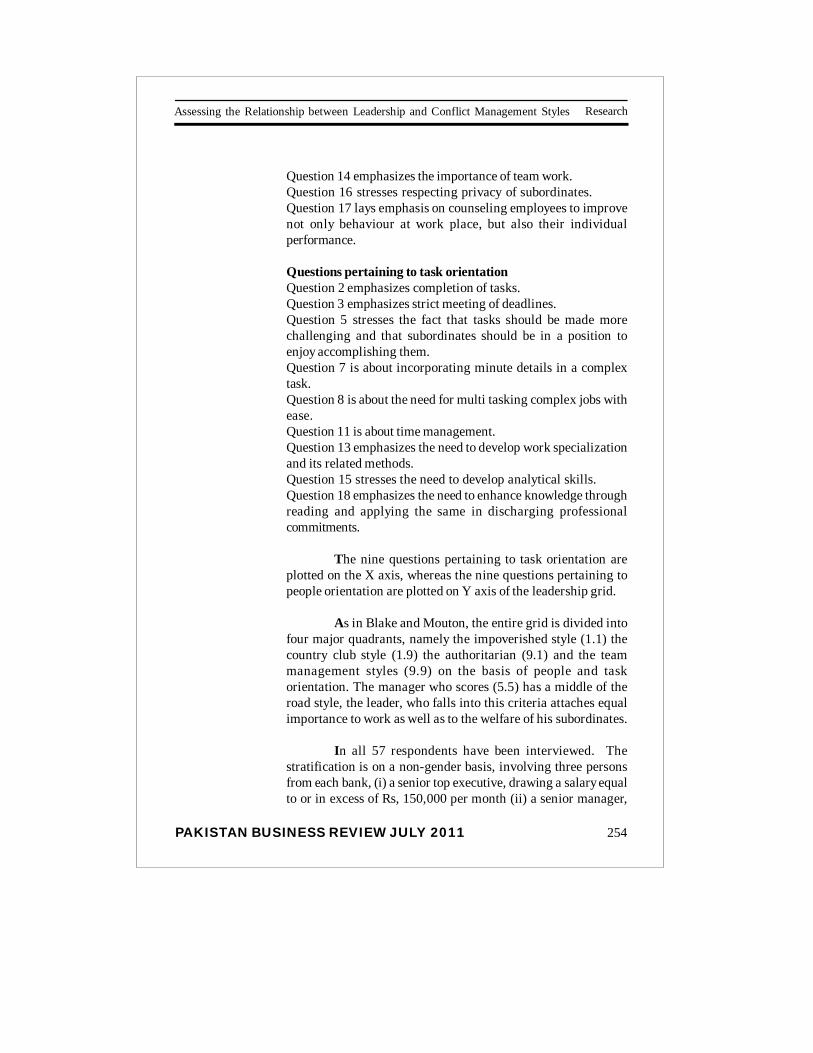
PAKISTAN BUSINESS REVIEW JULY 2011
Research
254
Assessing the Relationship between Leadership and Conflict Management Styles
Question 14 emphasizes the importance of team work.Question 16 stresses respecting privacy of subordinates.Question 17 lays emphasis on counseling employees to improvenot only behaviour at work place, but also their individualperformance.
Questions pertaining to task orientationQuestion 2 emphasizes completion of tasks.Question 3 emphasizes strict meeting of deadlines.Question 5 stresses the fact that tasks should be made morechallenging and that subordinates should be in a position toenjoy accomplishing them.Question 7 is about incorporating minute details in a complextask.Question 8 is about the need for multi tasking complex jobs withease.Question 11 is about time management.Question 13 emphasizes the need to develop work specializationand its related methods.Question 15 stresses the need to develop analytical skills.Question 18 emphasizes the need to enhance knowledge throughreading and applying the same in discharging professionalcommitments.
The nine questions pertaining to task orientation areplotted on the X axis, whereas the nine questions pertaining topeople orientation are plotted on Y axis of the leadership grid.
As in Blake and Mouton, the entire grid is divided intofour major quadrants, namely the impoverished style (1.1) thecountry club style (1.9) the authoritarian (9.1) and the teammanagement styles (9.9) on the basis of people and taskorientation. The manager who scores (5.5) has a middle of theroad style, the leader, who falls into this criteria attaches equalimportance to work as well as to the welfare of his subordinates.
In all 57 respondents have been interviewed. Thestratification is on a non-gender basis, involving three personsfrom each bank, (i) a senior top executive, drawing a salary equalto or in excess of Rs, 150,000 per month (ii) a senior manager,

PAKISTAN BUSINESS REVIEW JULY 2011255
Research Assessing the Relationship between Leadership and Conflict Management Styles
drawing a salary between the range of Rs. 75,000-100,000 permonth and (iii) a manager drawing a salary in the range ofRs.50,000 - 75,000 per month. In smaller financial institutions, ifthe senior executive is the CEO or the owner is the key personthis has been taken into account in the survey. The respondentshave filled out the above given questionnaire to indicate whetherthey see themselves as possessing one of the five mentionedleadership styles.
The respondents were required to answer 18 questionsin the first questionnaire, regarding leadership styles. The 9questions relating to the area of people consideration aremultiplied by 0.2; similarly the remaining 9 questions relating tothe task area have been multiplied by 0.2. In the original Blakeand Mouton model, there are 5 probable leadership styles, andin order to make our participants fall into one single leadershipstyle the probability is 1 over 5, hence the weight 0.2. is assignedto each question.
The second questionnaire consists of 15 questionswhich assess the conflict resolution style self perception of themanagers. These styles are Competing, Avoiding, Compromising,Accommodating, Collaborating and Forcing strategies asspecified by the Bernardin and Alvares study (1976).
The purpose of the second questionnaire is to identifythe conflict resolution style of the managers.
The participants have been informed that the intendedsurvey is being carried out to test the relationship betweenleadership styles and conflict management styles and preferencesin this regard will in no way be taken into consideration as anadverse feature. All communication will be considered to bestrictly confidential.
In the case of the conflict resolution questionnaire therespondents were required to answer 15 questions, whichidentify various conflict resolution styles, such as Competing,Avoiding, Compromising, Accommodating, Collaborating, andForcing and each of these styles are assessed on the basis of a
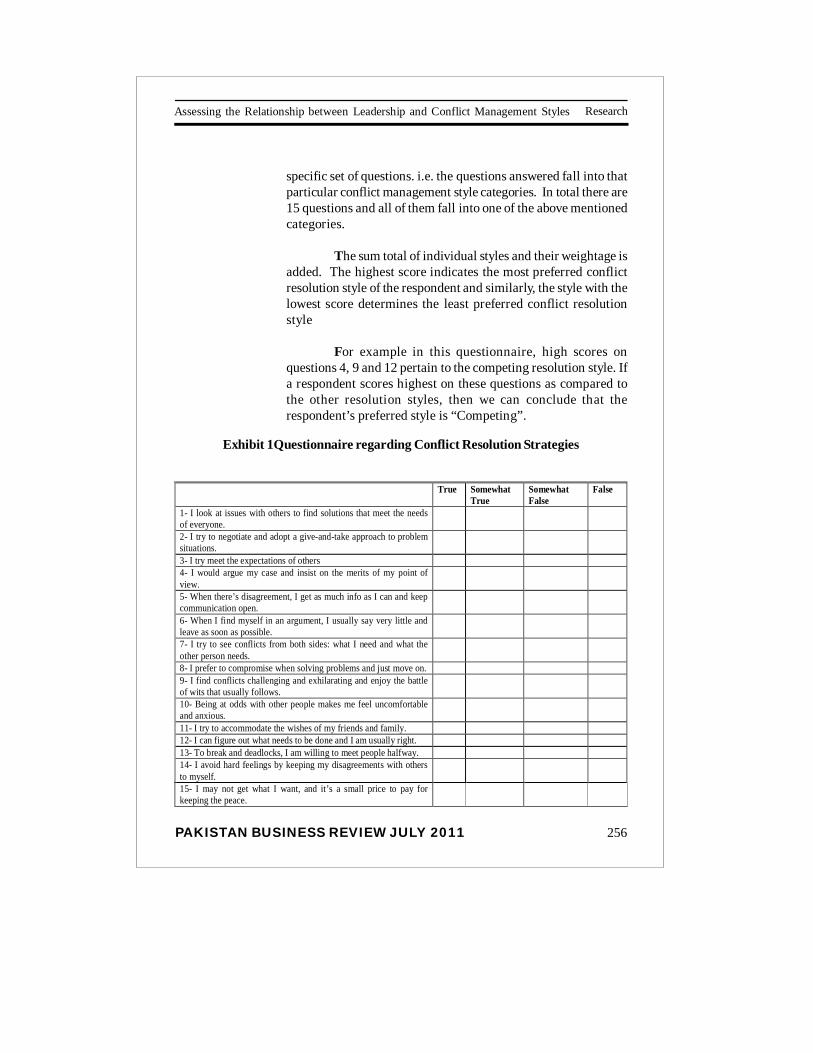
PAKISTAN BUSINESS REVIEW JULY 2011
Research
256
Assessing the Relationship between Leadership and Conflict Management Styles
specific set of questions. i.e. the questions answered fall into thatparticular conflict management style categories. In total there are15 questions and all of them fall into one of the above mentionedcategories.
The sum total of individual styles and their weightage isadded. The highest score indicates the most preferred conflictresolution style of the respondent and similarly, the style with thelowest score determines the least preferred conflict resolutionstyle
For example in this questionnaire, high scores onquestions 4, 9 and 12 pertain to the competing resolution style. Ifa respondent scores highest on these questions as compared tothe other resolution styles, then we can conclude that therespondent’s preferred style is “Competing”.
True Somewhat True
Somewhat False
False
1- I look at issues with others to find solutions that meet the needs of everyone.
2- I try to negotiate and adopt a give-and-take approach to problem situations.
3- I try meet the expectations of others 4- I would argue my case and insist on the merits of my point of view.
5- When there’s disagreement, I get as much info as I can and keep communication open.
6- When I find myself in an argument, I usually say very little and leave as soon as possible.
7- I try to see conflicts from both sides: what I need and what the other person needs.
8- I prefer to compromise when solving problems and just move on. 9- I find conflicts challenging and exhilarating and enjoy the battle of wits that usually follows.
10- Being at odds with other people makes me feel uncomfortable and anxious.
11- I try to accommodate the wishes of my friends and family. 12- I can figure out what needs to be done and I am usually right. 13- To break and deadlocks, I am willing to meet people halfway. 14- I avoid hard feelings by keeping my disagreements with others to myself.
15- I may not get what I want, and it’s a small price to pay for keeping the peace.
Exhibit 1Questionnaire regarding Conflict Resolution Strategies
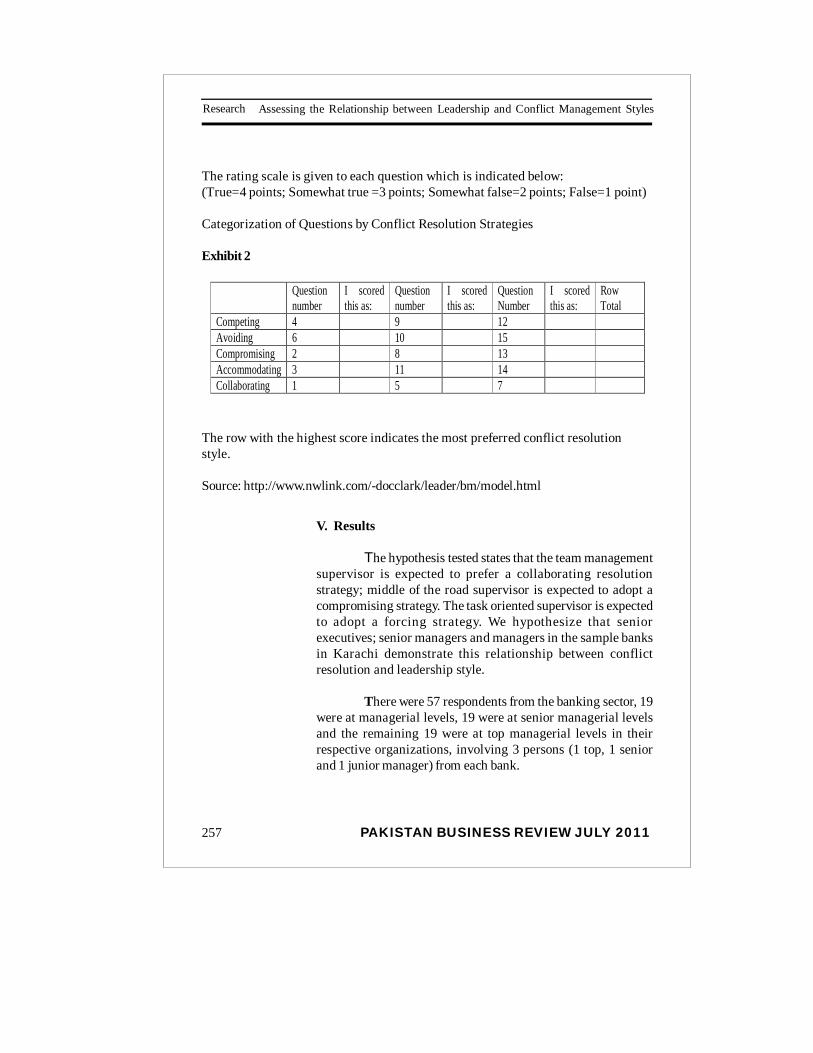
PAKISTAN BUSINESS REVIEW JULY 2011257
Research Assessing the Relationship between Leadership and Conflict Management Styles
The rating scale is given to each question which is indicated below:(True=4 points; Somewhat true =3 points; Somewhat false=2 points; False=1 point)
Categorization of Questions by Conflict Resolution Strategies
Exhibit 2
Question number
I scored this as:
Question number
I scored this as:
Question Number
I scored this as:
Row Total
Competing 4 9 12 Avoiding 6 10 15 Compromising 2 8 13 Accommodating 3 11 14 Collaborating 1 5 7
The row with the highest score indicates the most preferred conflict resolutionstyle.
Source: http://www.nwlink.com/-docclark/leader/bm/model.html
V. Results
The hypothesis tested states that the team managementsupervisor is expected to prefer a collaborating resolutionstrategy; middle of the road supervisor is expected to adopt acompromising strategy. The task oriented supervisor is expectedto adopt a forcing strategy. We hypothesize that seniorexecutives; senior managers and managers in the sample banksin Karachi demonstrate this relationship between conflictresolution and leadership style.
There were 57 respondents from the banking sector, 19were at managerial levels, 19 were at senior managerial levelsand the remaining 19 were at top managerial levels in theirrespective organizations, involving 3 persons (1 top, 1 seniorand 1 junior manager) from each bank.
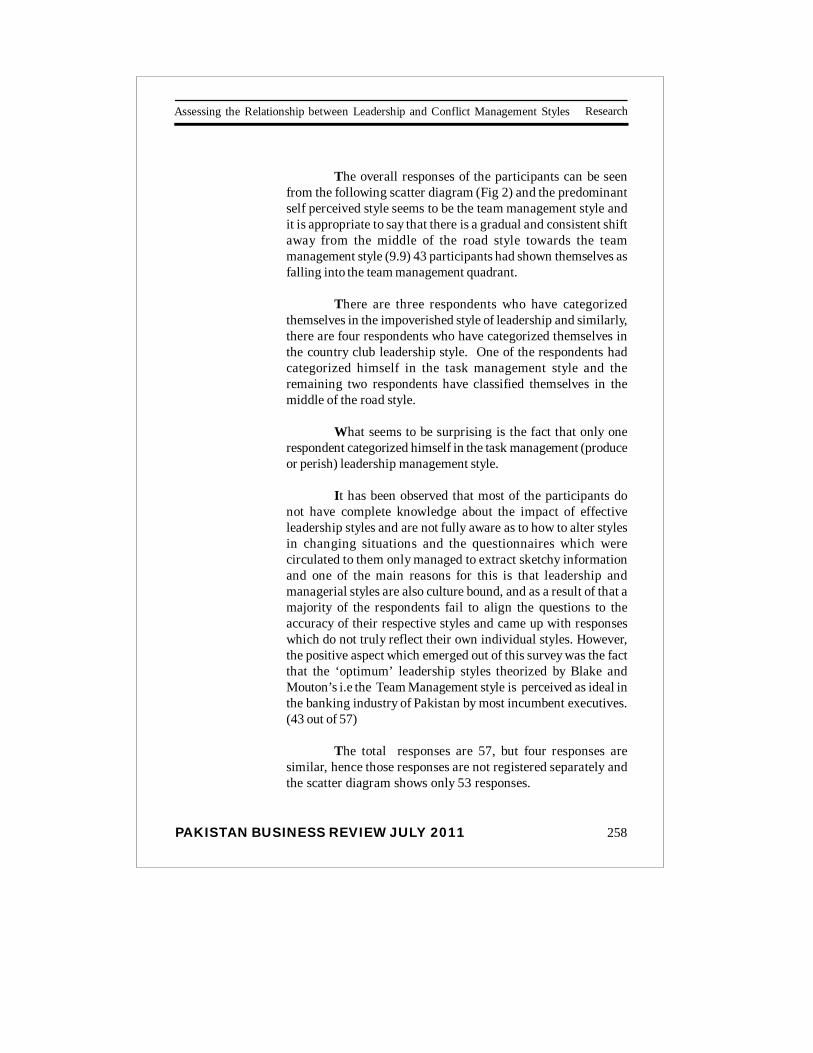
PAKISTAN BUSINESS REVIEW JULY 2011
Research
258
Assessing the Relationship between Leadership and Conflict Management Styles
The overall responses of the participants can be seenfrom the following scatter diagram (Fig 2) and the predominantself perceived style seems to be the team management style andit is appropriate to say that there is a gradual and consistent shiftaway from the middle of the road style towards the teammanagement style (9.9) 43 participants had shown themselves asfalling into the team management quadrant.
There are three respondents who have categorizedthemselves in the impoverished style of leadership and similarly,there are four respondents who have categorized themselves inthe country club leadership style. One of the respondents hadcategorized himself in the task management style and theremaining two respondents have classified themselves in themiddle of the road style.
What seems to be surprising is the fact that only onerespondent categorized himself in the task management (produceor perish) leadership management style.
It has been observed that most of the participants donot have complete knowledge about the impact of effectiveleadership styles and are not fully aware as to how to alter stylesin changing situations and the questionnaires which werecirculated to them only managed to extract sketchy informationand one of the main reasons for this is that leadership andmanagerial styles are also culture bound, and as a result of that amajority of the respondents fail to align the questions to theaccuracy of their respective styles and came up with responseswhich do not truly reflect their own individual styles. However,the positive aspect which emerged out of this survey was the factthat the ‘optimum’ leadership styles theorized by Blake andMouton’s i.e the Team Management style is perceived as ideal inthe banking industry of Pakistan by most incumbent executives.(43 out of 57)
The total responses are 57, but four responses aresimilar, hence those responses are not registered separately andthe scatter diagram shows only 53 responses.

PAKISTAN BUSINESS REVIEW JULY 2011259
Research Assessing the Relationship between Leadership and Conflict Management Styles
Fig 2. Scatter Diagram: Leadership styles (Full Sample)
Fig 3 reflects the responses from the managers in the bankingsector one of the responses which were received categorizedhimself in the impoverished style (1.1) two responses fell in thearea of country club style (1.9) and the remaining fourteenconsidered themselves to be in the area of team managementstyle (9.9) The two remaining responses fell into the area ofmiddle of the road (5.5) style.
Country Club Style (1.9)
Team Management (9.9)
Task Management 9.1 Impoverished style (1.1)
PAKISTAN BUSINESS REVIEW JULY 2011
Research
260
Assessing the Relationship between Leadership and Conflict Management Styles
Fig 3 Scatter Diagram: Leadership style: Managers
Fig 4 presents the responses from the senior managers in thebanking sector. None of the responses received from seniormanagers classified themselves in the impoverished style (1.1)no responses fell in the area of the country club style (1.9) and 17responses considered themselves to be in the area of teammanagement style (9.9) The two remaining responses accountedfor duplication of styles, not exhibited in the diagram.
Country Club Style (1.9)
Task Management (9.1)
Impoverished Style (1.1)
Middle of the road
Team Management (9.9) 9.1

PAKISTAN BUSINESS REVIEW JULY 2011261
Research Assessing the Relationship between Leadership and Conflict Management Styles
Fig 4 Scatter Diagram: Leadership style: Senior Managers
The final scatter diagram (Fig 5), reflects the results ofthe top executives working in the banking sector, and fourteensee themselves as following the team management style ofleadership (9.9), whereas two of the top executives see themselvesfollowing the impoverished style (1.1) and two perceivethemselves to be practicing the country club style of leadership1.9). One executive consider himself to be practicing the taskmanagement style of leadership (9.1).
Middle of the road
Country Club Style (1.9)
Impoverished Style (1.1)
Team Management
Task Management (9.1)
Team Management (9.9) 9.1
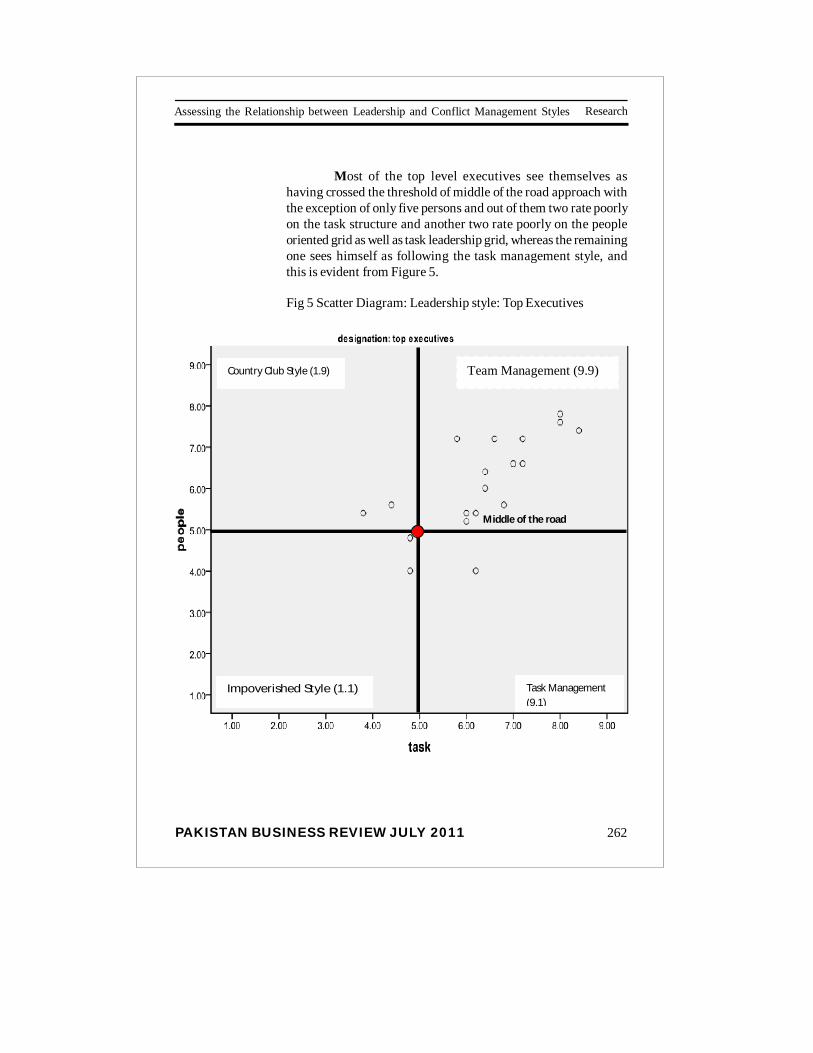
PAKISTAN BUSINESS REVIEW JULY 2011
Research
262
Assessing the Relationship between Leadership and Conflict Management Styles
Most of the top level executives see themselves ashaving crossed the threshold of middle of the road approach withthe exception of only five persons and out of them two rate poorlyon the task structure and another two rate poorly on the peopleoriented grid as well as task leadership grid, whereas the remainingone sees himself as following the task management style, andthis is evident from Figure 5.
Fig 5 Scatter Diagram: Leadership style: Top Executives
Country Club Style (1.9)
Task Management (9.1)
Impoverished Style (1.1)
Middle of the road
Team Management (9.9) 9.1
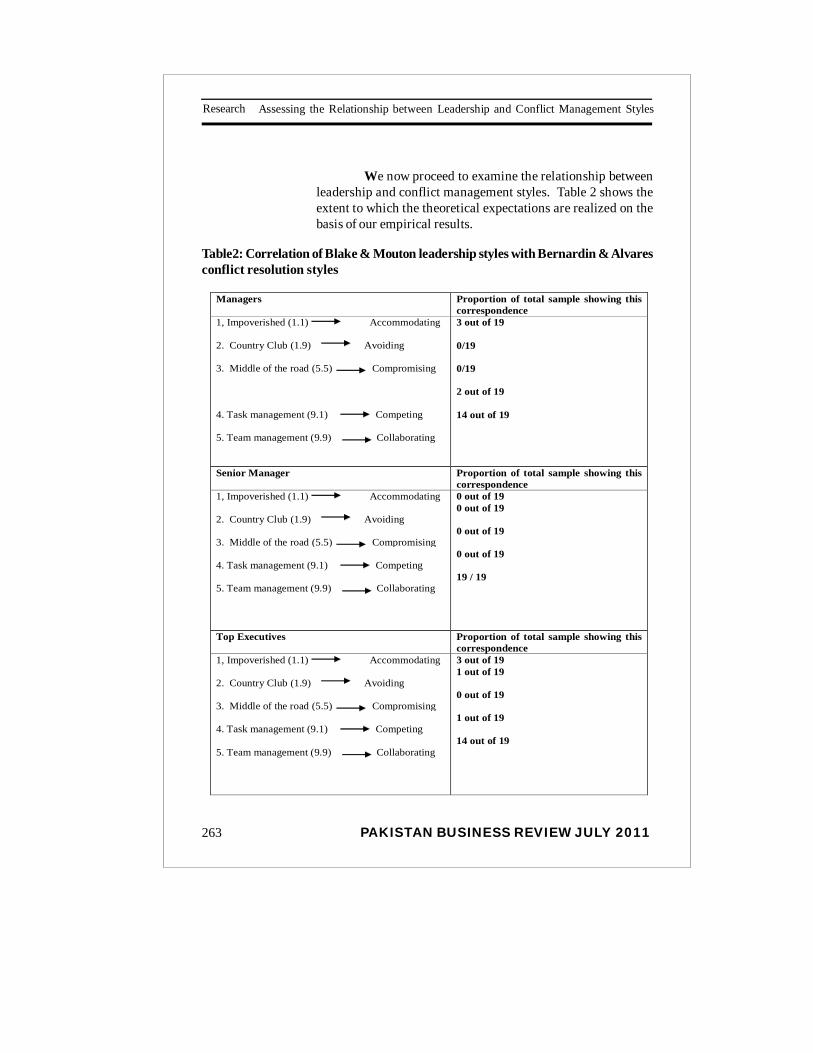
PAKISTAN BUSINESS REVIEW JULY 2011263
Research Assessing the Relationship between Leadership and Conflict Management Styles
We now proceed to examine the relationship betweenleadership and conflict management styles. Table 2 shows theextent to which the theoretical expectations are realized on thebasis of our empirical results.
Table2: Correlation of Blake & Mouton leadership styles with Bernardin & Alvaresconflict resolution styles
Managers Proportion of total sample showing this correspondence
1, Impoverished (1.1) Accommodating
2. Country Club (1.9) Avoiding
3. Middle of the road (5.5) Compromising
4. Task management (9.1) Competing
5. Team management (9.9) Collaborating
3 out of 19 0/19 0/19 2 out of 19 14 out of 19
Senior Manager Proportion of total sample showing this correspondence
1, Impoverished (1.1) Accommodating
2. Country Club (1.9) Avoiding
3. Middle of the road (5.5) Compromising
4. Task management (9.1) Competing
5. Team management (9.9) Collaborating
0 out of 19 0 out of 19 0 out of 19 0 out of 19 19 / 19
Top Executives Proportion of total sample showing this correspondence
1, Impoverished (1.1) Accommodating
2. Country Club (1.9) Avoiding
3. Middle of the road (5.5) Compromising
4. Task management (9.1) Competing
5. Team management (9.9) Collaborating
3 out of 19 1 out of 19 0 out of 19 1 out of 19 14 out of 19
PAKISTAN BUSINESS REVIEW JULY 2011
Research
264
Assessing the Relationship between Leadership and Conflict Management Styles
We find a close correspondence between perception ofmanagement and conflict resolution styles with respect to theTeam Management style and the collaborative conflictmanagement style. Of the total sample of 57 respondents 47respondents see themselves as having a team management and acollaborative conflict management style. This closecorrespondence between the team management and thecollaborative conflict management holds across all three subsamples –– managers, senior managers and top executives. Thusour results contradict the Bernardin Alvares finding that there isno correspondence between management and conflict resolutionstyle perception by managers at least as far as the teammanagement leadership and collaborative conflict resolution styleis concerned.
PAKISTAN BUSINESS REVIEW JULY 2011265
Research Assessing the Relationship between Leadership and Conflict Management Styles
References
Keys E. Bernard (1977) Management of Learning Grid forManagerial Development, The Academy of Management Review,vol 2, No 2, pp289-292.
Blake Robert R and Mouton S. Jane (1964) The Managerial Grid,Houston Gulf Publishing.
Bartol Kathryn Tien Margaret Mathews Graham Martin David4th Ed.Management A Pacific Rim Focus pp 407.
Bernardin John H and Alvares Kenneth M. (1976) The ManagerialGrid as a Conflict.
Resolution Method and Managerial Effectiveness AdministrativeScience Quarterly, vol 21, No I pp 84-92.
Mckee Rachel The Grid Difference (2005) A Historical Perspectiveof Grid.
Methodology, grid User’s Conference Belfast City, NorthernIreland.Robbins P. Stephens, (2007) Organizational Behaviour 12th Ed.Prentice Hall, pp434-440.
Deluga, J. Ronald, (1988) The politics of leadership: TheRelationship between Task-
People Leadership and Subordinate Influence: Journal ofOrganizational Behaviour, vol 9, No 4, pp359-366.
Schermerhorn R. John, Hunt G. James, Osborn N. Richard (2003)Organizational.
Behaviour 8th Ed. John Wiley and Sons pp 301-302.
http://www.nwlink.com/-docclark/leader/bm/model.html
Research
PAKISTAN BUSINESS REVIEW JULY 2011
Assessing the Service Quality of Some Selected Hospitals in Karachi
266
ASSESSING THE SERVICEQUALITY OF SOME SELECTED
HOSPITALS IN KARACHIBASED ON THE SERVQUAL
MODEL
Rizwan AhmedHina Samreen
College of Computer Sciences & Information SystemsInstitute of Business Management, Karachi
Abstract
The study is aimed at exploring the dimensions of theSERVQUAL model which are the significant determinants ofservice quality, in terms of patients’ satisfaction, in theselected hospitals of Karachi. For this purpose, data wascollected from 252 outpatients visiting three selectedhospitals each from public sector, private sector and semi-public sector. The technique of factor analysis is used toextract the important factors on the basis of responsesobtained from patients. Factor analysis resulted in fivefactors. The key findings of this study are the regressionmodels obtained for all three hospitals. These models havethe predictors that are statistically significant determinantsof the patients’ satisfaction for each hospital.
Keywords: SERVQUAL, Patients satisfaction, publichospitals, private hospitals, semi public hospitals
JEL Classification: I10, I11
Research

PAKISTAN BUSINESS REVIEW JULY 2011267
Assessing the Service Quality of Some Selected Hospitals in KarachiResearch
I. Introduction
The purpose of this study is to evaluate the performanceof some selected hospitals of Karachi on the basis of theSERVQUAL model related to customer service quality. Theresearch objectives of the study are to:
Ascertain whether the selected hospitals that areoperating in Karachi in the public, semi public andprivate sectors follow all five dimensions(TANGIBILES, RELIABILITY, RESPONSIVENESS,ASSURANCE, & EMPATHY) of the SERVQUALmodel.
Compare gaps among three types of hospitals.
Identify the areas of maximum and minimum gaps forthe items that are related to each dimension of theSERVQUAL model.
Identify the determinants of patients’ satisfaction inthe selected hospitals.
The term “service quality” has been defined in severalways. Parasuraman et al. (1985) describes the word service qualityas “a measure of the degree of discrepancy between consumers’perceptions and expectations”.
“Consumer dissatisfaction occurs when expectationsof the consumers are greater than actual performance of servicedelivering organizations and perceived service quality is less thanthe satisfactory level.”
Gronsroos (1984) defines service quality as a functionof expectations, outcome and image.
Research
PAKISTAN BUSINESS REVIEW JULY 2011
Assessing the Service Quality of Some Selected Hospitals in Karachi
268
The well known “SERVQUAL scale can be applied toany service providing organization to assess servicequality.”(Zeithaml, Parasuraman and Berry (1990)
The five gener ic dimensions or factors wereintroduced by Parasuraman et al (1988) to measure servicequality are:
Tangibles: Physical facilities, equipment andappearance of personnel;
Reliability: Aability to perform the promised servicedependably and accurately;
Responsiveness: Willingness to help customers andprovide prompt service;
Security: Knowledge and courtesy of employees andtheir ability to inspire trust and confidence; and
Empathy: Caring, individualized attention providedto customers.
These dimensions were extracted on the basis of aquestionnaire (See Chart 1) consisting of 22 questions thatcover the expectations and performance aspect of eachdimension of the SERVQUAL model
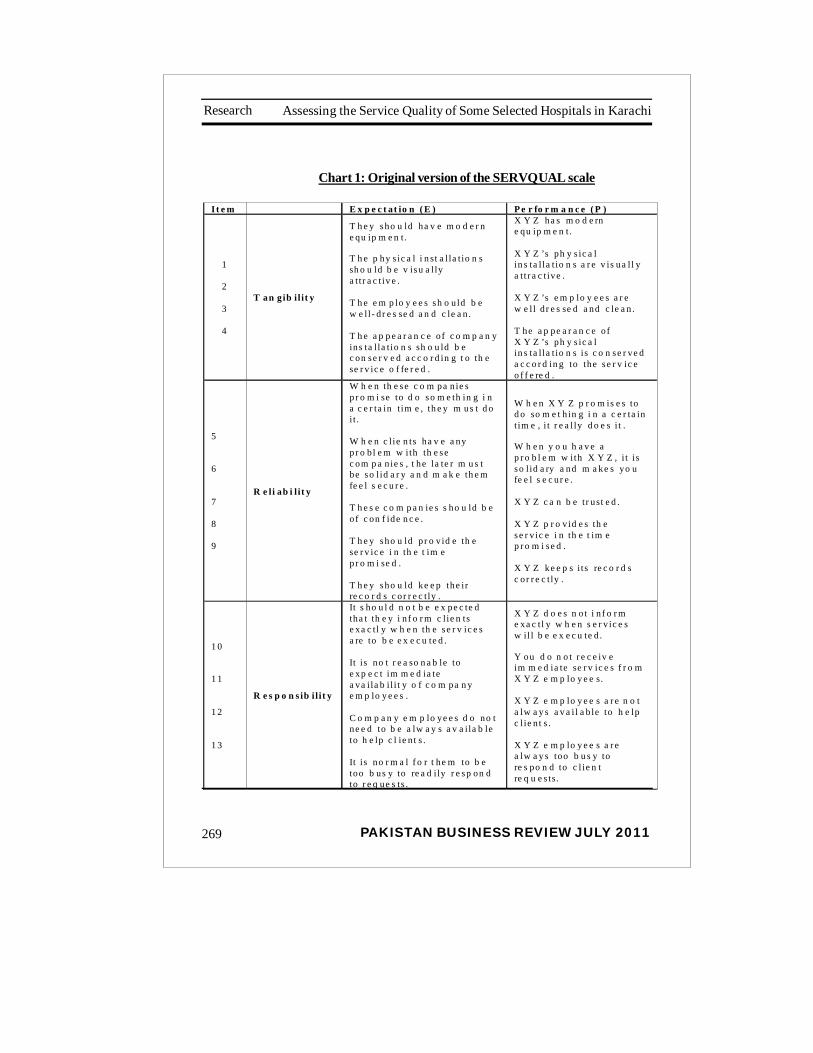
PAKISTAN BUSINESS REVIEW JULY 2011269
Assessing the Service Quality of Some Selected Hospitals in KarachiResearch
I t e m E x p e c t at io n ( E ) P e r fo r m a n c e ( P )
1
2
3
4
T an gib il i t y
T h e y sho u ld ha v e m o d e r n e qu ip m e n t . T h e p hy s ic a l i n st a l la t io n s sh o u ld b e v isu a l ly a t t r a c t iv e . T h e e m p lo y e e s sh o u ld b e w e ll- d r e s se d a n d c le a n . T h e a p p e a r a n c e o f c o m p a n y ins ta l la t io n s sh o u ld b e c on se r v e d a c c o r d in g t o th e se r v ic e o f fe r e d .
X Y Z ha s m o d e rn e qu ip m e n t . X Y Z ’s ph y s ic a l in s ta l la t io n s a r e v is ua l l y a t t r a c t ive . X Y Z ’s e m p lo y e e s a r e w e ll d r e s se d a nd c le a n . T he a p pe a r a n c e o f X Y Z ’s ph y s ic a l in s ta l la t io n s is c o n se r ve d a c c o r d in g to the s e r v ic e o f f e re d .
5 6 7 8 9
R e li ab i l i t y
W h e n th e se c o m pa nie s p r o m i se to d o so m e th in g i n a c e r ta in t im e , th e y m us t d o i t . W h e n c l ie n ts ha v e a ny p r o b l e m w ith th e se c om p a nie s , t he la te r m u s t be so l id a r y a n d m a k e th e m fe e l s e c u r e . T h e s e c o m p a n ie s s ho u ld b e o f c on f ide n c e . T h e y sho u ld p r o v id e th e se r v ic e i n th e t im e pr o m i se d . T h e y sho u ld ke e p the ir re c o r d s c or r e c t ly .
W h e n X Y Z p r o m is e s to d o so m e t h in g i n a c e r ta in t im e , i t r e a l ly d o e s i t . W h e n y o u h a v e a p r o b l e m w ith X Y Z , i t is so l id a ry a nd m a ke s yo u fe e l s e c ur e . X Y Z c a n b e t r ust e d . X Y Z p r o v id e s th e s e r v ic e i n th e t im e p r o m i se d . X Y Z ke e p s i ts re c o r d s c or r e c t ly .
1 0 1 1 1 2 1 3
R e s p o n s ib il i t y
It s ho u l d n o t b e e x pe c te d tha t th e y i n f o r m c l ie n ts e xa c t l y w h e n th e s e r v ic e s a re to b e e x e c u te d . It is no t r e a so n a b le to e xp e c t im m e d ia te a va i la b i l i t y o f c o m pa n y e m p lo y e e s . C o m p a n y e m p lo ye e s d o no t ne e d to b e a lw a y s a v a i la b le to h e lp c l ie n t s . It is no r m a l f o r t he m to b e too b us y to re a d i ly r e sp on d to r e q ue s ts .
X Y Z d o e s n o t i n f o r m e xa c t l y w h e n s e r v ic e s w il l b e e x e c u te d . Y ou d o n o t r e c e iv e im m e d ia te se r v ic e s f r o m X Y Z e m p lo y e e s. X Y Z e m p lo y e e s a r e n o t a lw a y s a v a i l a b le to h e lp c l ie n t s . X Y Z e m p lo y e e s a r e a lw a y s too b u s y to re s po n d to c l ie n t re q u e s ts.
Chart 1: Original version of the SERVQUAL scale
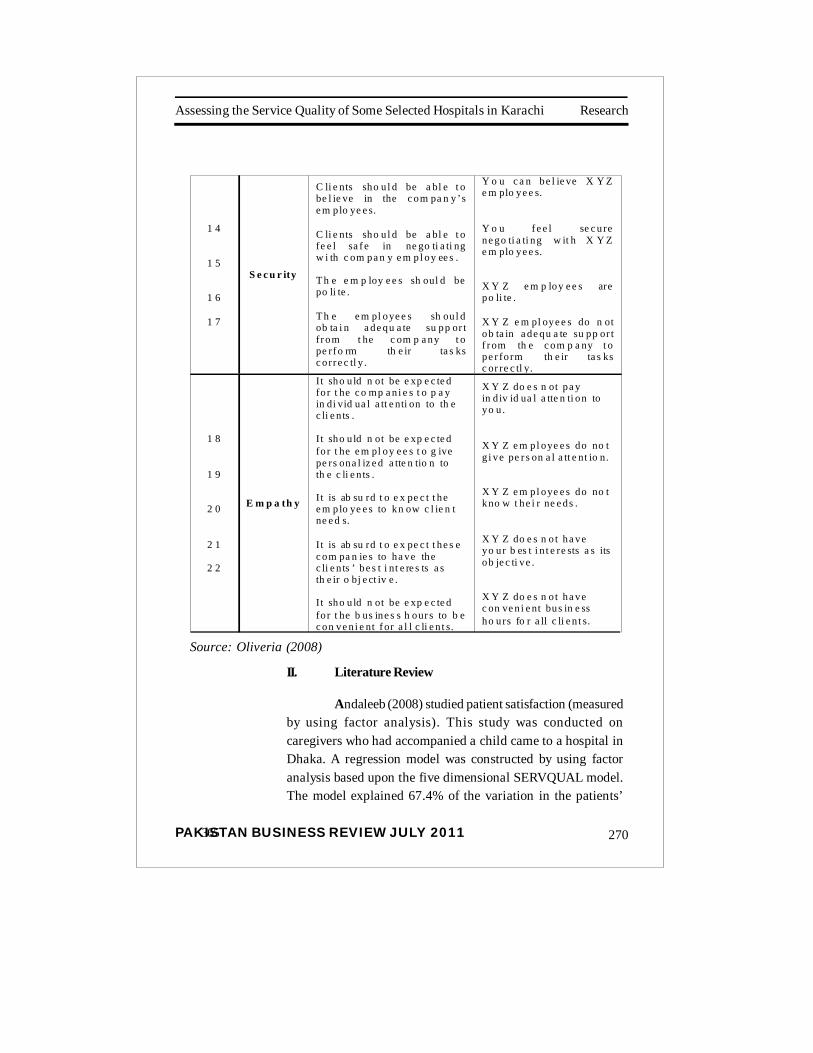
Research
PAKISTAN BUSINESS REVIEW JULY 2011
Assessing the Service Quality of Some Selected Hospitals in Karachi
270365
1 4
1 5
1 6
1 7
S e c u r ity
C li e nts sho u l d be a bl e t o be l ie ve in the c om pa n y’s e m plo ye e s. C li e nts sho u l d be a bl e t o fe e l sa f e in ne go ti a ti ng w i th c om pa n y e m pl oy ee s . T h e e m p loy e e s sh oul d be po li te . T h e e m pl oye e s sh ou l d ob ta i n a de qu a te su pp or t fr om t he c om p a ny t o pe rf o rm th e ir ta s ks c orr e c tl y .
Y o u c a n be l ie ve X Y Z e m plo ye e s. Y o u f e e l se c ure ne go ti a ti ng w it h X Y Z e m plo ye e s. X Y Z e m p loy e e s are po li te . X Y Z e m pl oye e s do n ot ob ta in a de qu a te su pp or t f r om th e c om p a ny t o pe r fo rm th e ir ta s ks c or re c tl y.
1 8
1 9
2 0
2 1
2 2
E m p a th y
I t sho u ld n ot be e xp e c te d fo r t he c o mp a ni e s t o p a y in di vid ua l a tt e nti on to th e c li e n ts . I t sho u ld n ot be e xp e c te d fo r t he e m pl oy e e s t o g ive pe rs ona l iz e d a tte n tio n to th e c li e n ts . I t is ab su rd t o e x pe c t t he e m plo ye e s to kn ow c l ie n t ne e d s. I t is ab su rd t o e x pe c t t he s e c om pa n ie s to ha ve the c li e n ts ’ be s t i nt e re s ts a s th e ir o bj e ct iv e . I t sho u ld n ot be e xp e c te d fo r t he b us ine s s h our s to b e c on ve n i e nt f or a l l c li e n t s.
X Y Z do e s n ot pa y in d iv id ua l a tte n ti on to yo u . X Y Z e m pl oye e s do no t g i ve pe r s on a l a tt e nt io n. X Y Z e m pl oye e s do no t kno w t he i r ne e ds . X Y Z do e s n o t ha ve yo ur b es t i n t e re sts a s its ob je c ti ve . X Y Z do e s n o t ha ve c on ve n i e nt bus in e ss ho urs fo r a ll c li e n t s.
Source: Oliveria (2008)
II. Literature Review
Andaleeb (2008) studied patient satisfaction (measuredby using factor analysis). This study was conducted oncaregivers who had accompanied a child came to a hospital inDhaka. A regression model was constructed by using factoranalysis based upon the five dimensional SERVQUAL model.The model explained 67.4% of the variation in the patients’
PAKISTAN BUSINESS REVIEW JULY 2011271
Assessing the Service Quality of Some Selected Hospitals in KarachiResearch
satisfaction which was taken as the dependent variable. Thebehavior of the nurses, the behavior of the doctors and facilitationpayments (staff expectation of extra payment for normal servicesthat were provided to the patients) had been appeared asstatistically significant determinants of patients’ satisfaction.Tangibles composite (all the items that were related to thecleanliness of the hospital and staff) and input adequacy(availability of medicines and equipment whenever needed),appeared as statistically insignificant.
Babakus and Mangold (1992) assessed patients’perceptions of service quality in a hospital environment. A modifiedSERVQUAL scale with 15 pairs of questions having 5 point scalewas used. Factor analysis and correlation were used to assessthe validity of the study. Reliability coefficients for all fivedimensions were found greater than 0.5.
Kang and James (2004) applied the SERVQUAL modelin the cell phone industry based on European perspective1. Atotal of 464 users of two specific cell phone companies in SouthKorea were interviewed. Interviewees were asked to rate questionsin the questionnaire constructed for 3 constructs i.e. functionalquality, technical quality, image and their impact on overall servicequality and customer satisfaction. Confirmatory Factor Analysis(CFA) was conducted to check the uni-dimensionality of theconstruct. Initial results did confirm the five-factor structure ofthe SERVQUAL model. The results of the study indicated thatfunctional and technical quality influence the perceptions thatare related to the overall service quality.
Karassavidou (2009) aimed to identify the service qualitydimension used by patients for service quality evaluation in GreekNHS (National Services Hospitals). A SERVQUAL questionnaire,including an expectation and perception section, each consistingof 26 statements having seven point Likert scale was used for thesurvey. A survey of 137 patients was conducted in six hospitalslocated in Northern Greece. In this study, principal component
Research
PAKISTAN BUSINESS REVIEW JULY 2011
Assessing the Service Quality of Some Selected Hospitals in Karachi
272
method was used to extract factors. Factor analysis resulted inthree extracted factors. Alpha coefficient ranged from 0.785 to0.996 and confirmed the reliability of all three dimensions. Gapanalysis was also performed to determine the degree to whichthe difference between expectations and perceptions exist among patients surveyed.
Lim and Tang (2000) examined patients’ expectationsand perceptions about hospital service quality in Singapore. Inthe beginning, the survey instrument was designed with fivedimensions of the SERVQUAL model. The instrument consistedof 25 questions having 5 point Likert scale. In this study anotherdimension “accessibility and affordability” was added to thequestionnaire in the form of three additional questions that weredifferent from original SERVQUAL model. This additionaldimension would also be included as the part of the presentstudy.
In addition to this, the questionnaire also had a questionon “overall importance” in the expectation section and anotherquestion “overall rating of service quality” in the perceptionsection. 252 satisfactorily filled questionnaires out of 300 werecollected from four general practitioners and two specialistclinics. The question related to the overall rating of service qualityis also included in the present study. SERVQUAL score wascalculated by using mean and standard deviation. Mann-Whitneytest was applied to test the hypothesis that there was no differencein the mean gap (mean difference between the ratings ofexpectations and perceptions). In this study assurance andresponsiveness appeared to be the most important dimensionsof hospital services.
Manaf and Nooi (2009) based their study upon thedifference in perceptions and expectations of in-patients andout-patients on the basis of SERVQUAL model adapted for thehealth care industry in Malaysia. Surveys of outpatients andinpatients were conducted and 646 inpatients and 570 outpatients’usable questionnaires were analyzed. Factor analysis was carriedout for both inpatient and outpatient data. This yielded with twofactors, namely clinical dimensions of service 2 and physicaldimension of service3.
PAKISTAN BUSINESS REVIEW JULY 2011273
Assessing the Service Quality of Some Selected Hospitals in KarachiResearch
Miranda et.al. (2010) based their study on the SERVQUALmodel and measured the gap between the perceptions of healthmanagers and that of patients’. Patients’ satisfaction was takenas the dependent variable and the variables, Health staff (doctorsand nurses), Efficiency (waiting times and the time it takes toresolve complaints), No Health Staff (administrative staff), andFacilities (cleanliness, equipment and the location of the healthcenter) were taken as independent variables. The gap betweenthe perceptions of health managers and patients were measuredand most of them were found to have statistically significantnegative values.
Mostafa (2005) tested perceptions of service quality inEgypt from the perspective of public and private hospital patientsand attempted to seek an answer to the question; how do patientsevaluate service quality by using relevant dimension. A surveyof a total of 500 patients, from 12 hospitals of Egypt was conducted,and resulted in 332 successfully filled questionnaires. Thisquestionnaire was designed on the basis of the five dimensionalSERVQUAL model having 5-point Likert rating scale. The resultsof the survey highlighted a three factor solution of the SERVQUALmodel. A statistically significant difference in terms of servicequality was observed between public and private hospitals.
Oliveria and Ferreira’s (2008) measured service qualityat a higher education institute in Brazil. This was a survey basedresearch. The survey instrument was five dimensional SERVQUALmodel. The instrument consisted of 19 items having 7 point Likertscale. The gaps between expectations and perceptions for all 19items had been measured. The questionnaire was applied to 38beginning students in the Production Engineering course. Theresults show that the gaps for all 19 items were negative and thisimplies that the expectations of the students were higher ascompared to the perceptions.
Research
PAKISTAN BUSINESS REVIEW JULY 2011
Assessing the Service Quality of Some Selected Hospitals in Karachi
274
Parasuraman et al. (1985) used the original tendimensions of the SERVQUAL Model in their study. They definedquality as a gap between expectations and performance. In-depthinterviews of 3 - 4 executives from four recognized service firmsand a total of 12 focus group interviews of consumers wereconducted to gain insights about:
The perceptions of managers regarding key attributesof service quality
The consumers’ perceptions regarding the keyattributes of quality in services
Do discrepancies exist between the perceptions ofconsumers and service marketers?
Can consumer and marketer perceptions becombined in a general model that explains servicequality from the consumer’s standpoint?
The authors’ exploratory research revealed 10evaluative dimensions or criteria that covered variety of services.The researchers developed the items that cover these 10dimensions. They had mentioned seven propositions to measurethe gap between expectations and perceptions.
Parasuraman et al. (1988) described the development ofa 22-item instrument of the SERVQUAL model having 5dimensions to assess perceptions of customers regarding servicequality in service and retailing organizations. The researchershad selected four major well known service providing businesses:a bank, a credit care company, a firm offering appliance repairsand maintenance services and a long-distance telephonecompany. They ended up with a 22-item instrument having fivedimensions. All four different firms, from which the data was

PAKISTAN BUSINESS REVIEW JULY 2011275
Assessing the Service Quality of Some Selected Hospitals in KarachiResearch
collected to perform factor analysis, yielded five extracted factorswith the same items loaded on each factor and having factorloadings greater than 0.5 cut-off value. The reliabilitycoefficients (Cronbach’s Alpha) were all greater than the cut-off value of 0.6. This signifies the internal validity of the factors.Scale’s validity was also assessed with the use of analysis ofvariance.
Sohail’s (2003) objective was to assess the dimensionsof the SERVQUAL model that influence the perception ofpatients regarding the service quality in private hospitals inMalaysia. Patients’ satisfaction was taken as dependent variableand it was measured on the basis of five dimensions defined inthe SERVQUAL model. The research instrument was aquestionnaire based upon a modified version of SERVQUALhaving five dimensions Tangibility, Reliability, Responsiveness,Assurance and Empathy and it consisted of 15 pairs of matchingexpectation/perception items. A total of 186 responses wereobtained and this represented a response rate of 18.6%. Toaddress construct validity of the study, factor analysis wasconducted. None of the reliability alphas were below the cut-off point of 0.60. The mean scores of the patients’ expectationsof service quality were generally low.
Yesilada and Direktor (2010) extracted the dimensionsof the SERVQUAL model in both public and private hospitals.In the survey, 990 people living in Northern Cyprus, above 18years of age were selected for the survey. 806 people contributedtheir responses. A 22 items-SERVQUAL model with 5-point“agree-disagree” Likert scale was used. Three factors wereextracted through factor analysis, with 61.5% explained variance.Reliability –confidence, empathy and tangibility appeared asthe most important dimensions of service quality. Privatehospitals appeared with smaller gaps between expectations andperceptions (not negligibly small), as compared to the publichospitals and were perceived as better service providers.
Research
PAKISTAN BUSINESS REVIEW JULY 2011
Assessing the Service Quality of Some Selected Hospitals in Karachi
276
III. MethodologyIII.1 Data Collection
In this study, three hospitals are selected that areoperating in Karachi. The study is conducted from September 15to October 8, 2010. To give appropriate representation to thepopulation of the city, one hospital each from the public sector,the semi-public and the private sector was selected. Both thehospital authorities and patients were given assurance ofanonymity. Target population was the out-patients who visit theconsulting and executive clinics of the three selected hospitalsduring their operating hours (morning and evening hours).
As a sampling technique, systematic sampling wasused to select every kth patient4 as a respondent. Systematicsampling was used to collect data because the entirepopulation was homogenous in terms of the purpose for whichthey had come to the hospital. The number of patients sittingin the waiting lounge was considered as the population and20% of the individuals were selected as the part of the sample.During the data collection, we found that from 20 to 30 patientsper executive/consulting clinic visited these hospitals duringconsulting hours.
During the data collection, we have faced the difficultyof lack of cooperation when the individuals who were selected,refused to be the part of the study (Approximately between 40 to50 % of them refused). The lowest numbers of respondents werefrom the public hospital where people were least willing tocooperate. Even though, the questionnaire in Urdu and wasespecially designed, keeping in view the difficulty that therespondents may face, most of the individuals who visit publichospitals are not well educated. The lack of cooperation withinthe public hospital patients was mainly because they had beenkept waiting for so long as they werefinished with the consultation they were eager to leave thehospital premises immediately.
PAKISTAN BUSINESS REVIEW JULY 2011277
Assessing the Service Quality of Some Selected Hospitals in KarachiResearch
This data collection activity was spread over the threeweeks (one week each for each hospital). The number ofrespondents from the private hospital, the semi-public hospital,and the public hospital was 96, 90, and 66 (a total of 252)respectively. The lowest numbers of respondents were from publichospital where people were least willing to cooperate.
III.2 Research Instrument
The research instrument for this study was aquestionnaire having 26 items and each item was divided intotwo parts in such a manner that the first part of each item measuresthe expectations of the patients and the second part measuresthe perceptions of the patients based upon their experiences.Each question is constructed with the 5-points Likert scale ratingfrom 1 (strongly disagree) to 5 (strongly agree). Questionnairewas also translated in Urdu for the respondents who did notunderstand English.
In this study, five dimensions of the original SERVQUALmodel that is Tangibility, Reliability, Responsibility, Assuranceand Empathy were incorporated and an additional dimensionAccessibility & Affordability included in Lim & Tang (2005) wasalso incorporated.
Tangibility includes questions related to Physical facilities,equipment and appearance of personnel.
Questions related to hospital equipment, other facilitiesapparent get up and out going personalities of doctors andparamedical staff were a vital part of the previous studies (Babakus(1992), Lim and Tang (2000), Sohail (2003), Mostafa (2005),Karassavidou (2009), and Miranda (2010)). This study has alsoincluded these questions in Tangibility dimension. (Question no.1 to Question no. 5 in the questionnaire)
Research
PAKISTAN BUSINESS REVIEW JULY 2011
Assessing the Service Quality of Some Selected Hospitals in Karachi
278
The question related to privacy during the treatmentwas only included by Lim and Tang (2000) in the Tangibilitydimension, and we have also included this question as a part ofTangibility dimension. (Question no. 5)
Lim and Tang (2000) and Karassavidou (2009) have usedmodified version of SERVQUAL by adding a new dimension“Accessibility and Affordability” in their studies. A question onadequate parking facilities was included in both studies.
Questions about the easy accessibility to hospitallocation, and affordability of hospital services, are also the partof our questionnaire (Question no. 25 and question no. 26).Previous researchers like Lim and Tang (2000), and Karassavidou(2009) have also studied these dimensions.
Ability to perform the promised service dependablyand accurately comes under the definition of Reliability.
Babakus (1992) and Miranda (2010) had includedquestion about the professionalism and competency of doctorsand health staff. This question is also the part of ourquestionnaire under reliability dimension (Question no. 8).
Question about error-free documentation of medicalrecords, previously used by Babakus (1992), Lim and Tang (2000),Sohail (2003), Mostafa (2005), Karassavidou (2009) is also addedin our questionnaire in Reliability dimension (Question no. 9).
Two questions, “Hospitals should provide their servicesat the time they promise to do so”, and “Services should becarried out right the first time”, were previously included byBabakus (1992), Lim and Tang (2000), Mostafa (2005),Karassavidu (2009), Miranda (2010) in Reliability dimension.(Question no. 6 and question no. 7).

PAKISTAN BUSINESS REVIEW JULY 2011279
Assessing the Service Quality of Some Selected Hospitals in KarachiResearch
Lim and Tang (2000) included a question aboutconsistency of charges in the same dimension and we are alsoconsidering this question. (Question no. 10).
The fourth dimension Responsiveness is defined asWillingness to help customers and provide prompt service.
Questions related to “provide prompt services”, and“willingness of doctors and health staff to help patients” wasconsidered as a part of responsiveness dimension, by Babakus(1992), Lim and Tang (2000), Sohail (2003), Mostafa (2005),Karassavidou (2009) and we are also including these questionsunder this dimension. (Question no. 11 and question no. 12)Our next question is about waiting time in health centers, wasalso the part of Lim and Tang (2000) and Miranda (2010) (Questionno. 14).
The fifth dimension Assurance, consists of questionsrelated to competence, courtesy, credibility and security,Knowledge and ability to inspire trust and confidence.
In this dimension, we are considering a questionregarding Secure feeling of patients, receiving medical services,was previously used by Babakus (1992), Sohail (2003), Mostafa(2005), Karassavidou (2009), Miranda (2010).
We have also added a question in this dimension, “Dothe Attitude and behavior of doctors/staff instill confidence inpatients?”(Question no. 13), adapted by the previous studies ofLim and Tang (2000), Sohail (2003), Mostafa (2005), Karassavidou(2009).
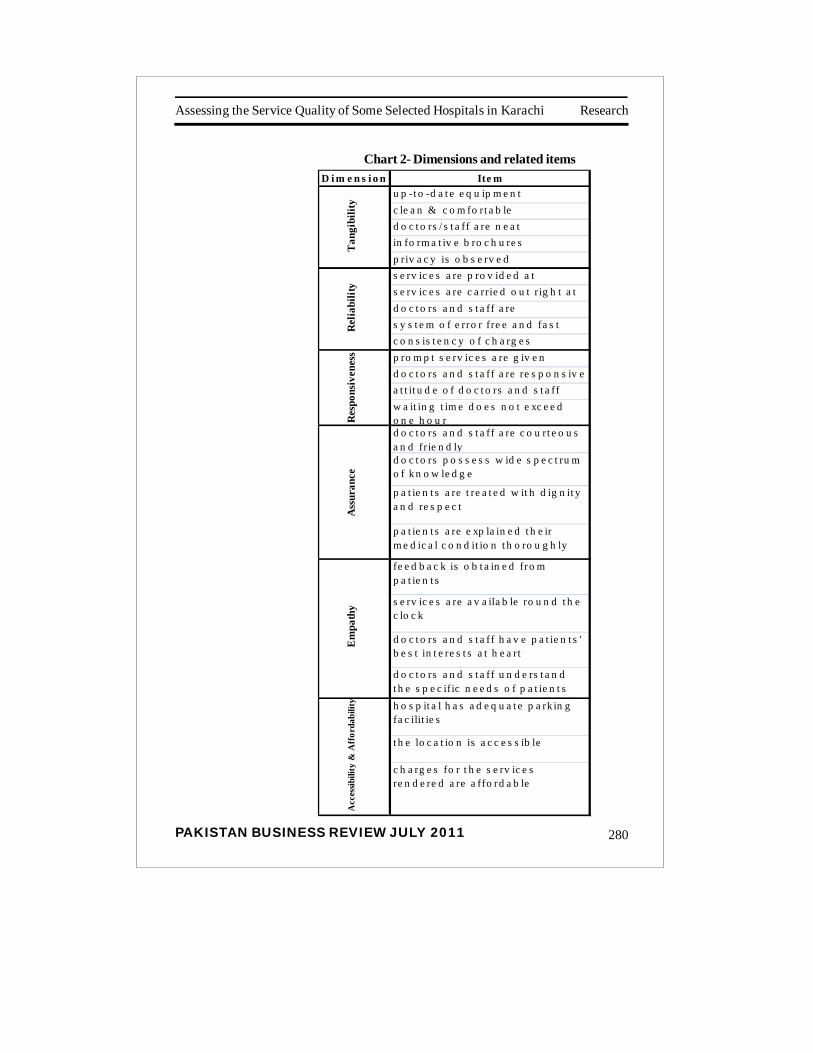
Research
PAKISTAN BUSINESS REVIEW JULY 2011
Assessing the Service Quality of Some Selected Hospitals in Karachi
280
Chart 2- Dimensions and related itemsD i m e n s i o n Ite m
u p -t o -d a t e e q u ip m e n tc le a n & c o m fo rt a b le e n v iro n m e n td o c t o rs / s t a ff a re n e a tin fo rm a t iv e b ro c h u re sp riv a c y is o b s e rv e ds e rv ic e s a re p ro v id e d a t a p p o in t e d t im es e rv ic e s a re c a rrie d o u t rig h t a t t h e firs t t im ed o c t o rs a n d s t a ff a re p ro fe s s io n a l a n d c o m p e t e n ts y s t e m o f e rro r fre e a n d fa s t re t rie v a l o f d o c u m e n t s e xis t sc o n s is t e n c y o f c h a rg e sp ro m p t s e rv ic e s a re g iv e nd o c t o rs a n d s t a ff a re re s p o n s iv ea t t it u d e o f d o c t o rs a n d s t a ff in s t ill c o n fid e n c e in p a t ie n t sw a it in g t im e d o e s n o t e xc e e d o n e h o u rd o c t o rs a n d s t a ff a re c o u rt e o u s a n d frie n d lyd o c t o rs p o s s e s s w id e s p e c t ru m o f k n o w le d g e
p a t ie n t s a re t re a t e d w it h d ig n it y a n d re s p e c t
p a t ie n t s a re e xp la in e d t h e ir m e d ic a l c o n d it io n t h o ro u g h ly
fe e d b a c k is o b t a in e d fro m p a t ie n t s
s e rv ic e s a re a v a ila b le ro u n d t h e c lo c k
d o c t o rs a n d s t a ff h a v e p a t ie n t s ' b e s t in t e re s t s a t h e a rt
d o c t o rs a n d s t a ff u n d e rs t a n d t h e s p e c ific n e e d s o f p a t ie n t sh o s p it a l h a s a d e q u a t e p a rk in g fa c ilit ie s
t h e lo c a t io n is a c c e s s ib le
c h a rg e s fo r t h e s e rv ic e s re n d e re d a re a ffo rd a b le
Acc
essib
ility
& A
ffor
dabi
lity
Tan
gibi
lity
Rel
iabi
lity
Res
pons
iven
ess
Ass
uran
ceE
mpa
thy

PAKISTAN BUSINESS REVIEW JULY 2011281
Assessing the Service Quality of Some Selected Hospitals in KarachiResearch
Babakus (1992), Lim and Tang (2000), Sohail (2003),Mostafa (2005), Karassavidou (2009), Miranda (2010) haveincluded questions related to knowledge, friendliness andcourtesy of doctors and health staff. And we are also consideringthese questions in this dimension. (Question no. 13, Questionno. 15 & Question no. 16).
Lim and Tang (2000) and Karassavidou (2009) haveextended this dimension by incorporating two additionalquestions addressing dignity and respect of patients receivinghealth services, and how doctors explain medical conditions topatients. So we are considering both questions under the samedimension. (Question no.17)
The sixth dimension Empathy includes access,communication, Caring and individualized attention that thefirm provides to its customers.
24-hours availability of services, used by Lim and Tang(2000), and Karassavidou (2009), is included in our questionnaireas a part of Empathy dimension. (Question no. 20)
Another question in the questionnaire of present study,is related to understanding of specific needs of patients, ispreviously used by Lim and Tang (2000), Mostafa (2005),Karassavidou (2009), Miranda (2010). (Question no. 22)
Interest of doctors and health staff towards problemresolution of their patients was considered previously by Limand Tang (2000), Mostafa (2005), Karassavidou (2009), Miranda(2010) and we are including this question in our questionnaire.(Question no. 21).
Research
PAKISTAN BUSINESS REVIEW JULY 2011
Assessing the Service Quality of Some Selected Hospitals in Karachi
282
III.3 Measures
SPSS 17 is used for data analysis and differences ofratings related to expectations and perceptions were obtained toidentify the gap regarding each item of the questionnaire. Thepurpose was to identify the areas where the maximum andminimum gaps in the selected hospitals exist. This approach wasalso used in Karassavidou (2009), Lim and Tang (2000),Myercoughs (2002), Sohail (2003), and Yesilada and Direktor(2010).
As a second step, factor analysis was performed. Onthe basis of the ratings of the perceptions of 252 respondents,factors were extracted as the determinants of the patients’satisfaction5. To extract important factors as the determinants ofpatients’ satisfaction, the technique of factor analysis was usedas used by Andaleeb (2008), Iwaarden (2003), Kang and James(2004), Karassavidou (2009), Manaf and Nooi (2000), Sohail(2003), Parasuraman (1988), Yesilada and Direktor (2010). Factorloadings were obtained by using Varimax rotation. Theconsistency of data was checked by using Cronbach alpha thatwas also used in Babakus and Mangold (1992), Manaf and Nooi(2000), Parasuraman (1988), Sohail (2003) and Mostafa (2005).After performing the factor analysis a regression was run bytaking all the extracted factors as the independent variables andpatients’ satisfaction as the dependent variable (Yesilada &Direktor, 2010). The values of the independent variables wereobtained by calculating the mean score of the items that wereloaded on each factor. The 26th item that measures the patients’satisfaction with overall service quality was used as thedependent variable.
nn XXXonsatisfactipatientsY
..........)'( 22110
Where,
i : the regression coefficients estimated on the basis of the
data
iX : the independent variables obtained from factor analysis
PAKISTAN BUSINESS REVIEW JULY 2011283
Assessing the Service Quality of Some Selected Hospitals in KarachiResearch
The regression models were measured in two steps:First, by considering all 252 observations and second them threeregression models that were obtained for three hospitalsbased upon thedata collected from each hospital.
IV. Findings & Discussion
At the first stage of our analysis, the study has beenfocused on the gap analysis (the difference in the ratings ofexpectations and perceptions of the respondents). For each itemof the questionnaire, the study identified the maximum andminimum gaps so that the areas of strengths and weaknesses foreach hospital. In Table 1, only maximum and minimum gaps in theitems related to each dimension were presented for all the threehospitals.
In tangibility, the item “doctors/staff are neat inappearance” has minimum difference of 0.7292 for the privatehospital while the item “informative brochures are available” hasthe maximum differences of 1.7879 for the public hospital.
In Reliability, the item “doctor/staff are professional andcompetent” has the minimum value of 0.9167 for the private hospitaland the item “system of error free and fast retrieval of documents”has the maximum value of 1.7556 for the semi-public hospital.
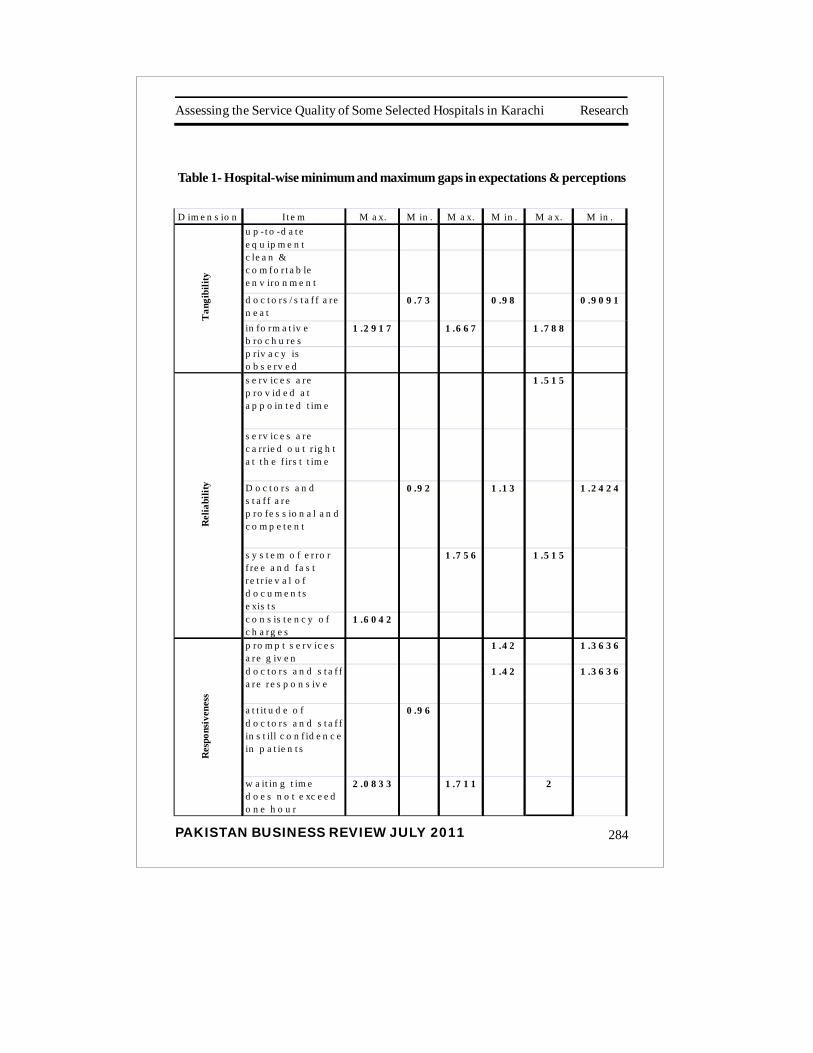
Research
PAKISTAN BUSINESS REVIEW JULY 2011
Assessing the Service Quality of Some Selected Hospitals in Karachi
284
Table 1- Hospital-wise minimum and maximum gaps in expectations & perceptions
D im e n s io n It e m M a x. M in . M a x. M in . M a x. M in .u p - t o -d a t e e q u ip m e n tc le a n & c o m fo r t a b le e n v iro n m e n t
d o c t o r s / s t a f f a r e n e a t
0 .7 3 0 .9 8 0 .9 0 9 1
in fo rm a t iv e b ro c h u re s
1 .2 9 1 7 1 .6 6 7 1 .7 8 8
p riv a c y is o b s e rv e ds e rv ic e s a r e p ro v id e d a t a p p o in t e d t im e
1 .5 1 5
s e rv ic e s a r e c a rr ie d o u t r ig h t a t t h e f irs t t im e
D o c t o r s a n d s t a f f a r e p ro fe s s io n a l a n d c o m p e t e n t
0 .9 2 1 .1 3 1 .2 4 2 4
s y s t e m o f e r ro r f re e a n d fa s t r e t r ie v a l o f d o c u m e n t s e xis t s
1 .7 5 6 1 .5 1 5
c o n s is t e n c y o f c h a rg e s
1 .6 0 4 2
p ro m p t s e rv ic e s a r e g iv e n
1 .4 2 1 .3 6 3 6
d o c t o r s a n d s t a f f a r e r e s p o n s iv e
1 .4 2 1 .3 6 3 6
a t t it u d e o f d o c t o r s a n d s t a f f in s t ill c o n f id e n c e in p a t ie n t s
0 .9 6
w a it in g t im e d o e s n o t e xc e e d o n e h o u r
2 .0 8 3 3 1 .7 1 1 2
Tan
gibi
lity
Rel
iabi
lity
Res
pons
iven
ess

PAKISTAN BUSINESS REVIEW JULY 2011285
Assessing the Service Quality of Some Selected Hospitals in KarachiResearch
Ass
uran
ce
do c to r s and s ta f f a r e c ou r te o us a nd fr ien d ly do c to r s po ss ess w i de sp e c tr um o f kn o w le d ge
1.0 8 89
.93 9 4
pa t ie nts a re tr e a ted w it h dig n ity a nd re s p e c t
.87 5 0
pa t ie nts a re e xp la in e d the ir m e d ic a l c on d itio n tho r o ug hl y
1 .1 8 75
1 .6 22 2 2 .1 51 5
Empa
thy
fe e d b a c k is ob ta in e d fr o m pa t ie nts
1 .5 8 33
2 .0 22 2
2 .4 54 5
se r vi c es a r e a va il a ble ro u nd th e c lo c k
1 .06 2 5 1.5 1 11 .87 8 8
do c to r s and s ta f f ha v e pa t ie nts ' be s t inte r es ts a t he a r t do c to r s and s ta f f un de rs ta nd the s pe c i fic ne e d s o f pa t ie nts
Acc
essib
ility
&
Affo
rdab
ility
ho sp ita l h a s a de q u a te pa r k in g fa c il itie s the lo c a tio n is a c ce ss ib le
.77 0 8 1.0 0 00 .78 7 9
c ha r g e s f or the s e rv ic es re n d er ed a r e a ff o r dab le
1 .8 1 25
1 .9 11 1
2 .3 33 3
D im e nsi on I tem M a x . M in . M ax . M in . M a x . M in.
Table-1 (continuation)
Research
PAKISTAN BUSINESS REVIEW JULY 2011
Assessing the Service Quality of Some Selected Hospitals in Karachi
286
In Responsiveness, the item “attitude of doctors andstaff instill confidence in patients” has the minimum meandifference of 0.9583 for the private hospital and the item “waitingtime should not exceed one hour” has the maximum mean ratingof 2.0833 for the private hospital.
In Assurance, the item “patients are treated with dignityand respect” has the minimum mean difference of 0.875 for theprivate hospital and the item “patients are explained their medicalcondition thoroughly has the highest mean difference of 2.1515for the public hospital.
For Empathy, the item “services are available round theclock” is found with the minimum value of 0.8788 lowest for thepublic hospital and the item “feedback is obtained from patientshas the highest mean difference of 2.4545 for the public hospital.
For Accessibility & Affordability, the item “the locationis accessible” has the minimum mean difference of 0.7708 for theprivate hospital and the maximum difference of 2.3333 in meanratings is observed for the item “charges for the servicesrendered are affordable” for the public hospital.
In the second stage, exploratory factor analysis wasperformed (see Appendix 2 for SPSS output of Factor Analysis),by taking the ratings of the perception of respondents regardingeach item then these extracted factors were used to determinepatients’ satisfaction. The results are displayed in table 2.
Five factors were extracted as a result of factor analysis.According to the nature of the items that were loaded on a factor;they are named as Tangibility & Professionalism, Reliability &responsiveness, Assurance & Empathy, Feedback, andAffordability.

PAKISTAN BUSINESS REVIEW JULY 2011287
Assessing the Service Quality of Some Selected Hospitals in KarachiResearch
Table 2- Extracted Factors, Factor Loadings, Cronbach Alpha and AverageVariance Extracted
Dimensions /Item s
F actor Loa dings
C ronbach A lpha(α)
Avera ge Variance Ex tracted (AVE )
T angib il ity and Pro fessiona lis m 0 .8 38 17 .555 Up to date and well m ain tain ed equ ip men t 0 .77 4 Do ctors and staff are neat in a ppearance 0 .67 1 Do ctors and staff are profes sio nal and com petent 0 .70 5 Sys tem of erro r free and fas t r et rieval of do cum ents 0 .66 2 Do ctors po ss ess wid e sp ect rum o f kn owledg e 0 .61 7 Th e lo catio n i s access ib le 0 .54 1 Rel iabi li ty & Respo nsiv enes s 0 .8 65 15 .754 Priv acy is ob served du rin g t re atm ent 0 .59 0 Services are pro vid ed at app oin ted time 0 .68 4 Services are carried out rig ht at the fi rst tim e 0 .63 8 Do ctors and staff are res po nsi ve 0 .51 5 At ti tud e of d octors an d s taff ins til l con fi den ce in patients 0 .63 6
wait in g t im e d oes not exceed on e hou r 0 .77 2 As surance a nd Em pathy 0 .7 52 13 .851 Do ctors and staff are court eous and friend ly 0 .57 4 Pati ents are treated wi th di gni ty and resp ect 0 .62 3 Do ctors and staff have p atients' best in terest at heart 0 .77 8 Do ctors and staff und erstand the specific needs o f a patient 0 .80 3 Feedback a nd Gui dance 0 .5 57 9.6 90 Infor mat ive broch ures are av ailab le 0 .57 3 Pati ents are exp lain ed their med ical con dit io n thoro ug hly 0 .79 2
Feedback is ob tain ed fro m pati ent s 0 .80 7 Affo rdabil ity 0 .8 51 6.4 98 C ons is ten cy o f charges 0 .70 4 C harges for the s ervices rendered are affo rdab le 0 .81

Research
PAKISTAN BUSINESS REVIEW JULY 2011
Assessing the Service Quality of Some Selected Hospitals in Karachi
288
The reliability coefficients (Cronbach Alpha) are allgreater than 0.5 (see appendix 3) and ranged from 0.577 to 0.865except for the factor (named as affordability) for which the valueis below the cut off value of 0.6. The total variance explained onthe basis of rotated factor loading is 63.349. The averagevariances extracted by each of factors are 17.555 (tangibility &professionalism), 15.754 (reliability & responsiveness), 13.851(assurance & empathy), 9.690 (feedback & guidance) and 6.498(affordability) respectively. Chart 3 gives the flow chart ofdeterminants with alpha (α) values and average variance extractedby each factor.
CHART 3 – Determinants of Patients’ Satisfaction extracted from ExploratoryFactor Analysis with Cronbach Alpha and Average Variance Extracted Values
Tangibility &
Professionalism
Affordability
a
Reliability & Responsiveness
Assurance & Empathy
Feedback & Guidance
Patients’ Satisfaction
α=0.838, AVE =17.555%
α=0.865, AVE =15.754%
α=0.752, AVE =13.851%
α=0.557, AVE =9.690%
α=0.851, AVE =6.468%

PAKISTAN BUSINESS REVIEW JULY 2011289
Assessing the Service Quality of Some Selected Hospitals in KarachiResearch
In the third stage of data analysis, regression analysiswas performed by taking the ratings of 252 respondents on thebasis of items related to the extracted factors. These extractedfactors have been taken as the independent variables whilepatients’ satisfaction (measured with the help of ratings given tothe 26th item6 of the questionnaire) as the dependent variable. Theresults of regression analysis are presented in tables 3 (a) through3 (c). From table 3 (a), R Square for the regression model is 0.694with the standard error of the estimate having a very low value of0.32086. Table 3 (b) gives the results of analysis of variance and itshows that ANOVA is statistically significant.It adds further reliability to the regression model.
Table 3 (a)
Model R R
Square Adjus ted R
Square
Std. Erro r of
the Estimate
1 .833a .694 .687 .32806
Table 3 (b)
A N O V A b
M o de l S u m of S qu a r e s df
M e a n S q u a re F S ig .
1 R e g r e ss ion 5 9 .95 4 5 1 1 .99 1 1 11 .41 7 .0 00 a
R e s id ua l 2 6 .47 5 2 46 .10 8 T o ta l 8 6 .42 9 2 51
Table (3 c) gives the regression coefficients for the model
based upon the extracted factors. All the five factors that wereextracted on the basis of factor analysis are found statisticallysignificant to determine patients’ satisfaction except the factornamed as feedback and guidance.
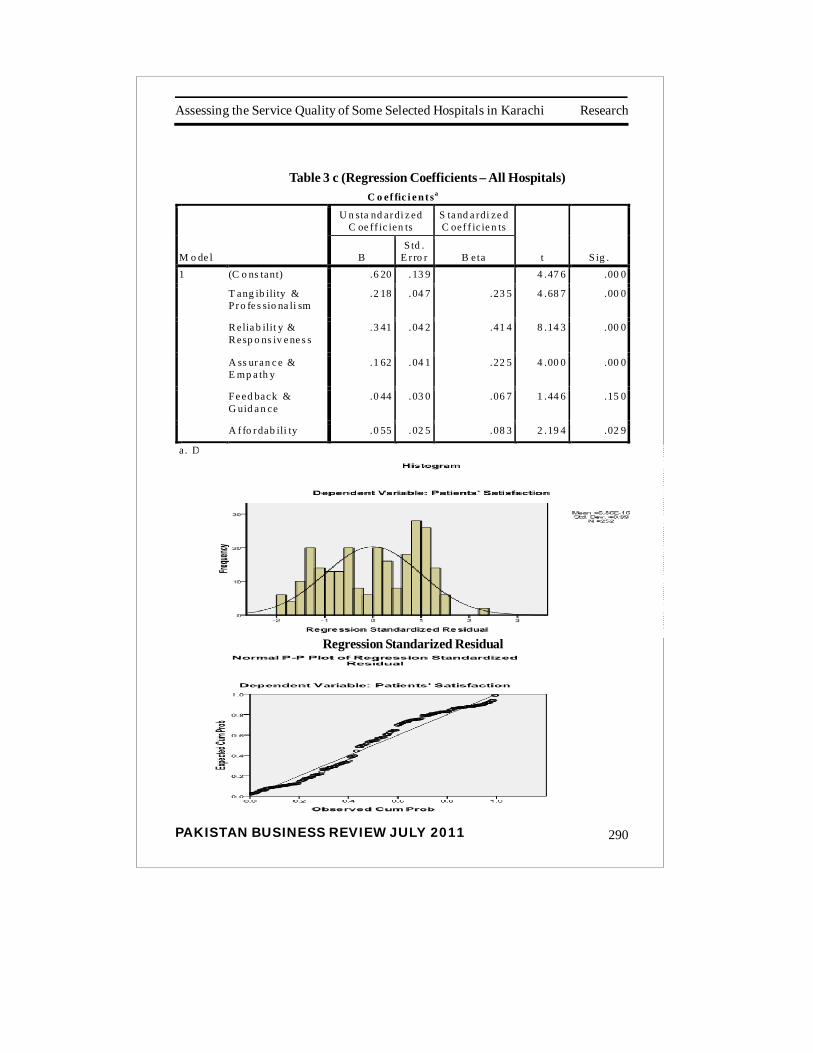
Research
PAKISTAN BUSINESS REVIEW JULY 2011
Assessing the Service Quality of Some Selected Hospitals in Karachi
290
C o ef fic i e nt sa
M o de l
U n sta nd ar di z ed C oe ff ic ien ts
S ta nd a rdi ze d C oef f ic ie n ts
t S ig . B S td .
E r ro r B eta 1 (C o ns tant) .6 20 .13 9 4 .47 6 .00 0
T ang ib ility & Pr o fe s sio na li sm
.2 18 .04 7 .23 5 4 .68 7 .00 0
R elia b ilit y & R esp o ns iv e ne s s
.3 41 .04 2 .41 4 8 .14 3 .00 0
A ss ur an c e & E mp a th y
.1 62 .04 1 .22 5 4 .00 0 .00 0
Fe ed back & G uid a n ce
.0 44 .03 0 .06 7 1 .44 6 .15 0
A f fo r dab ili ty .0 55 .02 5 .08 3 2 .19 4 .02 9
a . D e p end ent V ariab le : P a tie nt s' Sa tis f ac tio n
Table 3 c (Regression Coefficients – All Hospitals)
Regression Standarized Residual
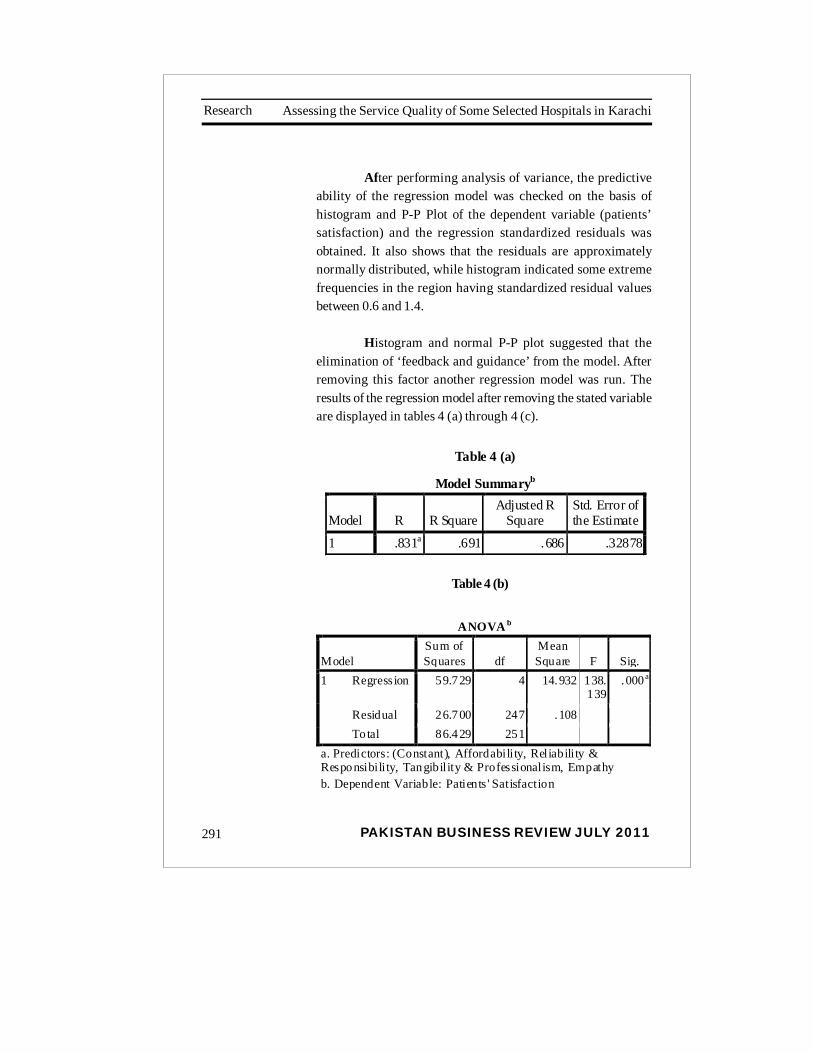
PAKISTAN BUSINESS REVIEW JULY 2011291
Assessing the Service Quality of Some Selected Hospitals in KarachiResearch
After performing analysis of variance, the predictiveability of the regression model was checked on the basis ofhistogram and P-P Plot of the dependent variable (patients’satisfaction) and the regression standardized residuals wasobtained. It also shows that the residuals are approximatelynormally distributed, while histogram indicated some extremefrequencies in the region having standardized residual valuesbetween 0.6 and 1.4.
Histogram and normal P-P plot suggested that theelimination of ‘feedback and guidance’ from the model. Afterremoving this factor another regression model was run. Theresults of the regression model after removing the stated variableare displayed in tables 4 (a) through 4 (c).
Table 4 (a)
Model Summaryb
Model R R Square Adjusted R
Square Std. Error of the Estimate
1 .831a .691 .686 .32878
Table 4 (b)
ANOVA b
Model Sum of Squares df
Mean Square F Sig.
1 Regression 59.729 4 14.932 138.139
.000 a
Residual 26.700 247 .108 To tal 86.429 251
a. Predictors: (Constant), Affordability, Reliability & Responsibility, Tangibility & Professionalism, Empathy b. Dependent Variable: Patients ' Satisfaction
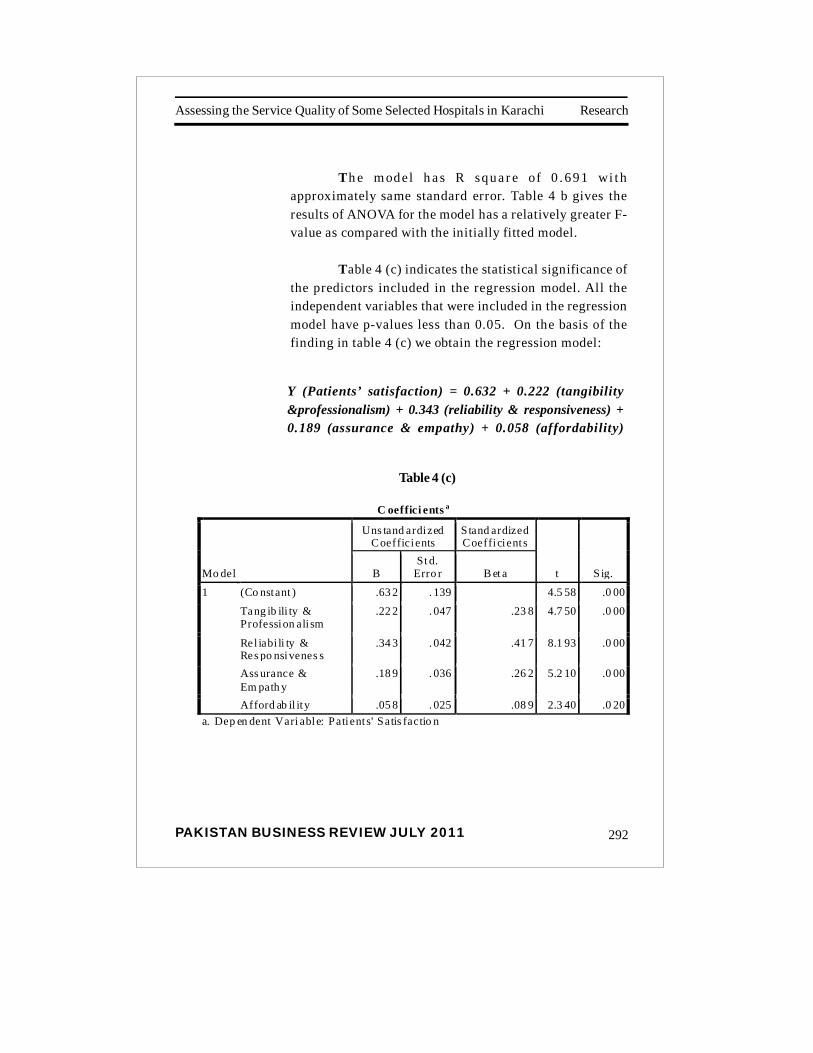
Research
PAKISTAN BUSINESS REVIEW JULY 2011
Assessing the Service Quality of Some Selected Hospitals in Karachi
292
Th e m odel h a s R squa r e of 0 . 691 wi t happroximately same standard error. Table 4 b gives theresults of ANOVA for the model has a relatively greater F-value as compared with the initially fitted model.
Table 4 (c) indicates the statistical significance ofthe predictors included in the regression model. All theindependent variables that were included in the regressionmodel have p-values less than 0.05. On the basis of thefinding in table 4 (c) we obtain the regression model:
Y (Patients’ satisfaction) = 0.632 + 0.222 (tangibility&professionalism) + 0.343 (reliability & responsiveness) +0.189 (assurance & empathy) + 0.058 (affordability)
Table 4 (c)
C oeffici ents a
Mo del
Uns tand ardized Coefficients
S tand ardized Coefficient s
t S ig. B St d.
Erro r B et a
1 (Co nstant ) .63 2 . 139 4.5 58 .0 00
Tang ib ili ty & Profession ali sm
.22 2 . 047 .23 8 4.7 50 .0 00
Rel iabi li ty & Res po nsivenes s
.34 3 . 042 .41 7 8.1 93 .0 00
Ass urance & Em path y
.18 9 . 036 .26 2 5.2 10 .0 00
Afford ab il ity .05 8 . 025 .08 9 2.3 40 .0 20a. Dep en dent Vari able: Pati ent s' Satis factio n

PAKISTAN BUSINESS REVIEW JULY 2011293
Assessing the Service Quality of Some Selected Hospitals in KarachiResearch
In the fourth stage of the data analysis, separate modelswere obtained for the three hospitals. Preliminary data analysisindicated that different combinations of predictors werestatistically significant for each hospital set up.
Table 5 (Regression model For Private Hospital)
Model Summary
Model R R Square Adjusted R
Square Std. Error of the Estimate
1 .718a .516 .500 .33509 a. Predictors: (Constant), affordability, reliability & responsiveness, feedback & guidance
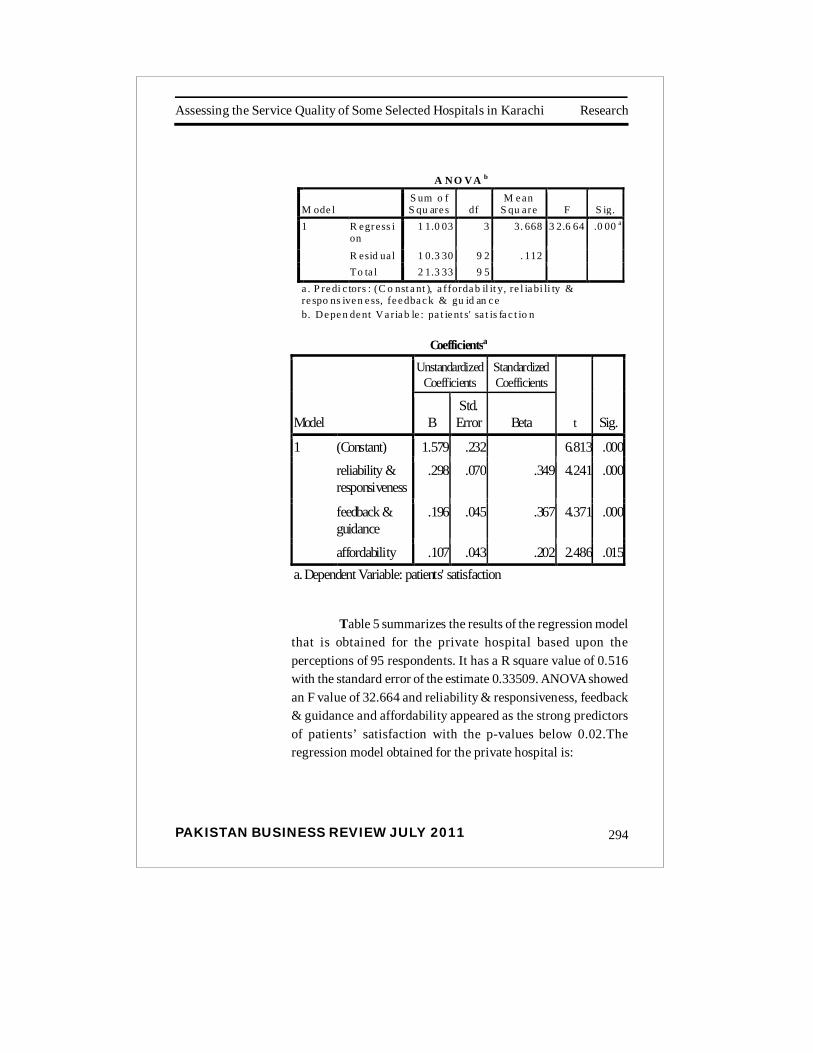
Research
PAKISTAN BUSINESS REVIEW JULY 2011
Assessing the Service Quality of Some Selected Hospitals in Karachi
294
A NO VA b
M ode l S um o f S qu are s df
M e an S qu are F S ig.
1 R egress ion
1 1.0 03 3 3. 668 3 2.6 64 .0 00 a
R esid ual 1 0.3 30 9 2 . 112 To ta l 2 1.3 33 9 5
a . P re di c tors : (C o nst a nt ), a fforda b il it y, re l ia bi li ty & re spo ns ive n e ss, fe e dba c k & gu id an c e b. De pe n de nt Va ria b le : pa t ie nt s' sa t is fa c t io n
Coefficientsa
Model
Unstandardized Coefficients
Standardized Coefficients
t Sig. B Std. Error Beta
1 (Constant) 1.579 .232 6.813 .000reliability & responsiveness
.298 .070 .349 4.241 .000
feedback & guidance
.196 .045 .367 4.371 .000
affordability .107 .043 .202 2.486 .015a. Dependent Variable: patients' satisfaction
Table 5 summarizes the results of the regression modelthat is obtained for the private hospital based upon theperceptions of 95 respondents. It has a R square value of 0.516with the standard error of the estimate 0.33509. ANOVA showedan F value of 32.664 and reliability & responsiveness, feedback& guidance and affordability appeared as the strong predictorsof patients’ satisfaction with the p-values below 0.02.Theregression model obtained for the private hospital is:
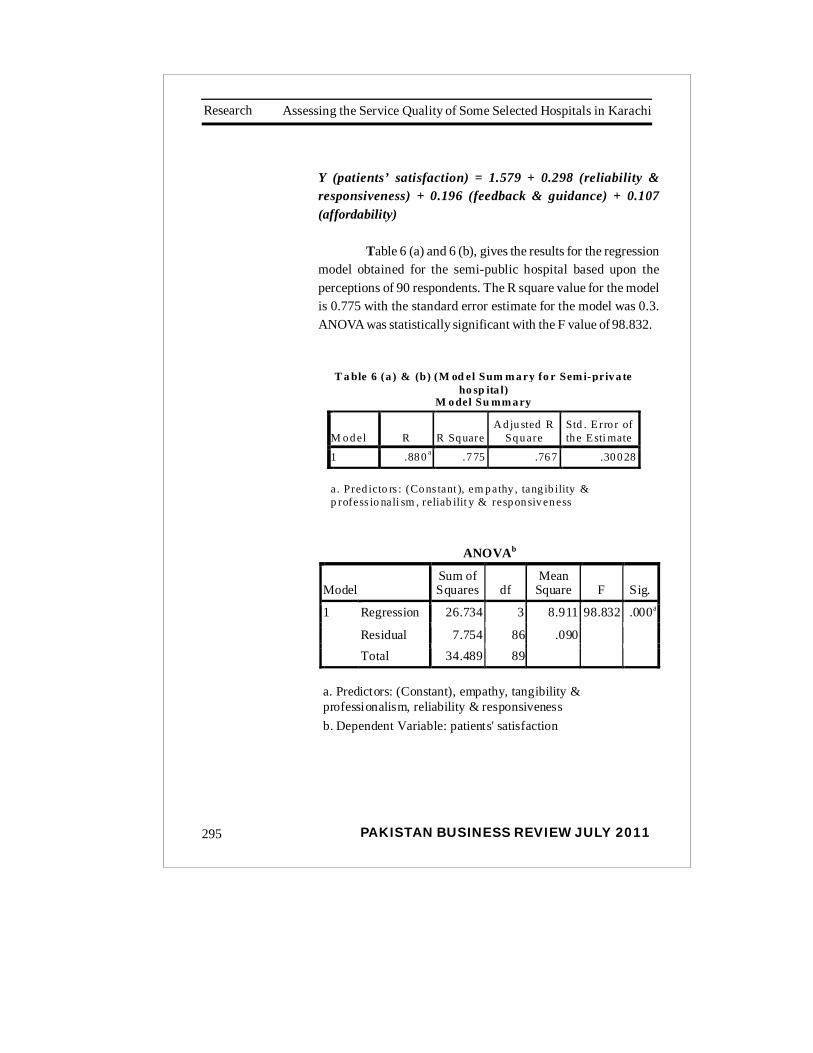
PAKISTAN BUSINESS REVIEW JULY 2011295
Assessing the Service Quality of Some Selected Hospitals in KarachiResearch
Y (patients’ satisfaction) = 1.579 + 0.298 (reliability &responsiveness) + 0.196 (feedback & guidance) + 0.107(affordability)
Table 6 (a) and 6 (b), gives the results for the regressionmodel obtained for the semi-public hospital based upon theperceptions of 90 respondents. The R square value for the modelis 0.775 with the standard error estimate for the model was 0.3.ANOVA was statistically significant with the F value of 98.832.
T a ble 6 (a ) & (b) (M od el Sum m a ry fo r Sem i-priv a te
ho sp ita l) M o del Su mm a ry
M o d el R R Sq uare A d ju sted R
Sq u are Std . E rro r of th e E sti mate
1 .88 0 a .7 75 .76 7 .30 0 28
a. Pred icto rs : (Co ns tant ), em p athy , tang ib ility & p rofess io nali sm , reliab ilit y & resp on siv en ess
ANOVAb
Model Sum of Squares df
Mean Square F Sig.
1 Regression 26.734 3 8.911 98.832 .000a
Residual 7.754 86 .090 Total 34.489 89
a. Predictors: (Constant), empathy, tangibility & professionalism, reliability & responsiveness b. Dependent Variable: patients' satisfaction
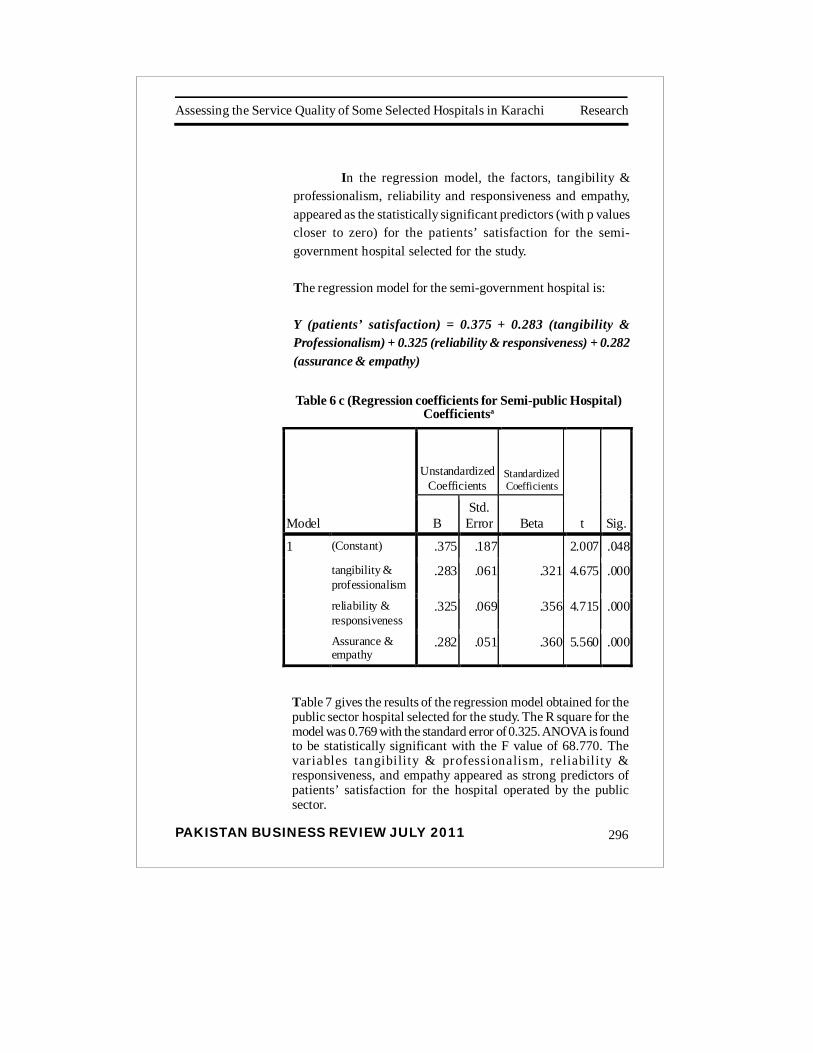
Research
PAKISTAN BUSINESS REVIEW JULY 2011
Assessing the Service Quality of Some Selected Hospitals in Karachi
296
In the regression model, the factors, tangibility &professionalism, reliability and responsiveness and empathy,appeared as the statistically significant predictors (with p valuescloser to zero) for the patients’ satisfaction for the semi-government hospital selected for the study.
The regression model for the semi-government hospital is:
Y (patients’ satisfaction) = 0.375 + 0.283 (tangibility &Professionalism) + 0.325 (reliability & responsiveness) + 0.282(assurance & empathy)
Table 6 c (Regression coefficients for Semi-public Hospital)Coefficientsa
Model
Unstandardized Coefficients
Standardized Coefficients
t Sig. B Std.
Error Beta
1 (Constant) .375 .187 2.007 .048
tangibility & professionalism
.283 .061 .321 4.675 .000
reliability & responsiveness
.325 .069 .356 4.715 .000
Assurance & empathy
.282 .051 .360 5.560 .000
Table 7 gives the results of the regression model obtained for thepublic sector hospital selected for the study. The R square for themodel was 0.769 with the standard error of 0.325. ANOVA is foundto be statistically significant with the F value of 68.770. Thevariables tangibility & professionalism, reliability &responsiveness, and empathy appeared as strong predictors ofpatients’ satisfaction for the hospital operated by the publicsector.
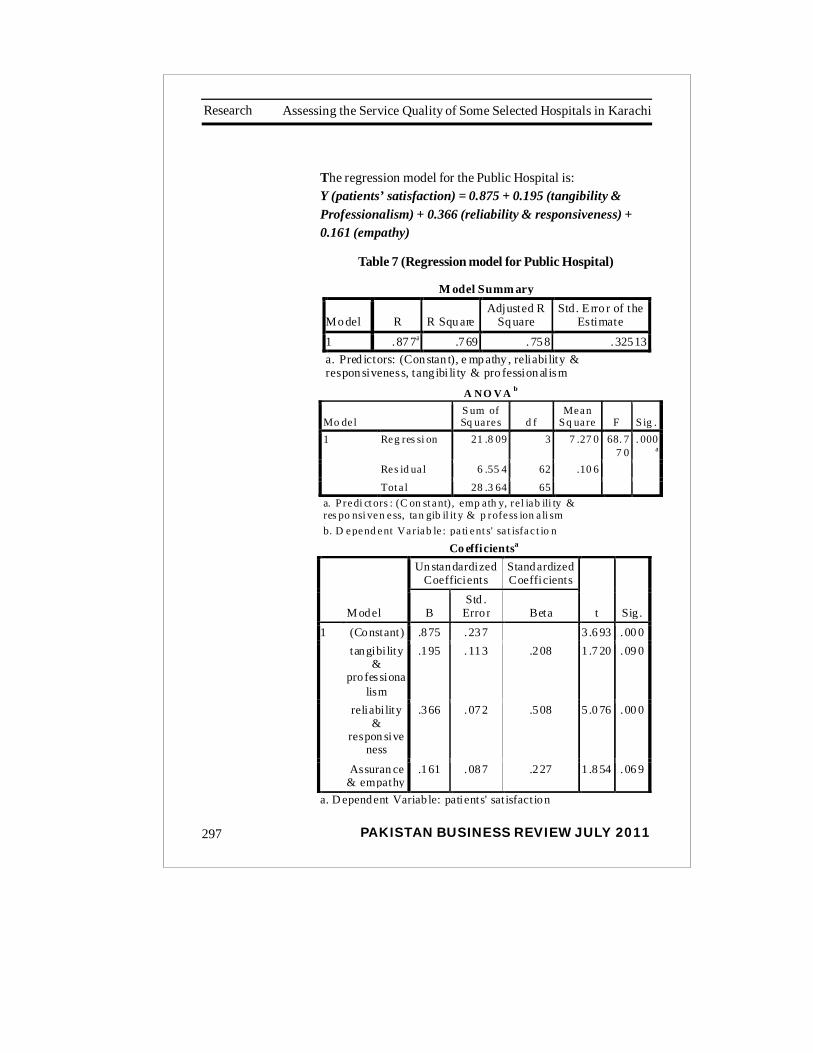
PAKISTAN BUSINESS REVIEW JULY 2011297
Assessing the Service Quality of Some Selected Hospitals in KarachiResearch
The regression model for the Public Hospital is:Y (patients’ satisfaction) = 0.875 + 0.195 (tangibility &Professionalism) + 0.366 (reliability & responsiveness) +0.161 (empathy)
Table 7 (Regression model for Public Hospital)
M odel Summ ary
Mo del R R Squ are Adjusted R
Sq uare Std . E rro r of the
Estimate
1 . 87 7a .7 69 . 75 8 .32513a. Pred ictors: (Con stan t), e mp athy , reliability & respon siveness, tangibi li ty & pro fession alism
A NO V A b
Mo de l S um of Sq uares d f
Mean Sq uare F S ig .
1 Reg res si on 21 .8 09 3 7 .27 0 68. 77 0
. 000a
Res id ua l 6 .55 4 62 .10 6
Tot a l 28 .3 64 65 a. P redi ct ors : (C on st ant), emp ath y, rel iab ili ty & res po nsi ven ess, tan gib il it y & p rofess ion a li sm b. D epend ent Variab le : pa ti ent s' sa t isfac t io n
Co efficientsa
M odel
Un standardized Coefficients
Standardized Coefficients
t Sig . B Std .
Erro r Beta
1 (Constant) .875 . 237 3 .6 93 . 00 0 tangibi lity
& pro fes siona
lism
.195 . 113 .208 1 .7 20 . 09 0
reliabi lity &
respon siveness
.366 . 072 .508 5 .0 76 . 00 0
Assuran ce & empathy
.161 . 087 .227 1 .8 54 . 06 9
a. D ependent Variab le: patients' sat isfact ion
Research
PAKISTAN BUSINESS REVIEW JULY 2011
Assessing the Service Quality of Some Selected Hospitals in Karachi
298
Conclusions and Recommendations
The paper provides health care managers andadministrators an opportunity to identify the dimensions of theservice quality in which larger gaps between the patients’expectations and perceptions were found in the three hospitals.In this context, the gap analysis has revealed that the followingitems have very large gaps.
Availability of informative brochures Error free and fast retrieval of documents Waiting times Counseling of patients regarding their
treatment Feedback of patients regarding service quality Affordability of charges
Hospital-based comparison identifies that the maximumgap regarding availability of informative brochures has beenobserved among the respondents who have visited the publichospital. This result is expected because of the fact the publichospitals are not profit oriented but service oriented entities andtheir spending depends upon the governments’ budgetaryallocations and for that reason public sector hospitals have muchless to spend on informative brochures as compared to the privatesector hospitals. Error free and fast retrieval of documents is thearea of concern for the respondents who have visited the semi-private hospital. Waiting time is the area of grievance among thevisitors of the private hospital. Respondents of public hospitalshave rated the items ‘medical condition thoroughly’, ‘feedbackobtained from patients’ and ‘affordability of charges’ in a waythat gives the larger gaps between their expectations andperceptions regarding quality of service that they are provided.Table 8 gives the summary of the regression models that wererun in this study.
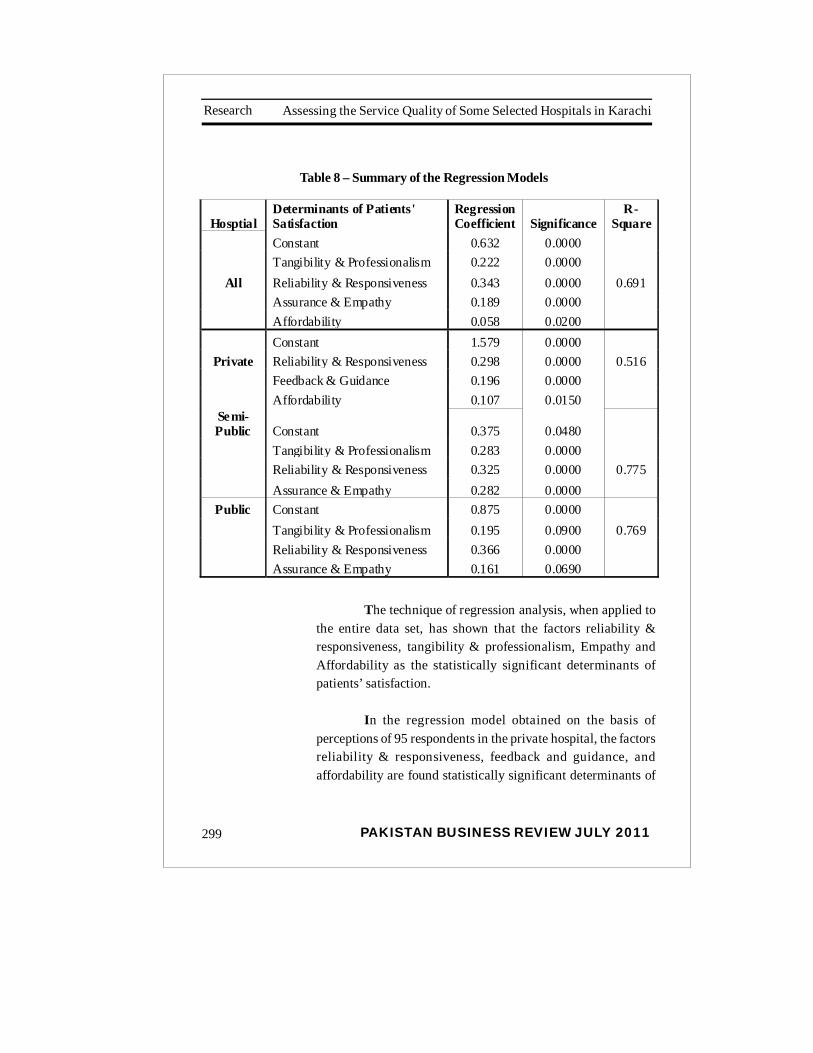
PAKISTAN BUSINESS REVIEW JULY 2011299
Assessing the Service Quality of Some Selected Hospitals in KarachiResearch
Table 8 – Summary of the Regression Models
Hosptial Determinants of Patients' Satisfaction
Regression Coefficient Significance
R-Square
Constant 0.632 0.0000
Tangibility & Professionalism 0.222 0.0000 All Reliability & Responsiveness 0.343 0.0000 0.691
Assurance & Empathy 0.189 0.0000
Affordability 0.058 0.0200
Constant 1.579 0.0000
Private Reliability & Responsiveness 0.298 0.0000 0.516
Feedback & Guidance 0.196 0.0000
Affordability 0.107 0.0150 Semi-
Public Constant 0.375 0.0480
Tangibility & Professionalism 0.283 0.0000
Reliability & Responsiveness 0.325 0.0000 0.775
Assurance & Empathy 0.282 0.0000
Public Constant 0.875 0.0000
Tangibility & Professionalism 0.195 0.0900 0.769
Reliability & Responsiveness 0.366 0.0000
Assurance & Empathy 0.161 0.0690
The technique of regression analysis, when applied tothe entire data set, has shown that the factors reliability &responsiveness, tangibility & professionalism, Empathy andAffordability as the statistically significant determinants ofpatients’ satisfaction.
In the regression model obtained on the basis ofperceptions of 95 respondents in the private hospital, the factorsreliability & responsiveness, feedback and guidance, andaffordability are found statistically significant determinants of

Research
PAKISTAN BUSINESS REVIEW JULY 2011
Assessing the Service Quality of Some Selected Hospitals in Karachi
300
patients’ satisfaction. The findings indicate that the managementof the private hospital considered in the study has to work in theareas that appeared as the significant determinants of patients’satisfaction. They have to especially focus on shortening thewaiting time of the patients and make sure the availability of thedoctors at the appointed time. They have also to focus on theaffordability aspect of the service.
The regression model obtained for the semi-publichospital has resulted in the factors of reliability &responsiveness, tangibility & professionalism and empathy asthe statistically significant determinants of patients’ satisfaction.This model is based upon 90 respondents who have visited theselected semi-public hospital at the time of data collection. Themanagement of this hospital has to give more emphasis on thecleanliness of the hospital and to make their staff more courteous.They have also to improve the system of fast and error freeretrieval of documents and they have to make their staff morecourteous and responsive because these are some of the aspectsof the service quality with which patients are most dissatisfiedand need immediate attention.
In the public hospital selected for the study, theregression model based upon the perceptions of 66 respondentsidentifies the factors of reliability and responsiveness, tangibility& professionalism and empathy as the statistically significantpredictors of patients’ satisfaction. According to the findings ofthis study the areas of immediate attention with which patientscan be made more satisfied are the cleanliness of the hospital,waiting times, proper attention and guidance to the patientsregarding their medical condition and feedback of the patients.The public hospitals are the only sign of hope and source ofgetting medical treatment for the masses as the majority of ourpopulation lives below the poverty line and they cannot affordto get medical treatment in the private hospitals.
PAKISTAN BUSINESS REVIEW JULY 2011301
Assessing the Service Quality of Some Selected Hospitals in KarachiResearch
In comparison with the overall regression model thefactor of reliability & responsiveness is the common factorappeared with the highest factor loadings in all regression models.The factors of tangibility & professionalism and empathy haveappeared in the regression models obtained for the semi-publicand public sector hospitals. The factors of feedback & guidanceand affordability have appeared as the determinants of patients’satisfaction only in the regression model obtained for the privatehospital.
The target audience of this paper is the management ofthe hospitals considered in the study. The findings of this researchpaper highlight the areas where management of each hospital hasto make improvements to increase patients’ satisfaction becausethe gaps in perceptions and expectations of the patients arecritically important for their performance improvement.
Research
PAKISTAN BUSINESS REVIEW JULY 2011
Assessing the Service Quality of Some Selected Hospitals in Karachi
302
Notes
1- It is based upon three dimensions, technical, functionaland image to determine the service quality instead offunctional quality dimension that is characterized by fivecomponents in the original SERVQUAL model.
2 - It includes the services of doctors and nurses, clinicaltreatment received, the way the patients were managed ortreated, and the information given about the condition ofpatien t
3 - It includes clean line ss , environmen t , no ise in wa rd,management of visitors, registration process, comfort ofwaiting room, atmosphere of pharmacy.
4 - It was determined by taking 20% of the patients selected asthe respondents who vis ited the hospitals du ring datacollection period.
5 - It is the degree to which individual regards the health careservice or product or the manner in which it is delivered bythe provider as useful, effective or beneficial.
Source: www.biology-online.org/dictionary/ patient_satisfaction
6- How do you rate the overall service quality of this hospital?
PAKISTAN BUSINESS REVIEW JULY 2011303
Assessing the Service Quality of Some Selected Hospitals in KarachiResearch
References
Andaleeb.S (1992) ,”Caring for children: A model of healthcareservice quality in Bangladesh” , International Journal forQuality in Health Care, Volume 20, Number 5: pp. 339–345
Babakus.E,Mangold.G , “Adapting the SERVQUAL Scale toHospital Services”: An Empirical investigation , HealthServices Research 26:6 (February 1992)
Iwaarden, V. J., van der Wiele, T., Ball, L., and Millen, R.,(2003), “Applying SERVQUAL to websites: An exploratorystudy”, International Journal of Quality & ReliabilityManagement, Vol.20, No. 8, pp. 919-935
Kang.G and James.J, (2004), “Service quality dimensions:Anexamination of Gronroos’s service model” Managing ServiceQuality, Vol. 14, No. 4, pp 266-277.
Karassavidou, E., Glaveli, N., Papadopoulos, C. T., (2009),“Health Care Quality in Greek NHS Hospitals: No one knowsbetter than patients”, Measuring Business Excellence, Vol.13,No. 1, pp 34-46.
Lim, P.C. and Tag, N.K. (2000), “A study of patients’expectations and satisfaction in Singapore hospital”,International Journal of Health Care Quality Assurance, Vol.13, No. 7, pp. 290-299.
Manaf.N and Nooi.P(2009). “Patient Satisfaction as anIndicator of Service Quality in Malaysian Public Hospitals”,Asian Journal on Quality, Vol. 10 Iss: 1, pp.77 – 87
Miranda, F.J., Chamorro, A., Murillo, L.R., Vega, J. “Adaptingthe SERVQUAL Scale to Primary Health Care Services in Spain:Managers vs. Patients perceptions”, J. Public HealthManagement Practice(2010)
Mostafa, M.M. (2006), An empirical study of patients;expectations and satisfaction in Egyptian Hospitals”,
Research
PAKISTAN BUSINESS REVIEW JULY 2011
Assessing the Service Quality of Some Selected Hospitals in Karachi
304
International Journal of Health Care Quality Assurance, Vol.18, No. 7, pp. 516-32
Myerscough.M.A (2002) ‘ “Concerns about SERVQUAL’sunderlying dimensions”, Issues in information systems,III,pp.462-470
Oliveria, O.J., and Ferreira, E.C., “Adaptation and applicationof the SERVQUAL scale in higher education”, POMS 20th
Annual Conference.
Parasuraman, A., Valarie, A., Zeithaml, Berry, L. L. (1985), “ AConceptual model of Service Quality and Its Implications forFuture Research”, Journal of Marketing Vol.49 (Fall 1985), pp41-50
Parasuraman, A., Zeithaml, V.A., and Berry, L. (1988),“SERVQUAL: A Multiple-item Scale for Measuring ConsumerPerceptions of Service Quality”, Journal of Retailing, Vol.64(Spring), p.12-40.
Sohail, M. S.,(2003), “Service quality in hospitals: morefavorable than you might think”, Managing service Quality,Vol. 13 Iss:3, pp.197-206
Vinagre, M. H., Neves, J., (2008)”The influence of service qualityand patients’ emotions on satisfaction”, International Journalof Health Care Quality Assurance Vol.21 No.1, pp. 87-103
Yesilada.F and Direktor.E: “Health care service quality:Acomparison of public and private hospitals”, African Journalof Business management ,Vol.4(6),pp 962-971,June 2010.

PAKISTAN BUSINESS REVIEW JULY 2011305
Assessing the Service Quality of Some Selected Hospitals in KarachiResearch
APPENDIX 1Que s t io nnair e
Gender: M / F Age: _______Area of Residence: _______________
1. The hospital should have up-to-date and well-maintainedmedical facilities and equipment
1(a). The hospital has up-to-date and well-maintained medicalfacilities and Equipment
1. 1 2 3 4 51(a). 1 2 3 4 5strongly disagree strongly agree
2. The hospital should have clean and comfortable environmentwith good directional signs.
2(a). The hospital should has clean and comfortable environmentwith good
directional signs.
2 . 1 2 3 4 52(a). 1 2 3 4 5strongly disagree strongly agree
3. Doctors /staff should be neat in appearance.3(a). Doctors /staff are neat in appearance.
3 . 1 2 3 4 53(a). 1 2 3 4 5strongly disagree strongly agree
4. Informative brochures about services should be available.4(a). Informative brochures about services are available.
4 . 1 2 3 4 54(a). 1 2 3 4 5strongly disagree strongly agree
5. Privacy should be observed during treatment.5(a). Privacy is observed during treatment.
5 . 1 2 3 4 55(a). 1 2 3 4 5strongly disagree strongly agree
6. Services should be provided at appointed time.
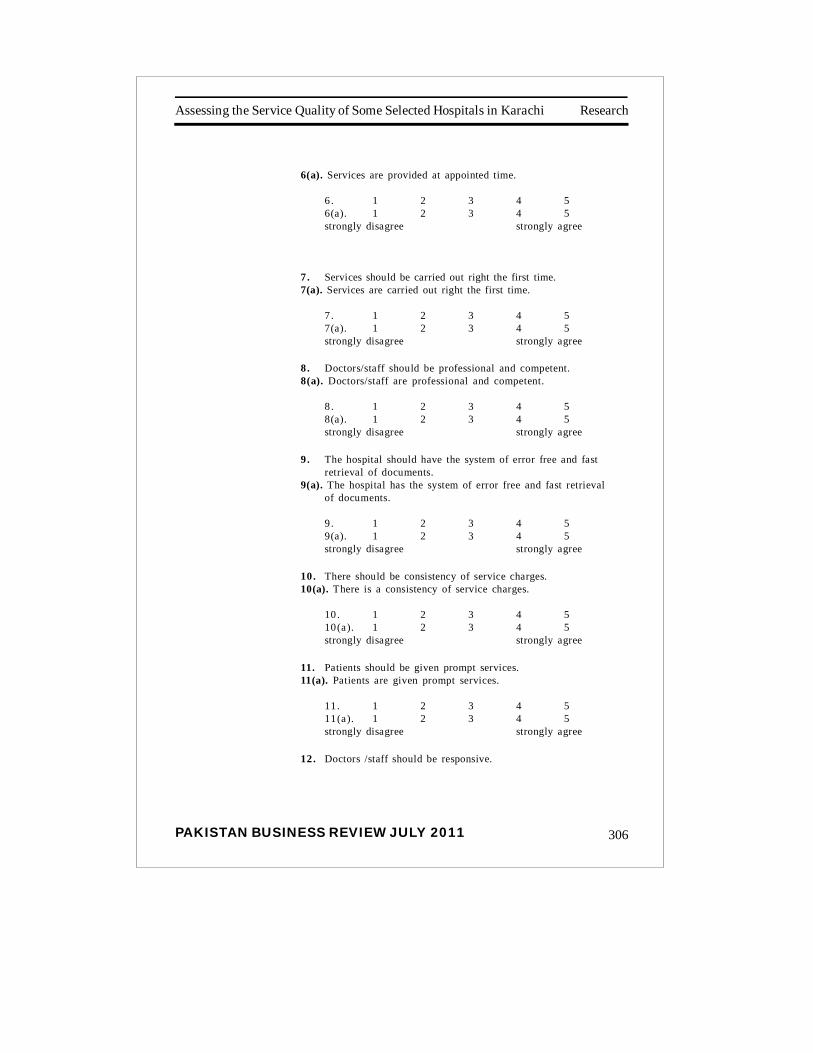
Research
PAKISTAN BUSINESS REVIEW JULY 2011
Assessing the Service Quality of Some Selected Hospitals in Karachi
306
6(a). Services are provided at appointed time.
6 . 1 2 3 4 56(a). 1 2 3 4 5strongly disagree strongly agree
7. Services should be carried out right the first time.7(a). Services are carried out right the first time.
7 . 1 2 3 4 57(a). 1 2 3 4 5strongly disagree strongly agree
8. Doctors/staff should be professional and competent.8(a). Doctors/staff are professional and competent.
8 . 1 2 3 4 58(a). 1 2 3 4 5strongly disagree strongly agree
9. The hospital should have the system of error free and fastretrieval of documents.
9(a). The hospital has the system of error free and fast retrievalof documents.
9 . 1 2 3 4 59(a). 1 2 3 4 5strongly disagree strongly agree
10. There should be consistency of service charges.10(a). There is a consistency of service charges.
10 . 1 2 3 4 510(a). 1 2 3 4 5strongly disagree strongly agree
11. Patients should be given prompt services.11(a). Patients are given prompt services.
11 . 1 2 3 4 511(a). 1 2 3 4 5strongly disagree strongly agree
12. Doctors /staff should be responsive.
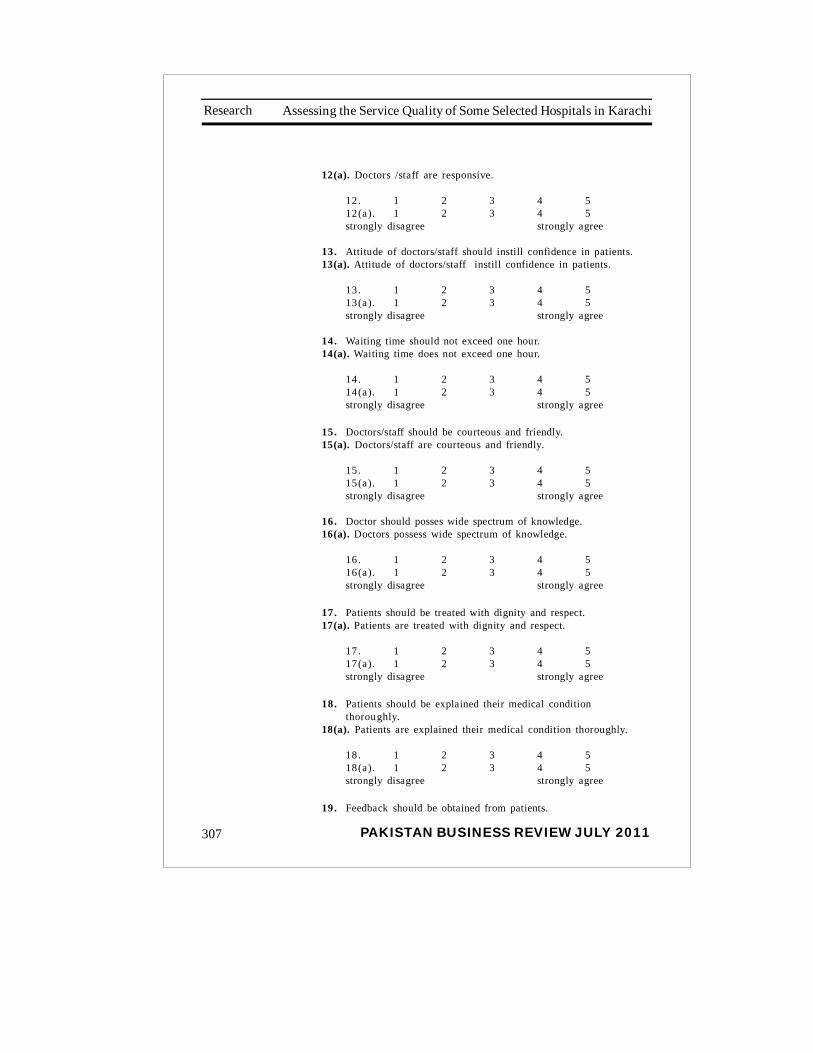
PAKISTAN BUSINESS REVIEW JULY 2011307
Assessing the Service Quality of Some Selected Hospitals in KarachiResearch
12(a). Doctors /staff are responsive.
12 . 1 2 3 4 512(a). 1 2 3 4 5strongly disagree strongly agree
13. Attitude of doctors/staff should instill confidence in patients.13(a). Attitude of doctors/staff instill confidence in patients.
13 . 1 2 3 4 513(a). 1 2 3 4 5strongly disagree strongly agree
14. Waiting time should not exceed one hour.14(a). Waiting time does not exceed one hour.
14 . 1 2 3 4 514(a). 1 2 3 4 5strongly disagree strongly agree
15. Doctors/staff should be courteous and friendly.15(a). Doctors/staff are courteous and friendly.
15 . 1 2 3 4 515(a). 1 2 3 4 5strongly disagree strongly agree
16. Doctor should posses wide spectrum of knowledge.16(a). Doctors possess wide spectrum of knowledge.
16. 1 2 3 4 516(a). 1 2 3 4 5strongly disagree strongly agree
17. Patients should be treated with dignity and respect.17(a). Patients are treated with dignity and respect.
17 . 1 2 3 4 517(a). 1 2 3 4 5strongly disagree strongly agree
18. Patients should be explained their medical conditionthoroughly.
18(a). Patients are explained their medical condition thoroughly.
18 . 1 2 3 4 518(a). 1 2 3 4 5strongly disagree strongly agree
19. Feedback should be obtained from patients.
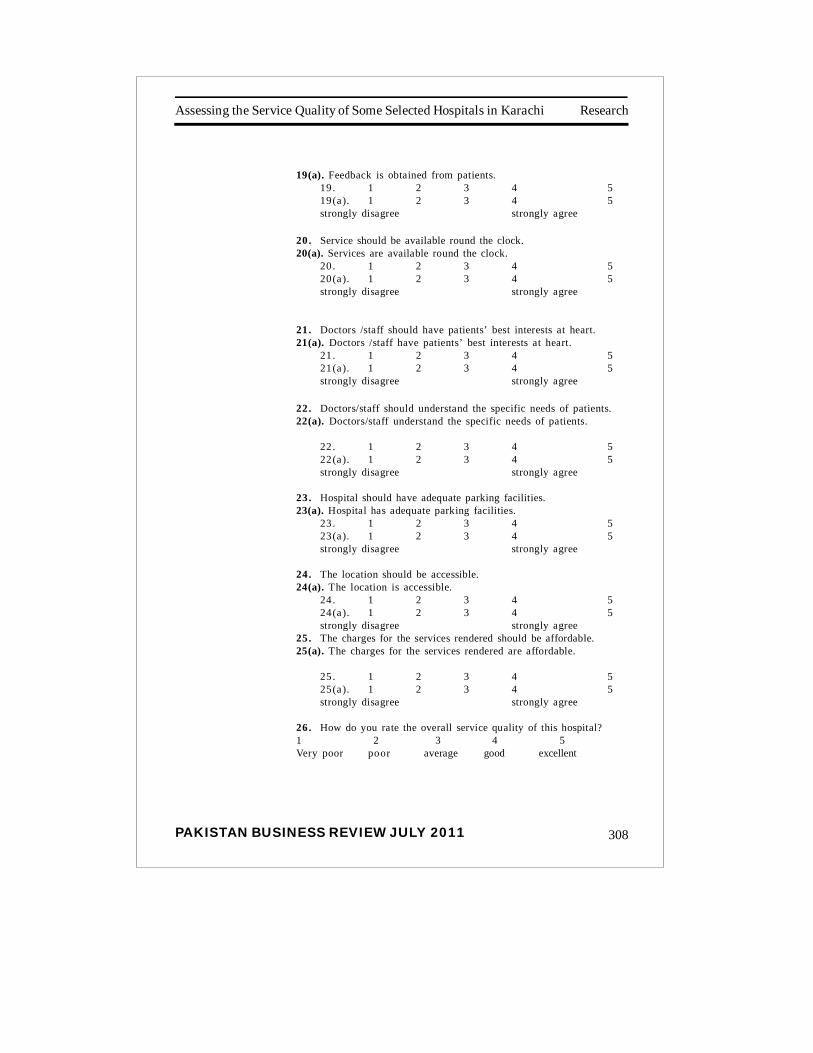
Research
PAKISTAN BUSINESS REVIEW JULY 2011
Assessing the Service Quality of Some Selected Hospitals in Karachi
308
19(a). Feedback is obtained from patients.19 . 1 2 3 4 519(a). 1 2 3 4 5strongly disagree strongly agree
20. Service should be available round the clock.20(a). Services are available round the clock.
20. 1 2 3 4 520(a). 1 2 3 4 5strongly disagree strongly agree
21. Doctors /staff should have patients’ best interests at heart.21(a). Doctors /staff have patients’ best interests at heart.
21 . 1 2 3 4 521(a). 1 2 3 4 5strongly disagree strongly agree
22. Doctors/staff should understand the specific needs of patients.22(a). Doctors/staff understand the specific needs of patients.
22 . 1 2 3 4 522(a). 1 2 3 4 5strongly disagree strongly agree
23. Hospital should have adequate parking facilities.23(a). Hospital has adequate parking facilities.
23 . 1 2 3 4 523(a). 1 2 3 4 5strongly disagree strongly agree
24. The location should be accessible.24(a). The location is accessible.
24 . 1 2 3 4 524(a). 1 2 3 4 5strongly disagree strongly agree
25. The charges for the services rendered should be affordable.25(a). The charges for the services rendered are affordable.
25 . 1 2 3 4 525(a). 1 2 3 4 5strongly disagree strongly agree
26. How do you rate the overall service quality of this hospital?1 2 3 4 5Very poor poor average good excellent
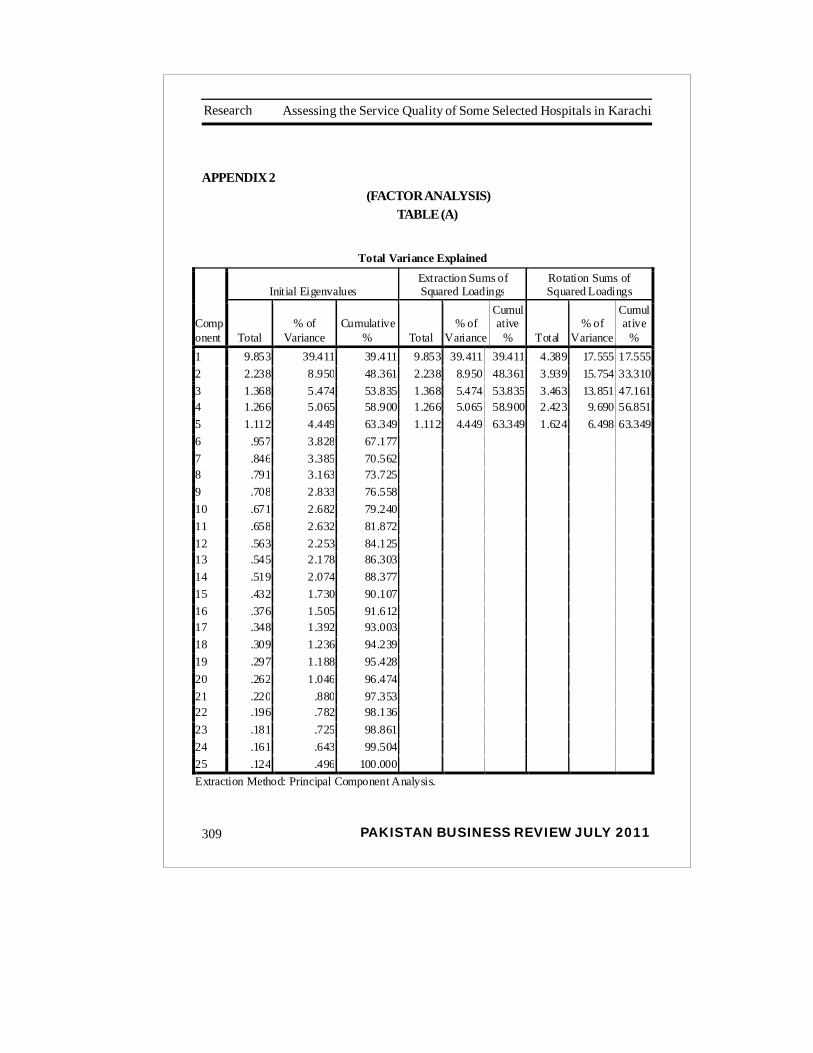
PAKISTAN BUSINESS REVIEW JULY 2011309
Assessing the Service Quality of Some Selected Hospitals in KarachiResearch
APPENDIX 2 (FACTOR ANALYSIS)
TABLE (A)
Total Variance Explained
Component
Initial Eigenvalues Extraction Sums of Squared Loadings
Rotation Sums of Squared Loadings
Total % of
Variance Cumulative
% Total % of
Variance
Cumulative
% Total % of
Variance
Cumulative
% 1 9.853 39.411 39.411 9.853 39.411 39.411 4.389 17.555 17.5552 2.238 8.950 48.361 2.238 8.950 48.361 3.939 15.754 33.3103 1.368 5.474 53.835 1.368 5.474 53.835 3.463 13.851 47.1614 1.266 5.065 58.900 1.266 5.065 58.900 2.423 9.690 56.8515 1.112 4.449 63.349 1.112 4.449 63.349 1.624 6.498 63.3496 .957 3.828 67.177 7 .846 3.385 70.562 8 .791 3.163 73.725 9 .708 2.833 76.558 10 .671 2.682 79.240 11 .658 2.632 81.872 12 .563 2.253 84.125 13 .545 2.178 86.303 14 .519 2.074 88.377 15 .432 1.730 90.107 16 .376 1.505 91.612 17 .348 1.392 93.003 18 .309 1.236 94.239 19 .297 1.188 95.428 20 .262 1.046 96.474 21 .220 .880 97.353 22 .196 .782 98.136 23 .181 .725 98.861 24 .161 .643 99.504 25 .124 .496 100.000 Extraction Method: Principal Component Analysis.
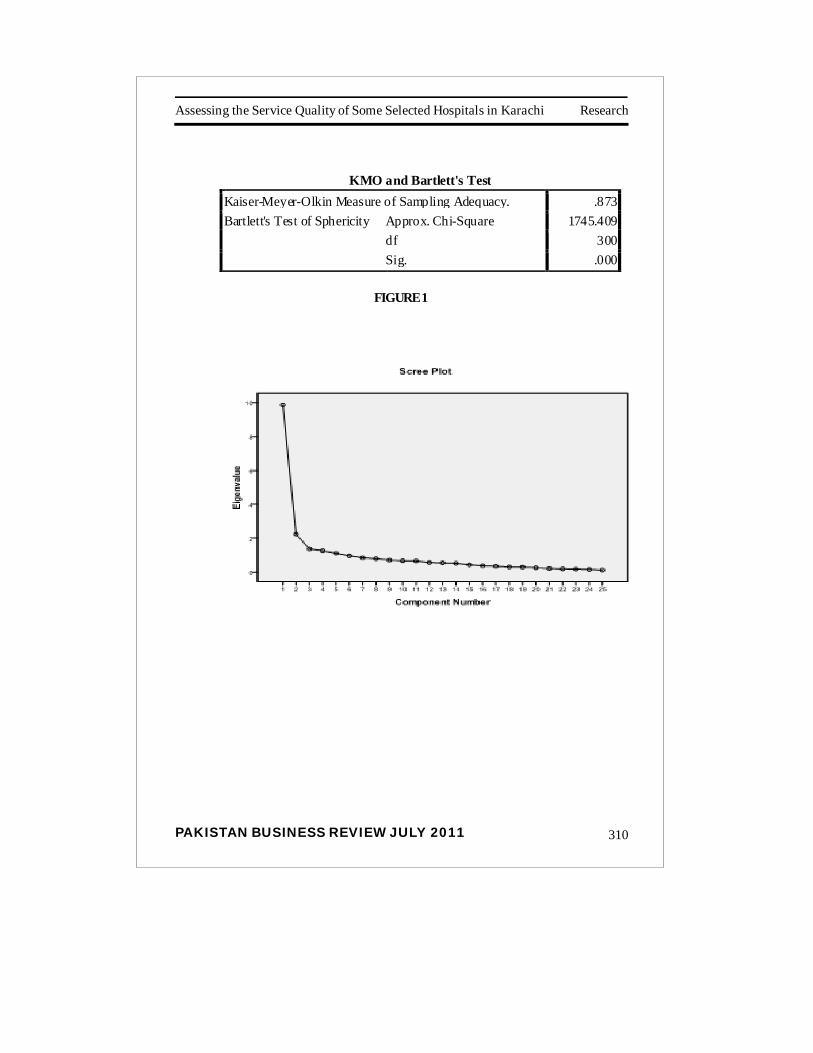
Research
PAKISTAN BUSINESS REVIEW JULY 2011
Assessing the Service Quality of Some Selected Hospitals in Karachi
310
KMO and Bartlett's Test Kaiser-Meyer-Olkin Measure of Sampling Adequacy. .873Bartlett's Test of Sphericity Approx. Chi-Square 1745.409
df 300Sig. .000
FIGURE 1
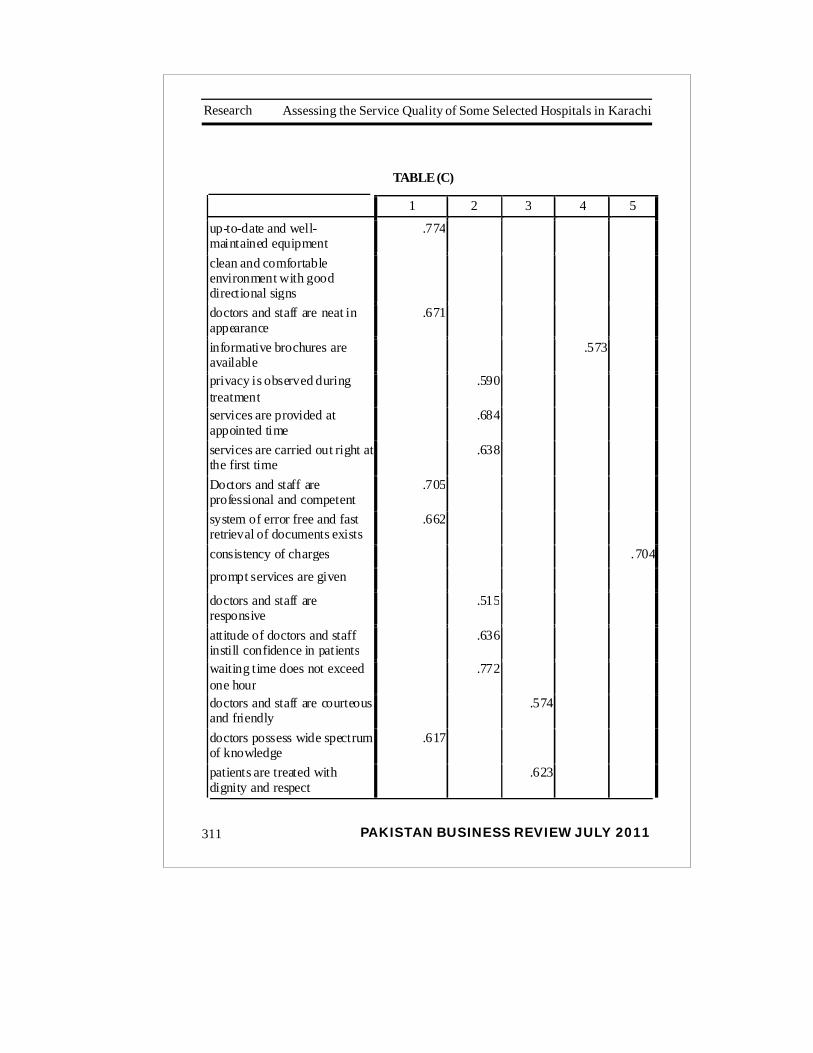
PAKISTAN BUSINESS REVIEW JULY 2011311
Assessing the Service Quality of Some Selected Hospitals in KarachiResearch
TABLE (C)
1 2 3 4 5
up-to-date and well-maintained equipment
.774
clean and comfortable environment with good directional signs
doctors and staff are neat in appearance
.671
informative brochures are available .573
privacy is observed during treatment
.590
services are provided at appointed time
.684
services are carried out right at the first time
.638
Doctors and staff are professional and competent
.705
system of error free and fast retrieval of documents exists
.662
consistency of charges .704
prompt services are given
doctors and staff are responsive
.515
attitude of doctors and staff instill confidence in patients
.636
waiting time does not exceed one hour
.772
doctors and staff are courteous and friendly
.574
doctors possess wide spectrum of knowledge
.617
patients are treated with dignity and respect
.623
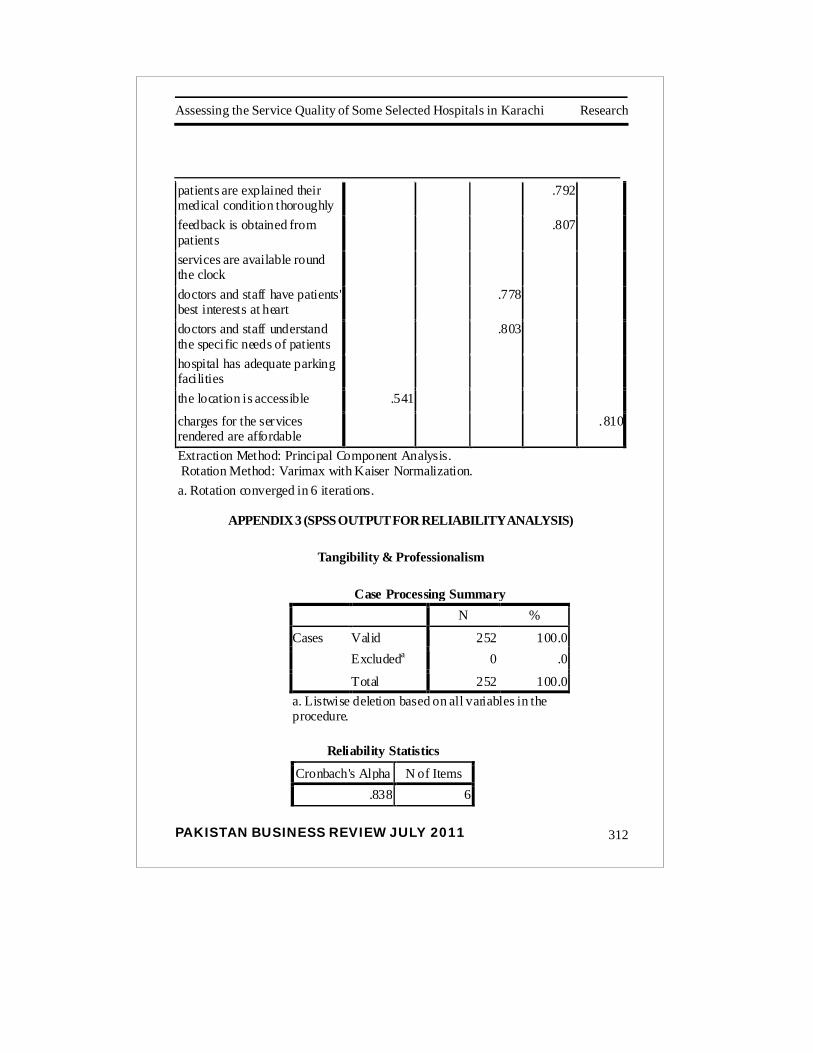
Research
PAKISTAN BUSINESS REVIEW JULY 2011
Assessing the Service Quality of Some Selected Hospitals in Karachi
312
patients are explained their medical condition thoroughly
.792
feedback is obtained from patients
.807
services are available round the clock
doctors and staff have patients' best interests at heart
.778
doctors and staff understand the specific needs of patients
.803
hospital has adequate parking facilities
the location is accessible .541
charges for the services rendered are affordable
.810
Extraction Method: Principal Component Analysis. Rotation Method: Varimax with Kaiser Normalization. a. Rotation converged in 6 iterations.
APPENDIX 3 (SPSS OUTPUT FOR RELIABILITY ANALYSIS)
Tangibility & Professionalism
Case Processing Summary N %
Cases Valid 252 100.0 Excludeda 0 .0
Total 252 100.0 a. Listwise deletion based on all variables in the procedure.
Reliability Statistics
Cronbach's Alpha N of Items .838 6
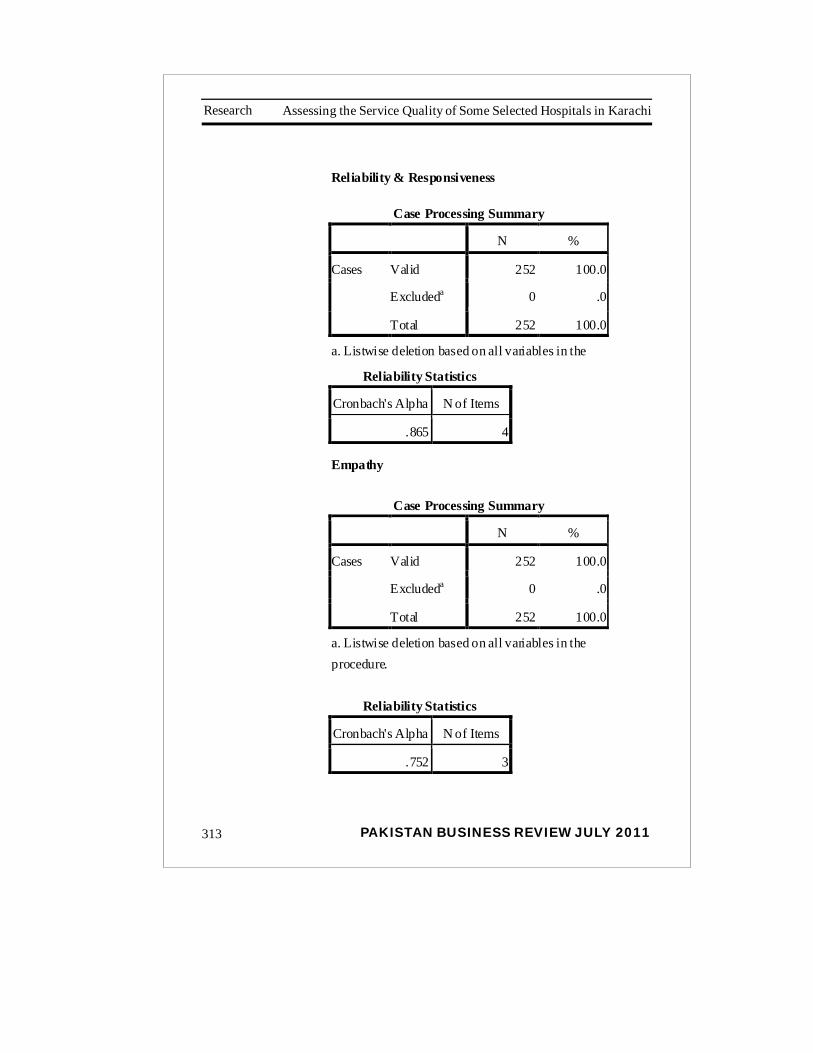
PAKISTAN BUSINESS REVIEW JULY 2011313
Assessing the Service Quality of Some Selected Hospitals in KarachiResearch
Reliability & Responsiveness
Case Processing Summary N %
Cases Valid 252 100.0
Excludeda 0 .0
Total 252 100.0
a. Listwise deletion based on all variables in the procedure. Reliability Statistics
Cronbach's Alpha N of Items
.865 4
Empathy
Case Processing Summary N %
Cases Valid 252 100.0
Excludeda 0 .0
Total 252 100.0
a. Listwise deletion based on all variables in the procedure.
Reliability Statistics
Cronbach's Alpha N of Items
.752 3

Research
PAKISTAN BUSINESS REVIEW JULY 2011
Assessing the Service Quality of Some Selected Hospitals in Karachi
314
Affordability
Case Processing Summary
N %
Cases Valid 252 100.0
Excludeda 0 .0
Total 252 100.0
a. Listwise deletion based on all variables in the
procedure.
Reliability Statistics
Cronbach's Alpha N of Items
.851 6
Feedback & Guidance
Case Processing Summary N %
Cases Valid 252 100.0
Excludeda 0 .0
Total 252 100.0
a. Listwise deletion based on all variables in the procedure.
Reliability Statistics
Cronbach's Alpha N of Items
.557 2
Research
PAKISTAN BUSINESS REVIEW JULY 2011315
Gender Difference: Work and Family Conflicts and Family-Work Conflicts
GENDER DIFFERENCE: WORKAND FAMILY CONFLICTS AND
FAMILY-WORK CONFLICTSSadia Aziz Ansari
Department of Business PsychologyCollege of Business Management, Karachi
Abstract
The present study was conducted to explore the prevailingdifferences between work-to-family interference, and family-to-work interference among men and women employees. Thepopulation was a random sample of 210 men and women employedin Karachi aged 25–50 years. Work-family conflict, and family-work conflict was measured by (Niemeyer, Boles, & Mcmurrian -1996) 10-item scale, which was scored on a 7-point Likert scaleranging from 1 (strongly disagree) to 7 (strongly agree). Datacollection also included questions about their current functioningwith regard to family support, control over work responsibilitiesand work hours flexibility along with demographic questionsabout, age, gender, education, marital status, number ofdependents and nature of employment. Data was analyzedthrough descriptive statistics to assess prevalence of work-to-family interference and family-to-work interference. Overallresults indicate no significant gender difference with regard towork-family interference and family-to-work interference. This istheoretically an unexpected result, however, it might be due tothe sample size which was too small to identify such differences.Further study is necessary to accurately identify the predictorsof work-family interference and family-to-work interference incollectivistic societies.
Key-words: Work-family conflict, family-work conflict, genderJEL Classification: A13, J16, Z13, R20, M15
*An earlier version of this refereed paper was presented a t the firstBusiness Psychology Seminar held by the Department of BusinessPsychology IoBM in November, 2010

PAKISTAN BUSINESS REVIEW JULY 2011
Research
316
Gender Difference: Work and Family Conflicts and Family-Work Conflicts
Eclectic Literature Review:
In the recent past most of the research in the domain ofwork and family has been originated within diverse disciplineslike sociology, psychology, occupational health, businessmanagement, and gender and family studies. Work and familysymbolize two of the most critical roles of an adult life. It’s obviousthat work can interfere with family and family can interfere withwork, factors like globalization, equal employment opportunities,working hours, and changes in the demographic makeup ofemployees have posed significant challenges for bothorganizations and employees. In particular, with the increase indual-career households, employees are ever more performing bothwork and family roles all together and dealing with job-relateddemands that place limits on the performance of family role andvice versa. Hence; researchers are primarily interested in identifyingcauses of work-family interference.
The work-family interface is defined as a unifiedrelationship between work and family. Kahn, Wolfe, Quinn, Snoek,and Rosenthal, (1964); first examined this inter-role conflict thatpeople experienced between their work roles and other life roles.Later Greenhaus and Beutell (1985) defined work-family conflict(WFC)as, “a form of inter-role conflict in which role pressuresfrom the work and family domain are mutually incompatible insome respect” competing work activity or when family stress(FWC) has a negative effect on performance in the work role”.There are three aspects of the work-family interface that are relatedto conflict: (1) bidirectional nature (Carlson & Kacmar, 2000), (2)time, and (3) psychological carryover (Greenhaus & Beutell, 1985;Piotrkowski, 1979; Voydanoff, 1988). Work -family conflict isexplained as reciprocal interference of work and family rolesleading to significant personnel and organizational problems.Studies focusing on role stress have suggested that employeesare frequently confronted with role stress, heavy workloads, long
Research
PAKISTAN BUSINESS REVIEW JULY 2011317
Gender Difference: Work and Family Conflicts and Family-Work Conflicts
work hours, irregular work schedules, job insecurity and are atrisk of conflict in the work-family interface (Karatepe & Baddar,2006; Karatepe & Sokmen, 2006; Namasivayam & Mount, 2004).
A group of authors including: Carlson and Kacmar(2000); Eagle, Icenogle, and Maes (1998); Eagle, Miles, andIcenogle (1997); Frone, Yardley, and Markel (1997); Greenhausand Powell, (2003); Gutek, Searle, Klepa, (1991); Matsui, Ohsawa,and Onglotco (1995); Netemeyer, Boles, and McMurrian (1996);Williams and Alliger, (1994) agreed that conflict in the work-familyinterface has a bidirectional nature. Such as Frone, Russell andCooper, (1992) have shown that work-family conflict and family-work conflict as the two forms of inter-role conflict. Where work-family conflict refers to “a form of inter-role conflict in which thegeneral demands of time devoted to, and strain created by thejob interfere with performing family related responsibilities”; andfamily-work conflict refers to “a form of inter-role conflict in whichthe general demands of time devoted to, and strain created bythe family interfere with performing work-related responsibilities(Netemeyer, Boles, & McMurrian, 1996).
Similarly, Greenhaus and Powell (2003) showed thatwork-family conflict occurs when participation in work activityinterferes with participation in a competing family activity orwhen work stress has a negative effect on behavior within thefamily domain. For example, conflict may occur when an employeeis accepting a promotion that requires more hours which in turndecreases the number of hours at home with the family. On theother hand, family-work conflict is experienced when participationin a family activity interferes with participation in a competingwork activity or when family stress has a negative effect onperformance in the work role.
Industrial and organizational psychologists and otherresearchers have attempted to better understand work-family
PAKISTAN BUSINESS REVIEW JULY 2011
Research
318
Gender Difference: Work and Family Conflicts and Family-Work Conflicts
conflict construct by examining the bidirectionality of work familyconflict, different types of conflict, several reactance models ofwork-family conflict, and different causal models explaining howconflict affects individuals. However, gender differences in workand family conflict have been a consistently important theme inwork-family research (Lewis & Cooper, 1999). Pleck (1977)considered gender as an important factor in work-family conflictin his theory of the work-family role system. He has conceptualizedwork-family interface that includes gender as an important factor.Further he explained that the work-family role system is composedof the male work role, the female work role, the female family role,and the male family role. Each of these roles may be fully actualized,or may be only partly actualized or latent, as is often the case withthe female work role and the male family role.
According to Lambert (1990) gender differences must bestudied in depth. Extensive review of the literature has suggestedtwo hypotheses concerning gender differences in domain sourceconflict: domain flexibility and domain salience. The domainflexibility hypothesis predicts that the work domain is a greatersource of conflict than the family domain for both women andmen. The domain salience hypothesis predicts that the familydomain is a greater source of conflict for women than the workdomain and the work domain is a greater source of conflict formen than the family domain. Izraeli, (1993); Evans & Bartolome(1984) assumed that the work domain is less flexible, thus workaffects family life more than vice versa and there is no genderdifferences. Contrary to this, Cooke and Rousseau (1984)proposed that conflict is greater from the domain that is moresalient to the person’s identity. Therefore, women experience moreconflict from the family domain and men from the work domain.Hall (1972) noted that women may experience more role conflictas a result of simultaneity of their multiple roles. Beside gender,some family domain pressures like the effect of presence of youngchildren (Lewis & Cooper, 1988); (Kopelman & Greenhaus,1981),
Research
PAKISTAN BUSINESS REVIEW JULY 2011319
Gender Difference: Work and Family Conflicts and Family-Work Conflicts
spouse time in paid work (Coverman & Sheley, 1986); (Voydanoff,1988) and work domain pressures like number of hours workedper week (Voydanoff, 1988); (Burke,Weirs & Duwors,1980) areassociated with work family conflict.
Moreover, studies have shown that employed womengenerally face more demands (from paid work, child care, andhousework) than employed men (Robinson & Godbey, 1997).The degree of this difference for women is made up by housework:when men and women differ on number of hours dedicated tohousework, flexibility of the activity, and the challenging and orcreativity of the task. Hochschild (1989) also reported thatemployed mothers work an extra month per year of 24 hour dayswhen compared with employed fathers with their number of hoursdedicated to housework. Similarly, research has shown that mendo not adjust the time that they spend on home and familyactivities according to their wives’ employment decisions(Shelton & John, 1996). Consequently, even if women increasethe number of hours they work, men are not likely to spend morehours on housework. It’s not just time that leaves women withthe feeling of imbalance. Housework is gendered that is, thereare tasks that women are expected to perform and others that aregenerally men’s expected responsibility. Women cook, clean, andcare for children, while men usually take care of home repairsand lawn maintenance, (Robinson & Godbey, 1997). In this regard“male” activities are more flexible while “female” responsibilitiesare often necessary to do every day. Therefore men do theirtasks as leisure-like and discretionary activities (Larson, Richards,& Perry- Jenkins, 1994); (Shaw, 1988). Greenhaus and Beutell,(1985), and many scholars have hypothesized that womenexperience more work-family conflict than men because of theirtypically greater home responsibilities and their allocation ofmore importance to family roles. However, more recent researchershave discovered that men and women do not differ on their level
PAKISTAN BUSINESS REVIEW JULY 2011
Research
320
Gender Difference: Work and Family Conflicts and Family-Work Conflicts
of work-family conflict (Blanchard-Fields, Chen, & Hebert, 1997;Duxbury & Higgins, 1991; Rice & Frone , 1992; Wallace, 1997)
On the basis of the above discussion the present studyaims to explore gender and domain differences in work familyconflict among women and men employees employed in Karachi.Specifically, this study attempts to scrutinize which of the twodomains that is work-family conflict or family-work conflict, causesmore conflict for men and women and examine gender differenceson the basis of Niemeyer, scales measures of work-family conflictin Pakistani population.
Hypothesis:
1. Null Hypothesis: There is no relationship betweengender and the degree of work-family and family workconflict.Alternative hypothesis: There is a relationship(difference) between gender and the degree of work-family conflict & family-work conflict.
2. Null Hypothesis: There is no relationship betweengender and the nature of work-family and family workconflict.Alternative hypothesis: There is a relationship betweengender and nature of family-work conflict and work-familyconflict.
Methodology:
The present study was conducted to observe genderdifferences pertaining to work–family interference amongemployees both men and women from diverse professions whichinclude: teachers, mangers, doctors, bankers and others. To assesswork-family conflict (WFC) and family-work conflict, (FWC)Niemeyer, Boles, & Mcmurrian’s (1996), scale was used. It includestwo subscales: WFC and FWC and each subscale consists offive items with 7-point likert rating scale ranging from strongly
Research
PAKISTAN BUSINESS REVIEW JULY 2011321
Gender Difference: Work and Family Conflicts and Family-Work Conflicts
disagree to strongly agree where 1= strongly disagree, 2=disagree, 3= slightly disagree, 4= neutral, 5= slightly agree, 6=agree and 7= strongly agree. Niemeyer, Boles, & Mcmurrian(1996), described high internal consistency of five items subscalesfor both WFC and FWC that is Cronbach alpha range from .82 to.90. The scale measures the respondent’s degree of agreementwith statements. The scale scores range from 5 to 35, a highscore indicates a high level of perceived conflict between WFCand FWC, while a low score reflects a low level of perceivedconflict between WFC and FWC. Along with the work-familyconflict scale, demographic questions about age, gender,education, marital status, number of dependents and nature ofemployment were asked. The demographic section also includedeight moderating variables including: respondent’s perceivedfamily, friends and partner’s support for WFC & FWC, perceivedcontrol over work responsibilities, perceived flexibility in workhours, and perceived boss’s support for both WFC and FWCmeasured through self-structured questions.
Those eight questions are as follows:
1) on a scale from 1 (no control) to 7 (complete control),how much control do you have over your workresponsibilities?
2) on a scale from 1 (no flexibility) to 7 (complete flexibility),how would you describe your work hours?
3) on a scale from 1 (no support) to 7 (complete support),how would you describe the level of support you feelyou have from your partner for conflict that arises as aresult of work interfering with family responsibility?
4) on a scale from 1 (no support) to 7 (complete support),how would you describe the level of support you feelyou have your partner for conflict that arises as a resultof family responsibilities interfering with work?
PAKISTAN BUSINESS REVIEW JULY 2011
Research
322
Gender Difference: Work and Family Conflicts and Family-Work Conflicts
5) on a scale from 1 (no support) to 7 (complete support),how would you describe the level of support you feelyou have from your family members and friends forconflict that arises as a result of family responsibilitiesinterfering with work?
6) on a scale from 1 (no support) to 7 (complete support),how would you describe the level of support you feelyou have from your family members and friends forconflict that arises as a result of family responsibilitiesinterfering with work?
7) on a scale from 1 (no support) to 7 (complete support),how would you describe the level of support you feelyou have from your boss/supervisor for conflict thatarises as a result of work interfering with familyresponsibilities?
8) on a scale from 1 (no support) to 7 (complete support),how would you describe the level of support you feelyou have from your boss/supervisor for conflict thatarises as a result of family responsibilities interferingwith work?
The targeted population was both men and women,
regular full time employees, working in Karachi. The samplewas a random selection consisting of 105 men and 105women (N=210), age ranged 25–50 years. The study wasconducted through one to one contact . Part icipantscompleted the work-family conflict, family-work conflict anddemographic questionnaire. All the data was collected bygoing into the field during September, 2010.
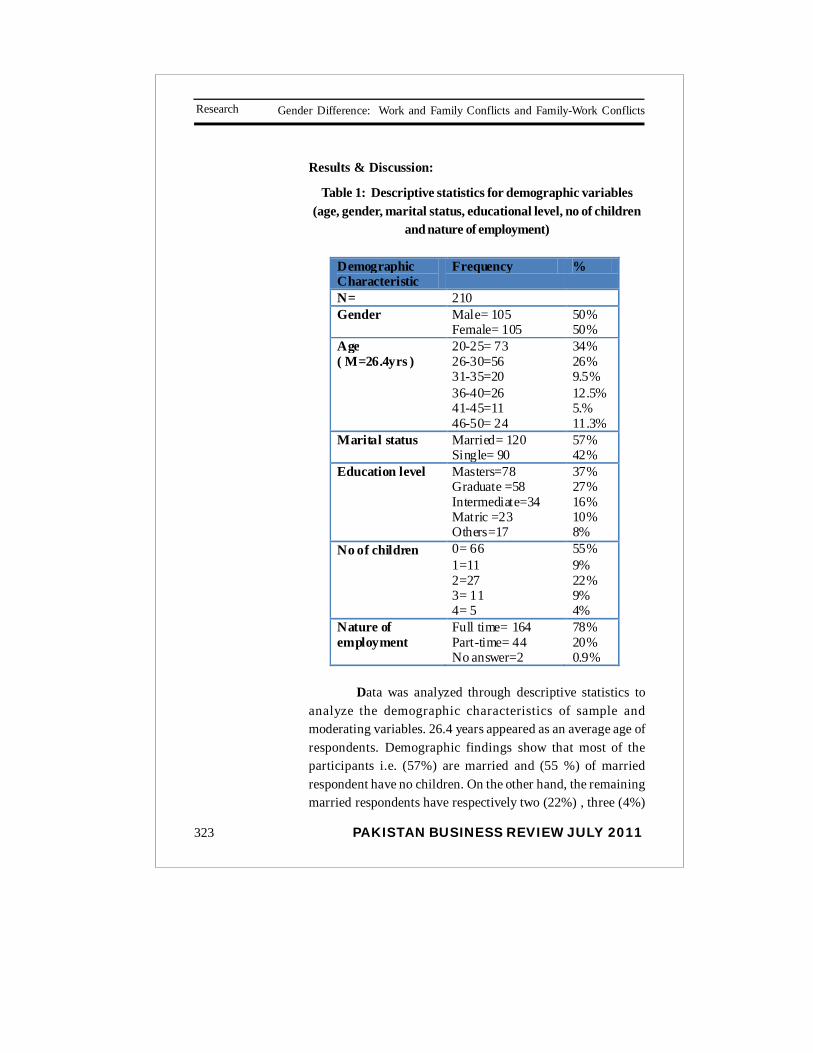
Research
PAKISTAN BUSINESS REVIEW JULY 2011323
Gender Difference: Work and Family Conflicts and Family-Work Conflicts
Results & Discussion:
Table 1: Descriptive statistics for demographic variables(age, gender, marital status, educational level, no of children
and nature of employment)
Demographic Characteristic
Frequency %
N= 210 Gender Male= 105
Female= 105 50% 50%
Age ( M=26.4yrs )
20-25= 73 26-30=56 31-35=20 36-40=26 41-45=11 46-50= 24
34% 26% 9.5% 12.5% 5.% 11.3%
Marital status Married= 120 Single= 90
57% 42%
Education level Masters=78 Graduate =58 Intermediate=34 Matric =23 Others=17
37% 27% 16% 10% 8%
No of children 0= 66 1=11 2=27 3= 11 4= 5
55% 9% 22% 9% 4%
Nature of employment
Full time= 164 Part-time= 44 No answer=2
78% 20% 0.9%
Data was analyzed through descriptive statistics to
analyze the demographic characteristics of sample andmoderating variables. 26.4 years appeared as an average age ofrespondents. Demographic findings show that most of theparticipants i.e. (57%) are married and (55 %) of marriedrespondent have no children. On the other hand, the remainingmarried respondents have respectively two (22%) , three (4%)

PAKISTAN BUSINESS REVIEW JULY 2011
Research
324
Gender Difference: Work and Family Conflicts and Family-Work Conflicts
and one (9%) as number of children, this reflects that just 4% ofthe total married population possessed somewhat large familysize with four children. The rest of total respondents i.e. (47%)are single. Among all respondents (37%) have completed theirmasters, (27%) graduate, (16%) intermediate and (10%) matric astheir last educational qualification (see table 1.1).
Table 2: Descriptive statistics for Eight moderating factorsfor FWC & WFC
Variables Male m
Female m
Control over work responsibilities 5.5 3 5.27 Working hours Flexibility 4.59 4.4 Perceived partner’s Support for WFC 5.05 5.27 Perceived partner’s Support for FWC 4.8 5.2 Perceived Friends & Family’s Support for WFC
5.0 5.2
Perceived Friends & Family’s Support for FWC
4.8 5.1
Perceived Boss Support for WFC 4.4 4.5 Perceived Boss Support for FWC 4.2 4.5
Table1.2 presents the mean values for all moderatingvariables which work as buffer to WFC & FWC including workhour flexibility, control over work responsibilities, family, partner,friends and boss’s support for the work-family and family-workconflicts. Social support and relations with co-workers andmanagers is an important part of an individual’s social environmentand lack of it can be a contributing factor to their stress. Ourfindings clearly support this argument as most of the respondentsexperienced moderate level of WFC (mean=21) & FWC(mean=17.8). Where 19 is the 50th percentile for FWC score and 22is the 50th percentile for WFC score distributions. This indicatesthat about half of the total respondent’s scores on WFC & FWCscale are either less or equal to 19 and 22 (see Table1.3).Furthermore, standard deviation for FWC (std. deviation = 6.3)and (std. deviation = 5.7) for WFC which indicates that majorityof respondent’s scores don’t fall into the mean scores for bothFWC and WFC scores. Moreover, this is also supported whenboth male and female respondents of the study received complete

Research
PAKISTAN BUSINESS REVIEW JULY 2011325
Gender Difference: Work and Family Conflicts and Family-Work Conflicts
support from their husbands, family members and friends i.e.(5.2%). All respondent irrespective of the gender reported thatthey receive higher level of support and encouragement fromtheir families, friends and partners when work and family domainsbecome troublesome. On the contrary, most of the participantsreceived moderate level of their boss’s support i.e. (4.5%) tomanage with WFC & FWC. The amount of support received bymen and women from their bosses is found relatively the samei.e. (4.2%).
In general there is a relation between responsibility andcontrol when it comes to work. If individual’s have lots ofresponsibilities at their jobs and little or no control over it tohave it interfere more with work as well as family obligationsthan control at work responsibilities. Respondents of this studyreported that they have enough control i.e. (5.5%) over theirwork responsibilities and can also work with flexible workinghours. Furthermore, for women flexibility at work i.e. (4.4%)reduces the amount of family work conflicts when they are ableto determine the hours they work in which moderates the WF &FW interference.
Table 3: Descriptive Statistics for Work-Family Conflict &Family-Work Conflict
Percentiles FWC WFC 25 13 17 50 19 22 75 23 25 All respondent’s Mean score
17.83 21
Std. Deviation 6.36 5.75 Std. Error 0.43 0.39 Variance 40.45 33 Male 17.5 20.5 Female 18.1 21.4
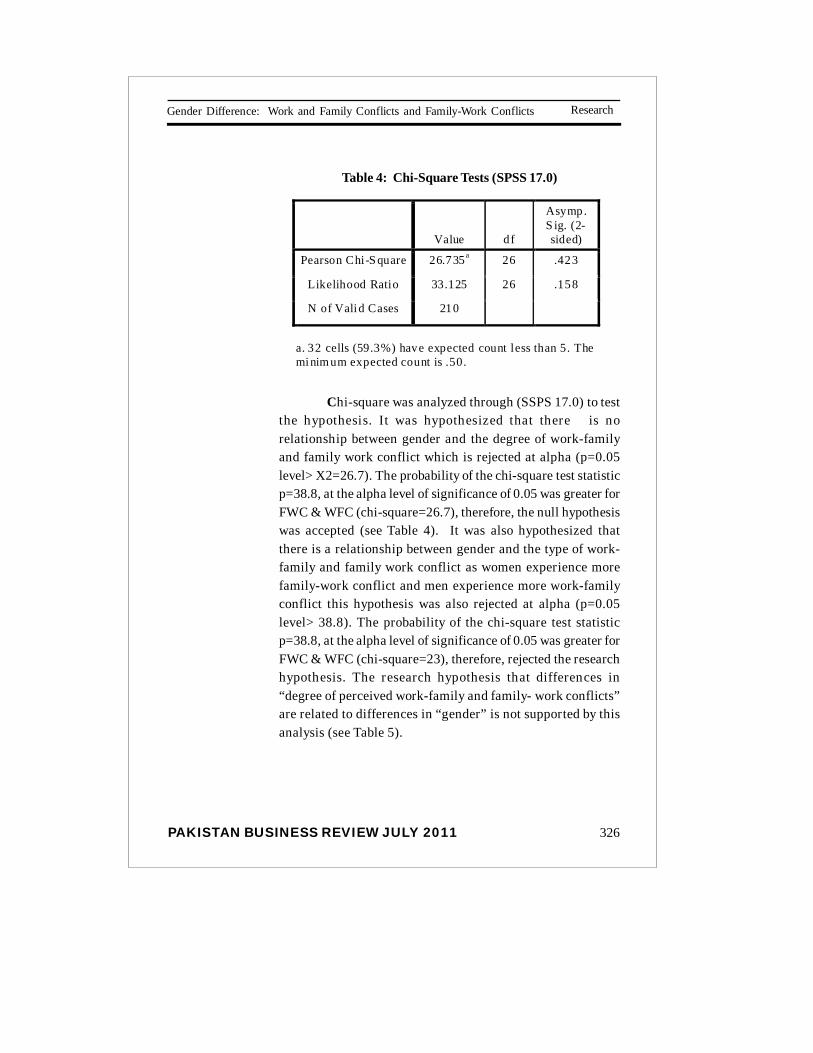
PAKISTAN BUSINESS REVIEW JULY 2011
Research
326
Gender Difference: Work and Family Conflicts and Family-Work Conflicts
Value df
Asymp. S ig. (2-sided)
Pearson Chi-S quare 26.735 a 26 .423
Likelihood Ratio 33.125 26 .158
N of Valid Cases 210
a. 32 cells (59.3%) have expected count less than 5. The minimum expected count is .50.
Table 4: Chi-Square Tests (SPSS 17.0)
Chi-square was analyzed through (SSPS 17.0) to testthe hypothesis. It was hypothesized that there is norelationship between gender and the degree of work-familyand family work conflict which is rejected at alpha (p=0.05level> X2=26.7). The probability of the chi-square test statisticp=38.8, at the alpha level of significance of 0.05 was greater forFWC & WFC (chi-square=26.7), therefore, the null hypothesiswas accepted (see Table 4). It was also hypothesized thatthere is a relationship between gender and the type of work-family and family work conflict as women experience morefamily-work conflict and men experience more work-familyconflict this hypothesis was also rejected at alpha (p=0.05level> 38.8). The probability of the chi-square test statisticp=38.8, at the alpha level of significance of 0.05 was greater forFWC & WFC (chi-square=23), therefore, rejected the researchhypothesis. The research hypothesis that differences in“degree of perceived work-family and family- work conflicts”are related to differences in “gender” is not supported by thisanalysis (see Table 5).

Research
PAKISTAN BUSINESS REVIEW JULY 2011327
Gender Difference: Work and Family Conflicts and Family-Work Conflicts
Chi-Square Tests
Value df Asymp. Sig.
(2-sided) Pearson Chi-Square 23.048a 24 .517
Likelihood Ratio 26.120 24 .347 N of Valid Cases 210
a. 29 cells (58.0%) have expected count less than 5. The minimum expected count is .50.
Table: 5 Chi-Square Tests (SPSS 17.0)
These findings are more in the line with previousstudies that there were no differences between the gender inexperience of work-family conflicts. Even which presentfindings don’t support that family is the greater source ofconflict for women and work for men. Furthermore, source offamily-work conflicts are associated with moderating variableslike the number of small children, number of children and timespent at work. Since majority of respondents are married withno children might be the indicative of rejection. When it iseven contrary to our societal gender role expectations andresponsibilities; women carry out most of the familyresponsibilities from child care to the household. In this waythese findings can support little when most of the respondentsare young with small family size hence the family doesn’tgenerate enough pressures when it clashes with their workresponsibilities.
This is also an indicative of evolving family- friendlyorganizations in Pakistani society. Social support i.e. family,friends, partner and boss’s support is generally considered amoderator between stress and conflicts; individuals whoreceive high support experience low strain than others. Thisis also comparable to the respondents in the present study.
PAKISTAN BUSINESS REVIEW JULY 2011
Research
328
Gender Difference: Work and Family Conflicts and Family-Work Conflicts
When both male and female respondents equally perceivedthat they have enough control over their current workresponsibilities and working hour flexibility and appeared asdominating moderating factors for WFC and FWC in the presentstudy. It also indicates that working environment in industrieslike academia, health and banks is becoming conducive to workin our local context.
However, with a small and convenient samplinggeneralization of the results hold limitations of the study.Moreover, unequal distribution of sample from different andspecific occupation also resulting limits to the generalization.On the basis of above discussion we conclude that sources ofWFC & FWC can be better examined if employees are withcomparable occupational and of employment status. Such asKarasek’s theory, suggested that lower level managers reportedhigher levels of conflict than others. Therefore, there is still aneed to study work family conflict construct in detail andidentify what those different organizational and moderatingvariables like support, controllability and work hour flexibility,work load, and work environment to determine genderdifferences for WFC and FWC. Future research may also focuson exploring the factor analysis and convergent-validity oftwo different constructs such as Carlson scale for its localimplication so that it can be brought into human resourcemanagement functions.

Research
PAKISTAN BUSINESS REVIEW JULY 2011329
Gender Difference: Work and Family Conflicts and Family-Work Conflicts
References:
Burke, R. J., Weir, T., & DuWors, R. E.(1980) Work Demands onAdministrators and Spouse Well-being. Human Relations, 33,253-278.
Carlson, D. & Kacmar, M. (2000) Work-Family Conflict in theOrganization: Do Life Role Values Make a Difference? Journalof Management, 26(5), 1031-054.
Carlson, D. (1999) Personality and Role Variables as Predictorsof Three Types of Work Family Conflict, Journal of VocationalBehavior, 55, 236-253.
Cooke, R. A., & Rousseau, D. M. (1984), Stress and Strain fromFamily Roles and Work-role Expectations. Journal of AppliedPsychology, 69, 252-260.
Elizabeth, D.L., & Alan, H.C., (1991), Gender Differences in Work-Family Conflict. Journal of Applied Psychology, 76(1): 60-74.
Eagle, B.W., Icenogle, M. L. & Maes, J. D. (1998) The Importanceof Employee Demographic Profiles for UnderstandingExperiences in Work-family Interrole Conflicts. The Journal ofSocial Psychology, 138: 690-709.
Eagle, B.W., Miles, E. W., & Icenogle, M. L. (1997) InterroleConflicts and the Permeability of Work and Family Domains: Arethere gender differences? The Journal of Vocational Behavior,50: 168-184.
Frone, M. R., Russell, M., & Cooper, L., (1992) Prevalence ofWork Family Conflict: are Work and Family Boundaries Permeable.Journal of Organizational Behavior, 13, 723-729.
PAKISTAN BUSINESS REVIEW JULY 2011
Research
330
Gender Difference: Work and Family Conflicts and Family-Work Conflicts
Frone, M. R. & Yardley, J. K. (1996). Workplace Family-supportiveProgrammes: Predictors of Employed parents Importance Rating.Journal of Vocational Behavior, 69, 351-366.
Greenhaus, J. H., & Beutell, N. J. (1985),Sources of ConflictBetween Work and Family Roles. Academy of ManagementReview, 10(1), 76-88.
Greenhaus, J. & Powell, G. (2003), When Work and Family Collide:Deciding between Competing Role Demands. OrganizationalBehavior and the Human Decision Processes, 90(2): 291-303.
Gutek, B. A. Searle, S. & Klepa, L. (1991), Rational versus Genderrole Explanations for Work-Family Conflict. Journal of AppliedPsychology, 76, 560-568.
Hall, D. T. (1972) A Model of Coping Hall with Role Conflict: TheRole Behavior of College Educated Women. AdministrativeScience Quarterly, 17, 471-489.
Hochschild, A. (1989) The second shift. New York: Avon Books.
Kahn, R., Wolfe, D., Quinn, R., Snoek, J. & Rosenthal, R. (1964)Organizational Stress, Wiley, New York.
Kopelman, R. E., Greenhaus, J. H., & Connolly, T. F. (1983) AModel of Work, Family, and Interrole Conflict: A ConstructValidation Study. Organizational, Behavior, and HumanPerformance, 32, 198-215.
Lambert, S. J. (1990), Process Linking Work and Family: A CriticalReview and Research Agenda, Human Relations, 43(3), 239-257.
Larson, R. W., Richards, M. H., & Perry-jenkins, M. (1994)Divergent worlds: The Daily Emotional Experience of Mothersand Fathers in The Domestic and Public Spheres.

Research
PAKISTAN BUSINESS REVIEW JULY 2011331
Gender Difference: Work and Family Conflicts and Family-Work Conflicts
Journal of Personality and Social Psychology, 67: 1034-1046.
Matsui, T., Ohsawa, T., & Onglotco, M. (1995) Work-familyConflict and the StressbufferingEffects of Husband Support and Coping Behavior amongJapanese Married Working Women.” Journal of VocationalBehavior, 47: 178-192.
Netemeyer, R.G.,Boles, J. S. & McMurrian, R. (1996).Developmentand Validation Of Workfamily Conflicts and Work-Family ConflictScales. Journal of Applied Psychology, 81, 400 –410.
Pleck, H., (1977), The Work-Family Role System. Social Problems,417-427.
Rice, R. W., Frone, M. R., & McFarlin, D. B. (1992) Work-NonworkConflict and the Perceived Quality of Life. Journal ofOrganizational Behavior, 13, 155-168.
Robinson, J. P., & Godbey, G. (1997) Time for life. UniversityPark: The Pennsylvania State University Press.
Shelton, B. A., & John, D. (1996) The Division of HouseholdLabor.” Annual Review of Sociology, 22: 299-322.
Voydanoff, P. (1988) Work Role Characteristics, Family StructureDemands and Work Family Conflict. Journal of Marriage andthe Family, 50, 749-761.
Williams, K. J., & Alliger, G. M. (1994) Role Stressors, MoodSpillover, and Perceptions of Work-family Conflict in EmployedParents. Academy of Management Journal, 37: 837-868.

PAKISTAN BUSINESS REVIEW JULY 2011
Research
332
The Relationship between Work Motivation and Job Satisfaction
THE RELATIONSHIP BETWEENWORK MOTIVATION AND JOB
SATISFACTION
Nadia AyubDepartment of Business Psychology
Shagufta RafifDepartment of Management
College of Business Management, KarachiAbstract
Numerous researchers investigated the relationship betweenjob satisfaction and work motivation in diversifiedprofessions but none investigated bank managers inPakistan. Therefore, the current study attempts to explorethe relationship between work motivation and jobsatisfaction. Based on the literature review two hypotheseswere formulated 1) There will be positive relationship betweenwork motivation and job satisfaction, and 2) There would bea gender difference on the variable of work motivation andjob satisfaction. To asses job satisfaction, “Job SatisfactionSurvey (JSS; Spector, 1997)”, and for motivation, “Motivationat Work Scale (MAWS, Gagné, M., et.al, 2010)”, were used.The sample of the study consists of 80 middle managers (46males; 34 females) from different banks of Karachi, Pakistan.A Pearson Product Moment Correlation Coefficient wascalculated for the correlation between the work motivationand job satisfaction. In order to find out gender differencest test was computed. In conclusion, the findings of the studysuggest that there was a positive correlation between workmotivation and job satisfaction. Furthermore, there was asignificant gender difference on the variable of workmotivation and job satisfaction.
Keywords: Motivation, job satisfaction, gender differenceJEL Classification: J81, O15, Z13, J28*An earlier version of this refereed paper was presented at the firstBusiness Psychology Seminar held by the Department of BusinessPsychology IoBM in November, 2010

Research
PAKISTAN BUSINESS REVIEW JULY 2011333
The Relationship between Work Motivation and Job Satisfaction
Introduction
The relationship between job satisfaction and motivationat work has been one of the widely researched areas in the field ofmanagement in relation to different professions, but in Pakistanvery few studies have explored this concept especially on bankingsectors employees. According to Khan (1997), in the currentbusiness environment, organizations in all industries areexperiencing rapid change, which is accelerating at an enormousspeed. Finck et al. (1998) also stated that companies mustrecognize that the human factor is becoming much more importantfor organizational survival, and that business excellence will onlybe achieved when employees are excited and motivated by theirwork. In addition, difficult circumstances, such as violence,tragedy, fear, and job insecurity create severe stress in employeesand result in reduced workplace performance (Klein, 2002).According to Watson (1994) business has come to realize that amotivated and satisfied workforce can deliver powerfully to thebottom line. Since employee performance is a joint function ofability and motivation, one of management’s primary tasks,therefore, is to motivate employees to perform to the best of theirability (Moorhead & Griffin, 1998).
Banks are corporeal structures and play a significantrole in the economy worldwide, although faced by internalcompetition among the commercial banks in Pakistan, the onlycompetitive advantage they have is through their motivationalpersonnel that deliver quality service to their customers.Outstanding services provided by these employees create a nichein the eye of the customer, which plays an important and significantrole in delivering high customer satisfaction. Thus it’s importantfor management to ensure that managers are work place motivated.
Pinder (1998) described work motivation as the set ofinternal and external forces that initiate work-related behavior,
PAKISTAN BUSINESS REVIEW JULY 2011
Research
334
The Relationship between Work Motivation and Job Satisfaction
and determine its form, direction, intensity and duration. Pinder(1998) contended that an essential feature of this definition isthat work motivation is an invisible, internal and hypotheticalconstruct, and that researchers, therefore, have to rely onestablished theories to guide them in the measurement ofobservable manifestations of work motivation. Du Toit (1990)added that three groups of variables influence work motivation,namely individual characteristics, such as people’s own interests,values and needs, work characteristics, such as task variety andresponsibility, and organizational characteristics, such as itspolicies, procedures and customs. Van Niekerk (1987) saw workmotivation as the creation of work circumstances that influenceworkers to perform a certain activity or task of their own free will,in order to reach the goals of the organization, and simultaneouslysatisfy their own needs.
Work motivation of the middle managers in the bankingsector largely depends on the social, economic, and culturalcircumstances of the country. If the manager does not receive acompetitive salary, he will face problem in maintaining his familylife status. The pressure of the family will not let this individualshow his full potential, thus he will be stressed out and theorganizations efficiency will be affected by this individual.Therefore, it is very important to find out the variable thatcontributes to his motivation at work and job satisfaction. Jobsatisfaction of the managers who have an important place asforerunners of the society will affect the quality of the servicerendered.
According to Sempane, Rieger & Roodt (2002), “Jobsatisfaction relates to people’s own evaluation of their jobsagainst those issues that are important to them”. Job satisfactionis regarded as related to important employee and organizationaloutcomes, ranging from job performance to health and longevity(Spector, 2003). The nature of the environment outside of the job

Research
PAKISTAN BUSINESS REVIEW JULY 2011335
The Relationship between Work Motivation and Job Satisfaction
directly influences a person’s feelings and behavior on the job(Hadebe, 2001). Judge and Watanabe (1993) reinforced this ideaby stating that there is a positive and reciprocal relationship existsbetween job and life satisfaction in the short term, and that overtime, general life satisfaction becomes more influential in a person’slife. Schultz and Schultz (1998) emphasized that people spendone third to one half of their waking hours at work, for a period of40 to 45 years, and that this is a very long time to be frustrated,dissatisfied and unhappy, especially since these feelings carryover to family and social life, and affect physical and emotionalhealth.
Megginson, Mosley & Pietri (1982) stated that peopleexperience job satisfaction when they feel good about their jobs,and that this feeling often relates to their doing their jobs well, ortheir becoming more proficient in their professions, or their beingrecognized for good performance. Literature suggests that, “Avariety of factors motivate people at work, some of which aretangible, such as money, and some of which are intangible, suchas a sense of achievement (Spector, 2003)”. Schultz and Schultz(1998) held the view that job satisfaction encompasses the positiveand negative feelings and attitudes people hold about their jobs,and that these depend on many work-related characteristics, butalso on personal characteristics, such as age, gender, health andsocial relationships.
Employee motivation and job satisfaction cannot beisolated, but they complement each other and respond to differentorganizational variables like productivity and working conditions.Employee and job satisfaction depends on people’s insight andbehavior at the work place which is driven by a set of intrinsic,extrinsic needs and by their view of numerous job-related andorganization related attitudes. The relationship has long beenignored by researchers, although a very strong relation exists,that can be supported by previous literature such as Hoole andVermeulen (2003) found that the extent to which people are
PAKISTAN BUSINESS REVIEW JULY 2011
Research
336
The Relationship between Work Motivation and Job Satisfaction
motivated by outward signs of position, status and due regardfor rank, is positively related to their experience of jobsatisfaction. Chess (1994), reported that certain motivationalfactors contribute to the prediction of job satisfaction.
The evidence suggests that there is a gender differencein work motivation. For example, Hofstede (2001) came to theconclusion that while men’s concerns are mostly earnings,promotion and responsibility, women value friendly atmosphereand usually concern prestige, challenge, task significance, jobsecurity, co-operation and their work environmental conditions.Reif et al. (1976) examined significance of 33 particular rewardsfor men and women and found that gender was the determiningfactor of appreciation of the value of reward. Gooderman et al.(2004) have also discovered that men prove to be much morefinancially motivated than women do. A study by Miner (1974a)of business managers (44 females and 26 males) and educationaladministrators (25 females and 194 men) found that managerialmotivation was “significantly related to the success of femalemanagers” (p. 197), but there were no consistent differencesbetween men and women in managerial motivation. Minerconcluded that “it implies only that those women who becomemanagers have the motivational capacity to do as well as maleswho become managers…Whether the female population canprovide a major source of managerial talent in the future,consonant with the rising labor force participation of women,poses a major and as yet unanswered research question” ( p.207).
Few studies suggest negligible or no gender differenceon work motivation such as a study by Dubinsky, A.J., et al.,(1993) showed that rather minimal differences in motivation existbetween men and women. Similarly, Pearson & Chatterjee (2002)while examining experience of China came to the conclusion thatdespite divergences, gender uniformity in job motivation of menand women dominated. They share the same attitudes as to high
Research
PAKISTAN BUSINESS REVIEW JULY 2011337
The Relationship between Work Motivation and Job Satisfaction
earnings, training opportunities, work autonomy, usage of skills,desirable living area, relations with managers, etc.
Gender differences in job satisfaction have beenextensively researched and no conclusive evidence has beenfound with regard to the levels of satisfaction among men andwomen. However, results from several studies have indicatedthat there is a relationship between gender and job satisfaction(Bilgic 1998; Lumpkin & Tudor 1990; Goh & Koh 1991; Oshagbemi2000b). For instance, Hulin and Smith (1964) investigated 295male workers and 163 female workers to determine the satisfactionlevel of employees. Results indicated male workers were moresatisfied with their job than female workers. On the other hand aresearch conducted by Lumpkin & Tudor (1990) showed thatfemale managers are paid less and are less satisfied with theirpay; thus, it follows that they are not satisfied with their pay,promotions, and overall job satisfaction.
Based on above literature review, the primary aims ofthe current study are twofold. One, our study attempts to explorethe relationship between work motivation and job satisfaction.Two, the study also looks at gender differences, in terms of workmotivation and job satisfaction.
MethodologySample
The sample comprised of 80 middle managers (46 males, 34females) working in different banks of Karachi, Pakistan. Participantswere selected through the HR department pool. The mean age ofparticipants was 30.56 years. With regard to marital status, 64% menwere married, 36% women were married. Seventy five percent ofparticipants were Master’s and 25% were Bachelor’s. An averageparticipant’s length of the service was 5.8 years.
PAKISTAN BUSINESS REVIEW JULY 2011
Research
338
The Relationship between Work Motivation and Job Satisfaction
Measures
A demographic form was filled by the participants,which included information about age, gender, qualification,length of service, designation, and marital status.
The Motivational at Work Scale (MAWS; Gagné, M.,et al., 2010). The MAWS consists of 12 items. Each subscaleconsists of three items i.e. Intrinsic (item 4, 8, & 12), Identified(item 3, 7, & 11), Introjected (item, 2, 6, & 10), and extrinsic (item1, 5, & 9).The rating scale range from 1= not at all; 2= very little;3 = a little; 4 = moderately; 5 = strongly; 6 = very strongly; 7=exactly. MAWS was found to be internally consistent at thelevel of = .824.
The Job Satisfaction Survey (JSS; Spector, 1997) is anine-subscale measure of employee job satisfaction. The ninefacets are 1) pay, 2) promotion, 3) supervision, 4) fringe benefits,5) contingency rewards, 6) operating conditions, 7) coworkers,8) nature of work, and 9) communication. The JSS consists of 36items to be rated by participants on a 6-point likert formatresponse scale (i.e., disagrees very much, disagree moderately,disagree slightly, agree slightly, agree moderately, and agree verymuch). In the present study, JSS found to be internally consistentat the level of = .759.
Procedure
The questionnaires were distributed to respondents andthey completed the questionnaire manually. The data wascollected individually. At the beginning of each questionnaire,an overview was provided. All respondents must fill ademographic form which includes information on age, gender,qualification, length of service, designation, and marital status.The researcher gave directions for the Motivational at WorkScale (2010) first and then for the Job Satisfaction Survey (1997).
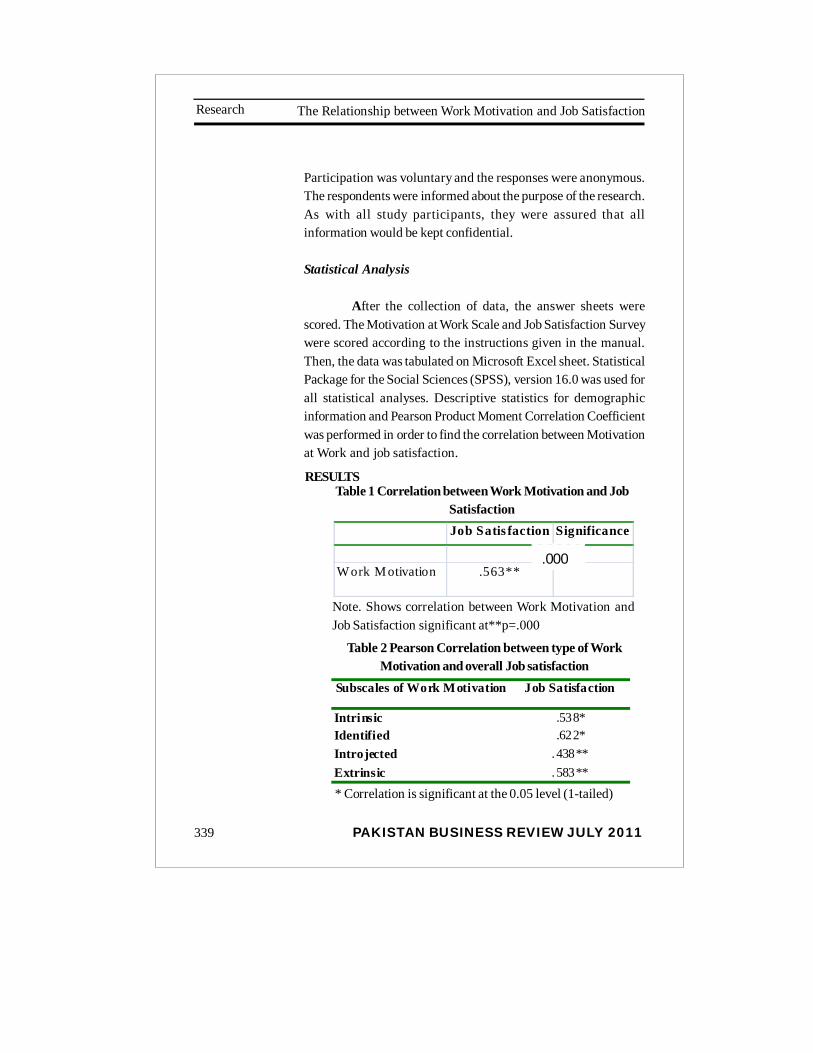
Research
PAKISTAN BUSINESS REVIEW JULY 2011339
The Relationship between Work Motivation and Job Satisfaction
Participation was voluntary and the responses were anonymous.The respondents were informed about the purpose of the research.As with all study participants, they were assured that allinformation would be kept confidential.
Statistical Analysis
After the collection of data, the answer sheets werescored. The Motivation at Work Scale and Job Satisfaction Surveywere scored according to the instructions given in the manual.Then, the data was tabulated on Microsoft Excel sheet. StatisticalPackage for the Social Sciences (SPSS), version 16.0 was used forall statistical analyses. Descriptive statistics for demographicinformation and Pearson Product Moment Correlation Coefficientwas performed in order to find the correlation between Motivationat Work and job satisfaction.
RESULTSTable 1 Correlation between Work Motivation and Job
Satisfaction
Note. Shows correlation between Work Motivation andJob Satisfaction significant at**p=.000
Subscales of Work Motivation Job Satisfaction
Intrinsic .538* Identified .622* Introjected . 438** Extrinsic . 583**
* Correlation is significant at the 0.05 level (1-tailed)
Job Satis faction Significance
Work M otivation .563** .000
Table 2 Pearson Correlation between type of WorkMotivation and overall Job satisfaction
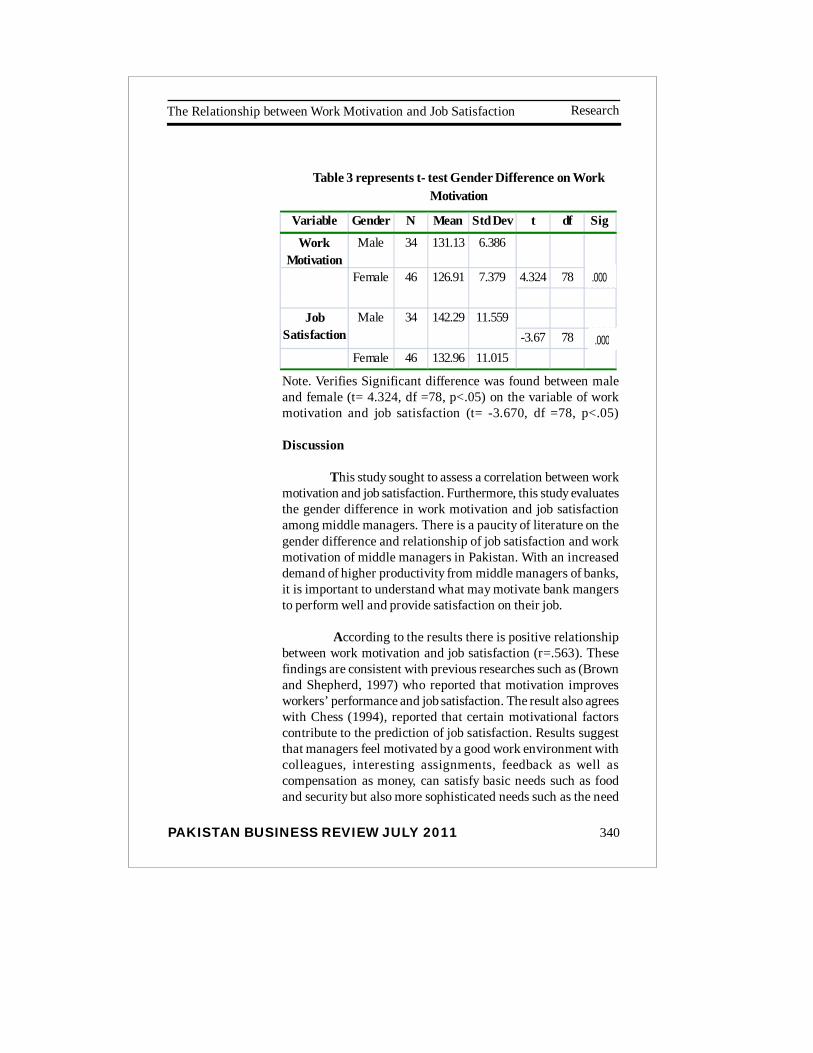
PAKISTAN BUSINESS REVIEW JULY 2011
Research
340
The Relationship between Work Motivation and Job Satisfaction
Table 3 represents t- test Gender Difference on WorkMotivation
Variable Gender N Mean Std Dev t df Sig
Work Motivation
Male 34 131.13 6.386
4.324 78
-3.67 78Female 46 132.96 11.015
Job Satisfaction
Male 34 142.29 11.559
Female 46 126.91 7.379
Note. Verifies Significant difference was found between maleand female (t= 4.324, df =78, p<.05) on the variable of workmotivation and job satisfaction (t= -3.670, df =78, p<.05)
Discussion
This study sought to assess a correlation between workmotivation and job satisfaction. Furthermore, this study evaluatesthe gender difference in work motivation and job satisfactionamong middle managers. There is a paucity of literature on thegender difference and relationship of job satisfaction and workmotivation of middle managers in Pakistan. With an increaseddemand of higher productivity from middle managers of banks,it is important to understand what may motivate bank mangersto perform well and provide satisfaction on their job.
According to the results there is positive relationshipbetween work motivation and job satisfaction (r=.563). Thesefindings are consistent with previous researches such as (Brownand Shepherd, 1997) who reported that motivation improvesworkers’ performance and job satisfaction. The result also agreeswith Chess (1994), reported that certain motivational factorscontribute to the prediction of job satisfaction. Results suggestthat managers feel motivated by a good work environment withcolleagues, interesting assignments, feedback as well ascompensation as money, can satisfy basic needs such as foodand security but also more sophisticated needs such as the need
.000
.000

Research
PAKISTAN BUSINESS REVIEW JULY 2011341
The Relationship between Work Motivation and Job Satisfaction
for recognition and influence (Locke, 1999). Therefore, financialcompensation is assumed to play a significant part when peoplechoose jobs, stay in jobs and are motivated in jobs. The possibleexplanations of these findings are when the managers basic andhigher order needs are fulfilled at work, the employee will have apositive attitude towards job that will eventually lead to jobsatisfaction.
In the study, a significant gender difference was foundon the variable of work motivation (n=80, t=4.324, pd”.05). Thefindings are in line with previous literature, which suggests thatwomen are rather highly motivated to avoid success, becausethey are likely to expect negative consequences, like socialrejection and/or feeling of being unfeminine (Horner, 2005, p. 207).Gooderman et al. (2004) have discovered that men prove to bemuch more financially motivated than women. Reif et al. (1976)examined a significance of 33 particular rewards for men andwomen and found that gender was the determining factor ofappreciation of the value of reward. According to Marjaana G. etal., (2007), men in Japan “value more highly not only the masculinework attribute of advancement but also the following femininefactors: fringe benefits and personal time. In contrast, Japanesewomen value more highly not only physical working conditionsbut also the challenging work that is supposed to be valued morehighly by men”.
According to the results there was a difference on jobsatisfaction (n=80, t= -3.670, p<.05).These findings are consistentwith previous researches such as Bigoness (1988) found thatmen usually emphasize on salary while women‘s emphasis is onprofessional growth. Moreover, Major and Konar (1984)demonstrating the differences, stressed that women usually payless attention to salary than men do. Contributing to the literatureon gender differences and job satisfaction, Goh & Koh (1991)examined the effects of gender on the job satisfaction of 608Singaporean accountants and found that male respondents weremore satisfied than their female counterparts. According to genderstereotypical model, women should fulfill family needs and careof the quality of their family life. So, for women interpersonalrelationship, security, fringe benefits, environment etc. should be
PAKISTAN BUSINESS REVIEW JULY 2011
Research
342
The Relationship between Work Motivation and Job Satisfaction
more important. On the whole, these studies have demonstratedthat there is some association between gender and jobsatisfaction.
There are some limitations of the present study. Firstly,the findings of the study were from convenient purposivesampling method. Therefore, the generalizability of the findingsis inadequate. Second, this study did not include age, and lengthof service - an important correlate of job satisfaction. For futureinvestigations should include these variables and explorerelationships among age, length of service, and other valuevariables in relation to motivation and job satisfaction. Finally,the study depended on self-reported data. There is always a riskof being biased and selective recall when using such data (Smith& Glass, 1987). Expansion on the present study would allowgreater knowledge into the predictors of job satisfaction andmotivation in the banking profession.
The findings of this study have several implicationsfor employers that gender contributes a major part in motivationas well as in job satisfaction. For that reason employers shouldkeep in mind that gender does play a significant part whiledesigning assignments, challenging tasks, incentive plans,promotions, and working conditions for managers in theworkplace. It is, therefore, hoped that these findings will serveas resource materials for the management of banks, government,and significant others who are concerned with the managersquality performance.
Conclusion
To conclude, findings of the study illustrate that workmotivation improves job satisfaction. Employee gender displayeda marked influence on employee motivation, & job satisfaction.The research findings suggest that when employers are caringand supportive and focus their attention on motivating factorsthe outcome is more productive and committed employees.
Research
PAKISTAN BUSINESS REVIEW JULY 2011343
The Relationship between Work Motivation and Job Satisfaction
References
Bi lg ic, R. (1998) , “The Rela t ionsh ip between JobSat isfaction and Per sonal Characterist ic of TurkishWorkers,” Journal of Psychology, 132:549-57.
Bigoness, W.J. (1988). Sex differences in job attributepreferences. Journal of Organizational Behavior, 9, 139-147.
Brown, J. & Sheppard, B. (1997). Teacher librarians inlearning organizations. Paper Presented at the AnnualConference of the International Association of SchoolLibrarianship, Canada. August 25-30.
Dubinsky, A.J., Joison, M.A., Michaels, R.E., Kotabe, M.and Lim, C.U. (1993). Percept ions of mot ivat ionalcomponents: salesmen and saleswomen revisited. TheJournal of Personal Selling and Sales Management, 13, 25-37.
Du Toit, M.A. (1990). Motivering (Motivation). In J. Kroon(Ed.), Algemene bestuur (General management) (2nd ed.)(pp.83 – 92). Pretoria : HAUM.
Finck, G., Timmers, J. & Mennes, M. (1998). Satisfaction vs.motivation. Across The Board, 35(9), 55-56.
Gagné, M., Forest, J., Gilbert, M.-H., Aubé, C., Morin, E.M., & Malorni, A. (2010). The Motivation at Work Scale:Validation evidence in two languages. Educational andPsychological Measurement, 70, 628-646. doi:10.1177/0013164409355698
PAKISTAN BUSINESS REVIEW JULY 2011
Research
344
The Relationship between Work Motivation and Job Satisfaction
Goh, C.T., H.C. Koh & C.K. Low (1991), “Gender Effects onthe Job Satisfaction of Accountants in Singapore,” Workand Stress 5(4): 341-48.
Gooderman, P., Nordhaug, O., Ringdal, K. and Birkelund, E.(2004). Job values among future business leaders: theimpact of gender and social background. ScandinavianJournal of Management, 20, 3, 277-95.
Hofstede, G. (2001). Culture’s Consequences: ComparingValues, Behaviors, Institutions, and Organizations AcrossNations
Hoole, C. & Vermeulen, L.P. (2003). Job satisfaction amongSouth African pilots. South African Journal of IndustrialPsychology, 29(1), 52 – 57.
Hor ner, M.S . (2005) . Toward an under stan ding ofachievement-related conflicts in women. In M. Ednick,S.Tangi, L.W. Hoffman (Eds.), Women and achievement.Social and motivational analyses. John Wiley and Sons.
Hulin, C. & P. Smith (1964), “Sex Differences in JobSatisfaction,” Journal of Applied Psychology 48:88-92.
Judge, T.A. & Watanabe, S. (1993). Another look at the jobsatisfaction - life satisfaction relationship. Journal ofApplied Psychology, 78, 939 – 948.
Hadebe, T.P. (2001). Relationship between motivation andjob satisfaction of employees at Vista Information Services.M. A. d i sser t a t i on , Ra nd Afr i ka a n s Un i ver si t y,Johannesburg.
Research
PAKISTAN BUSINESS REVIEW JULY 2011345
The Relationship between Work Motivation and Job Satisfaction
Khan, S. (1997). The key to being a leader company:Empowerment. Journal for Quality and Participation, 20(2),44-53.
Klein, K.E. (2002). Motivating from the top down. BusinessWeek Online, 1/9/2002, pN.PAG, 01p.
Locke, E.A. (1999). The Motivat ion Sequence, theMotivation Hub and the Motivation Core. Organizationalbehaviour and human decision processes, 50, 288 – 299.
Lumpkin J.R. & K. Tudor (1990), “Effect of Pay Differentialon Job Satisfaction: A Study of the Gender Gap,” Journalof Supply Chain Management: Human Resources Issues26(3):25-29.
Major, B. and Konar, E. (1984). An investigation of sexdifferences in pay expectations and their possible causes.Academy of Management Journal, 4, 777-792.
Marjaana Gunkel, Edward J. Lusk, Birgitta Wolff, Fang Li(2007). Gender-specific Effects at Work: An EmpiricalStudy of Four Countries. Gender, Work & Organization 14(1), 56-79.
Megginson, L.C., Mosley, D.C. & Pietri, P.H. (1982).Management concepts and applications (4th ed.) NewYork: Harper Collins.
Miner, J. B. (1974a). Motivation to manage among women:St udi es of bus i ness m an a ger s a n d educa t ion a ladministrators. Journal of Vocational Behavior, 5, 197- 208.

PAKISTAN BUSINESS REVIEW JULY 2011
Research
346
The Relationship between Work Motivation and Job Satisfaction
Moorhead, G. & Griffin, R.W. (1998). Organizationalbehavior: Managing people and organizations (5th ed.).Boston: Houghton Mifflin.
Oshagbemi, T. (2000b), “Correlates of Pay Satisfaction inHigher Education,” International Journal of EducationalManagement 14(1):31-39.
Pearson, C.A.L., Chatterjee, S.R. (2002) Gender variationsin work goal priorities: a survey of Chinese managers.International Journal of Management, 535-543.
Pinder, C.C. (1998). Work motivation in organizationalbehavior. Upper Saddle River, N J: Prentice-Hall.
Reif, W.E., Newstrom, J.W., St Louis, R.J. (1976). Sex as adiscriminating variable in organizational reward decisions.Academy of Management Journal, 19, 3, 460-76.
Schultz, D. & Schultz, S.E. (1998). Psychology and worktoday: An introduction to industrial and organizationalpsychology (7th ed.). New Jersey: Prentice Hall.
Sempane, M.E., Rieger, H.S. & Roodt, G. (2002). Jobsatisfaction in relation to organizational culture. SouthAfrican Journal of Industrial Psychology, 28(2), 23 -30.
Smith, M.L. and Glass, G.V. (1987) Research and Evaluationin Education and the Social Sciences Englewood Cliffs:Prentice-Hall.
Spector, P.E. (2003). Industr ia l and organ izat ionalpsychology – Research and practice (3rd ed.).
Research
PAKISTAN BUSINESS REVIEW JULY 2011347
The Relationship between Work Motivation and Job Satisfaction
Spector, P. E. (1997) Job sat isfaction: Applicat ion,assessment, cause and consequences Thousand Oaks,CA: Sage New York: John Wiley & Sons, Inc.
Watson, T. (1994). Linking employee motivation andsatisfaction to the bottom line. CMA Magazine, 68(3), 4.
Van Niekerk, W.P. (1987). Eietydse bestuur (Contemporarymanagement). Durban: Butterworth.
Vinokur, K.D., Jayaaratne, S., Chess, W.A. (1994). Jobsatisfaction and retention of social workers in publicagencies, non-profit agencies and private practice: Thei mpact of wor k pl ace con di t i on s an d mot i va tor s .Administration in Social Work, 18 (3) 93-121.

PAKISTAN BUSINESS REVIEW JULY 2011
Research
348
Effectiveness of Brief Counseling Sessions for Employee Development
EFFECTIVENESS OF BRIEFCOUNSELING SESSIONS FOREMPLOYEE DEVELOPMENT:
A QUALITATIVE STUDYZainab F Zadeh PhD
Samia AhmadHalima Ghani
Institute of Professional Psychology, Bahria University,Karachi
Abstract
The purpose of the study was to provide a qualitative analysisof the brief counseling sessions and to investigate theeffectiveness of the same in employee development. Further itidentified issues leading to spill over at work and creating work-life imbalance.
The study was launched with a group orientation sessionscomprising of a briefing related to purpose, procedure andregulatory requirements of the process followed by an ice breakingactivity. Drawing was chosen as an icebreaking activity as it isconsidered one of the useful tools for rapport building andproviding free reign to thoughts. Each employee was asked tosubmit a drawing depicting their current feelings.
A total of 20 employees participated in the study for which followup sessions began with brief counseling. A minimum of eight toten sessions including the intake interview were conducted, ofwhich the duration of each session was between 30 to 60 minutes.Each session was problem focused, providing rapport andexpectation clarification in the initial phase, leading to re-educative and supportive counseling for presenting complaintsin later sessions. Towards the end feedback was obtainedregarding the effectiveness of the sessions.
*An earlier version of this refereed paper was presented a t the firstBusiness Psychology Seminar held by the Department of BusinessPsychology IoBM in November, 2010
PAKISTAN BUSINESS REVIEW JULY 2011349
Effectiveness of Brief Counseling Sessions for Employee DevelopmentResearch
Results
The results indicate that among the 20 employees, two reportedall four complaints of emotional disturbance (i.e. anger, stress,frustration and anxiety), seven reported three complaints ofemotional disturbance and the combination varied accordingly(two out of seven complained of anger, frustration and stress,three complained of frustration, stress and anxiety, there was asingle case of stress, anger, and anxiety, and a single case ofanger frustration and anxiety). Nine employees reported twocomplaints of emotional disturbance (and the combination variedaccordingly, two of anger and frustration, two of frustration andanxiety, one of stress and anxiety, two of frustration and stressand two of anger and stress). Two employees reported a singlecomplaint of emotional disturbance (i.e.anxiety).
To asses the efficacy of brief counseling sessions the followingquestion was asked in the terminal phase from each participant“Did you benefit from the counseling sessions?” The feedbackreceived in the form of a verbatim was further divided into threecategories i.e. Yes, No, and Indifferent. The results showed inTable 2 clearly indicates that 18 out of 20 employees reported thatthey benefited from the counseling process and it helped themgain relative control over emotional disturbances caused bypersonal and workplace issues whereas the response of twoemployees suggested indifference related to the outcome of thecounseling process, which shows that 90% of the employeefeedback was in the favor of the counseling process.
Conclusion
The study limitations were that employees’ verbal feedback wasthe only form of data collected during brief counseling and noother formal pre or post counseling assessments were conducted.
Key Words: Development, Employee Development, BriefCounseling, Change: Organizational Restructuring, EmotionalDisturbance, Work-life balance.
JEL Classification: O15, I29, M15
PAKISTAN BUSINESS REVIEW JULY 2011
Research
350
Effectiveness of Brief Counseling Sessions for Employee Development
Introduction
The purpose of the study was to provide a qualitativeanalysis of brief counseling sessions and to investigate theefficacy of the same in employee development. Further, itidentified issues leading to spill over at work and creating work-life imbalances.
Employee development initiatives have a significantimpact during organizational restructuring. As defined by theChartered Institute of Personnel and Development CIPD, 2001development is the growth or realization of a person’s abilityand potential through the provision of learning and educationalexperiences (Armstrong, 2006). For the purpose of this studyEmployee development is defined as the process of re-educationin order to reduce emotional disturbance and achieve a desirablestate.
At an organizational level a variety of employeedevelopment strategies are utilized for instance, training andQuality of Work Life (QWL) programs which is an organizationaldevelopment technique designed to improve organizationalfunctioning by humanizing the work place. An approach toimprove QWL is Quality Circles (QCs) in which small groups ofvolunteers meet regularly to identify and to solve problems relatedto the work they perform and the conditions under which theywork. Another example is of team building exercises whichenhance employee development by discussing problems relatedto their work group’s performance. On the basis of thesediscussions specific problems are identified and plans for solvingthem are devised and implemented. Survey and feedbacktechniques are also used as employee development techniques.The survey feedback technique follows three steps 1. Collectingdata: employees complete surveys to provide information about
PAKISTAN BUSINESS REVIEW JULY 2011351
Effectiveness of Brief Counseling Sessions for Employee DevelopmentResearch
problems in their organizations; 2. Give feedback: feelings aboutthe organization are summarized and shared with all employees;3. Develop action plans: through group discussions specific plansfor overcoming problems are identified and developed. EmployeeAssistance Programs are also an effective strategy for employeedevelopment. An EAP provides employees and their familymembers with opportunities to address their workplace concernsas well as those in their personal life through counseling (Robbins,1998).
In 2001 the British Association for Counseling andPsychotherapy commissioned and published a report, Counselingin the Workplace. The results showed that “after counseling,work-related symptoms returned to normal in more than half of allclients and sickness absence was reduced by over 25%” McLeod(2003).
The objectives of counseling reported by Eisenberg and Delaneyare:1. Understanding self2. Making impersonal decisions3. Setting achievable goals which enhance growth4. Planning in the present to bring about desired future objectives5. Effective solutions to personal and interpersonal problems6. Coping with difficult situations7. Controlling self defeating emotions8. Acquiring effective transaction skills9. Acquiring ‘positive self-regard’ and a sense of optimism about one’s own ability to satisfy one’s basic needs.
PAKISTAN BUSINESS REVIEW JULY 2011
Research
352
Effectiveness of Brief Counseling Sessions for Employee Development
Many professionals working in mental health agencies,private practice and schools are increasingly asked to shortentheir time with clients and provide clear evidence of counselingeffectiveness (Ivey, 1997). Brief counseling provides prompt andearly interventions as it allows limited but attainable goals toimprove coping abilities. It is a time limited intervention designedto attain specified goals, the principle focus being on the hereand now rather than on early life events. It also provides rapidinitial assessment of the nature of the problem to develop a workformulation and maintain a flexible approach (Bloom, 1997). Inthe present study Brief counseling was introduced as anintervention during organizational restructuring.
According to Holmes and Rahe (1967) any life changes,including work related life events requiring readjustments canbe perceived as stressful. Moreover, changes that are introducedin organizational restructuring affect the socio-psychologicalwell-being of the organization members given the potential foruncertainty that may accompany such changes (Ahmed & Zadeh,2008). Employees in a post-restructuring context areunderstandably wary about the future direction of theorganization and their roles within it (Lee & Teo, 2005).Organizational restructuring is a global phenomenon. 12000managers in 25 countries (Kanter, 1991) were asked to identifychanges they have experienced in the past two years. Majorrestructuring was the highest organizational change reportedalong with others like mergers, acquisitions reduction inemployment, international expansion etc. (Robbins, 1998).
For the purpose of this study Change: organizationalrestructuring is defined as the rearrangement of the existingdivision of labor, as well as the pattern of coordination,communication, workflow and authority.
PAKISTAN BUSINESS REVIEW JULY 2011353
Effectiveness of Brief Counseling Sessions for Employee DevelopmentResearch
The concerns raised during the brief counselingsessions were mainly around emotional disturbance in the formof stress: perceived pressure in fulfilling responsibilities, angeroutbursts: disagreements and misunderstandings, anxiety:apprehension of failure and frustration: inability to find solutions.These disturbances were reported to effect both domains of workand life.
These disturbances were resolved through 6 – 8 briefcounseling sessions per employee in order to bring about work-life balance. Each employee was counseled using cognitiveinterventions. Cognitive intervention uses scientific and rationalmethods to explore thought assumptions and beliefs people have.These methods focus on functioning that has been found to playboth a causative and maintenance role in solving psychologicalproblems. Cognitive interventions are time limited and obtain fastresults because they are problem focused. Moreover, thetechniques are structured and directive in which they provide anagenda for each session. Agenda setting was imperative becauseeach employee had a schedule and the organization’s goal was toachieve results within a limited time frame. The participants metthe “inclusion criteria” for Cognitive Behavioral Therapy (CBT),as they could understand the CBT rationale, access their thoughtsand feelings, take responsibility and demonstrate optimism forchange.
In an analysis by Schultheiss (2006) “an extensiveliterature base has been established on the interdependenciesbetween the world of work and family life” (Barling & Sorensen1997; Fassinger 2000; Greenhaus 1989; Greenhaus & Parasuraman1999). A variety of models have surfaced to elaborate therelationship among the two prominent spheres of life, includingspill over, work-family conflict, work-family enrichment, work-family integration, work-family balance. Work-family balance is
PAKISTAN BUSINESS REVIEW JULY 2011
Research
354
Effectiveness of Brief Counseling Sessions for Employee Development
perhaps the most extensively sited term in the literature of jobsatisfaction. Grrenhaus et al. (2003) suggests that Work-familybalance refers to the extent to which an individual is equallyengaged in and equally satisfied with his or her work role andfamily role.
The theory of Work-Life Balance proposes threehypotheses about how job and life satisfaction are related.Weaver (1978) proposed that satisfaction (or dissatisfaction) inone area of life affects or spills over to another termed as the“spill over hypothesis”. Therefore, difficulties in home life canaffect those in work causing the spillover. The second hypothesisthat is “compensation hypothesis” suggests that an individualcompensates for dissatisfaction in one area of life with another.Thus an employee facing dissatisfaction at work may look forsatisfaction in other areas of life or vice versa. The finalhypothesis which is “segmentation hypothesis” poses thatpeople group aspects of their lives separately and thussatisfaction or dissatisfaction in one group does not affectanother. (Rein et al. 1991) point out that because research hasconsistently found a positive correlation between job and lifesatisfaction, the spill over hypothesis is the only one supportedby studies. Judge and Watanabe (1993) conducted a longitudinalstudy over a 5-year span which suggests that job satisfactionand life satisfaction affect one another in that satisfaction ordissatisfaction in either will affect the other (Spector, 1996).
In the present study it was found that Work-Life balancewas being disturbed causing spill over, as a result of “change”which came about in the form of organizational restructuring.Change: organizational restructuring caused rearrangementof the existing division of labor, as well as the pattern ofcoordination, communication, workflow and authority. Whenorganizational restructuring was taking place the employees werefacing a transition in work location disturbing their originalroutines. This transition required additional time away from home
PAKISTAN BUSINESS REVIEW JULY 2011355
Effectiveness of Brief Counseling Sessions for Employee DevelopmentResearch
Figu
re 1:
Sta
ges o
f em
ploy
ee d
evel
opm
ent
causing disruption in performing their jobs as well as daily choresat home. Furthermore, the employees were expected to look afterexisting responsibilities with the same fervor as earlier alongwith assimilation towards setting up the new location.
PAKISTAN BUSINESS REVIEW JULY 2011
Research
356
Effectiveness of Brief Counseling Sessions for Employee Development
MethodologySample
A total of 20 non teaching staff participated in thestudy. The group comprised of 19 males and one female, agesbetween 23 to 58 years, out of which 14 were married and sixunmarried. Most of the staff was educated up till Bachelors’level and belonged to middle and lower-middle socio-economic backgrounds.
Measures/Techniques
A semi structured intake interview followed by briefcounseling sessions per individual were conducted weekly.
Procedure The study was launched with an orientation to definethe purpose, procedure and regulatory requirements for thecounseling sessions. Drawing was chosen as an icebreakingactivity as it is considered one of the useful tools for rapportbuilding and providing free reign to thoughts. Each employeewas asked to submit a drawing depicting their current feelings.
The follow up sessions began with brief counselingwhich was between eight to ten sessions including the intakeinterview for each employee. The intake interview focused onquestions related to work-life such as “Do you think youhave a job of your choice?” and “Where do you see yourselfafter five years?” and home life such as “Among your friendsand family who do you count on for support?” and “Maritalstatus” along with the emotional involvement with onesspouse was inquired through “How long have both of youbeen together?” indicated also the level and depth ofinteraction. These areas of investigation indicated how marriedemployees were experiencing relatively more emotionaldisturbances as compared to unmarried employees due to amore complicated family dynamics, indicated a spill over atwork.
PAKISTAN BUSINESS REVIEW JULY 2011357
Effectiveness of Brief Counseling Sessions for Employee DevelopmentResearch
The duration of each session was between 30 to 60minutes, which was problem focused, providing rapport andexpectation clarification in the initial phase, leading to re-educativeand supportive counseling for presenting complaints in the latersessions. Towards the end feedback was obtained regarding theeffectiveness of the sessions. The consolidated brief counselingactivity lasted approximately for a period of three months fromstart to end.
Session StructureSession 1Intake interview, establishing rapport, expectation clarificationSession 2Problem identification, structuring a future planSession 3Introduction of re-educative techniques, catharsisSession 4Working through, cognitive restructuringSession 5Practicing alternative strategies, dealing with reluctant behaviorSession 6Modifications in client strategiesSession 7Session review and feedback, preparation for closing sessionSession 8Closing, discussion on future plans
Through the method of content analysis the employee’semotional disturbances were identified which were manifested inthe form of anger outbursts, frustration, stress and anxiety.
Anger is a fairly strong emotional reaction whichaccompanies a variety of situations such as physically restrainedbeing interfered with, having one’s possessions removed,attacked or threatened. It includes physical reactions such asfacial grimaces and body positions characteristic of action.
PAKISTAN BUSINESS REVIEW JULY 2011
Research
358
Effectiveness of Brief Counseling Sessions for Employee Development
Anger Outbursts are described as disagreements andmisunderstandings at work. Anger outbursts were mainlymanifested in two forms passive and active. Passive angermanifested itself as an inert struggle with feelings of unfairtreatment, and stubbornness. Active anger was evident in theform of miscommunication, impulsivity and verbal arguments.
Frustration is an inability to find solutions resulting ina negative and puzzled sate of mind. For example, difficulty ininterpersonal communication, feelings of inferiority, decisionmaking and adaptability issues.
Stress is perceived pressure in fulfilling responsibilitiespertaining to work as well as home, manifested in the form ofpoor concentration, difficulty in prioritizing with multitasking,and modification in responsibilities.
Anxiety is an apprehension of failure. In the presentstudy it was observed in the form of job insecurity, low initiativeand lack of trust in one’s self and others.
Definition Of Key Terms:
Development was the growth or realization of aperson’s ability and potential through the provision of learningand educational experiences.
Employee development was defined as the process ofre-education in order to reduce emotional disturbance and achievea desirable state.
Change: organizational restructuring was defined asthe rearrangement of the existing division of labor, as well as thepattern of coordination, communication, workflow and authority.
Emotional disturbance was defined in following terms:
Stress: perceived pressure in fulfilling responsibilities,Anger outbursts: disagreements and misunderstandings,
Anxiety: apprehension of failure and Frustration:inability to find solutions. These disturbances were reported toreflect in both domains of Work and Life.
Brief Counseling: Brief Counseling where a minimumof eight to ten sessions including the intake interview wereconducted. The duration of each session was between 30 to 60minutes.
PAKISTAN BUSINESS REVIEW JULY 2011359
Effectiveness of Brief Counseling Sessions for Employee DevelopmentResearch
Wok-life Balance: Gaining relative control over emotionaldisturbances caused by personal and workplace issues.
Discussion of Results
The purpose of the study helped identify theeffectiveness of brief counseling at the workplace to reducethe employee’s emotional disturbances and bring about worklife balance. The study elaborates the emotional disturbancesfaced by employees during the time of organizationalrestructuring causing spill over of work on homeresponsibilities. In order to reduce the emotional disturbanceand restore balance, brief counseling was used as an effectiveintervention.
In the Pakistani organizational context there is littleevidence based work in counseling research.Expressivelanguage has a therapeutic effect on one’s mental state.Similarly, counseling provides an opportunity for catharsis ina non judgmental environment with the assistance of aprofessional. Through this qualitative assessment theeffectiveness of brief counseling on employee developmentwas evident as given an opportunity to talk in an environmentproviding conflict resolution is healthier than gossiping. Thisallowed employees to gain awareness and insight on how tobalance their work and home issues, in a healthier and moreconstructive manner.
The manifested anger outbursts were identified asactive and passive. Passive anger manifested itself as an inertstruggle with feelings of unfair treatment, and stubbornness.Active anger was evident in the form of miscommunication,impulsivity and verbal arguments. During counseling activeanger was addressed through debating, deep breathingexercises, and relaxation techniques. Employees with passive
PAKISTAN BUSINESS REVIEW JULY 2011
Research
360
Effectiveness of Brief Counseling Sessions for Employee Development
anger were taught to cope with anger outbursts through assertivetraining.
Frustration was revealed through feelings of inferioritywhich were also reported like low self confidence and low selfrespect, where employees felt they were unable to express andresolve issues. Memory problems pertaining to retention andrecall were bought during counseling. Techniques such asexternal memory aids and diary keeping were introduced formemory problems. Role play facilitated enhancement ininterpersonal communication. Low self confidence and low selfrespect were restructured through debating negative andirrational thought patterns. For instance one of the senioremployees felt inferior in terms of position/rank when comparedto fellow colleagues. With debating a realistic picture was drawnto bring about healthy acceptance of existing circumstanceswhich minimized the unfair comparison.
Stress was observed in the form of poor concentrationand difficulty in prioritizing with multitasking. Modification ofresponsibilities during organizational restructuring wasperceived as an added pressure. Married employees withdependent family members perceived relatively more stress thanothers. Socio economic background was another determinant increating stress leading to work-life imbalance; this was also moreevident in employees with dependants. Time management,structuring and planning with distribution of responsibilities werethe main techniques utilized during counseling. For example, incase of one of the administration employees, the pre-counselingbehavior indicated mounting stress due to difficulty in delegationof responsibilities and consequently finding oneself responsiblefor every task given. During counseling this stress was addressedby analyzing the tasks in steps and teaching delegation at variousstages.

PAKISTAN BUSINESS REVIEW JULY 2011361
Effectiveness of Brief Counseling Sessions for Employee DevelopmentResearch
Anxiety was observed as apprehension of failure, a fewof the employees reported reluctance in taking initiative andresponsibilities during organizational restructuring due toincreased fear of disapproval and losing one’s job. Techniquesused during counseling for anxiety reduction were relaxation withdeep breathing and imagination, thought stopping, mirroring,motivational debriefing and reassurance. For instance, one of theemployee’s negative automatic thoughts were addressed duringincreased anxiety through the method with thought stopping.
Table 1 Complaints of Emotional Disturbance
Types of Emo tiona l D isturb an ce Ca se
No G ender M a rital
status Ang er
O utburst F rustrati on Stress Anxiety
1. M ale M arri ed Χ X X X 2. M ale U nm arried X X 3. M ale U nm arried X X X 4. M ale M arri ed X X X X 5. Fema le U nm arried X X X 6. M ale M arri ed X X X 7. M ale M arri ed X X X 8. M ale M arri ed X X 9. M ale M arri ed X X 10 . M ale M arri ed X X 11 . M ale M arri ed X X 12 . M ale M arri ed X 13 . M ale M arri ed X X 14 . M ale U nm arried X 15 . M ale U nm arried X X X 16 . M ale M arri ed X X 17 . M ale U nm arried X X 18 . M ale M arri ed X X 19 . M ale M arri ed X X X 20 . M ale M arri ed X X X
Table showing case wise frequency of complaints related to emotional disturbance
PAKISTAN BUSINESS REVIEW JULY 2011
Research
362
Effectiveness of Brief Counseling Sessions for Employee Development
Th r ough t h e m eth od of con t en t a n al ys i scounseling data was analyzed in units which were theparticipant’s presenting complaints. The results showedin Table 1 indicate that out of 20 employees two reportedall four complaints of emotional disturbance (anger, stress,frustration and anxiety), seven reported three complaintsof emotional disturbance and the combination variedaccordingly (two out of seven complained of anger,frustration and stress, three complained of frustration,stress and anxiety, there was a single case of stress, anger,and anxiety, and a single case of anger frustration andanxiety). Nine employees reported two complaints ofemotional disturbance (and the combinat ion variedaccordingly two of anger and frustration, two of frustrationand anxiety, one of stress and anxiety, two of frustrationand stress and two of anger and stress). Two employeesreported a single complaint of emotional disturbance (i.e.anxiety).
These units were further evaluated in terms offrequency, space and direction. Frequency refers to thenumber of participants with the recurrent unit presented,space referred to the amount of sessions covered for eachunit and direction showed positive or negative impact inthe unit. Some of the units identified in the study wereemotional instability, need for enhancing education andmarital issues. Based on the demographics of the samplein cl ud in g ma r i ta l an d socio economi c st a t us a ndeducational level variations in terms of intensity in unitswere observed.
It was observed that married employees wereexperiencing relatively more emotional disturbances ascompared to unmarried employees due to more complicatedfamily dynamics. The lack of quality time spent with familyand the contributing lower socio economic background

PAKISTAN BUSINESS REVIEW JULY 2011363
Effectiveness of Brief Counseling Sessions for Employee DevelopmentResearch
were the two other significant determinants that lead to thespill over hypothesis.
A m a jor i t y of t h e em pl oyees wh o wer eundergraduates and have reached mid career levels withwork experiences of eight to ten years were feeling jobinsecurities (threat was caused by less job opportunitiesoutside the organization and the employee’s age group,with older employees feeling more insecure).
Table 2 Feedback of efficacy for brief counseling sessions
Cas e No No Yes Indifferent1. X2. X3. X4. X5. X6. X7. X8. X9. X10. X11. X12. X13. X14. X15. X16. X17. X18. X19. X20. XTotal 18 (90% ) 2 (10% )

PAKISTAN BUSINESS REVIEW JULY 2011
Research
364
Effectiveness of Brief Counseling Sessions for Employee Development
To asses the efficacy of the brief counseling sessionsthe following question was asked in the terminal phase fromeach participant “Did you benefit from the counseling sessions?”The feedback received in the form of a verbatim was furtherdivided into 3 categories i.e. Yes, No, and Indifferent. The resultsshowed in Table 2 clearly indicates that 18 (90 percent) out of 20employees reported that they benefited from the counselingprocess and it helped them gain relative control over emotionaldisturbances caused by personal and workplace issues. Asagainst this the response of two (10 percent) employeessuggested indifference related to the outcome of the counselingprocess.
The feedback obtained from the participants during thetermination phase suggested that brief counseling sessions hada positive impact on employee development and helped themrestore relative control over work-life balance.
The study provided support to the non teaching staffto manage stress level during the time of organizationalrestructuring. In Pakistan most of the research data shows littledocumentation and thus for this purpose it was decided todocument the findings reported in the study, which can serve asgrounds for establishing facts regarding the effectiveness ofcounseling for later research. This was the reason the studyposes a limitation in terms of pre and post evaluation through astructured instrument.
Conclusively, the feedback obtained from theparticipants during the termination phase suggested that briefcounseling sessions had positive impact on employeedevelopment and helped them restore relative control over work-life balance.
PAKISTAN BUSINESS REVIEW JULY 2011365
Effectiveness of Brief Counseling Sessions for Employee DevelopmentResearch
Qualitative analysis of sessions based on participantfeedback revealed that the process of counseling provided anopportunity to non teaching staff to openly express in a nonjudgmental environment. Through cognitive behavioraltechniques employees gained insight to restore relative controlover work-life balance. Such practices can prove to be helpfulin organizations at a one to one level as this process revealsan in-depth understanding of employee issues.
Study limitations indicate that employee’s verbalfeedback was the only form of data collected during briefcounseling and no other formal pre or post counselingassessments were conducted. For future studies it isrecommended that formal pre and post assessments tools canbe used to analyze the actual utilization of the insight andskills acquired in the employee’s everyday functioning.Moreover other demographic features like socio economicbackground, education etc. could be analyzed in detail in futureresearches. Consideration of detailed analysis of the drawingsthat were used in the ice breaking activity could also provideuseful information in further studies.
PAKISTAN BUSINESS REVIEW JULY 2011
Research
366
Effectiveness of Brief Counseling Sessions for Employee Development
References
Ahmad, K. B. & Zadeh, Z. F. (2008). Number of Working Hoursand Male Employee’s Psychological Work Stress levels.Pakistan Journal of Psychological Research, 23 (1-2), 29-36
Armstrong, M. (2006). A Handbook of Human ResourceManagement Practice. (10th Ed). Kogan Page. Philadelphia, USA.213, 535.
Bloom, B. L. (1997). Planned Shot-term Psychotherapy, A Clinicalhandbook. (2nd Ed). Allyn and Bacon. Massachusetts, USA. 5.
Chatturvedi, R. (2007). Encyclopedia of Guidance and Counseling.Cresent Publishing Corporation. New Delhi, India. 175 – 186.
Ivey, A. E., Ivey, M. B. & Simek-Morgan, L. (1997). Counselingand Psychotherapy, A Multicultural Perspective. (4th Ed). Allyn& Bacon. Massachusetts, USA. 81 – 82.
McLeod, J. (2003). Doing Counseling Research. (2nd Ed). SagePublication Limited. London, UK. 122 – 125.
Robbins, P. S. (1998). Organizational Behavior. (8th Ed). Prentice-Hall. New Jersey, USA. 210 – 212.
Schultheiss, D. E.P. (2006). The Interference of Work and FamilyLife. Professional Psychology: Research and Practice, 37 (4),334-341.
Shyam, R. & Yadev. S. (2006). Indices of Well-being In OlderAdults: A Study Amongst Institutionalized and Non-institutionalized Elderly. Pakistan Journal of PsychologicalResearch, 21 (3-4), 79-94.
Spector, P. E. (1996). Industrial and Organizational Psychology,Research and Practice. John Wiley and Sons, Inc. New York,USA. 235-236.
Mcloed, J & Henderson. M. (2003). Does workplace counselingwork? Retrieved from, http://bjp.rcpsych.org/cgi/content/full/182/2/103 Eisenberg and Delaney. Retrived from, http://www.citehr.com/26074-employee-counselling overview.html

Research
PAKISTAN BUSINESS REVIEW JULY 2011367
Role of Popularity in Being Bullied at the Work Place
ROLE OF POPULARITY INBEING BULLIED AT THE
WORK PLACE
Qudsia TariqSaima Masoom Ali
Department of PsychologyUniversity of Karachi, Karachii
Abstract
The present study is designed to study “The Role of workplacepopularity in being bullied at the work place”. The samplecomprised of two hundred participants selected from differenttall and flat organization of Karachi city. In this study a workplacebullying questionnaire based on DIAS (Direct IndirectAggression Scale )by K.Bjorkquist and K.Osterman, AbouAkademi University Finland (1992); was used. The popularity ofthe individual was rated on a ten point rating scale accompanyingthe demographic sheet, on which the participant was asked torate him/herself in order to screen the level of popularity in theorganization. It was hypothesized that people who are popularamong their colleagues are more likely to be bullied as comparedto unpopular people. The second hypothesis stated that womenare more likely to be bullied as compare to men. Pearsoncorrelation along with means was applied for statistical analysis.The results showed a significant relationship between bullyingand popularity calculated value was + 0.8 which verified the firsthypothesis and correlation of bullying scores of men and womenwas as + 0.2 which revealed no significant gender differences.Further, interesting findings indicated that men are more bulliedby men bosses and women are more bullied by women bosses.
JEL Classification: M14, M59, J81
*An earlier version of this refereed paper was presented a t the firstBusiness Psychology Seminar held by the Department of BusinessPsychology IoBM in November, 2010
PAKISTAN BUSINESS REVIEW JULY 2011
Research
368
Role of Popularity in Being Bullied at the Work Place
Introduction
The purpose of this research was to identify therelationship between popularity at the work place in beingbullied. It is needless to say that workplace bullying presentsserious challenges to organizations, yet it remains one of themost neglected problems in the realm of employment relations.
According to Tracy, Lutgen-Sandvik, and Alberts(2006), researchers associated with the Project for Wellness andWork-Life, workplace bullying is most often “a combination oftactics in which numerous types of hostile communication andbehaviour are used”.
Gary and Namie, define workplace bullying as “repeated,health-harming mistreatment, verbal abuse, or conduct whichis threatening, humiliating, intimidating, or sabotage thatinterferes with work or some combination of the three .”
Pamela Lutgen-Sandvik (2003) expands this definition,stating that workplace bullying is “persistent verbal andnonverbal aggression at work that includes personal attacks,social ostracism, and a multitude of other painful messagesand hostile interactions.”
Workplace bullying comes in many forms, obvious andconcealed, direct and indirect. It is deliberately spiteful, typicallyrepeated, and often malicious in nature. Surrounded by the mostcommonly reported behaviors are yelling, shouting, andscreaming; false accusations of mistakes and errors; hostile glaresand other intimidating non-verbal behaviors; covert criticism,sabotage, and undermining of one’s reputation; social exclusionand the “silent treatment”; use of put-downs, insults, andexcessively harsh criticism; and irrationallyheavy work demands (As cited by David and Yamada, (2008).
Research
PAKISTAN BUSINESS REVIEW JULY 2011369
Role of Popularity in Being Bullied at the Work Place
Contrary to the impression generated by a growingnumber of news reports in the past several years, the occurrenceof workplace violence extreme acts of aggression involving directphysical assault represent a relatively rare event in work settings.However, workplace aggression—efforts by individuals to harmothers with whom they work or have worked—are much morecommon and may prove extremely damaging toindividuals and organizations (Baron & Neuman 1998).
If workplace bullying is to be taken more gravely, it maygive details of as part of a deeper overall communal interest inhuman dignity. On this point, we may turn to Robert Fuller, aphysicist and former college president who has attracted nationalattention for his examinations of dignity in the context of hierarchyand rank. According to Fuller, the primary obstacle to buildingwhat he calls a “dignitarian” society is the persistence of“rankism,” which may manifest itself as discrimination on thebasis of constructs such as race, sex, or age, but also may generatefrom unnecessarily hierarchical relationships in our private,public, and civic institutions (As cited by Yamada, 2008).
Bullying can occur at various places depending uponthe level of vulnerability of an individual in a group. For example,people are mainly bullied at work by their manager or co-workersor subordinates, or by their clients (bullying, workplace bullying,mobbing, work abuse, harassment, discrimination) at home bytheir partner or parents or siblings or children (bullying, assault,domestic violence, abuse, verbal abuse), at school (bullying,harassment, assault) in the care of others, such as in hospitals,convalescent homes, care homes, residential homes (bullying,harassment, assault), in the armed forces (bullying, harassment,discrimination, assault) by those in authority (harassment, abuseof power) by neighbors and landlords (bullying, harassment) bystrangers (harassment, stalking, assault, sexual assault, rape,grievous bodily harm, murder).Bullying differs from harassmentand assault in that the latter can result from a single incident orsmall number of incidents - which everybody recognizes as

PAKISTAN BUSINESS REVIEW JULY 2011
Research
370
Role of Popularity in Being Bullied at the Work Place
harassment or assault / whereas, bulling tends to be anaccumulation of many small incidents over a long period of time.Each incident tends to be trivial, and on its own and out of contextdoes not constitute an offence or grounds fordisciplinary or grievance action. (Retr ieved fromhttp://www.bullyonl ine.org/workbully/amibeing.htm).
Bullying is behavior by choice, and, therefore, bullyingis a choice. Many bullies are in positions of management or powerand, therefore, do not require help - except in their speciousattempts to deceive others and to evade accountability andsanction. Bullies rely on naivety, inexperience and people feelingsorry for them and will ruthlessly exploit decent people’s urge to“help” and “forgive” them. Such people unwittingly swell thebully’s army of supporters, enablers, apologists, appeasers,acolytes, protectors and deniers. This could be one of the reasonsfor bullying being so common at the work place since the personbullying disguises him/herself very well in public.h t t p : / / www. bu l l yon l i n e . o rg / wor kbu l l y/ m yt h s . h t m .
People who bully others are usually incompetent andunskilled and in order to conceal their uselessness they try tobelittle others. They usually victimize popular people as a resultof intense jealousy against them. Since people who are popularand are being liked by the majority it makes them vulnerable in asense that these people become prominent and a threat for thosewho lack potential and likeness among their colleagues. Hencethey are targeted by the bully to be as invisibleas themselves by threatening and harassing them.
Policy and procedures could be ineffective, and oneshould not underestimate the ability (conscious or otherwise) ofsenior managers to undermine the process! One of the mostundermining systems we have observed is what is termed ‘vacuummanagement’(Rayner 2002). This is where decisions fail to bemade. Senior managers may hope that by not giving an answer,
Research
PAKISTAN BUSINESS REVIEW JULY 2011371
Role of Popularity in Being Bullied at the Work Place
the situation will go away, and sometimes does. Of course, staffwill know about their tactics. Unfortunately, this lack of actioncan lead to staff having no confidence in senior managers’willingness or ability to combat bullying at work andunfortunately, in some cases this is very well founded (as citedby Dorightatwork).
ObjectivesThe aim of this study was to observe the relation of popularitywith work place bullying.Observe gender differences in work place bullying.Research Assumptions1- It was hypothesized that people who are popular amongtheir colleagues are more likely to be bullied as compared tounpopularpeople.2- The second hypothesis stated that women are more likely tobe bullied as compared to men.
MethodologySample
A sample of 200, 120 men and 80 women participantswere selected through random stratified technique after screeningthem on a popularity scale from various tall and flat organizations.It included both private and government sectors based inKarachi. For all tall organizations, banks, multinationalcompanies, fast chains and for flat organizations schools, NGOsand single unit companies were considered. Their average agewas 26 years and the minimum qualification was graduation.
Inclusion CriteriaParticipants who had a job experience of at least 3 years
and also rated ‘seven or above’ on popularity scales wereincluded in the sample.Exclusion Criteria
Participants who had a job experience of less than 3years or on contract and those who rated themselves less than‘seven ’ on popularity scales were excluded.
PAKISTAN BUSINESS REVIEW JULY 2011
Research
372
Role of Popularity in Being Bullied at the Work Place
Material1- Consent Form: It communicates the purpose of research,
ensures confidentiality and right to withdraw and wassigned by each participant.
2-Demographic: name (optional), age, gender, marital status,qualification, date of administration, subject’s designationand to which category of organization he/she belonged i.e.,flat organization or tall organization, work experience, jobshifts in the last 3 years.
3- A popularity questionnaire based on 10 point rating scale forscreening purposes was used.
4- Workplace bullying questionnaire was based on DIAS (DirectIndirect Aggression Scale). It is a 4 point rating scale rangingfrom 0 to 4, never to very often design by K.Bjorkquist andK. Osterman, Abou Akademi University Finland (1992).It hasthree domains 1-Physical aggression(7 items )2-VerbalAggression(5 items) & 3-Indirect aggression(12 items).
ProcedureThe first step of the methodology was to screen the
employees on the popularity scale after getting the consent formsigned by the participants. Then participants were asked to fillthe demographic sheet in which they had to rate themselves onthe bullying scale. Those who rated 7 or above on the popularityscale. On selected participants bullying scale (4 point likert scale)was administered. After they had filled the questionnaire, theirscores were calculated. For statistical analysis Mean and Pearsoncorrelation was applied.Results
There is a 0.8 relation between bullying and popularitywhich is indicative of strong positive relation. Bullying scores ofmen and women is 0.2 which shows very weak correlation. Resultsindicated interesting findings men are more bullied by men bossesand women are more bullied by women bosses. Men are bulliedfor their work performance while women for personal and moralvalues.
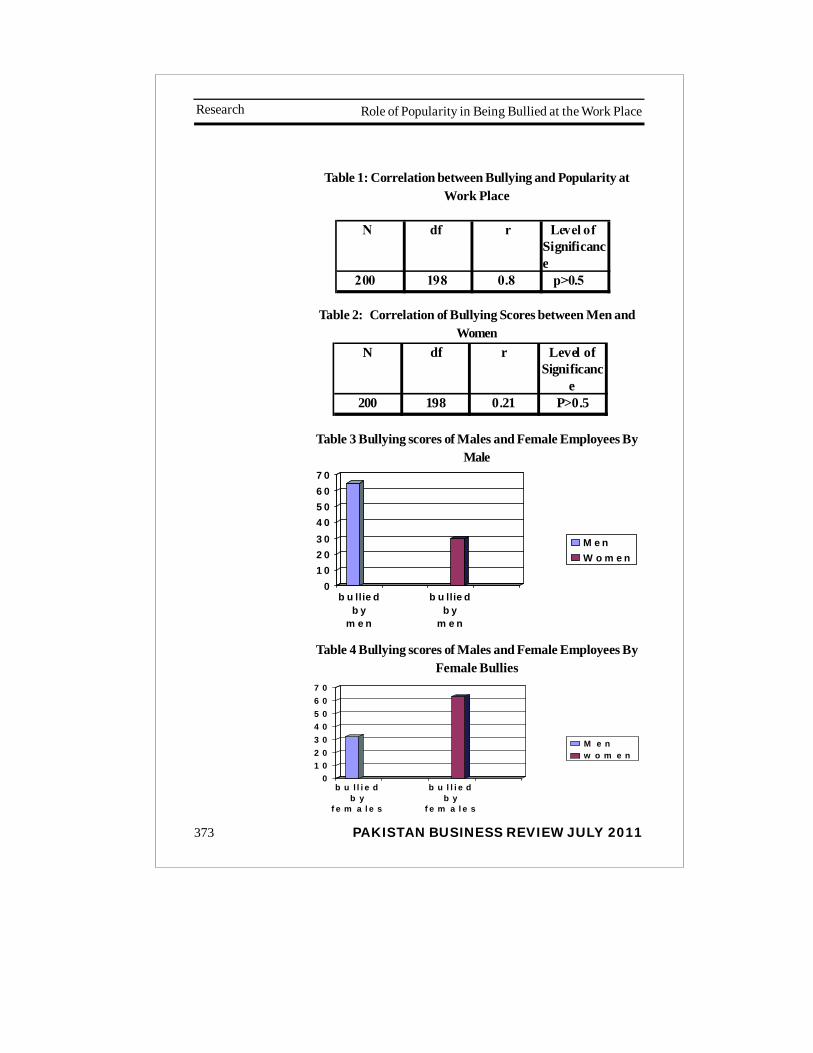
Research
PAKISTAN BUSINESS REVIEW JULY 2011373
Role of Popularity in Being Bullied at the Work Place
Table 1: Correlation between Bullying and Popularity atWork Place
Table 2: Correlation of Bullying Scores between Men andWomen
N df r Level of Significanc
e200 198 0.21 P>0.5
N df r Level of Significance
200 198 0.8 p>0.5
01 02 03 04 05 06 07 0
b u llie db y
m e n
b u llie db y
m e n
M e nW o m e n
Table 3 Bullying scores of Males and Female Employees ByMale
Table 4 Bullying scores of Males and Female Employees ByFemale Bullies
01 02 03 04 05 06 07 0
b u l l i e db y
f e m a l e s
b u l l i e db y
f e m a l e s
M e nw o m e n

PAKISTAN BUSINESS REVIEW JULY 2011
Research
374
Role of Popularity in Being Bullied at the Work Place
Table 5 Gender Differences in Types of Bullying AttacksMen are bullied for their work performance, while women forpersonal and moral values
01020304050607080
work related Characterassassination
MalesFemales
Discussion
Workplace bullying has been a concern fororganizational heads not in the recent era only but ever since theindustries were built. Hanley & Gilbraith (2008) suggest thatabusive and bullying supervisors have at least some degree ofintent to inflict their behavior on subordinates, whereas poorsupervisors are often simply “clueless” and lack any sense ofspecifically trying to inflict stress on others in the workplace.Although the importance of this grave issue is of great concernfor the mental health and good performance of the employeesunfortunately, not much has been done to handle the issue.
The first hypothesis was ‘Individuals who are popularwould be bullied more than those who are not popular’. Relatingthe factor of popularity to bullying, the results depicted that thereexist a strong correlation between popularity and bullyingi.e.,+80. This factor leaves no room for doubt of popularity beinga desirable attribute by bullies (Refer to Table 1). Since popularpeople are liked and appreciated by their bosses and colleagues
Research
PAKISTAN BUSINESS REVIEW JULY 2011375
Role of Popularity in Being Bullied at the Work Place
they get maximum benefit at the workplace. This creates an air ofjealousy for the bully who is less appreciated and mostly criticizedby his/her colleagues.
Organizations often find it difficult to identify just wherethe work place bullying is taking place, because the distinctionbetween bullying and bossiness is hard to draw, and becauseefficient bosses are usually of economic value to the companyby achieving results. Workplace bullying is an alarming futurerisk exposure for employers. Perhaps the difficulty in definingprecisely what constitutes workplace bullying has contributedto the lack of attention given to this issue by many employers.(Query and Hanley 2010).
The second hypothesis states that ‘popular females
are more likely to be bullied as compared to popular males’.The correlation applied on these factors gave us the figure of.215 which cannot be deemed as worth interpreting but the resultsrevealed interesting findings that men are more bullied by menbosses and women are more bullied by women bosses. Refer toTables 3 and 4 .This reveals the gender biases against femalesthat even their counterparts do not spare them and harass themon equal grounds like men. Men on the other hand, are lessnegative towards their own gender. One reason could be that itis much easier to pick on the weaker sex than their counterpartswho are on equal grounds with them. According to Braithwaite,et al 2008 impulsivity, emotional reactivity, sarcasm, a lowtolerance for ambiguity and aggressiveness are qualities thatpredispose some to bullying others. In comparison, targets appearlikely to have low self-esteem, poor social competence and exhibitnegative affectivity more commonly than other employees; thiscould be another reason for women victimization at the workplace. Men are bullied for their work performance while womenfor personal and moral values.(refer Table 5) It has been observedat the work place that men are usually targeted on their work
PAKISTAN BUSINESS REVIEW JULY 2011
Research
376
Role of Popularity in Being Bullied at the Work Place
efficiency and skill proficiency, on the other hand, women arejudged by their attitudes towards their colleagues and their bodylanguage and dress code. Their personal traits and moral conductdetermines their vulnerability of being a victim of bullying. Theconstant harassment in the form of bullying can be verydevastating for health.According to Yamada, Workplace bullyingis an often unseen, dangerous practice encountered by countlessworkers today. Such harassment has taken a charge, not just onthe physical and mental well-being of the individual directlyaffected, but on his or her family and social relations, job output,and overall workforce morale. As with more slight forms of sexualharassment, incidences of bullying are often unreported ifinvestigated, brought to a quick and usually unsuccessfulconclusion.
“Problems at work are more strongly associated withhealth complaints than are any other life stressor – more so thaneven financial problems or family problems.” (As cited by Yamada,2008).
According to Ronald Lindah (2006) it is indispensableto distinguish that large-scale organizational enhancement doesnot occur in a vacuum or sterile environment. It occurs in humansystems, organizations, which already have beliefs, assumptions,expectations, norms, and values, both idiosyncratic to individualmembers of those organizations and communal.
Conclusion Bulling in an organization can reduce staff turnover andincrease de-motivation and absences among employees, henceaffecting morale and productivity negatively. Since bullyingaffects likeable and popular people more it could cause abreakdown of trust, hence refraining an efficient and effectiveemployee from contributing his/her best work, not giving extraideas for improvement, not providing feedback on failures andmay be less honest about performance. Women being among themore vulnerable group will be affected more.

Research
PAKISTAN BUSINESS REVIEW JULY 2011377
Role of Popularity in Being Bullied at the Work Place
References Baron, Robert A. & Neuman, Joel H. (1998). WorkplaceAggression — The Iceberg Beneath the Tip of WorkplaceViolence. Public Administration Quarterly, Vol. 21, No. 4Retr ieved December 24, 2010 fromhttp://jom.sagepub.com/content/24/3/391.abstract.
Braithwaite, V., Ahmed, E., & Braithwaite, J. (2008) WorkplaceBullying and Victimization: The Influence of OrganizationalContext, Shame and Pride. International Journal ofOrganizational Behavior, Volume 13 [2] 71-94.
Dorightatwork. The Problem Internal with Investigations ofWorkplace Bully Bosses Retrieved January 12, 2011from http://marilynveincentotzs.wordpress.com/2010/04/26/the-problem-with-internal-investigations-of-workplace-bully-bosses/
Half the population are bullied ... most people only realize itwhen they read this page What is bullying, how to recognizebullying. Retr ieved December 24, 2010 fromhttp://www.bullyonline.org/workbully/amibeing.htm
Hanley, G., & Bryant, M. (2008) .The use of conceptual metaphorsas interpretive tools in qualitative research. Paper presented atthe 6th Conference on Workplace Bullying: Sharing ourKnowledge, Ecole des Sciences de la Gestion, Université duQuébec à Montréal, Canada. June.
Lutgen-Sandvik, Pamela (2003) Take This Job and : Quitting andOther Forms of Resistance to Workplace Bullying
Retrieved December 24, 2010 fromhttp://en.wikipedia.org/wiki/Workplace_bullying Myths andmisperceptions about workplace bullying Overcomingstereotypes and false perceptions of adult bullying and
PAKISTAN BUSINESS REVIEW JULY 2011
Research
378
Role of Popularity in Being Bullied at the Work Place
workplace bullying Retrieved December 24, 2010 from http://www.bullyonline.org/workbully/myths.htm Namie, Gary and Ruth Workplace Bullying Institute DefinitionRetrieved December 24, 2010 fromh t t p : / / e n . wi k i pe d i a . or g / wi k i / Wor kp l a ce_ bu l l yi n g
Query. T & Hanley M.G, (2010) Recognizing and Managing RisksAssociated with Workplace Bullying, CPCU e Journal RetrievedDecember18/1/20 from http://business.nmsu.edu/~tquery/r e s e a r c h / C P C U _ e J o u r n a l _ B u l l y i n g _ P a p e r . p d f
Ronald Lindah (2006). The Role of Organizational Climate andCulture in the School Improvement Process: A Review of theKnowledge Base Retr ieved January 12, 2011h t t p : / / c n x . o r g / c o n t e n t / m 1 3 4 6 5 / l a t e s t /
Tracy, Lutgen-Sandvik, and Alberts (2006). Nightmares, Demonsand Slaves, Exploring the Painful Metaphors of WorkplaceBullying, Retr ieved December 24, 2010 fromh t t p : / / e n . wi k i pe d i a . or g / wi k i / Wor kp l a ce_ bu l l yi n g Yamada, D. (2007) Imagining the Good Workplace: It Starts withIndividual Dignity Retrieved December 24, 2010 from http://w w w . h u i l m i a t i o n s t u d i e s . o r g / d o c u m e n t s /Y a m a d a I m a g i n i n g t h e G o o d W o r k p l a c e . p d f
Yamada, David C. (2008). Work Place Bullying and EthicalLeadership. The Journal of JVBL Values Based Leadership.1,2, Retrieved December 24, 2010 from http://www.valuesbasedleadershipjournal.com/issues/vol1issue2/yamada.php
Yamada, David C. Workplace bullying and ethical leadership.Retrieved December 24, 2010 from http://www.scribd.com/doc/31645104/Summary-of-Workplace-Bullying
PAKISTAN BUSINESS REVIEW JULY 2011
Personality Job-FitResearch
379
PERSONALITY JOB-FIT
Khalida RaufDepartment of Psychology
Federal Urdu University, Karachi
Abstract
The present study was conducted to investigate therelationship between traits of ascendancy and job satisfactionin three groups belonging to different professions. The traitof ascendancy of 75 personnel was measured with the help ofGordon personal Profile (Gordon,1963) and the job satisfactionlevel of the same was measured with the help of the Ganguliscale of job satisfaction (Ganguli, 1954). The personnelincluded 25 faculty members,25 insurance agents and 25medical representatives. In order to assess the relationshipof both the variables product moment correlation wascalculated. In order to assess the level of difference in thelevel of ascendancy and job satisfaction of these threegroups, one way analysis of variance was calculated for eachvariable. Results indicated that there was very weak inversecorrelation between the two variables, r=-.006. F value for thevariable of ascendancy is .196 p>.05 and the F value for thevariable of job satisfaction is .077 p>.05.
JEL Classification: J28, M50, 044
*An earlier version of this refereed paper was presented a t the firstBusiness Psychology Seminar held by the Department of BusinessPsychology IoBM in November, 2010
Research
PAKISTAN BUSINESS REVIEW JULY 2011
Personality Job-Fit
380
Introduction and Literature Review
Personality is reflection of behavior, whatever humanbeings do in a persistent fashion that is known as personality.Though behavior differs from situation to situation i.e., behaviorat the workplace may differ from behavior at home, yet people donot differ in their dominating style. This means that people whotend to relate well with their families prefer to be in jobs whichrequire them to have interaction with others, people who are lesstalkative prefer to be in jobs which require individual concentrationon work. Different traits have been identified as conducive tosuccess in different professions.
Researchers generally describe personality in terms oftrait. A trait is a learned tendency of an individual to react as hehas more or less successfully done in the past in similar situations,when similarly motivated. Motivation prompts all behavior in orderto satisfy various needs (Shartle, 1953).
Researchers over different timeframes (Jenkins andMaslach 1994;Veroff and Feld 1971) have concluded that peoplewith high power need reported more satisfaction in power relatedjobs.
Landy(1978) discovered that people with high powerneeds are likely to be found in managerial jobs and leadershippositions, that require them to exert influence over others.
Similar results have been reported by McClelland (1961).According to him graduate students who showed a high need forachievement, after ten years of graduation, were more likely to befound in entrepreneurial occupations than those who had showna low need for achievement.
Similarly, later researchers like Condly and Viswesvaran(2000) and Watson et al. (2002) concluded that people with thetrait of conscientiousness, extraversion or emotional stability arehappier at work. However, Maslach et al (2001) reported that
PAKISTAN BUSINESS REVIEW JULY 2011
Personality Job-FitResearch
381
turnover was common among those who report more stress andburnout on their jobs.
Personality has been shown to influence career choices,job satisfaction, stress, leadership and some aspects of jobperformance. Individual differences seem to affect jobsatisfaction. When the specific job factors are related to one’smakeup job satisfaction is possible. This conjecture is supportedby the results of Hoppock (1963). The sample of this researchwas 500 teachers, those who reported more satisfaction werethose who reported more emotional adjustment, more religiosity,and better human relations, felt more successful, selected theirvocations and were on average 7.5 years older. One interestingfinding in this research was that the difference in average salariesbetween the two groups was not statistically significant asdeterminant of job satisfaction.
Personality can be considered a determinant of jobsatisfaction. When selection procedures are based onpersonality in addition to ability, people may find job contentmore interesting. When people are dissatisfied with their workingconditions, they are likely to move to a new job but with similarcontent which matches their needs (www.aabri.com).
Hulin (1991) argued that personality affects jobsatisfaction but through the mediation of working conditions.Job satisfaction is basically a reaction to working conditions.Working conditions could be improved to increase jobsatisfaction without manipulating the personality variables (Cooket al., 1995).
The results of metaanalysis of stabilities in jobsatisfaction done by Dormann and Zapf (2001) concluded thatpersonality factors play an important role leading to jobsatisfaction.
Judge et al. (2002) maintained that job satisfaction islargely determined by personality traits. On the basis ofdisposition, people view their job characteristics differently, a
Research
PAKISTAN BUSINESS REVIEW JULY 2011
Personality Job-Fit
382
positively disposed person views his job as enriching andinteresting and is more satisfied with his jobs, whereas, negativelydisposed individuals generally focus on the negative aspects ofthe job and are less satisfied. This is supported by Weiss andCropanzano, 1996).
Most of the recent researchers focus on matchingindividuals to organizations. For example, people high onopenness to experience fit best in organizations with highemphasis on innovation, agreeable people work better insupportive environment (LePine et al, 2001). This congruencebetween personality and organization results in increased levelsof well being and decreased levels of stress and turnover (Lovelaceand Rosen, 1996).
The trait of self monitoring among sales people havebeen studied by Vilela & Vilela and Gonzalez (2010), in addition tohigh self monitors, they reported that sales people have enhancedinterpersonal skills and communication skills. Moreover, Blakely,Andrews and Fuller(2003) also reported positive relationshipbetween self monitoring and interpersonal skills.
Maslach et al (2001) found that people have a problemfocused approach if they report more well being at the workplace.Similar results have been obtained by Houtman et al. (1999);Hallberg et al. (2007) and Shimizutani et al. (2008). They obtainedthe above mentioned results testing the statement that one’spersonal approach to work plays a decisive role in developingwork stress.
Methodology:
Based on the literature review the present study aims toidentify the relationship between ascendancy trait and jobsatisfaction.
The hypotheses tested are1. There will be a positive correlation between the trait of
ascendancy and job satisfaction.2. There will be no difference in the level of job satisfaction
of the three groups.
PAKISTAN BUSINESS REVIEW JULY 2011
Personality Job-FitResearch
383
3. There will be no difference in the level of ascendancyof the three groups.
The sample comprised of 25 faculty members of privateuniversities,25 medical representatives and 25 insurance agents.Their ages ranged from 25 to 50 years, the sample comprised ofmarried and unmarried people living in joint and nuclear familysystems. Their educational level range from graduation to PhD.
The Ascendancy scale of Gordon Personal Profile (1963)was administered to gauge scores on Ascendancy whereas; jobsatisfaction was measured through Ganguli scale of jobsatisfaction (1954).Demographic information was collectedthrough the standard Demographic Information Form.
In order to assess the relationship between ascendancyand job satisfaction Pearson Product Moment Correlation wascalculated. In order to find the difference among the three groupsin terms of their ascendancy level and job satisfaction level oneway analysis of variance was calculated for each variable.
Ascendancy was defined as follows:
Those individuals who are verbally ascendant, whoadopt an active role in the group who are self assured andassertive in their relationships with others, and who tend tomake independent decisions, score high on this scale. Thosewho playa low role in the group who listen rather than talk, wholack self confidence, who let others take the lead and who tendto be overly dependent on others for advice, normally make lowscores(Gordon 1963).
Job Satisfaction was defined as follows:
Job satisfaction is the collection of feelings and beliefsthat people have about their current jobs (Ganguli, 1954).
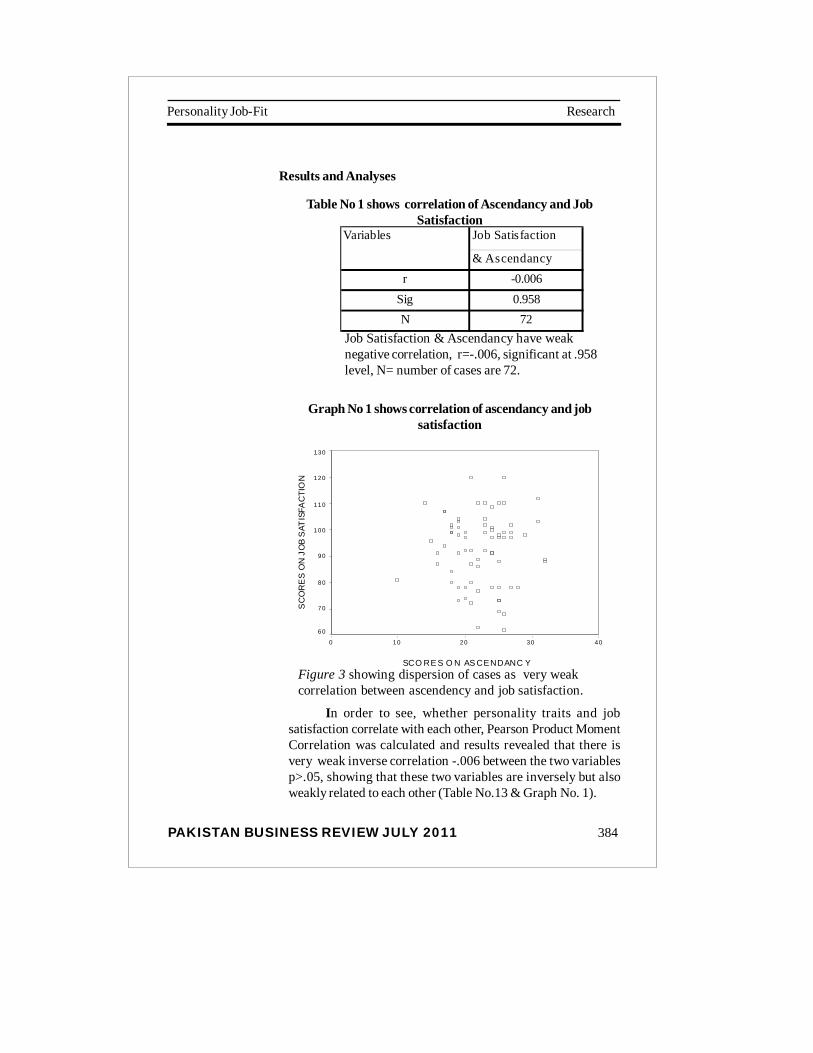
Research
PAKISTAN BUSINESS REVIEW JULY 2011
Personality Job-Fit
384
Results and Analyses
Table No 1 shows correlation of Ascendancy and JobSatisfaction
Job Satisfaction & Ascendancy have weaknegative correlation, r=-.006, significant at .958level, N= number of cases are 72.
Graph No 1 shows correlation of ascendancy and jobsatisfaction
SCO RE S O N AS CENDANC Y
403020100
SC
OR
ES
ON
JO
B S
ATIS
FAC
TIO
N
130
120
110
100
90
80
70
60
Figure 3 showing dispersion of cases as very weakcorrelation between ascendency and job satisfaction.
In order to see, whether personality traits and jobsatisfaction correlate with each other, Pearson Product MomentCorrelation was calculated and results revealed that there isvery weak inverse correlation -.006 between the two variablesp>.05, showing that these two variables are inversely but alsoweakly related to each other (Table No.13 & Graph No. 1).
Job Satisfaction
& Ascendancyr -0.006
Sig 0.958N 72
Variables
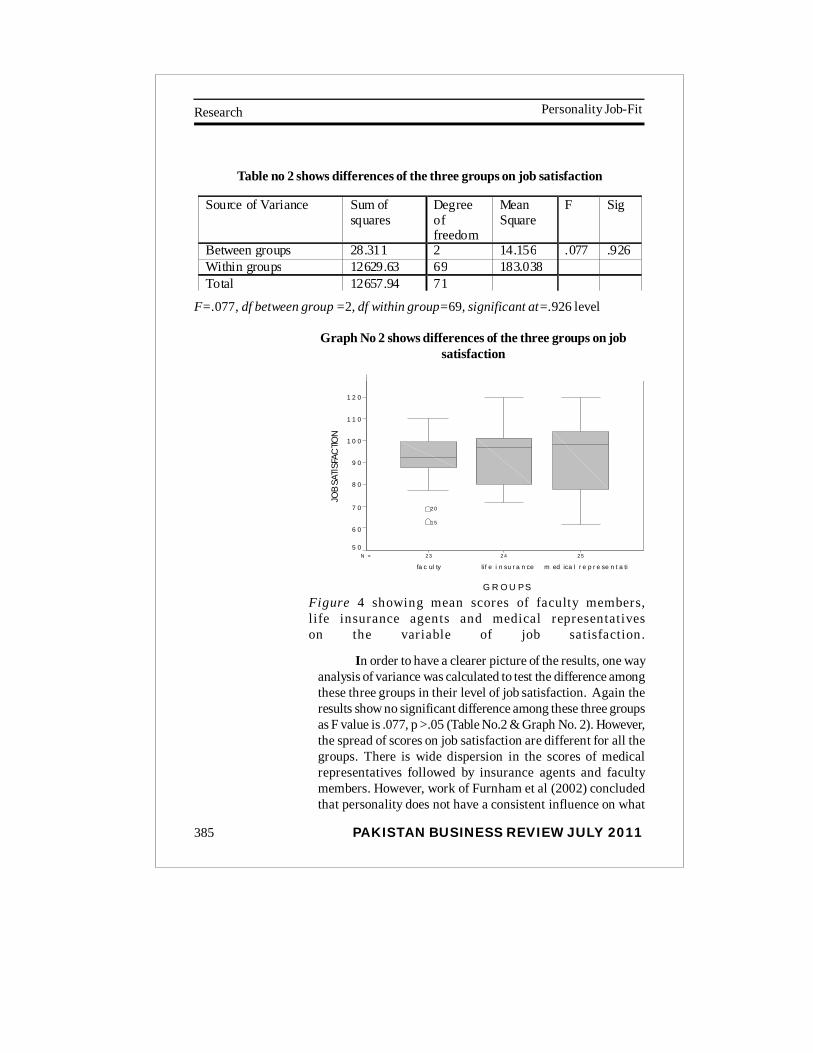
PAKISTAN BUSINESS REVIEW JULY 2011
Personality Job-FitResearch
385
Table no 2 shows differences of the three groups on job satisfaction
Source of Variance Sum of squares
Degree of freedom
Mean Square
F Sig
Between groups 28.311 2 14.156 .077 .926 Within groups 12629.63 69 183.038 Total 12657.94 71
F=.077, df between group =2, df within group=69, significant at=.926 level
Graph No 2 shows differences of the three groups on jobsatisfaction
252423N =
G R O U PS
m ed ica l r e p r e se n t a tilif e i n su r a n cefa c ul ty
JOB
SATI
SFAC
TION
1 2 0
1 1 0
1 0 0
9 0
8 0
7 0
6 0
5 0
20
15
Figure 4 showing mean scores of faculty members,life insurance agents and medical representativeson the variable of job satisfaction.
In order to have a clearer picture of the results, one wayanalysis of variance was calculated to test the difference amongthese three groups in their level of job satisfaction. Again theresults show no significant difference among these three groupsas F value is .077, p >.05 (Table No.2 & Graph No. 2). However,the spread of scores on job satisfaction are different for all thegroups. There is wide dispersion in the scores of medicalrepresentatives followed by insurance agents and facultymembers. However, work of Furnham et al (2002) concludedthat personality does not have a consistent influence on what
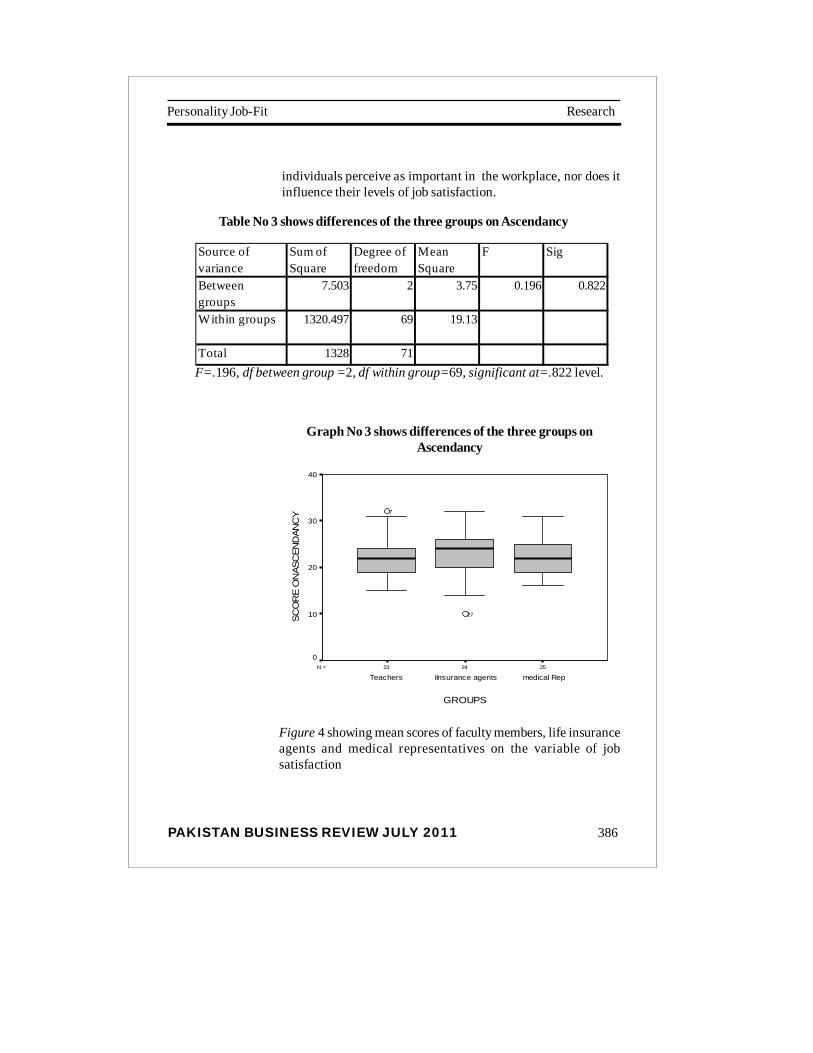
Research
PAKISTAN BUSINESS REVIEW JULY 2011
Personality Job-Fit
386
individuals perceive as important in the workplace, nor does itinfluence their levels of job satisfaction.
Table No 3 shows differences of the three groups on Ascendancy
Source of variance
Sum of Square
Degree of freedom
Mean Square
F Sig
Between groups
7.503 2 3.75 0.196 0.822
Within groups 1320.497 69 19.13
Total 1328 71F=.196, df between group =2, df within group=69, significant at=.822 level.
Graph No 3 shows differences of the three groups onAscendancy
252423N =
GROUPS
medical Rep iInsurance agentsTeachers
SCO
RE
ON
ASC
END
ANC
Y
40
30
20
10
0
27
7
Figure 4 showing mean scores of faculty members, life insuranceagents and medical representatives on the variable of jobsatisfaction
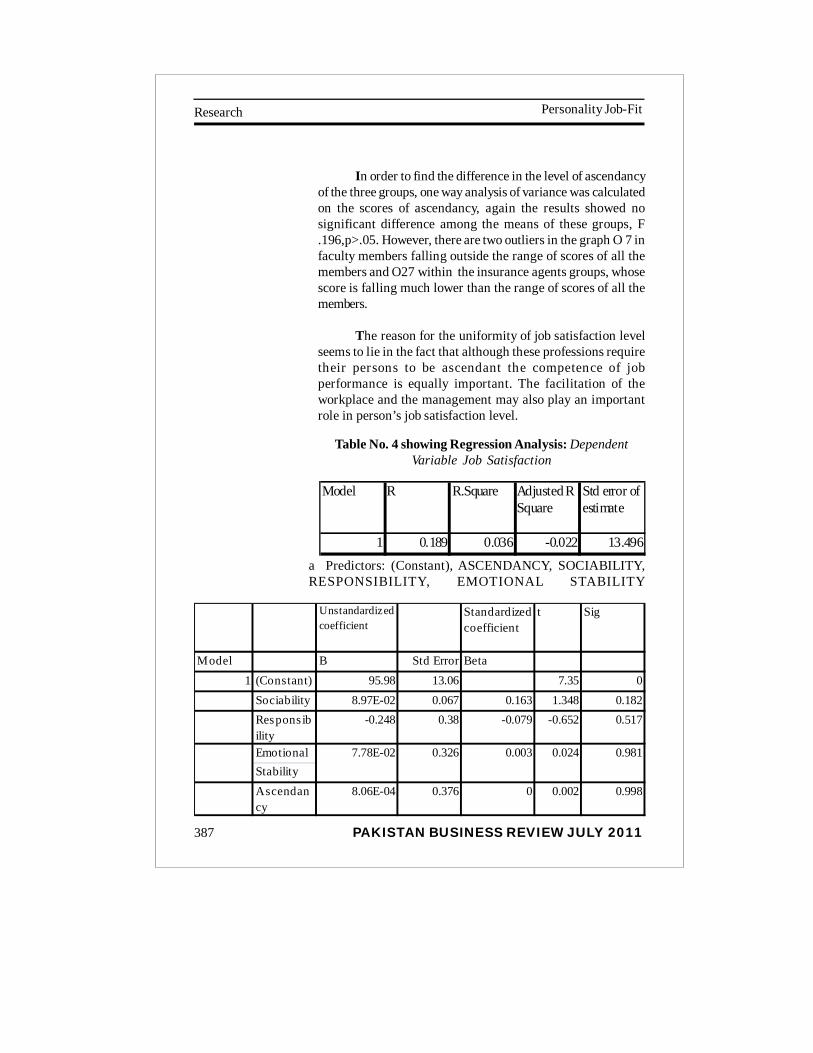
PAKISTAN BUSINESS REVIEW JULY 2011
Personality Job-FitResearch
387
In order to find the difference in the level of ascendancyof the three groups, one way analysis of variance was calculatedon the scores of ascendancy, again the results showed nosignificant difference among the means of these groups, F.196,p>.05. However, there are two outliers in the graph O 7 infaculty members falling outside the range of scores of all themembers and O27 within the insurance agents groups, whosescore is falling much lower than the range of scores of all themembers.
The reason for the uniformity of job satisfaction levelseems to lie in the fact that although these professions requiretheir persons to be ascendant the competence of jobperformance is equally important. The facilitation of theworkplace and the management may also play an importantrole in person’s job satisfaction level.
Table No. 4 showing Regression Analysis: DependentVariable Job Satisfaction
Model R R.Square Adjusted R Square
Std error of estimate
1 0.189 0.036 -0.022 13.496a Predictors: (Constant), ASCENDANCY, SOCIABILITY,RESPONSIBILITY, EMOTIONAL STABILITY
Unstandardized coefficient
Standardized coefficient
t Sig
Model B Std Error Beta1 (Constant) 95.98 13.06 7.35 0
Sociability 8.97E-02 0.067 0.163 1.348 0.182Respons ibility
-0.248 0.38 -0.079 -0.652 0.517
EmotionalStabilityAscendancy
8.06E-04 0.376 0 0.002 0.998
0.9817.78E-02 0.326 0.003 0.024

Research
PAKISTAN BUSINESS REVIEW JULY 2011
Personality Job-Fit
388
In order to further ascertain the determinants of jobsatisfaction, some other traits of personality were rated by thesame respondents namely, responsibility, emotional stabilityand sociability, the other three traits were measured by GordonPersonal Profile. In order to find out which of these variables isa determinant of job satisfaction, Regression analysis wasundertaken. Results reveal that none of the factors aresignificant determinants of job satisfaction.
Results of exploratory factors reveal that mean scoreson responsibility were highest followed by emotional stabilityand sociability.(Table No. 4 ).
People may report job satisfaction because they performtheir job with responsibility, as has been reported by Kujawski(1963). While measuring predictive validity, he administeredGordon Personal Profile to 97 personnel in the sales departmentover the period of one year, and they were rated by their dealersalesmen. Scores reveal high correlation for responsibility andemotional stability i.e,.43** and.33** respectively.
Though a group of researchers support personality andsatisfaction relationship at work, another body of researchesdispute this. Filan, et al (1986) related job satisfaction topsychological variables such as perception, responsibility andlocus of control, whereas, Harnish and Creamer (1985, 1986)disregarded these variables. However, Eric digest (1988) reportedthat job satisfaction is related to both individual and workconditions. Different scales use different approaches tosatisfaction.
With regard to the present research, it is suggested thatif the obtained results are supplemented with some kind ofperformance rating, the conclusions would be different. Theexploration of working conditions or hygienic factors shouldbe looked into as a correlate of job satisfaction.** highly significant correlation
Moreover, high scores on emotional stability also enablepeople to stick to their jobs despite difficulties their higher
PAKISTAN BUSINESS REVIEW JULY 2011
Personality Job-FitResearch
389
emotional stability allows them to face problems at theworkplace effectively.In addition to having attitudes about their jobs as a whole,people can have attitudes about various aspects of their jobssuch as their performance, however, the direction of influencebetween the personaliy and job satisfaction could be reversed:job performance may lead to job satisfaction.
Furthermore, other than these personal factors certainenvironmental factors like the unstable economy and extremecompetitiveness in the market require workers to be moreresponsible.
Conclusion:
The study was conducted to assess the relationshipbetween job satisfaction and personality traits. It washypothesized that individuals scoring high on ascendancywould score high on job satisfaction as they belong to jobswhich require them to be ascendant, like faculty members,insurance agents and medical representatives. Results revealedinsignificant very weak and inverse correlation between thevariables of ascendancy and job satisfaction (p>.05). Analysisof variance among all three groups for the variables ofascendancy and job satisfaction also appear insignificant(p>.05). In order to make the results conclusive, other variables,like working conditions or perception of work are to beincorporated into the future research.
Limitations:
1.The limitations of present research are that the study wasconducted on a limited sample, since medical representativesand insurance agents are in the field; it was not possible toaccess them easily.2. The study included only personality variables as a correlateof job satisfaction. If some other variables like workingconditions, intrinsic factors and some positive psychologicalattributes had been studied, the resultant picture would havebeen clearer.
Research
PAKISTAN BUSINESS REVIEW JULY 2011
Personality Job-Fit
390
References:
Blakely, G. L., Andrews, M. C., & Fuller, J. (2003). Are chameleonsgood citizens? A longitudinal study of the relationship betweenself-monitoring and organizational citizenship behavior.Journal of Business and Psychology, 18 , 131–144.
Cook, J. R. and Brown, B. L. (1995 ... presented in Division 14(SIOP) at the One-Hundred and Twelfth Annual Convention... Paper presented at the Eightieth Annual Conventionwww3.interscience.wiley.com/resolve/doi?DOI=10.1111/j.1365-2834.2010.01066. . www.jostor.org
Connolly J.J. & Viswesvaran C. (2000) The role of affectivity injob satisfaction: a meta-analysis. Personality and IndividualDifference. 265–281. www3.interscience.wiley.com/resolve/doi?DOI=10.1111/j.1365-2834.2010.01066.
Dorman,C. & Zapf,D.(2001). Job- Satisfaction , A Meta-analysisof Stabilities. Journal of Organiztional Behavior, vol 22,No5.pp483-504. John Wiley & Sons. www.jostor.org
Filan, Gary L.; Okun, Morris A.; and Witter, Robert A. “Influenceof Ascribed and Achieved Social Statuses, Values, and Rewardson Job Satisfaction among Community College Faculty.”Community/Junior College Quarterly of Research andPractice: v10 n2 p113-122 www.ericdigests.org/pre-929/job.htm May 2010
Furnham, A, Petrides, KV, Jackson, CJ and Cotter, T (2002) Dopersonality factors predict job satisfaction? Personality andIndividual Differences,33,8:1325-1342.www.espace.library.uq.edu.au/view/UQ:63035 May 2010
Ganguli H. C., 1954. Job Satisfaction Scales for EffectiveManagement Manual for Managers and Social Scientists. NewDelhi. Ashok Kumar Mittal Concept Publishing Company.
PAKISTAN BUSINESS REVIEW JULY 2011
Personality Job-FitResearch
391
Gordon,L.V. (1963) Gordon Personal Profile. US ArmyPersonnel Research office 1963.
Hallberg U.E., Johansson G. & Schaufeli W.B. (2007) Type ABehavior and Work situations: Associations with Burnoutand Work Engagement. Scandinavian Journal of Psychology48,135–142.
Harnish, D; Creamer, D.G.(1985-86). “Faculty Stagnation andDiminished Job Involvement.” Community College Review;vol,13. No.3, p.33-39, Winter 1985-86. www.ericdigests.org/pre-929/job.htm May 2010-08-09
Hoppock,R.(1963). Occupational Information (2nd ed) London, Central Book. www.aabri.com/ manuscript10470pdf.
Houtman I., Kornitzer M., De Smet P. et al. (1999) The jobstress, absenteeism and coronary heart disease Europeancooperative study (the JACE-study)-design of a multicenterprospectivestudy. European Journal of Public Health 9, 52–57.
Hulin,C.L (1991) Adaptation, Persistence, and Commitment inorganizations. In Handbook of Industrial and OrgaizationalPsychology,vol2, Dunnette MD.Hough Lm (eds) ConsultingPsychologists Press: Palo Al to, C;445-505.www3.interscience.wiley.com/resolve/doi?DOI=10.1111/j.1365-2834.2010.01066. . www.jstor.org May 2010
Jenkins,s.r.& Maslach,C.(1994) Psychological Health andInvolvement in Interpersonally Demanding Occupations: ALongitudinal Perspective, Journal of OrganizationalBehaviour.
Judge T.A., Heller D. & Mount M.K. (2002) Five-factor model ofpersonality and job satisfaction: a meta-analysis. JournalofAppliedPsychology87,530–541. www3.interscience.wiley.com/
Research
PAKISTAN BUSINESS REVIEW JULY 2011
Personality Job-Fit
392
resolve/doi?DOI=10.1111/j.1365-2834.2010.01066. www.jostor.orgMay 2010
Kujawsaki (1963). In Gordon,L.V.(1963) Gordon PersonalProfile. US Army Personnel Research Office 1963.
Landy,E.J.(1978) Opponent Process Theory of Job Satisfaction,Journal of Applied Psychology.1978,63.533-547.
LePine,J.A,; Colquitt,J.A.& Eraz,A.(2000).Adaptability tochanging Task Contents: Effects of General cognitive ability,conscientiousness, openness to experience. PersonnelPsychology, 33 pp.563-595. In Robins.S.P., Judge.T,A.,&Sanghi,.S.(2009).Organizational Behavior 13thed. Prentice Hall.Pearson Education Inc. India.
Lovelace,K.,& Rosen,B.(1996). Differences in achieving person–organization fit among diverse groups of managers. Journalof Management ,22,703-722. In Vilela González and FerrínSalespersons’ Self-Monitoring: Direct, Indirect, andModerating Effects on Salespersons’ Organizat ionalCitizenship Behavior. Psychology & Marketing, Vol. 27(1): 71–89 (January 2010)Published online in Wiley InterScience(www.interscience.wiley.com) © 2009 Wiley Periodicals, Inc.DOI: 10.1002/mar.20320, May 2010
Maslach C., Schaufeli W.B. & Leiter M.P. (2001) Job Burnout.Annual Review of Psychology 52, 397–422.www3.interscience.wiley.com/resolve/doi?DOI=10.1111/j.1365-2834.2010.01066. May 2010
McClelland and DC.(1961). The Achieving Society. NewYork,Van Norstrand.
Shartle,C.L,(1952) Occupational Information, NewYork,Prentice Hall.

PAKISTAN BUSINESS REVIEW JULY 2011
Personality Job-FitResearch
393
Shimizutani M., Odagiri Y., Ohya Y. et al. (2008) Relationshipof nurse burnout with personality characteristics and copingbehaviours. Industrial Health 46, 326–335.
Veroff, J.& Feld,S.C. (1970). Mar r iage and Work .America.NewYork:Van Norstrand, Reinhold.
Watson D., Suls J. & Haig J. (2002) Global self-esteem inrelation to structural models of personality and affectivity.Journal of Personality and Social Psychology 83, 185–197.www3.interscience.wiley.com/resolve/doi?DOI=10.1111/j.13652834.2010.01066. May 2010
Weiss H.M. & Cropanzano R. (1996) Effective Events Theory:atheoretical discussion on the structure, causes andconsequences of affective experiences at work. In Researchin Organisational Behaviour (B. Staw & L. Cummings eds),pp. 1–74, JAI Press, Greenwich, CT. . www.jstor.org May 2010
PAKISTAN BUSINESS REVIEW JULY 2011
Business Intelligence: A New Dimension to Business Market Report
394
BUSINESS INTELLIGENCE:A NEW DIMENSION TO
BUSINESSAzimuddin KhanKarunesh Saxena
Faculty of Management StudiesM L Sukhadia University, Udaipur (India).
Abstract
Due to numerous factors such as global competition,technological breakthroughs, changing regulatory requirements,customer expectation, structural changes, environmentalconcerns and also the impact of economic recession, businessorganizations are compelled to reshape and restructure theirbusiness processes.
Due to the fiercely competitive environment and also high stakesof making wrong decision, it has become inevitable to designand implement Business Intelligence solutions which proved tobe immensely beneficial in decision making.
An attempt has been made in this paper to develop the conceptualframework pertaining to Business Intelligence and also to discussits application, decision making as well as to analyze itssignificance in creating business value.
Keywords: Business Intelligence, Data Warehouse, ETL,Dashboard, Reporting and Querying.
JEL Classification: A19, D78, D79, O29
PAKISTAN BUSINESS REVIEW JULY 2011
Business Intelligence: A New Dimension to BusinessMarket Report
395
1. Introduction
Today, organizations have lots of data and availablesystems but they are not effective at turning all that data intouseful strategic information. Over the past two decades,companies have gathered tons and tons of data about theiroperation. Information is said to double every 18 months. Mostorganizations are faced with information crises because theavailable data is not readily usable for strategic decision making.These large quantities of data are very useful and good forrunning the business operations, but hardly acquiescent for usein making decisions about business strategies and objectives.This happens due to spread of data across many types ofincompatible structures and systems. Sales and marketing datais lying with newly developed systems whereas financial andaccounting data be kept with old legacy systems, while materialand inventory data is collected through client server application.Another problem which exists with data is that availableoperational data cannot be readily used to spot trends.Operational data is event driven. The data in organizations residesin various disparate systems, multiple platforms, and diversestructures. For proper decision making on overall corporatestrategies and objectives, the organization has to integrateinformation from all the systems. Managers should be in aposition to review the sales by product, sales person, district,region, and customer group.
2. Concept of Business Intelligence (BI)
Business Intelligence is the process of gettinginformation about the business from available data sources. Thesesystems are essential for organizations to keep track of theiraffairs. Data becomes information when you can use it to answerbusiness questions, so you can understand business better.Business Intelligence allows you to answer the questions, sothat executives and managers at all levels can respond quicklyto changes in the business.
PAKISTAN BUSINESS REVIEW JULY 2011
Business Intelligence: A New Dimension to Business Market Report
396
Business Intelligence can provide answers to thefollowing questions:
• What happened?o What are my five top selling products?
• What is happening?o How do my sales this year compare to last year?
• Why did it happen?o Why are sales down in this region?
• What will happen?o What can we predict the sales of the nextquarter to be?
• What do I want to happen?o How will our margins improve if we run this promotion?
Business intelligence starts with day to day informationthat organizations need to run the business and assist to takecorrect decisions based on facts at the right time and at the rightplace through out the life of the business by doing businessanalytics.
According to Devenport and Harris (2007), BusinessIntelligence (BI) is required to encompass analytics as well as theprocesses and technologies used for collecting, managing, andreporting decision-oriented data and information. The BusinessIntelligence architecture (a subset of overall IT architecture) is anumbrella term for an enterprise-wide set of systems, applications,and governance processes that enable sophisticated analytics,by allowing data, content, and analysis to flow to those whoneed them, when they need them. Top management, unit heads,functional heads, knowledge workers, and business analysts allneed such information in various forms at various times to takedecisions.
Mike Steadman (2003) defined Business Intelligence asthe act of capturing raw data, then transforming and combiningthat data into information that can be proactively used to improve
PAKISTAN BUSINESS REVIEW JULY 2011
Business Intelligence: A New Dimension to BusinessMarket Report
397
business. The goal of BI is to empower decision makers, allowingthem to make better and faster decisions.
As per Wikipedia, Business Analytics (BA) to the setof skills, technologies, applications and practices for continuousiterative exploration and investigation of past businessperformance to gain insight into and drive business planning.Analytics are a subset of business intelligence, a set oftechnologies and processes that use data to understand andanalyze business performance. Analytics is a critical componentof business intelligence, one that delivers the ability to derivemore value from data and answer the more challenging questions.
Analytics enables us to make smart business decisionswhich provide a competitive advantage to leading organizationsacross the industry. Analytics such as statistical analysis,forecasting, predictive modeling and optimization, providesactionable intelligence and insight to support the changing needof the organization. It provide confidence to the business withmaximum efficiency and effectiveness, supporting continuouslearning and improvement for developing a sustainablecompetitive edge.
Strategic BI is to align multiple business processes withkey business objectives through integrated performancemanagement and analysis. The emphasis is on achieving longterm, strategic goals like increasing revenues, cost controls,increasing market share and profitability with the improvementof customer satisfaction. Top level management uses BusinessIntelligence to asses the company’s key performance indicators(KPI) in terms of targets. It also provides in depth analytics totake corrective action if it is not achieved. This type of analysisis based on time series data. Strategic business intelligence, isalso called performance management (PM) with other prefixeslike corporate performance management (CPM), enterpriseperformance management (EPM) or business performancemanagement (BPM).
PAKISTAN BUSINESS REVIEW JULY 2011
Business Intelligence: A New Dimension to Business Market Report
398
Tactical BI is to optimize business processes byidentifying trends, anomalies, and behaviors for initiatingappropriate management action at the right time. Tactical use ofBusiness Intelligence addresses short term goals such asmarketing campaigns, introduction of new products, pricing,buying of raw material, production scheduling and managementof funds. The analysis is based on weekly or monthly data. It isused to predict business trends, provide periodic comparativestudy of sales and expenses, need for inventory to meet expecteddemands, advertisement schedules etc.
Operational BI is a means for helping businesses to makemore informed decisions and take more effective action in theirdaily business operations. Operational Business Intelligenceprovides analytics based on real time, low latency and historicaldata to the operation managers. It can be used in reducing fraud,decreasing loan processing times, optimizing pricing, monitoringcurrent campaign, checking order status etc. It helps employeesto make knowledgeable decisions before their daily problemsbecome corporate disasters. Colin White (2009) noted that“Competitive pressures … are forcing companies to react fasterto changing business conditions and customer requirements. Asa result, there is now a need to use Business Intelligence to helpdrive and optimize business operations on a daily basis and, insome cases, even for intra-day decision making. This type of BI isusually called operational business intelligence. The objective ofoperational BI is to make more timely business decisions.
3. Applications of Business Intelligence
Companies like Netflix, Google, CEMEX, Proctor andGamble, Amazon.com, Wal-Mart, Fed ex, Capital One have showntheir presence as the best and fast growing companies. There totake decisions are based on analytics by extensive use of data,statistical and quantitative analysis, predictive modeling,forecasting, optimization and simulation techniques. In India,Business Intelligence Implementation is at its initial stage but alead has been taken by banking, financial services and insurance(BFSI) sector companies. ICICI, IDBI, Standard Chartered Bank(SCB) and Max New York Life are the companies which havetaken the lead in implementing Business Intelligence. Industries
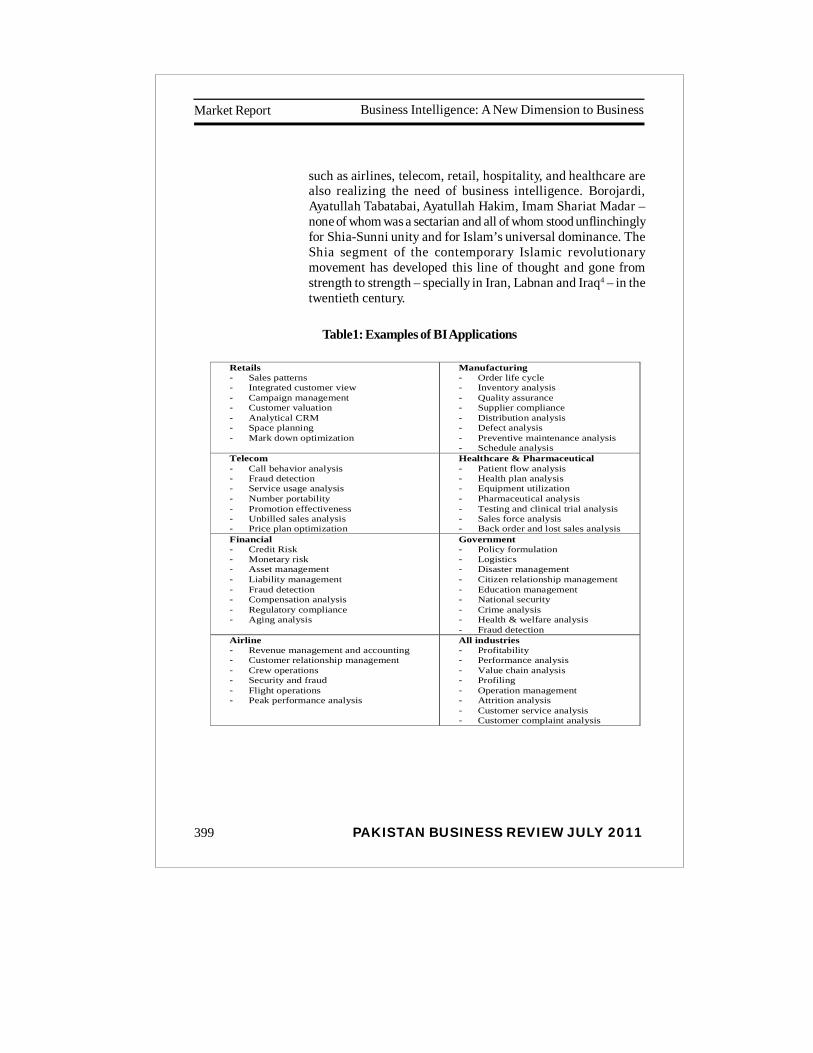
PAKISTAN BUSINESS REVIEW JULY 2011
Business Intelligence: A New Dimension to BusinessMarket Report
399
such as airlines, telecom, retail, hospitality, and healthcare arealso realizing the need of business intelligence. Borojardi,Ayatullah Tabatabai, Ayatullah Hakim, Imam Shariat Madar –none of whom was a sectarian and all of whom stood unflinchinglyfor Shia-Sunni unity and for Islam’s universal dominance. TheShia segment of the contemporary Islamic revolutionarymovement has developed this line of thought and gone fromstrength to strength – specially in Iran, Labnan and Iraq4 – in thetwentieth century.
Retails - Sales patterns - Integrated customer view - Campaign management - Customer valuation - Analytical CRM - Space planning - Mark down optimization
Manufacturing - Order life cycle - Inventory analysis - Quality assurance - Supplier compliance - Distribution analysis - Defect analysis - Preventive maintenance analysis - Schedule analysis
Telecom - Call behavior analysis - Fraud detection - Service usage analysis - Number portability - Promotion effectiveness - Unbilled sales analysis - Price plan optimization
Healthcare & Pharmaceutical - Patient flow analysis - Health plan analysis - Equipment utilization - Pharmaceutical analysis - Testing and clinical trial analysis - Sales force analysis - Back order and lost sales analysis
Financial - Credit Risk - Monetary risk - Asset management - Liability management - Fraud detection - Compensation analysis - Regulatory compliance - Aging analysis
Government - Policy formulation - Logistics - Disaster management - Citizen relationship management - Education management - National security - Crime analysis - Health & welfare analysis - Fraud detection
Airline - Revenue management and accounting - Customer relationship management - Crew operations - Security and fraud - Flight operations - Peak performance analysis
All industries - Profitability - Performance analysis - Value chain analysis - Profiling - Operation management - Attrition analysis - Customer service analysis - Customer complaint analysis
Table1: Examples of BI Applications
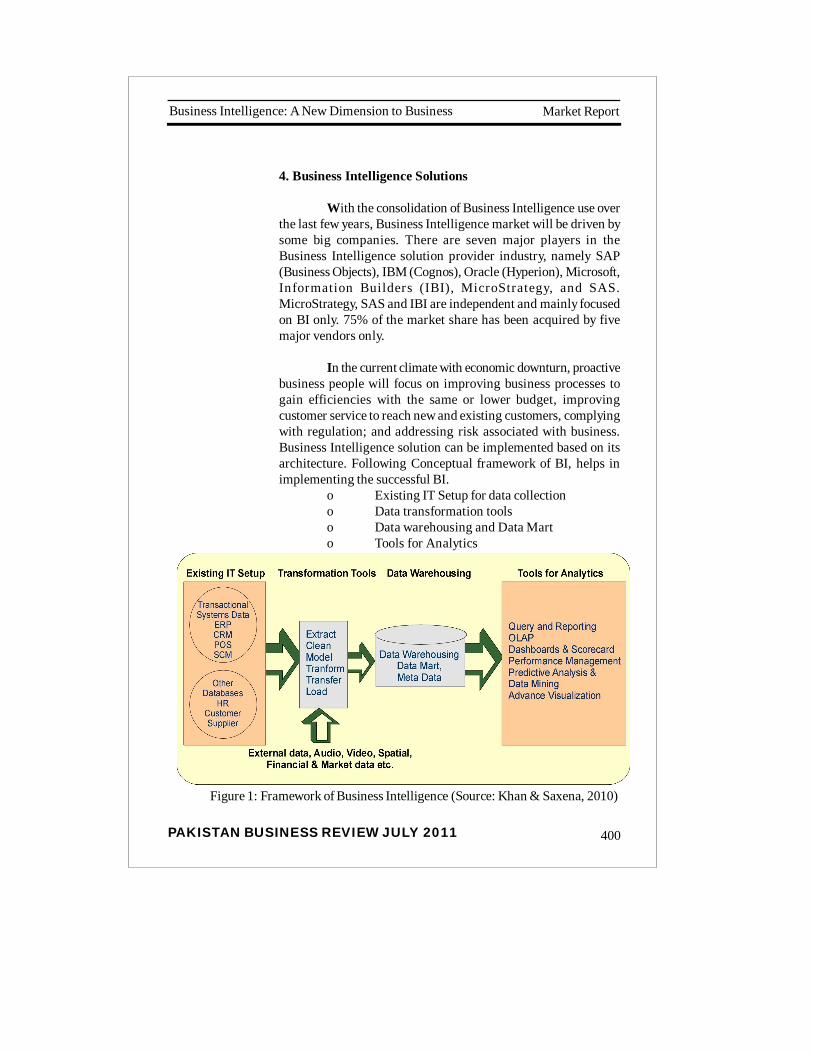
PAKISTAN BUSINESS REVIEW JULY 2011
Business Intelligence: A New Dimension to Business Market Report
400
4. Business Intelligence Solutions
With the consolidation of Business Intelligence use overthe last few years, Business Intelligence market will be driven bysome big companies. There are seven major players in theBusiness Intelligence solution provider industry, namely SAP(Business Objects), IBM (Cognos), Oracle (Hyperion), Microsoft,Information Builders (IBI), MicroStrategy, and SAS.MicroStrategy, SAS and IBI are independent and mainly focusedon BI only. 75% of the market share has been acquired by fivemajor vendors only.
In the current climate with economic downturn, proactivebusiness people will focus on improving business processes togain efficiencies with the same or lower budget, improvingcustomer service to reach new and existing customers, complyingwith regulation; and addressing risk associated with business.Business Intelligence solution can be implemented based on itsarchitecture. Following Conceptual framework of BI, helps inimplementing the successful BI.
o Existing IT Setup for data collectiono Data transformation toolso Data warehousing and Data Marto Tools for Analytics
Figure 1: Framework of Business Intelligence (Source: Khan & Saxena, 2010)
PAKISTAN BUSINESS REVIEW JULY 2011
Business Intelligence: A New Dimension to BusinessMarket Report
401
We must begin by defining and designing datamanagement strategy to ensure that the organization has theright information and uses it properly. The challenge is to collectclean data, from various sources so that BI solutions deliver thecorrect actionable information to management at different levels.The organization should concentrate on quality of data, andinvestment must be made to ensure high levels of data quality.The duplicate data should be unified as it comes from varioussources. The data coming from the transaction system is atomiclevel data and should be recorded in detailed form.
The integration of data is important as it is generatedby various operational systems with different namingconventions, attributes, codes, business rules and measurement.Inconsistencies have to be removed by standardized variousdata elements. The data should be distributable among varioususers at various levels located at different locations.
Most companies don’t have a precise view about theircustomers, products, suppliers, inventory or even employees.Whenever organizations add new enterprise applications to“manage” data, they unwittingly contribute to an overallconfusion about an organization’s overall view of the enterprise.As a result, the concept of master data management (MDM),creating a single, unified view of an organization is growing inimportance now a days.
Data transformation is one of the most important stages,where the data coming from various sources gets into the datawarehouse after going through the various stages of datacleansing. It is necessary to first clean and validate data usingbusiness rules through data cleansing tools. Transformationprocedure defines business logics which maps data from itssource to destination. ETL (Extract, Transfer and Load) tools arevery mature and helpful for reducing the development time,managing the flow of data from source to destination anduploading data to the tables of data warehouse. ETL tools canassist in ensuring that data is cleansed and conforms tostandards before entering into the data warehouse. The ETLprocesses consist of the following steps:
PAKISTAN BUSINESS REVIEW JULY 2011
Business Intelligence: A New Dimension to Business Market Report
402
Initiation - Building reference data – Extract from sources– Validate – Transform – Load into stages tables – Audit reports– Publish – Achieve - Cleanup
Effective data ETL processes represent the number onesuccess factor for data warehouse projects and consume 70% ofthe total time spent on the project. Data extraction also takes timedepending on the complexity of source systems. The dataextraction strategy can be defined by considering sourcesidentification, extraction method (manual or tool based), extractionfrequency (daily, weekly, quarterly etc.), time window for extractionprocess, and job sequencing and exception handling for inputrecords that cannot be extracted.
Inmon (1995) defined a data warehouse as a centralizedrepository (collection of resources that can be accessed to retrieveinformation) of an organization’s electronically stored data,designed to facilitate reporting and analysis. Inmon (1995) is oneof the leading proponents of the top-down approach to datawarehouse design, in which the data warehouse is designed usinga normalized enterprise data model. A data warehouse is a subject-oriented, integrated, time-variant and non-volatile collection ofdata in support of management’s decision making process. Thetop-down design methodology generates highly consistentdimensional views of data across data marts since all data martsare loaded from the centralized repository and also proven to berobust against business changes. Generating new dimensionaldata marts against the data stored in the data warehouse is arelatively simple task. The main disadvantage to the top-downmethodology is that it represents a very large project with a verybroad scope.
Kimball (2002) has given the bottom-up approach wheredata marts are first created to provide reporting and analyticalcapabilities for specific business processes. Data marts contain,primarily, dimensions and facts. Facts can contain either atomicdata and, if necessary, summarized data. The single data martoften models a specific business area such as sales or production.These data marts can eventually be integrated to create acomprehensive data warehouse.

PAKISTAN BUSINESS REVIEW JULY 2011
Business Intelligence: A New Dimension to BusinessMarket Report
403
Data Mart: To improve the query performance, apartitioned sector of the overall data warehouse is known asData Mart. The emphasis of a data mart is on meeting the specificdemands of a particular group of knowledge users in terms ofanalysis, content, presentation, and ease-of-use. Data marts aredesigned to support business function like sales, marketing,finance, inventory, HR, production etc. In general, a datawarehouse tends to be a strategic but somewhat unfinishedconcept; a data mart tends to be tactical and aimed at meeting animmediate need.
Meta Data: Meta Data is the data about data. It isbasically a data dictionary which acts as the glue that connectsall the part of the data warehouse. Metadata can be stored andmanaged in a database, often called a registry or repository. Itprovides information about the contents and structures of data,such as means of creation, purpose of the data, time and date ofcreation, creator or author of data, placement on a network(electronic form) where the data was created, what standardsused etc.
Organizations are increasingly using of businessintelligence to identify cost saving opportunities and to improvequality of products and services as a way to beating thecompetition. There are many categories of tools available in theBusiness Intelligence market from simple query and reporting tocomplex performance management and advanced visualizationsystems. Business Intelligence vendors are now alsoconsolidating tools in every category to provide completebusiness intelligence solutions to companies.
However, some organizations still prefer to have a ‘bestof bread’ strategy in which they select Business Intelligencetools in each category from different vendors.
i. Query & Reporting:
It is the process of putting a query to database, thenformatting it to create a report. There are two types of reporting,
PAKISTAN BUSINESS REVIEW JULY 2011
Business Intelligence: A New Dimension to Business Market Report
404
one is “Production Reporting” and the other is “Business Queryand Reporting”.ii. Online Analytical Processing:
The objective of Online Analytical Processing (OLAP)is to promote information based insight and understanding byproviding decision makers with information they need quickly,and in the form they want it. An OLAP allows manager to tailortheir information and knowledge requirements by discriminatingaccording to user defined criteria by making comparisons,analyzing trends based on past and current data. Online AnalyticalProcessing is a category of software tools that provides analysisof data stored in a database. The OLAP cube consists of numericfacts called measures which are categorized by dimensions.Measures are derived from the records in the fact table anddimensions are derived from the dimension tables.
According to industry visualization expert Stephen Few(2006), a dashboard is a visual display of the mostimportant information needed to achieve one or moreobjectives; consolidated and arranged on single screenso the information can be monitored at a glance. Thesetools can display multiple objects by connecting frommultiple data sources. These tools provide the userspecific dashboard at all the three hierarchical levels ofthe organization by combining ease of use withmeaningful information.
Scorecards are a management system that enablesorganization to set, track, and achieve key businessstrategies and objectives. It has four businessperspectives Customer (e.g. Customer satisfaction),Financial (Operating income and cash flow), Internalbusiness process (Productivity) and Learning & Growth(No of training Hours). It focuses on metrics andcompares it with targets. It also generates alerts whenpotential problems arise, analyzes the root cause ofproblems by exploring relevant information in detail andallows the user to take corrective action. The scorecardallows a user to answer the question: “How does my

PAKISTAN BUSINESS REVIEW JULY 2011
Business Intelligence: A New Dimension to BusinessMarket Report
405
goal support the corporate strategy?” Scorecardsenable an organization to improve processes and reducecost by aligning strategy, plans, targets, and forecastsby creating a consolidated, strategic view of existingdata.
Performance Management is involved with monitoringand managing an organization’s performance, accordingto key performance indicators such as revenue, returnon investment, overhead, and operational costs. Theseapplications include budgeting, planning and financialconsolidation. Performance Management may be relatedto workforce planning, supply chain optimization,capacity planning etc. other than finance. Craig Schiff(2007) stated that performance management is reallyabout the business process that enables a business toset strategic goals and measure how successfully it isperforming in terms of its objectives. The technologythat supports these processes include BPM packagedapplications such as budgeting, planning, andconsolidation, as well as BI tools such as ETL, Queryand Report, and OLAP cubes.
Predictive Analytics and Data Mining provide highlyspecialized functionality for statisticians and skilledsenior analyst to find the pattern in data and generatestatistical models and rules. These tools are based onneural network, decision tree, artificial intelligence,Bayesian network theory, and statistics.
Predictive analytics is an area of statistical analysisthat deals with extracting information from data andusing it to predict future trends and behavior patterns.The core of predictive analytics relies in capturingrelationships between explanatory variables andpredicted variables from past occurrences, andexploiting it to predict future outcomes. The accuracyand usability of results will depend greatly on the levelof Business and Data Understanding of the user.

PAKISTAN BUSINESS REVIEW JULY 2011
Business Intelligence: A New Dimension to Business Market Report
406
Data mining is the technology for the extraction of hiddenpredictive information from large databases, with greatpotential to help companies focus on the most importantinformation in their data warehouses. Data mining is morepopular in strong consumer focused organizations suchas retail, financial, communication, and marketing firms.It enables these organizations to determine relationshipsamong “internal” factors such as price, productpositioning, or staff skills, and “external” factors suchas economic indicators, competition, and customerdemographics and enables them to determine the impacton sales, customer satisfaction, and corporate profits.
Advanced visualization and discovery tools often usean in memory architecture to provide highly interactivedashboards. Advanced visualization and discovery, areinteractive ways of working with the data. Withadvanced visualization, the visualization and queryprocess is one and the same. It’s much more exploratory.
The “in memory technologies” basically load data fromsources into the memory of the computer they arerunning on, rather than landing or reading data to thedisk as is done in other business intelligence tools. Itprovides nearly instantaneous response times to userqueries. These tools provide the business user to seethe data in graphical form including representation ofdata in heat maps, histograms, waterfall charts,decomposition trees, geographic maps, spark lines, andbullet graph etc.
5. Business Value of Business Intelligence
In the 1990s, most business reports were developed byIT departments, even though the implementation of ERP, SCMand CRM was started by the organization at get the benefits oftransactional efficiency, process improvements and integration,process automation, better control over day to day operation,and information availability across the organization on reducedcost and time. These systems had generated huge volumes of
PAKISTAN BUSINESS REVIEW JULY 2011
Business Intelligence: A New Dimension to BusinessMarket Report
407
data which were stored in the newly developed concept of datawarehousing. With the attainment of maturity Data Warehousing,organizations were able to collects good quality transactionaldata, which in turn, initiated the concept of business intelligencetools where business reports were developed by business usersin place of IT.
Business Intelligence can empower people to make theirdecisions effective and correct. It can deliver many tangible andintangible benefits to the organization. These include.
- Alignment of an organization around a set of KeyPerformance Indicators (KPIs) & Metrics and generategraphical presentation
- Better strategies and plans- Respond faster to new opportunities and changing
demands- Timely and accurate data helps to identify and quickly
address inefficiencies- Improve productivity by reducing the decision making
cycle time- Reduce costs by minimizing the time required to collect
data- Optimize customer relationships and increase customer
loyalty- Allows organizations to monitor competitor
information, giving extra edge needed to stay ahead- Supports interactive exploration across multiple
dimensions of business- Helps to identify the issues that fall outside norms and
signals potential problem- Supports what-if analysis to model the operational and
financial impact of multiple scenarios on revenue, costand cash flow
- Provides the predictive analysis based on the currentand past data
PAKISTAN BUSINESS REVIEW JULY 2011
Business Intelligence: A New Dimension to Business Market Report
408
A structured approach should be used to capture thebusiness value of BI investments by implementing businessintelligence best practices, involvement of top level executiveand IT department, support of finance, engagement of end users,strategic alignment and business process engineering, changemanagement and encouraging the data through out theorganization
More and more organizations are now implementingbusiness intelligence in their IT setup. With the increase in demandof BI, a lot of research is being done to provide ease of use withreduction of cost for its deployment. New initiatives such asMaster Data Management, Customer Data Integration, BusinessProcess Management and Service Oriented Architecture, Softwareas a Service, and Decision Services will enhance BI usage businessintelligence market;
Software as a Service (SaaS) BI is gaining momentum insmall and mid size organization which reduces the cost, complexity,and economies on IT resources and time requirement to implement.Instead of purchasing and implementing BI solutions,organizations are taking services from vendors through secureinternet connection.
With the implementation of business intelligencesolution, organization can generate actionable information byutilizing various analytics. Dashboard and Scorecard are the besttools to visualize the organizations performance. Businessintelligence usage increases the business value in terms ofefficiency, cost reduction, margins, profits and customersatisfaction.
PAKISTAN BUSINESS REVIEW JULY 2011
Business Intelligence: A New Dimension to BusinessMarket Report
409
References:
Devenport Thomas H. and Harris Jeanne G, 2007, Competing onAnalytics: The New Science of Winning, Harvard BusinessSchool Press, 2007, p. 155.
Mike Steadman, 2003, Practical Business Intelligence forAssociations & Non Profit Organizations, p. 1-6.
Colin White, 2009, The Evolution of Real-Time BusinessIntelligence, Gravic Inc, p. 12.
Gartner, 2010, RAS Core Research Note G00173700 by JosephFeiman and Neil MacDonald.Khan Azimuddin and Saxena Karunesh, 2010, BusinessIntelligence: How to make Organisations Agile,Indian Management Journal, 49(10).
Inmon, W.H., 1995, What is a Data Warehouse?, Prism Solutions,Volume 1.
Kimball, Ralph and Ross, Margy, 2002, The Data WarehouseToolkit, John Wiley and Sons Inc., Second Edition, p. 16.
Few, Stephen, 2006, Information Dashboard Design: The EffectiveVisual Communication of Data, O’Reilly Media, p. 2-8.
Schiff, Craig, 2007, Fact vs. Fiction in Performance Management,Business Intelligence Network, http://www.b-eye-network.com/view/4452, May 16.
http://en.wikipedia.org/wiki/Predictive_analytics accessed onAugust 10, 2010.
Business Objects, 2008, Query as Web Service, A SAP Company,2008, p. 2.

Conference Report
PAKISTAN BUSINESS REVIEW JULY 2011
Workshop on Environment and Energy: An Overview
410
WORKSHOP ONENVIRONMENT AND
ENERGY:AN OVERVIEW
Shahid AmjadDepartment of Environmental ManagementCollege of Business Management, Karachi
An environment and energy workshop was held atManagement Excellence Center (MEC) Institute of BusinessManagement, Karachi on February 12, 2011. It highlighted thesignificance of environment and the energy sector managementissues in Pakistan. The workshop discussed some of the essentialtools needed by junior level executives, middle level managersand supervisors, to assist them in capacity building and updatingtheir knowledge on conservation of energy as well as preservationof the environment in which they operate. More businesses aremoving towards eco-friendly products and image development.This is imperative as the future investments in Pakistan will mainlybe in the fields of energy, environment conservation andrenewable energy sectors. The competitiveness of organizationsand manufacturing units, that are leaders in conserving energyand operating in an environmentally friendly system, will improvein the global dynamics of the 21st century market place. Theworkshop was intended for graduates with a clear affinity formanagement and/or technology, as well as for decision-makers incompanies, government and non-governmental organizationswho wish to engage in environment and energy management. Anumber of presentations were made by environmental scientistsand energy experts.
Mr. Talib Karim, Rector IoBM, highlighted the role ofIoBM in contributing its share to environmental management.The Institute has succeeded in the disposing off of industrialwaste water from the nearby industrial area that passes near theIoBM campus and drains into the Korangi nala. Plantation oftrees have been initiated in this area to make the IoBMmicroenvironment more pleasing.
PAKISTAN BUSINESS REVIEW JULY 2011
Conference Report Workshop on Environment and Energy: An Overview
411
Dr. Akhlaq Ahmad presented a brief history of theStockholm Conference 1972, establishment of UNEP, TiblisiConference 1977 and UNESCO 1980. The efforts of theseorganizations in the field of environment were highlighted andtheir role was discussed. Environmental codes, standards,legislation, training and monitoring in the field of environmentwere described. The role of Ministry of Housing and Works(Environment and Urban Affairs) and EPA (Federal and Provincial)were also presented.
Dr. Shahid Amjad presented a paper on environmentsector related job opportunities Pakistan spans a remarkablenumber of the world’s broad ecological regions, including morethan five biomes in its land area of over 880,000 km2, these biomesare; the desert biome, temperate grassland biome, tropical forestbiome, mountain biome, Coastal and Marine, Wetlands etc.
Pakistan fauna (as per IUCN Red Book) includes 668birds species (25 threatened), 198 freshwater fish species (29endemic, 1 threatened), over a 1000 species of marine fish. 177reptiles (13 endemic, 6 threatened), and 174 mammals (6 endemic,20 threatened). About 5,700 species of flowering plants have alsobeen identified.
Environmental Issues faced by Pakistan include
• Degradation of soil and issues related to solid wastedisposal.
• Pollution of freshwater, lakes and aquifers• Degraded coastal and marine life.• Air pollution and noise.• Overall negative Impact on the biosphere
Both big industrial estates and small cottage industriesgenerate hazardous and toxic chemicals. The fertilizer plants, textileindustry, glass industry, steel plants etc are major sources ofpollution. They emit SO2, NO2, smoke, volatile organic compounds,chlorine gas, ammonia, CO, CO2, phenol, cyanide and particulatematter, into the atmosphere. Human health is adversely affectedby different-sized airborne particulate matter. Larger particles PM10
Conference Report
PAKISTAN BUSINESS REVIEW JULY 2011
Workshop on Environment and Energy: An Overview
412
are trapped in the nose and throat, whereas smaller particles(PM2.5) penetrate the lungs and are associated with a range ofrespiratory symptoms. In order to create an economy based onsustainable development, interactions of humans and ecosystemsmust be regulated.
Job opportunities identified were:
• After successful completion of environment andenergy management program IoBM graduates willbe able to develop, implement, monitor and evaluateenvironmental and energy management programs,policies and projects.
• Successful graduates will be employed by,multinationals in the private sector. They maybecome consultants for large, small and mediumsized enterprises, or work for governmental or nongovernmental organizations.
• In the public sector, national public authorities, ,larger municipalities’ sewage and water boards mayemploy them.
Mr. Moin Uddin Ali Khan spoke on EnvironmentalImpact Assessment (EIA). EIA is most effective and constructivefor new projects when potential environmental impacts areassessed at the pre-feasibility and feasibility stages. The objectof EIA is to provide for environmental matters to be taken intoaccount in the making of decisions, by all interested parties.
The EIA process involves screening scoping, baselineanalysis , impact prediction, impact mitigation measures,documentation , public hearing, review and decision-making ,and post project monitoring (PPM).
In Pakistan EIA is an upcoming field and there is dearthof environment impact assessors. Also there is a great demandin this field in the Middle East.
PAKISTAN BUSINESS REVIEW JULY 2011
Conference Report Workshop on Environment and Energy: An Overview
413
Syed Nadeem Arif: Director. Environment ManagementConsultants spoke on the Karachi Transportation ImprovementProject. He highlighted current issues related to traffic congestionin Karachi. Mr. Arif is working on a JICA assisted program inassociation with Karachi Mass Transit Cell, CDGK, to identify,alleviate and facilitate movement of public through mass transportschemes. Novel ideas were presented to reduce the trafficcongestion on the streets thereby creating space on roads byattracting greater number of commuters on to mass transit modesof transport. The Karachi Transportation improvement Project(KTIP) is an engineering solution envisaged to implement theKarachi Urban Transport Master Plan (KUTMP). In a preliminarysocial environment study significant issues were addressed thatpertain to the demographic social, cultural and economic aspectsof urban development. Currently more than 60% of air pollutionis caused by the transport sector.
Mr. Akthar Ali energy expert spoke on energy resourcesand the Pakistan Energy Development Plan. He highlighted issuesrelated to Thar coal development, promotion of LNG, renewable,solar and winds energy, and use of nuclear fuels.
Dr. Samiuz Zaman spoke on the management of solidwaste disposal systems in Karachi. He highlighted the issuesrelated to setting up of an incinerator in Karachi that he haddesigned in the 1990s. This incinerator continues to be used bythe industrialists and others. He has his own lab facility that isable to test and measure key environmental parameters NEQS asstipulated by Environmental Agencies of Pakistan. The labfacilities are open for students of IoBM Environment and EnergyProgram for conducting experiments related to their courses.
Dr. A. A. Baig former Director PCSIR concluded theworkshop proceedings by highlighting the term social pollution.A non caring attitude of the people and the concernedenvironmental monitoring agencies has contributed to the growingmenace of pollution in the city. Karachi has now become the mostpolluted metropolis in Asia according to a recent World Bankstudy.
Volume 13 Number 2 July 2011
PAKISTAN BUSINESS REVIEW JULY 2011
INSTRUCTIONS TO AUTHORS(Research Section)
1. Papers must be in English.2 . Papers for publication should be sent in triplicate or by e-mail to:
Managing Editor, Pakistan Business ReviewInstitute of Business Management
Korangi Creek, Karachi- 75190, PakistanUAN: (9221) 111-002-004 Fax: (9221) 3509-0968, 3509-2658
E-mails: [email protected], [email protected]
Submission of a paper will be held to imply that it contains original unpublished work and is notbeing submitted for publication elsewhere. The Editors do not accept responsibility for damages orloss of papers submitted.
3 . PBR is a multi-disciplinary journal covering all subject areas of relevance to business inPakistan. Research in the areas of Finance, Human Resources, Management, Informatics,Ethics, Marketing, Psychology, Economics and issues related to governance is speciallyencouraged.
4 . Manuscripts should be typewritten on one side of the page only, double spaced with widemargins. All pages should be numbered consecutively, titles and subtitles should be short.References, tables and legends for figures should be typed on separate pages. The legends andtitles on tables and figures must be sufficiently descriptive such that they are understandablewithout reference to the text. The dimension of figure axes and the body of tables must beclearly labelled in English.
5 . The first page of the manuscript should contain the following information; (i) the title; (ii)the name(s) and institutional affiliation(s); (iii) an abstract of not more than 100 words. Afootnote on the same sheet should give the name and present address of the author to whomreprints will be sent.
6 . Acknowledgements and information on grants received can be given before the references orin a first footnote, which should not be included in the consecutive numbering of footnotes.
7 . Important formulae (displayed) should be numbered consecutively throughout the manuscriptas (1), (2), etc., on the right hand side of the page where the derivation of formula has beenabbreviated, it is of great help to referees if the full derivation can be presented on a separatesheet (not to be published).
8 . Footnotes should be kept to a minimum and be numbered consecutively throughout the textwith superscript arabic numerals.
9 . The references should include only the most relevant papers. In the text, references topublications should appear as follows: “Khan (1978) reported that….” Or “This problem hasbeen a subject in literature before [e.g., Khan (1978) p. 102].” The author should make surethat there is a strict “one-to-one correspondence” between the names (years) in the text andthose on the list. At the end of the manuscript (after any appendices) the complete referencesshould be listed as:for monographs and books.Ahmad, Jaleel, 1978, Import substitution, trade and development, Amsterdam: North-Holland,For contributions to collective worksNewbery, Daved M.G., 1975,. The use of rental contract in peasant agriculture, in: Reynods,ed., Agriculture in development theory, New Haven: Yale University Press p. 3-40.
Continued next page
Volume 13 Number 2 July 2011
PAKISTAN BUSINESS REVIEW JULY 2011
INSTRUCTIONS TO AUTHORS(Research Section)
From previous page:
For periodicalsBaumol, W.J., 1982, Applied fairness theory and rational policy, American EconomicReview, 72(4): 639561.Note that journal titles should not be abbreviated.
10 . Illustrations should be provided in triplicate (one original drawn in black ink on whitepaper and or with two photocopies). Care should be taken that lettering and symbolsare of a comparable size. The drawings should not be inserted in the text and shouldbe marked on the back with figure numbers, title of paper and name of author. Allgraphs and diagrams should be numbered consecutively in the text in arabic numerals.Graph paper should be ruled in blue and any grid lines to be shown should be inkedblack. Illustrations of insufficient quality which have to be redrawn by the publisherwill be charged to the author.
11 . All unessential tables should be eliminated from the manuscript. Tables should benumbered consecutively in the text in arabic numerals and typed on separate sheets.Any manuscript which does not conform to the instructions may be returned fornecessary revision before publication.