The Company - 1 Half 2010 - Banco do Brasil
73
The Company st 1 Half 2010
-
Upload
khangminh22 -
Category
Documents
-
view
0 -
download
0
Transcript of The Company - 1 Half 2010 - Banco do Brasil
The Companyst1 Half 2010
bb.com.br
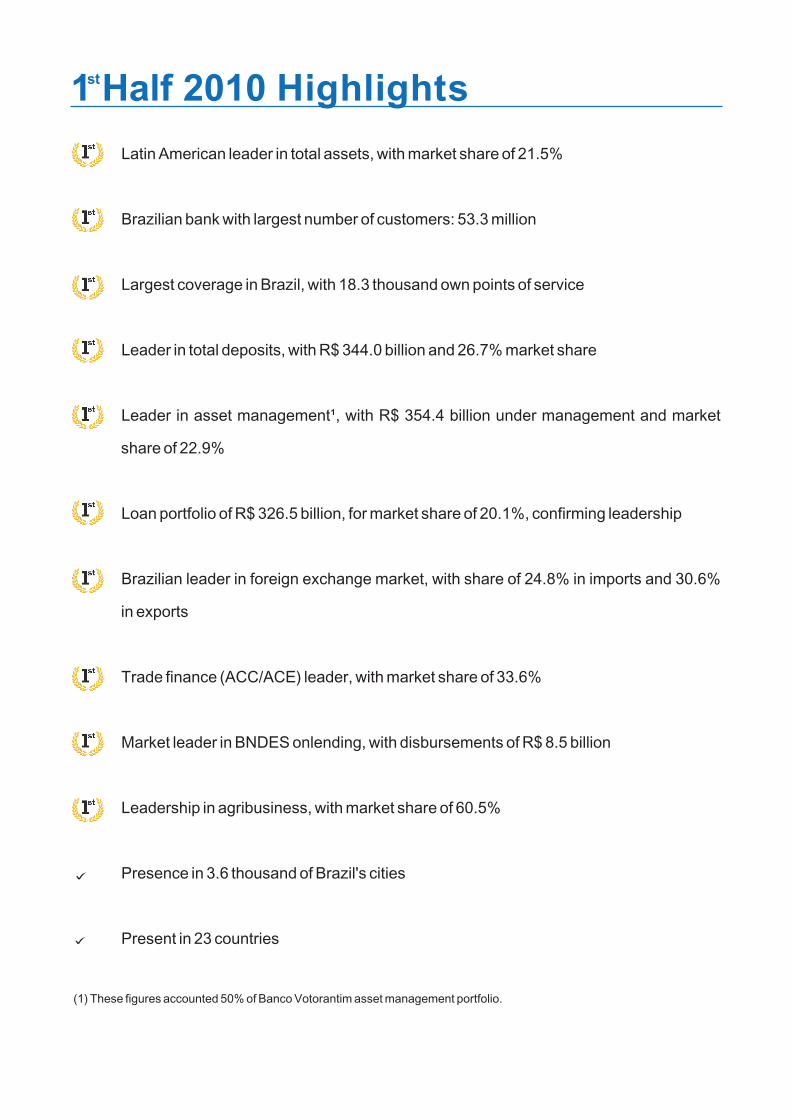
1 Half 2010 Highlights
Latin American leader in total assets, with market share of 21.5%
Brazilian bank with largest number of customers: 53.3 million
Largest coverage in Brazil, with 18.3 thousand own points of service
Leader in total deposits, with R$ 344.0 billion and 26.7% market share
Leader in asset management¹, with R$ 354.4 billion under management and market
share of 22.9%
Loan portfolio of R$ 326.5 billion, for market share of 20.1%, confirming leadership
Brazilian leader in foreign exchange market, with share of 24.8% in imports and 30.6%
in exports
Trade finance (ACC/ACE) leader, with market share of 33.6%
Market leader in BNDES onlending, with disbursements of R$ 8.5 billion
Leadership in agribusiness, with market share of 60.5%
Presence in 3.6 thousand of Brazil's cities
Present in 23 countries
(1) These figures accounted 50% of Banco Votorantim asset management portfolio.
st
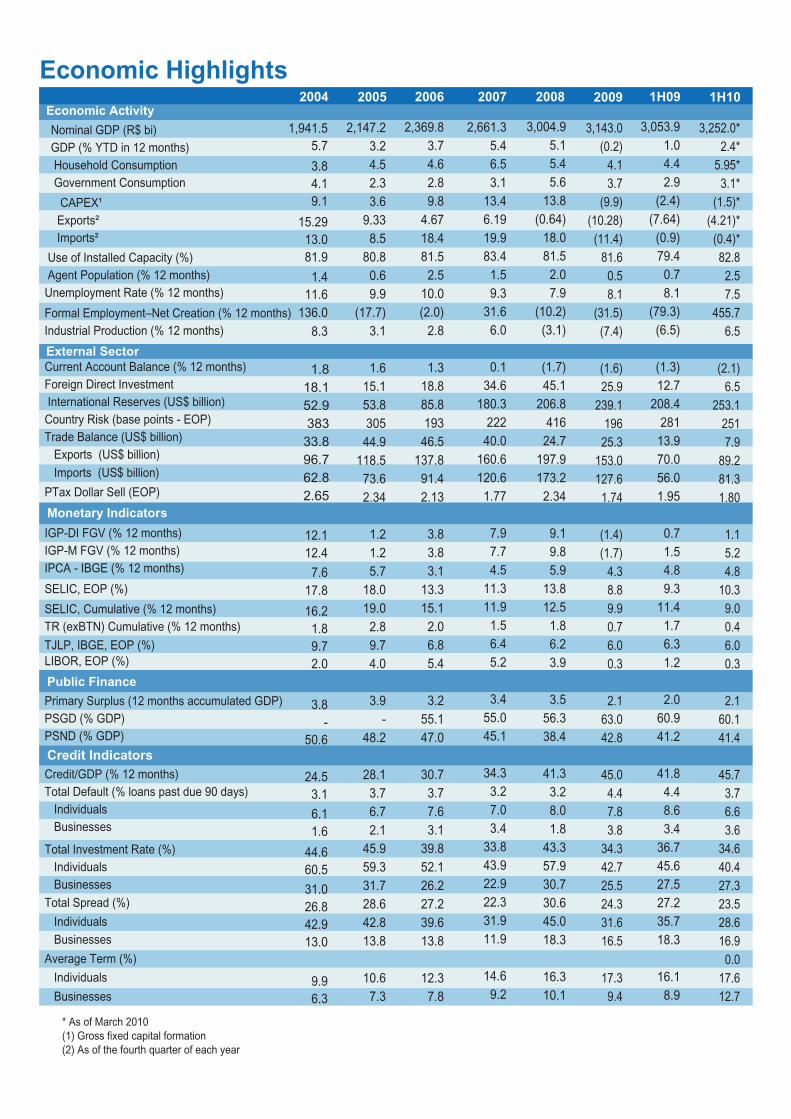
Economic Highlights
Economic Activity
* As of March 2010(1) Gross fixed capital formation(2) As of the fourth quarter of each year
2004 2005 2006 2007 2008 2009 1H09 1H10
External Sector
Monetary Indicators
Public Finance
Credit Indicators
Nominal GDP (R$ bi)
GDP (% YTD in 12 months)
Household Consumption
Government Consumption
CAPEX¹
Exports²
Imports²
Use of Installed Capacity (%)
Agent Population (% 12 months)
Unemployment Rate (% 12 months)
Formal Employment–Net Creation (% 12 months)
Industrial Production (% 12 months)
Current Account Balance (% 12 months)
Foreign Direct Investment
International Reserves (US$ billion)
Country Risk (base points - EOP)
Trade Balance (US$ billion)
Exports (US$ billion)
Imports (US$ billion)
PTax Dollar Sell (EOP)
IGP-DI FGV (% 12 months)
IGP-M FGV (% 12 months)
IPCA - IBGE (% 12 months)
SELIC, EOP (%)
SELIC, Cumulative (% 12 months)
TR (exBTN) Cumulative (% 12 months)
TJLP, IBGE, EOP (%)
LIBOR, EOP (%)
Primary Surplus (12 months accumulated GDP)
PSGD (% GDP)
PSND (% GDP)
Credit/GDP (% 12 months)
Total Default (% loans past due 90 days)
Individuals
Businesses
Total Investment Rate (%)
Individuals
Businesses
Total Spread (%)
Individuals
Businesses
Average Term (%)
Individuals
Businesses
2,147.2
3.2
4.5
2.3
3.6
9.33
8.5
80.8
0.6
9.9
(17.7)
3.1
1.6
15.1
53.8
305
44.9
118.5
73.6
2.34
1.2
1.2
5.7
18.0
19.0
2.8
9.7
4.0
3.9
-
48.2
28.1
3.7
6.7
2.1
45.9
59.3
31.7
28.6
42.8
13.8
10.6
7.3
2,369.8
3.7
4.6
2.8
9.8
4.67
18.4
81.5
2.5
10.0
(2.0)
2.8
1.3
18.8
85.8
193
46.5
137.8
91.4
2.13
3.8
3.8
3.1
13.3
15.1
2.0
6.8
5.4
3.2
55.1
47.0
30.7
3.7
7.6
3.1
39.8
52.1
26.2
27.2
39.6
13.8
12.3
7.8
2,661.3
5.4
6.5
3.1
13.4
6.19
19.9
83.4
1.5
9.3
31.6
6.0
0.1
34.6
180.3
222
40.0
160.6
120.6
1.77
7.9
7.7
4.5
11.3
11.9
1.5
6.4
5.2
3.4
55.0
45.1
34.3
3.2
7.0
3.4
33.8
43.9
22.9
22.3
31.9
11.9
14.6
9.2
3,004.9
5.1
5.4
5.6
13.8
(0.64)
18.0
81.5
2.0
7.9
(10.2)
(3.1)
(1.7)
45.1
206.8
416
24.7
197.9
173.2
2.34
9.1
9.8
5.9
13.8
12.5
1.8
6.2
3.9
3.5
56.3
38.4
41.3
3.2
8.0
1.8
43.3
57.9
30.7
30.6
45.0
18.3
16.3
10.1
3,143.0
(0.2)
4.1
3.7
(9.9)
(10.28)
(11.4)
81.6
0.5
8.1
(31.5)
(7.4)
(1.6)
25.9
239.1
196
25.3
153.0
127.6
1.74
(1.4)
(1.7)
4.3
8.8
9.9
0.7
6.0
0.3
2.1
63.0
42.8
45.0
4.4
7.8
3.8
34.3
42.7
25.5
24.3
31.6
16.5
17.3
9.4
3,053.9
1.0
4.4
2.9
(2.4)
(7.64)
(0.9)
79.4
0.7
8.1
(79.3)
(6.5)
(1.3)
12.7
208.4
281
13.9
70.0
56.0
1.95
0.7
1.5
4.8
9.3
11.4
1.7
6.3
1.2
2.0
60.9
41.2
41.8
4.4
8.6
3.4
36.7
45.6
27.5
27.2
35.7
18.3
16.1
8.9
3,252.0*
2.4*
5.95*
3.1*
(1.5)*
(4.21)*
(0.4)*
82.8
2.5
7.5
455.7
6.5
(2.1)
6.5
253.1
251
7.9
89.2
81.3
1.80
1.1
5.2
4.8
10.3
9.0
0.4
6.0
0.3
2.1
60.1
41.4
45.7
3.7
6.6
3.6
34.6
40.4
27.3
23.5
28.6
16.9
0.0
17.6
12.7
1,941.5
5.7
3.8
4.1
9.1
15.29
13.0
81.9
1.4
11.6
136.0
8.3
12.1
12.4
7.6
17.8
16.2
1.8
9.7
2.0
3.8
-
50.6
24.5
3.1
6.1
1.6
44.6
60.5
31.0
26.8
42.9
13.0
9.9
6.3
1.8
18.1
52.9
383
33.8
96.7
62.8
2.65
1.8
18.1
52.9
383
33.8
96.7
62.8
2.65
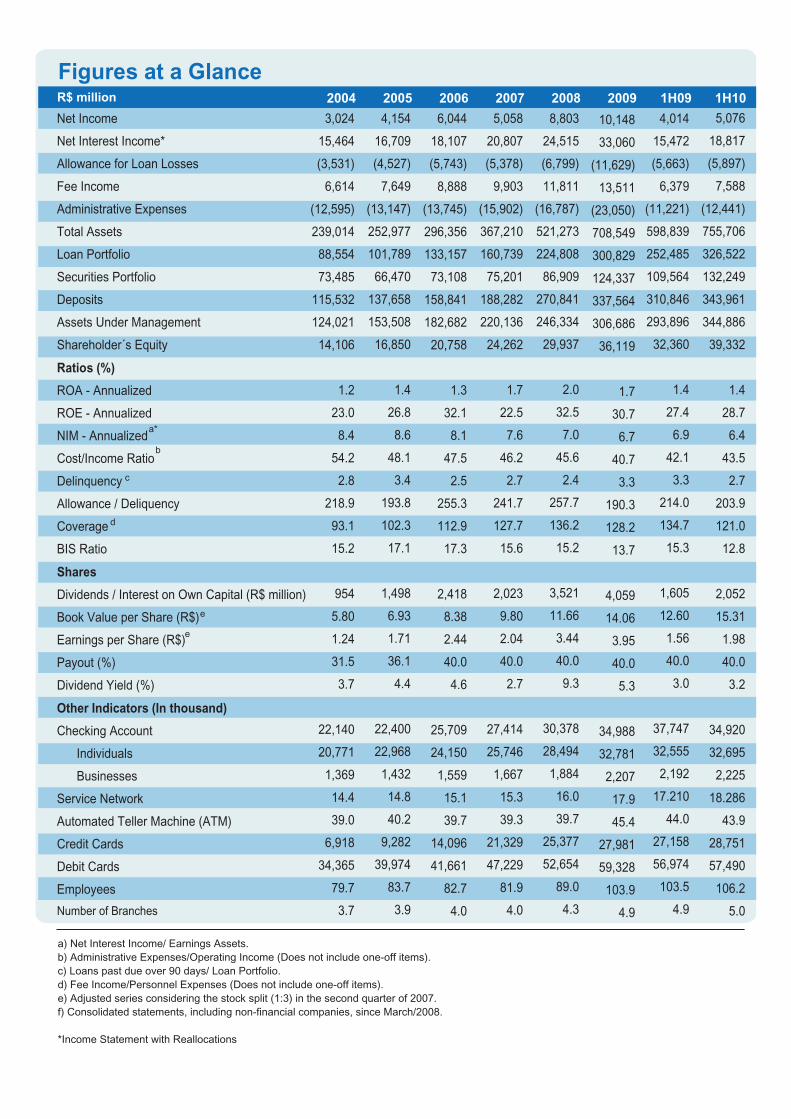
Figures at a GlanceR$ million 2004 2005 2006 2007 2008 2009
3,024
15,464
(3,531)
6,614
(12,595)
239,014
88,554
73,485
115,532
124,021
14,106
1.2
23.0
8.4
54.2
2.8
218.9
93.1
15.2
954
5.80
1.24
31.5
3.7
22,140
20,771
1,369
14.4
39.0
6,918
34,365
79.7
3.7
4,154
16,709
(4,527)
7,649
(13,147)
252,977
101,789
66,470
137,658
153,508
16,850
1.4
26.8
8.6
48.1
3.4
193.8
102.3
17.1
1,498
6.93
1.71
36.1
4.4
22,400
22,968
1,432
14.8
40.2
9,282
39,974
83.7
3.9
6,044
18,107
(5,743)
8,888
(13,745)
296,356
133,157
73,108
158,841
182,682
20,758
1.3
32.1
8.1
47.5
2.5
255.3
112.9
17.3
2,418
8.38
2.44
40.0
4.6
25,709
24,150
1,559
15.1
39.7
14,096
41,661
82.7
4.0
5,058
20,807
(5,378)
9,903
(15,902)
367,210
160,739
75,201
188,282
220,136
24,262
1.7
22.5
7.6
46.2
2.7
241.7
127.7
15.6
2,023
9.80
2.04
40.0
2.7
27,414
25,746
1,667
15.3
39.3
21,329
47,229
81.9
4.0
8,803
24,515
(6,799)
11,811
(16,787)
521,273
224,808
86,909
270,841
246,334
29,937
2.0
32.5
7.0
45.6
2.4
257.7
136.2
15.2
3,521
11.66
3.44
40.0
9.3
30,378
28,494
1,884
16.0
39.7
25,377
52,654
89.0
4.3
10,148
33,060
(11,629)
13,511
(23,050)
708,549
300,829
124,337
337,564
306,686
36,119
1.7
30.7
6.7
40.7
3.3
190.3
128.2
13.7
4,059
14.06
3.95
40.0
5.3
34,988
32,781
2,207
17.9
45.4
27,981
59,328
103.9
4.9
1H09 1H10
4,014
15,472
(5,663)
6,379
(11,221)
598,839
252,485
109,564
310,846
293,896
32,360
1.4
27.4
6.9
42.1
3.3
214.0
134.7
15.3
1,605
12.60
1.56
40.0
3.0
37,747
32,555
2,192
17.210
44.0
27,158
56,974
103.5
4.9
5,076
18,817
(5,897)
7,588
(12,441)
755,706
326,522
132,249
343,961
344,886
39,332
1.4
28.7
6.4
43.5
2.7
203.9
121.0
12.8
2,052
15.31
1.98
40.0
3.2
34,920
32,695
2,225
18.286
43.9
28,751
57,490
106.2
5.0
Net Income
Net Interest Income*
Allowance for Loan Losses
Fee Income
Administrative Expenses
Total Assets
Loan Portfolio
Securities Portfolio
Deposits
Assets Under Management
Shareholder´s Equity
Ratios (%)
ROA - Annualized
ROE - Annualized
NIM - Annualized
Cost/Income Ratio
Delinquency
Allowance / Deliquency
Coverage
BIS Ratio
Shares
Dividends / Interest on Own Capital (R$ million)
Book Value per Share (R$)
Earnings per Share (R$)
Payout (%)
Dividend Yield (%)
Other Indicators (In thousand)
Checking Account
Individuals
Businesses
Service Network
Automated Teller Machine (ATM)
Credit Cards
Debit Cards
Employees
Number of Branches
a) Net Interest Income/ Earnings Assets.
b) Administrative Expenses/Operating Income (Does not include one-off items).
c) Loans past due over 90 days/ Loan Portfolio.
d) Fee Income/Personnel Expenses
e) Adjusted series considering the stock split (1:3) in the second quarter of 2007.
f) Consolidated statements, including non-financial companies, since March/2008.
*Income Statement with Reallocations
(Does not include one-off items).
a*
b
c
d
e
e

Table of Contents
01. Economic Environment
02. Industry Outlook
03. Banco do Brasil Positioning
04. Financial Performance
05. Banco do Brasil Stock
06. Corporate Governance
6.1 Organizational Structure
6.2 Risk Management
6.3 Regulatory Capital
07. Human Resources
08. Social and Environmental Responsibility
09. Products and Services
9.1 Credit
9.1.1 Individuals
9.1.2 Businesses
9.1.3 Agribusiness
9.1.4 Foreign Trade
9.2 Securities
9.3 Funding
9.4 Asset Management
9.5 Capital Markets
9.6 Insurance, Pension Plans and Savings Bonds
9.7 Cards
10. Banco do Brasil Presence
10.1 Client Base
10.1.1 Retail
10.1.2 Wholesale
10.1.3 Public Sector
10.2 Distribution Channels in Brazil and Abroad
10.3 Technology Structure
11. Market Opinion
12. Awards
13. Banco do Brasil Figures
Distribution Network Abroad
Contact List
03
09
12
16
19
21
22
25
25
26
27
29
29
30
32
34
37
39
40
41
42
43
47
48
48
48
49
49
50
52
54
55
56
59
63
1Banco do Brasil - The Company 1 Half 2010st
3
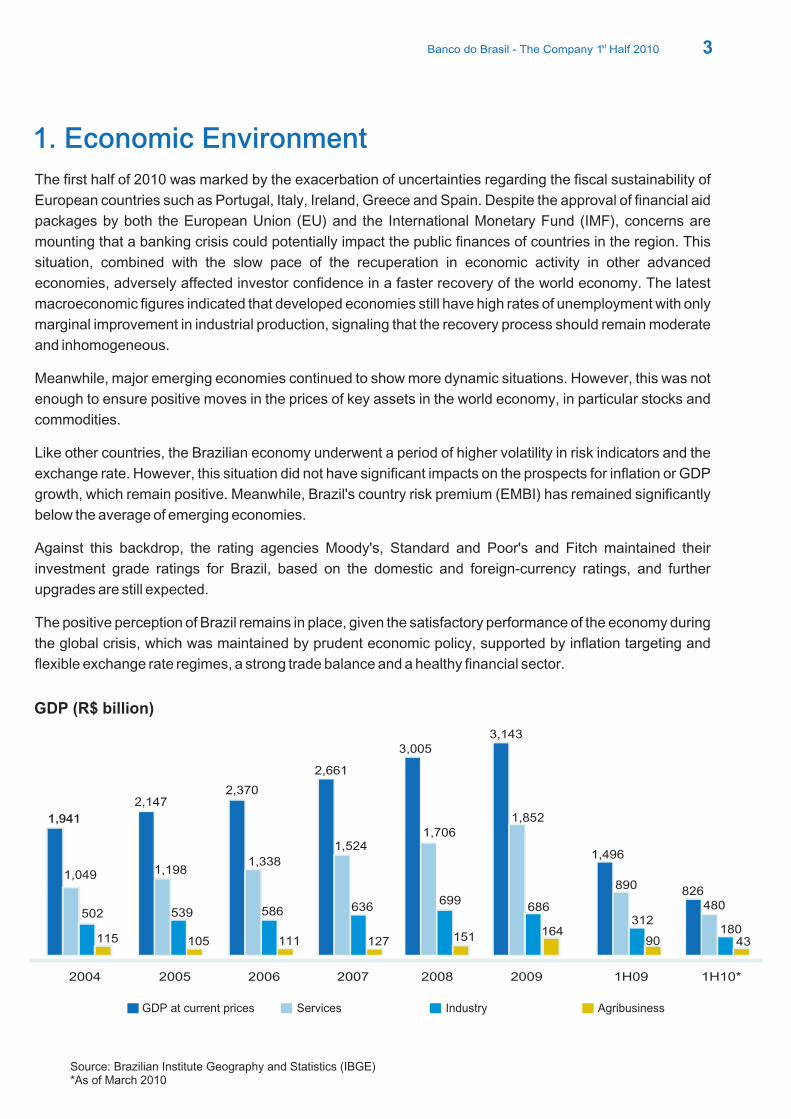
1. Economic Environment
The first half of 2010 was marked by the exacerbation of uncertainties regarding the fiscal sustainability of
European countries such as Portugal, Italy, Ireland, Greece and Spain. Despite the approval of financial aid
packages by both the European Union (EU) and the International Monetary Fund (IMF), concerns are
mounting that a banking crisis could potentially impact the public finances of countries in the region. This
situation, combined with the slow pace of the recuperation in economic activity in other advanced
economies, adversely affected investor confidence in a faster recovery of the world economy. The latest
macroeconomic figures indicated that developed economies still have high rates of unemployment with only
marginal improvement in industrial production, signaling that the recovery process should remain moderate
and inhomogeneous.
Meanwhile, major emerging economies continued to show more dynamic situations. However, this was not
enough to ensure positive moves in the prices of key assets in the world economy, in particular stocks and
commodities.
Like other countries, the Brazilian economy underwent a period of higher volatility in risk indicators and the
exchange rate. However, this situation did not have significant impacts on the prospects for inflation or GDP
growth, which remain positive. Meanwhile, Brazil's country risk premium (EMBI) has remained significantly
below the average of emerging economies.
Against this backdrop, the rating agencies Moody's, Standard and Poor's and Fitch maintained their
investment grade ratings for Brazil, based on the domestic and foreign-currency ratings, and further
upgrades are still expected.
The positive perception of Brazil remains in place, given the satisfactory performance of the economy during
the global crisis, which was maintained by prudent economic policy, supported by inflation targeting and
flexible exchange rate regimes, a strong trade balance and a healthy financial sector.
Source: Brazilian Institute Geography and Statistics (IBGE)*As of March 2010
GDP at current prices Services Industry Agribusiness
GDP (R$ billion)
2004
1,941
1,049
502
115
3,005
2,147
1,198
539
105
2005
2,370
1,338
586
111
2006
2,661
1,524
636
127
2007
1,706
699
151
2008
3,143
1,852
686
164
2009
1,496
890
312
90
826480
1H09 1H10*
18043
Banco do Brasil - The Company 1 Half 2010st
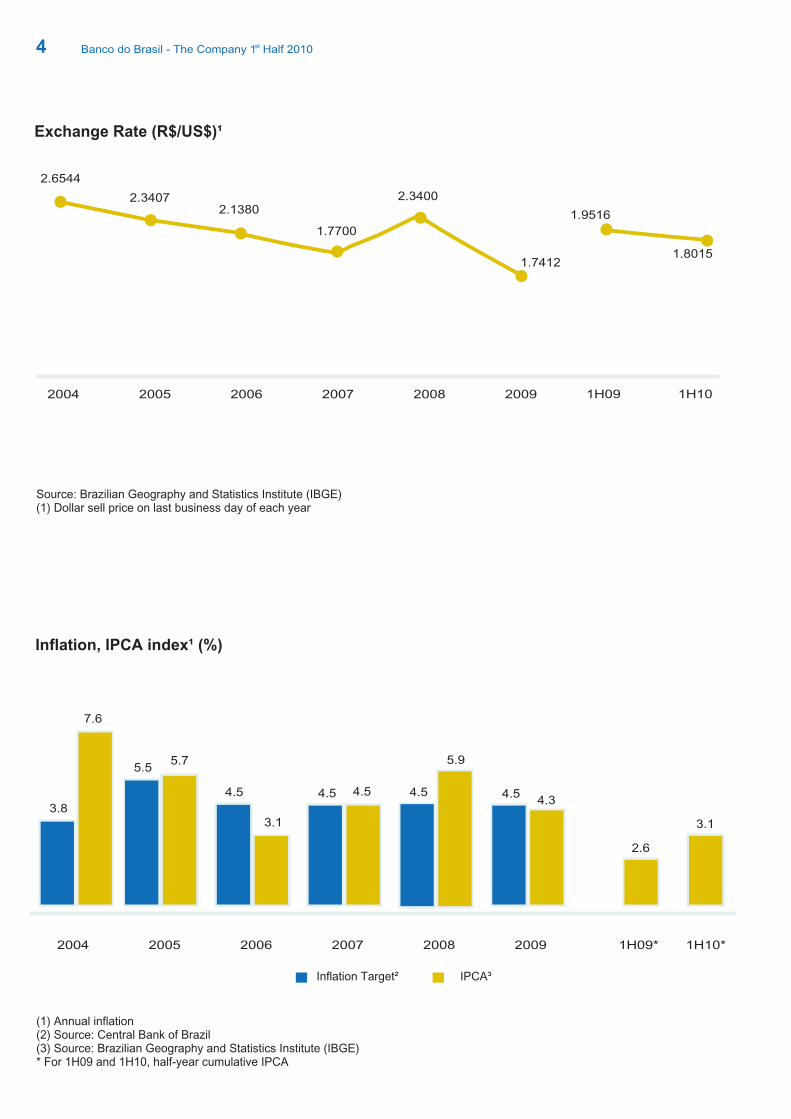
Exchange Rate (R$/US$)¹
Inflation, IPCA index¹ (%)
Source: Brazilian Geography and Statistics Institute (IBGE)(1) Dollar sell price on last business day of each year
(1) Annual inflation(2) Source: Central Bank of Brazil(3) Source: Brazilian Geography and Statistics Institute (IBGE)* For 1H09 and 1H10, half-year cumulative IPCA
Inflation Target² IPCA³
4
2004 2005 2006 2007 2008 2009
2.6544
2.34072.1380
1.7700
2.3400
1.7412
1.9516
1.8015
1H09 1H10
2004 2005 2006 2007 2008 2009
3.8
7.6
62,8
118,5
73,8
5.75.5
3.1
4.5 4.5 4.5 4.5
5.9
4.54.3
2.6
3.1
1H09* 1H10*
Banco do Brasil - The Company 1 Half 2010st
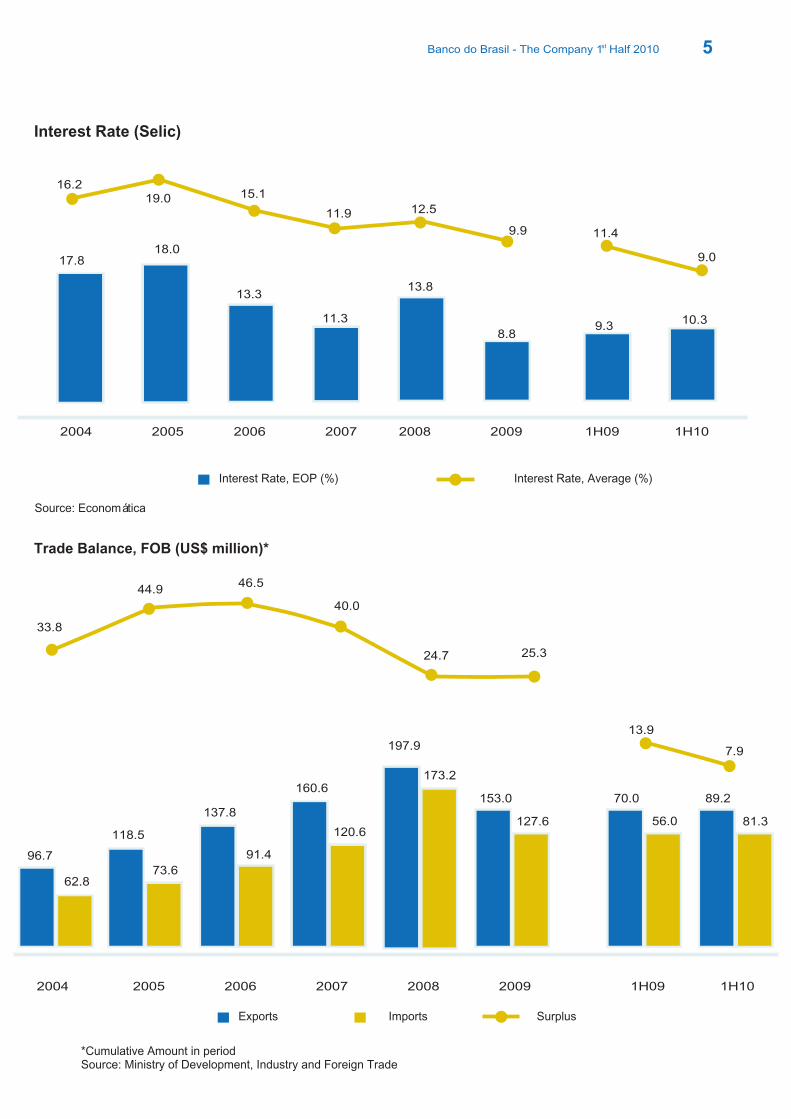
Interest Rate (Selic)
Trade Balance, FOB (US$ million)*
Source: Economática
*Cumulative Amount in periodSource: Ministry of Development, Industry and Foreign Trade
9.9
19.016.2
15.1
11.9 12.5
Interest Rate, EOP (%) Interest Rate, Average (%)
33.8
44.946.5
40.0
24.7 25.3
5
Exports Imports
11.4
9.017.818.0
13.3
11.3
13.8
2004 2005 2006 2007 2008 2009
8.89.3
10.3
1H09 1H10
13.9
7.9197.9
2004 2005 2006 2007 2008 2009
96.7
62.8
118.5
73.6
137.8
91.4
160.6
120.6
173.2
153.0
127.6
70.0
56.0
89.2
81.3
1H09 1H10
Surplus
Banco do Brasil - The Company 1 Half 2010st

Brazil Sovereign Risk¹
Internacional Reserves (US$ billion)
(1) End of periodSource: Bloomberg
Source: Central Bank of Brazil
6
383
305
193222
416
196
281
251
2004 2005 2006 2007 2008 2009 1H09 1H10
2004 2005 2006 2007 2008 2009
52.9 53.8
85.8
180.3
206.8
239.1253.1
208.4
1H09 1H10
Banco do Brasil - The Company 1 Half 2010st
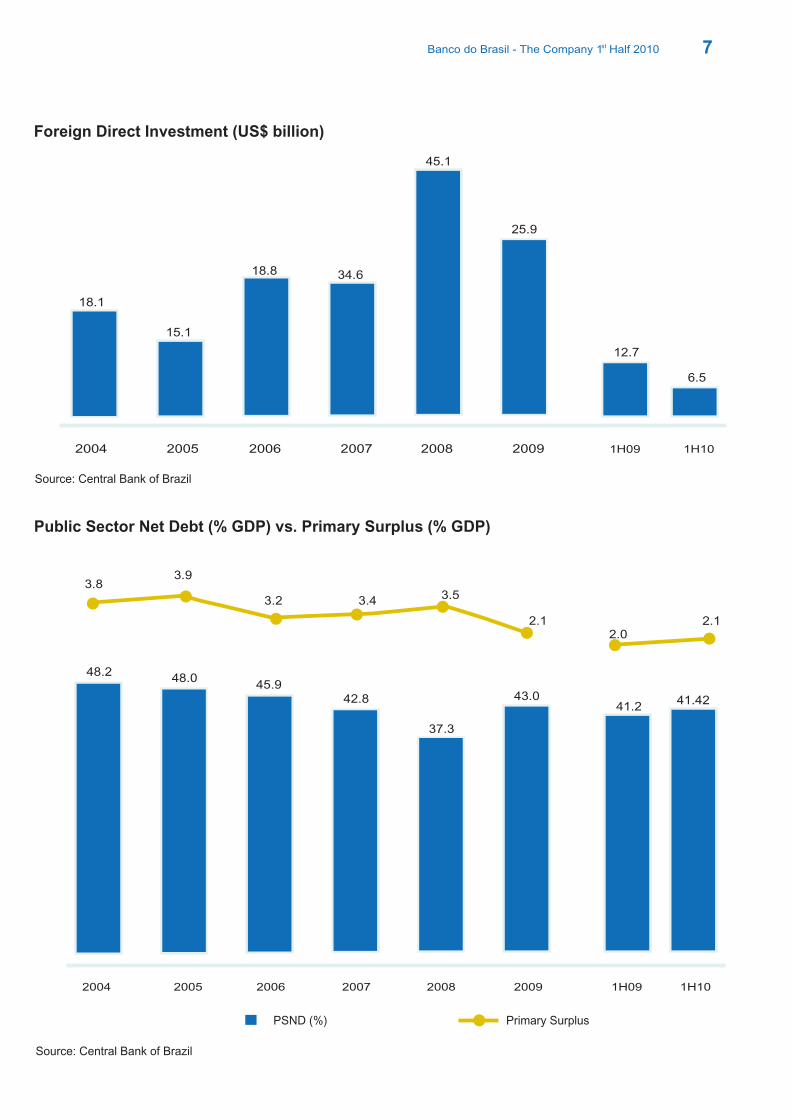
Foreign Direct Investment (US$ billion)
Public Sector Net Debt (% GDP) vs. Primary Surplus (% GDP)
Source: Central Bank of Brazil
Source: Central Bank of Brazil
PSND (%) Primary Surplus
18.1
15.1
18.8 34.6
45.1
25.9
2004 2005 2006 2007 2008 2009
12.7
6.5
1H09 1H10
3.83.9
3.2 3.4 3.5
2.12.0
2.1
48.248.0
45.942.8
37.3
43.0
2004 2005 2006 2007 2008 2009
41.241.42
1H09 1H10
7Banco do Brasil - The Company 1 Half 2010st
8
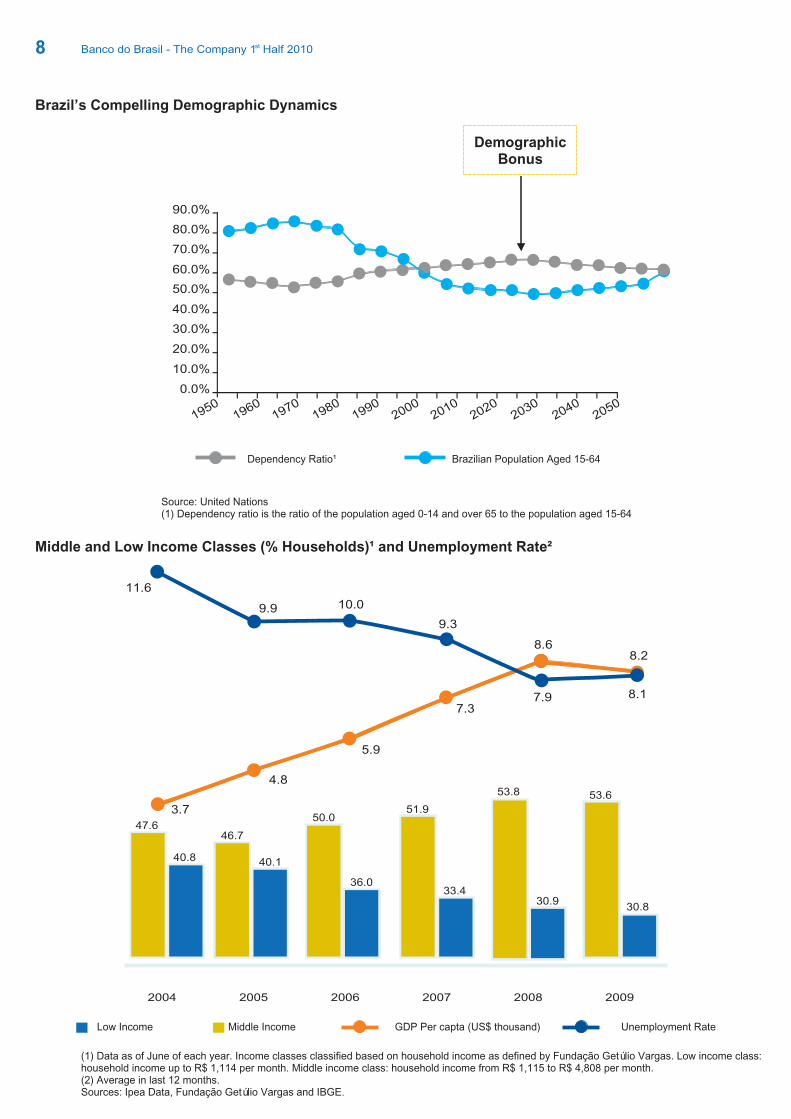
Brazil’s Compelling Demographic Dynamics
0.0%
10.0%
20.0%
30.0%
40.0%
50.0%
60.0%
70.0%
80.0%
90.0%
19501960
19701980
19902000
20102020
20302040
2050
Dependency Ratio¹ Brazilian Population Aged 15-64
Source: United Nations(1) Dependency ratio is the ratio of the population aged 0-14 and over 65 to the population aged 15-64
Middle and Low Income Classes (% Households)¹ and Unemployment Rate²
2004 2005 2006 2007 2008 2009
47.6
40.8
46.7
40.1
50.0
36.0
51.9
33.4
53.8
30.9
53.6
30.8
(1) Data as of June of each year. Income classes classified based on household income as defined by Fundação Getúlio Vargas. Low income class:household income up to R$ 1,114 per month. Middle income class: household income from R$ 1,115 to R$ 4,808 per month.(2) Average in last 12 months.Sources: Ipea Data, Fundação Getúlio Vargas and IBGE.
Low Income Middle Income GDP Per capta (US$ thousand) Unemployment Rate
11.6
9.9 10.0
9.3
8.68.2
8.17.97.3
5.9
4.8
3.7
DemographicBonus
Banco do Brasil - The Company 1 Half 2010st
9
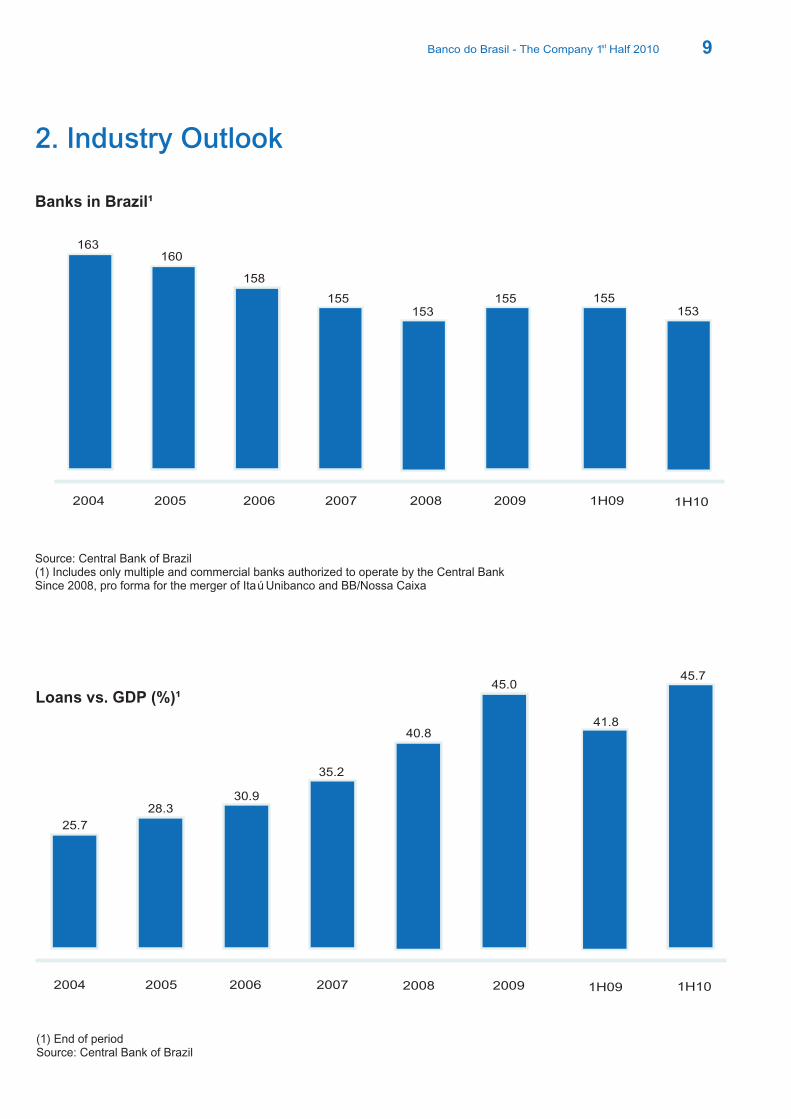
Banks in Brazil¹
(1) End of periodSource: Central Bank of Brazil
2. Industry Outlook
Loans vs. GDP (%)¹
Source: Central Bank of Brazil(1) Includes only multiple and commercial banks authorized to operate by the Central BankSince 2008, pro forma for the merger of Itaú Unibanco and BB/Nossa Caixa
2004 2005 2006 2007 2008 2009
163160
158
155153
1H09 1H10
155 155153
2004 2005 2006 2007 2008 2009
25.7
28.330.9
35.2
40.8
45.0
1H09 1H10
41.8
45.7
Banco do Brasil - The Company 1 Half 2010st

10
Loans by Segment, Free Resources (%)
Source: Central Bank of Brazil
Individuals Businesses
Main Individual Loan Operations
Source: Central Bank of Brazil
2004 2005 2006 2007 2008 2009
56.4
43.6
52.8 52.2 51.9 54.7 50.8
47.2 47.8 48.1 45.3 49.2
1H09 1H10
51.7 50.3
48.3 49.7
(R$ million) 2004 2005 2006 2007 2008 200949,356
17,151
38,065
8,027
9,800
105,428
70,739
31,704
50,685
11,260
10,974
143,658
88,710
48,149
63,475
13,418
11,760
177,363
100,928
64,686
81,481
17,150
12,985
317,561
133,025
78,890
139,145
22,088
16,040
394,287
164,323
107,883
157,950
25,699
15,790
469,863
Direct Consumer Credit
Payroll Loan
Vehicles
Credit Cards
Overdraft Account
Total (Free Resources)
1H09 1H10149,429
91,826
147,460
25,386
17,877
434,331
186,133
123,438
157,950
28,558
17,939
505,733
Banco do Brasil - The Company 1 Half 2010st
11
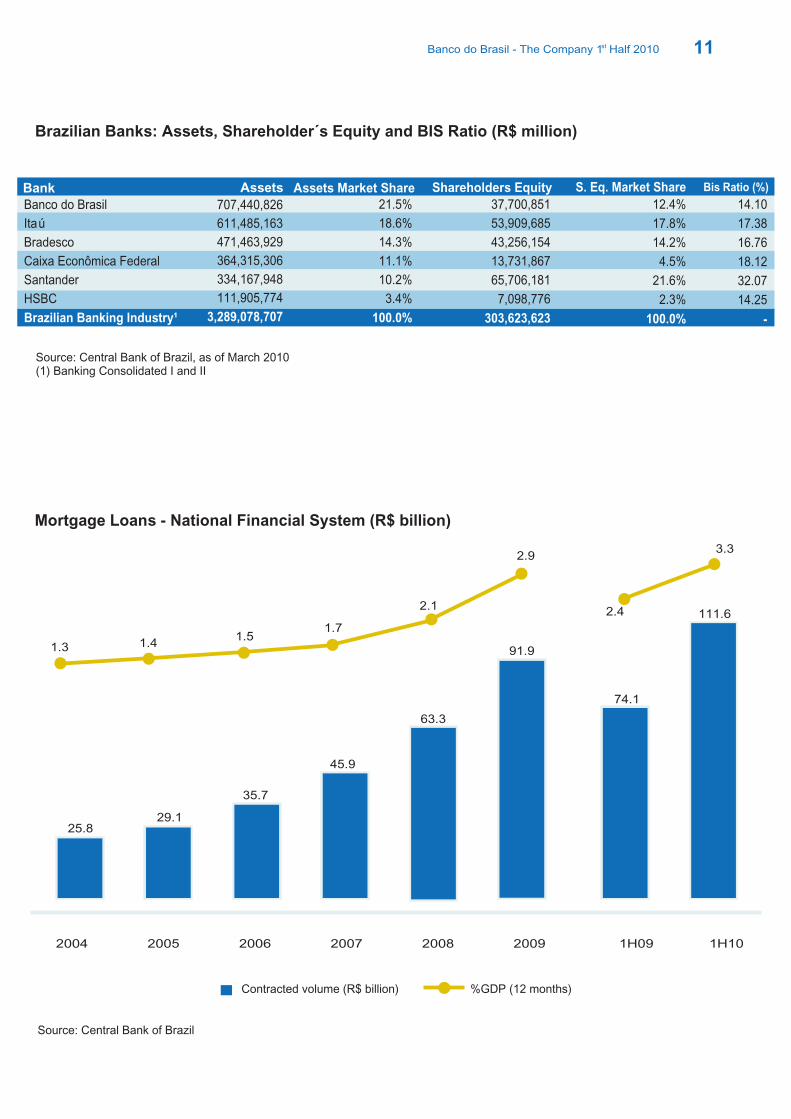
Brazilian Banks: Assets, Shareholder´s Equity and BIS Ratio (R$ million)
Source: Central Bank of Brazil, a(1) Banking Consolidated I and II
s of March 2010
Bank Assets Assets Market Share Shareholders Equity
707,440,826
611,485,163
471,463,929
364,315,306
334,167,948
111,905,774
3,289,078,707
21.5%
18.6%
14.3%
11.1%
10.2%
3.4%
100.0%
37,700,851
53,909,685
43,256,154
13,731,867
65,706,181
7,098,776
303,623,623
S. Eq. Market Share
12.4%
17.8%
14.2%
4.5%
21.6%
2.3%
100.0%
Bis Ratio (%)
14.10
17.38
16.76
18.12
32.07
14.25
-
Banco do Brasil
Itaú
Bradesco
Caixa Econômica Federal
Santander
HSBC
Brazilian Banking Industry¹
Mortgage Loans - National Financial System (R$ billion)
Source: Central Bank of Brazil
1.3 1.41.5
1.7
2.1
2.9
Contracted volume (R$ billion) %GDP (12 months)
2.4
3.3
2004 2005 2006 2007 2008 2009
25.829.1
91.9
35.7
45.9
63.3
1H09 1H10
74.1
111.6
Banco do Brasil - The Company 1 Half 2010st
12
3. Banco do Brasil positioning
Profile
Banco do Brasil is the largest bank in Latin America in terms of total assets as of June 30, 2010. It is a multiple-service bank with headquarters in Brasília and has a significant presence throughout Brazil, while also conducting operations in key global economic and financial centers. To expand its operations abroad, BB announced an agreement to acquire a controlling interest in Banco Patagonia in Argentina. BB was also authorized by the U.S. Federal Reserve to perform banking activities in U.S. territory.
The Bank focuses on sustainable results and performance that are compatible with its market leadership. BB acts as an agent of Brazil's federal government to implement its policies and programs involving agribusiness, small and micro businesses and foreign trade, as well as for the development of solutions that simplify the operations and services that cater to these economic sectors.
With over 200 years of operations, BB's principal strength is in Brazil's retail banking market, and its business can be grouped generally into seven general areas: banking services, investments, asset management, insurance, pension and financing, payment services and other businesses. The main activities of each segment are as follows:
Banking services: offering banking services to all customer segments;
Investments: investments in insurers and companies operating in the pension sector;
Asset management: administration and management of third-party assets, organization and administration of investment and other funds, management of portfolios and custody of marketable securities;
Insurance: health, life, financial, vehicle and agricultural;
Pension plans and financing: sale of private pension products and administration of pension plans;
Payment services: commercial payment services under corporate benefit plans, including meal, transportation and fuel plans; and
Other businesses, including:
· Acquisitions and management of bank real estate credit and leasing operations; · Investments in electric power;· Leasing of properties and other assets;· Management of consortium groups; and· Sales, installations and maintenance of computers and other electronic devices.
Mission: To be the solution in financial services and intermediation, to meet the expectations of customersand shareholders, to strengthen the commitment between employees and the Bank, and to
contribute to Brazil's development
Banco do Brasil - The Company 1 Half 2010st
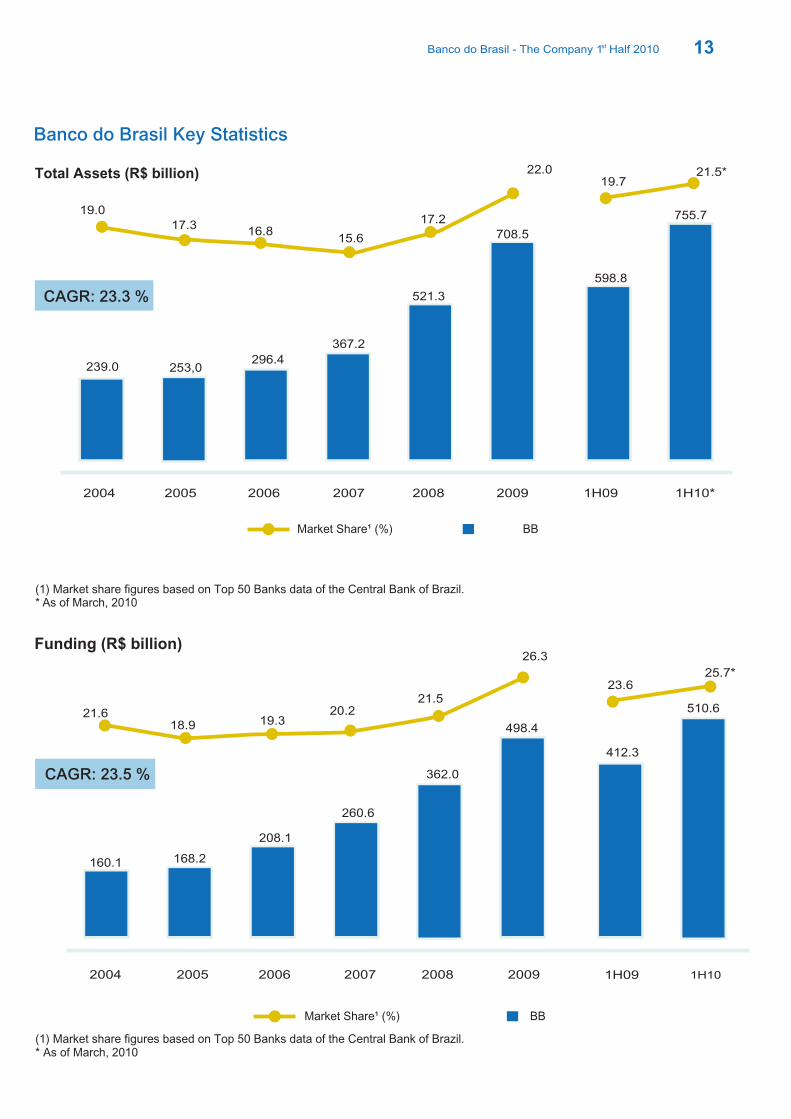
Total Assets (R$ billion)
Funding (R$ billion)
(1) Market share figures based on Top 50 Banks data of the Central Bank of Brazil. * As of March, 2010
(1) Market share figures based on Top 50 Banks data of the Central Bank of Brazil.* As of March, 2010
2004 2005 2006 2007 2008 2009
Banco do Brasil Key Statistics
13
19.0
17.316.8
15.6
17.2
22.0
21.618.9 19.3
20.221.5
26.3
Market Share¹ (%) BB
Market Share¹ (%) BB
19.721.5*
CAGR: 23.3 %
2004 2005 2006 2007 2008 2009
521.3
708.5
367.2
296.4253,0239.0
1H09 1H10*
598.8
755.7
1H09 1H10
160.1 168.2
208.1
260.6
362.0
498.4
CAGR: 23.5 %
412.3
510.6
23.625.7*
Banco do Brasil - The Company 1 Half 2010st
14
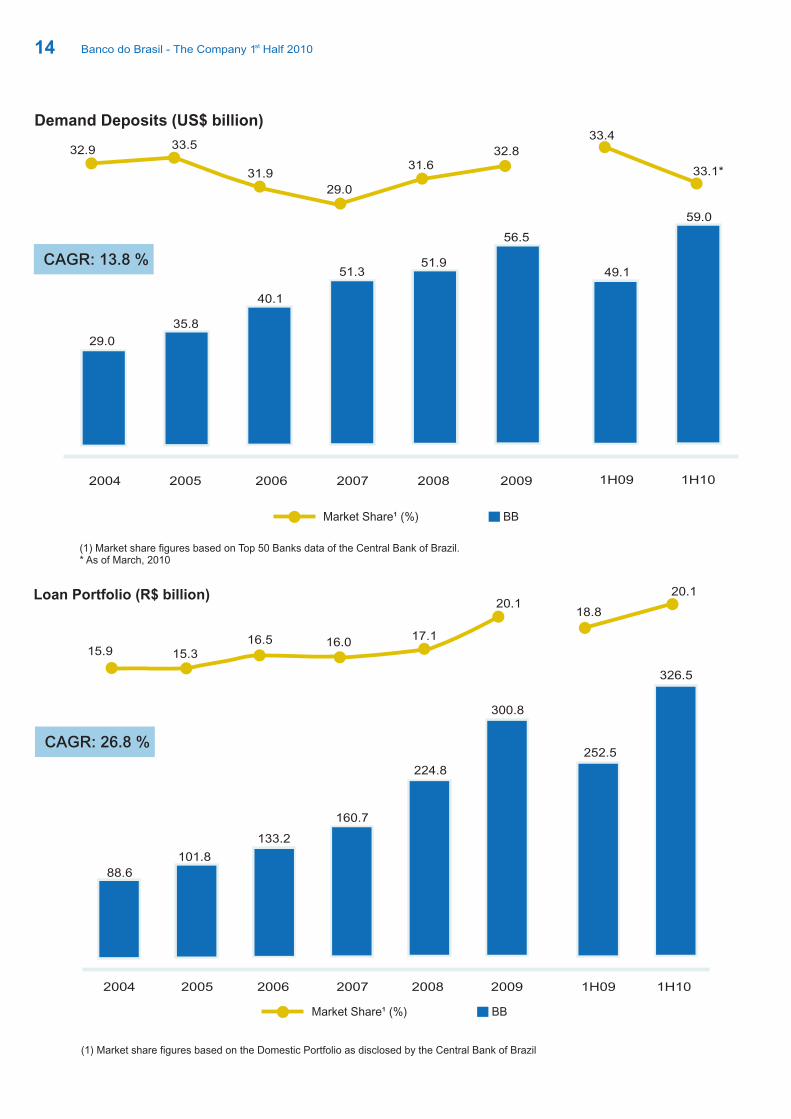
Demand Deposits (US$ billion)
Loan Portfolio (R$ billion)
(1) Market share figures based on the Domestic Portfolio as disclosed by the Central Bank of Brazil
(1) Market share figures based on Top 50 Banks data of the Central Bank of Brazil.* As of March, 2010
CAGR: 26.8 %
Market Share¹ (%) BB
CAGR: 13.8 %
32.9 33.5
31.9
29.0
31.632.8
29.0
35.8
40.1
51.351.9
56.5
2004 2005 2006 2007 2008 2009
49.1
59.0
1H09 1H10
33.4
33.1*
15.9 15.316.5 16.0
17.1
20.1
Market Share¹ (%) BB
88.6
101.8
133.2
160.7
224.8
300.8
2004 2005 2006 2007 2008 2009
252.5
326.5
1H09 1H10
18.8
20.1
Banco do Brasil - The Company 1 Half 2010st
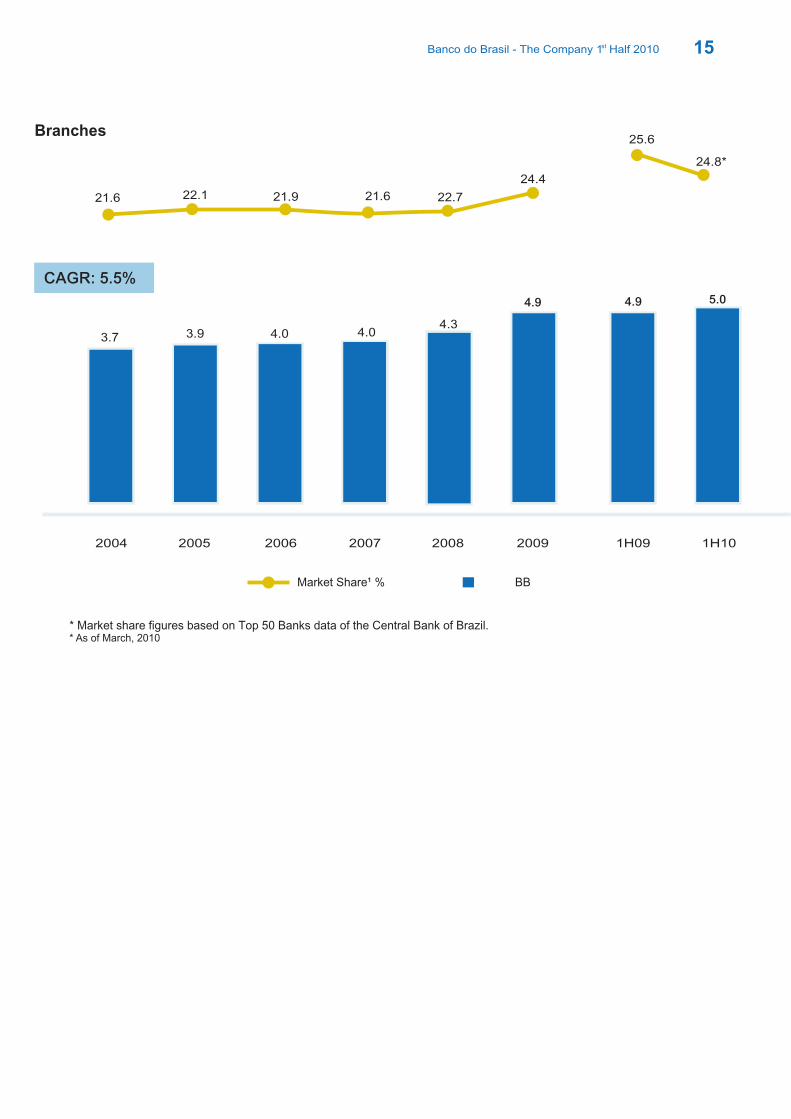
Branches
* Market share figures based on Top 50 Banks data of the Central Bank of Brazil.* As of March, 2010
21.6 22.1 21.9 21.6 22.7
24.4
15
Market Share¹ % BB
CAGR: 5.5%
2004 2005 2006 2007 2008 2009
3.7 3.9 4.0 4.04.3
4.9
1H09 1H10
5.04.9
25.6
24.8*
Banco do Brasil - The Company 1 Half 2010st

16
4. Financial Performance
In 1H10, Banco do Brasil recorded net income of R$ 5.1 billion and return on equity of 28.7%, which corresponds to earnings per share of R$ 1.98. Shareholders' equity increased 21.5% from the same period in 2009 to R$ 39.3 billion.
Net Income vs. ROE
Net Interest Income (NII) vs. Net Interest Margin (NIM)
15,48416,709
18,107
20,807
24,515
33,060
8.48.6
8.17.6
7.06.7
ROE % Net Income (R$ million)
NIM¹ (%) Net Interest Income¹ (R$ million)
23.026.8
32.1
22.5
32.530.7
2004 2005 2006 2007 2008 2009
3,024
4,154
6,0445,058
8,803
10,148
2004 2005 2006 2007 2008 2009
4,014
5,076
1H09 1H10
27.4 28.7
15,472
18,817
1H09 1H10
6.9
6.4
(1) Income statement with reallocations
Banco do Brasil - The Company 1 Half 2010st
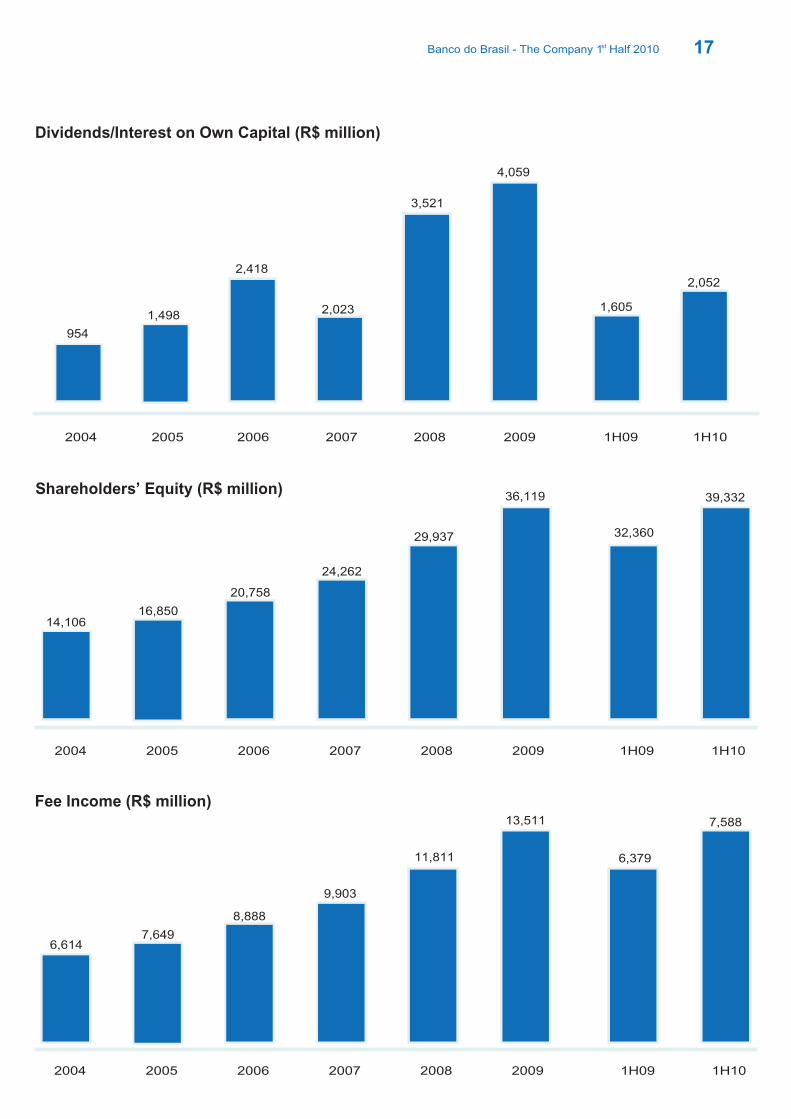
Dividends/Interest on Own Capital (R$ million)
Shareholders’ Equity (R$ million)
Fee Income (R$ million)
17
2004 2005 2006 2007 2008 2009
3,521
4,059
2,023
2,418
1,498
954
1H09 1H10
1,605
2,052
2004 2005 2006 2007 2008 2009
29,937
36,119
24,262
20,758
16,85014,106
1H09 1H10
32,360
39,332
2004 2005 2006 2007 2008 2009
11,811
13,511
9,903
8,888
7,6496,614
1H09 1H10
6,379
7,588
Banco do Brasil - The Company 1 Half 2010st
18
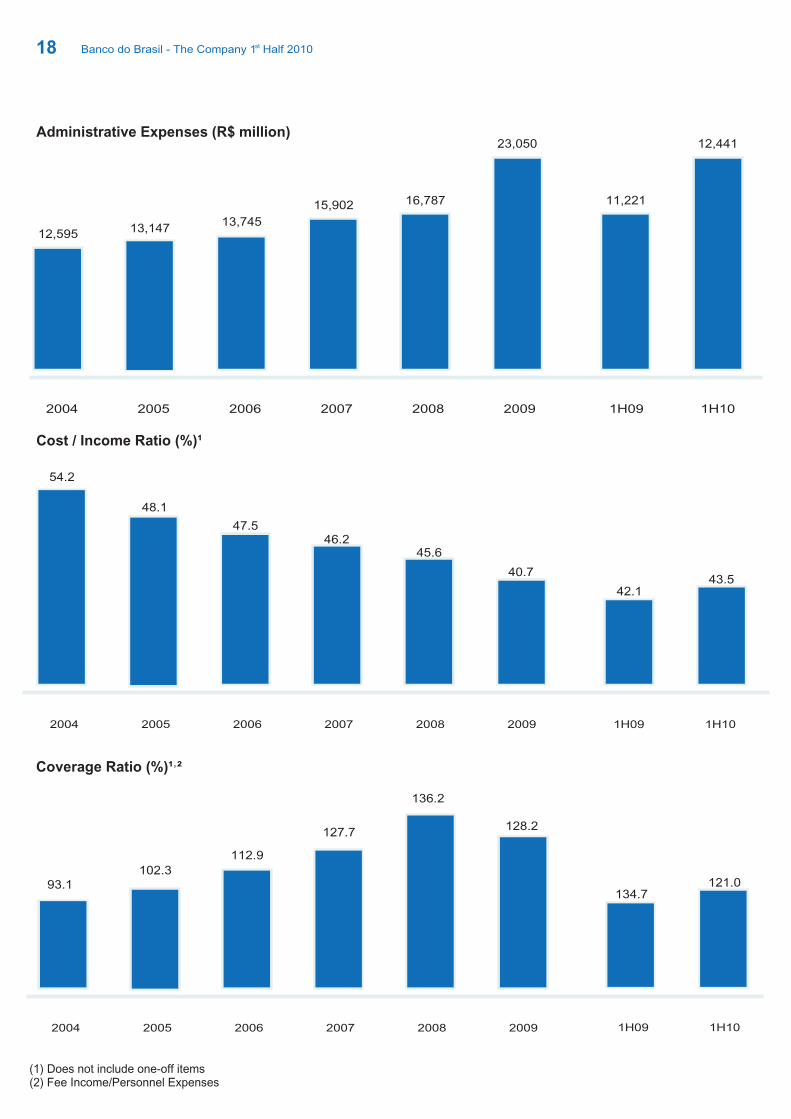
Administrative Expenses (R$ million)
Cost / Income Ratio (%)¹
Coverage Ratio (%)¹ ²,
2004 2005 2006 2007 2008 2009
136.2
128.2127.7
112.9
102.393.1
2004 2005 2006 2007 2008 2009
16,787
23,050
15,902
13,74513,14712,595
1H09 1H10
11,221
12,441
2004 2005 2006 2007 2008 2009
45.6
40.7
46.247.5
48.1
54.2
1H09 1H10
42.143.5
1H09 1H10
134.7121.0
(1) Does not include one-off items(2) Fee Income/Personnel Expenses
,
Banco do Brasil - The Company 1 Half 2010st

19
5. Banco do Brasil Stock
Banco do Brasil stock ended the first half of the year quoted at R$ 24.65, for gains of 23.7% in the last 12 months and devaluation of 16.2% in the quarter. Most of the price depreciation is explained by external factors, such as the slowing of the Chinese economy, weak consumer sentiment in the United States and concern with the fiscal sustainability of certain countries in the Euro Zone. Under this scenario, not even the positive projections for the Brazilian economy were sufficient to boost the local stock market.
In June 2010, Banco do Brasil carried out a public share offering. On June 30, after the bookbuilding process, Banco do Brasil stock was priced at R$ 24.65, which was in line with the closing price on that date. A total of 396 million shares were traded in the deal, with 286 million in the primary offer and 110 million in the secondary offer.
The offer amounted to R$ 9.8 billion, including the secondary offer. In the primary offer, the sale of new shares totaled R$ 7.0 billion, which will strength the institution's capital base and support its future growth. The offer also helped BB reach a free float of 30.4%.
In December 2009, Banco do Brasil launched its first American Depositary Receipts (ADR) Level 1 program in New York. On August 2, 2010, BB had 7.5 million outstanding ADRs, quoted at US$ 17.70.
In Brazil, BB stock was traded in all sessions on the São Paulo Stock Exchange (Bovespa) in 2010, with average daily trading volume of R$ 95.7 billion in the period. The stock remained a component of various stock indexes: Ibovespa, IBrX50, IBrX, Special Corporate Governance Index (IGC), Corporate Sustainability Index (ISE) and Special Tag-Along Index (ITAG). In the portfolio for the Ibovespa valid from May to August 2010, Banco do Brasil had the 13 highest weighting.th
Ownership Structure
National Treasury
Previ
Free Float
BNDESPar
National Treasury
Previ
Free Float
BNDESPar
21.8%
2.5%
10.2%65.5% 65.3%
21.9%
2.4%
10.4%
June 30, 2009 June 30, 2010 July 31, 2010¹
National Treasury
Previ
Free Float
BNDESPar
(1) Based on post-offering figures
59.2%
30.4%
0.01%
10.4%
rd
Banco do Brasil - The Company 1 Half 2010st
20
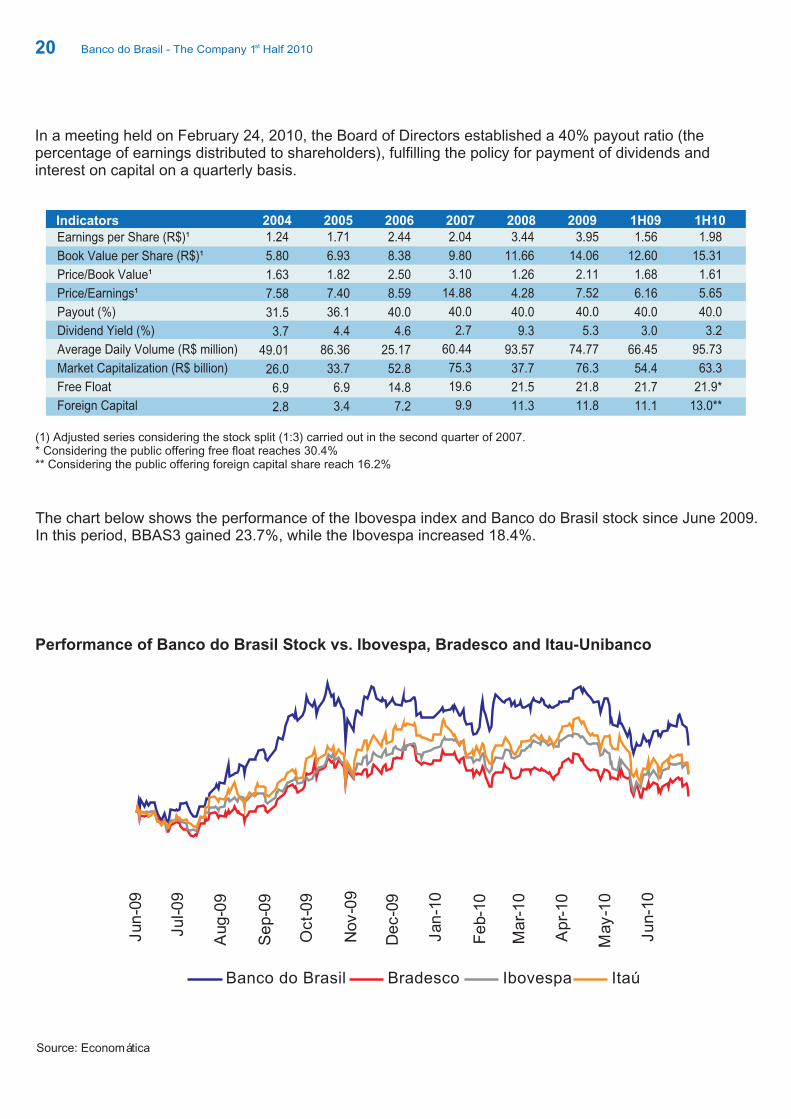
In a meeting held on February 24, 2010, the Board of Directors established a 40% payout ratio (the percentage of earnings distributed to shareholders), fulfilling the policy for payment of dividends and interest on capital on a quarterly basis.
The chart below shows the performance of the Ibovespa index and Banco do Brasil stock since June 2009. In this period, BBAS3 gained 23.7%, while the Ibovespa increased 18.4%.
Performance of Banco do Brasil Stock vs. Ibovespa, Bradesco and Itau-Unibanco
Source: Economática
(1) Adjusted series considering the stock split (1:3) carried out in the second quarter of 2007.* Considering the public offering free float reaches 30.4%** Considering the public offering foreign capital share reach 16.2%
Indicators 2004 2005 2006 2007 2008 20091.24
5.80
1.63
7.58
31.5
3.7
49.01
26.0
6.9
2.8
1.71
6.93
1.82
7.40
36.1
4.4
86.36
33.7
6.9
3.4
2.44
8.38
2.50
8.59
40.0
4.6
25.17
52.8
14.8
7.2
2.04
9.80
3.10
14.88
40.0
2.7
60.44
75.3
19.6
9.9
3.44
11.66
1.26
4.28
40.0
9.3
93.57
37.7
21.5
11.3
3.95
14.06
2.11
7.52
40.0
5.3
74.77
76.3
21.8
11.8
Earnings per Share (R$)¹
Book Value per Share (R$)¹
Price/Book Value¹
Price/Earnings¹
Payout (%)
Dividend Yield (%)
Average Daily Volume (R$ million)
Market Capitalization (R$ billion)
Free Float
Foreign Capital
1H09 1H101.56
12.60
1.68
6.16
40.0
3.0
66.45
54.4
21.7
11.1
1.98
15.31
1.61
5.65
40.0
3.2
95.73
63.3
21.9*
13.0**
Jun
-09
Ju
l-0
9
Aug
-09
Se
p-0
9
Oct-
09
Nov
-09
De
c-0
9
Jan
-10
Fe
b-1
0
Ma
r-1
0
Ap
r-10
May
-10
Ju
n-1
0
Banco do Brasil Bradesco Ibovespa Itaú
Banco do Brasil - The Company 1 Half 2010st

21
6. Corporate GovernanceBanco do Brasil, which joined the Novo Mercado special corporate governance listing segment of the São Paulo Stock Exchange (Bovespa) in 2006, is committed to transparency, accountability, equitable treatment and social and environmental responsibility, aligning the organization's management with the interests of shareholders and society. BB has also adopted stricter corporate governance practices, and since the public offering in June, BB stock has reached a free float of 30.4%, above the 25.0% required by Novo Mercado regulations.
BB stock is also a component of the Special Tag-Along Stock Index (ITAG) and Special Corporate Governance Stock Index (IGC), which track the performance of companies with differentiated tag-along rights and corporate governance best practices, respectively.
Banco do Brasil's decisions are taken collectively at all company levels. To involve executives in the
definition and approval of strategies for the company's different businesses, Management draws on
committees, subcommittees and commissions at a strategic level, which imparts greater agility and security
to the decision-making process.
Market relations
Committees, Subcommittees and Commissions - Strategic Level
In the first half of 2010, BB participated in 34 meetings with domestic investors and analysts, five conferences and organized 16 conference calls with analysts and investors. In addition, due to the public offering, the IR Team intensified its participation in national and international roadshows, marking a presence in 14 countries and eight Brazilian cities. BB's Investor Relations program was recognized as one of the best among large companies. BB also provides up-to-date information to shareholders and analysts through its Investor Relations website (bb.com.br/ri).
Liquidy & Risk
Market
Global Risk
Business andCommunication
Superior Inquiry
AuditorsCommitee
Board Of Directors
Credit Limit
Resources
Committee
Subcommittee
Comission
Prevetion ofFinancial and
Exchange FraudOperations
Operations EmployeeAssignment
Operational Administrative
Credit Risk
OperationalRisk
Channels
WorkAgreement
Management Board Management of Assets& Liabilities
and Liquidity
Management of Assets& Liabilities
and Liquidity
InformationSecurity
InformationTechnology
Ethics Superior
States for Ethics
Cost Managementand Operational
Efficiency
Banco do Brasil - The Company 1 Half 2010st
22
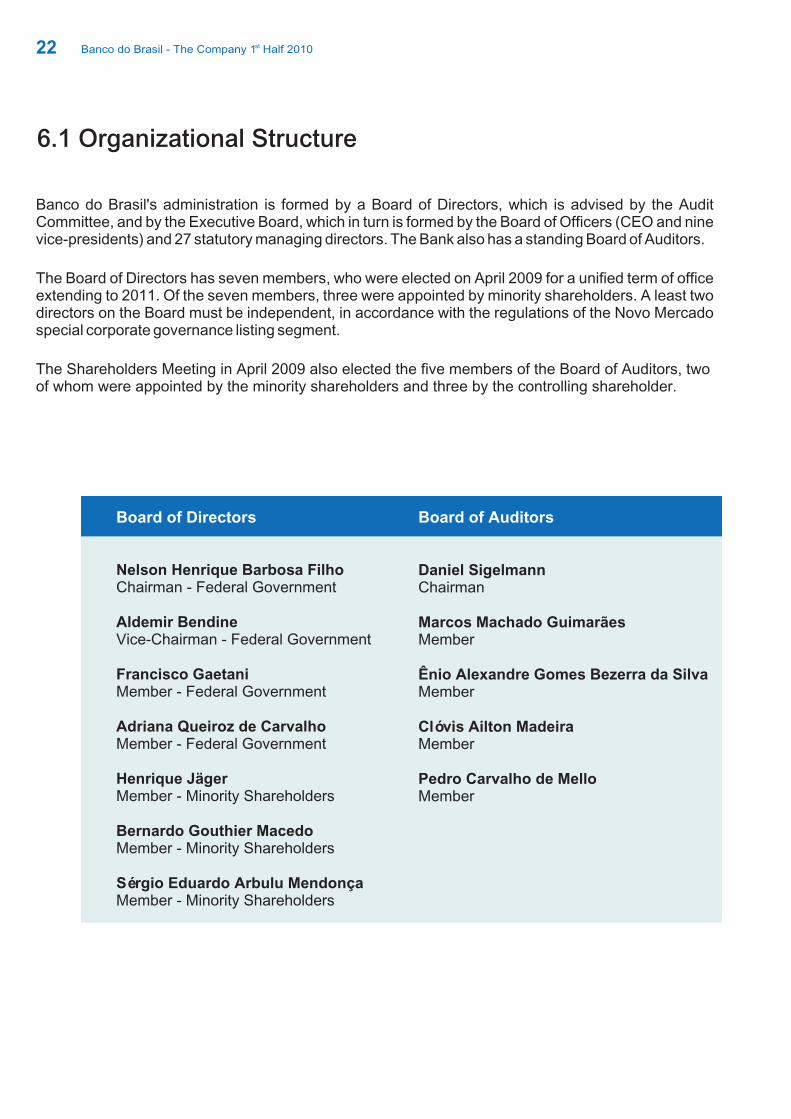
Banco do Brasil's administration is formed by a Board of Directors, which is advised by the Audit Committee, and by the Executive Board, which in turn is formed by the Board of Officers (CEO and nine vice-presidents) and 27 statutory managing directors. The Bank also has a standing Board of Auditors.
The Board of Directors has seven members, who were elected on April 2009 for a unified term of office extending to 2011. Of the seven members, three were appointed by minority shareholders. A least two directors on the Board must be independent, in accordance with the regulations of the Novo Mercado special corporate governance listing segment.
The Shareholders Meeting in April 2009 also elected the five members of the Board of Auditors, two of whom were appointed by the minority shareholders and three by the controlling shareholder.
6.1 Organizational Structure
Nelson Henrique Barbosa FilhoChairman - Federal Government
Aldemir BendineVice-Chairman - Federal Government
Francisco GaetaniMember - Federal Government
Adriana Queiroz de CarvalhoMember - Federal Government
Henrique JägerMember - Minority Shareholders
Bernardo Gouthier MacedoMember - Minority Shareholders
Sérgio Eduardo Arbulu MendonçaMember - Minority Shareholders
Daniel SigelmannChairman
Marcos Machado GuimarãesMember
Ênio Alexandre Gomes Bezerra da SilvaMember
Clóvis Ailton MadeiraMember
Pedro Carvalho de MelloMember
Board of Directors Board of Auditors
Banco do Brasil - The Company 1 Half 2010st

23
Bo
ard
of
Off
icers
Ban
co
do
Bra
sil S
.A.
Org
an
izati
on
al S
tru
ctu
re o
f th
e C
om
merc
ial B
an
k
Inte
rna
l A
ud
it
Dir
ecto
rsh
ips
CE
O
Un
its
Po
sit
ion
: J
un
e 3
0,
20
10
CE
O
of
Inte
rna
tio
na
lB
us
ine
ss
Wh
ole
sa
le
VP
of
Re
tail
Bu
sin
es
s
VP
of
Re
tail
an
dD
istr
ibu
tio
n
VP
of
Ag
rib
us
ine
ss
VP
of
Go
ve
rnm
en
t
VP
of
Fin
an
ce,
Ca
pit
al
Ma
rke
tsa
nd
IR
VP
of
Te
ch
no
log
ya
nd
Lo
gis
tic
s
VP
of
Pe
op
le M
an
ag
em
en
ta
nd
Su
sta
ina
ble
De
ve
lop
me
nt
VP
of
Cre
dit
,C
on
tro
lle
rsh
ipa
nd
Glo
ba
l R
isk
Co
mm
erc
ial
Inte
rna
tio
na
l
Lo
an
s a
nd
Fin
an
cin
g
Ins
ura
nc
e,
Pe
ns
ion
Pla
ns
an
dC
ap
ita
liza
tio
n
Hig
h I
nc
om
e
Ag
rib
us
ine
ss
Go
ve
rnm
en
t
Pe
ns
ion
Fu
nd
Ma
na
ge
me
nt
Fin
an
ce
Ca
pit
al
Ma
rke
ts
an
d I
nv
es
tme
nt
Inv
es
tor
Re
lati
on
s
Lo
gis
tic
s
Te
ch
no
log
y
So
ftw
are
De
ve
lop
me
nt
IT
Infr
ae
str
uc
ture
Op
era
tio
na
l
Su
pp
ort
Pe
op
le
Ma
na
ge
me
nt
Re
lati
on
s w
ith
Em
plo
ye
es
an
d
Sp
on
so
red
En
titi
es
Co
ntr
oll
ers
hip
Cre
dit
Ris
k
Ma
na
ge
me
nt
Re
es
tru
ctu
rin
g
of
Op
era
tio
na
l
As
se
ts
Ac
co
un
tin
g
Inte
rna
l
Co
ntr
ols
Str
ate
gy
Org
an
iza
tio
n
Se
cu
rity
Ma
na
ge
me
nt
Ma
rke
tin
g a
nd
Co
mm
un
ica
tio
n
Ex
ec
uti
ve
Se
cre
tari
at
Mic
ro
an
d S
ma
ll
En
terp
ris
es
Re
tail
Dis
trib
uti
on
Ne
two
rkM
an
ag
em
en
t
Su
sta
ina
ble
De
ve
lop
me
nt
Sã
o P
au
lo
Dis
trib
uti
on
Bo
ard
of
Au
dit
ors
Au
dit
Co
mm
itte
e
Bo
ard
of
Dir
ec
tors
Sh
are
ho
lde
rs G
en
era
l M
ee
tin
g
Dis
trib
uti
on
Ca
rds
Fo
reig
n
Tra
de
VP
an
d
an
d
Le
ga
l
Banco do Brasil - The Company 1 Half 2010st

24
RE
LA
TE
D C
OM
PA
NIE
S /
SH
AR
ES
CO
NT
RO
LL
ED
MA
NA
GE
DF
OU
ND
AT
ION
Po
sitio
n o
n J
une 3
0, 2010
CO
BR
AB
B-9
9.8
8%
ON
99.9
4%
Tota
lB
I-0
.007%
ON
0
.003%
T
ota
l
BB
LE
AS
ING
BB
- 1
00%
ON
100%
Tota
l
BB
CA
RT
ÕE
SB
B -
100%
ON
100%
Tota
l
BB
LE
AS
ING
Co
. L
TD
BB
- 1
00%
ON
1
00%
Tota
l
BB
D
TV
M
B
B -
100%
ON
100%
Tota
l
BB
SE
CU
RIT
IES
BA
MB
-100%
ON
1
00%
Tota
l
BB
TU
RIS
MO
B
AM
B -
99%
ON
BB
Leasi
ng -
1%
ON
100%
Tota
l
AT
IVO
S S
.A.
BB
BI -
49%
ON
74.5
0 %
Tota
lB
AM
B -
51%
ON
25.5
0%
Tota
l
B
AN
CO
DO
BR
AS
IL
BB
PR
EV
IDÊ
NC
IA
Priva
te P
ensi
on E
ntit
y
CA
SS
IP
RE
VI
FB
B
BB
CO
NS
ÓR
CIO
S
BB
-100%
ON
100%
Tota
l 1
00%
Tota
l
BR
AS
ILP
RE
V
49.9
9%
Tota
l
BR
AS
ILS
AÚ
DE
BB
Seguro
s 49.9
2%
ON
4
9.9
2%
Tota
l
BR
AS
ILC
AP
BB
Seguro
s 49.9
9%
ON
BR
AS
ILV
EÍC
UL
OS
BB
Seguro
s 40%
ON
7
0%
Tota
l
S
trate
gic
In
tere
st
Insu
ran
ce G
rou
p
B
B S
EG
UR
OS
CIB
RA
SE
CC
IEL
OC
BS
ST
EC
BA
N
Oth
er
Inte
rest
BB
BI
BB
AL
IAN
ÇA
PA
RT
ICIP
AÇ
ÕE
S
CA
DA
M
No
n-s
tra
teg
ic In
tere
st
S
tra
teg
ic In
tere
st
BA
NC
O
BV
PA
RT
ICIP
AÇ
ÕE
SV
OT
OR
AN
TIM
MA
PF
RE
NO
SS
AC
AIX
A
EB
P
ITA
PE
BI
KE
PL
ER
WE
BE
R
PR
ON
OR
NE
OE
NE
RG
IA
No
n-s
tra
teg
ic In
tere
st
S
trate
gic
In
tere
st
SB
CE
B
B-B
I 9.0
9%
ON
9.0
9%
Tota
lB
B
3.0
3%
ON
3
.03 %
Tota
l
B
B B
I
23.5
4%
O
N
2
3.5
4%
Tota
l
BB
BI
35
.00
%
ON
40
.35
%
To
tal
BB
BI
13
.53
%
ON
13
.53
%%
To
tal
BB
56
.19
% P
N
2
1.6
4%
To
tal
BB
49
.99
% O
N
5
0%
To
tal
B
NC
49
% O
N
49
% T
ota
l
B
B B
I
11.1
1%
O
N
11.1
1 T
ota
l
BB
-BI
19
% O
N
19
% T
ota
l
BB
-BI
1
7.5
7%
ON
17
.55
% T
ota
lB
BD
TV
M
0.0
2%
ON
0
.02
% T
ota
l
BB
1.7
7%
PN
1
.05
% T
ota
lB
B-B
I
5.5
1%
PN
3.2
7%
To
tal
BB
DT
VM
29
.51
% O
N
1
2.0
2%
To
tal
BB
-BI
8.8
1%
ON
8.8
1%
To
tal
BB
-BI
12.0
9%
ON
12.0
9%
Tota
l’’
BB
- C
onglo
mera
te -
Corp
ora
te C
onfig
ura
tion
SP
ON
SO
RE
D
BB
CO
RR
ET
OR
AB
B -
100%
ON
100%
Tota
l
BA
NC
O D
O B
RA
SIL
SE
CU
RIT
IES
L
LC
BB
- 1
00%
ON
100%
Tota
l
BE
SC
AV
AL
BB
– 1
00%
O
N
1
00%
Tota
l
NO
SS
A C
AIX
A A
DM
. D
E C
AR
TÕ
ES
B
B –
100%
ON
1
00%
Tota
l
NO
SS
A C
AIX
A C
AP
ITA
LIZ
AÇ
ÃO
B
B –
100%
ON
100%
Tota
l
BB
AL
IAN
ÇA
Alian
ça d
oB
rasil
BB
BI
BB
- 1
00%
ON
BA
NC
O D
OB
RA
SIL
AG
VIE
NA
BB
-100%
ON
100%
Tota
l
BB
US
A H
OL
DIN
GC
OM
PA
NY
, IN
C.
BB
AG
Vie
na -
100%
ON
100%
Tota
l
BB
MO
NE
Y
TR
AN
SF
ER
S,
INC
.B
B U
SA
Ho
ldC
o-1
00
% O
N
1
00
% T
ota
l
BA
MB
BB
-100%
ON
100%
Tota
l 100%
Tota
l
B
an
co
do
Bra
sil
Natio
nal T
reasu
ry
57.7
358 %
Pre
vi
BN
DE
SP
ar
Indiv
iduals
0.2
918 %
Inve
stim
ents
Guara
nte
e F
und
1.7
511 %
F
ore
ign C
apita
l
Caix
a F
I G
ara
ntia
Const
. N
ava
l
Exp
ort
Guara
nte
e F
und
5.4
244 %
10.3
720 %
2.4
285 %
Caix
a F
GH
AB
Inve
stim
ent
Fund
Com
panie
s
0.0
652 %
5.0
110 %
3.9
003 %
12.9
748 %
Sh
are
s in
Tre
asu
ry0
.04
51
%
BB
AL
IAN
ÇA
PA
RT
ICIP
AÇ
ÕE
SB
B -
100%
ON
100%
Tota
l
PA
RT
ICIP
AÇ
ÕE
S
BB
– 1
00%
O
N
100%
Tota
l
BB
Alia
nça
100%
O
N 1
00%
Tota
l
BB
Seguro
s 4
9.9
9%
ON
100%
PN
74.9
9%
Tota
l
FU
SE
SC
SIM
PR
EB
VE
PE
CO
NO
MU
S
Banco do Brasil - The Company 1 Half 2010st
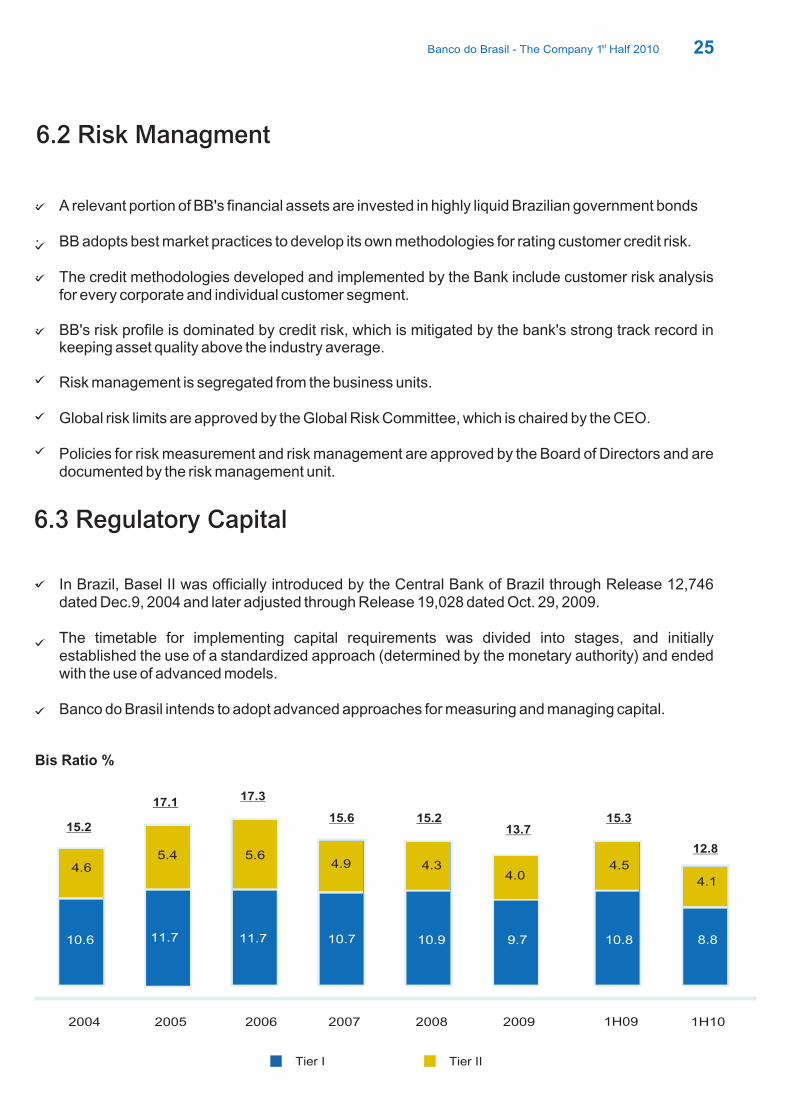
· A relevant portion of BB's financial assets are invested in highly liquid Brazilian government bonds · BB adopts best market practices to develop its own methodologies for rating customer credit risk.
· The credit methodologies developed and implemented by the Bank include customer risk analysis for every corporate and individual customer segment.
· BB's risk profile is dominated by credit risk, which is mitigated by the bank's strong track record in keeping asset quality above the industry average.
· Risk management is segregated from the business units.
· Global risk limits are approved by the Global Risk Committee, which is chaired by the CEO.
Policies for risk measurement and risk management are approved by the Board of Directors and are documented by the risk management unit.
25
6.2 Risk Managment
6.3 Regulatory Capital
· In Brazil, Basel II was officially introduced by the Central Bank of Brazil through Release 12,746 dated Dec.9, 2004 and later adjusted through Release 19,028 dated Oct. 29, 2009.
The timetable for implementing capital requirements was divided into stages, and initially established the use of a standardized approach (determined by the monetary authority) and ended with the use of advanced models.
Banco do Brasil intends to adopt advanced approaches for measuring and managing capital.
Bis Ratio %
Tier I Tier II
17.117.3
15.6 15.215.2
2004 2005 2006 2007 2008 2009
10.6 11.7 11.7 10.7 10.9
4.3
13.7
9.7
4.04.9
5.65.44.6
15.3
1H09 1H10
10.8
4.5
12.8
8.8
4.1
Banco do Brasil - The Company 1 Half 2010st

26
At the end of the first half, Banco do Brasil had 106.2 thousand employees, of which 59.0% were male
and 41.0% female. This workforce presented the following profile:
BB provided 113.6 hours of training per staff member during the year as part of its training program. In
addition, 3,759 employees were granted academic scholarships for undergraduate degrees, 5,307 for
graduate degrees, MBAs and master's degrees and 197 for language studies.
Age (%) Tenure (%) Education (%)
7. Human Resources
BB Stand -alone BNC BESC / BEP
35.7
29.2 25.4
27.5
Up to 5 years
From 6 to 10 years
From 11 to 20 years
Above 20 years
Up to 25 years
From 26 to 35 years
From 36 to 45 years
Above 45 years
46.5
21.9
6.2
21.8
0.629.3
48.3
7.6
Specialization, Master’s or Doctorate
High School
Elementary School
Bachelor’s Degree
Worksforce
79,725
83,751 82,672 81,855
86,059
103,971
14,150
2004 2005 2006 2007 2008 2009
2,818
14,027
87,126 14,150
1H09
3,148
86,316
1H10
106,241
14,150
2,752
12,797
89,194
2,878
106,241
Banco do Brasil - The Company 1 Half 2010st
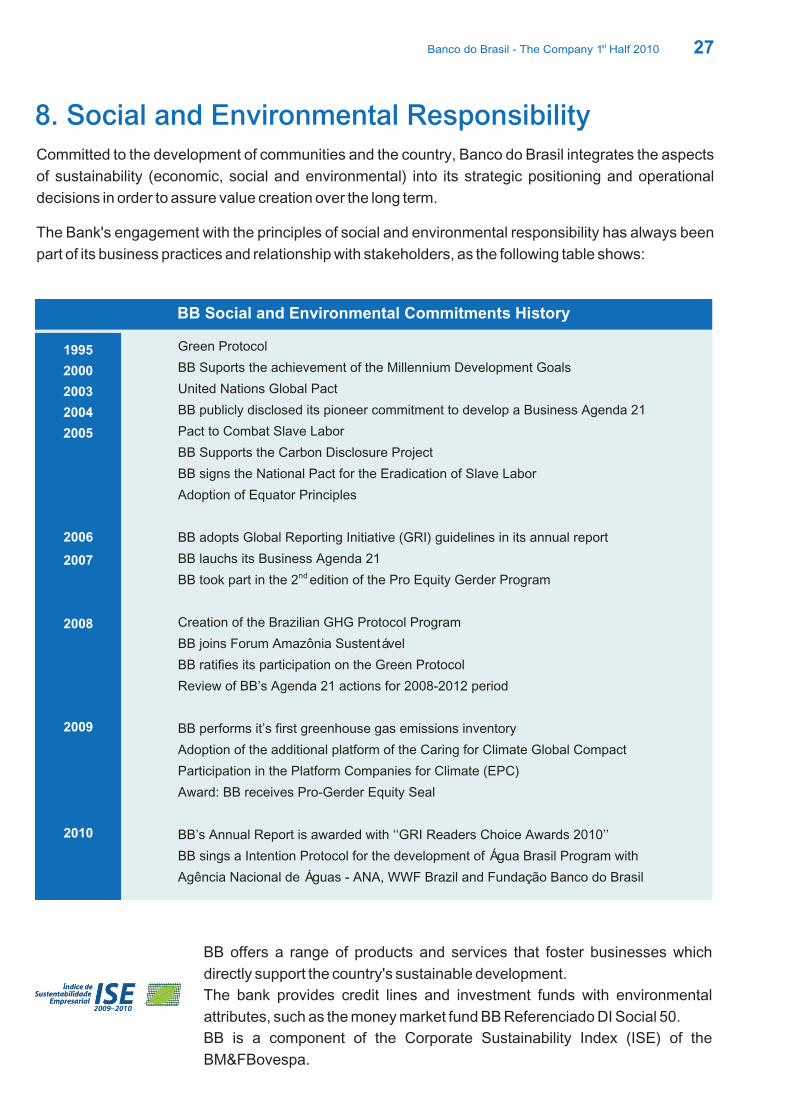
BB offers a range of products and services that foster businesses which
directly support the country's sustainable development.
The bank provides credit lines and investment funds with environmental
attributes, such as the money market fund BB Referenciado DI Social 50.
BB is a component of the Corporate Sustainability Index (ISE) of the
BM&FBovespa.
27
8. Social and Environmental ResponsibilityCommitted to the development of communities and the country, Banco do Brasil integrates the aspects
of sustainability (economic, social and environmental) into its strategic positioning and operational
decisions in order to assure value creation over the long term.
The Bank's engagement with the principles of social and environmental responsibility has always been
part of its business practices and relationship with stakeholders, as the following table shows:
Green Protocol
BB Suports the achievement of the Millennium Development Goals
United Nations Global Pact
BB publicly disclosed its pioneer commitment to develop a Business Agenda 21
Pact to Combat Slave Labor
BB Supports the Carbon Disclosure Project
BB signs the National Pact for the Eradication of Slave Labor
Adoption of Equator Principles
BB adopts Global Reporting Initiative (GRI) guidelines in its annual report
BB lauchs its Business Agenda 21
BB took part in the 2 edition of the Pro Equity Gerder Program
Creation of the Brazilian GHG Protocol Program
BB joins Forum Amazônia Sustentável
BB ratifies its participation on the Green Protocol
Review of BB’s Agenda 21 actions for 2008-2012 period
BB performs it’s first greenhouse gas emissions inventory
Adoption of the additional platform of the Caring for Climate Global Compact
Participation in the Platform Companies for Climate (EPC)
Award: BB receives Pro-Gerder Equity Seal
BB’s Annual Report is awarded with ‘‘GRI Readers Choice Awards 2010’’
BB sings a Intention Protocol for the development of Água Brasil Program with
Agência Nacional de Águas - ANA, WWF Brazil and Fundação Banco do Brasil
1995
2000
2003
2004
2005
BB Social and Environmental Commitments History
nd
2010
2009
2008
2006
2007
Banco do Brasil - The Company 1 Half 2010st
28
Banco do Brasil also innovated by disclosing on a quarterly basis the highlights of its Social and
Environmental Performance, presenting historical data and analyses that give the reader a better
understanding of how sustainability permeates the company's strategy and management. For more
information go to and read Chapter 9 of the MD&A.
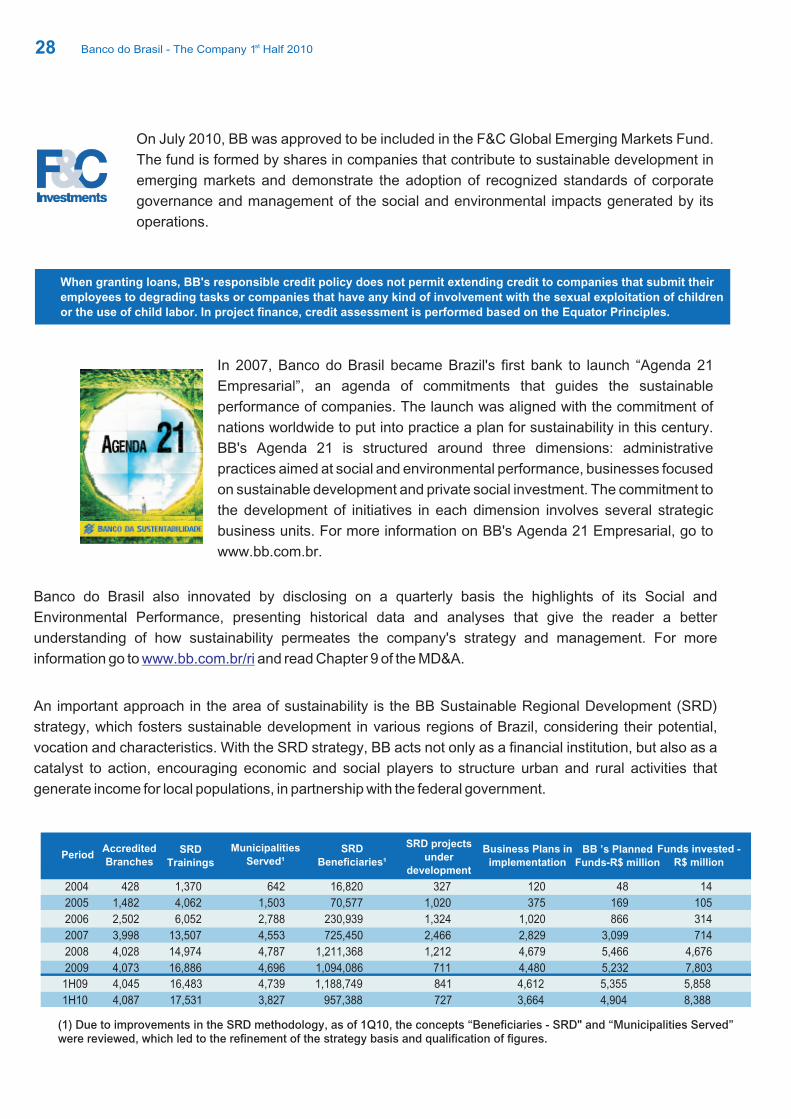
An important approach in the area of sustainability is the BB Sustainable Regional Development (SRD)
strategy, which fosters sustainable development in various regions of Brazil, considering their potential,
vocation and characteristics. With the SRD strategy, BB acts not only as a financial institution, but also as a
catalyst to action, encouraging economic and social players to structure urban and rural activities that
generate income for local populations, in partnership with the federal government.
www.bb.com.br/ri
(1) Due to improvements in the SRD methodology, as of 1Q10, the concepts “Beneficiaries - SRD" and “Municipalities Served”were reviewed, which led to the refinement of the strategy basis and qualification of figures.
When granting loans, BB's responsible credit policy does not permit extending credit to companies that submit their
employees to degrading tasks or companies that have any kind of involvement with the sexual exploitation of children
or the use of child labor. In project finance, credit assessment is performed based on the Equator Principles.
In 2007, Banco do Brasil became Brazil's first bank to launch “Agenda 21
Empresarial”, an agenda of commitments that guides the sustainable
performance of companies. The launch was aligned with the commitment of
nations worldwide to put into practice a plan for sustainability in this century.
BB's Agenda 21 is structured around three dimensions: administrative
practices aimed at social and environmental performance, businesses focused
on sustainable development and private social investment. The commitment to
the development of initiatives in each dimension involves several strategic
business units. For more information on BB's Agenda 21 Empresarial, go to
www.bb.com.br.
On July 2010, BB was approved to be included in the F&C Global Emerging Markets Fund.
The fund is formed by shares in companies that contribute to sustainable development in
emerging markets and demonstrate the adoption of recognized standards of corporate
governance and management of the social and environmental impacts generated by its
operations.
1H09
1H10
4,045
4,087
16,483
17,531 3,827
4,739
957,388
1,188,749
727
841
3,664
4,612
4,904
5,355
8,388
5,858
2004
2005
2006
2007
2008
2009
428
1,482
2,502
3,998
4,028
4,073
1,370
4,062
6,052
13,507
14,974
16,886
642
1,503
2,788
4,553
4,787
4,696
327
1,020
1,324
2,466
1,212
711
120
375
1,020
2,829
4,679
4,480
48
169
866
3,099
5,466
5,232
14
105
314
714
4,676
7,803
PeriodAccredited
Branches SRD
Trainings
Municipalities
Served¹SRD
Beneficiaries¹Business Plans in
implementationBB ’s Planned
Funds-R$ million
Funds invested -
R$ million
SRD
under
development
projects
16,820
70,577
230,939
725,450
1,211,368
1,094,086
Banco do Brasil - The Company 1 Half 2010st
29
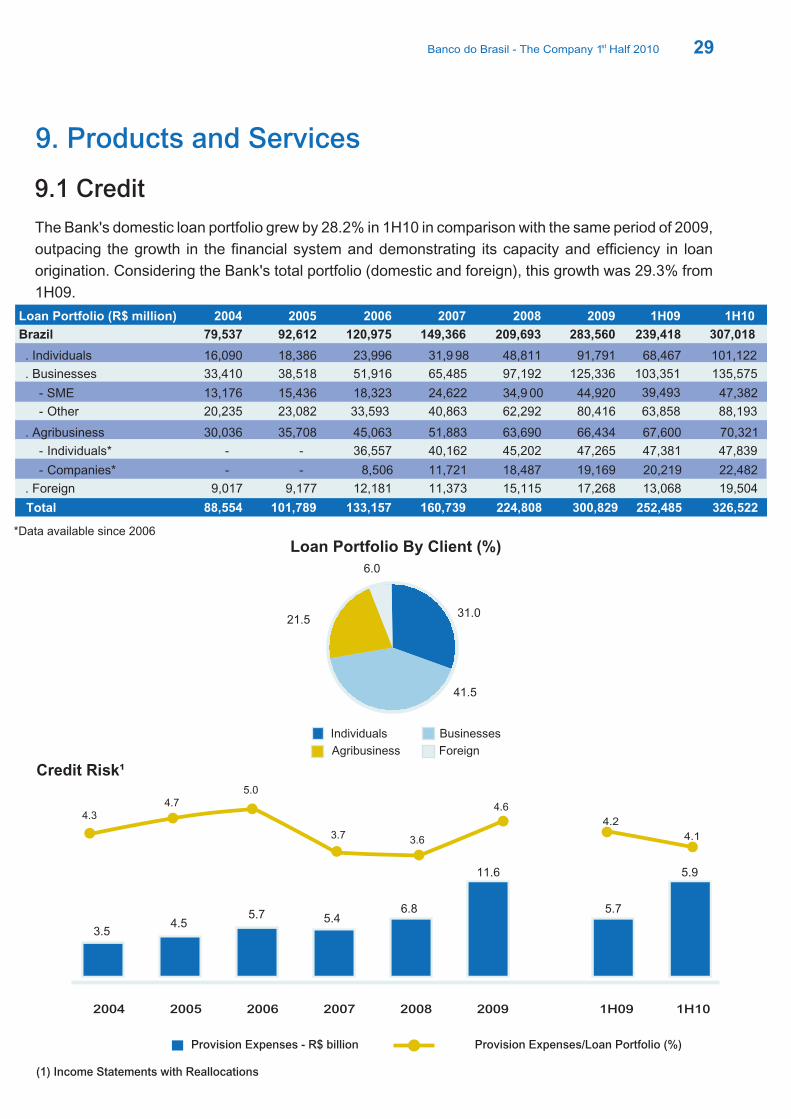
9. Products and Services
The Bank's domestic loan portfolio grew by 28.2% in 1H10 in comparison with the same period of 2009,
outpacing the growth in the financial system and demonstrating its capacity and efficiency in loan
origination. Considering the Bank's total portfolio (domestic and foreign), this growth was 29.3% from
1H09.
9.1 Credit
Loan Portfolio By Client (%)
Individuals Businesses
Agribusiness Foreign
31.0
6.0
21.5
41.5
Credit Risk¹
4.6
3.63.7
5.04.7
4.3
Provision Expenses - R$ billion Provision Expenses/Loan Portfolio (%)
*Data available since 2006
Loan Portfolio (R$ million) 2004 2005 2006 2007 2008 2009
Brazil 79,537 92,612 120,975 149,366 209,693 283,560
. Individuals 16,090 18,386 23,996 31,9 98 48,811 91,791
. Businesses 33,410 38,518 51,916 65,485 97,192 125,336
- SME 13,176 15,436 18,323 24,622 34,9 00 44,920
- Other 20,235 23,082 33,593 40,863 62,292 80,416
. Agribusiness 30,036 35,708 45,063 51,883 63,690 66,434
- Individuals* - - 36,557 40,162 45,202 47,265
- Companies* - - 8,506 11,721 18,487 19,169
. Foreign 9,017 9,177 12,181 11,373 15,115 17,268
Total 88,554 101,789 133,157 160,739 224,808 300,829
1H09 1H10
239,418 307,018
68,467 101,122
103,351 135,575
39,493 47,382
63,858 88,193
67,600 70,321
47,381 47,839
20,219 22,482 13,068 19,504
252,485 326,522
2004 2005 2006 2007 2008 2009
1.7
11.6
3.5 4.5
5.7 5.4 6.8
1H09 1H10
1.7
5.9
5.7
4.2
4.1
(1) Income Statements with Reallocations
Banco do Brasil - The Company 1 Half 2010st
30
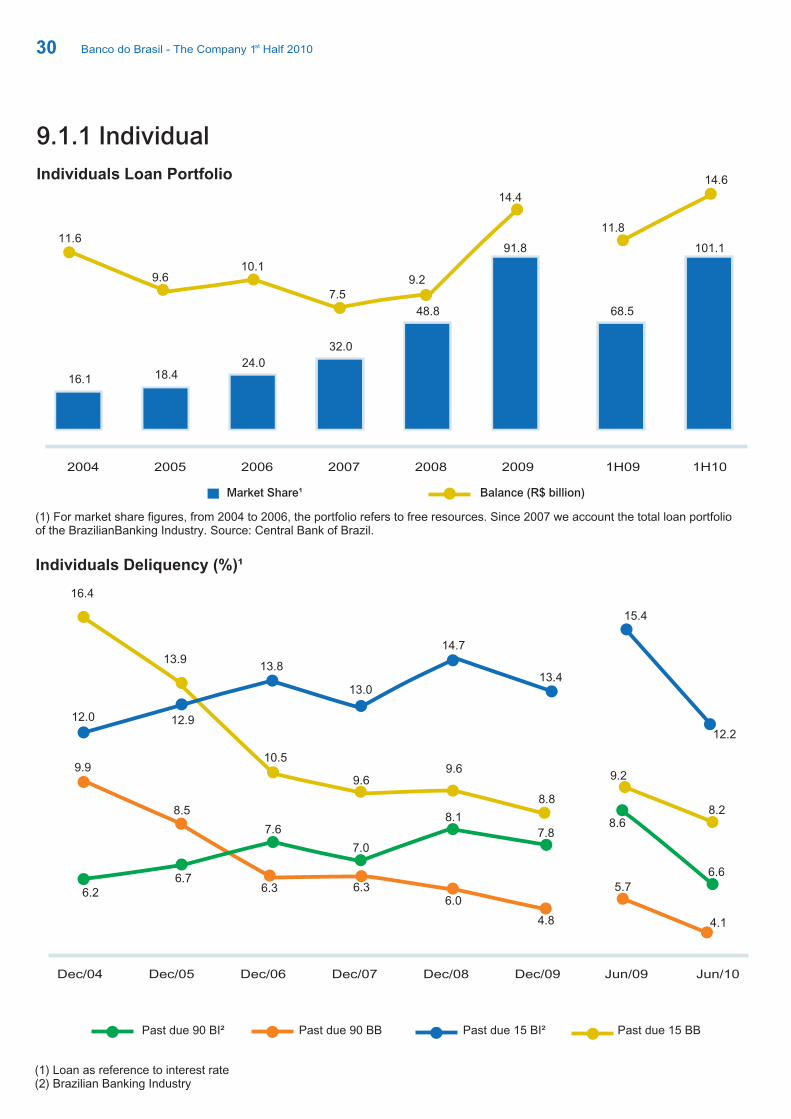
9.1.1 Individual
Individuals Loan Portfolio
Individuals Deliquency (%)¹
(1) Loan as reference to interest rate(2) Brazilian Banking Industry
Past due 90 BI² Past due 90 BB Past due 15 BI² Past due 15 BB
2004 2005 2006 2007 2008 2009
16.1 18.4 24.0
32.0
48.8
91.8
1H09 1H10
68.5
101.1
(1) For market share figures, from 2004 to 2006, the portfolio refers to free resources. Since 2007 we account the total loan portfolioof the BrazilianBanking Industry. Source: Central Bank of Brazil.
7.6
7.0
8.1
6.3
6.3
6.0
4.8
12.0
13.8
13.0
14.7
13.4
16.4
13.9
10.5
9.6
9.6
8.8
7.8
6.7
6.2
9.9
8.5
12.9
Dec/04 Dec/05 Dec/06 Dec/07 Dec/08 Dec/09 Jun/09 Jun/10
15.4
12.2
9.2
8.28.6
6.6
5.7
4.1
11.6
9.610.1
7.59.2
14.4
11.8
14.6
Market Share¹ Balance (R$ billion)
Banco do Brasil - The Company 1 Half 2010st

31
Payroll Loans (R$ Billion)¹
Vehicle Loans
Market Share (%) Balance (R$ billion)
1.2
2.7
4.8
13.2
(1) Includes results from BV since 2H09.
The strategic partnership with Banco Votorantim started on 2009 allowed BB to continue expanding its
vehicle loan portfolio.
2005 2006 2007 2008 2009¹
0.2 0.9
3.0
6.7
20.7
1H09 1H10
8.2
22.85.5
13.6
(1) Includes results from BV and BNC
2004 2005 2006 2007 2008 2009¹
1.5
3.8
8.3
11.9
17.6
36.5
1H09 1H10
29.5
40.5
8.7
12.0
17.2
18.4
22.3
33.8
32.2
32.8
Market Share² (%) Balance (R$ billion)
Banco do Brasil - The Company 1 Half 2010st
(2) For market share figures, from 2004 to 2006, the portfolio refers to free resources.Since 2007 we account the total loan portfolio of the BrazilianBanking Industry. Source: Central Bank of Brazil.
32
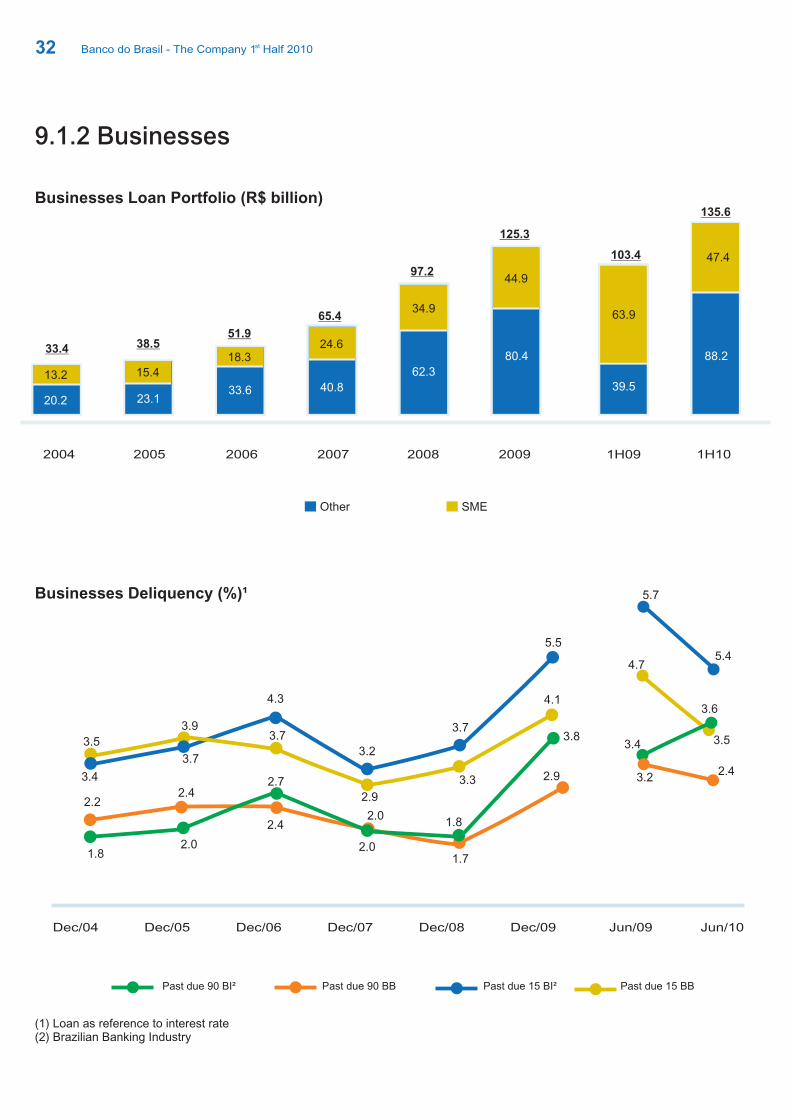
9.1.2 Businesses
Businesses Loan Portfolio (R$ billion)
Businesses Deliquency (%)¹
Other SME
Past due 90 BI² Past due 90 BB Past due 15 BI² Past due 15 BB
2004 2005 2006 2007 2008 2009
33.6 40.8
62.3
80.4
13.2
33.4 38.551.9
65.4
97.2
125.3
15.4
18.324.6
34.9
44.9
23.120.2
1H09 1H10
39.5
88.2
103.4
135.6
47.4
3.8
2.4
2.01.7
2.93.4
3.5
4.3
3.2
3.7
5.5
2.01.8
2.7
2.01.8
2.42.2
3.7
3.9
2.9
3.7
3.3
4.1
5.7
5.44.7
3.53.4
3.6
3.22.4
Dec/04 Dec/05 Dec/06 Dec/07 Dec/08 Dec/09 Jun/09 Jun/10
(1) Loan as reference to interest rate(2) Brazilian Banking Industry
63.9
Banco do Brasil - The Company 1 Half 2010st
33
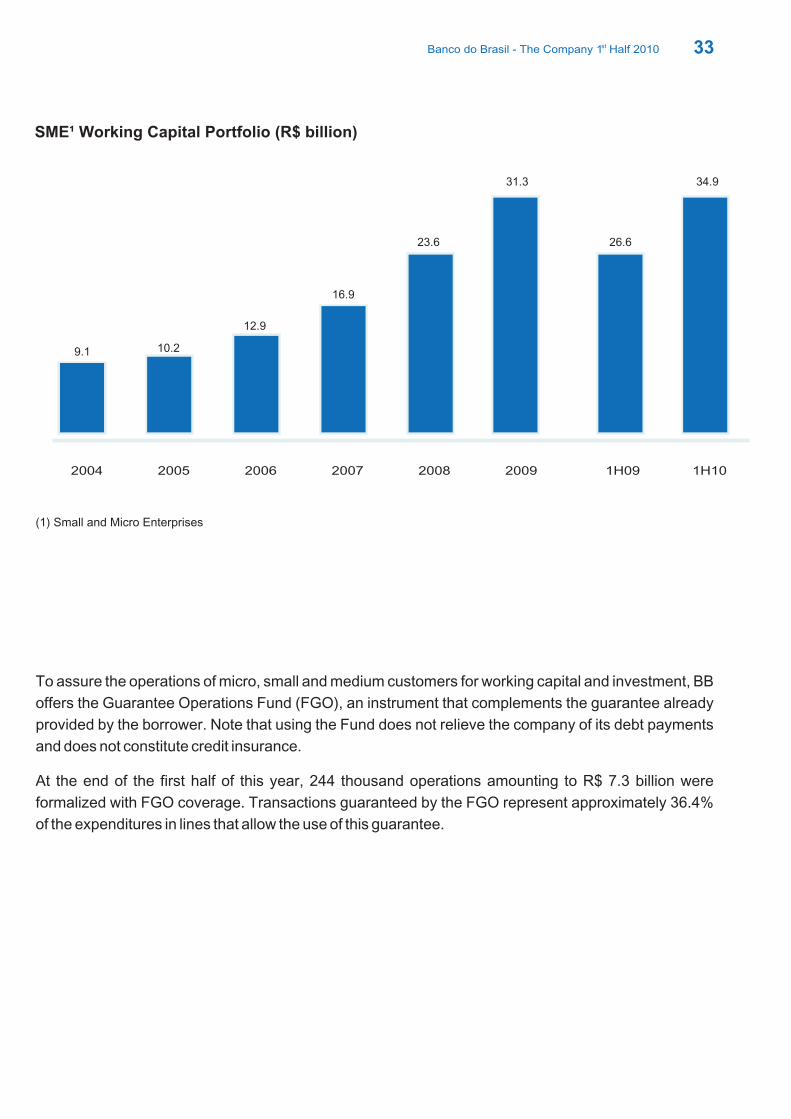
SME¹ Working Capital Portfolio (R$ billion)
(1) Small and Micro Enterprises
2004 2005 2006 2007 2008 2009
9.1 10.2
12.9
16.9
23.6
31.3
1H09 1H10
26.6
34.9
To assure the operations of micro, small and medium customers for working capital and investment, BB
offers the Guarantee Operations Fund (FGO), an instrument that complements the guarantee already
provided by the borrower. Note that using the Fund does not relieve the company of its debt payments
and does not constitute credit insurance.
At the end of the first half of this year, 244 thousand operations amounting to R$ 7.3 billion were
formalized with FGO coverage. Transactions guaranteed by the FGO represent approximately 36.4%
of the expenditures in lines that allow the use of this guarantee.
Banco do Brasil - The Company 1 Half 2010st
34
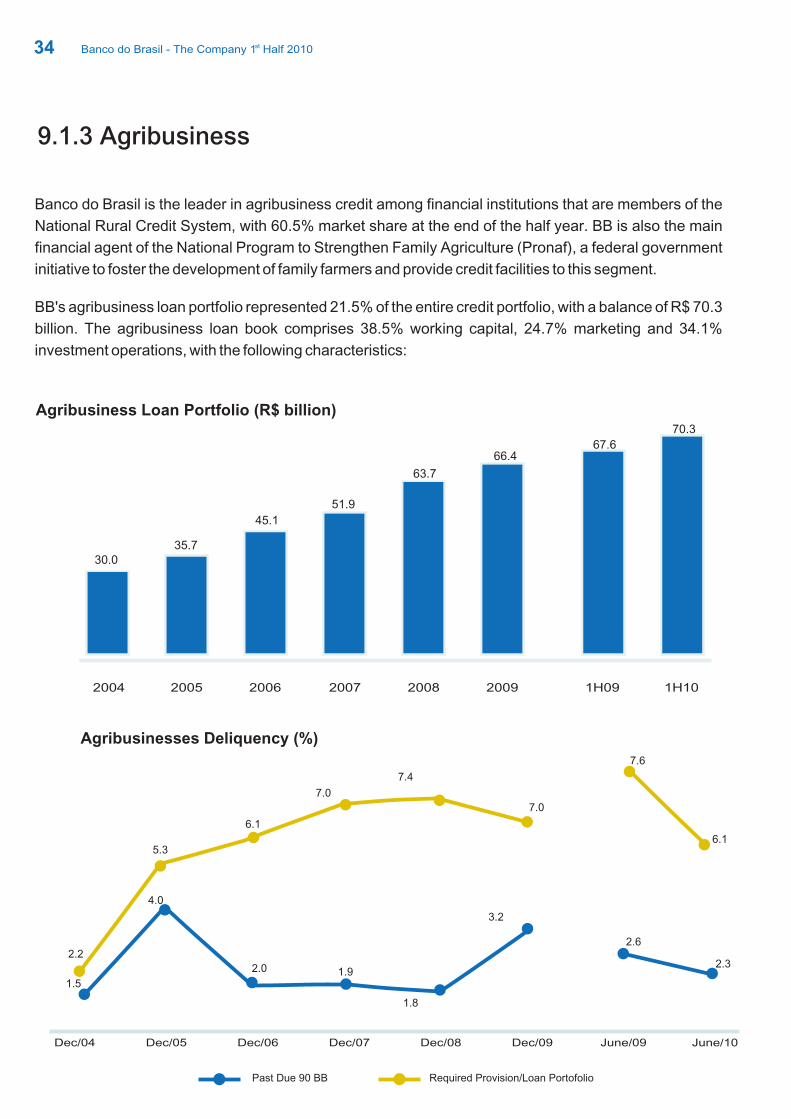
9.1.3 Agribusiness
Banco do Brasil is the leader in agribusiness credit among financial institutions that are members of the
National Rural Credit System, with 60.5% market share at the end of the half year. BB is also the main
financial agent of the National Program to Strengthen Family Agriculture (Pronaf), a federal government
initiative to foster the development of family farmers and provide credit facilities to this segment.
BB's agribusiness loan portfolio represented 21.5% of the entire credit portfolio, with a balance of R$ 70.3
billion. The agribusiness loan book comprises 38.5% working capital, 24.7% marketing and 34.1%
investment operations, with the following characteristics:
Agribusiness Loan Portfolio (R$ billion)
Agribusinesses Deliquency (%)
1.5
4.0
1.9
1.8
3.2
2.2
6.1
7.0
7.0
2.0
5.3
7.4
Past Due 90 BB Required Provision/Loan Portofolio
2004 2005 2006 2007 2008 2009
30.035.7
45.1
51.9
63.7
66.4
1H09 1H10
67.6
70.3
Dec/04 Dec/05 Dec/06 Dec/07 Dec/08 Dec/09 June/09 June/10
7.6
6.1
2.6
2.3
Banco do Brasil - The Company 1 Half 2010st
35
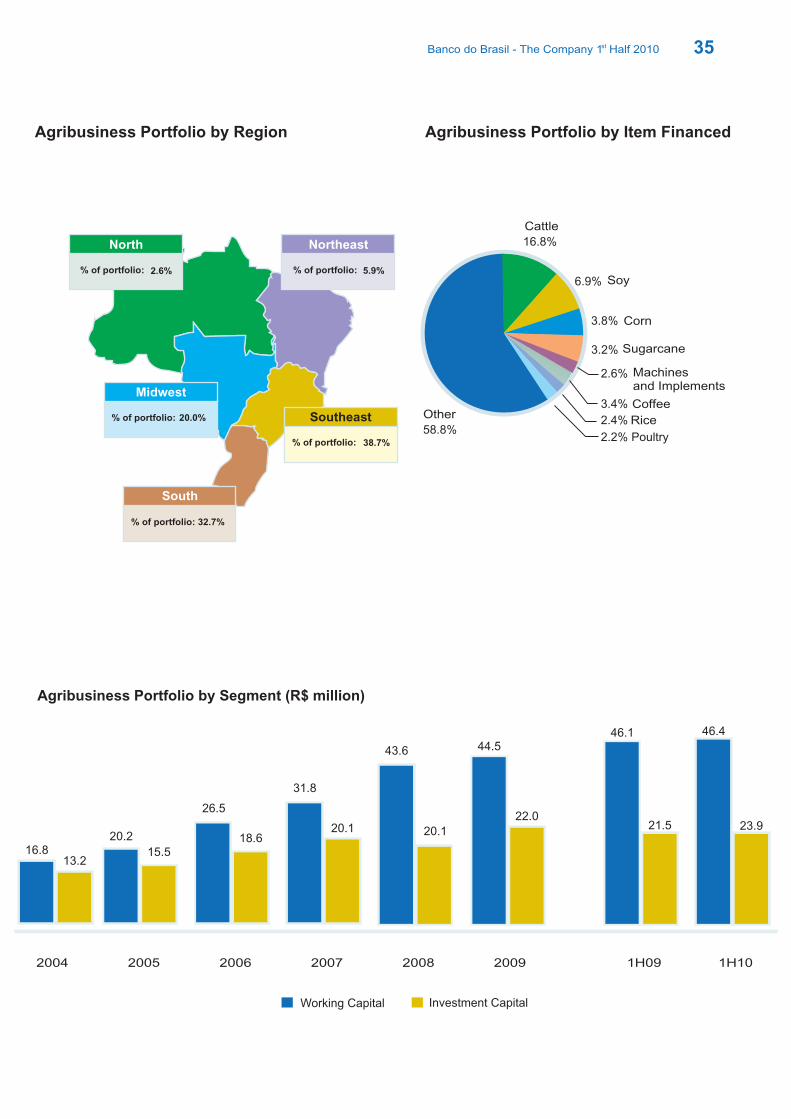
Agribusiness Portfolio by Region Agribusiness Portfolio by Financed Item
Agribusiness Portfolio by Segment (R$ million)
Southeast
% of portfolio: 38.7%
% of portfolio: 32.7%
South
6.9%
3.8%
3.2%
Other
58.8%
16.8%
2.6%
3.4%
2.4%
2.2% Poultry
Cattle
Soy
Corn
Sugarcane
Machines and Implements
Coffee
Rice
North
% of portfolio: 2.6%
Northeast
% of portfolio: 5.9%
Midwest
% of portfolio: 20.0%
16.820.2
26.5
31.8
43.6
20.1
22.0
44.5
20.118.6
15.513.2
2004 2005 2006 2007 2008 2009
Investment CapitalWorking Capital
21.5
46.1
1H09
23.9
46.4
1H10
Banco do Brasil - The Company 1 Half 2010st

36
The Bank has mechanisms to mitigate risk in the agribusiness loan portfolio. In the 2009/2010 marketing year, as of
June 2010, 61% of loan transactions were carried out with Agricultural Insurance or Proagro (government
insurance), amounting to R$ 9.0 billion.
MarketingAgricultural Costs Agroindustrial CreditInvestment Livestock Costs
National Program to Strengthen Family Agriculture (Pronaf)
Number of Contracts (thousand) Contracted Volume (R$ billion)
894
1,1481,034 1,037
887 915
15.5%
13.6%
26.1% 31.8%
39%
61%
Insured
Not Insured
Contracted Crop 2009/2010 Agri Insurance
13.0%
2004 2005 2006 2007 2008 2009
3.6
4.95.4
5.9
6.6
8.1
1H09
3.0
1H10
3.4
The National Program to Strengthen Family Agriculture (PRONAF) is a federal government program that helps
micro and small farmers who operate by directly employing labor and their families to become part of the
agribusiness chain, providing income improvements and adding value to products and properties by modernizing
the production system and enhancing the professionalism of these farmers.
249245
Family Agriculture
Banco do Brasil - The Company 1 Half 2010st

37
Foreign Exchange for Imports
In the first half of 2010, BB consolidated its leadership in the export and import market, with market
shares of 30.6% and 24.8% and contracted volumes of US$ 14.2 billion and US$ 10.4 billion,
respectively
Foreign Exchange for Exports
9.1.4 Foreign Trade
Market Share (%)
Market Share (%) Contracted Volume (US$ billion)
Contracted Volume (US$ billion)
23.922.3
23.8 24.2 24.7 25.4
27.2 27.0 26.5 26.628.0
31.1
2004 2005 2006 2007 2008 2009
25.9
34.239.4
51.2 54.247.1
1H09 1H10
23.225.6
31.330.6
2004 2005 2006 2007 2008 2009
13.5 15.920.7
26.1
34.534.1
1H09 1H10
14.319.5
24.524.9
Banco do Brasil - The Company 1 Half 2010st

BB is the exclusive financial agent of Proex, the federal government's Export Finance Program, with
balances of US$ 166 million under the Financing type and US$ 37 million under the Equalization type,
supporting the export market with a total of US$ 203.0 million. BB is also an important player in the Exim
program of the Brazilian Development Bank (BNDES), with volume reaching US$ 219.8 million in the half
year.
38
ACC/ACE
PROEX
Supported Companies Contracted Volume - Financing (US$ million)
30,37032,116
29,21127,185
20,557
16,560
409452
337358 359
400
Number of Contracts Contracted Volume (US$ billion)
2004 2005 2006 2007 2008 2009
9.0
11.9 12.1
15.1
13.0
10.9
1H09 1H10
5.56.2
7,785
8,936
2004 2005 2006 2007 2008 2009
286.0
428.9
382.9
331.6297.0
278.3
1H09 1H10
130.5
166.0
251263
Banco do Brasil - The Company 1 Half 2010st
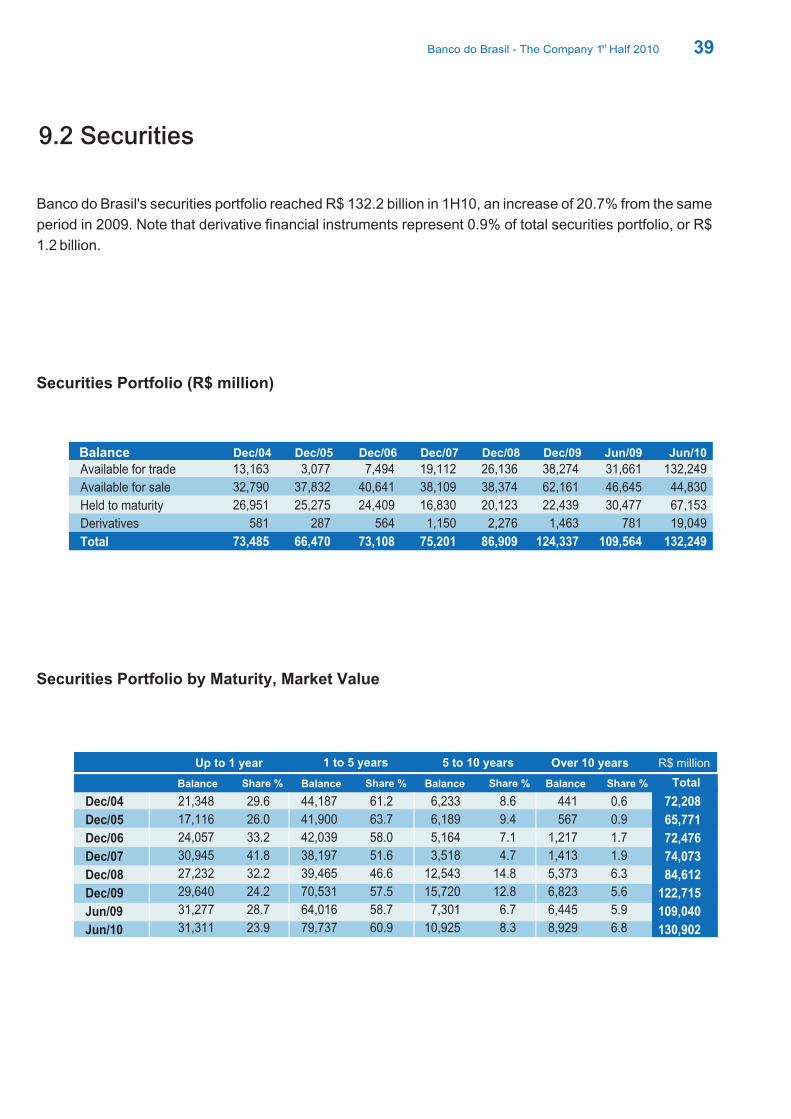
Banco do Brasil's securities portfolio reached R$ 132.2 billion in 1H10, an increase of 20.7% from the same
period in 2009. Note that derivative financial instruments represent 0.9% of total securities portfolio, or R$
1.2 billion.
39
9.2 Securities
Balance Dec/06 Dec/07 Dec/08 Dec/09 Jun/09 Jun/10
40,641
24,409
564
7,494
73,108
38,109
16,830
1,150
19,112
75,201
38,374
20,123
2,276
26,136
86,909
62,161
22,439
1,463
38,274
124,337
31,661
46,645
30,477
781
109,564
132,249
44,830
67,153
19,049
132,249
Available for trade
Available for sale
Held to maturity
Derivatives
Total
Securities Portfolio (R$ million)
Securities Portfolio by Maturity, Market Value
Dec/04 Dec/05
13,163
32,790
26,951
581
73,485
3,077
37,832
25,275
287
66,470
Balance Balance Balance BalanceShare %
Up to 1 year 1 to 5 years 5 to 10 years Over 10 years R$ million
Share % Share % Share % Total
Dec/04
Dec/05
Dec/06
Dec/07
Dec/08
Dec/09
Jun/09
Jun/10
72,208
65,771
72,476
74,073
84,612
122,715
109,040
130,902
21,348
17,116
24,057
30,945
27,232
29,640
31,277
31,311
29.6
26.0
33.2
41.8
32.2
24.2
28.7
23.9
44,187
41,900
42,039
38,197
39,465
70,531
64,016
79,737
61.2
63.7
58.0
51.6
46.6
57.5
58.7
60.9
6,233
6,189
5,164
3,518
12,543
15,720
7,301
10,925
8.6
9.4
7.1
4.7
14.8
12.8
6.7
8.3
441
567
1,217
1,413
5,373
6,823
6,445
8,929
0.6
0.9
1.7
1.9
6.3
5.6
5.9
6.8
Banco do Brasil - The Company 1 Half 2010st
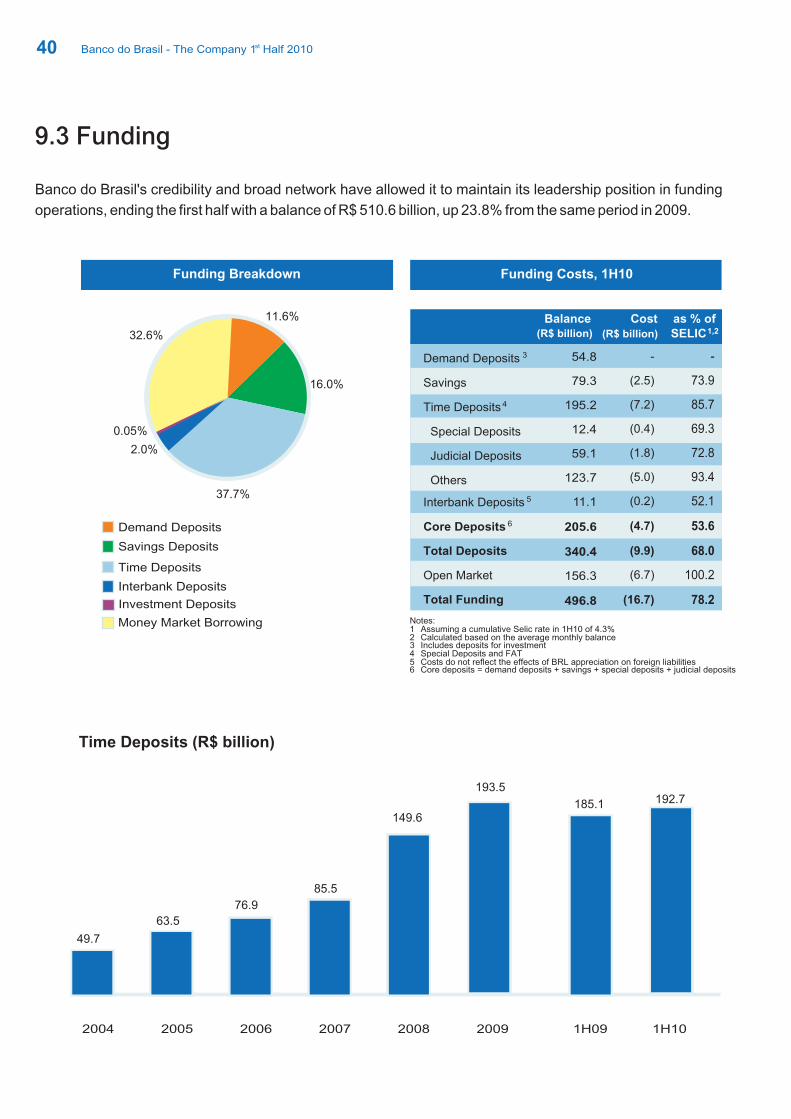
Banco do Brasil's credibility and broad network have allowed it to maintain its leadership position in funding
operations, ending the first half with a balance of R$ 510.6 billion, up 23.8% from the same period in 2009.
40
9.3 Funding
Time Deposits (R$ billion)
11.6%
2.0%
0.05%
16.0%
37.7%
Funding Breakdown Funding Costs, 1H10
Demand Deposits
Time Deposits
Savings Deposits
Interbank Deposits
32.6%
Money Market Borrowing Notes: 1 Assuming a cumulative Selic rate in 1H10 of 4.3%2 Calculated based on the average monthly balance3 Includes deposits for investment4 Special Deposits and FAT 5 Costs do not reflect the effects of BRL appreciation on foreign liabilities 6 Core deposits = demand deposits + savings + special deposits + judicial deposits
2004 2005 2006 2007 2008 2009
49.7
63.5
76.9
85.5
149.6
193.5
1H09 1H10
185.1 192.7
Investment Deposits
Banco do Brasil - The Company 1 Half 2010st
0
Cost (R$ billion)
as % ofSELIC1,2
Core Deposits
Balance (R$ billion)
Time Deposits 4
Savings
Interbank Deposits 5
Demand Deposits 3
Total Deposits
Special Deposits
Judicial Deposits
Others
Total Funding
6
54.8
79.3
195.2
12.4
59.1
123.7
11.1
205.6
340.4
156.3
496.8
-
(2.5)
(7.2)
(0.4)
(1.8)
(5.0)
(0.2)
(4.7)
(9.9)
(6.7)
(16.7)
-
73.9
85.7
69.3
72.8
93.4
52.1
53.6
68.0
100.2
78.2
Open Market

BB Administração de Ativos - Distribuidora de Títulos e Valores Mobiliários (BB DTVM), a wholly owned
subsidiary of Banco do Brasil, increased its market share at the end of the first half of 2010 to 22.3 %, from
20.3% in the same period of 2009, according to the Brazilian Financial and Capital Markets Association
(Anbima). Meanwhile, the balance of assets under management increased to R$ 344.9 billion, up 17.4%
from 1H09, composed of R$ 332.4 billion in investment funds and R$ 15.0 billion in managed portfolios.
41
9.4 Asset Management
Asset Management¹
(1) Excludes BV
Investment Funds and Managed Portfolios by Investment Profile / (%)Client
14.6
14.6
12.4
54.1
Fixed Income
Others
Multi-strategy
Equities
25.9
22.3
37.4
4.8
9.6
Institutional
Wholesale
Foreign Investor
Government
Retail
21.119.7
20.219.1
18.3
20.7
Market Share (%) Total Assets (R$ billion)
2004 2005 2006 2007 2008 2009
124.0
153.6182.7
220.1246.3
306.7
1H09 1H10
239.9344.9
20.3
22.3
Banco do Brasil - The Company 1 Half 2010st
42
9.5 Capital Markets
Banco do Brasil operates in local capital markets through BB Banco de Investimento S.A. (BB-BI). In the first half of 2010:
stBB-BI arranged 20 fixed-income issues totaling R$5.5 billion, placing 1 in the Anbima ranking,
with market share of 20.8%.
Securities: issue of two receivables-backed investment funds (FIDC) and mortgage-backed
securities (MBS) funds and one real estate fund, amounting to R$ 397 million.
ndCustody of assets in the local market: 2 in the Anbima ranking, with R$ 487 billion in custody,
which represents market share of 25.8%
International capital markets: BB, through its brokerage firms located abroad, BB Securities Ltd
(London) and Banco do Brasil Securities LLC (New York), took part in 15 of Brazil's 32 fixed-income
issuances, considering both own and third-party funding operations. BB acted as lead manager in nine
operations and in six as co-manager, including Braskem, CSN, Magnesita, Marfrig, Minerva, Banco
Votorantim, BNDES, Fibria, Votorantim, BESI and STN, arranging a combined total of over US$ 9 billion.
Interests in subsidiaries generated earning/loss equity for the Bank of R$ 1.4 billion, an increase of 39.7% in the first half from the same period of 2009. The Bank is a shareholder in companies involved in areas related to its business and that adopt best corporate governance practices.
Private equity industry BB acts through BB-BI to provide economic and financial advisory services
to various private-equity funds that observe good principles of social and environmental
responsibility, such as:
FIP Brazil Corporate Governance: Committed capital of R$ 600 million
- Brazil FIP Sustainability: Committed capital of R$ 411 million
FIP Brazil Agribusiness: Committed capital of R$ 840 million
Since 2004, BB-BI has been an active shareholder in eight Private-Equity Funds (FIPs) and
Emerging Company Investment Funds (FMIEEs), and more recently provided advisory services to
four financial private-equity funds, of which three are in the investment period and one in the funding
phase within institutional investors, for committed capital of R$ 1.85 billion.
thStock issues: BB-BI acted as lead manager in share offerings worth R$ 327 million, placing 10 in the Anbima ranking, with market share of 2.4%
Banco do Brasil - The Company 1 Half 2010st

43
Since October 2009, BB is implementing a program to restructure its operations in the insurance segment in order to advance its strategy of increasing the contribution from the insurance, annuity plans and pension plan businesses to its income.
Two subsidiaries were set up: BB Seguros Participações S.A. (BB Seguros) and BB Aliança Participações S.A. (BB Aliança). In 2010:
9.6 Insurance, Pension Plans and Savings Bonds
BB Seguros is holding dealings with the Spanish Insurance Group MAPFRE in order to conclude a partnership agreement to stablish a strategic alliance in the segments of individuals, P&C and auto insurance, for a period of 20 years.
BB also continues helding negotiations without binding effetct with the Federal Government, aiming at acquiring a stake in the IRB–Brazil RE S.A., the largest reinsurer group in Latin America.
BB Seguros Participações and Grupo Icatu signed a Memorandum of Understanding in order to set a strategic partnership to the development and marketing of Savings bonds in Brazil.
BB Seguros and PFG do Brasil Ltda., part of Principal Financial Group, renewed their strategic partnership in the development and marketing of open private pension products in Brazil. On the other hand, BB Seguros holds the share of 74.995% from the total capital of Brasilprev.
BB Seguros and Sul América Companhia Nacional de Seguros signed a Sales and Purchase Agreement for the acquisition of all shares owned by Sul América (60% of common shares) on Brasilveículos Companhia de Seguros.
BB Seguros and Sul América Seguro Saúde S.A. signed a Sales and Purchase Agreement for the selling of all shares owned by BB Seguros (49.92% of total stakes) on Brasilsaúde Companhia de Seguros (“Brasilsaúde”) to Sul América Seguro Saúde.
Ranking Position AfterCorporate Reorganization
Banco do Brasil - The Company 1 Half 2010st
Life33rdrd 55stst 11stst
Market share:18.4%Aliança do Brasil
Non-Life66thth 22ndnd 22ndnd
Market share:13.1%Aliança do Brasil
Vehicles55thth 66thth 22ndnd
Market share :
15.7%BrasilVeículos
Annuity Plans11stst 77thth 11stst
Market share:30.2%BrasilCap
Pension Fund22ndnd 22ndnd
Market share :20.1%BrasilPrev

Auto Insurance
44
Brasil Veiculos recorded net income of R$ 14.8 million in the half, with return on average equity of
4.5%;thThe company ended the half year with market share of 8.1% and ranked 5 in the market of retained
premiums;
Supported by strong customer loyalty, the retention index ended the period at 82.7%;
The portfolio reached R$ 666 million in managed volume in the half year.
Insurance Ratio
The insurance, pension and savings bonds businesses contributed R$ 596.2 million to the overall net income ofBanco do Brasil in the first half 2010, up 19.4% from the same period in 2009.
Managed portfolio (R$ million)Vehicles Insured (thousand)
2004 2005 2006 2007 2008 2009
238.7
318.5367.0
453.3
593.7
665.3
971
578 625 676 747 807
1H09 1H10
635.7 665.6
848
1.055
Insurance Ratio¹ (%) Insurance Income (R$ million) Recurring Income (R$ million)
2005 2006 2007 2008 2009
501.0 617.6 671.9 758.5 992.2
3,441 3,665
5,880
6,6856,833
16.814.5
11.311.4
14.6
1H09 1H10
3,250
4,383
499.2 596.2
15.4
13.6
(1) The Insurance Ratio indicates the share of income from the Insurance, Pension Plans and Savings bonds in the conglomerate's overall income added by the five companies that operates in strategic segments of the insurance industry: Aliança do Brasil; Brasilveículos; Brasilprev; Brasilcap and Brasilsaúde.
Banco do Brasil - The Company 1 Half 2010st

Brasilsaúde's health insurance portfolio reached R$ 105.5 million in retained premiums;
101.4 thousand members at the end of the first half of 2010, with a focus on the corporate
segment;
Health insurance portfolio ended June with a managed portfolio of R$ 55.0 million.
Brasilprev ended the first six months of 2009 with net income of R$ 138.1 million, with return on
average equity of 31.2%;
Market share in private pension plans of 20.1% in tax revenues, with financial income of
R$ 1.1 billion in the first half;
Brasilprev strengthened its sales team by using agents in the retail segment.
Health Insurance
Pension Fund
Lives Insured (thousand) Managed portfolio (R$ million)
45
Aliança do Brasil's life insurance portfolio reached R$ 1.1 billion in retained premiums;
With market share of 39.8%, Aliança do Brasil is Brazil's largest rural insurer in Brazil;
Net profit of R$ 224.0 million in the first half of 2010, for return on average equity of 38.2% in the
period.
Life Insurance
2004 2005 2006 2007 2008 2009
1,351 1,417 1,748 1,791
2,105
2,866
680.6 717.1
820.1
984.5
1,139.4
1,436.7
1H09 1H10
1,270.0
1,464.0
2,373
3,640
Banco do Brasil - The Company 1 Half 2010st
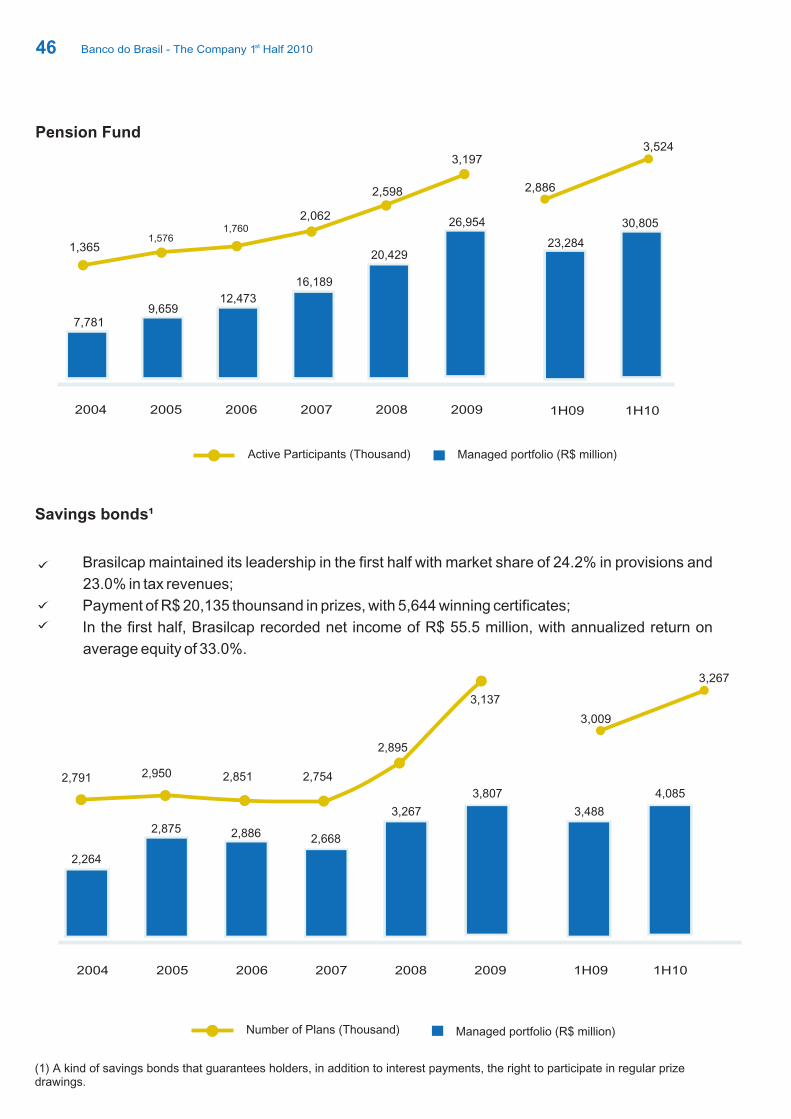
Brasilcap maintained its leadership in the first half with market share of 24.2% in provisions and
23.0% in tax revenues;
Payment of R$ 20,135 thounsand in prizes, with 5,644 winning certificates;
In the first half, Brasilcap recorded net income of R$ 55.5 million, with annualized return on
average equity of 33.0%.
Savings bonds¹
46
Managed portfolio (R$ million)Number of Plans (Thousand)
Pension Fund
Managed portfolio (R$ million)Active Participants (Thousand)
2004 2005 2006 2007 2008 2009
7,781
1,3651,576
1,7602,062
2,598
3,197
9,65912,473
16,189
20,429
26,954
2004 2005 2006 2007 2008 2009
2,264
2,875 2,886 2,668
3,267
3,807
2,791 2,950 2,851 2,754
2,895
3,137
1H09 1H10
23,284
30,805
1H09 1H10
3,488
4,085
2,886
3,524
3,009
3,267
(1) A kind of savings bonds that guarantees holders, in addition to interest payments, the right to participate in regular prizedrawings.
Banco do Brasil - The Company 1 Half 2010st
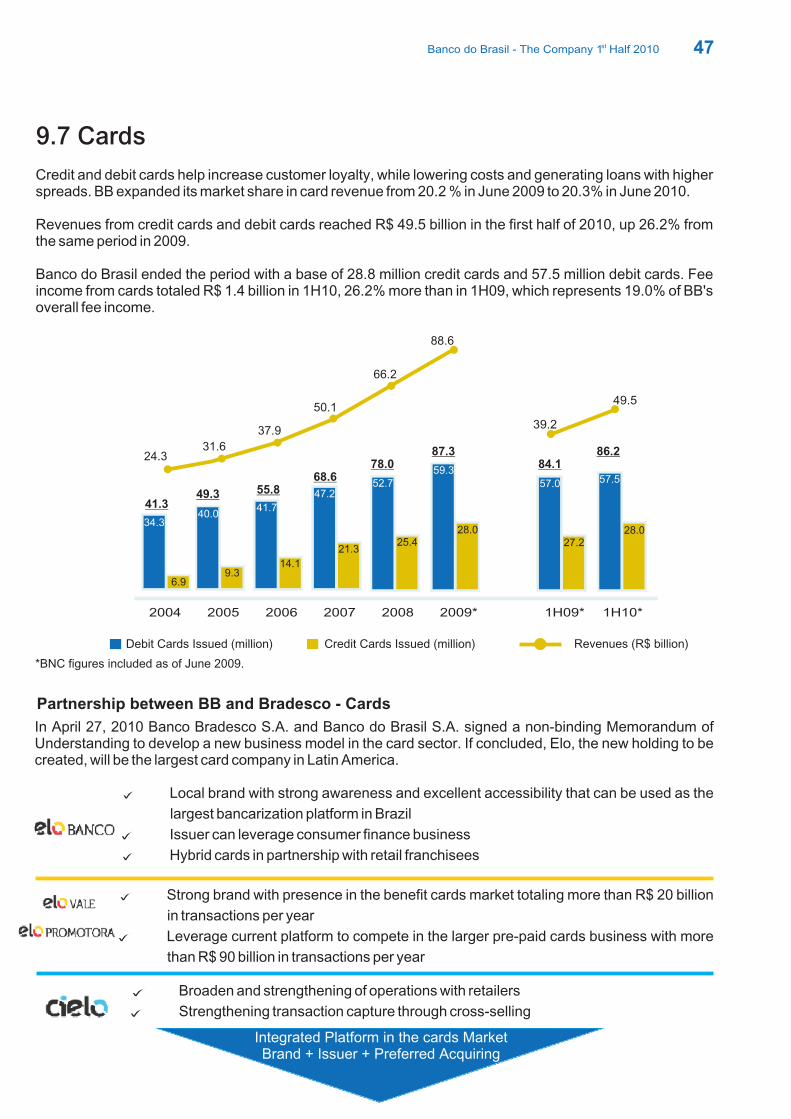
47
9.7 Cards
Credit and debit cards help increase customer loyalty, while lowering costs and generating loans with higher spreads. BB expanded its market share in card revenue from 20.2 % in June 2009 to 20.3% in June 2010.
Revenues from credit cards and debit cards reached R$ 49.5 billion in the first half of 2010, up 26.2% from the same period in 2009.
Banco do Brasil ended the period with a base of 28.8 million credit cards and 57.5 million debit cards. Fee income from cards totaled R$ 1.4 billion in 1H10, 26.2% more than in 1H09, which represents 19.0% of BB's overall fee income.
Revenues (R$ billion)Debit Cards Issued (million) Credit Cards Issued (million)
*BNC figures included as of June 2009.
Partnership between BB and Bradesco - Cards
In April 27, 2010 Banco Bradesco S.A. and Banco do Brasil S.A. signed a non-binding Memorandum of Understanding to develop a new business model in the card sector. If concluded, Elo, the new holding to be created, will be the largest card company in Latin America.
Local brand with strong awareness and excellent accessibility that can be used as the
largest bancarization platform in Brazil
Issuer can leverage consumer finance business
Hybrid cards in partnership with retail franchisees
Strong brand with presence in the benefit cards market totaling more than R$ 20 billion
in transactions per year
Leverage current platform to compete in the larger pre-paid cards business with more
than R$ 90 billion in transactions per year
Broaden and strengthening of operations with retailers
Strengthening transaction capture through cross-selling
2004 2005 2006 2007 2008 2009*
24.331.6
37.9
50.1
66.2
88.6
34.3
41.349.3 55.8
68.678.0
87.3
40.041.7
47.252.7
59.3
6.99.3
14.1
21.3
25.4 28.025.4
1H09* 1H10*
84.186.2
57.0 57.5
25.4 28.027.2
39.2
49.5
Integrated Platform in the cards MarketBrand + Issuer + Preferred Acquiring
Banco do Brasil - The Company 1 Half 2010st
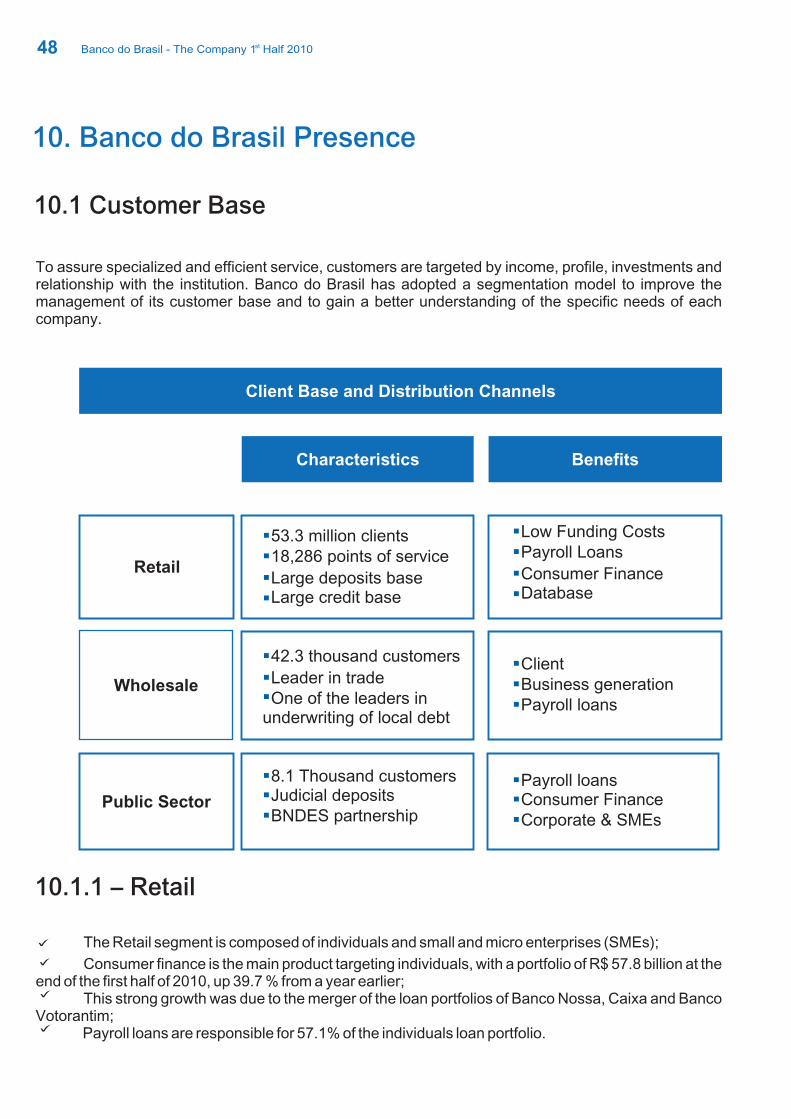
48
10.1 Customer Base
10.1.1 – Retail
To assure specialized and efficient service, customers are targeted by income, profile, investments and relationship with the institution. Banco do Brasil has adopted a segmentation model to improve the management of its customer base and to gain a better understanding of the specific needs of each company.
10. Banco do Brasil Presence
Client Base and Distribution Channels
Characteristics Benefits
Wholesale
Retail
Wholesale
Public Sector
53.3 million clients18,286 points of service§§
§§
§§
§§
§
§§
§§§
§§§
§§§
Large deposits baseLarge credit base
42.3 thousand customers
Leader in tradeOne of the leaders in
underwriting of local debt
8.1 Thousand customersJudicial depositsBNDES partnership
Low Funding CostsPayroll Loans
Consumer FinanceDatabase
ClientBusiness generationPayroll loans
Payroll loansConsumer FinanceCorporate & SMEs
The Retail segment is composed of individuals and small and micro enterprises (SMEs);
Consumer finance is the main product targeting individuals, with a portfolio of R$ 57.8 billion at the end of the first half of 2010, up 39.7 % from a year earlier;
This strong growth was due to the merger of the loan portfolios of Banco Nossa, Caixa and Banco Votorantim;
Payroll loans are responsible for 57.1% of the individuals loan portfolio.
Banco do Brasil - The Company 1 Half 2010st
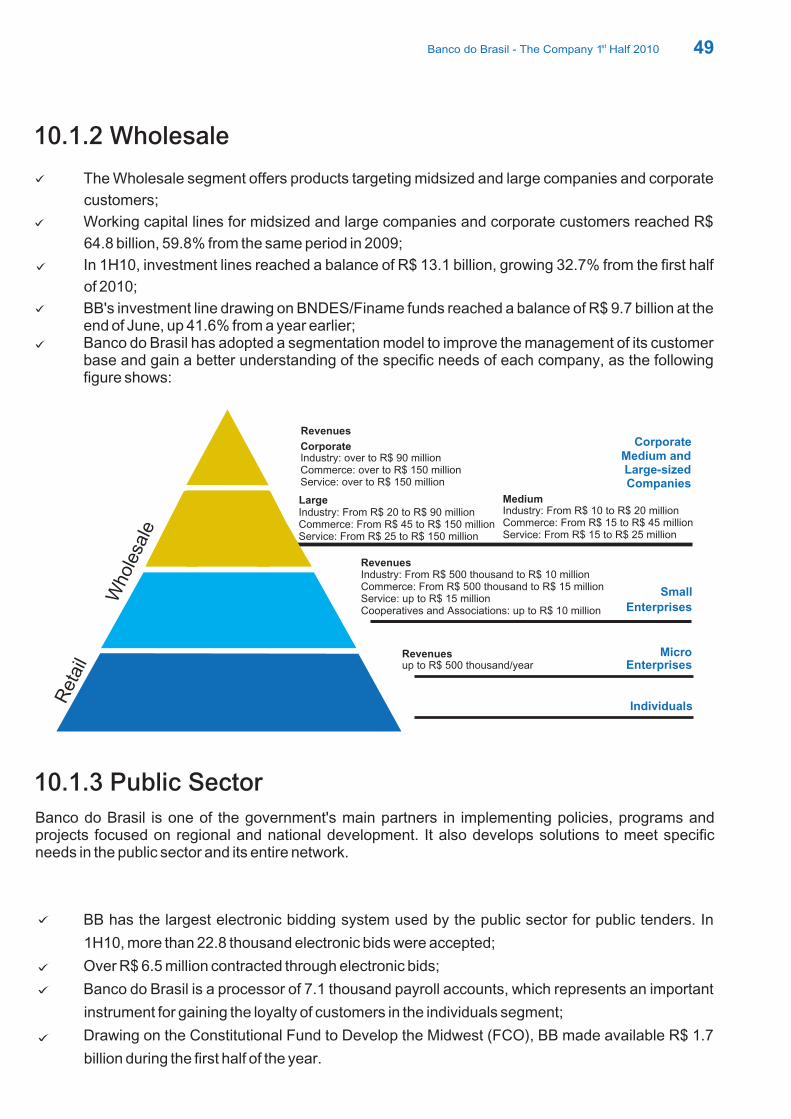
49
10.1.2 Wholesale
The Wholesale segment offers products targeting midsized and large companies and corporate
customers;
Working capital lines for midsized and large companies and corporate customers reached R$
64.8 billion, 59.8% from the same period in 2009;
In 1H10, investment lines reached a balance of R$ 13.1 billion, growing 32.7% from the first half
of 2010;
BB's investment line drawing on BNDES/Finame funds reached a balance of R$ 9.7 billion at the end of June, up 41.6% from a year earlier;Banco do Brasil has adopted a segmentation model to improve the management of its customer base and gain a better understanding of the specific needs of each company, as the following figure shows:
10.1.3 Public Sector
Banco do Brasil is one of the government's main partners in implementing policies, programs and projects focused on regional and national development. It also develops solutions to meet specific needs in the public sector and its entire network.
BB has the largest electronic bidding system used by the public sector for public tenders. In
1H10, more than 22.8 thousand electronic bids were accepted;
Over R$ 6.5 million contracted through electronic bids;
Banco do Brasil is a processor of 7.1 thousand payroll accounts, which represents an important
instrument for gaining the loyalty of customers in the individuals segment;
Drawing on the Constitutional Fund to Develop the Midwest (FCO), BB made available R$ 1.7
billion during the first half of the year.
Revenuesup to R$ 500 thousand/year
Revenues
MediumLarge
Corporate
Industry: Commerce: From R$ 500 thousand to R$ 15 millionService: up to R$ 15 millionCooperatives and Associations: up to R$ 10 million
From R$ 500 thousand to R$ 10 million
Medium and Large-sized Companies
Small
Enterprises
Corporate
MicroEnterprises
Industry: Commerce: From R$ 15 to R$ 45 millionService: From R$ 15 to R$ 25 million
From R$ 10 to R$ 20 millionIndustry: From R$ 20 to R$ 90 millionCommerce: From R$ 45 to R$ 150 millionService: From R$ 25 to R$ 150 million
Industry: over to R$ 90 millionCommerce: over to R$ 150 millionService: over to R$ 150 million
Who
lesa
le
Ret
ail
Individuals
Revenues
Banco do Brasil - The Company 1 Half 2010st
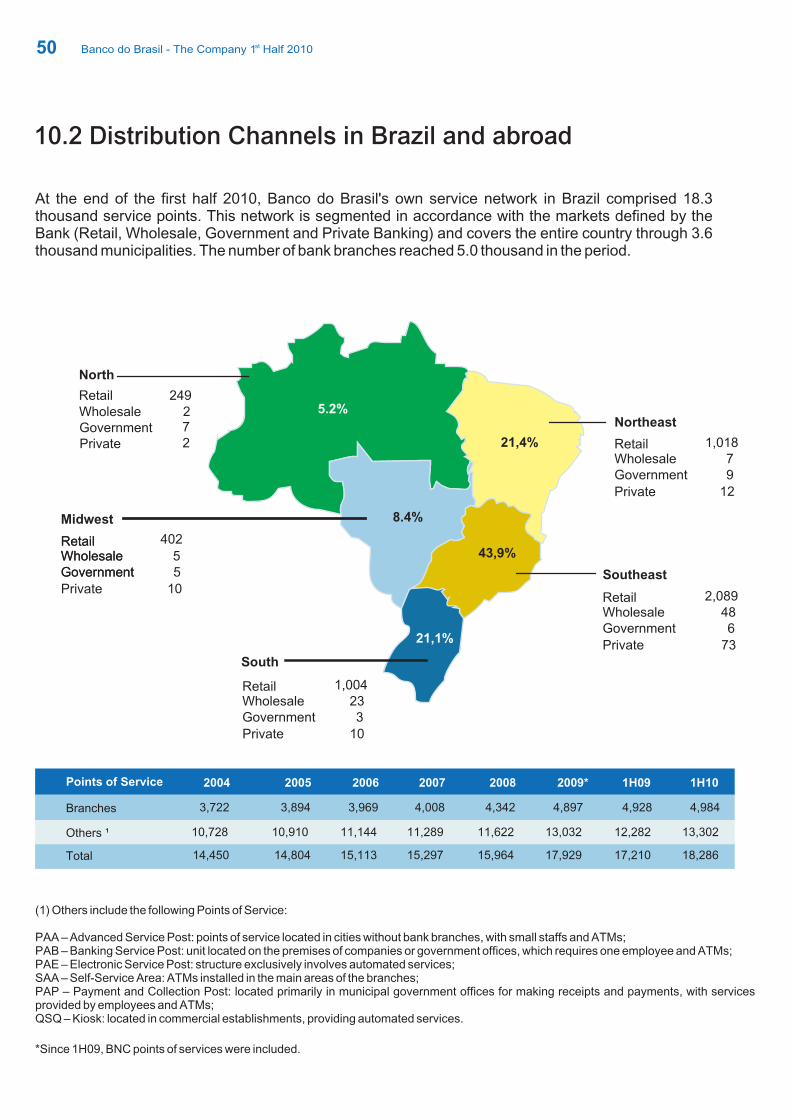
50
10.2 Distribution Channels in Brazil and abroad
At the end of the first half 2010, Banco do Brasil's own service network in Brazil comprised 18.3 thousand service points. This network is segmented in accordance with the markets defined by the Bank (Retail, Wholesale, Government and Private Banking) and covers the entire country through 3.6 thousand municipalities. The number of bank branches reached 5.0 thousand in the period.
North
5.2%
21,4%
8.4%
43,9%
21,1%
Retail 249Wholesale 2Government 7
South
Southeast
Northeast
Private 2
Retail 1,004Wholesale 23Government 3
Private 10
Retail 2,089Wholesale 48Government 6
Private 73
Retail 1,018Wholesale 7Government 9
Private 12
Midwest
Retail 402
WholesaleGovernment 5
RetailWholesale 5Government
Private 10
(1) Others include the following Points of Service:
PAA – Advanced Service Post: points of service located in cities without bank branches, with small staffs and ATMs;PAB – Banking Service Post: unit located on the premises of companies or government offices, which requires one employee and ATMs;PAE – Electronic Service Post: structure exclusively involves automated services;SAA – Self-Service Area: ATMs installed in the main areas of the branches;PAP – Payment and Collection Post: located primarily in municipal government offices for making receipts and payments, with services provided by employees and ATMs;QSQ – Kiosk: located in commercial establishments, providing automated services.
*Since 1H09, BNC points of services were included.
Points of Service 2004 2005 2006 2007 2008 2009*
Others ¹ 10,728 10,910 11,144 11,289 11,622 13,032
Total 14,804 15,113 15,297 15,964 17,929
1H09 1H10
12,282 13,302
Branches 3,722 3,894 3,969 4,008 4,342 4,897 4,928 4,984
17,210 18,28614,450
Banco do Brasil - The Company 1 Half 2010st
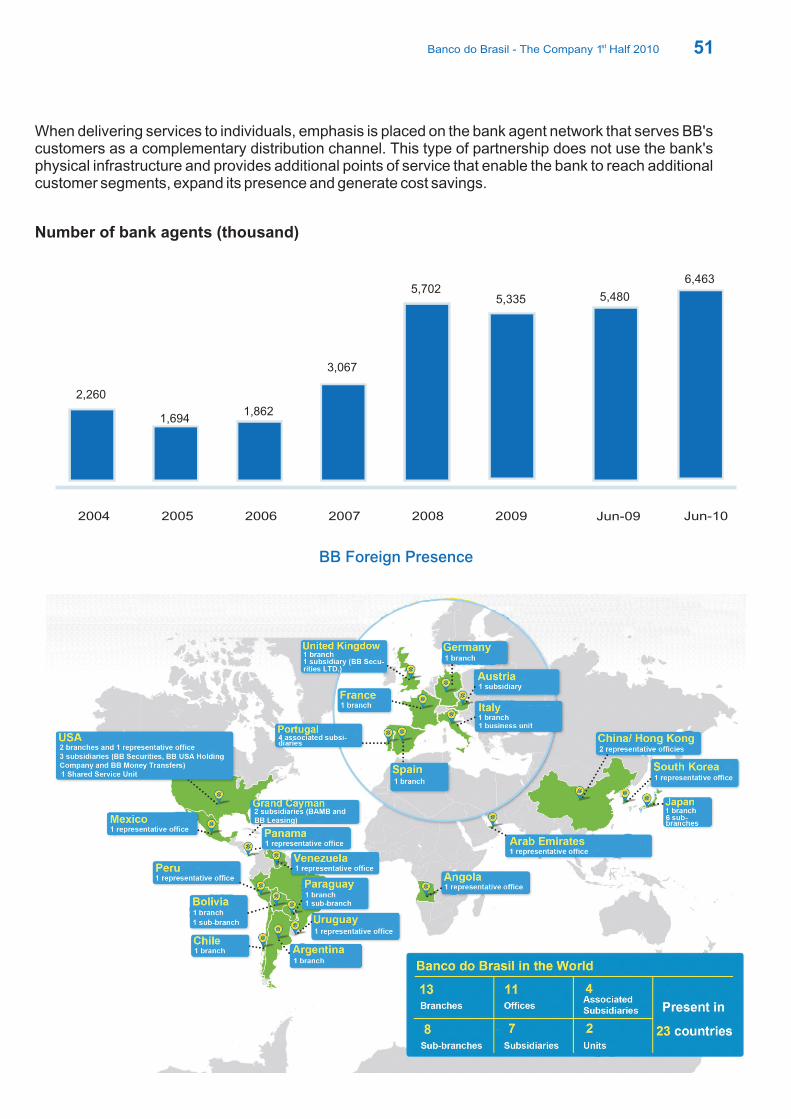
51
When delivering services to individuals, emphasis is placed on the bank agent network that serves BB's customers as a complementary distribution channel. This type of partnership does not use the bank's physical infrastructure and provides additional points of service that enable the bank to reach additional customer segments, expand its presence and generate cost savings.
Number of bank agents (thousand)
2004 2005 2006 2007 2008 2009
2,260
1,6941,862
3,067
5,7025,335
Jun-09 Jun-10
5,480
6,463
BB Foreign Presence
Banco do Brasil - The Company 1 Half 2010st

52
BB uses its IT infrastructure to increase convenience and security for customers when accessing their account, offering complementary channels such as Internet Banking, Financial Manager (an Internet banking tool for businesses), POS equipment, services via telephone and fax, and mobile banking (WAP). BB also has the largest ATM network in Latin America, with 43.9 thousand machines (own network), which handle 38.9% of all transactions carried out by Banco do Brasil customers.
Transactions via Automated Channels (%)
Breakdown of Transactions (%)
10.3 Technology Structure
ATM Internet Banking - Individuals
Internet Banking - Businesses Cashier
POS Others
38.7
38.9
19.1 20.1
18.6 17.1
8.9 8.1
8.8 10.0
5.9 5.8June 30, 2009
June 30, 2010
2004 2005 2006 2007 2008 2009
88.4
89.2
90.0
91.391.1
92.0
1H09 1H10
91.1
91.9
Banco do Brasil - The Company 1 Half 2010st
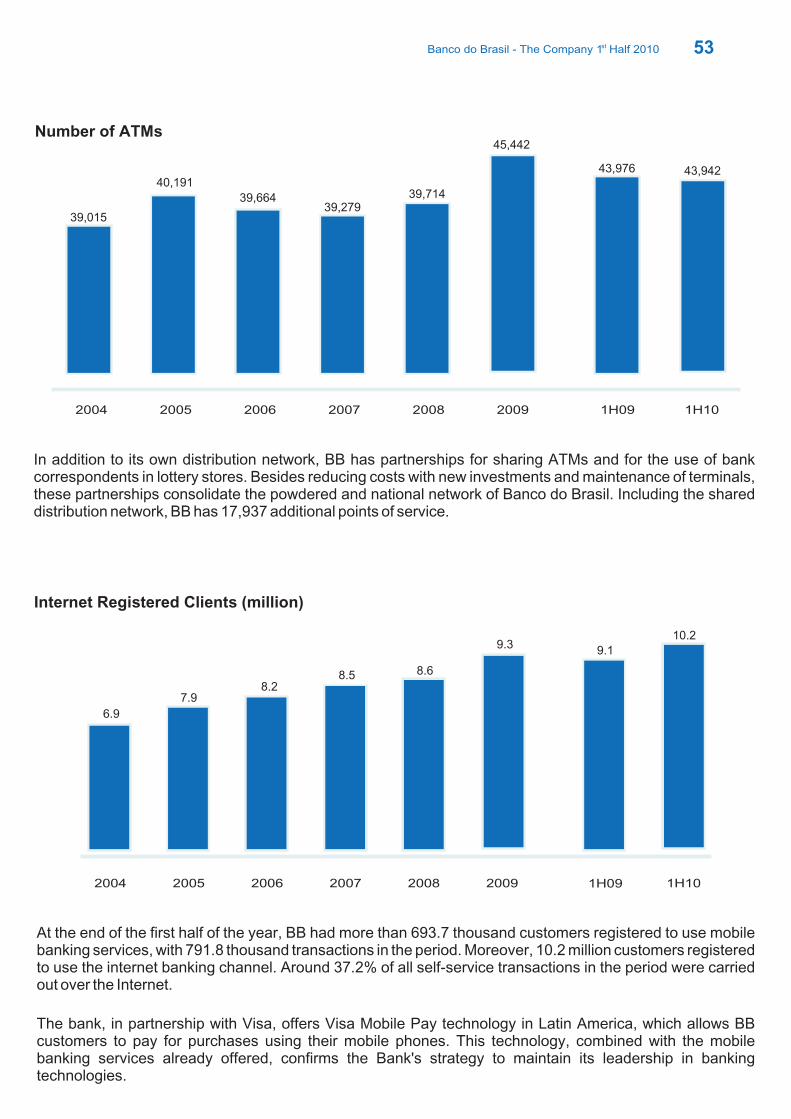
53
In addition to its own distribution network, BB has partnerships for sharing ATMs and for the use of bank correspondents in lottery stores. Besides reducing costs with new investments and maintenance of terminals, these partnerships consolidate the powdered and national network of Banco do Brasil. Including the shared distribution network, BB has 17,937 additional points of service.
Number of ATMs
Internet Registered Clients (million)
2004 2005 2006 2007 2008 2009
39,015
40,191
39,66439,279
39,714
45,442
1H09 1H10
43,976 43,942
2004 2005 2006 2007 2008 2009
6.9
7.98.2
8.5 8.6
9.3
1H09 1H10
9.1
10.2
At the end of the first half of the year, BB had more than 693.7 thousand customers registered to use mobile banking services, with 791.8 thousand transactions in the period. Moreover, 10.2 million customers registered to use the internet banking channel. Around 37.2% of all self-service transactions in the period were carried out over the Internet.
The bank, in partnership with Visa, offers Visa Mobile Pay technology in Latin America, which allows BB customers to pay for purchases using their mobile phones. This technology, combined with the mobile banking services already offered, confirms the Bank's strategy to maintain its leadership in banking technologies.
Banco do Brasil - The Company 1 Half 2010st
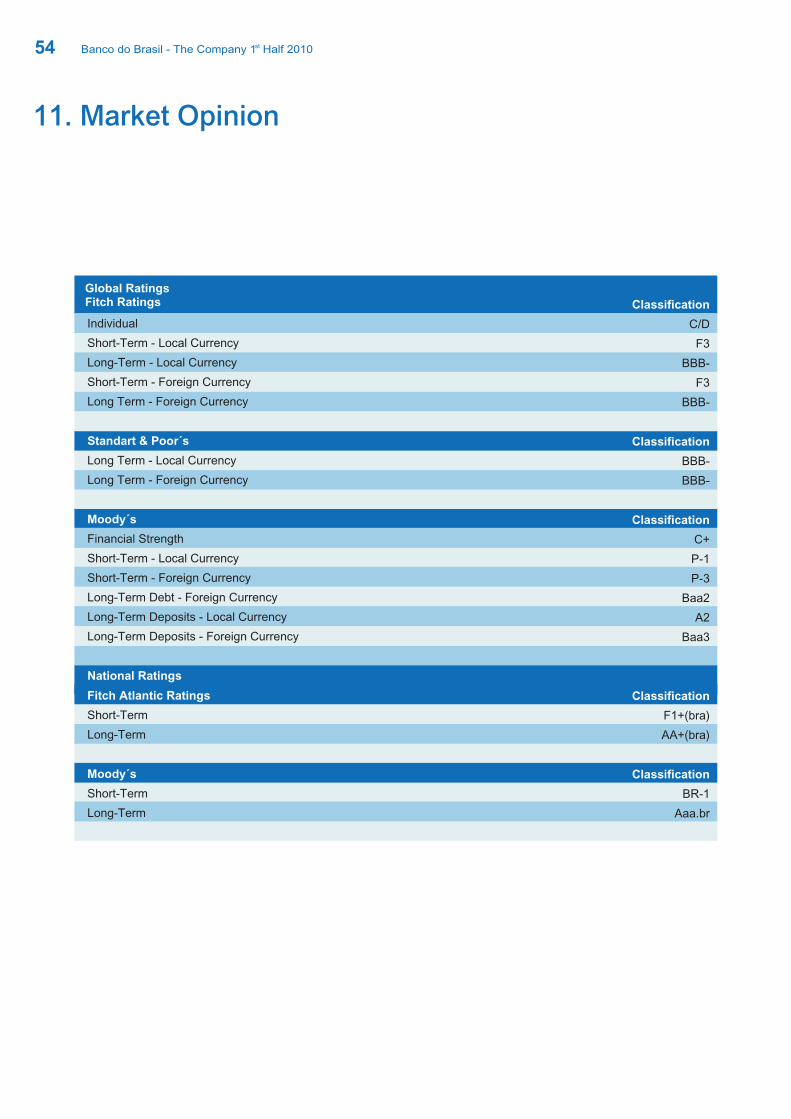
54
Global RatingsFitch Ratings
Individual
Short-Term - Local Currency
Long-Term - Local Currency
Short-Term - Foreign Currency
Long Term - Foreign Currency
Long Term - Local Currency
Long Term - Foreign Currency
Financial Strength
Short-Term - Local Currency
Short-Term - Foreign Currency
Long-Term Debt - Foreign Currency
Long-Term Deposits - Local Currency
Long-Term Deposits - Foreign Currency
Short-Term
Long-Term
Short-Term
Long-Term
Standart & Poor´s
Moody´s
National Ratings
Fitch Atlantic Ratings
Moody´s
Classification
Classification
Classification
Classification
Classification
C/D
F3
BBB-
F3
BBB-
BBB-
BBB-
C+
P-1
P-3
Baa2
A2
Baa3
F1+(bra)
AA+(bra)
BR-1
Aaa.br
11. Market Opinion
Banco do Brasil - The Company 1 Half 2010st
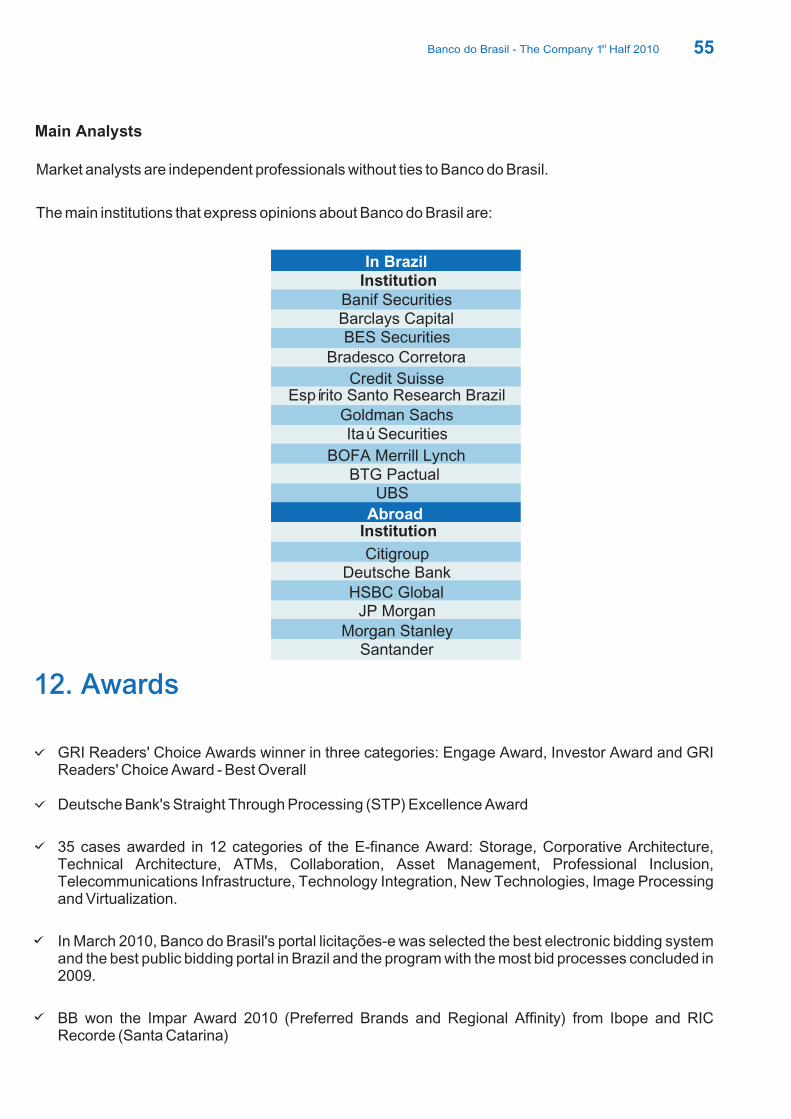
55
Market analysts are independent professionals without ties to Banco do Brasil.
The main institutions that express opinions about Banco do Brasil are:
Main Analysts
In Brazil
BES Securities
Banif Securities
Bradesco Corretora
Itaú Securities
Credit Suisse
Goldman Sachs
BTG Pactual
Barclays Capital
BOFA Merrill Lynch
UBS
Abroad
CitigroupDeutsche BankHSBC Global
JP MorganMorgan Stanley
Santander
Institution
Institution
Espírito Santo Research Brazil
· GRI Readers' Choice Awards winner in three categories: Engage Award, Investor Award and GRI Readers' Choice Award - Best Overall
· Deutsche Bank's Straight Through Processing (STP) Excellence Award
· 35 cases awarded in 12 categories of the E-finance Award: Storage, Corporative Architecture, Technical Architecture, ATMs, Collaboration, Asset Management, Professional Inclusion, Telecommunications Infrastructure, Technology Integration, New Technologies, Image Processing and Virtualization.
· In March 2010, Banco do Brasil's portal licitações-e was selected the best electronic bidding system and the best public bidding portal in Brazil and the program with the most bid processes concluded in 2009.
· BB won the Impar Award 2010 (Preferred Brands and Regional Affinity) from Ibope and RIC Recorde (Santa Catarina)
12. Awards
Banco do Brasil - The Company 1 Half 2010st
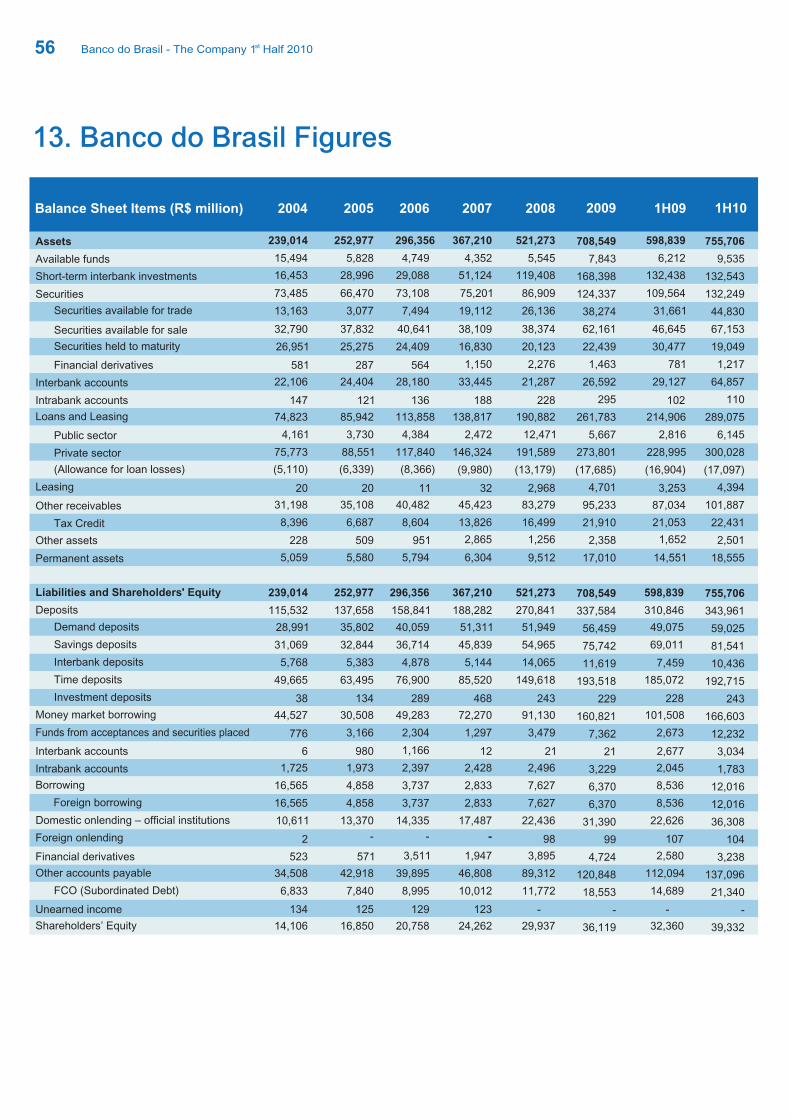
56
13. Banco do Brasil Figures
Balance Sheet Items (R$ million)
2004 2005 2006 2007
Assets 239,014
252,977
296,356
367,210
Available funds
15,494
5,828
4,749
4,352
Short-term interbank investments
16,453
28,996
29,088
51,124
Securities
73,485
66,470
73,108
75,201
Securities available for trade 13,163 3,077 7,494 19,112
Securities available for sale
32,790 37,832 40,641 38,109
Securities held to maturity
26,951
25,275
24,409
16,830
Financial derivatives
581
287
564
1,150
Interbank accounts
22,106
24,404
28,180
33,445
Intrabank accounts 147 121 136 188
Loans and Leasing 74,823
85,942
113,858
138,817
Public sector
4,161
3,730
4,384
2,472
Private sector
75,773
88,551
117,840
146,324
(Allowance for loan losses)
(5,110)
(6,339)
(8,366)
(9,980)
Leasing
20
20
11
32
Other receivables
31,198
35,108
40,482
45,423
Tax Credit 8,396 6,687 8,604 13,826
Other assets
228 509 951 2,865
239,014 252,977 296,356 367,210
Deposits 115,532 137,658 158,841 188,282
Demand deposits 28,991 35,802 40,059 51,311
Savings deposits
31,069
32,844
36,714
45,839
Interbank deposits
5,768
5,383
4,878
5,144
Time deposits
49,665
63,495
76,900
85,520
Investment deposits
38
134
289
468
Money market borrowing
44,527
30,508
49,283
72,270
Funds from acceptances and securities placed 776
3,166
2,304
1,297
Interbank accounts
6
980
1,166
12
Intrabank accounts
1,725
1,973
2,397
2,428
Borrowing
16,565
4,858
3,737
2,833
Foreign borrowing
16,565
4,858
3,737
2,833
10,611
13,370
14,335
17,487
Foreign onlending
2
-
-
-
Financial derivatives
523
571
3,511
1,947
Other accounts payable
34,508
42,918
39,895
46,808
FCO (Subordinated Debt)
6,833
7,840
8,995
10,012
Unearned income
134
125
129
123
Shareholders’ Equity
14,106
16,850
20,758
24,262
Liabilities and Shareholders' Equity
Domestic onlending – official institutions
Permanent assets 5,059
5,580
5,794
6,304
-
2008 2009
521,273 708,549
7,843
168,398
124,337
38,274
62,161
22,439
1,463
26,592
295
261,783
5,667
273,801
(17,685)
4,701
95,233
21,910
2,358
17,010
708,549
337,584
56,459
75,742
11,619
193,518
229
160,821
7,362
21
3,229
6,370
6,370
31,390
99
4,724
120,848
18,553
-
36,119
5,545
119,408
86,909
26,136
38,374
20,123
2,276
21,287
228
190,882
12,471
191,589
(13,179)
2,968
83,279
16,499
1,256
9,512
521,273
270,841
51,949
54,965
14,065
149,618
243
91,130
3,479
21
2,496
7,627
7,627
22,436
98
3,895
89,312
11,772
-
29,937
1H09 1H10
598,839 755,706
9,535
132,543
132,249
44,830
67,153
19,049
1,217
64,857
110
289,075
6,145
300,028
(17,097)
4,394
101,887
22,431
2,501
18,555
755,706
343,961
59,025
81,541
10,436
192,715
243
166,603
12,232
3,034
1,783
12,016
12,016
36,308
104
3,238
137,096
21,340
-
39,332
6,212
132,438
109,564
31,661
46,645
30,477
781
29,127
102
214,906
2,816
228,995
(16,904)
3,253
87,034
21,053
1,652
14,551
598,839
310,846
49,075
69,011
7,459
185,072
228
101,508
2,673
2,677
2,045
8,536
8,536
22,626
107
2,580
112,094
14,689
-
32,360
Banco do Brasil - The Company 1 Half 2010st
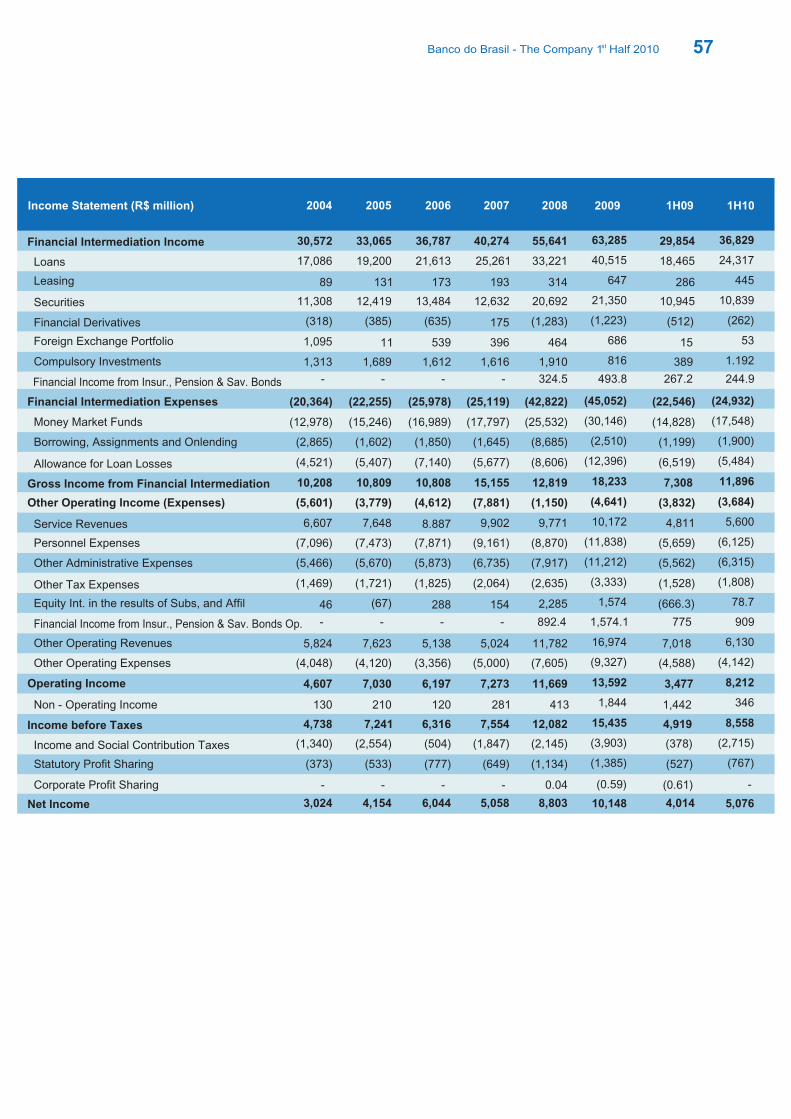
57
Income Statement (R$ million) 2004 2005 2006 2007
Financial Intermediation Income 30,572 33,065 36,787 40,274
Loans 17,086 19,200 21,613 25,261
Leasing 89 131 173 193
Securities 11,308 12,419 13,484 12,632
Financial Derivatives (318) (385) (635) 175
Foreign Exchange Portfolio 1,095 11 539 396
Compulsory Investments
Financial Income from Insur., Pension & Sav. Bonds
Financial Income from Insur., Pension & Sav. Bonds Op.
1,313
- - - - 324.5
- - - - 892.4
- - - - 0.04 (0.59)
493.8
1,574.1
1,689 1,612 1,616
Financial Intermediation Expenses (20,364) (22,255) (25,978) (25,119)
Money Market Funds (12,978) (15,246) (16,989) (17,797)
Borrowing, Assignments and Onlending (2,865) (1,602) (1,850) (1,645)
Allowance for Loan Losses (4,521) (5,407) (7,140) (5,677)
Gross Income from Financial Intermediation 10,208 10,809 10,808 15,155
Other Operating Income (Expenses) (5,601) (3,779) (4,612) (7,881)
Service Revenues 6,607 7,648 8.887 9,902
Personnel Expenses (7,096) (7,473) (7,871) (9,161)
Other Administrative Expenses (5,466) (5,670) (5,873) (6,735)
Other Tax Expenses (1,469) (1,721) (1,825) (2,064)
Equity Int. in the results of Subs, and Affil 46 (67) 288 154
Other Operating Revenues 5,824 7,623 5,138 5,024
Other Operating Expenses (4,048) (4,120) (3,356) (5,000)
Operating Income 4,607 7,030 6,197 7,273
Non - Operating Income 130 210 120 281
Income before Taxes 4,738 7,241 6,316 7,554
Income and Social Contribution Taxes (1,340) (2,554) (504) (1,847)
Statutory Profit Sharing (373) (533) (777) (649)
Net Income
Corporate Profit Sharing
3,024 4,154 6,044 5,058
2008 2009
55,641
33,221
314
20,692
(1,283)
464
1,910
(42,822)
(25,532)
(8,685)
(8,606)
12,819
(1,150)
9,771
(8,870)
(7,917)
(2,635)
2,285
11,782
(7,605)
11,669
413
12,082
(2,145)
(1,134)
8,803
63,285
40,515
647
21,350
(1,223)
686
816
(45,052)
(30,146)
(2,510)
(12,396)
18,233
(4,641)
10,172
(11,838)
(11,212)
(3,333)
1,574
16,974
(9,327)
13,592
1,844
15,435
(3,903)
(1,385)
10,148
267.2
775
(0.61) -
244.9
909
1H09 1H10
29,854
18,465
286
10,945
(512)
15
389
(22,546)
(14,828)
(1,199)
(6,519)
7,308
(3,832)
4,811
(5,659)
(5,562)
(1,528)
(666.3)
7,018
(4,588)
3,477
1,442
4,919
(378)
(527)
4,014
36,829
24,317
445
10,839
(262)
53
1.192
(24,932)
(17,548)
(1,900)
(5,484)
11,896
(3,684)
5,600
(6,125)
(6,315)
(1,808)
78.7
6,130
(4,142)
8,212
346
8,558
(2,715)
(767)
5,076
Banco do Brasil - The Company 1 Half 2010st
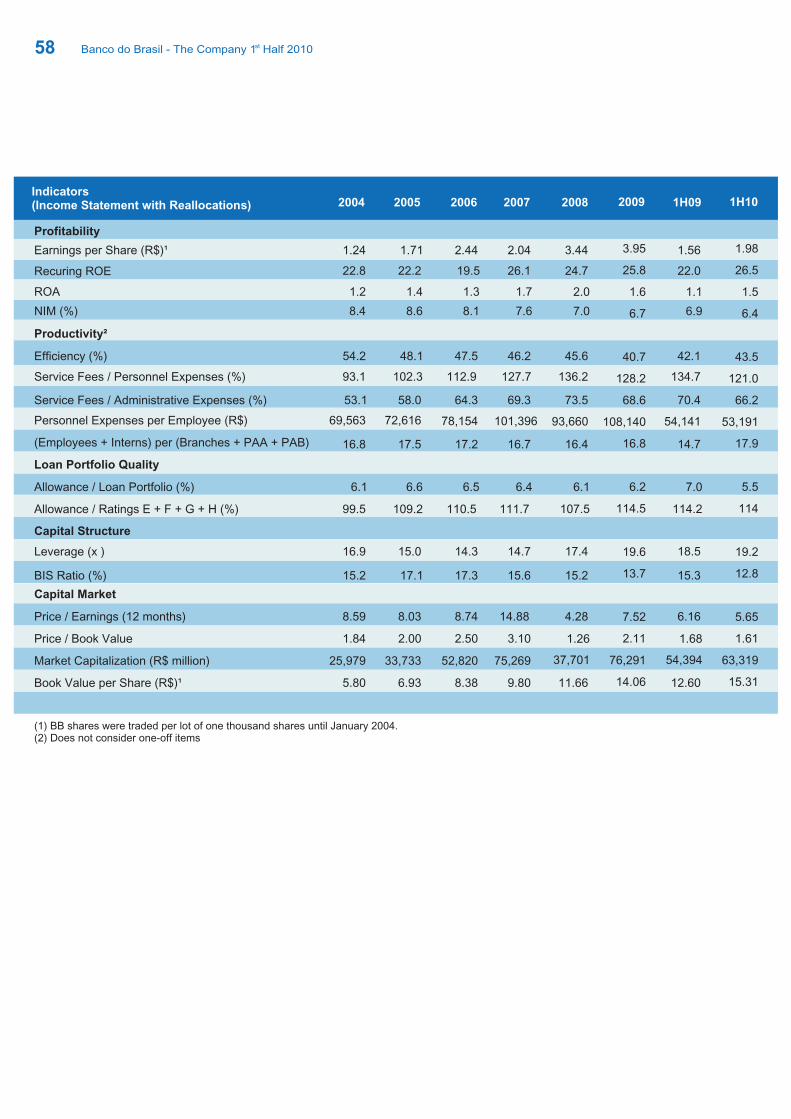
58 Banco do Brasil - The Company 1 Half 2010st
Indicators (Income Statement with Reallocations) 2004 2005 2006 2007
Profitability
Earnings per Share (R$)¹ 1.24 1.71 2.44 2.04
Recuring ROE 22.8 22.2 19.5 26.1
ROA 1.2 1.4 1.3 1.7
NIM (%) 8.4 8.6 8.1 7.6
Productivity²
Efficiency (%) 54.2 48.1 47.5 46.2
Service Fees / Personnel Expenses (%)
93.1 102.3
112.9
127.7
Service Fees / Administrative Expenses (%) 53.1 58.0 64.3 69.3
Personnel Expenses per Employee (R$) 69,563 72,616
78,154
101,396
(Employees + Interns) per (Branches + PAA + PAB) 16.8 17.5
17.2
16.7
2008 2009
3.44
24.7
2.0
7.0
45.6
136.2
73.5
93,660
16.4
Loan Portfolio Quality
Allowance / Loan Portfolio (%) 6.1 6.6 6.5 6.4
Allowance / Ratings E + F + G + H (%)
99.5 109.2
110.5
111.7
Capital Structure
Leverage (x )
16.9 15.0
14.3
14.7
BIS Ratio (%) 15.2 17.1 17.3 15.6
Capital Market
Price / Earnings (12 months) 8.59 8.03 8.74 14.88
Price / Book Value 1.84 2.00 2.50 3.10
Market Capitalization (R$ million) 25,979 33,733 52,820 75,269
Book Value per Share (R$)¹ 5.80 6.93 8.38 9.80
6.1
107.5
17.4
15.2
4.28
1.26
37,701
11.66
3.95
25.8
1.6
6.7
40.7
128.2
68.6
108,140
16.8
6.2
114.5
19.6
13.7
7.52
2.11
76,291
14.06
(1) BB shares were traded per lot of one thousand shares until January 2004.(2) Does not consider one-off items
1H09 1H10
1.56
22.0
1.1
6.9
42.1
134.7
70.4
54,141
14.7
7.0
114.2
18.5
15.3
6.16
1.68
54,394
12.60
1.98
26.5
1.5
6.4
43.5
121.0
66.2
53,191
17.9
5.5
114
19.2
12.8
5.65
1.61
63,319
15.31

59
Argentina - Buenos Aires Calle San Martin 323, Piso 2 Caixa de Correio 2684 – MicrocentroC10004 AAG - Buenos Aires – ArgentinaPhone: 54 + 11 + [email protected]
Cayman Islands - Grand Cayman Elizabethan Square, Phase III Building 4th floor, Sheden Road George Town PO Box 1360GT Grand Cayman – Cayman IslandsPhone: 1 + 345 + [email protected]
England - London 34, King Street EC2V 8ESLondon – EnglandPhone: 44 + 207 + [email protected]
Germany - Frankfurt Eschersheimer Landstrasse, 5560322 - Frankfurt – GermanyPhone: 49 + 69 + [email protected]
Japan - Tokyo New Kokusai Building 3-4-1 Marunouchi - Chiyoda ku100-0005 – Tokyo - JapanPhone: 81 + 3 + [email protected]
Spain - Madrid Calle Jose Ortega y Gasset, 29 - 1º piso, Edifício Beatriz28006 - Madrid – SpainPhone: 34 + 91 + [email protected]
Bolivia - La Paz Avenida 16 de Julio, 1642 Caixa de Correio 1650 - El Prado - Central La Paz – BoliviaPhone: 59 + 12 + [email protected]
Chile - Santiago Avenida Apoquindo, 3001, 1º andar Las Condes06760-342 Santiago – ChilePhone: 56 + 2 + [email protected]
France - Paris 29, Avenue Kleber, 16 Arrondisement 75116 - Paris – FrancePhone: 33 + 1 + [email protected]
Italy - Milan Piazza Castello, 1, 3º andar - Centro20121 - Milan – ItalyPhone: 39 + 02 + [email protected]
Paraguay - Asuncion Calle Oliva y Nuestra Señora de La Assunción Centro Cassilla de correo 667 Paraguay - Asuncion Phone: 595 + [email protected]
USA - New York 600 Fifth Avenue, Third floor 10020 – New York (NY) – USAPhone: 1 + 212 + [email protected]
USA - Miami 2, South Biscayne Boulevard - One Biscayne Tower, Suite 3870 – Downtown 33131 - Miami (FL) – USAPhone: 1 + 786 + [email protected]
Distribution Network Abroad
Branches
105/108 Old Broad Street 4th Floor - Pinners HallEC2N 1EREngland-LondonPhone: [email protected]
701 Brickell Avenue - Suite 2610 33131 - Miami - United StatesPhone: 1 + 407 + [email protected]
Banco do Brasil - The Company 1 Half 2010st

60
Subsidiaries
Bolivia - Santa Cruz de La SierraAvenida San Martin, 1700 Centro Empresarial Equipetrol - Piso 4 Santa Cruz de La Sierra – BoliviaPhone: 59 + 13 + [email protected]
Japan - GunmaBandou Building, 1319-1, lida-cho Ota-shi 373-0851 - Gunma-ken – JapanPhone: 81 + 276 + [email protected]
Japan - IbarakiShirai Building 2909-1, Fuchigashira-machi Mitsukaido-shi, Joso-shi 303-0022 - Ibaraki-ken – JapanPhone: 81 + 297 + [email protected]
Japan - NagoiaKirix Marunouchi Building, 1-17-19 Marunouchi, Naka-ku - Nagoya-shi 460-0003 - Aichi-ken – JapanPhone: 81 + 52 + [email protected]
Banco do Brazil AG (Aktiengesellschaft) / Vienna – AustriaFranz Josefs-Kai 47 / 3OG1010 - Vienna – AustriaPhone: 43 + 1 + [email protected]
BB Leasing Company Ltd / Grand Cayman – Cayman IslandsAddress: C/O International Division Gered/Diope - SBS Qd. 01, Lote 32 Ed. Sede III do BB - 13º andarBrasília (DF) - Brazil CEP: 70073-901Phone: 61 + [email protected]
Japan - GifuAsahi Plaza Minokamo Station Core, Office 101-Minokamo-shi, Ota-cho 2591-1505-0041 - Gifu-Ken – JapanPhone: 81 + 574 + [email protected]
Japan - Hamamatsu111-2 Itaya-machi Hamamatsu Act Tower 1F, Shizuoka-ken 4307701 - Hamamatsu-ken – JapanPhone: 81 + 53 + [email protected]
Japan - NaganoAtago Mansion 101 - Chuo Higashi 1-5Ueda-shi 386-0013 Nagano-ken – JapanPhone: 81 + 268 + [email protected]
Paraguay - Ciudad del EsteCalle Nanawa, 107, Esquina Monsenhor Rodrigues – CentroCiudad del Leste – ParaguayPhone: 595 + [email protected]
Banco do Brazil Securities LLC / New York – United States600 Fifth Avenue, Third floor 10020 - New York (NY) – USAPhone: 1 + 212 + [email protected]
BB Money Transfers, Inc. / New York – United States600 Fifth Avenue, Third floor 10020 - New York (NY) – USAPhone: 1 + 212 + [email protected]
Sub-Branches
Banco do Brasil - The Company 1 Half 2010st
Representative Offices
BB Securities Ltd. / London – England7th Floor, 16 St. Martins Le Grand EC1A 4NA - London – EnglandPhone: 44 + 207 + [email protected]
Brazilian American Merchant Bank / Grand Cayman – Cayman IslandsAddress: C/O International Division - Gered/Diope - SBS Qd. 01, Lote 32 Ed. Sede III do BB - 13º andarBrasília (DF) - Brazil CEP: 70073-901Phone: 61 + [email protected]
Venezuela - Caracas Av. Francisco de Miranda Ed. Centro Lido - Torre A - Piso 9 Oficina 93A - El Rosal 1067-A Caracas – VenezuelaPhone: 58 + 212 + [email protected]
United Arab Emirates – DubaiLevel 42, Emirates Towers, Sheikh Zayed Road 31303 - Dubai - United Arab EmiratesPhone: 97 + 1 + [email protected]
Peru – LimaAvenida Camino Real 348 - Piso 9 Torre El Pilar - San IsidroLima – PeruPhone: 511 + [email protected]
Uruguay – MontevideuAv. Dr. Luis Alberto de Herrera, 1248 Complejo WTC - Torre II - Oficina 314 - Buceo 11300-000 - Montevideo – UruguayPhone: 598 + 2 + [email protected]
BB USA Holding Company, Inc. / New York - United States709 Westchester Avenue, 1 floor 10604 - White Plains (NY) – USAPhone: 1 + 212 + [email protected]
Mexico City – MexicoCalle Campos Elíseos, 345 - Piso 6 Edifício Omega Colônia Chapultepec - Polanco11560 - Mexico City (DF) – MéxicoPhone: 52 + 55 + [email protected]
China - Hong KongUnit 1305, 13th Floor, Shanghai Kerry Centre, 1515 Nanjing Road West 200040 - Shanghai - China Phone: 85 + 2 + [email protected]
Angola – LuandaBela Business Park, Edifício Empresarial Malange, Sala 503-A, Bairro Talatona Luanda – AngolaPhone: 244 + 22 + [email protected]
Panama – Panama CityAv. Aquilino de la Guardia/Calle 47 Ocean Business Plaza, Oficina 1202 Marbella 0823-0118 - Panama – Panama CityPhone: 50 + 7 + [email protected]
st
London – England105/108 Old Broad Street - 4th Floor - Pinners HallEC2N 1ER - London - EnglandPhone: 44 + 207 + [email protected]
Rua Engrácia Fragoso, 61 - Primeiro andar C Edifício Kalunga AtriumLuanda - AngolaPhone: 244 + 22 + [email protected]
Unit 903, 9th Floor, Faimont House 8 Cotton Tree Drive - CentralHong Kong - (SAR) ChinaPhone: 85 + 2 + [email protected]
61
Mexico - Mexico City
Banco do Brasil - The Company 1 Half 2010st
62
Associated Subsidiaries
South Korea – SeoulSuite 400-3, Business Center 8th floor, Leema Building, 146-1 Soosong-dong, Chongro-gu - 110-140 - Seul - South Korea Phone: 82 + 2 + 398- [email protected]
Shanghai – ChinaUnit 1305, 13th Floor, Shanghai Kerry Centre, 1515 Nanjing Road West 200040 - Shanghai – ChinaPhone: 86 + 21 + [email protected]
Banco do Brazil AG – Portugal / Cascais Passeio Carlos Andrade Teixeira, 7 e 8Edifício Baía Center 2765-409 - Cascais – PortugalPhone: 351 + 21 + [email protected]
Banco do Brazil AG – Portugal / Parque das Nações Av. D. João II - Lote 1.13.01 E Edifício Horizonte Tejo 1990-078 - Lisboa – PortugalPhone: 351 + 21 + [email protected]
Shared Services UnitBanco do Brazil USA Servicing Center / United States - Orlando8325 South Park Circle, Suite 140 P.O. Box 32819 - Orlando (FL) – USAPhone: 1 + 407 + [email protected]
USA – Washington1801, K Street - N.W. - Suite 71020006-1301 - Washington (DC) – USAPhone: 1 + 202 + [email protected]
Banco do Brazil AG – Portugal / Marquês de Pombal Praça Marquês de Pombal, 16, Centro 1269-134 - Lisbon – PortugalPhone: 351 + 21 + [email protected]
Banco do Brazil AG – Portugal / Porto Av. de França, 256 - Lojas 34/354050-276 - Porto – PortugalPhone: 351 + 22 + [email protected]
Business UnitItaly - Rome (Milan Business Unit)Via Barberini 29, 4º Piano, Centro187 - Rome – ItalyPhone: 39 + 06 + [email protected]
Banco do Brasil - The Company 1 Half 2010st
Contact List
Banco do BrasilSBS – Ed.Sede III – 13º andarInternational Division70073-901 – Brasília (DF) – Brazilwww.bb.com.br
PresidencyPhone: 55 (61) 3310.3400Fax.: 55 (61) 3310.2502
VP of Finance, Capital Markets and Investor RelationsPhone: 55 (61) 3310.3406Fax.: 55 (61) 3310.2502
VP of International Business and WholesalePhone: 55 (61) 3310.3405Fax.: 55 (61) 3310.2502
International DirectorshipPhone: 55 (61) 3310.4500Fax: 55 (61) 3310.2444
International Division - Financial Institutions DepartmentPhone: 55 (11) 3066.9081Fax: 55 (11) 3066.9089
Investor RelationsAddress: SBS – Ed.Sede III – 5th floor70073-901 – Brasília (DF) – BrazilPhone: 55 (61) 3310.3990Fax: 55 (61) 3310.3735e-mail: [email protected]
63Banco do Brasil - The Company 1 Half 2010st

64
Notes
Banco do Brasil - The Company 1 Half 2010st

65
Notes
Banco do Brasil - The Company 1 Half 2010st

Notes
66 Banco do Brasil - The Company 1 Half 2010st

Notes
67Banco do Brasil - The Company 1 Half 2010st

Notes
68 Banco do Brasil - The Company 1 Half 2010st