The combined use of GC, PDSC and FT-IR techniques to ...
12
Research Article Klara Zglińska, Tomasz Niemiec, Joanna Bryś, Andrzej Bryś, Andrzej Łozicki, Iwona Kosieradzka, Piotr Koczoń* The combined use of GC, PDSC and FT-IR techniques to characterize fat extracted from commercial complete dry pet food for adult cats https://doi.org/10.1515/chem-2020-0146 received March 23, 2020; accepted June 11, 2020 Abstract: This study aims to compare the quality of fat extracted from different priced dry pet food for adult cats through classical and instrumental methods: pressure differential scanning calorimetry (PDSC), Fourier transform infrared spectroscopy (FT-IR) or gas chromatography (GC). Fat extracted from pet food was examined for induction time (IT), fatty acid composition, free fatty acid (FFA) content and peroxide value with the use of PDSC, GC, acid–base and iodometric titration, respectively. FT-IR data from the selected spectral regions correlate with the value of oxidation IT or the content of FFA. This resulted in construction of a reference model for IT with the following statistical features: R calibration = 0.917 (RMSEC = 28.0) and R validation = 0.841 (RMSEP = 34.6). For fatty acid content, model statistics were as follows: R calibration = 0.912 (RMSEC = 0.61) and R validation = 0.856 (RMSEP = 0.75). Discriminant model that uses spectral data alone, calculated with performance index 83.7 allowed distinguishing the studied pet food samples due to the price. Studies conducted proved PDSC and IR as reliable analytical techniques to control and monitor the quality of dry pet food for cats. Considering quality of the studied samples, it was proved that low-priced pet foods can be stored longer than premium-priced ones, while former is nutritionally more beneficial for adult cats. Keywords: pet food, fat quality, cat complete food, commercial feeds, oxidative stability 1 Introduction According to GfK Institute, a global increase in the amount of pet food sold in 2016 was 5% greater on average compared to that of 2015. However, in devel- oping countries of eastern Europe, this increase was more than 7%, while western countries reported only a 2% increase. A significant increase in eastern European countries is accompanied by a rapidly increasing number of producers and a variety of products offered. Euromonitor International evaluates the value of the pet food market in Poland as 1.8 billion PLN and forecasts a rapid increase in this sector in the coming years [1]. Increased demand for pet food results in increased production that in turn requires intensified quality control. Quality control refers to controlling sources of starting materials, technological processes applied in the production and chemical composition of the final product. Pertaining to source fat used should be of good quality as it is the component most sensitive to environmental factors, hence mostly influencing the deterioration process. The fat contained in the final product is mainly animal fat, provided via the rendering process. Additional fat comes from the poultry by- product meal and/or corn, while smaller amounts come from meat and bone meal, wheat and soybean meal. Such mixture contains a range of fatty acids including the essential unsaturated fatty acid (UFA), e.g., linoleic acid. Some other commonly used fat sources in pet dry food production are vegetable, fish and flaxseed oils rich in linoleic acid and omega-3 fatty acids [2]. Appropriate Klara Zglińska, Tomasz Niemiec, Andrzej Łozicki, Iwona Kosieradzka: Division of Animal Nutrition, Institute of Animal Science, Warsaw University of Life Sciences – SGGW, Warsaw, 02-786, Poland Joanna Bryś: Department of Chemistry, Institute of Food Sciences, Warsaw University of Life Sciences – SGGW, Warsaw, 02-776, Poland Andrzej Bryś: Department of Fundamental Engineering and Energetics, Institute of Mechanical Engineering, Warsaw University of Life Sciences – SGGW, Warsaw, 02-776, Poland * Corresponding author: Piotr Koczoń, Department of Chemistry, Institute of Food Sciences, Warsaw University of Life Sciences – SGGW, Warsaw, 02-776, Poland, e-mail: [email protected] Open Chemistry 2020; 18: 1136–1147 Open Access. © 2020 Klara Zglińska et al., published by De Gruyter. This work is licensed under the Creative Commons Attribution 4.0 Public License.
-
Upload
khangminh22 -
Category
Documents
-
view
0 -
download
0
Transcript of The combined use of GC, PDSC and FT-IR techniques to ...
Research Article
Klara Zglińska, Tomasz Niemiec, Joanna Bryś, Andrzej Bryś, Andrzej Łozicki,Iwona Kosieradzka, Piotr Koczoń*
The combined use of GC, PDSC and FT-IRtechniques to characterize fat extracted fromcommercial complete dry pet food for adult cats
https://doi.org/10.1515/chem-2020-0146received March 23, 2020; accepted June 11, 2020
Abstract: This study aims to compare the quality of fatextracted from different priced dry pet food for adult catsthrough classical and instrumental methods: pressuredifferential scanning calorimetry (PDSC), Fourier transforminfrared spectroscopy (FT-IR) or gas chromatography (GC).Fat extracted from pet food was examined for inductiontime (IT), fatty acid composition, free fatty acid (FFA)content and peroxide value with the use of PDSC, GC,acid–base and iodometric titration, respectively. FT-IR datafrom the selected spectral regions correlate with the value ofoxidation IT or the content of FFA. This resulted inconstruction of a reference model for IT with the followingstatistical features: Rcalibration = 0.917 (RMSEC = 28.0) andRvalidation = 0.841 (RMSEP = 34.6). For fatty acid content,model statistics were as follows: Rcalibration = 0.912 (RMSEC =0.61) and Rvalidation = 0.856 (RMSEP = 0.75). Discriminantmodel that uses spectral data alone, calculated withperformance index 83.7 allowed distinguishing the studiedpet food samples due to the price. Studies conductedproved PDSC and IR as reliable analytical techniques tocontrol and monitor the quality of dry pet food for cats.Considering quality of the studied samples, it was proved
that low-priced pet foods can be stored longer thanpremium-priced ones, while former is nutritionally morebeneficial for adult cats.
Keywords: pet food, fat quality, cat complete food,commercial feeds, oxidative stability
1 Introduction
According to GfK Institute, a global increase in theamount of pet food sold in 2016 was 5% greater onaverage compared to that of 2015. However, in devel-oping countries of eastern Europe, this increase wasmore than 7%, while western countries reported only a2% increase. A significant increase in eastern Europeancountries is accompanied by a rapidly increasingnumber of producers and a variety of products offered.Euromonitor International evaluates the value of the petfood market in Poland as 1.8 billion PLN and forecasts arapid increase in this sector in the coming years [1].Increased demand for pet food results in increasedproduction that in turn requires intensified qualitycontrol. Quality control refers to controlling sources ofstarting materials, technological processes applied in theproduction and chemical composition of the finalproduct. Pertaining to source fat used should be ofgood quality as it is the component most sensitive toenvironmental factors, hence mostly influencing thedeterioration process. The fat contained in the finalproduct is mainly animal fat, provided via the renderingprocess. Additional fat comes from the poultry by-product meal and/or corn, while smaller amounts comefrom meat and bone meal, wheat and soybean meal.Such mixture contains a range of fatty acids includingthe essential unsaturated fatty acid (UFA), e.g., linoleicacid. Some other commonly used fat sources in pet dryfood production are vegetable, fish and flaxseed oils richin linoleic acid and omega-3 fatty acids [2]. Appropriate
Klara Zglińska, Tomasz Niemiec, Andrzej Łozicki, IwonaKosieradzka: Division of Animal Nutrition, Institute of AnimalScience, Warsaw University of Life Sciences – SGGW, Warsaw,02-786, PolandJoanna Bryś: Department of Chemistry, Institute of Food Sciences,Warsaw University of Life Sciences – SGGW, Warsaw, 02-776,PolandAndrzej Bryś: Department of Fundamental Engineering andEnergetics, Institute of Mechanical Engineering, Warsaw Universityof Life Sciences – SGGW, Warsaw, 02-776, Poland
* Corresponding author: Piotr Koczoń, Department of Chemistry,Institute of Food Sciences, Warsaw University of LifeSciences – SGGW, Warsaw, 02-776, Poland,e-mail: [email protected]
Open Chemistry 2020; 18: 1136–1147
Open Access. © 2020 Klara Zglińska et al., published by De Gruyter. This work is licensed under the Creative Commons Attribution 4.0 PublicLicense.
fat of good quality ensures proper growth, developmentand healthiness of animal fed. Cats require an especiallywell-balanced diet in terms of fatty acid composition.Their specific metabolism of n-3 and n-6 fatty acidsrequires feed containing those compounds in stable,degradation-resistant form. Fat components are air andwater sensitive. They undergo chemical reactions espe-cially if reactive double bonds are present. Stored fattyacids, especially UFAs, are prone to oxygen action.When oxygen reacts with fatty acids, interims includingfree radicals are formed and the main product is said tobe oxidized or rancid. The function of antioxidants in petfoods is to prevent or stop the oxidation process. All dryproducts require an antioxidant (preservation) system tostop oxygen from destroying UFAs, which are first aim ofenvironmental oxygen action. A rancid product isdeficient in important nutrients, contains free radicalsand probably has a bad taste/aroma that causes the petto reject the food [2].
The Official Publication of the Association of theAmerican Feed Control Officials (AAFCO), the NationalResearch Council (NRC) recommendations or TheEuropean Pet Food Industry Federation – FEDIAF asso-ciated with Scientific Advisory Board have been uniform interms of the development of standards for commercial catfood, and their recommendations are based on peer-reviewed scientific data and information from experts inthe field. The recommendations published by NRC presentthe required amounts of each nutrient to be included in adiet. FEDIAF and AAFCO recommended minimum fat,linoleic acid, arachidonic acid, alpha-linolenic acid andeicosapentaenoic acid + docosahexaenoic acid level in petfood [3]. According to the study by Ahlstrom et al. (2004),it is known that the fatty acid profile consumed by pet catshas a ratio of n-6:n-3 fatty acids between 5:1 and 17:1,which differs from the ratio appropriate for feral cats(recommended ratio is 2:1) [4]. Unfortunately, there are norecommendations on the correct amount and ratio ofsaturated fatty acids (SFAs) to UFAs, especially mono-unsaturated fatty acids (MUFAs) and polyunsaturatedfatty acids (PUFAs) in cat diets. Therefore, the quality ofpet food fat mainly refers to the total content of UFAs thatare of particular importance in feeding cats.
Infrared spectroscopy (IR) and differential scanningcalorimetry (DSC) are modern methods that providereliable information on the quality of fats. Gas chroma-tography (GC) provides about the fatty acid compositionof studied samples. IR is a rapid and sensitive techniquethat provides information on the energy of vibratinggroups of atoms in a molecule. For 20 years, it has beenused for food analysis widely, including fats and oils
analysis [5–7]. It was proven to be a proper instrumentfor the evaluation of milk, vegetables, various beveragesand meets quality and chemical composition. Theapplication of IR in quality analysis of fats and oils isone of the most common and documented trends in thearea [8–11]. The major advantages of Fourier transforminfrared spectroscopy (FT-IR) over other techniquesinclude rapid and easy equipment operations alongwith the possibility to conduct nondestructive measure-ment of samples at any state, i.e., solid, liquid, paste, gaswith convenient and environmentally friendly samplepreparation with no chemical waste production.
Pressure differential scanning calorimetry (PDSC) is arapid technique that requires quite small amount ofsample. Although it has many advantages, it is undiscov-ered fully so far. Only limited literature data are availableon the application of PDSC in food and feed analysis. DSChas also been used to monitor the oxidative stability of fatsand oils contained in feed samples, as well as studiedalone [12,13]. GC used for fatty acid composition iscurrently considered a standard method and therefore iswidely applied in many laboratories worldwide [14,15].
The current investigation provided feedback on some ofthe social requirements and doubts related to feed qualityand its controlling measures, e.g., allowed time of storage,materials used to produce feed or methods used to controlthe quality of fats and oils contained in the feed, thenutritional value of feed. Data obtained by PDSC, GC and IRmethods were used to evaluate cat feeds of different prices.It was expected that, if present, variation in the quality ofdifferent price feeds can be due to the use of differentstarting materials in various ratios in the productionprocess. Initial materials used have a significant impact onthe oxidative stability of fat in the final product. The loweroxidative stability results in the faster oxidation and thelower quality. Higher oxidative stabilities were expected tobe greater for more premium-priced products that can bechecked with the use of various analytical methods.Therefore, the scientific aim of this study is to check theoxidative stability of oils extracted from the feed, indicatedby induction time (IT), free fatty acids (FFAs) and peroxidevalue (PV). Oxidative stability results from the chemicalcomposition of the oil, which in turn exhibits in wave-number and intensity of bands occurring in IR spectra.Reference models were constructed to correlate oxidativestability with spectral information from selected specificregions. As chemical difference between price-differingfeeds was expected, the next scientific aim was to constructa statistically significant discriminant model, with the use ofspectral data exclusively, to rapidly differentiate feeds dueto their price or quality. Both discriminant and reference
GC, PDSC and FT-IR to characterize fat extracted from commercial dry cat food 1137
models equipped with statistically significant power ofprediction can be further used for rapid and versatileevaluation of feed quality of any unknown cat feed sample.
2 Materials and methods
2.1 Pet food for cat
Commercial complete pet foods for adult cats werepurchased at different prices from the local market inWarsaw, Poland. Each group of studied products, i.e.,low-priced (L), fairly average priced (A) and premium-priced (P), consisted of samples from three differentcompanies (L1, L2 and L3; A1, A2 and A3; P1, P2 and P3,respectively). To ensure random diversity, each one ofthree different low-priced, fairly average priced andpremium-priced dry pet food composed of ten samplespurchased from various retailers. For example, P1composed of ten samples of the same feed, meaningfeed with the identical label, purchased from differentretailers. Boxes were opened and subjected to furtheranalysis starting with fat extraction.
2.2 Extraction of fat
The Folch method [16,17] with further improvement byBoselli was applied for studied feed samples to chemi-cally extract a fat from them with the use of hexane.
2.3 PV and FFA content
The PV of the mixture was determined by the iodometrictechnique with visual endpoint detection. The FFAcontent was calculated based on acid values and thevalue of the molar mass of oleic acid. The acid value wasdetermined by titration of fat samples with 0.1 Methanolic potassium hydroxide solution.
2.4 GC measurements
The determination of fatty acid composition was carriedout by GC analysis of fatty acid methyl esters. Methyl
esters of fatty acids were prepared through the saponi-fication of triacylglycerols and esterification withmethanol according to ISO 5509:2001. An YL6100 GCchromatograph equipped with a flame ionization de-tector and a BPX-70 capillary column of 0.20mm i.d. ×60m length and 0.25 µm film thickness was used. Theoven temperature was set at 60°C for 5 min, and then itwas increased from 10°Cmin−1 to 180°C; from 180°C to230°C, temperature was increased by 3°Cmin−1 and thenmaintained at 230°C for 15 min. The temperature of theinjector was 225°C, with a split ratio of 1:100, and thedetector temperature was 250°C. Nitrogen flowing withthe rate of 1 mLmin−1 was used as the carrier gas. Theidentification of fatty acids was carried out using thelipid standard.
2.5 DSC measurements
A differential scanning calorimeter (DSC Q20 TA) coupledwith a high-pressure cell (PDSC) was used. Fat samples of3–4mg were weighed in an aluminum open pan andplaced in the sample chamber under an oxygen atmo-sphere with an initial pressure of 1,400 kPa and theoxygen flow rate of 100mLmin−1. The isothermal tem-perature for each sample was 120°C. Obtained diagramswere analyzed using TA Universal Analysis 2000 software.For each sample, the output was automatically recalcu-lated and presented as amount of energy per one gram.The maximum PDSC oxidation time (IT) was determinedbased on the maximum rate of oxidation (maximum rateof heat flow).
2.6 FT-IR measurements
The background spectrum was registered with an emptymeasuring chamber for each sample separately toeliminate the influence of carbon dioxide and water vaporpresent in the air on the spectra of samples. A drop of thesample was placed on a round ZnSe (zinc selenide) plateand covered with another identical plate to form a film of asample between them. Therefore, the path length of IRlight passing through the sample was considered constant.Both plates were then placed in a holder that wasmounted in the measuring chamber of Perkin ElmerSystem 2000 instrument using dedicated slides. Afterclosing measuring chamber doors, recording of spectrumhas been started. Region selected was 4,000–400 cm−1
1138 Klara Zglińska et al.
with the resolution of 2 cm−1. Twenty-five scans were takenfor background spectrum followed by 25 scans forspectrum of each sample. After recording of spectrum,sample holder plates were washed with hexane and thenshortly with water and dried with paper towel to removetraces of given sample before further recording. Thecomputer runs on Windows 95 with GRAMS AI softwarethat operated with System 2000 spectrometer.
2.7 Modeling
Two types of models, i.e., discriminant and reference wereconstructed. Discriminant models were obtained withspectral data alone. Wavenumbers and intensities of selectedbands occurring in different spectral regions were used toform homologous groups of samples, i.e., groups of sampleswith identical or very similar properties. Specific regionsexpected to contain different information on every homo-logous group of samples were tested to obtain the bestseparation with the appropriate assignment of samples.Some of the studied samples were ignored within modelconstruction as considered outliers. For discriminant models,Mahalanobis distances within the own group and distancesfrom the next groups were calculated. Mahalanobis distanceis the distance of a given sample from the mean of a set of allsamples considered. Mahalanobis distances allow us togather samples with similar characteristics in one homo-logous group, separated from other groups of differentcharacteristics (spectral characteristics were used in currentstudies). Calculating these distances (using GRAMS IAsoftware) allows us to arrange samples of similar propertiesinto one group in which Mahalanobis distance for eachsample is not greater than one. This is crucial fordiscriminant analysis, as similar samples are in groups thatare distinguished from others. Distances from other thanown group served to evaluate discrepancies between groups.For reference models, some outlier spectra were ignored aswell. The trials with different spectral regions were done toobtain models with the highest correlation coefficient valuesfor both calibration and prediction meaning smallest residualmean square error of calibration (RMSEC) and residual meansquare error of prediction (RMSEP), respectively.
Mahalanobis distance, that is, the distance of agiven sample from the mean of a set of samples, wascalculated as follows:
= ( ) ( )
−D X X S X X– – ,2ave
T 1ave
where D is the distance (as a scalar); X is the data vector(n × 1); Xave is the mean data vector (n × 1); S is the
covariance matrix (n × n); (X − Xave)T denotes the transposeof (X − Xavg); n is the number of data points in X.
Ethical approval: The conducted research is not relatedto either human or animal use.
3 Results
3.1 Fat characterization by PDSC and GC
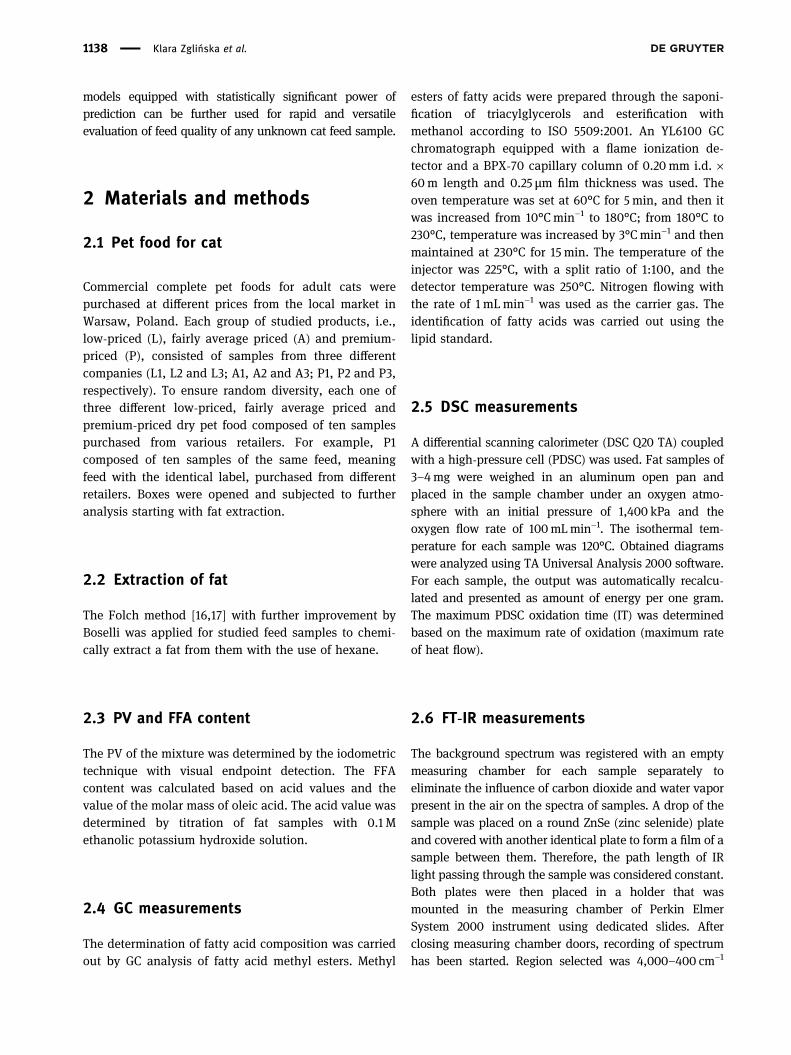
SFAs, MUFAs, PUFAs and TRANS (fatty acids with transconfiguration at double bond) were analyzed. Figure 1shows the percentage composition of studied fats.
On the left y-axis, one can observe a similarpercentage level of SFA and MUFA and a significantlylower percentage of PUFA.
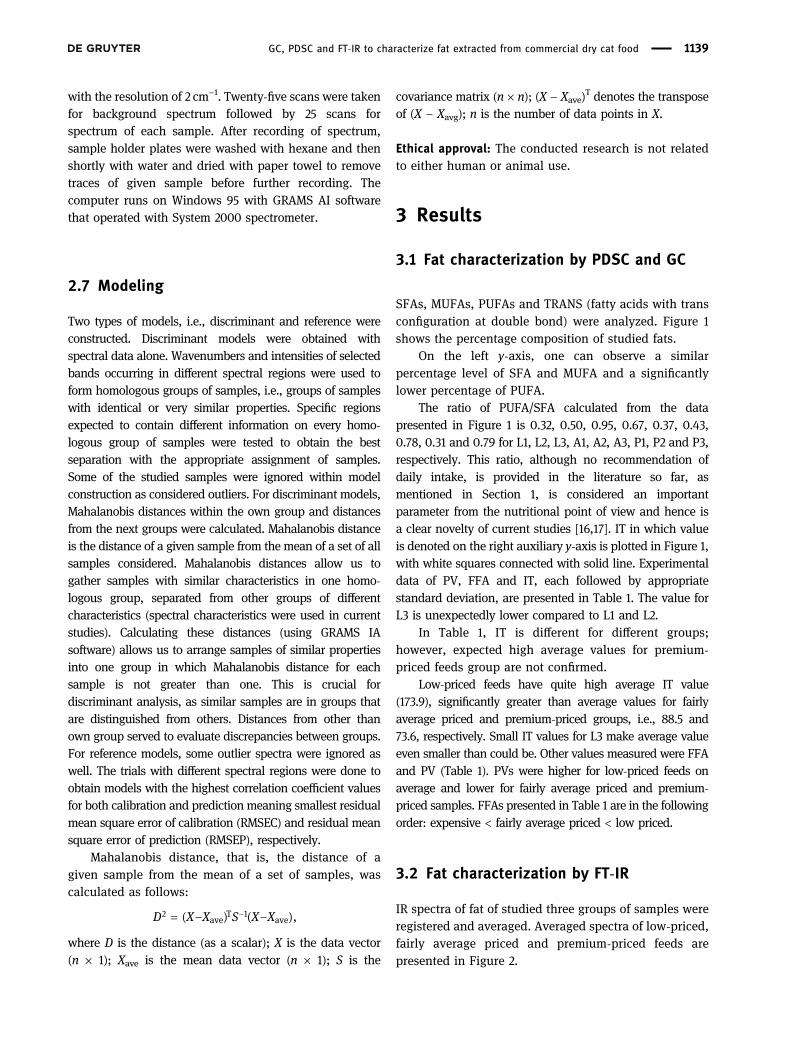
The ratio of PUFA/SFA calculated from the datapresented in Figure 1 is 0.32, 0.50, 0.95, 0.67, 0.37, 0.43,0.78, 0.31 and 0.79 for L1, L2, L3, A1, A2, A3, P1, P2 and P3,respectively. This ratio, although no recommendation ofdaily intake, is provided in the literature so far, asmentioned in Section 1, is considered an importantparameter from the nutritional point of view and hence isa clear novelty of current studies [16,17]. IT in which valueis denoted on the right auxiliary y-axis is plotted in Figure 1,with white squares connected with solid line. Experimentaldata of PV, FFA and IT, each followed by appropriatestandard deviation, are presented in Table 1. The value forL3 is unexpectedly lower compared to L1 and L2.
In Table 1, IT is different for different groups;however, expected high average values for premium-priced feeds group are not confirmed.
Low-priced feeds have quite high average IT value(173.9), significantly greater than average values for fairlyaverage priced and premium-priced groups, i.e., 88.5 and73.6, respectively. Small IT values for L3 make average valueeven smaller than could be. Other values measured were FFAand PV (Table 1). PVs were higher for low-priced feeds onaverage and lower for fairly average priced and premium-priced samples. FFAs presented in Table 1 are in the followingorder: expensive < fairly average priced < low priced.
3.2 Fat characterization by FT-IR
IR spectra of fat of studied three groups of samples wereregistered and averaged. Averaged spectra of low-priced,fairly average priced and premium-priced feeds arepresented in Figure 2.
GC, PDSC and FT-IR to characterize fat extracted from commercial dry cat food 1139
Each spectrum was averaged from 18 spectra (2replications each) registered for 9 samples from everygroup. Spectra presented in Figure 2 are quite similar toeach other. Characteristic strong bands at 2,800–3,000 cm−1
are present in every spectrum. Bands in this region aregenerated by C–H vibrations, with C–H of benzene ringoccurring over 3,020 cm−1 and C–H groups forming carbonchain under 3,020 cm−1 [18]. If bands over 3,020 cm−1 arenot present, samples were considered to not containchemicals with benzene ring. Samples that do not containwater or contain very small amount of water are indicatedby weak but relatively broad bands at around 3,321 cm−1 and3,429 cm−1 generated by vibrations of O–H water group(Wang et al., 2004). Next region with very strong bands is at
1,800–1,580 cm−1. Bands in this region are generated by C═Ovibrations, i.e., symmetric and asymmetric stretches [19].
Moving right on the spectrum toward lower wave-numbers, dactyloscopy region starts [20]. Small differ-ences, e.g., different intensity ratios, or slightly differentshapes of selected bands occur; however, region800–650 requires more detailed analysis. Figure 3presents the extension for the region.
In the region presented on Figure 3, there are twodistinct bands located at 759 and 723 cm–1, respectively. Foreach studied cat feed spectrum those bands are pointedwith arrows. Their mutual ratios, however, differ signifi-cantly depending on the type of the sample. In the case oflow-priced (solid line) and premium-priced (dotted line)feeds, the ratio of intensity is 759–723 cm−1 and bands aresignificantly bigger. In the case of medium-priced feed(dashed line), this ratio is much smaller. This shows one ofthe differences in the chemical composition of three studiedsamples. In addition, in the low-priced feed (solid line),there is a band at 668 cm−1 that is significantly more intensethan bands at the same wavenumber in two remainingfeeds. Only few examples of differences performed by visualinspection are presented here, but some other less cleardifferences certainly occur, which can be detected only withappropriate software, which is explained in the followingsection.
3.3 Discriminant model
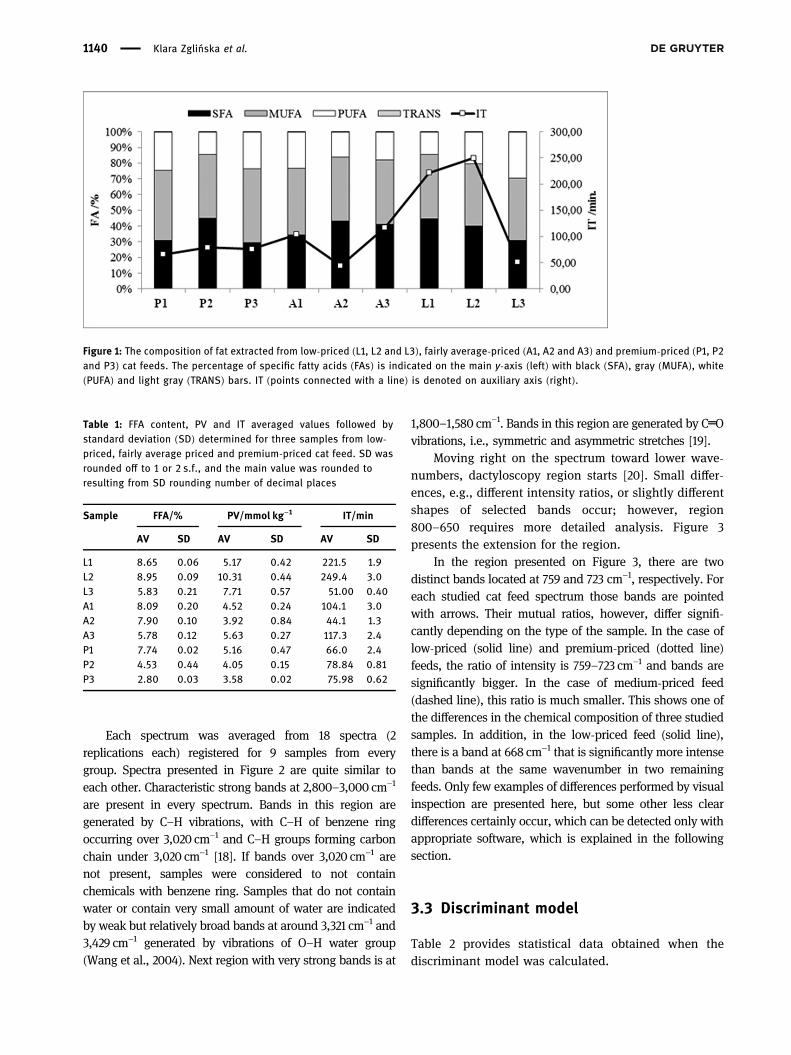
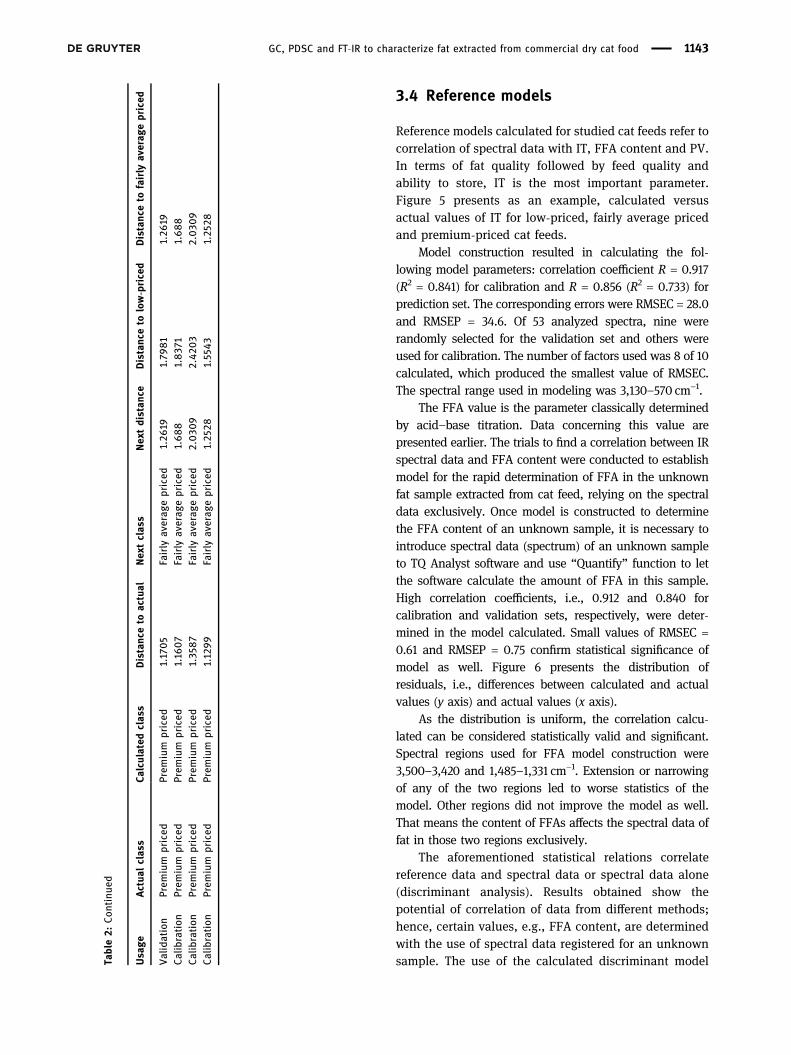
Table 2 provides statistical data obtained when thediscriminant model was calculated.
Figure 1: The composition of fat extracted from low-priced (L1, L2 and L3), fairly average-priced (A1, A2 and A3) and premium-priced (P1, P2and P3) cat feeds. The percentage of specific fatty acids (FAs) is indicated on the main y-axis (left) with black (SFA), gray (MUFA), white(PUFA) and light gray (TRANS) bars. IT (points connected with a line) is denoted on auxiliary axis (right).
Table 1: FFA content, PV and IT averaged values followed bystandard deviation (SD) determined for three samples from low-priced, fairly average priced and premium-priced cat feed. SD wasrounded off to 1 or 2 s.f., and the main value was rounded toresulting from SD rounding number of decimal places
Sample FFA/% PV/mmol kg−1 IT/min
AV SD AV SD AV SD
L1 8.65 0.06 5.17 0.42 221.5 1.9L2 8.95 0.09 10.31 0.44 249.4 3.0L3 5.83 0.21 7.71 0.57 51.00 0.40A1 8.09 0.20 4.52 0.24 104.1 3.0A2 7.90 0.10 3.92 0.84 44.1 1.3A3 5.78 0.12 5.63 0.27 117.3 2.4P1 7.74 0.02 5.16 0.47 66.0 2.4P2 4.53 0.44 4.05 0.15 78.84 0.81P3 2.80 0.03 3.58 0.02 75.98 0.62
1140 Klara Zglińska et al.

Mahalanobis distances, i.e., “distance to actual,”“distance to low-priced” and “distance to fairlyaverage,” are presented for each investigated sample.Three classes, i.e., homologous groups, were obtainedwith 12 spectra for low-priced feed, 17 spectra for fairlyaverage priced feeds and 14 spectra for premium-pricedfeeds. Remaining spectra, i.e., five for low-priced andthree for fairly average priced feed samples, wererejected from the model as outstanding. Samples werebest assigned to individual groups with the use ofspectral data from 3,057 to 574 cm−1 region, which coversalmost entire spectrum while not overfitted. The perfor-mance index of the model constructed with the use of
ten principal components equals 83.7, which indicatesstatistically high match and calibration.
The “next class” term in Table 2 refers to theMahalanobis distance between the given sample and thesecond close class (homologous group). Data presented inTable 2 allow to state that low-priced samples aresignificantly different from premium-priced samples (biggestMahalanobis distances), and for both classes, fairly averagepriced group is the next class. On the other hand, fairlyaverage priced group samples have random similarity topremium-priced and low-priced feed samples as appropriateMahalanobis distances differ. Figure 4 shows graphically howthe samples are divided into separate homologous groups.
Figure 2: IR spectra registered for low-priced, fairly average priced and premium-priced cat feeds as a radiation transmittance againstwavenumber in the range 4,000–400 cm−1.
Figure 3: IR spectral region 900–500 cm−1 extension registered for low-priced, fairly average priced and premium-priced cat feeds as aradiation transmittance against wavenumber.
GC, PDSC and FT-IR to characterize fat extracted from commercial dry cat food 1141
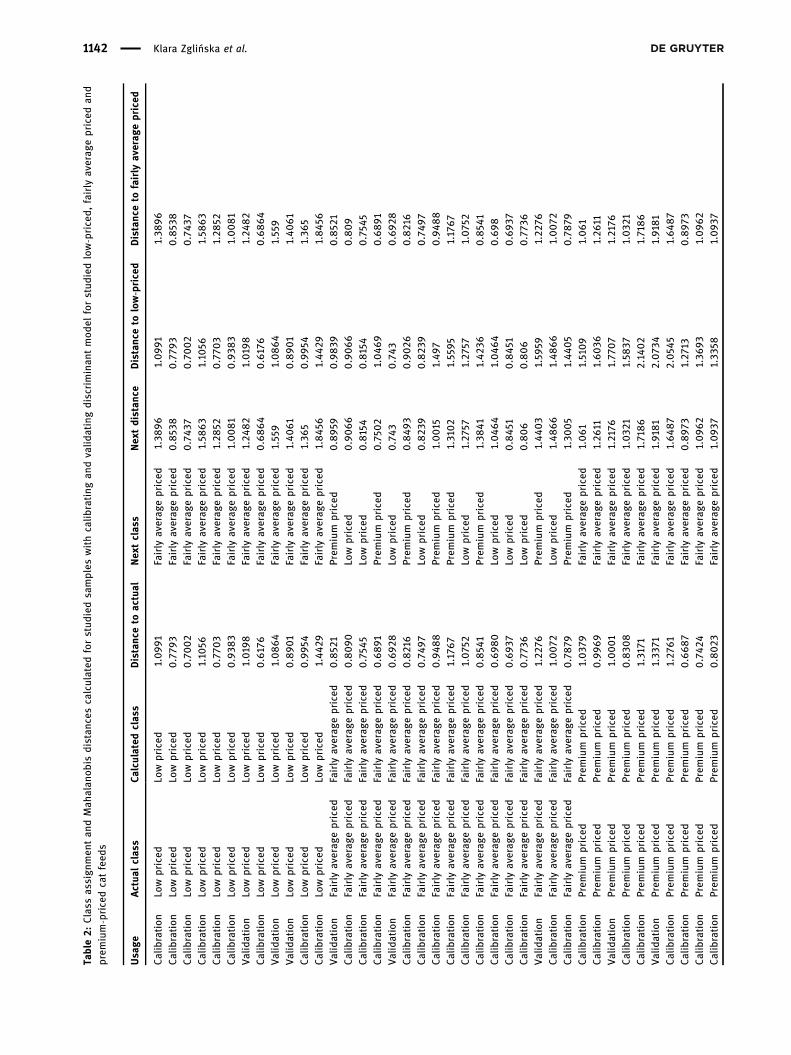
Table2:
Class
assign
men
tan
dMah
alan
obis
distan
cescalculated
forstud
iedsa
mples
withcalib
rating
andvalid
atingdiscriminan
tmod
elforstud
iedlow-priced,
fairly
averag
epriced
and
prem
ium-pricedcatfeed
s
Usa
geActua
lclas
sCa
lculated
clas
sDistanc
eto
actual
Nex
tclas
sNex
tdistan
ceDistanc
eto
low-priced
Distanc
eto
fairly
averag
epriced
Calibration
Low
priced
Low
priced
1.099
1Fairly
averag
epriced
1.38
961.099
11.38
96Calibration
Low
priced
Low
priced
0.779
3Fairly
averag
epriced
0.853
80.779
30.853
8Calibration
Low
priced
Low
priced
0.7002
Fairly
averag
epriced
0.743
70.7002
0.743
7Calibration
Low
priced
Low
priced
1.10
56Fairly
averag
epriced
1.58
63
1.10
561.58
63
Calibration
Low
priced
Low
priced
0.770
3Fairly
averag
epriced
1.28
520.770
31.28
52Calibration
Low
priced
Low
priced
0.938
3Fairly
averag
epriced
1.0081
0.938
31.0081
Validation
Low
priced
Low
priced
1.0198
Fairly
averag
epriced
1.24
82
1.0198
1.24
82
Calibration
Low
priced
Low
priced
0.6176
Fairly
averag
epriced
0.6864
0.6176
0.6864
Validation
Low
priced
Low
priced
1.0864
Fairly
averag
epriced
1.559
1.0864
1.559
Validation
Low
priced
Low
priced
0.890
1Fairly
averag
epriced
1.40
61
0.890
11.40
61
Calibration
Low
priced
Low
priced
0.995
4Fairly
averag
epriced
1.36
50.995
41.36
5Calibration
Low
priced
Low
priced
1.44
29Fairly
averag
epriced
1.845
61.44
291.845
6Validation
Fairly
averag
epriced
Fairly
averag
epriced
0.852
1Prem
ium
priced
0.895
90.9839
0.852
1Calibration
Fairly
averag
epriced
Fairly
averag
epriced
0.8090
Low
priced
0.9066
0.9066
0.809
Calibration
Fairly
averag
epriced
Fairly
averag
epriced
0.754
5Lo
wpriced
0.8154
0.8154
0.754
5Calibration
Fairly
averag
epriced
Fairly
averag
epriced
0.6891
Prem
ium
priced
0.750
21.046
90.6891
Validation
Fairly
averag
epriced
Fairly
averag
epriced
0.692
8Lo
wpriced
0.743
0.743
0.692
8Calibration
Fairly
averag
epriced
Fairly
averag
epriced
0.8216
Prem
ium
priced
0.849
30.9026
0.8216
Calibration
Fairly
averag
epriced
Fairly
averag
epriced
0.749
7Lo
wpriced
0.823
90.823
90.749
7Calibration
Fairly
averag
epriced
Fairly
averag
epriced
0.948
8Prem
ium
priced
1.0015
1.49
70.948
8Calibration
Fairly
averag
epriced
Fairly
averag
epriced
1.1767
Prem
ium
priced
1.3102
1.5595
1.1767
Calibration
Fairly
averag
epriced
Fairly
averag
epriced
1.075
2Lo
wpriced
1.27
571.27
571.075
2Calibration
Fairly
averag
epriced
Fairly
averag
epriced
0.854
1Prem
ium
priced
1.38
411.42
360.854
1Calibration
Fairly
averag
epriced
Fairly
averag
epriced
0.698
0Lo
wpriced
1.046
41.046
40.698
Calibration
Fairly
averag
epriced
Fairly
averag
epriced
0.693
7Lo
wpriced
0.845
10.845
10.693
7Calibration
Fairly
averag
epriced
Fairly
averag
epriced
0.773
6Lo
wpriced
0.806
0.806
0.773
6Validation
Fairly
averag
epriced
Fairly
averag
epriced
1.22
76Prem
ium
priced
1.44
03
1.59
591.22
76Calibration
Fairly
averag
epriced
Fairly
averag
epriced
1.0072
Low
priced
1.48
66
1.48
66
1.0072
Calibration
Fairly
averag
epriced
Fairly
averag
epriced
0.7879
Prem
ium
priced
1.30
05
1.44
05
0.7879
Calibration
Prem
ium
priced
Prem
ium
priced
1.037
9Fairly
averag
epriced
1.061
1.5109
1.061
Calibration
Prem
ium
priced
Prem
ium
priced
0.996
9Fairly
averag
epriced
1.26
111.6036
1.26
11Validation
Prem
ium
priced
Prem
ium
priced
1.0001
Fairly
averag
epriced
1.2176
1.77
07
1.2176
Calibration
Prem
ium
priced
Prem
ium
priced
0.830
8Fairly
averag
epriced
1.032
11.58
371.032
1Calibration
Prem
ium
priced
Prem
ium
priced
1.3171
Fairly
averag
epriced
1.7186
2.1402
1.7186
Validation
Prem
ium
priced
Prem
ium
priced
1.33
71Fairly
averag
epriced
1.9181
2.073
41.9181
Calibration
Prem
ium
priced
Prem
ium
priced
1.27
61
Fairly
averag
epriced
1.648
72.054
51.648
7Calibration
Prem
ium
priced
Prem
ium
priced
0.6687
Fairly
averag
epriced
0.897
31.27
130.897
3Calibration
Prem
ium
priced
Prem
ium
priced
0.742
4Fairly
averag
epriced
1.096
21.36
931.096
2Calibration
Prem
ium
priced
Prem
ium
priced
0.8023
Fairly
averag
epriced
1.093
71.33
581.093
7
1142 Klara Zglińska et al.
3.4 Reference models
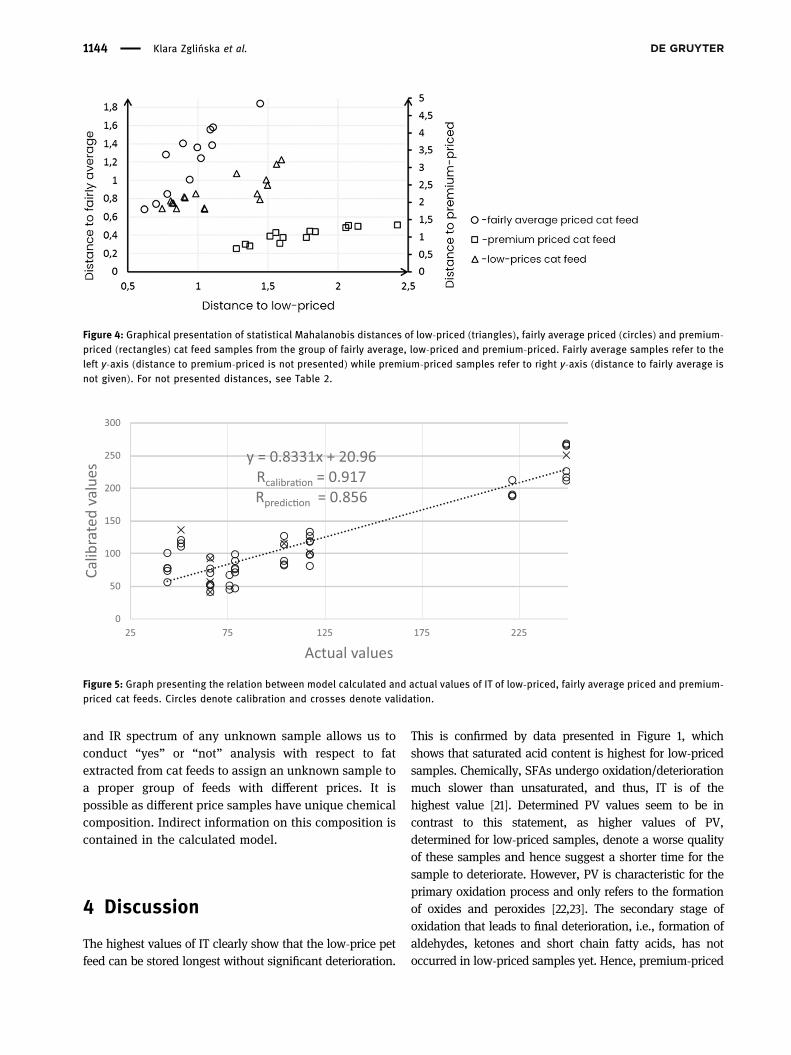
Reference models calculated for studied cat feeds refer tocorrelation of spectral data with IT, FFA content and PV.In terms of fat quality followed by feed quality andability to store, IT is the most important parameter.Figure 5 presents as an example, calculated versusactual values of IT for low-priced, fairly average pricedand premium-priced cat feeds.
Model construction resulted in calculating the fol-lowing model parameters: correlation coefficient R = 0.917(R2 = 0.841) for calibration and R = 0.856 (R2 = 0.733) forprediction set. The corresponding errors were RMSEC = 28.0and RMSEP = 34.6. Of 53 analyzed spectra, nine wererandomly selected for the validation set and others wereused for calibration. The number of factors used was 8 of 10calculated, which produced the smallest value of RMSEC.The spectral range used in modeling was 3,130–570 cm−1.
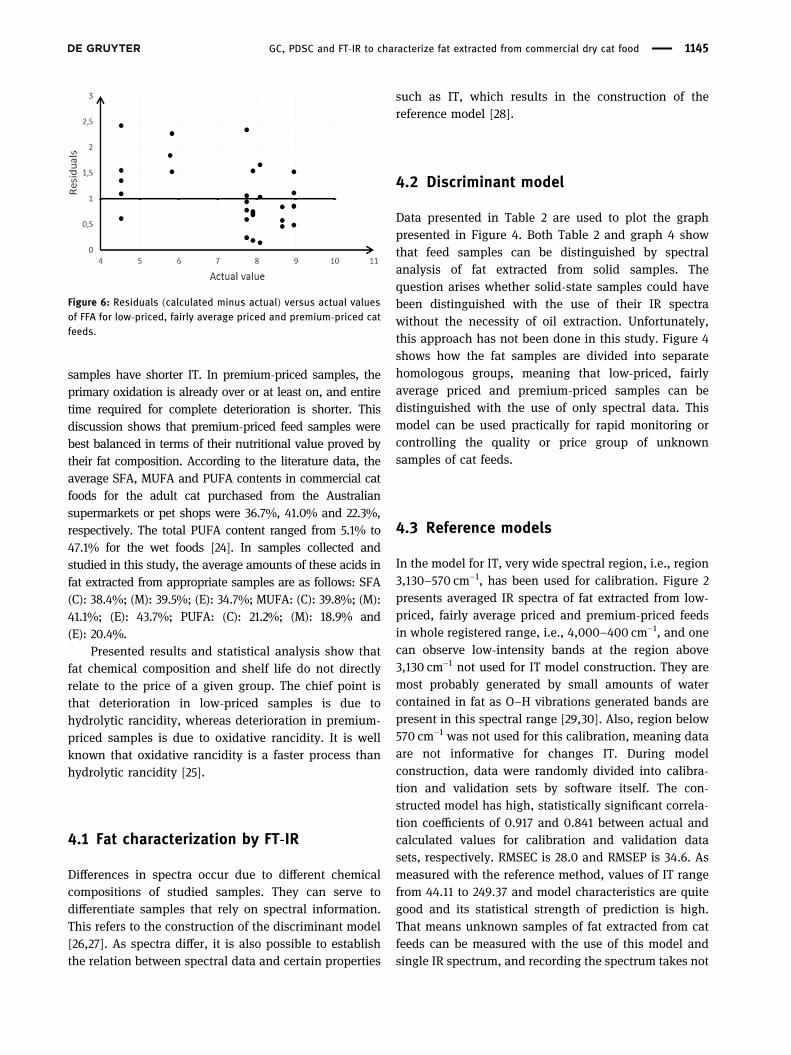
The FFA value is the parameter classically determinedby acid–base titration. Data concerning this value arepresented earlier. The trials to find a correlation between IRspectral data and FFA content were conducted to establishmodel for the rapid determination of FFA in the unknownfat sample extracted from cat feed, relying on the spectraldata exclusively. Once model is constructed to determinethe FFA content of an unknown sample, it is necessary tointroduce spectral data (spectrum) of an unknown sampleto TQ Analyst software and use “Quantify” function to letthe software calculate the amount of FFA in this sample.High correlation coefficients, i.e., 0.912 and 0.840 forcalibration and validation sets, respectively, were deter-mined in the model calculated. Small values of RMSEC =0.61 and RMSEP = 0.75 confirm statistical significance ofmodel as well. Figure 6 presents the distribution ofresiduals, i.e., differences between calculated and actualvalues (y axis) and actual values (x axis).
As the distribution is uniform, the correlation calcu-lated can be considered statistically valid and significant.Spectral regions used for FFA model construction were3,500–3,420 and 1,485–1,331 cm−1. Extension or narrowingof any of the two regions led to worse statistics of themodel. Other regions did not improve the model as well.That means the content of FFAs affects the spectral data offat in those two regions exclusively.
The aforementioned statistical relations correlatereference data and spectral data or spectral data alone(discriminant analysis). Results obtained show thepotential of correlation of data from different methods;hence, certain values, e.g., FFA content, are determinedwith the use of spectral data registered for an unknownsample. The use of the calculated discriminant modelTa
ble2:
Con
tinu
ed
Usa
geActua
lclas
sCa
lculated
clas
sDistanc
eto
actual
Nex
tclas
sNex
tdistan
ceDistanc
eto
low-priced
Distanc
eto
fairly
averag
epriced
Validation
Prem
ium
priced
Prem
ium
priced
1.1705
Fairly
averag
epriced
1.26
191.79
81
1.26
19Calibration
Prem
ium
priced
Prem
ium
priced
1.16
07
Fairly
averag
epriced
1.688
1.837
11.688
Calibration
Prem
ium
priced
Prem
ium
priced
1.35
87
Fairly
averag
epriced
2.030
92.42
03
2.030
9Calibration
Prem
ium
priced
Prem
ium
priced
1.1299
Fairly
averag
epriced
1.25
281.5543
1.25
28
GC, PDSC and FT-IR to characterize fat extracted from commercial dry cat food 1143
and IR spectrum of any unknown sample allows us toconduct “yes” or “not” analysis with respect to fatextracted from cat feeds to assign an unknown sample toa proper group of feeds with different prices. It ispossible as different price samples have unique chemicalcomposition. Indirect information on this composition iscontained in the calculated model.
4 Discussion
The highest values of IT clearly show that the low-price petfeed can be stored longest without significant deterioration.
This is confirmed by data presented in Figure 1, whichshows that saturated acid content is highest for low-pricedsamples. Chemically, SFAs undergo oxidation/deteriorationmuch slower than unsaturated, and thus, IT is of thehighest value [21]. Determined PV values seem to be incontrast to this statement, as higher values of PV,determined for low-priced samples, denote a worse qualityof these samples and hence suggest a shorter time for thesample to deteriorate. However, PV is characteristic for theprimary oxidation process and only refers to the formationof oxides and peroxides [22,23]. The secondary stage ofoxidation that leads to final deterioration, i.e., formation ofaldehydes, ketones and short chain fatty acids, has notoccurred in low-priced samples yet. Hence, premium-priced
Figure 4: Graphical presentation of statistical Mahalanobis distances of low-priced (triangles), fairly average priced (circles) and premium-priced (rectangles) cat feed samples from the group of fairly average, low-priced and premium-priced. Fairly average samples refer to theleft y-axis (distance to premium-priced is not presented) while premium-priced samples refer to right y-axis (distance to fairly average isnot given). For not presented distances, see Table 2.
y = 0.8331x + 20.96Rcalibra�on = 0.917Rpredic�on = 0.856
0
50
100
150
200
250
300
25 75 125 175 225
Calib
rate
d va
lues
Actual values
Figure 5: Graph presenting the relation between model calculated and actual values of IT of low-priced, fairly average priced and premium-priced cat feeds. Circles denote calibration and crosses denote validation.
1144 Klara Zglińska et al.
samples have shorter IT. In premium-priced samples, theprimary oxidation is already over or at least on, and entiretime required for complete deterioration is shorter. Thisdiscussion shows that premium-priced feed samples werebest balanced in terms of their nutritional value proved bytheir fat composition. According to the literature data, theaverage SFA, MUFA and PUFA contents in commercial catfoods for the adult cat purchased from the Australiansupermarkets or pet shops were 36.7%, 41.0% and 22.3%,respectively. The total PUFA content ranged from 5.1% to47.1% for the wet foods [24]. In samples collected andstudied in this study, the average amounts of these acids infat extracted from appropriate samples are as follows: SFA(C): 38.4%; (M): 39.5%; (E): 34.7%; MUFA: (C): 39.8%; (M):41.1%; (E): 43.7%; PUFA: (C): 21.2%; (M): 18.9% and(E): 20.4%.
Presented results and statistical analysis show thatfat chemical composition and shelf life do not directlyrelate to the price of a given group. The chief point isthat deterioration in low-priced samples is due tohydrolytic rancidity, whereas deterioration in premium-priced samples is due to oxidative rancidity. It is wellknown that oxidative rancidity is a faster process thanhydrolytic rancidity [25].
4.1 Fat characterization by FT-IR
Differences in spectra occur due to different chemicalcompositions of studied samples. They can serve todifferentiate samples that rely on spectral information.This refers to the construction of the discriminant model[26,27]. As spectra differ, it is also possible to establishthe relation between spectral data and certain properties
such as IT, which results in the construction of thereference model [28].
4.2 Discriminant model
Data presented in Table 2 are used to plot the graphpresented in Figure 4. Both Table 2 and graph 4 showthat feed samples can be distinguished by spectralanalysis of fat extracted from solid samples. Thequestion arises whether solid-state samples could havebeen distinguished with the use of their IR spectrawithout the necessity of oil extraction. Unfortunately,this approach has not been done in this study. Figure 4shows how the fat samples are divided into separatehomologous groups, meaning that low-priced, fairlyaverage priced and premium-priced samples can bedistinguished with the use of only spectral data. Thismodel can be used practically for rapid monitoring orcontrolling the quality or price group of unknownsamples of cat feeds.
4.3 Reference models
In the model for IT, very wide spectral region, i.e., region3,130–570 cm−1, has been used for calibration. Figure 2presents averaged IR spectra of fat extracted from low-priced, fairly average priced and premium-priced feedsin whole registered range, i.e., 4,000–400 cm−1, and onecan observe low-intensity bands at the region above3,130 cm−1 not used for IT model construction. They aremost probably generated by small amounts of watercontained in fat as O–H vibrations generated bands arepresent in this spectral range [29,30]. Also, region below570 cm−1 was not used for this calibration, meaning dataare not informative for changes IT. During modelconstruction, data were randomly divided into calibra-tion and validation sets by software itself. The con-structed model has high, statistically significant correla-tion coefficients of 0.917 and 0.841 between actual andcalculated values for calibration and validation datasets, respectively. RMSEC is 28.0 and RMSEP is 34.6. Asmeasured with the reference method, values of IT rangefrom 44.11 to 249.37 and model characteristics are quitegood and its statistical strength of prediction is high.That means unknown samples of fat extracted from catfeeds can be measured with the use of this model andsingle IR spectrum, and recording the spectrum takes not
Figure 6: Residuals (calculated minus actual) versus actual valuesof FFA for low-priced, fairly average priced and premium-priced catfeeds.
GC, PDSC and FT-IR to characterize fat extracted from commercial dry cat food 1145

more than a few minutes. The great advantage of currentresults is that the same spectrum of an unknown samplecan be simultaneously entered for both models to rapidlydetermine IT or FFA values.
The model for FFA content correlates spectral andreference data at a statistically significant level for bothcalibration and validation sets. There are small values ofRMSEC and RMSEP that prove the quality of the modeland its ability to determine or predict the content of FFAsin an unknown sample being fat extracted from pet food.In the case of FFA, data from two separate spectralregions produced the best model. Interestingly, the useof each region separately did not result in good statistics.This means that FFAs present themselves in bothspectral regions and bands generated by vibrations aremutually dependent.
5 Conclusions
The aim of this study is to verify spectral data—stabilitydependence for price-different cat feeds. This wascompleted by (1) constructing reference models corre-lating data from spectral and reference methods and (2)constructing the discriminant model with the use ofspectral data exclusively, to rapidly differentiate feeds.The aim is achieved, which is presented in Sections 3.3and 3.4. The following conclusions were drawn.1. Fat from low-priced product samples exhibits longer
IT, higher PV and greater content of FFA compared tofat from premium-priced samples. Premium-pricedfeeds can be stored for shorter period than low-pricedfeeds without a significant decrease in quality;however, premium-priced samples have better initialnutritional value.
2. The group of low-priced feeds differs from the fairlyaverage price group and premium-priced group signifi-cantly by means of chemical composition. This wasproved by the presence of distinct homologous groupsoccurring in the discriminant model constructed.
3. It is generally possible to differentiate the fairlyaverage priced feeds from premium-priced feeds bychemical composition; however, some fairly averagepriced and premium-priced feeds seem to be chemi-cally very similar as the statistical distances betweensamples in those two homologous groups indicated inthe discriminant model are small.
4. Constructed models prove the ability to correlateanalytical data from different methods, i.e., PDSC andIR. This evidences that results obtained by each
method separately are robust and reliable and can beused exclusively for the determination of desiredparameters, e.g., IT to evaluate product oxidativestability.
5. Models constructed might have practical application.They can be used for monitoring or controlling thequality of feeds; however, introduction to practicerequires further study, e.g., use of a much greaternumber of samples for calibration and validation.
6. Spectra of feed alone without fat extraction shouldhave been measured or reference materials should beincluded in the study to find out whether thecorrelation between spectral data of solid-statesamples and fat quality parameters exist.
Acknowledgments: The authors thank Maria Milczarek,Magdalena Rogoza and Aleksandra Prochocka, for theirvaluable input to this study.
Conflict of interest: The authors declare no conflict ofinterest.
References
[1] Pręgowski M, Włodarczyk J. editors. Researching the human-canine relationship in democratic Poland. Free market dogs:the human-canine bond in post-communist Poland. USA:Purdue University Press; 2016. p. 14–21.
[2] Thompson A. Ingredients: where pet food starts. TopCompanion Anim Med. 2008;23:127–32.
[3] Nutritional Guidelines For Complete and Complementary PetFood for Cats and Dogs; 2019.
[4] Plantinga EA, Bosch G, Hendriks WH. Estimation of the dietarynutrient profile of free-roaming feral cats: possible implica-tions for nutrition of domestic cats. Br J Nutr. 2011;106(Suppl1):S35–48. doi: 10.1017/S0007114511002285.
[5] Gurdeniz G, Ozen B. Detection of adulteration of extra-virginolive oil by chemometric analysis of mid-infrared spectraldata. Food Chem. 2009;116:519–25.
[6] Nunes C. Vibrational spectroscopy and chemometrics to assessauthenticity, adulteration and intrinsic quality parameters of edibleoils and fats. Food Res Int. 2014;60:255–61.
[7] Sherazi STH, Kandhro A, Mahesar SA, Bhanger MI, Talpur MY,Arain S. Application of transmission FT-IR spectroscopy for thetrans fat determination in the industrially processed edibleoils. Food Chemistry 2009;114:323–7.
[8] Porep J, Kammerer D, Carle R. On-line application ofnear infrared (NIR) spectroscopy in food|chemometrics|absorption spectroscopy. Trends Food Sci Tech.2015;46:211–30.
[9] Nicolaï BM, Defraeye T, De Ketelaere B, Herremans E,Hertog MLATM, Saeys W, et al. Nondestructive measurement
1146 Klara Zglińska et al.
of fruit and vegetable quality. Annu Rev Food Sci Technol.2014;5:285–312. doi: 10.1146/annurev-food-030713-092410.
[10] Santos PM, Pereira-Filho ER, Rodriguez-Saona LE. Rapiddetection and quantification of milk adulteration usinginfrared microspectroscopy and chemometrics analysis. FoodChem. 2013;138:19–24. doi: 10.1016/j.foodchem.2012.10.024.
[11] Huang H, Yu H, Xu H, Ying Y. Near infrared spectroscopy for on/in-line monitoring of quality in foods and beverages: a review. J FoodEng. 2008;87:303–13. doi: 10.1016/j.jfoodeng.2007.12.022.
[12] Belayneh HD, Wehling RL, Cahoon EB, Ciftci ON. Effect ofextraction method on the oxidative stability of Camelina seedoil studied by differential scanning calorimetry. J Food Sci.2017;82:632–7. doi: 10.1111/1750-3841.13652.
[13] Kerrihard AL, Pegg RB, Sarkar A, Craft BD. Update on themethods for monitoring UFA oxidation in food products. Eur JLipid Sci Technol. 2015;117:1–14. doi: 10.1002/ejlt.201400119.
[14] Martínez B, Miranda JM, Franco CM, Cepeda A, Rodríguez JL.Development of a simple method for the quantitativedetermination of fatty acids in milk with special emphasis onlong-chain fatty acids. CyTA J Food. 2012;10:27–35.doi: 10.1080/19476337.2010.538860.
[15] O’Keefe S, Pike O. Fat characterization. In: Nielsen S, editor.Food analysis. 5th ed. Switzerland: Springer InternationalPublishing; 2017.
[16] Ennouri M, Fetoui H, Hammami M, Bourret E, Attia H, Zeghal N.Effects of diet supplementation with cactus pear seeds and oilon serum and liver lipid parameters in rats. Food Chem.2007;101:248–53.
[17] Coelho DF, Pereira-Lancha LO, Chaves DS, Diwan D, Ferraz R,Campos-Ferraz PL, et al. Effect of high-fat diets on bodycomposition, lipid metabolism and insulin sensitivity, and therole of exercise on these parameters. Braz J Med Biol Res.2011;44:966–72. doi: 10.1590/s0100-879x2011007500107.
[18] Varsányi G, Kovner MA, Láng L. Assignments for vibrational spectraof 700 benzene derivatives. Budapest: Akademiai Kiadó; 1973.
[19] Koczoń P, Piekut J, Borawska M, Świsłocka R, Lewandowski W.Vibrational and microbiological study on alkaline metalpicolinates and o-iodobenzoates. Anal Bioanal Chem.2006;384:302–8. doi: 10.1007/s00216-005-0158-7.
[20] Abu El-Rub Z, Kujawa J, Albarahmieh E, Al-Rifai N, Qaimari F,Al-Gharabli S. High throughput screening and characterizationmethods of Jordanian oil shale as a case study. Energies.2019;12:3148. doi: 10.3390/en12163148.
[21] Qi B, Zhang Q, Sui X, Wang Z, Li Y, Jiang L. Differential scanningcalorimetry study—assessing the influence of composition ofvegetable oils on oxidation. Food Chem. 2016;194:601–7.doi: 10.1016/j.foodchem.2015.07.148.
[22] Guillén MD, Cabo N. Fourier transform infrared spectra dataversus peroxide and anisidine values to determine oxidativestability of edible oils. Food Chem. 2002;77:503–10.doi: 10.1016/S0308-8146(01)00371-5.
[23] Shahidi F, Zhong Y. Lipid oxidation: measurement methods.Bailey’s Ind Oil Fat Prod Am Cancer Soc. 2005;1:491–512.doi: 10.1002/047167849X.bio050.
[24] Gosper EC, Raubenheimer D, Machovsky-Capuska GE,Chaves AV. Discrepancy between the composition of somecommercial cat foods and their package labelling andsuitability for meeting nutritional requirements. Australian VetJ. 2016;94:12–7. doi: 10.1111/avj.12397.
[25] Cichosz G, Czeczot H. Oxidative stability of edible fats– conse-quences to human health. Bromat Chem Toksykol.2011;XLIV:50–60.
[26] Özdemir D, Öztürk B. Near infrared spectroscopic determina-tion of olive oil adulteration with sunflower and corn oil. J FoodDrug Anal. 2007;15(1).
[27] Anjos O, Campos MG, Ruiz PC, Antunes P. Application of FTIR-ATR spectroscopy to the quantification of sugar in honey. FoodChem. 2015;169:218–23. doi: 10.1016/j.foodchem.2014.07.138.
[28] Alomar D. Chemical and discriminant analysis of bovine meatby near infrared reflectance spectroscopy (NIRS). Meat Sci.2003;63:441–50.
[29] Hop E, Luinge H-J, Hemert HV. Quantitative analysis of water inmilk by FT-IR spectrometry. Appl Spectrosc. 1993;47:1180–2.
[30] Iñón FA, Garrigues S, de la Guardia M. Nutritional parametersof commercially available milk samples by FTIR and chemo-metric techniques. Anal Chim Acta. 2004;2:401–12.doi: 10.1016/j.aca.2004.03.014.
GC, PDSC and FT-IR to characterize fat extracted from commercial dry cat food 1147