The Case of OpenStreetMap - MDPI
20
ISPRS Int. J. Geo-Inf. 2012, 1, 146-165; doi:10.3390/ijgi1020146 ISPRS International Journal of Geo-Information ISSN 2220-9964 www.mdpi.com/journal/ijgi/ Article Analyzing the Contributor Activity of a Volunteered Geographic Information Project — The Case of OpenStreetMap Pascal Neis * and Alexander Zipf Geoinformatics Research Group, Department of Geography, University of Heidelberg, Berliner Street 48, D-69120 Heidelberg, Germany; E-Mail: [email protected] * Author to whom correspondence should be addressed; E-Mail: [email protected]; Tel.: +49-6221-545-504; Fax: +49-6221-544-529. Received: 13 June 2012; in revised form: 17 July 2012 / Accepted: 17 July 2012 / Published: 27 July 2012 Abstract: The OpenStreetMap (OSM) project, founded in 2004, has gathered an exceptional amount of interest in recent years and counts as one of the most impressive sources of Volunteered Geographic Information (VGI) on the Internet. In total, more than half a million members had registered for the project by the end of 2011. However, while this number of contributors seems impressive, questions remain about the individual contributions that have been made by the project members. This research article contains several studies regarding the contributions by the community of the project. The results show that only 38% (192,000) of the registered members carried out at least one edit in the OSM database and that only 5% (24,000) of all members actively contributed to the project in a more productive way. The majority of the members are located in Europe (72%) and each member has an activity area whose size may range from one soccer field up to more than 50 km 2 . In addition to several more analyses conducted for this article, predictions will be made about how this newly acquired knowledge can be used for future research. Keywords: volunteered geographic information (VGI); OpenStreetMap; contributions; community; activity OPEN ACCESS
-
Upload
khangminh22 -
Category
Documents
-
view
4 -
download
0
Transcript of The Case of OpenStreetMap - MDPI
ISPRS Int. J. Geo-Inf. 2012, 1, 146-165; doi:10.3390/ijgi1020146
ISPRS International
Journal of
Geo-Information ISSN 2220-9964
www.mdpi.com/journal/ijgi/
Article
Analyzing the Contributor Activity of a Volunteered
Geographic Information Project — The Case of OpenStreetMap
Pascal Neis * and Alexander Zipf
Geoinformatics Research Group, Department of Geography, University of Heidelberg,
Berliner Street 48, D-69120 Heidelberg, Germany; E-Mail: [email protected]
* Author to whom correspondence should be addressed; E-Mail: [email protected];
Tel.: +49-6221-545-504; Fax: +49-6221-544-529.
Received: 13 June 2012; in revised form: 17 July 2012 / Accepted: 17 July 2012 /
Published: 27 July 2012
Abstract: The OpenStreetMap (OSM) project, founded in 2004, has gathered an
exceptional amount of interest in recent years and counts as one of the most impressive
sources of Volunteered Geographic Information (VGI) on the Internet. In total, more than
half a million members had registered for the project by the end of 2011. However, while
this number of contributors seems impressive, questions remain about the individual
contributions that have been made by the project members. This research article contains
several studies regarding the contributions by the community of the project. The results
show that only 38% (192,000) of the registered members carried out at least one edit in the
OSM database and that only 5% (24,000) of all members actively contributed to the project
in a more productive way. The majority of the members are located in Europe (72%) and
each member has an activity area whose size may range from one soccer field up to more
than 50 km2. In addition to several more analyses conducted for this article, predictions
will be made about how this newly acquired knowledge can be used for future research.
Keywords: volunteered geographic information (VGI); OpenStreetMap; contributions;
community; activity
OPEN ACCESS

ISPRS Int. J. Geo-Inf. 2012, 1
147
1. Introduction
The World Wide Web (WWW) has evolved significantly from its early stages in the 1990s,
sometimes referred to as Web 1.0, to a sophisticated source of information. At the beginning of
the 21st century, the term “Web 2.0” was first introduced [1]. However, the term experienced its real
attention after a publication by O’Reilly in 2005, entitled “What Is Web 2.0?” [2].
The change in terminology is based on a shift in the usage of the Web, which is no longer
characterized by the consumption of predefined content. In fact the term Web 2.0 relates to a “new”
platform where users can customize their own applications on the WWW to meet their own design,
ideas, and functionality and, most importantly, can create their own data or edit existing data.
The online encyclopedia “Wikipedia,” established in 2001, is based precisely on this phenomenon.
The newly created information is referred to as “user-generated content” or “user-created content” [3].
The voluntary users, who are spread all over the world, share their knowledge on various topics on one
particular online platform. Other websites that are based on a similar approach allow users to share
their videos (YouTube) and photos (Flickr, Panoramio) with others.
Similar efforts are the foundation of geodata platforms such as OpenStreetMap (OSM), Tagzania,
Wayfaring.com, the People’s Map, and Platial or The People’s Atlas, where volunteers, amateurs, or
professionals gather information and upload it to a central database available on the Internet [4].
However, unlike other platforms that rely on user contributions such as Wikipedia and Flickr the
collected information is not about a particular topic or image; instead, it contains more specific details
about elements such as streets, points of interest, or buildings, which always include a geographic
reference. The literature describes this particular type of data as Volunteered Geographic
Information (VGI) [5], while others describe the process as “crowdsourcing geospatial data” [6].
The OSM project has developed into one of the largest sources of VGI in recent years. Hundreds of
thousands of members are contributing to the project worldwide. Different applications based on
spatial data provided by the OSM project have been developed. Besides the creation of different maps
for hikers [7], skiers [8] and public transportation networks [9] the information also shows potential for
more advanced applications such as location-based services (LBS) [10] or a Web 3D Service [11].
Also, the implementation of OSM data for indoor areas has been discussed [12].
With the change of the licensing model by Google Maps in early 2012 [13] and the potential costs
that can arise, more and more businesses are moving to the free option offered by the OSM project.
The location-based social network FourSquare [14] and the Nestoria Property Search [15] are two
major examples that have changed their services to the OSM platform. Also professional spatial data
providers and companies have seen the potential in user-generated information and have created their
own platforms in the past few years such as Google Map Maker [16], TomTom Map Share [17] and
Nokia Map Creator [18], which allow customers and users to edit their own data to the provided maps.
However, the collected information on these platforms, including the changes provided by volunteers,
is the property of the platform operator and will not be freely available to other users.
These developments show that over the past few years the success of the VGI approach to data
collaboration and sharing is undeniable. However, questions remain about the motivation of the
members to participate in projects such as OSM. According to different research results, there are a
variety of factors that can play a major role [19,20]. Possible factors might be the unique ethos or that

ISPRS Int. J. Geo-Inf. 2012, 1
148
geospatial information should be freely available to everyone. For others, learning new technologies,
self-expression, relaxation and recreation or just pure fun can play a major role. However, these
particular motivational factors are certainly not unique to VGI-related projects, but also to other online
communities and platforms such as Wikipedia.
One major caveat of VGI platforms that has been identified is the very small percentage of members,
e.g., in Wikipedia that actively contribute to the project [21]. During the writing process of this article,
Wikipedia had a worldwide community of more than 16 million registered members, of which a total of
1.5 million members had at least made one change to an article [22]. Less than 85,000 members had
made more than five changes, which represents less than 1% of the registered members. These results
correspond closely to what has been termed Participation Inequality and a general 90-9-1 rule that can
be applied to community-based projects [23]. The numbers represent the 90% of an online community
who consume the provided information but do not contribute to the project, the 9% who contribute
occasionally, and the only 1% who create or edit most of the content and can be considered active
members. Similar results were found in a previous study about Wikipedia, indicating that only a small
percentage of the members actively contributed to the project [24].
The research conducted provides information pertaining to whether the above-mentioned
participation inequality theory holds true for the members of the OSM project. A first analysis
focusing on participants’ characteristics and motivations in OSM in April 2009 had shown that
of 120,000 registered users only 33,440 contributors made at least one edit to the database [19].
Similar to previous work, the members are split into several groups based on their contributions to the
project to provide a better overview [21]. Owing to the different methods that were applied during the
research process, it is possible to provide statements about the origin of a member and her/his main
area of activity.
The remainder of the paper is structured as follows: The next section gives an introduction to the
VGI OpenStreetMap project. The third section of the paper compares registered vs. active contributors
of the OSM project, while sections four through six focus on the determination of the location, the
activity area, and the active time frame of a member. The last section summarizes the results of this
paper and presents some future research suggestions.
It needs to be noted that almost all analyses in this article are based on the full history dump file of the
OSM project dated 8 December 2011. In the compressed format the file has a size of 30 GB while the
uncompressed file size increases to 500 GB. All programs that were applied to perform the conducted
analyses were developed in Java with the implementation of a variety of open source libraries.
2. The OpenStreetMap Project
The OSM project, founded in 2004 at the University College London, has the goal to create a free
database with geographic information of the entire world, and detailed introductions to the project have
been published [25–27]. A plethora of spatial data such as roads, buildings, land use areas, or points of
interest is entered into the project’s database. Similar to other community-based projects on the
Internet, any user can start contributing to the project and editing data after a short online registration.
This simple approach allowed the project to gather more than 640,000 registered members by June
2012 [28].
ISPRS Int. J. Geo-Inf. 2012, 1
149
The contribution of new data to the project can be accomplished in different ways. The most
classical, yet still most common, approach is to record data using a GPS receiver and edit the collected
information using one of the various freely available editors. The user provides additional information
about the collected data by adding attributes and stores the final results in the OSM database. Several
companies such as Yahoo (up to 2011) and Microsoft Bing support the project [29,30] by providing
various aerial images to the community, which allows the OSM members to digitize data such as
streets from the images. However, this process has its advantages and disadvantages. While this
method is a very simple way to add new data, the disadvantage is that aerial imagery is oftentimes
outdated or not properly geo-referenced. More importantly, it is not possible to get any metadata
information such as the road or street names from an aerial image. Another common practice in recent
years has been the import of other freely available data into OSM. For instance, the complete
TIGER/Line dataset of the United States and donated data from Automotive Navigation Data (AND)
for the Netherlands were imported into the OSM database.
For this article, it is important to note what type of data provided by the OSM project has been used
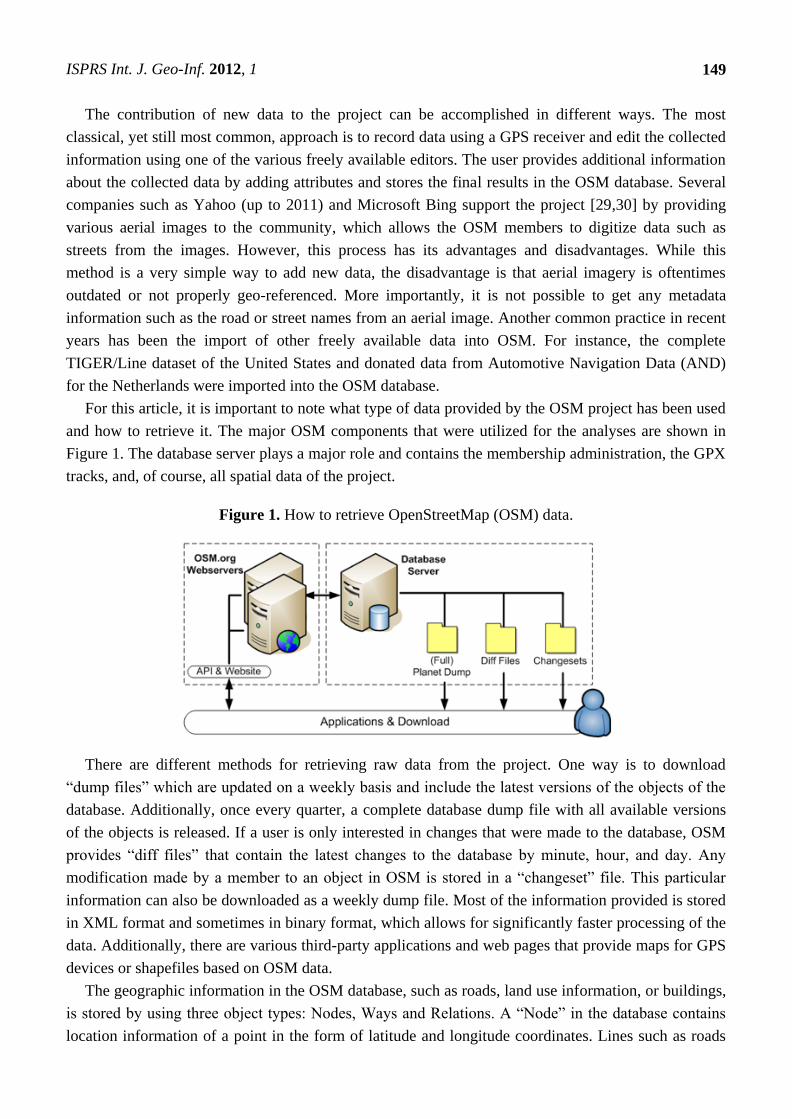
and how to retrieve it. The major OSM components that were utilized for the analyses are shown in
Figure 1. The database server plays a major role and contains the membership administration, the GPX
tracks, and, of course, all spatial data of the project.
Figure 1. How to retrieve OpenStreetMap (OSM) data.
There are different methods for retrieving raw data from the project. One way is to download
“dump files” which are updated on a weekly basis and include the latest versions of the objects of the
database. Additionally, once every quarter, a complete database dump file with all available versions
of the objects is released. If a user is only interested in changes that were made to the database, OSM
provides “diff files” that contain the latest changes to the database by minute, hour, and day. Any
modification made by a member to an object in OSM is stored in a “changeset” file. This particular
information can also be downloaded as a weekly dump file. Most of the information provided is stored
in XML format and sometimes in binary format, which allows for significantly faster processing of the
data. Additionally, there are various third-party applications and web pages that provide maps for GPS
devices or shapefiles based on OSM data.
The geographic information in the OSM database, such as roads, land use information, or buildings,
is stored by using three object types: Nodes, Ways and Relations. A “Node” in the database contains
location information of a point in the form of latitude and longitude coordinates. Lines such as roads

ISPRS Int. J. Geo-Inf. 2012, 1
150
and polygons are stored as “Ways,” and “Relations” define logical or geographic relationships between
the objects. Each object contains additional information such as a version number, an ID, the name of
the editor, the date when it was created or last modified, and, of course, further attributes, so-called
Tag/Value pairs.
Anonymous changes to the database are no longer supported; however, any Internet user who
registers for the project can add information to the map and change existing data. This open approach
to collaborative data collection creates questions about the quality of the spatial data. Studies regarding
this topic have been conducted and published in recent years [31,32]. The OSM data collection shows
an overall very heterogeneous quality, i.e., the quality and completeness of the database varies highly
from country to country. For urban areas in Europe, especially in the United Kingdom, Germany,
Austria, and Switzerland, the OSM data proves to have a similar completeness to commercial or
governmental data providers. However, rural areas show a lower data concentration in the OSM
database with the exception of the USA, where an opposite pattern, i.e., better coverage in rural areas
and less completeness in urban areas, could be determined [33–36].
3. Registered Members vs. Active Contributors
It is often stated that the OSM project has hundreds of thousands of members who help to collect or
improve the data of the project. As outlined in the introduction to this article, this pattern seems to
contradict that of most other online portals that are based on user contributions. The direct extraction
of information about the members of the OSM project, such as a list of all members, or registration
information, is not possible. Thus, a different approach needs to be considered to be able to analyze
OSM contributors’ actions.
Based on the full history dump file [37] of 8 December 2011, and the changeset dump file [37] of
7 December 2011, it was possible to create a list of all members who made changes to the database.
The registration date of each member can be retrieved from the corresponding user’s website. The
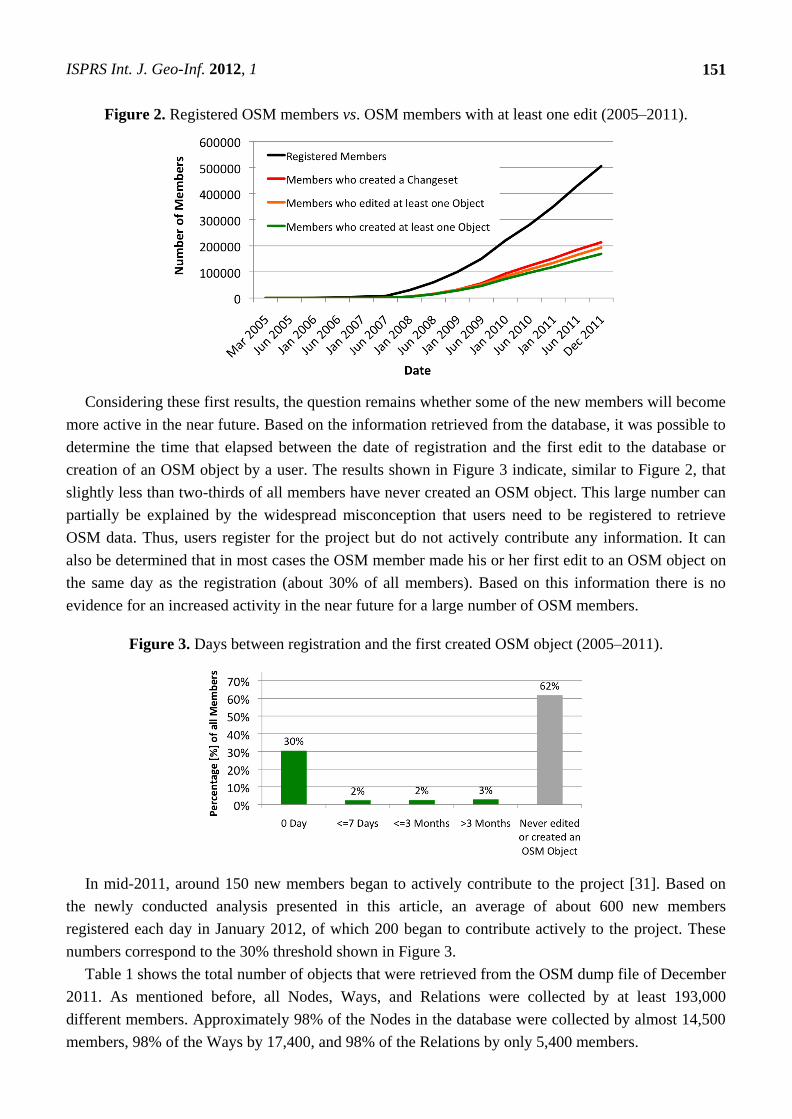
collected information for the OSM dataset is shown in Figure 2. The increase of registered members
since the beginning of the project is represented by the black line, while the red line represents the
number of the members who have at least created a changeset, and the orange line represents the
number of members who have edited at least one object (Node, Way or Relation). Finally, the green
line represents the number of members who have created at least one object in the database.
The results in Figure 2 show that in December 2011 the OSM project had approximately 505,000
registered members. However, comparing the number of registered members with any of the other
retrieved information reveals a strong difference in growth over the past few years. At the end of 2011
almost 43% (213,000) of the members created a changeset but only 38% (193,000) of all members
edited (created, modified or deleted) at least one object type (Node, Way or Relation) and only 33%
(169,000) of all members created an object in the database. It must be noted that, in the past, if a
member logged into the OSM online editor, a changeset was created independent from the fact of
actual changes to the database being made or not. This particular error causes the small difference
between the number of members who created a changeset or edited at least one object. Lastly, 62%
(312,000) of the members of the project did not actively contribute any information.
ISPRS Int. J. Geo-Inf. 2012, 1
151
Figure 2. Registered OSM members vs. OSM members with at least one edit (2005–2011).
Considering these first results, the question remains whether some of the new members will become
more active in the near future. Based on the information retrieved from the database, it was possible to
determine the time that elapsed between the date of registration and the first edit to the database or
creation of an OSM object by a user. The results shown in Figure 3 indicate, similar to Figure 2, that
slightly less than two-thirds of all members have never created an OSM object. This large number can
partially be explained by the widespread misconception that users need to be registered to retrieve
OSM data. Thus, users register for the project but do not actively contribute any information. It can
also be determined that in most cases the OSM member made his or her first edit to an OSM object on
the same day as the registration (about 30% of all members). Based on this information there is no
evidence for an increased activity in the near future for a large number of OSM members.
Figure 3. Days between registration and the first created OSM object (2005–2011).
In mid-2011, around 150 new members began to actively contribute to the project [31]. Based on
the newly conducted analysis presented in this article, an average of about 600 new members
registered each day in January 2012, of which 200 began to contribute actively to the project. These
numbers correspond to the 30% threshold shown in Figure 3.
Table 1 shows the total number of objects that were retrieved from the OSM dump file of December
2011. As mentioned before, all Nodes, Ways, and Relations were collected by at least 193,000
different members. Approximately 98% of the Nodes in the database were collected by almost 14,500
members, 98% of the Ways by 17,400, and 98% of the Relations by only 5,400 members.
ISPRS Int. J. Geo-Inf. 2012, 1
152
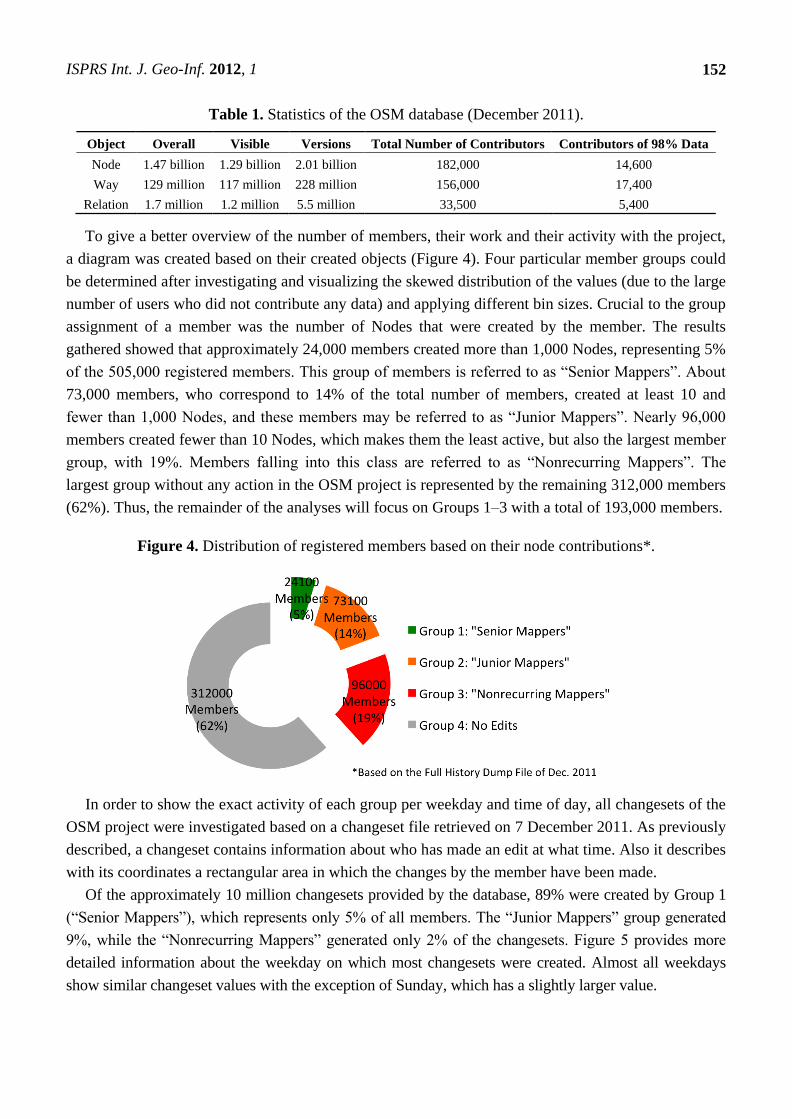
Table 1. Statistics of the OSM database (December 2011).
Object Overall Visible Versions Total Number of Contributors Contributors of 98% Data
Node 1.47 billion 1.29 billion 2.01 billion 182,000 14,600
Way 129 million 117 million 228 million 156,000 17,400
Relation 1.7 million 1.2 million 5.5 million 33,500 5,400
To give a better overview of the number of members, their work and their activity with the project,
a diagram was created based on their created objects (Figure 4). Four particular member groups could
be determined after investigating and visualizing the skewed distribution of the values (due to the large
number of users who did not contribute any data) and applying different bin sizes. Crucial to the group
assignment of a member was the number of Nodes that were created by the member. The results
gathered showed that approximately 24,000 members created more than 1,000 Nodes, representing 5%
of the 505,000 registered members. This group of members is referred to as “Senior Mappers”. About
73,000 members, who correspond to 14% of the total number of members, created at least 10 and
fewer than 1,000 Nodes, and these members may be referred to as “Junior Mappers”. Nearly 96,000
members created fewer than 10 Nodes, which makes them the least active, but also the largest member
group, with 19%. Members falling into this class are referred to as “Nonrecurring Mappers”. The
largest group without any action in the OSM project is represented by the remaining 312,000 members
(62%). Thus, the remainder of the analyses will focus on Groups 1–3 with a total of 193,000 members.
Figure 4. Distribution of registered members based on their node contributions*.
In order to show the exact activity of each group per weekday and time of day, all changesets of the
OSM project were investigated based on a changeset file retrieved on 7 December 2011. As previously
described, a changeset contains information about who has made an edit at what time. Also it describes
with its coordinates a rectangular area in which the changes by the member have been made.
Of the approximately 10 million changesets provided by the database, 89% were created by Group 1
(“Senior Mappers”), which represents only 5% of all members. The “Junior Mappers” group generated
9%, while the “Nonrecurring Mappers” generated only 2% of the changesets. Figure 5 provides more
detailed information about the weekday on which most changesets were created. Almost all weekdays
show similar changeset values with the exception of Sunday, which has a slightly larger value.

ISPRS Int. J. Geo-Inf. 2012, 1
153
Figure 5. Changesets per weekday*.
In addition to the distribution of changesets per weekday, more detailed information could be
gathered by analyzing the changesets by the time of day. Therefore, the timestamps, provided by OSM
in Coordinated Universal Time (UTC), of all changesets were evaluated. The results, shown in
Figure 6, highlight that the majority of changesets were created during the afternoon and evening
hours. Ideally, the changeset information would be evenly distributed throughout the daylight hours
based on the worldwide community character of the project. However, currently this is not the case,
and the results support the aforementioned focus of the project in the European time zones.
Figure 6. Changesets per hour*.
Further information can be gathered by analyzing the number of members per year, month, week,
and day who make changes to the database. At the beginning of 2008, about 10% of the 30,000
registered members of the OSM project added new data every month [38]. A year later, this value
decreased to almost 8%, although the total number of project members increased to 200,000 members.
In 2010, only about 4% of the members collected new data per month [39]. This negative trend
continued in 2011, when the number dropped to about 3%.
Figure 7(a–d) shows the corresponding figures for the years 2005 to late 2011. In 2011, almost
87,000 different users made at least one change to the database, corresponding to approximately 17%
of the total number of members. The monthly analysis showed that at the end of 2011, between 16,000

ISPRS Int. J. Geo-Inf. 2012, 1
154
and 18,000 active members (representing approximately 3% of all members) contributed to the project.
The weekly number of members with at least one contribution fluctuated between 6,000 and 7,000,
representing only 1% of the total community. The daily member numbers were between 1,800 and
2,200, representing a percentage of active members far below 1%.
Figure 7. Number of active contributors per (a) year, (b) month, (c) week and (d) day.
(a) (b)
(c) (d)
An analysis that we conducted in January 2012 based on OSM “Diff” files showed that, in total, all
members generated about 1.2 million Nodes, 130,000 Ways, and 1,500 Relations per day, with
about 2,100 active members for each day of the month. This means that each member created on
average about 570 Nodes, 60 Ways, and 0.7 Relations.
4. Member Location
In addition to the information gathered that was based on the contributions of OSM members,
further tests were conducted with a focus on member locations and activity areas. The OSM database
does not provide specific information about the member’s country of residency. However, if this
information could be retrieved in a different manner, it could give data about how many active and
inactive members each country hosts. The quality of the dataset relates closely to the number of
members in an area or country that add or improve the data [40]. Four different approaches to retrieve
member location information from the OSM database were applied:
1. The first Node that was created by the member determines the country/location of the member.
2. The mass center of all bounding boxes provided by the changesets of each member is
determined to retrieve the country/location of a member.

ISPRS Int. J. Geo-Inf. 2012, 1
155
3. All Nodes that were created by a member are taken into consideration and the country that
shows the majority of the Nodes indicates the country/location of a member.
4. The center of the activity area polygon of a member provides the country/location information
of the member.
The first approach is based on the assumption that the first Node that a member creates is located in
close proximity to his or her residence or mapping base. Usually, new members create their first new
objects in areas that they are very familiar with and where local knowledge is very detailed.
The second method relies on the previously introduced changeset information. For each OSM
member analyzed there were a certain number of changeset files available. Overlaying and blending
these files allows the visualization of a particular area, which is covered in most of the overlaying files.
Subsequently, the center point of this area can be calculated for the identification of the location or
country of the OSM member.
The third approach identifies the location of an OSM member by analyzing the created Nodes. The
country in which the member created most of its Nodes was used as the origin of the member.
The fourth and last method is the most comprehensive and most accurate approach to determining
an activity area polygon of the member. The polygon represents an area in which the member focuses
his or her activities when collecting information for the OSM project. To create the polygon for each
member, all created Nodes of a member were meshed using a Delaunay triangulation [41] and a
flipping algorithm [42]. This creates a triangle mesh from all Nodes. Subsequently, all triangle edges
and their points were removed from the network where the edge lengths were longer than 1km.
Figure 8 shows the processing steps for determining the polygons.
Figure 8. Member activity area creation: (a) nodes of contributor, (b) triangulation,
(c) edge-distance-filtering (final activity areas result).
(a) (b) (c)
It is important to note that for this particular method to determine the activity area polygon of a
member, only Nodes that a member created were included, no edited Nodes or deleted Nodes were
considered. Initial calculations that included all Nodes showed some irregularities, which were based
on a software error in the OSM editors in the past (before 2011). This error increased the version
number of a Node although the object was not changed in any way by any user directly, but because
the Node would fall into the range of a certain changeset. Thus, the database would count a change to a
Node, although the member did not actually edit the data. It is important to consider these errors when

ISPRS Int. J. Geo-Inf. 2012, 1
156
conducting similar studies to [32,40,43,44], in which the versions of an OSM object should be based
on real changes and not primarily on the number of editors and the absolute version number.
The results of the different methods that were applied showed that, based on the first approach by
analyzing the first created Node of each member, a total of 167,000 members could be assigned to a
particular country. Determining the center of all overlapping changeset areas allowed about 192,000
members to be assigned to a country. The analysis of all created Nodes by a member and the countries
in which they were located helped to determine a country for almost 167,000 members. The difference
between the number of members for which a country of origin could be determined when applying the
two methods is either caused by Nodes that cannot be assigned to a particular country (e.g., Nodes in
international waters), or the fact that the member did not create any Nodes at all. The most
computationally intense, but also most accurate method was able to generate an activity polygon in
several countries for 123,000 members. In this case, the difference between the member numbers can
be caused by insufficient amounts of Nodes to create a polygon.
Figure 9 shows the distribution of OSM members by country based on the results gathered from the
different methods (country borders taken from the OSM project [45]). If an activity area polygon could
be determined, the location of the member was chosen based on the center of the polygon. If this
method did not provide the information needed, the country in which the member created the most
Nodes was chosen. If this approach did not provide enough information, either the midpoint of the
overlapping changesets or the member’s first created Node determined the country of origin. In total
192,000 members could be associated with a country in which they showed their major OSM
contributions.
Figure 9. Contributors per country*.
The result of the distribution analysis of OSM members highlights the concentration of the project
in European countries at the end 2011. About 26% of the total members who have contributed to the
project are working on the German dataset. In 2009, almost 50% of all changes in the database were
made within Germany [46]. Nearly 30% of all active OSM members collected information in Germany
in mid-2011 [31]. This value decreased to 26% in January 2012 [47].
Taking the aforementioned groups of contributors into consideration (Figure 4) the results showed
that, with variations between 1 and 3%, all groups were represented in similar ways in each country, as

ISPRS Int. J. Geo-Inf. 2012, 1
157
shown in Figure 9. The comparison of the daily active member values for each country from the
middle of November 2011 to the middle of December 2011 showed not significantly large differences
of up to 3%.
Figure 10(a) shows the distribution of the 192,000 members by continents. Almost three-quarters of
the total members of the project are from Europe. Prior research using a different approach to
determine user origin has shown similar results [19].
Figure 10. (a) Contributors per continent* and (b) ratio of members to population per
continent*.
(a) (b)
Figure 10(b) illustrates the ratio of OSM members to the population of the continent based on
values provided by [48]. For these particular results, Australia surprisingly shows a similar magnitude
as Europe. Considering the relationship between the number of members and the total area of the
continent, Australia shows a very low value. However, these values could be based on varying
population density factors. Overall, Europe shows the closest relation between number of members per
100,000 inhabitants and number of members per 1,000 km2.
Figure 11. Number of countries per OSM contributor group*.
In addition to the studies that focus on the different countries of origin of the OSM members, a further
analysis was conducted to evaluate the number of countries in which the different members created at
least one Node. Figure 11 shows the distribution of the different contributor groups by the number of
countries in which they have been collecting information. The results show that more than half of the

ISPRS Int. J. Geo-Inf. 2012, 1
158
members of the “Senior Mapper” group (Group 1) have contributed information about more than one
country to the OSM project. These additional contributions may be based on several reasons, such as
moving to another country, vacation, a business trip, or digitizing data from aerial photographs of foreign
countries. Overall, approximately 86% of the members of Group 1 were active in up to four different
countries, roughly 11% in five to ten countries and slightly less than 3% in more than ten different
countries. In Group 2 (“Junior Mappers”), almost 86% contributed in one and 11% in two countries.
Nearly 98% of the members of Group 3 (“Nonrecurring Mappers”) were only active in one country.
5. Activity Area of a Member
To determine the country of origin of a member, a method was applied that determines a polygon
representing the activity area of a member. It is based on the aforementioned triangulation of the
Nodes. In this particular case a maximum value of one million Nodes of all created Nodes of a member
were included in the analysis. Nodes that represented a boundary in the database, such as state or city
limits, were excluded in a prior step. During the triangulation process, a minimum edge length between
10 and 500 m was adapted based on the number of Nodes created by the member. Thus the number of
generated triangles was reduced to limit the consumption of resources during the calculation process.
Also, the activity polygon of active OSM members is large and therefore does not require a triangle
edge length of less than 500 m.
Nearly 760 million Nodes were included in the calculation process of the polygons for all OSM
members. The smaller value compared to the total number of 1.47 billion existing Nodes from the full
history file is caused by the filter that was applied to exclude boundaries and thereby limiting the
number of Nodes per member to one million. The applied database of December 2011 provided
180 members who created or imported more than one million Nodes each.
During the triangulation process, approximately 370 million triangles were generated based on the
760 million Nodes. With the newly created triangles it was possible to determine the activity polygons
for about 123,000 members. An example activity area of a member is shown in Figure 12.
Figure 12. Example activity area of a member of the OSM project.
The distribution of activity area sizes for each of the three contributor groups (Figure 4) is displayed
in Figure 13. For a better overview, the area sizes have been divided into three individual size classes
for each group.
ISPRS Int. J. Geo-Inf. 2012, 1
159
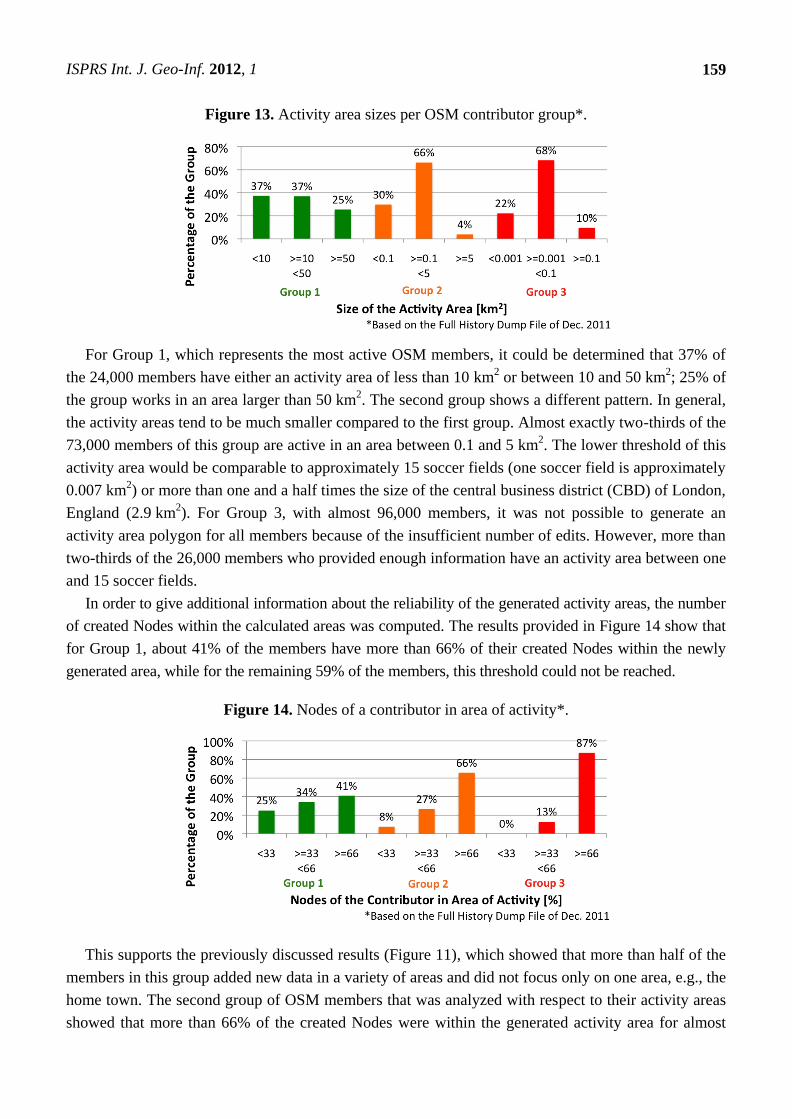
Figure 13. Activity area sizes per OSM contributor group*.
For Group 1, which represents the most active OSM members, it could be determined that 37% of
the 24,000 members have either an activity area of less than 10 km2 or between 10 and 50 km
2; 25% of
the group works in an area larger than 50 km2. The second group shows a different pattern. In general,
the activity areas tend to be much smaller compared to the first group. Almost exactly two-thirds of the
73,000 members of this group are active in an area between 0.1 and 5 km2. The lower threshold of this
activity area would be comparable to approximately 15 soccer fields (one soccer field is approximately
0.007 km2) or more than one and a half times the size of the central business district (CBD) of London,
England (2.9 km2). For Group 3, with almost 96,000 members, it was not possible to generate an
activity area polygon for all members because of the insufficient number of edits. However, more than
two-thirds of the 26,000 members who provided enough information have an activity area between one
and 15 soccer fields.
In order to give additional information about the reliability of the generated activity areas, the number
of created Nodes within the calculated areas was computed. The results provided in Figure 14 show that
for Group 1, about 41% of the members have more than 66% of their created Nodes within the newly
generated area, while for the remaining 59% of the members, this threshold could not be reached.
Figure 14. Nodes of a contributor in area of activity*.
This supports the previously discussed results (Figure 11), which showed that more than half of the
members in this group added new data in a variety of areas and did not focus only on one area, e.g., the
home town. The second group of OSM members that was analyzed with respect to their activity areas
showed that more than 66% of the created Nodes were within the generated activity area for almost

ISPRS Int. J. Geo-Inf. 2012, 1
160
two-thirds of the members. Group 3 showed a very high value for the group, with approximately 87%
of the Nodes being within the activity area; however this value is less meaningful due to the small
activity area.
6. Activity Time Frame of a Member
Apart from the size of the area in which a member contributes data to the OSM project, it is
obviously important in what time frame a member generates new data, i.e., how active a member is
after registration for the project. Do members only collect data in the first few months, or can they be
identified as long-term contributors? Figure 15(a) shows the percentage of each contributor group in
relation to the years they have been registered for the project. The majority, 40%, of the most active
contributor group (Group 1) has been registered for more than three years. However, it can also be
determined that the increase of Group 1 members has not been consistent over the years. On the other
hand, an increase can be determined for Groups 2 and 3 in recent years. Figure 15(b) illustrates the
actual time frame in which the members have been active since their registration. As expected, nearly
all members in Group 3, who contributed the least amount of data to the project, were only active for
less than three months. A similar pattern can be found in Group 2. Here about three-quarters of the
members contributed for about three months, while the remaining members actively collected
information for up to three to 12 months. In the most active Group 1, almost half of the members, 48%,
contributed to the project actively between three to 12 months, while another 38% were involved for
more than 12 months.
Figure 15. (a) Participation, (b) active participation and (c) active participation after
project registration.
(a) (b) (c)
The created changesets revealed the results shown in Figure 15(c) for our analysis of the most
active times of the members. The bars in the diagram represent the average timeframe in which the
members of the different groups performed their changesets. For Group 3, this means that almost 90%
of the changes were created within the first three months after registering to the project, while only 6%
were made after the first three to 12 months, and 5% within 12 months. The results of the second group
show that 79% of all changes were made during the first three months, while changes between the
third and twelfth months or later are fewer than 11%. Group 1 shows a slightly different pattern.
Although an average of nearly 44% of all changes of a member are made within the first few months,
the contributions of these members to the project can still last up to 12 months and more.

ISPRS Int. J. Geo-Inf. 2012, 1
161
Additionally, an analysis was conducted that provides information about the percentage of members
in each group who have made at least one change within the past six months, between six and twelve
months, or within the past twelve months. Table 2 provides the results of the analysis in absolute and
relative values.
Table 2. Number of active members of the last six and 12 months (absolute and relative values).
Group For the Last 6 Months Between 6 and 12 Months For the Last 12 Months
1 14,340 (59%) 14,350 (60%) 17,800 (74%)
2 20,800 (28%) 19,200 (26%) 34,650 (47%)
3 15,100 (22%) 13,840 (20%) 28,000 (40%)
A slight decrease in activity can be determined for Groups 2 and 3. However, 60% of the members
of the Senior Mappers Group were active within the past six months or the past six to twelve months.
In total, nearly three-quarters of all members of the most active group contributed information within
the past 12 months.
7. Conclusions and Future Work
Various results of different analyses regarding the number of registered and truly active members of
an online VGI community were presented in this article. To be able to retrieve the desired information,
different datasets of the OSM project were investigated, all of which originate from the middle of
December 2011. Several sources on the Internet have reported on the large number of contributors to
the OSM project, which exceeded 500,000 registered members in December 2011. However, the
results have shown that only 38% of the total number of members, around 192,000, carried out at least
one change during their membership.
For a more detailed analysis, the members were divided into three groups according to their number
of contributions to the project; Senior Mappers who created more than 1,000 Nodes, Junior Mappers
who created 10 to 1,000 Nodes, and Nonrecurring Mappers who only created less than 10 Nodes. The
Senior Mapper group represents the smallest group in the database with about 24,000 members. This
means that only 5% of all members actively contribute to the project in a productive way. The other
two contributor groups provide larger user numbers, with 73,100 for the Junior Mappers and 96,000
for the Nonrecurring Mappers group; their contributions, however, are very limited compared to the
first group. Overall, 312,000 members never contributed to the project at all.
The evaluation of the changeset files of the project revealed that nearly the same number of
members worked on the project every weekday with the exception of Sunday, which showed a slightly
larger number. Further, almost 87,000 different members made at least one change to the OSM
database in 2011. Breaking down the numbers per month, week, and day showed that 17,000, 6,500,
and approximately 2,000 members contributed to the project, respectively. These numbers indicate that
roughly about 3% of all members made at least one change a month.
By applying four different methods, the countries of origin were determined for the 192,000
members who had completed at least one change in the database. The majority of the members are
located in Europe (72%), while the remaining members (28%) are divided as follows: North America
(12%), Asia (8%), South America (3%), Australia (2%), Africa (2%), and Oceania (1%). Further

ISPRS Int. J. Geo-Inf. 2012, 1
162
analysis showed that more than half of the Senior Mappers members collected information for the
OSM project in at least two different countries.
The triangulation of all created Nodes in the database resulted in the determination of an activity
area polygon for each of the OSM members. The results showed slightly different patterns for each
contributor group. Two-thirds of the “Nonrecurring Mappers” (Group 3) has an activity area between
one and 15 soccer fields in size. For the “Junior Mappers” (Group 2), the activity area increases for
about two-thirds of the members to a size between 15 soccer fields and an area one and a half times the
size of the CBD of London (2.9 km2). The most active “Senior Mappers” (Group 1) can be divided
into one-third of members that cover up to 10 km2, one-third that cover between 10 and 50 km
2, and
one-thirds that cover an area of about 50 km2. Further research needs to be conducted to analyze
whether and to what extent these numbers might change in the future.
An analysis of the timeframe in which the members contributed data to the project showed that the
majority of the members contributed most of their information within the first three months of their
membership. When comparing the conducted results with prior findings [19], there are a few
similarities that can be addressed. Both analyses showed that only about a third of all members ever
contributed to the project and that only a small number of contributors collected information over a
longer period of time. Further research will provide more information about possible reasons for the
reduced workload by the members. It may be based on adequately covered areas that do not need
additional information or a general loss of interest for the project. However, these conclusions are only
speculative and need to be researched in more detail. For the future of the project, these factors will
play a major role, since VGI data does not solely rely on data collection, but also on maintaining the
data to keep it as accurate and up-to-date as possible [49]. Additionally, the development of the
number of members per country in the coming years needs to be observed. An analysis that goes
beyond the general activity of the members and focuses on changes within the activity areas of the
members or whether members edit or improve the objects of other members could be conducted as
well. Some first investigations regarding these factors have already been published [43].
Additionally to these suggested analyses with focus on user activities, the results gathered in this
paper could provide a valuable foundation to answering questions regarding VGI data quality such as:
Which type of contributors (e.g., Senior Mappers) created a particular dataset of interest? How many
activity areas of members intersect with each other or within a predefined area? Similar to the
approach used in the analysis of Wikipedia and “The Roles of Local and Global Inequality
Contribution” [50], it could be tested if the quality of OSM data varies, depending on whether the
member who edited the information is very familiar with the area or not.
References and Notes
1. Knorr, E. 2004: The Year of Web Services; 2003. Available online: http://www.cio.com/article/
32050/2004_The_Year_of_Web_Services (accessed on 7 March 2012).
2. O’Reilly, T. What Is Web 2.0: Design Patterns and Business Models for the Next Generation of
Software; O’Reilly Media: Cambridge, MA, USA, 2005. Available online: http://oreilly.com/
web2/archive/what-is-web-20.html (accessed on 30 January 2012).

ISPRS Int. J. Geo-Inf. 2012, 1
163
3. Wunsch-Vincent, S.; Vickery, G. Participative Web: User-Created Content: Web 2.0, Wikis and
Social Networking; Organisation for Economic Co-operation and Development: Paris, France
2007.
4. Coleman, D.J.; Georgiadou, Y.; Labonte, J. Volunteered geographic information: The nature and
motivation of producers. Int. J. Spat. Data Infrastruc. Res. 2009, 4, 332–358.
5. Goodchild, M.F. Citizens as sensors: The world of volunteered geography. GeoJournal 2007, 69,
211–221.
6. Heipke, C. Crowdsourcing geospatial data. ISPRS J. Photogramm. 2010, 65, 550–557.
7. Hiking and Bridlemap. Available online: http://www.wanderreitkarte.de (accessed on 27 March
2012).
8. OpenPisteMap. Available online: http://openpistemap.org (accessed on 27 March 2012).
9. ÖPNV-Karte. Available online: http://www.öpnvkarte.de (accessed on 27 March 2012).
10. Neis, P.; Zipf, A. OpenRouteService.org is Three Times “Open”: Combining OpenSource,
OpenLS and OpenStreetMap; GIS Research UK: Manchester, UK, 2008.
11. Over, M.; Schilling, A.; Neubauer, S.; Zipf, A. Generating web-based 3D city models from
OpenStreetMap: The current situation in Germany. Comput. Environ. Urban Syst. 2010, 34,
496-507.
12. Goetz, M.; Zipf, A. Extending OpenStreetMap to Indoor Environments: Bringing Volunteered
Geographic Information to the Next Level. In Proceedings of the 28th Urban Data Management
Symposium, Delft, The Netherlands, 28–30 September 2011.
13. Introduction of Usage Limits to the Maps API. Available online:
http://googlegeodevelopers.blogspot.de/2011/10/introduction-of-usage-limits-to-maps.html
(accessed on 27 June 2012).
14. Foursquare is Joining the OpenStreetMap Movement! Available online:
http://blog.foursquare.com/2012/02/29/foursquare-is-joining-the-openstreetmap-movement-say-
hi-to-pretty-new-maps/ (accessed on 19 March 2012).
15. Nestoria. Why (and How) We’ve Switched Away from Google Maps. Available online:
http://blog.nestoria.co.uk/why-and-how-weve-switched-away-from-google-ma (accessed on 19
March 2012).
16. Google Map Maker. Available online: http://groups.google.com/group/google-map-maker/
browse_thread/thread /7ba81462f965c1dd (accessed on 7 March 2012).
17. TomTom: Map Share. Available online: http://www.tomtom.com/en_gb/maps/map-share/
(accessed on 7 March 2012).
18. Nokia Map Creator. Available online: http://blog.maps.nokia.com/travelling-out-and-about/
introducing-nokia-map-creator (accessed on 7 March 2012).
19. Budhathoki, N. Participants’ Motivations to Contribute to Geographic Information in an Online
Community. Ph.D. Dissertation, University of Illinois, Urbana-Champaign, IL, USA, 2010.
20. Lin, Y. A qualitative enquiry into OpenStreetMap making. New Rev. Hypermedia Multimedia
2011, 17, 53-71.
21. Javanmardi, S.; Ganjisaffar, Y.; Lopes, C.; Baldi, P. User Contribution and Trust in Wikipedia. In
Proceedings of the 5th International Conference on Collaborative Computing: Networking,
Applications and Worksharing, Washington, DC, USA, 11–14 November 2009.

ISPRS Int. J. Geo-Inf. 2012, 1
164
22. Statistics about Wikipedia. Available online: http://en.wikipedia.org/wiki/Special:Statistics
(accessed on 20 February 2012)
23. Nielsen, J. Participation Inequality: Encouraging More Users to Contribute. Available online:
http://www.useit.com/alertbox/participation_inequality.html (accessed on 30 January 2012).
24. Anthony, D.; Sean, W.S.; Williamson, T. The Quality of Open Source Production: Zealots and
Good Samaritans in the Case of Wikipedia; Dartmouth Computer Science Technical Report;
TR2007-606; Dartmouth College Computer Science: Hanover, NH, USA, 2007.
25. Haklay, M.; Weber, P. OpenStreetMap: User-generated street maps. IEEE Pervas. Comput. 2008,
7, 12–18.
26. Bennett, J. OpenStreetMap: Be Your Own Cartographer, 1st ed.; Packt Publishing: Birmingham,
UK, 2010.
27. Ramm, F.; Topf, J.; Chilton, S. OpenStreetMap: Using and Enhancing the Free Map of the
World, 1st ed.; UIT: Cambridge, UK, 2010.
28. OSM Statistics. Available online: http://www.openstreetmap.org/stats/data_stats.html (accessed
on 28 June 2012).
29. Yahoo! Aerial Imagery; OSM Wiki. Available online: http://wiki.openstreetmap.org/wiki/
Yahoo!_Aerial_Imagery (accessed on 28 June 2012).
30. Bing; OSM Wiki. Available online: http://wiki.openstreetmap.org/wiki/Bing (accessed on 28
June 2012).
31. Neis, P.; Zielstra, D.; Zipf, A. The street network evolution of crowdsourced maps:
OpenStreetMap in Germany 2007–2011. Future Internet 2012, 4, 1–21.
32. Mooney, P.; Corcoran, P. Characteristics of heavily edited objects in OpenStreetMap. Future
Internet 2012, 4, 285–305.
33. Haklay, M. How good is volunteered geographical information? A comparative study of
OpenStreetMap and ordnance survey datasets. Environ. Plan. B 2010, 37, 682-703.
34. Zielstra, D.; Zipf, A. A Comparative Study of Proprietary Geodata and Volunteered Geographic
Information for Germany. In Proceedings of 13th AGILE International Conference on
Geographic Information Science, Guimarães, Portugal, 10–14 May 2010.
35. Girres, J.F.; Touya, G. Quality assessment of the French OpenStreetMap dataset. Trans. GIS
2010, 14, 435–459.
36. Zielstra, D.; Hochmair, H.H. Digital street data: Free versus proprietary. GIM Int. 2011, 25, 29–33.
37. Planet OSM. Available online: http://planet.openstreetmap.org (accessed on 15 December 2011).
38. Ramm, F.; Stark, H.-J. Crowdsourcing geodata. Geomatik Schweiz, Géomatique Suisse 2008, 6,
315–318.
39. Stats: OpenStreetMap Wiki. Available online: http://wiki.openstreetmap.org/wiki/Stats (accessed
on 12 March 2012).
40. Haklay, M.; Basiouka, S.; Antoniou, V.; Ather, A. How many volunteers does it take to map an
area well? The validity of Linus’ law to volunteered geographic information. Cartogr. J. 2010,
47, 315–322.
41. Lee, D. T.; Schachter, B.J. Two algorithms for constructing Delaunay triangulation. Int. J.
Parallel Prog. 1980, 9, 219–242.
ISPRS Int. J. Geo-Inf. 2012, 1
165
42. Berg, M.D.; Cheong, O.; Kreveld, M.V.; Overmars, M. Computational Geometry: Algorithms
and Applications, 3rd ed.; TELOS: Santa Clara, CA, USA, 2008.
43. Mooney, P.; Corcoran, P. The annotation process in OpenStreetMap. Trans. GIS 2012,
doi: 10.1111/j.1467-9671.2012.01306.x.
44. Mooney, P.; Corcoran, P. Accessing the History of Objects in OpenStreetMap. In Proceedings of
AGILE 2011: The 14th AGILE International Conference on Geographic Information Science,
Springer Verlag, Utrecht, The Netherlands, 18–21 April 2011.
45. OSM World Boundaries. Available online: http://wiki.openstreetmap.org/wiki/
Mapnik#World_boundaries (accessed on 1 December 2011).
46. Ramm, F. Krautsourcing 2.0 Beta: The State of Germany. State of the Map 2009. Available
online: http://www.geofabrik.de/media/2009-07-11-sotm-state-of-germany.pdf (accessed on 28
December 2011).
47. Statistics of the Free Wiki World Map. Available online: http://osmstats.altogetherlost.com
(accessed on 1 February 2012).
48. World Population Data Sheet. Available online: http://www.prb.org/Publications/Datasheets/
2011/world-population-data-sheet/data-sheet.aspx (accessed on 12 December 2011).
49. Qian, X.; Di, L.; Li, D.; Li, P.; Shi, L.; Cai, L. Data Cleaning Approaches in Web 2.0 VGI
Application. In Proceedings of the 17th International Conference on Geoinformatics, Fairfax,
VA, USA, 12–14 August 2009; pp. 1–4.
50. Arazy, O.; Nov, O. Determinants of Wikipedia Quality: The Roles of Global and Local
Contribution Inequality. In Proceedings of the 2010 ACM Conference on Computer Supported
Cooperative Work (CSCW), Savannah, GA, USA, 6–10 February 2010.
© 2012 by the authors; licensee MDPI, Basel, Switzerland. This article is an open access article
distributed under the terms and conditions of the Creative Commons Attribution license
(http://creativecommons.org/licenses/by/3.0/).