A Case Study in Complex Manual Assembly - MDPI
24
applied sciences Article Classification and Quantification of Human Error in Manufacturing: A Case Study in Complex Manual Assembly Yaniel Torres 1, * , Sylvie Nadeau 1, * and Kurt Landau 1,2 Citation: Torres, Y.; Nadeau, S.; Landau, K. Classification and Quantification of Human Error in Manufacturing: A Case Study in Complex Manual Assembly. Appl. Sci. 2021, 11, 749. https://doi.org/ 10.3390/app11020749 Received: 15 December 2020 Accepted: 10 January 2021 Published: 14 January 2021 Publisher’s Note: MDPI stays neu- tral with regard to jurisdictional clai- ms in published maps and institutio- nal affiliations. Copyright: © 2021 by the authors. Li- censee MDPI, Basel, Switzerland. This article is an open access article distributed under the terms and con- ditions of the Creative Commons At- tribution (CC BY) license (https:// creativecommons.org/licenses/by/ 4.0/). 1 Department of Mechanical Engineering, École de Technologie Supérieure (ÉTS), 1100 Notre-Dame St W, Montreal, QC H3C 1K3, Canada; offi[email protected] 2 Institute of Ergonomics and Human Factors, Technische Universität Darmstadt, Otto-Berndt-Straße 2, 64287 Darmstadt, Germany * Correspondence: [email protected] (Y.T.); [email protected] (S.N.) Abstract: Manual assembly operations are sensitive to human errors that can diminish the qual- ity of final products. The paper shows an application of human reliability analysis in a realistic manufacturing context to identify where and why manual assembly errors occur. The techniques SHERPA and HEART were used to perform the analysis of human reliability. Three critical tasks were selected for analysis based on quality records: (1) installation of three types of brackets using fasteners, (2) fixation of a data cable to the assembly structure using cushioned loop clamps and (3) installation of cap covers to protect inlets. The identified error modes with SHERPA were: 36 action errors, nine selection errors, eight information retrieval errors and six checking errors. According to HEART, the highest human error probabilities were associated with assembly parts sensitive to geometry-related errors (brackets and cushioned loop clamps). The study showed that percep- tually engaging assembly instructions seem to offer the highest potential for error reduction and performance improvement. Other identified areas of action were the improvement of the inspection process and workers’ provision with better tracking and better feedback. Implementation of assembly guidance systems could potentially benefit worker’s performance and decrease assembly errors. Keywords: human reliability analysis; manual assembly; human error; quality; ergonomics 1. Introduction An efficient and reliable assembly process is a critical aspect of manufacturing, ensuring that the final product meets the required quality level. Engineers usually con- sider several variables when selecting an appropriate assembly system. Among them are flexibility, productivity, product variants and production volume [1]. Figure 1 shows the relationship between some of these variables and the level of automation in the assembly system. The development of industrial robotics has induced a significant increase in the au- tomation and productivity of manufacturing processes, including assembly [2]. However, in manufacturing domains where product complexity and variety present particular chal- lenges, manual work remains a viable alternative. This is the case of such manufacturing domains as consumer electronics [3], aerospace manufacturing [4,5], combustion engine assembly [6], automotive manufacturing [7,8] and the production of industrial machines and tools [9,10]. Hence, for manual assembly to yield a final product of the appropriate level of quality, several operations must be executed properly. For example: selecting, handling and fitting parts; checking; applying force; and retrieving and analyzing information. Unfortunately, these operations are susceptible to human error and represent potential sources of defects. Swain and Guttmann [11] define human errors as “any member of a set of human actions that exceed some limit of acceptability, i.e., an out-of-tolerance action, where the limits of tolerable performance are defined by the system”. Common error-related defects in manual assembly processes include loose connections, missing com- ponents, the installation of wrong components, improper application of force to fasteners, Appl. Sci. 2021, 11, 749. https://doi.org/10.3390/app11020749 https://www.mdpi.com/journal/applsci
-
Upload
khangminh22 -
Category
Documents
-
view
3 -
download
0
Transcript of A Case Study in Complex Manual Assembly - MDPI

applied sciences
Article
Classification and Quantification of Human Error inManufacturing: A Case Study in Complex Manual Assembly
Yaniel Torres 1,* , Sylvie Nadeau 1,* and Kurt Landau 1,2
�����������������
Citation: Torres, Y.; Nadeau, S.;
Landau, K. Classification and
Quantification of Human Error in
Manufacturing: A Case Study in
Complex Manual Assembly. Appl. Sci.
2021, 11, 749. https://doi.org/
10.3390/app11020749
Received: 15 December 2020
Accepted: 10 January 2021
Published: 14 January 2021
Publisher’s Note: MDPI stays neu-
tral with regard to jurisdictional clai-
ms in published maps and institutio-
nal affiliations.
Copyright: © 2021 by the authors. Li-
censee MDPI, Basel, Switzerland.
This article is an open access article
distributed under the terms and con-
ditions of the Creative Commons At-
tribution (CC BY) license (https://
creativecommons.org/licenses/by/
4.0/).
1 Department of Mechanical Engineering, École de Technologie Supérieure (ÉTS), 1100 Notre-Dame St W,Montreal, QC H3C 1K3, Canada; [email protected]
2 Institute of Ergonomics and Human Factors, Technische Universität Darmstadt, Otto-Berndt-Straße 2,64287 Darmstadt, Germany
* Correspondence: [email protected] (Y.T.); [email protected] (S.N.)
Abstract: Manual assembly operations are sensitive to human errors that can diminish the qual-ity of final products. The paper shows an application of human reliability analysis in a realisticmanufacturing context to identify where and why manual assembly errors occur. The techniquesSHERPA and HEART were used to perform the analysis of human reliability. Three critical taskswere selected for analysis based on quality records: (1) installation of three types of brackets usingfasteners, (2) fixation of a data cable to the assembly structure using cushioned loop clamps and (3)installation of cap covers to protect inlets. The identified error modes with SHERPA were: 36 actionerrors, nine selection errors, eight information retrieval errors and six checking errors. Accordingto HEART, the highest human error probabilities were associated with assembly parts sensitiveto geometry-related errors (brackets and cushioned loop clamps). The study showed that percep-tually engaging assembly instructions seem to offer the highest potential for error reduction andperformance improvement. Other identified areas of action were the improvement of the inspectionprocess and workers’ provision with better tracking and better feedback. Implementation of assemblyguidance systems could potentially benefit worker’s performance and decrease assembly errors.
Keywords: human reliability analysis; manual assembly; human error; quality; ergonomics
1. Introduction
An efficient and reliable assembly process is a critical aspect of manufacturing,ensuring that the final product meets the required quality level. Engineers usually con-sider several variables when selecting an appropriate assembly system. Among them areflexibility, productivity, product variants and production volume [1]. Figure 1 shows therelationship between some of these variables and the level of automation in the assemblysystem. The development of industrial robotics has induced a significant increase in the au-tomation and productivity of manufacturing processes, including assembly [2]. However,in manufacturing domains where product complexity and variety present particular chal-lenges, manual work remains a viable alternative. This is the case of such manufacturingdomains as consumer electronics [3], aerospace manufacturing [4,5], combustion engineassembly [6], automotive manufacturing [7,8] and the production of industrial machinesand tools [9,10]. Hence, for manual assembly to yield a final product of the appropriate levelof quality, several operations must be executed properly. For example: selecting, handlingand fitting parts; checking; applying force; and retrieving and analyzing information.Unfortunately, these operations are susceptible to human error and represent potentialsources of defects. Swain and Guttmann [11] define human errors as “any member ofa set of human actions that exceed some limit of acceptability, i.e., an out-of-toleranceaction, where the limits of tolerable performance are defined by the system”. Commonerror-related defects in manual assembly processes include loose connections, missing com-ponents, the installation of wrong components, improper application of force to fasteners,
Appl. Sci. 2021, 11, 749. https://doi.org/10.3390/app11020749 https://www.mdpi.com/journal/applsci

Appl. Sci. 2021, 11, 749 2 of 24
damage during assembly and contamination by foreign object debris [12,13]. Poor phys-ical and cognitive ergonomics have been found to increase errors and impact productquality [12,14]. The links between human factors, errors and quality issues have beenrecognized in the literature [15]. Human errors are to be avoided to limit economic lossesassociated with defects and unnecessary waste. For this reason, ergonomics and humanfactors discipline is considered to be a key practice area within the lean manufacturingapproach [12].
Appl. Sci. 2021, 11, x FOR PEER REVIEW 2 of 23
missing components, the installation of wrong components, improper application of force to fasteners, damage during assembly and contamination by foreign object debris [12,13]. Poor physical and cognitive ergonomics have been found to increase errors and impact product quality [12,14]. The links between human factors, errors and quality issues have been recognized in the literature [15]. Human errors are to be avoided to limit economic losses associated with defects and unnecessary waste. For this reason, ergonomics and human factors discipline is considered to be a key practice area within the lean manufac-turing approach [12].
Figure 1. Utilization areas for manual, hybrid and automated assembly concepts. Reprinted by permission from Springer: Changeable and Reconfigurable Assembly Systems by B. Lotter and H.-P. Wiendahl (COPYRIGHT 2009).
With the introduction of Industry 4.0, manufacturing will experience an increase in product customization under the conditions of highly flexible (large scale) production [13]. According to Thoben et al. [14], this mass customization is expected to escalate pro-duction complexity and could increase the demands on human operators’ skills. In this context, optimizing the working system is necessary to minimize human error. Identifying and understanding the factors that affect assemblers’ performance is the first step in the implementation of effective strategies. Bubb [15] argues that human reliability is crucial to improve quality in the manufacturing sector. However, human reliability research has mostly focused on safety, while less attention has been paid to the manufacturing sector and to manual assembly specifically [16]. To close this gap, this paper applies classic hu-man reliability analysis (HRA) techniques to a realistic case study of complex manual as-sembly. It assumes that some HRA techniques, developed and mostly used in safety-crit-ical domains, can also be useful in the analysis of human error in manual assembly con-text. The study’s main goal is to understand where and why manual assembly errors occur by identifying the most common error modes, evaluating them, and determining the fac-tors that influence the assemblers’ performances. The paper also discusses potential strat-egies for the reduction of errors, including new technological approaches.
The research is articulated around a case study of complex manual assembly in a manufacturing setting (described in detail later in the paper). This case study is intended to provide new insights into human-related effects of assembly processes, which might lead to new work design solutions and generate new research questions. Additionally, previous results of human reliability analysis may be critically questioned. The case study
Figure 1. Utilization areas for manual, hybrid and automated assembly concepts. Reprinted by permission from Springer:Changeable and Reconfigurable Assembly Systems by B. Lotter and H.-P. Wiendahl (COPYRIGHT 2009).
With the introduction of Industry 4.0, manufacturing will experience an increase inproduct customization under the conditions of highly flexible (large scale) production [13].According to Thoben et al. [14], this mass customization is expected to escalate productioncomplexity and could increase the demands on human operators’ skills. In this context,optimizing the working system is necessary to minimize human error. Identifying andunderstanding the factors that affect assemblers’ performance is the first step in the im-plementation of effective strategies. Bubb [15] argues that human reliability is crucial toimprove quality in the manufacturing sector. However, human reliability research hasmostly focused on safety, while less attention has been paid to the manufacturing sectorand to manual assembly specifically [16]. To close this gap, this paper applies classic humanreliability analysis (HRA) techniques to a realistic case study of complex manual assem-bly. It assumes that some HRA techniques, developed and mostly used in safety-criticaldomains, can also be useful in the analysis of human error in manual assembly context.The study’s main goal is to understand where and why manual assembly errors occur byidentifying the most common error modes, evaluating them, and determining the factorsthat influence the assemblers’ performances. The paper also discusses potential strategiesfor the reduction of errors, including new technological approaches.

Appl. Sci. 2021, 11, 749 3 of 24
The research is articulated around a case study of complex manual assembly in amanufacturing setting (described in detail later in the paper). This case study is intendedto provide new insights into human-related effects of assembly processes, which mightlead to new work design solutions and generate new research questions. Additionally,previous results of human reliability analysis may be critically questioned. The casestudy method is recognized as having an impact on the generalization of theoretical andempirical findings and it offers the possibility of studying a defined situation in greatdetail [17]. This methodological approach is especially suitable when researchers requirea holistic, in-depth investigation that demands that research goes beyond the study ofisolated variables. The examination of the manual assembly context object of study is anintegral aspect of the understanding of the interactions within. This examination favors thecollection of data in real settings [18]. In the present paper, a complex manual assembly isdefined as an assembly task that requires specialized knowledge and skills for the workerto be able to complete the task. Additionally, the assembled object is composed of a highnumber of parts with a high number of possible choices among them, while the geometryof the assembled object has several symmetric planes [19]. The cognitive demands on theassembler as a consequence of information perception and information processing arerelatively high [20]. The conceptual debate around definitions of complexity is beyond thescope of this article and is the focus of different scientific teams; we, therefore, invite thereader to consult the literature on this behalf [21–23].
2. Literature Review2.1. Some Considerations about Manual Assembly
According to Swift and Booker [24], manual assembly “involves the composition ofpreviously manufactured components or sub-assemblies into a complete product or unit ofa product, primarily performed by human operators using their inherent dexterity, skill andjudgment”. Richardson et al. [19] describe manual assembly as a spatial problem-solving ac-tivity that requires that workers build a mental model to understand and manipulate spatialinformation. The quality of the information contained in work instructions, the way this in-formation is presented and how the worker interacts with this information are particularlyimportant in manual assembly processes [25–28]. To take full advantage of the assemblers’cognitive abilities, work instructions should clearly and unambiguously describe whichcomponents to use and how they should be assembled [27]. One accepted principle is thatthese instructions must be presented in such a way that anyone can understand them andconduct assembly accordingly [29]. This way, work instructions can help to reduce theassemblers’ cognitive workloads, particularly by minimizing dynamic complexity.
In modern manual assembly processes, work instructions are generally providedelectronically and presented on a computer screen, as text supported by visual informa-tion [25,28]. However, according to Mattsson et al. [30], instructions need to be more percep-tual, which means that richer and more immediate sensory inputs should be provided tothe assembler. Using three-dimensional models in work instructions can show the assemblyprocess in a more realistic, accurate and intuitive fashion. Such model-based instructions(MBI) may present multiple views and easy-to-follow assembly procedures [31,32]. Recenttechnologies, such as augmented reality (AR), seem to promise even better means of deliv-ering work instructions to assemblers. In a recent literature review, AR was identified asone of the two most promising technologies to support humans in manufacturing contexts,along with collaborative robots [33]. However, applications of AR are still in developmentand the technology has not reached full technological maturity [34,35].

Appl. Sci. 2021, 11, 749 4 of 24
Choosing the right parts during the assembly requires a certain amount of informationprocessing and decision making, which is why the use of kitting systems has been exploredas a strategy to minimize this cognitive load [36]. Parts kitting is a logistics technique usedto deliver groups of parts together in one or more kit containers [37]. Generally, kits areprepared in a warehouse and delivered to the assembly line, to specific workstations,according to the production schedule. When kits are prepared properly, parts are supposedto be easily available, checked, and prepositioned so that they can be removed rapidlyfrom the container [38]. According to Brolin [25], a kit can be considered as a “carrier ofinformation” for assembly, meaning that work instructions are embedded in the kit itself.Medbo [39] argues that appropriately structured kits can support assemblers and evenfacilitate learning. According to Caputo et al. [37], kitting systems provide the opportunityfor in-process quality control and additional checks, both in the kitting room or at theworkstation. Kitting can therefore reduce the risk of a wrong part being assembled or of apart being omitted by providing direct feedback to the assembler. Past research suggeststhat kitting may yield better quality and productivity when compared to other parts feedingpolicies [25,39,40].
It has been acknowledged that errors cannot be entirely eliminated because they areconsidered to be a normal consequence of human variability [41]. Thus, during man-ual assembly, inspection is required to verify that a product is free of defects before itis transferred to the next level of assembly or shipped to the customer [42]. In this way,inspection allows the system to recover from human error. Historically, workers haveperformed these inspections visually. However, the limitations of humans as visual in-spectors have long been recognized [43,44]. For this reason, automated visual inspection(AVI) has long been used in the manufacturing industry for quality control and monitor-ing [45,46]. As gains in computational power yield enhanced image acquisition, processingand analysis capabilities, automation replaces human visual inspection more and moreoften [42,47]. For example, a robot can take pictures of the final product to detect deviationsand nonconformities. Such a system can validate the quality of final assembly based on itsability to perform optical characteristics recognition, such as detecting whether a specificcomponent is absent. However, even though machine vision has been used in qualityinspection for several years, it seems that technological challenges remain. According toSobel [48] “Many of the advances we take for granted in modern computing—ubiquitousconnectivity, unlimited data storage in the cloud, insights drawn from massive unstruc-tured data sets—have yet to be applied systematically to the factory floor in general and tocomputer vision specifically”. One drawback of centralized automated inspection at theend of the assembly line is that the identification of nonconformities is made too late andthe cost of reworking may be considerable. Lean approaches seek to ensure the qualityof the assembled object before it leaves the workstation to minimize costs and delays byeliminating waste [49]. As machine vision continues to evolve, it would be reasonableto expect that automated visual inspection might become sufficiently flexible to come tothe assembly workstation. Thus, a centralized automated inspection would shift to anin-process, ubiquitous automated inspection carried out with a smart assistance system.These systems could combine, for example, wearable augmented reality with automatedvisual inspection [50,51] or use collaborative robots for automated visual inspection [52,53].
2.2. Human Reliability Analysis: Origins and Applications in Assembly Systems
According to Embrey [54], the essence of human reliability analysis (HRA) is theprediction and mitigation of error to optimize safety, reliability and productivity. HRA’smain focus is the identification of sources of human error and the quantification of thelikelihood of such errors [55]. Over the years, the discipline of HRA has proposed severaltechniques [56,57], which stem from the need to quantify human error for probabilisticsafety analysis (PSA) in the nuclear sector [58,59]. Other industries where HRA has beenapplied include aerospace, offshore oil extraction and chemical processing, all of themsafety-critical domains [60,61]. Human reliability analysis represents the intersection of

Appl. Sci. 2021, 11, 749 5 of 24
reliability engineering and human factors research [62]. Reliability engineering seeks topredict overall system reliability based on system configuration and probabilistic estimatesof component failures [63]. According to Boring et al. [55], human factors research providesthe empirical basis to support predicting human performance in HRA. In practical terms,human performance is predicted by calculating human error probability (HEP). Mathemat-ically, human error is treated as the failure of a technical component. However, some HRAtechniques focus on human error identification rather than the calculation of human errorprobabilities [64,65].
Failure mode and effects analysis (FMEA) is a well-established reliability engineeringtechnique used to assess vulnerabilities in a system proactively [66]. It has been used inmanufacturing and manual work [67]. Quality function deployment (QFD), a quality re-search technique, has also been used to redesign product functionality to reduce complexityin assembly [68]. Despite these examples, a recent literature review by Pasquale et al. [16]concluded that: “a prospective analysis of human reliability in the manual assembly sys-tems until now has been neglected in the literature and few papers investigated the rangeof human error and the type of errors that occur in this field”. However, this conclusion isbased on a rather small number of relevant documents, i.e., 20 peer-reviewed papers pub-lished in English between 2005 and 2017. Authors from manufacturing powerhouses likeGermany, France and Japan, who published in their native languages, were not considered.While non-exhaustive, Table 1 shows additional developments and applications of HRA tomanufacturing and manual assembly.
Broadly speaking, there are two main approaches to human reliability in manualassembly: the development of context-specific techniques [37,69,70] and the application ofclassic HRA techniques with or without modifications [6,15,71]. Context-specific methodsare expected to provide more precision in the calculation of HEP, but they are more resource-intensive. For example, methods time and quality measurement (MTQM), developed inGermany, requires in-depth knowledge of predetermined motion time systems (PMTS) andhigh investments in training time and money [72]. Little information about context-specifictechniques is available, which hinders replication of the analysis process. On the otherhand, classic HRA techniques like THERP (technique for human error rate prediction),HEART (human error assessment and reduction technique) or SHERPA (systematic humanerror reduction and prediction approach) are well represented in the literature and enoughinformation is available to carry out an analysis. Furthermore, the importance of obtaininga precise final value of HEP depends on the intended final use of this numerical value.Kern and Refflinghaus [73] used assembly specific databases as part of MTQM, to calculateprecise estimates of HEP. This is necessary because HEP values are used as part of aproduction planning tool to conduct cost–benefit analysis. More recently, Torres et al. [74]proposed an intervention framework for the analysis of human error in manual assembly.This framework is based on the use of well-known HRA techniques and is in line withthe idea proposed by Bubb [15], who suggests using HRA to identify error modes andcalculate human error probabilities (HEP) in manual assembly.

Appl. Sci. 2021, 11, 749 6 of 24
Table 1. Some developments and applications of human reliability analysis (HRA) to manual assembly in manufacturing.
Author Reference Type of Document Objective Overview In Pasquale et al. [16]
[71] Journal paper
An analytical framework is proposed:HEDOMS—Human Error andDisturbance Occurrence inManufacturing Systems.
The framework has two modules. Module 1 discusses theselection of critical tasks to be analyzed (based on data,statistics and initial solutions). Module 2 is a modification ofclassic human reliability analysis techniques. No applicationwas reported.
No
[67] Conference paperA novel technique developed specificallyto identify manual assembly errors isproposed: “Assembly FMEA”.
Assembly defect levels are related to assembly complexity,which can be estimated using “Design for Assembly” (DFA)time penalties. Hence, Assembly FMEA uses a series ofDFA-related questions to elicit potential assembly defects.
No
[15] Journal paper
A reflection is conducted on how HRAcan help to improve quality in manualassembly through the use of literatureand examples.
The article describes the major tenets of HRA and itsrelationship with quality in production. THERP (techniquefor human error rate prediction) is used in a study case frommanual electronic assembly.
Yes
[75] Thesis Dissertation
A methodology is proposed to supportengineers and technicians in the selectionof the best error-proofing actions duringproduct development. This is intended tominimize errors from the design phase.
The proposed methodology is based on historical data andthe FMEA technique. It offers a list of 36 error-proofingapproaches to consider. The selection of the best approachesis based on cost calculations and the impact on quality.The methodology is based on Toyota’s production system.Application reported in a mixed production assembly of athree-wheeled motorcycle.
No
[6] Conference paperA “novel” mixed methodology isproposed to analyze quality issues relatedto human errors in engine assembly.
The methodology combines a modified version of CREAM(cognitive reliability and error analysis method) with FTA(fault tree analysis). Application reported on an assemblyline of automobile engines.
No
[69] Journal paper
An assembly planning method isdeveloped: MTQM (methods time andquality measurement) that allows thecalculation of human error probabilitieslinked to predetermined motion times.
The taxonomy of error types was harmonized withnomenclature from MTM. Specific human error probabilitiesare based on data from German automotive manufacturing.Application reported in the automotive industry [72].
Yes
[76] Conference paperA human reliability model for assemblyline manual workers is developed basedon statistical analysis of personal factors.
The model was built using Cox proportional-hazardsregression. Nine factors were evaluated in 120 assembly lineoperators using psychometric tests. Factors included in themodel were: stress, motivation, memory, and personality.The model was developed in an electronic assembly.
No

Appl. Sci. 2021, 11, 749 7 of 24
Table 1. Cont.
Author Reference Type of Document Objective Overview In Pasquale et al. [16]
[77] Thesis Dissertation
The objective was to capture the structureof human errors in a production line andto describe the frequency in which theseerrors occur. Principles of ResilienceEngineering were also explored.
A detailed analysis of error types and error probabilities;the findings are intended to be incorporated into futureplanning and development operations. A system theorymodel was used to understand specific human behaviorsand their adaptation to disturbance variables. Application atan engine production facility.
No
[37] Conference paper
A quantitative model is developed toassess errors in kitting processes forassembly line feeding. The model allowsquantifying costs of error-relatedquality issues.
Event trees are adopted to keep track of unwanted eventsand error correction opportunities during the entire logisticprocess, starting from material picking in the warehouse tokit delivery at workstations and parts assembly.An application example is included.
No
[70] Journal paper
A new human reliability analysis (HRA)method is presented: The simulator forhuman error probabilityanalysis (SHERPA).
A theoretical framework is provided, and human reliabilityis estimated as a function of the performed task,the performance shaping factors (PSF) and the time worked.
Yes

Appl. Sci. 2021, 11, 749 8 of 24
3. Materials and Methods
We focused on one case study of complex mechanical manual assembly. The casestudy was a realistic case distilled from the actual case that is confidential. Several datacollection and analysis methods were used to support the human error analysis process.This includes searching quality records to select critical tasks based on statistical analysis,familiarization and analysis of work instructions from the manufacturing execution system(MES), field observations of the tasks execution, unstructured interviews and focus groupmeetings with line supervisors, quality specialists and assemblers. This methodologicalapproach is known as mixed-methods [78]. The whole process was led and supervised byexperienced engineers and researchers in ergonomics and manufacturing. The participationwas completely voluntary and the whole study received approval from École de technologiesupérieure’s research ethics committee (7 November 2018).
3.1. Human Error Analysis Process
The five steps of the human error analysis process used in this study are presentedin Figure 2. Although these steps are presented sequentially, following a logical order,the approach employed in the field was iterative and holistic. Thus, the diagram in Figure 2should be seen as a simplification of the actual analysis process associated with the casestudy. The techniques included in the human error analysis process (HTA, SHERPA andHEART) were selected according to operational criteria from the literature (Holroyd andBell 2009; Lyons 2009) and considerations crucial to the manufacturing context: time,simplicity, availability of information, level of validation and analyst-oriented techniques.Further information about HTA [79], SHERPA [80] and HEART [81] can be found in theliterature. A brief description of each of the five steps in Figure 2 is presented subsequently.
Appl. Sci. 2021, 11, x FOR PEER REVIEW 8 of 23
3. Materials and Methods We focused on one case study of complex mechanical manual assembly. The case
study was a realistic case distilled from the actual case that is confidential. Several data collection and analysis methods were used to support the human error analysis process. This includes searching quality records to select critical tasks based on statistical analysis, familiarization and analysis of work instructions from the manufacturing execution sys-tem (MES), field observations of the tasks execution, unstructured interviews and focus group meetings with line supervisors, quality specialists and assemblers. This methodo-logical approach is known as mixed-methods [78]. The whole process was led and super-vised by experienced engineers and researchers in ergonomics and manufacturing. The participation was completely voluntary and the whole study received approval from École de technologie supérieure’s research ethics committee (7 November 2018).
3.1. Human Error Analysis Process The five steps of the human error analysis process used in this study are presented
in Figure 2. Although these steps are presented sequentially, following a logical order, the approach employed in the field was iterative and holistic. Thus, the diagram in Figure 2 should be seen as a simplification of the actual analysis process associated with the case study. The techniques included in the human error analysis process (HTA, SHERPA and HEART) were selected according to operational criteria from the literature (Holroyd and Bell 2009; Lyons 2009) and considerations crucial to the manufacturing context: time, sim-plicity, availability of information, level of validation and analyst-oriented techniques. Further information about HTA [79], SHERPA [80] and HEART [81] can be found in the literature. A brief description of each of the five steps in Figure 2 is presented subse-quently.
Figure 2. Human error analysis process used in the study. HTA = hierarchical task analysis; SHERPA = systematic human error reduction and prediction approach; HEART = human error assessment and reduction technique; GTT = generic task type, EPC = error producing condition; APOA = assessed proportion of effect; HEP = human error probability.
3.1.1. Step 1: Selection of Critical Tasks The selection of the tasks to be analyzed was based on data from the company’s rec-
ords. To this, quality records were explored for a 36-month period prior to the study. The objective was to find a group of tasks that were a frequent source of error-related quality
Figure 2. Human error analysis process used in the study. HTA = hierarchical task analysis; SHERPA = systematic humanerror reduction and prediction approach; HEART = human error assessment and reduction technique; GTT = generic tasktype, EPC = error producing condition; APOA = assessed proportion of effect; HEP = human error probability.
3.1.1. Step 1: Selection of Critical Tasks
The selection of the tasks to be analyzed was based on data from the company’srecords. To this, quality records were explored for a 36-month period prior to the study.The objective was to find a group of tasks that were a frequent source of error-relatedquality issues. Firstly, descriptive statistics allowed one to identify the assembly parts that

Appl. Sci. 2021, 11, 749 9 of 24
represented a high proportion of quality issues. Secondly, the rate of quality issues per 10thousand labor hours allowed one to select the specific assembly line and workstationswhere the research should focus on.
3.1.2. Step 2: Task Description
Once the tasks to be analyzed were chosen, each of them was broken down into thesubtasks required to achieve the overall goal of the task. This was achieved using thehierarchical task analysis technique developed by Anett [79]. The description of the taskswas based on the study of work procedures, as described in the manufacturing executionsystem (MES). Additionally, a total of 40 h of field observations supported this and othersteps within the human error analysis process. Five assemblers were observed duringan entire workday (eight hours) at their respective workstations. However, these fieldobservations focused primarily on the execution of tasks. The main goal was to understandthe structure and sequencing of tasks and subtasks in a real context (work as done).No personal data about the assemblers was collected. The assembly line and workstationsto be observed were identified based on results from the analysis of quality records.
3.1.3. Step 3: Identification of Human Errors
SHERPA (systematic human error reduction and prediction approach) was used toidentify human error modes associated with the tasks analyzed [82]. For this, each bottom-level subtask from the HTA was associated with one or more error modes proposed inthe SHERPA taxonomy of errors. The error modes are described, and corrected strategiesare identified. Information is then compiled and presented in the tabular form. In thisstudy, a focus group composed of line supervisors, quality specialists and experiencedassemblers provided the necessary information for the process of classifying human errors.Three meetings of approximately 1.5 h each were carried with the focus group.
3.1.4. Step 4: Quantification of Human Error
The quantitative analysis in this step was performed based on HEART (human errorassessment and reduction technique). HEART contains three main elements, which arethe following:
• Generic task type (GTT): the analyst should specify which of the eight generic tasktypes proposed in HEART best match the task object of analysis and determinesthe nominal HEP for the task based on the mean HEP value associated with thecorresponding GTT.
• Error producing condition (EPC): these are conditions that may influence the humanreliability, mathematically they represent modification weights for the nominal HEP.HEART proposes a table with a list of 40 EPCs and their relative maximum effect onperformance in the form of a numerical value (EPCs are also known as performanceshaping factors or PSFs).
• Calculation method: the method for calculation of human error probability evaluatesthe EPCs weights based on their relative importance to each other in the task context.In this manner, an assessed proportion of the error producing conditions (APOA) isobtained. The final HEP can be yielded, as shown in Equations (1) and (2):
HEP = GTTi × ∏ WFj (1)
WFj =[(
EPCj − 1)× APOAj + 1
](2)
where WFj = weighting effect for the jth EPC; EPCj = error-producing condition for the jthcondition; APOAj = assessed proportion of ‘affect’ for that condition; HEP = final humanerror probability; GTTi = central value of the HEP task (distribution) that is associated witha task i; GTT = generic task type.

Appl. Sci. 2021, 11, 749 10 of 24
3.2. Description of the Case Study
The case consists of a mechanical assembly worker installing various componentsto the main structure of the object being assembled. Instructions are delivered by themanufacturing execution system (MES) and displayed on a computer terminal at theworkbench (PC stationary screen), which is located approximately 2 m from the assemblyposition. Instructions consist of text and 2D drawings providing basic visual descriptionsof assembly steps. Parts are stored in bins at the workbench. The worker moves aroundthe assembly position at the center of the workstation as needed. Figure 3 shows theschematic representation of the assembly workstation’s layout and the general workflow.The assembly line consists of six workstations with similar characteristics to the workstationshown in Figure 3. The main assembly structure is transferred from one workstation tothe next using a dolly. The height and direction of the main structure of assembly can bemodified by the worker to gain access more easily.
Appl. Sci. 2021, 11, x FOR PEER REVIEW 10 of 23
error probability; GTTi = central value of the HEP task (distribution) that is associated with a task i; GTT = generic task type.
3.2. Description of the Case Study The case consists of a mechanical assembly worker installing various components to
the main structure of the object being assembled. Instructions are delivered by the manu-facturing execution system (MES) and displayed on a computer terminal at the workbench (PC stationary screen), which is located approximately 2 m from the assembly position. Instructions consist of text and 2D drawings providing basic visual descriptions of assem-bly steps. Parts are stored in bins at the workbench. The worker moves around the assem-bly position at the center of the workstation as needed. Figure 3 shows the schematic rep-resentation of the assembly workstation’s layout and the general workflow. The assembly line consists of six workstations with similar characteristics to the workstation shown in Figure 3. The main assembly structure is transferred from one workstation to the next using a dolly. The height and direction of the main structure of assembly can be modified by the worker to gain access more easily.
Figure 3. Workstation’s layout (not to scale) and general workflow: (1) read work instruction on the PC, (2) pick the parts from bins, (3) pick tools from the tool cabinet, (4) execute assembly oper-ations and (5) close work instructions on the PC.
4. Results 4.1. Selection and Description of Critical Tasks
Numerous manual assembly tasks are performed on the assembly line, but for the purpose of the case study presented in this paper, three basic tasks were selected as critical tasks. These tasks are related to assembly parts that represent a substantial proportion of the company’s quality issues. Results showed that, during the 36-month period prior to the study, 67% of all wrongly installed parts were associated with brackets (27%), loop clamps (25%) and bolts (15%). Similarly, 65% of all missing parts were associated with cap covers (40%), brackets (13%) and loop clamps (12%). Following this, the three basic critical tasks selected were: 1. Install three brackets at specific locations according to the work procedure.
Figure 3. Workstation’s layout (not to scale) and general workflow: (1) read work instruction on the PC, (2) pick the partsfrom bins, (3) pick tools from the tool cabinet, (4) execute assembly operations and (5) close work instructions on the PC.
4. Results4.1. Selection and Description of Critical Tasks
Numerous manual assembly tasks are performed on the assembly line, but for thepurpose of the case study presented in this paper, three basic tasks were selected as criticaltasks. These tasks are related to assembly parts that represent a substantial proportion ofthe company’s quality issues. Results showed that, during the 36-month period prior to thestudy, 67% of all wrongly installed parts were associated with brackets (27%), loop clamps(25%) and bolts (15%). Similarly, 65% of all missing parts were associated with cap covers(40%), brackets (13%) and loop clamps (12%). Following this, the three basic critical tasksselected were:
1. Install three brackets at specific locations according to the work procedure.2. Secure a data cable to the main structure with three cushioned loop clamps.3. Install four cap covers to protect access points to the structure.
Appl. Sci. 2021, 11, 749 11 of 24
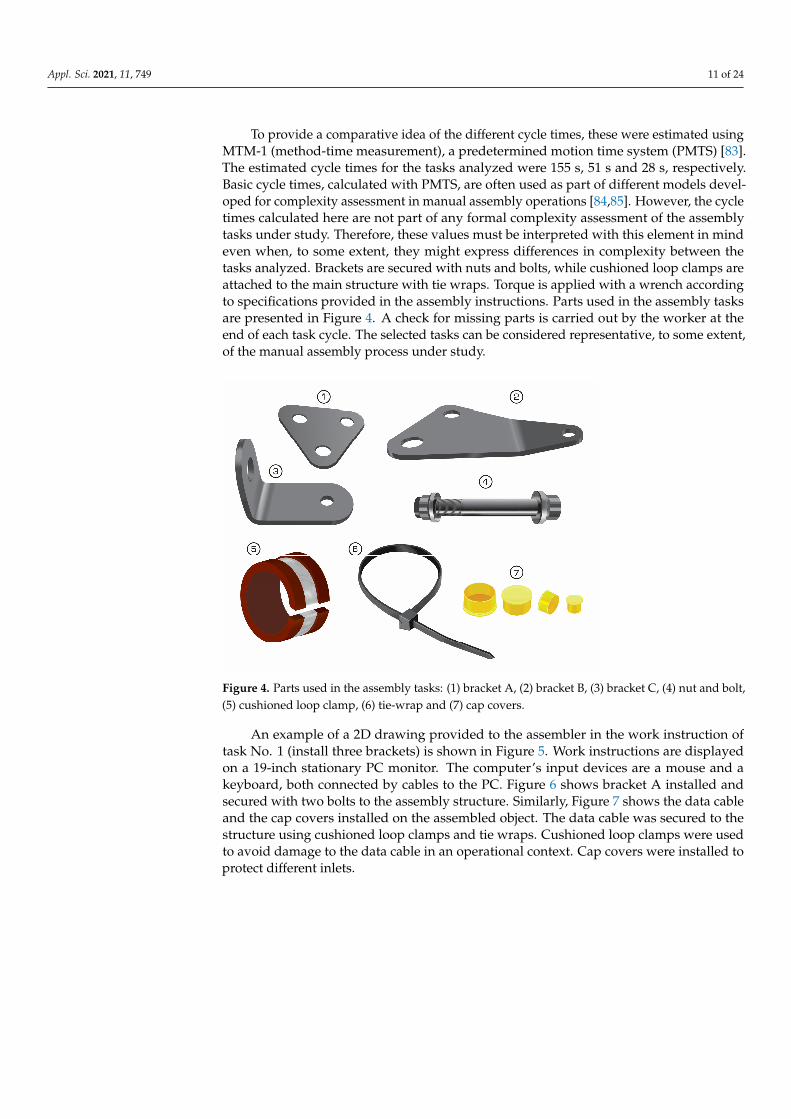
To provide a comparative idea of the different cycle times, these were estimated usingMTM-1 (method-time measurement), a predetermined motion time system (PMTS) [83].The estimated cycle times for the tasks analyzed were 155 s, 51 s and 28 s, respectively.Basic cycle times, calculated with PMTS, are often used as part of different models devel-oped for complexity assessment in manual assembly operations [84,85]. However, the cycletimes calculated here are not part of any formal complexity assessment of the assemblytasks under study. Therefore, these values must be interpreted with this element in mindeven when, to some extent, they might express differences in complexity between thetasks analyzed. Brackets are secured with nuts and bolts, while cushioned loop clamps areattached to the main structure with tie wraps. Torque is applied with a wrench accordingto specifications provided in the assembly instructions. Parts used in the assembly tasksare presented in Figure 4. A check for missing parts is carried out by the worker at theend of each task cycle. The selected tasks can be considered representative, to some extent,of the manual assembly process under study.
Appl. Sci. 2021, 11, x FOR PEER REVIEW 11 of 23
2. Secure a data cable to the main structure with three cushioned loop clamps. 3. Install four cap covers to protect access points to the structure.
To provide a comparative idea of the different cycle times, these were estimated us-ing MTM-1 (method-time measurement), a predetermined motion time system (PMTS) [83]. The estimated cycle times for the tasks analyzed were 155 s, 51 s and 28 s, respec-tively. Basic cycle times, calculated with PMTS, are often used as part of different models developed for complexity assessment in manual assembly operations [84,85]. However, the cycle times calculated here are not part of any formal complexity assessment of the assembly tasks under study. Therefore, these values must be interpreted with this element in mind even when, to some extent, they might express differences in complexity between the tasks analyzed. Brackets are secured with nuts and bolts, while cushioned loop clamps are attached to the main structure with tie wraps. Torque is applied with a wrench accord-ing to specifications provided in the assembly instructions. Parts used in the assembly tasks are presented in Figure 4. A check for missing parts is carried out by the worker at the end of each task cycle. The selected tasks can be considered representative, to some extent, of the manual assembly process under study.
Figure 4. Parts used in the assembly tasks: (1) bracket A, (2) bracket B, (3) bracket C, (4) nut and bolt, (5) cushioned loop clamp, (6) tie-wrap and (7) cap covers.
An example of a 2D drawing provided to the assembler in the work instruction of task No. 1 (install three brackets) is shown in Figure 5. Work instructions are displayed on a 19-inch stationary PC monitor. The computer’s input devices are a mouse and a key-board, both connected by cables to the PC. Figure 6 shows bracket A installed and secured with two bolts to the assembly structure. Similarly, Figure 7 shows the data cable and the cap covers installed on the assembled object. The data cable was secured to the structure using cushioned loop clamps and tie wraps. Cushioned loop clamps were used to avoid damage to the data cable in an operational context. Cap covers were installed to protect different inlets.
Figure 8 shows the breakdown of the critical basic task No.1 (install brackets). This HTA diagram is presented as an extract of the diagrams developed for the breakdown of each of the critical tasks under analysis. Subtasks 1.1–1.4 repeat for each of the brackets A, B and C, representing 12 subtasks. For the sake of diagram simplification, repetitions are not included.
Figure 4. Parts used in the assembly tasks: (1) bracket A, (2) bracket B, (3) bracket C, (4) nut and bolt,(5) cushioned loop clamp, (6) tie-wrap and (7) cap covers.
An example of a 2D drawing provided to the assembler in the work instruction oftask No. 1 (install three brackets) is shown in Figure 5. Work instructions are displayedon a 19-inch stationary PC monitor. The computer’s input devices are a mouse and akeyboard, both connected by cables to the PC. Figure 6 shows bracket A installed andsecured with two bolts to the assembly structure. Similarly, Figure 7 shows the data cableand the cap covers installed on the assembled object. The data cable was secured to thestructure using cushioned loop clamps and tie wraps. Cushioned loop clamps were usedto avoid damage to the data cable in an operational context. Cap covers were installed toprotect different inlets.

Appl. Sci. 2021, 11, 749 12 of 24Appl. Sci. 2021, 11, x FOR PEER REVIEW 12 of 23
Figure 5. 2D drawing showing the exact location where brackets A, B and C should be installed.
Figure 6. Bracket A secured to the structure in the final assembly location.
Figure 5. 2D drawing showing the exact location where brackets A, B and C should be installed.
Appl. Sci. 2021, 11, x FOR PEER REVIEW 12 of 23
Figure 5. 2D drawing showing the exact location where brackets A, B and C should be installed.
Figure 6. Bracket A secured to the structure in the final assembly location. Figure 6. Bracket A secured to the structure in the final assembly location.
Appl. Sci. 2021, 11, x FOR PEER REVIEW 13 of 23
Figure 7. Installation of data cable and cap covers in their respective assembly locations.
Figure 8. HTA diagram for the breakdown of the critical task No.1 (install brackets).
4.2. Identification and Description of Error Modes HTA and SHERPA techniques were applied to each task under evaluation, yielding
a total of 59 identified error modes. The installation of brackets accounted for the highest number of error modes with 34 (58%), followed by the installation of cushioned loop clamps with 19 error modes (32%), and the installation of cap covers with six error modes (10%). We found errors in four of the five categories proposed by the SHERPA taxonomy: action, retrieval, checking and selection. The absence of communication errors could be explained by the limited amount of teamwork in the context under study where the nec-essary information is usually supplied to the worker electronically by the MES. For the sake of simplification and the need to avoid repeated tables, only an extract of the SHERPA output table associated with critical task No.1 (install brackets) is presented in Table 2. Similar tables were obtained as a result of SHERPA analysis of the rest of the critical tasks object of study. The consolidated results of the error modes obtained during the SHERPA analysis are presented in Table 3. Estimated cycle times are also presented at the end of Table 3 for comparison purposes. A more detailed description of each error mode is presented subsequently.
Figure 7. Installation of data cable and cap covers in their respective assembly locations.

Appl. Sci. 2021, 11, 749 13 of 24
Figure 8 shows the breakdown of the critical basic task No.1 (install brackets). This HTAdiagram is presented as an extract of the diagrams developed for the breakdown of eachof the critical tasks under analysis. Subtasks 1.1–1.4 repeat for each of the brackets A,B and C, representing 12 subtasks. For the sake of diagram simplification, repetitions arenot included.
Appl. Sci. 2021, 11, x FOR PEER REVIEW 13 of 23
Figure 7. Installation of data cable and cap covers in their respective assembly locations.
Figure 8. HTA diagram for the breakdown of the critical task No.1 (install brackets).
4.2. Identification and Description of Error Modes HTA and SHERPA techniques were applied to each task under evaluation, yielding
a total of 59 identified error modes. The installation of brackets accounted for the highest number of error modes with 34 (58%), followed by the installation of cushioned loop clamps with 19 error modes (32%), and the installation of cap covers with six error modes (10%). We found errors in four of the five categories proposed by the SHERPA taxonomy: action, retrieval, checking and selection. The absence of communication errors could be explained by the limited amount of teamwork in the context under study where the nec-essary information is usually supplied to the worker electronically by the MES. For the sake of simplification and the need to avoid repeated tables, only an extract of the SHERPA output table associated with critical task No.1 (install brackets) is presented in Table 2. Similar tables were obtained as a result of SHERPA analysis of the rest of the critical tasks object of study. The consolidated results of the error modes obtained during the SHERPA analysis are presented in Table 3. Estimated cycle times are also presented at the end of Table 3 for comparison purposes. A more detailed description of each error mode is presented subsequently.
Figure 8. HTA diagram for the breakdown of the critical task No.1 (install brackets).
4.2. Identification and Description of Error Modes
HTA and SHERPA techniques were applied to each task under evaluation, yielding atotal of 59 identified error modes. The installation of brackets accounted for the highestnumber of error modes with 34 (58%), followed by the installation of cushioned loopclamps with 19 error modes (32%), and the installation of cap covers with six error modes(10%). We found errors in four of the five categories proposed by the SHERPA taxonomy:action, retrieval, checking and selection. The absence of communication errors couldbe explained by the limited amount of teamwork in the context under study where thenecessary information is usually supplied to the worker electronically by the MES. For thesake of simplification and the need to avoid repeated tables, only an extract of the SHERPAoutput table associated with critical task No.1 (install brackets) is presented in Table 2.Similar tables were obtained as a result of SHERPA analysis of the rest of the critical tasksobject of study. The consolidated results of the error modes obtained during the SHERPAanalysis are presented in Table 3. Estimated cycle times are also presented at the endof Table 3 for comparison purposes. A more detailed description of each error mode ispresented subsequently.

Appl. Sci. 2021, 11, 749 14 of 24
Table 2. SHERPA output-human error analysis table for critical task No.1 (install brackets) 1.
Task Step Task Description Error Mode Error Description Consequence Recovery Remedial Strategy
1.1 Read work instructions
R2: Wrong informationobtained.
R3: Informationretrieval incomplete.
Improper interpretationof drawings.
Incomplete reading ofwork instructions.
A wrong mental representation ofthe task to be completed leading
to improper execution.None
Improve work instructions:e.g., use interactive 3D models.
Improve instruction delivery systems.
1.2 Pick the bracket frombins at workstation
S2: Wrongselection made.
A8: Operation omitted.
Selection of a differentbracket model.
Bracket not picked.
A different bracket installed.A missing bracket in the assembly Step 3
Clearly identifiable and labeled bins orvalidation with a barcode system.
Introduction of kitting feeding system.
1.3 Pick fasteners from binsat the workstation
S2: Wrongselection made.
A8: Operation omitted.
Selection of adifferent fastener.
Fasteners not picked.
A different fastener installed,e.g., shorter bolt same caliber.
A missing fastener in the assembly.Step 1.4
Better tracking and guidance during theassembly process.
Introduction of kitting feeding system.
1.4 Fix the bracket inproper position.
A3: Operation inwrong direction.
A5: Misalignment.
Bracket installed in thewrong direction.
Bracket installed in thewrong position(wrong holes).
A misplaced bracket installed onthe assembly not according to
design specifications.Step 3 Access to more realistic work instructions
directly or near the assembly place.
2. Apply required torque.A4: Too little/
much operation.A8: Operation omitted.
Torque applied but outof specifications.
Torque not applied.
Loose fasteners or fasteners tootight. Damage to nuts and bolts Step 3
Torque wrench & Error proofing system.Better tracking and guidance during the
assembly process.
3. Check assembly C1: Check omitted.C2: Check incomplete.
Omission tocheck previously
installed parts.Check not done
thoroughly.
An undetected quality issuewhich crosses the recovery barrier. None Avoid distractions and interruptions.
In situ visual automated inspection.
1 Similar tables were obtained as a result of the SHERPA analysis for the other two critical tasks. The consolidated results of the identified error modes for the three critical tasks are presented in Table 3.Mitigation strategies are addressed in more detail in the discussion section of this paper. R2, R3, S2, etc., correspond to error codes in the SHERPA taxonomy.
Appl. Sci. 2021, 11, 749 15 of 24
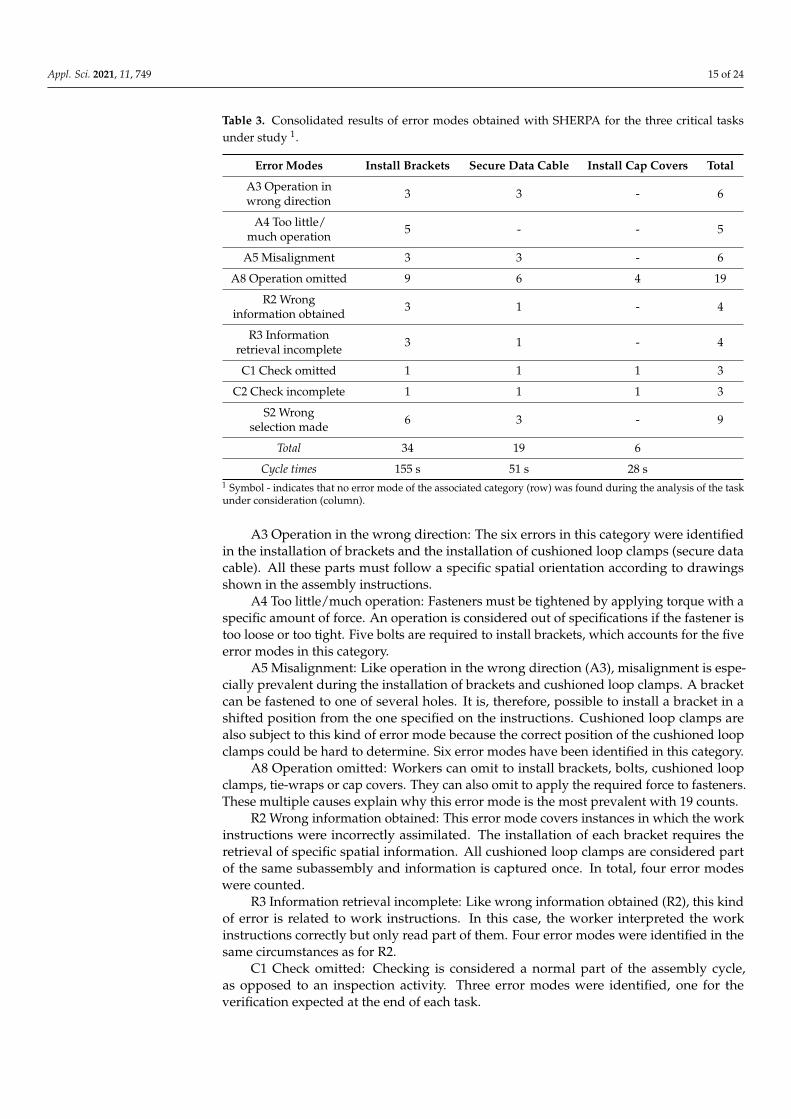
Table 3. Consolidated results of error modes obtained with SHERPA for the three critical tasksunder study 1.
Error Modes Install Brackets Secure Data Cable Install Cap Covers Total
A3 Operation inwrong direction 3 3 - 6
A4 Too little/much operation 5 - - 5
A5 Misalignment 3 3 - 6
A8 Operation omitted 9 6 4 19
R2 Wronginformation obtained 3 1 - 4
R3 Informationretrieval incomplete 3 1 - 4
C1 Check omitted 1 1 1 3
C2 Check incomplete 1 1 1 3
S2 Wrongselection made 6 3 - 9
Total 34 19 6
Cycle times 155 s 51 s 28 s1 Symbol - indicates that no error mode of the associated category (row) was found during the analysis of the taskunder consideration (column).
A3 Operation in the wrong direction: The six errors in this category were identifiedin the installation of brackets and the installation of cushioned loop clamps (secure datacable). All these parts must follow a specific spatial orientation according to drawingsshown in the assembly instructions.
A4 Too little/much operation: Fasteners must be tightened by applying torque with aspecific amount of force. An operation is considered out of specifications if the fastener istoo loose or too tight. Five bolts are required to install brackets, which accounts for the fiveerror modes in this category.
A5 Misalignment: Like operation in the wrong direction (A3), misalignment is espe-cially prevalent during the installation of brackets and cushioned loop clamps. A bracketcan be fastened to one of several holes. It is, therefore, possible to install a bracket in ashifted position from the one specified on the instructions. Cushioned loop clamps arealso subject to this kind of error mode because the correct position of the cushioned loopclamps could be hard to determine. Six error modes have been identified in this category.
A8 Operation omitted: Workers can omit to install brackets, bolts, cushioned loopclamps, tie-wraps or cap covers. They can also omit to apply the required force to fasteners.These multiple causes explain why this error mode is the most prevalent with 19 counts.
R2 Wrong information obtained: This error mode covers instances in which the workinstructions were incorrectly assimilated. The installation of each bracket requires theretrieval of specific spatial information. All cushioned loop clamps are considered partof the same subassembly and information is captured once. In total, four error modeswere counted.
R3 Information retrieval incomplete: Like wrong information obtained (R2), this kindof error is related to work instructions. In this case, the worker interpreted the workinstructions correctly but only read part of them. Four error modes were identified in thesame circumstances as for R2.
C1 Check omitted: Checking is considered a normal part of the assembly cycle,as opposed to an inspection activity. Three error modes were identified, one for theverification expected at the end of each task.

Appl. Sci. 2021, 11, 749 16 of 24
C2 Check incomplete: One or more component(s) were not checked during the verifi-cation at the end of a task cycle. Incomplete checking is equivalent to a partial omission ofthe check. There are three error modes in this category, the same as for C1.
S2 Wrong selection made: The assembler must obtain the required part from a binat the workbench. Parts are often similar, which could lead the worker to pick the wrongone: several brackets, cushioned loop clamp and fastener variants can be found in the bins.Nine error modes were counted.
4.3. Human Error Probabilities Calculation
A human error probability (HEP) was calculated for the incorrect installation of eachof four types of parts: brackets, cushioned loop clamps, cap covers and the generic partfasteners. The calculations followed the guidelines provided by William [81] in the originalarticle describing the HEART technique. The generic task type assigned to each partinstallation was routine, highly practiced, rapid task involving relatively low level ofskill, which corresponds to task type E in the HEART nomenclature. The generic errorprobability for this task type is 0.02. The number of error producing conditions (EPCs,also known as performance shaping factors or PSFs) was limited to no more than fivefor each of the parts analyzed. Although HEART provides a list of 40 error producingconditions, Boring [86] acknowledges that three to nine PSFs are generally sufficient toarrive at a screening value in the quantification phase. For the sake of simplification andthe need to avoid repeated calculations, only an extract of the HEART calculation table forthe critical task of installing a bracket is presented in Table 4. The consolidated results ofthe HEART analysis are presented in Table 5.
Table 4. HEART calculation of the human error probability (HEP) for brackets 1.
Generic Task Type E Generic Error Probability: 0.02
EPCs MaximumMultiplier
Assessed Proportionof Effect Assessed Effect % Contribution
to HEP
(5) No means of conveying spatialand functional information to
operators in a form which they canreadily assimilate
×8 0.7 = ((8 − 1) × 0.7) +1 = 5.9 49%
(39) Distraction andtask interruptions ×4 0.3 = ((4 − 1) × 0.3) +1 = 1.9 15.6%
(12) A mismatch between perceivedand real risk ×4 0.2 = ((4 − 1) × 0.2) +1 = 1.6 13.2%
(17) Little or no independentchecking or testing of output ×3 0.3 = ((3 − 1) × 0.3) +1 = 1.6 13.2%
(31) Low workforce morale ×1.2 0.2 = ((1.2 − 1) × 0.4) +1 = 1.08 9%
HEP= 0.02 × 5.9 × 1.9 × 1.6 × 1.6 × 1.08 = 0.621 Similar calculations of human error probabilities were conducted for the rest of assembly parts under analysis. The consolidated resultsare presented in Table 5.
The first and second columns of Table 5 show the identified EPC and the proposedmultiplier according to HEART analysis. The percentages in the other columns representthe contribution of each EPC to the probability of failure for each component. Table 5’sbottom row shows the total human error probabilities.

Appl. Sci. 2021, 11, 749 17 of 24
Table 5. Consolidated results of HEP calculations and error producing conditions with their respective % contribution 1.
EPCs MaximumMultiplier Brackets Cushioned
Loop Clamps:Fasteners
(Bolts-Nuts) Cap-Covers
(5) No means of conveying spatialand functional information to
operators in a form which they canreadily assimilate
×8 49% 42% - -
(12) A mismatch between perceivedand real risk ×4 13% 15% - -
(13) Poor, ambiguous or ill-matchedsystem feedback ×4 - - 30% -
(17) Little or no independentchecking or testing of output ×3 13% 15% 22% 35%
(26) No obvious way to keep trackof progress during an activity ×1.4 - - 14% 23%
(31) Low workforce moral ×1.2 9% 10% - -
(39) Distraction andtask interruptions ×4 16% 18% 34% 42%
Human Error Probability 0.62 0.47 0.29 0.091 Symbol - indicates that the corresponding EPC (row) was not identified during the analysis of the part under consideration (column).
5. Discussion
SHERPA analysis shows that brackets and cushioned loop clamps are particularlysensitive to operation in the wrong direction (A3) and to misalignment (A5). These errormodes can be considered geometry-related since the proper installation of these partsrequires some spatial abilities. Information errors such as the acquisition of the wronginformation (R2) and incomplete information retrieval (R3), also identified during SHERPAanalysis, can be considered precursors to geometry-related errors because of the impact ofthe information system on the assembler’s cognitive load [25]. Simultaneously, HEARTresults show that brackets and cushioned loop clamps had the highest human error prob-abilities (0.62 and 0.47 respectively) compared to fasteners (0.29) and cap covers (0.09).Interestingly, the lack of a means of conveying spatial and functional information to opera-tors in a form that they can readily assimilate is a major error producing condition (EPC)in the HEP calculation. This EPC was the single most important in the HEART analysis(×8 multiplier) and represented 49% and 42% of the total contribution to human errorprobabilities for brackets and cushioned loop clamps respectively. The results obtainedby using HEART were consistent with results from an empirical study in truck engineassembly where the potential error reduction obtained as a consequence of changing theinformation system was in the order of 40% [28].
It is important to highlight that the work instructions were provided as text and2D drawing sheets on a stationary PC display, which has been found to be less effectivethan 3D instructions when spatial abilities are required [87]. It has been acknowledgedthat work instructions are often deficient or underused in final assembly [25,26]. Anotherpoint of concern is how the assembler interacts with the work instructions. The computerscreen displaying the instructions in the study case is located on the workbench. However,the worker is frequently at some distance from the screen during the actual assembly.Instructions may not be easily readable from a distance, nor may the worker be able tofigure out details on the drawings. This will demand frequent trips from the assemblyposition to the workbench to retrieve information. Larger screens could help, although theworker’s movement around the assembly position might still frequently leave the screensout of sight. This situation was reported by Mayrhofer et al. [35]: a large overhead screenwas installed on an aircraft part assembly line, but the worker had to move to retrieve

Appl. Sci. 2021, 11, 749 18 of 24
the information because the screen was not visible from all angles and working positions.Neither do wide screens solve the need to move to the workbench to interact with thework instructions (validate, close instructions, go to following instruction, etc.), which isdone primarily with a mouse and keyboard. Optimizing the content of work instructions,their display and the interaction process between worker and instructions seems to beparamount to complex assembly performance.
As the SHERPA analysis shows, two major error modes are associated with the sys-tematic application of force to fasteners during assembly: the application of too little/muchforce (A4) and the omission of the operation (A8). In both cases, specifications are not met,and the integrity of the assembly can be compromised. Results from HEART show thatthe most important contributors to human error probability of failure in this context aredistractions and task interruptions (34%) and poor, ambiguous or ill-matched system feed-back (30%). The latter refers to the fact that the system provides no direct feedback to theassembler when a bolt is missing, too tight or loose: the responsibility for verification fallsto the assembler. A torque wrench can provide direct feedback while tightening, but thisdoes not solve the issue of missing fasteners and introduces calibration/certification chal-lenges [88]. The worker may also forget to check the applied torque value. Feeding partsto the assembly line in kits constitutes a more traditional way to avoid errors of omission(A8), as the omitted part will remain in the kitting container, thus providing direct feedbackto the worker. The number of parts provided by the kitting system should match theneeds of the associated task, so that there are neither missing nor superfluous parts inthe kitting box or rack (depending on the size of parts). As explained in the literaturereview, kitting systems also ease the process of selecting parts from bins, thus decreasingthe probability of encountering the wrong part selected (S2) error mode. Wireless-enabledtightening systems that improve torque application reliability constitute a support to theassembler [89]. Error-proofing fastening tools have been successfully used in assemblysince the late 1980s, when power tools equipped with electronic sensors to control torquebecame available [90]. Artificial intelligence and machine vision can further develop thepotential of these error-proofing systems.
The checks performed by the assembler at the end of each cycle can be treated as a low-key form of inspection because the search for nonconformity is more casual than duringactive inspection, where a person is directed to inspect specific items of equipment, usuallyusing specific written procedures like checklists [11]. Error modes C1 (check omitted)and C2 (check incomplete) constitute failures of these low-key inspections. While checksperformed by the assembler act as a barrier to the propagation of errors, this type ofbarrier can be sensitive to attention and interruptions and the well-known limitations ofvisual inspection [43,91]. Further along the assembly line, in-process active inspectionis carried out by other assemblers following specific instructions, sometimes in teams toprovide human redundancy, but these measures are susceptible to the same shortcomings,which is why automated visual inspection is often used at the end of the assembly process.It would be reasonable to expect automated visual inspection to become more flexible ascomputer vision improves. For this reason, the deployment of automated visual inspectionat the assembly workstation itself should be explored. This would result in a shift froma centralized automated inspection to an in-process, ubiquitous automated inspectioncarried out with a smart assistance system.
According to HEART, distractions and interruptions affect the probability of humanerror during the installation of all the parts under study to various degrees, i.e., from 16%for brackets to 42% for cap covers. Attention failures have been associated with manyskill-based errors in the Rasmussen SRK model [92], such as the breakdown in visual scanpatterns, the inadvertent activation of controls, and the disordering of steps in a proce-dure [93,94]. Distractions represent the drawing of attention away from the task, potentiallycausing confusion and increasing the likelihood of task failure. Either way, the potentialimpact on performance during manual assembly must be considered. Kilbeinsson et al. [95]

Appl. Sci. 2021, 11, 749 19 of 24
issue guidelines for the design of interruption systems that minimize errors and delaysduring assembly.
Criticism of human reliability analysis (HRA) has focused on the accuracy of humanerror probability computations [62] and on the assumption that human errors and machinefailures can be treated similarly [59] despite extensive variability among humans. Further,most of the research that supports HRA techniques was conducted in the nuclear sector,including the validation of HRA itself [96]. For these reasons, some authors support the useof human error identification (HEI) techniques like SHERPA but exclude the quantitativeaspects of HRA [97]. In the present study, human error probabilities calculated withHEART are not intended to be used in probabilistic safety analysis (PSA) but they canbe used for comparisons. The analysis shows that the installation of brackets has thehighest probability of failure (0.62) compared with cushioned loop clamps (0.47), fasteners(0.29) or cap covers (0.09), which suggests an explanation for the differences between thenumber of quality issues associated with each of the parts. The probabilities calculatedin this study are roughly similar to those reported by Richards [98] for failure of properlyinstalling an oil cap during aircraft maintenance (0.48–0.78). However, in both cases,the numerical values of human error probabilities should be treated as tools for human errorprevention rather than for prediction, i.e., task planning of novel assembly/maintenanceoperations. Quantification allows the importance of the various factors affecting assemblerperformance to be compared but it could lack precision since most of the HRA techniqueswere not specifically developed for the manufacturing context. We argue that, despite itslimitations, the quantification process constitutes a useful guide for the analyst during thesearch for solutions and, further, an important complement to the identification of humanerror modes.
Limitations of the Study and Future Research
Even though the authors took care to represent the real context upon which the casewas built as accurately as possible, it is often difficult to represent simply the complexityexamined. Possible generalizations must be seen in the light of the characteristics of thecontext in which the study was carried out [99]. Besides, the study focused mainly onfactors directly associated with the execution of the assembly tasks by the workers attheir respective workstations. However, several other factors associated with the workorganization can also have an impact on human performance and they should be addressedin future studies on manual assembly. This includes workload variations due to fluctua-tions in production demands, the overtime allocation practices and the arrangement ofworking hours, among others. Similarly, personal factors like worker’s training level andexperience are enablers affecting human performance that were out of the scope of thestudy. Even when HEART technique considers some of the mentioned factors, they havelow multiplier values, which explains that we chose to exclude them from this analysis.Future research about complex manual assembly should explore these organizationaland individual factors using different approaches as a complement to human reliabilityanalysis (HRA). Furthermore, the relationship between the complexity of manual assemblyoperations, cycle times (both basic and operational) and human error probabilities need tobe further examined in an integrative manner.
6. Conclusions
The paper shows how human reliability analysis (HRA) can be effectively appliedin a manufacturing context. SHERPA and HEART, both classic HRA methods initiallydeveloped for safety-critical domains, allowed the identification of potential errors andevaluation of the factors contributing to these errors. From the three critical assemblytasks initially selected, a total of 23 subtasks and 59 error modes were identified withSHERPA: 36 action errors, nine selection errors, eight information retrieval errors andsix checking errors. According to HEART the highest human error probabilities wereassociated with assembly parts sensitive to geometry-related errors (brackets and cushioned

Appl. Sci. 2021, 11, 749 20 of 24
loop clamps). The computed values of human error probabilities should be interpretedwith caution because their greatest value lies in preventing and managing human errorrather than in prediction. Nevertheless, HEART supports the analyst by providing a list ofproven factors that can affect human performance and whose influence can be comparedthrough their relative impact on human error probabilities. This process can shed lighton the best possible strategies to improve assembler performance. For example, the studyshows that when spatial abilities are required, the probability of errors can be reducedby providing assembly instructions that engage the worker’s senses more effectively.This supports the idea, already discussed in the literature, that assembly work instructionshave a major impact on dynamic complexity and should be optimized to decrease thecognitive workload.
The study also identified enhanced inspection processes, better operations tracking,better feedback to the worker and the reduction of distractions and interruptions as waysto reduce error probabilities and improve overall assembly performance. Although some ofthese can be achieved by traditional means (e.g., kitting system, poka-yoke, human redun-dancy, etc.), technology can also decrease workers’ cognitive load and reduce the dynamiccomplexity of assembly. With the development of human support technologies withinthe framework of the Operator 4.0 [33,100], the integration of several technologies intoassembly guidance systems could benefit workers and system performance. Questionsremain regarding the proper selection and deployment of these technologies, particularlyin relation to utility, usability, risks and practical acceptability [101]. Humans must remainat the heart of the reflection. Ergonomic analysis of the work systems, including humanerrors and reliability analysis, is a necessary step along the way.
Author Contributions: Conceptualization, Y.T., S.N. and K.L.; Formal analysis, Y.T.; Funding acqui-sition, Y.T., S.N. and K.L.; Investigation, Y.T.; Methodology, Y.T., S.N. and K.L.; Project administration,S.N.; Supervision, S.N. and K.L.; Writing—original draft, Y.T.; Writing—review & editing, S.N. andK.L. All authors have read and agreed to the published version of the manuscript.
Funding: This research was funded by MITACS, grant number IT12360 and the Natural Sciencesand Engineering Research Council of Canada (NSERC).
Institutional Review Board Statement: The study was approved by the Ethics Committee of Écolede technologie supérieure (reference number H20181004 and date of approval 7 November 2018).
Informed Consent Statement: Not applicable.
Data Availability Statement: The data related to the study are subject to a confidentiality agreementand therefore are not publicly available.
Acknowledgments: Authors would like to acknowledge the funding and infrastructure support ofthe industrial partner and École de technologie supérieure.
Conflicts of Interest: The authors declare no conflict of interest.
References1. Lotter, B.; Wiendahl, H.-P. Changeable and Reconfigurable Assembly Systems. In Changeable and Reconfigurable Manufacturing
Systems; ElMaraghy, H.A., Ed.; Springer: London, UK, 2009; pp. 127–142.2. Dinlersoz, E.; Wolf, Z. Automation, Labor Share, and Productivity: Plant-Level Evidence from US Manufacturing. US Census Bur.
Cent. Econ. Stud. Work. Pap. 2018, 18–39.3. Correia, D. Improving manual assembly lines devoted to complex electronic devices by applying Lean tools. Procedia Manuf.
2018, 17, 663–671. [CrossRef]4. Judt, D.; Lawson, C.; Lockett, H. Experimental investigation into aircraft system manual assembly performance under varying
structural component orientations. Proc. Inst. Mech. Eng. 2020, 234, 840–855. [CrossRef]5. Beuß, F.; Sender, J.; Flügge, W. Ergonomics Simulation in Aircraft Manufacturing—Methods and Potentials. Procedia CIRP 2019,
81, 742–746. [CrossRef]6. Yang, L.; Su, Q.; Shen, L. A novel method of analyzing quality defects due to human errors in engine assembly line. In Proceedings
of the 2012 International Conference on Information Management, Innovation Management and Industrial Engineering, Sanya,China, 20–21 October 2012.

Appl. Sci. 2021, 11, 749 21 of 24
7. Krugh, M. Prediction of Defect Propensity for the Manual Assembly of Automotive Electrical Connectors. Procedia Manuf. 2016, 5,144–157. [CrossRef]
8. Falck, A.-C.; Örtengren, R.; Högberg, D. The impact of poor assembly ergonomics on product quality: A cost–benefit analysis incar manufacturing. Hum. Factors Ergon. Manuf. Serv. Ind. 2010, 20, 24–41. [CrossRef]
9. Botti, L.; Mora, C.; Regattieri, A. Integrating ergonomics and lean manufacturing principles in a hybrid assembly line.Comput. Ind. Eng. 2017, 111, 481–491. [CrossRef]
10. Bao, S.; Mathiassen, S.E.; Winkel, J. Ergonomic effects of a management-based rationalization in assembly work—A case study.Appl. Ergon. 1996, 27, 89–99. [CrossRef]
11. Swain, A.D.; Guttmann, H.E. Handbook of Human-Reliability Analysis with Emphasis on Nuclear Power Plant Applications; Final Report;Sandia National Labs: Albuquerque, NM, USA, 1983.
12. Wong, Y.C.; Wong, K.Y.; Ali, A. Key Practice Areas of Lean Manufacturing. In Proceedings of the 2009 International Associationof Computer Science and Information Technology-Spring Conference, Singapore, 17–20 April 2009.
13. Kagermann, H. Recommendations for Implementing the Strategic Initiative INDUSTRIE 4.0: Securing the Future of German ManufacturingIndustry; Final Report of the Industrie 4.0 Working Group; Forschungsunion: Berlin, Germany, 2013.
14. Thoben, K.-D.; Wiesner, S.; Wuest, T. Industrie 4.0 and Smart Manufacturing—A Review of Research Issues and ApplicationExamples. Int. J. Autom. Technol. 2017, 11, 4–19. [CrossRef]
15. Bubb, H. Human reliability: A key to improved quality in manufacturing. Hum. Factors Ergon. Manuf. Serv. Ind. 2005, 15, 353–368.[CrossRef]
16. Pasquale, V.D. Human reliability in manual assembly systems: A Systematic Literature Review. IFAC-PapersOnLine 2018, 51,675–680. [CrossRef]
17. Easton, G. Critical realism in case study research. Ind. Mark. Manag. 2010, 39, 118–128. [CrossRef]18. Yin, R.K. A (very) brief refresher on the case study method. Appl. Case Study Res. 2012, 3, 18.19. Richardson, M. Identifying the Task Variables That Predict Object Assembly Difficulty. Hum. Factors 2006, 48, 511–525. [CrossRef]
[PubMed]20. Landau, K.; Brauchler, R.; Rohmert, W. The AET method of job evaluation. In Occupational Ergonomics Principles of Work Design;
CRC Press: Boca Raton, FL, USA, 2003; p. 20.21. Frizelle, G.; Woodcock, E. Measuring complexity as an aid to developing operational strategy. Int. J. Oper. Prod. Manag. 1995, 15,
26–39. [CrossRef]22. Kuzgunkaya, O.; Elmaraghy, H.A. Assessing the structural complexity of manufacturing systems configurations. Int. J. Flex.
Manuf. Syst. 2006, 18, 145–171. [CrossRef]23. Falck, A.-C.; Örtengren, R.; Rosenqvist, M.; Söderberg, R. Criteria for Assessment of Basic Manual Assembly Complexity.
Procedia CIRP 2016, 44, 424–428. [CrossRef]24. Swift, K.G.; Booker, J.D. Chapter 10—Assembly Systems. In Manufacturing Process Selection Handbook; Swift, K.G.,
Booker, J.D., Eds.; Butterworth-Heinemann: Oxford, UK, 2013; pp. 281–289.25. Brolin, A.; Thorvald, P.; Case, K. Experimental study of cognitive aspects affecting human performance in manual assembly.
Prod. Manuf. Res. 2017, 5, 141–163. [CrossRef]26. Li, D.; Fast-Berglund, Å.; Salunkhe, O.; Fast-Berglund, Å.; Skoogh, A.; Broberg, J. Effects of Information Content in Work
Instructions for Operator Performance. Procedia Manuf. 2018, 25, 628–635. [CrossRef]27. Mattsson, S.; Li, D.; Fast-Berglund, Å. Application of design principles for assembly instructions—Evaluation of practitioner use.
Procedia CIRP 2018, 76, 42–47. [CrossRef]28. Backstrand, G. The impact of information presentation on work environment and product quality: A case study. In Proceedings
of the Fortieth Annual Conference of the Nordic Ergonomics Society, Reykjavik, Iceland, 11–13 August 2008.29. Atsuko, E. “Assembly-navigation System” that Supports Manufacturing around the World. 2014. Available online: http:
//www.hitachi.com/rd/portal/contents/story/assembly_navigation/index.html (accessed on 15 October 2019).30. Mattsson, S.; Fast-Berglund, Å.; Li, D. Evaluation of Guidelines for Assembly Instructions. IFAC-PapersOnLine 2016, 49, 209–214.
[CrossRef]31. Hagan, R.; Lichtner, D.; Senesac, C. Three-dimensional model based manufacturing work instructions. In Proceedings of the 65th
Annual Forum-American Helicopter Society, Grapevine, TX, USA, 27–29 May 2009.32. Geng, J.; Zhang, S.; Yang, B. A Publishing Method of Lightweight Three-Dimensional Assembly Instruction for Complex Products.
J. Comput. Inf. Sci. Eng. 2015, 15, 031004. [CrossRef]33. Torres, Y.; Nadeau, S. Operator 4.0 in Manufacturing: Trends, Potential Technologies and Future Perspectives. In Kongress der
Gesellschaft für Arbeitswissenschaft; GfA-Press: Berlin, Germany, 2020.34. Bottani, E.; Vignali, G. Augmented reality technology in the manufacturing industry: A review of the last decade. IISE Trans.
2019, 51, 284–310. [CrossRef]35. Mayrhofer, W.; Rupprecht, P.; Schlund, S. One-Fits-All vs. Tailor-Made: User-Centered Workstations for Field Assembly with an
Application in Aircraft Parts Manufacturing. Procedia Manuf. 2019, 39, 149–157. [CrossRef]36. Brolin, A. The use of kitting to ease assemblers’ cognitive workload. In Proceedings of the 43rd Annual Nordic Ergonomics
Society Conference, Oulu, Finland, 18–21 September 2011.

Appl. Sci. 2021, 11, 749 22 of 24
37. Caputo, A.C.; Pelagagge, P.M.; Salini, P. Modeling Errors in Kitting Processes for Assembly Lines Feeding. IFAC-PapersOnLine2015, 48, 338–344. [CrossRef]
38. Christmansson, M.; Medbo, L.; Hansson, G.-Å.; Ohlsson, K.; Byström, J.U.; Moller, T.; Forsman, M. A case study of a principallynew way of materials kitting—an evaluation of time consumption and physical workload. Int. J. Ind. Ergon. 2002, 30, 49–65.[CrossRef]
39. Medbo, L. Assembly work execution and materials kit functionality in parallel flow assembly systems. Int. J. Ind. Ergon. 2003, 31,263–281. [CrossRef]
40. Caputo, A.C.; Pelagagge, P.M.; Salini, P. Modelling human errors and quality issues in kitting processes for assembly lines feeding.Comput. Ind. Eng. 2017, 111, 492–506. [CrossRef]
41. Hollnagel, E. Looking for errors of omission and commission or The Hunting of the Snark revisited. Reliab. Eng. Syst. Saf. 2000,68, 135–145. [CrossRef]
42. See, J.E.; Drury, C.G.; Speed, A.; Williams, A.; Khalandi, N. The Role of Visual Inspection in the 21st Century. Proc. Hum. FactorsErgon. Soc. Annu. Meet. 2017, 61, 262–266. [CrossRef]
43. Jebaraj, D.; Tyrrell, R.A.; Gramopadhye, A.K. Industrial inspection performance depends on both viewing distance and oculomotorcharacteristics. Appl. Ergon. 1999, 30, 223–228. [CrossRef]
44. Drury, C.; Fox, J. The imperfect inspector. In Human Reliability in Quality Control; Halsted Press: New York, NY, USA, 1975;pp. 11–16.
45. Suresh, B.R.; Fundakowski, R.A.; Levitt, T.S.; Overland, J.E. A Real-Time Automated Visual Inspection System for Hot Steel Slabs.IEEE Trans. Pattern Anal. Mach. Intell. 1983, 5, 563–572. [CrossRef] [PubMed]
46. König, A.; Windirsch, P.; Gasteier, M.; Glesner, M. Visual inspection in industrial manufacturing. IEEE Micro 1995, 15, 26–31.[CrossRef]
47. Edinbarough, I.; Balderas, R.; Bose, S. A vision and robot based on-line inspection monitoring system for electronic manufacturing.Comput. Ind. 2005, 56, 986–996. [CrossRef]
48. Sobel, J.O.N. Liberating Machine Vision from the Machines. 2019. Available online: https://www.wired.com/insights/2014/01/liberating-machine-vision-machines/ (accessed on 12 September 2020).
49. Gupta, S.; Jain, S.K. A literature review of lean manufacturing. Int. J. Manag. Sci. Eng. Manag. 2013, 8, 241–249. [CrossRef]50. Zheng, L.; Liu, X.; An, Z.; Li, S.; Zhang, R. A smart assistance system for cable assembly by combining wearable augmented
reality with portable visual inspection. Virtual Real. Intell. Hardw. 2020, 2, 12–27. [CrossRef]51. Eschen, H.; Kötter, T.; Rodeck, R.; Harnisch, M.; Schüppstuhl, T. Augmented and Virtual Reality for Inspection and Maintenance
Processes in the Aviation Industry. Procedia Manuf. 2018, 19, 156–163. [CrossRef]52. Leidenkrantz, A.; Westbrandt, E. Implementation of Machine Vision on a Collaborative Robot. In Automation Engineering;
University of Skovde: Skövde, Sweden, 2018; p. 60.53. Makrini, I.E. Design of a collaborative architecture for human-robot assembly tasks. In Proceedings of the 2017 IEEE/RSJ
International Conference on Intelligent Robots and Systems (IROS), Vancouver, BC, Canada, 24–28 September 2017.54. Embrey, D. Chapter 4-Assessment and Prediction of Human Reliability. In Health, Safety and Ergonomics; Nicholson, A.S.,
Ridd, J.E., Eds.; Butterworth-Heinemann: Oxford, UK, 1988; pp. 33–47.55. Boring, R. Is Human Reliability Relevant to Human Factors? In Proceedings of the Human Factors and Ergonomics Society
Annual Meeting, Houston, TX, USA, 27 September–1 October 1999.56. Holroyd, J.; Bell, J. Review of Human Reliability Assessment Methods; Health and Safety Laboratory: Derbyshire, UK, 2009.57. Lyons, M.N. Towards a framework to select techniques for error prediction: Supporting novice users in the healthcare sector.
Appl. Ergon. 2009, 40, 379–395. [CrossRef]58. IAEA. Human Error Classification and Data Collection; The International Atomic Energy Agency: Vienna, Austria, 1989; p. 167.59. IEEE. IEEE Guide for Incorporating Human Reliability Analysis into Probabilistic Risk Assessments for Nuclear Power Generating Stations
and Other Nuclear Facilities; IEEE: New York, NY, USA, 2018; pp. 1–34.60. Yang, K.; Tao, L.; Bai, J. Assessment of Flight Crew Errors Based on THERP. Procedia Eng. 2014, 80, 49–58. [CrossRef]61. Calixto, E. Chapter 5-Human Reliability Analysis. In Gas and Oil Reliability Engineering, 2nd ed.; Calixto, E., Ed.; Gulf Professional
Publishing: Boston, MA, USA, 2016; pp. 471–552.62. Hollnagel, E. Human reliability assessment in context. Nucl. Eng. Technol. 2005, 37, 159–166.63. Høyland, A.; Rausand, M. System Reliability Theory: Models and Statistical Methods; John Wiley & Sons: Hoboken, NJ, USA, 2009.64. Oxstrand, J.; Bladh, K.; Collier, S. Qualitative Analysis Makes Simple HRA Methods a Competitive Alternative. In Proceedings of
the 10th International Probabilistic Safety Assessment & Management Conference, Seattle, WA, USA, 7–11 June 2010.65. CCPS. Qualitative and Quantitative Prediction of Human Error in Risk Assessment. In Guidelines for Preventing Human Error in
Process Safety; Center for Chemical Process Safety: New York, NY, USA, 2004; pp. 201–245.66. Stamatis, D.H. Failure Mode and Effect Analysis: FMEA from Theory to Execution; Quality Press: Seattle, WA, USA, 2003.67. Kmenta, S.; Cheldelin, B.; Ishii, K. Assembly FMEA: A Simplified Method for Identifying Assembly Errors. In Heat Transfer;
ASME International: Houston, TX, USA, 2003; Volume 4, pp. 315–323.68. Armacost, R.; Balakrishnan, D.; Pet-Armacost, J. Design for Remanufacturability Using QFD. In Proceedings of the 11th Annual
Industrial Engineering Research Conference, Reno, NV, USA, 21–25 May 2011.

Appl. Sci. 2021, 11, 749 23 of 24
69. Kern, C.; Refflinghaus, R. Cross-disciplinary method for predicting and reducing human error probabilities in manual assemblyoperations. Total Qual. Manag. Bus. Excell. 2013, 24, 847–858. [CrossRef]
70. Di Pasquale, V.; Miranda, S.; Iannone, R.; Riemma, S. A Simulator for Human Error Probability Analysis (SHERPA). Reliab. Eng.Syst. Saf. 2015, 139, 17–32. [CrossRef]
71. Paz Barroso, M.; Wilson, J.R. HEDOMS—Human Error and Disturbance Occurrence in Manufacturing Systems: Toward thedevelopment of an analytical framework. Hum. Factors Ergon. Manuf. Serv. Ind. 1999, 9, 87–104. [CrossRef]
72. Refflinghaus, R.; Kern, C. On the track of human errors—Procedure and results of an innovative assembly planning method.Procedia Manuf. 2018, 21, 157–164. [CrossRef]
73. Kern, C.; Refflinghaus, R. Assembly-specific database for predicting human reliability in assembly operations. Total Qual. Manag.Bus. Excell. 2015, 26, 1056–1070. [CrossRef]
74. Torres, Y.; Nadeau, S.; Landau, K. Application of Human Errors Analysis in Manufacturing: A Proposed Intervention Frameworkand Techniques Selection. In Kongress der Gesellschaft für Arbeitswissenschaft; GfA-Press: Dresden, Germany, 2019.
75. Blais, G. Méthodologie de Sélection D’anti-erreur à L’assemblage par Calcul de L’efficacité et du Coût Global d’une Application.In MECHANICAL Engineering; École de Technologie Supérieure: Montréal, ON, Canada, 2011.
76. Baez, Y.A.; Rodriguez, M.A.; Limon, J.; Tlapa, D.A. Model of human reliability for manual workers in assembly lines. In Proceed-ings of the 2014 IEEE International Conference on Industrial Engineering and Engineering Management, Selangor Darul Ehsan,Malaysia, 9–12 December 2014.
77. Meister, M. Resilience in Socio-Technical Systems—A System-Theoretical Analysis of Production Using the Example of a BMWAG Engine (Translated from German). In Lehrstuhl für Ergonomie; Technische Universität München: Munich, Germany, 2014;p. 167.
78. Flick, U. Doing Triangulation and Mixed Methods; SAGE Publications Ltd.: London, UK, 2018.79. Anett, J. Hierarchical Task Analysis in Handbook of Cognitive Task Design; Hollnagel, E., Ed.; CRC Press: Boca Raton, FL, USA, 2003;
pp. 33–51.80. Embrey, D. Human Reliability SHERPA: A Systematic Human Error Reduction and Prediction Approach; Informa UK Limited: London,
UK, 2009; pp. 135–141.81. Williams, J.C. Heart—A Proposed Method for Achieving High Reliability in Process Operation by Means of Human Factors
Engineering Technology. Saf. Reliab. 2015, 35, 5–25. [CrossRef]82. Embrey, D. SHERPA: A Systematic Human Error Reduction and Prediction Approach to modelling and assessing human
reliability in complex tasks. In 22nd European Safety and Reliability annual conference (ESREL 2013); CRC Press: Amsterdam,The Netherlands, 2014.
83. Morlock, F.; Kreggenfeld, N.; Louw, L.; Kreimeier, D.; Kuhlenkoetter, B. Teaching Methods-Time Measurement (MTM) forWorkplace Design in Learning Factories. Procedia Manuf. 2017, 9, 369–375. [CrossRef]
84. Alkan, B.; Vera, D.; Ahmad, M.; Ahmad, B.; Harrison, R. A Model for Complexity Assessment in Manual Assembly Operationsthrough Predetermined Motion Time Systems. Procedia CIRP 2016, 44, 429–434. [CrossRef]
85. Zaeh, M.F.; Wiesbeck, M.; Stork, S.; Schubö, A. A multi-dimensional measure for determining the complexity of manual assemblyoperations. Prod. Eng. 2009, 3, 489–496. [CrossRef]
86. Boring, R.L. How Many Performance Shaping Factors are Necessary for Human Reliability Analysis? In Proceedings of the 10thInternational Probabilistic Safety Assessment & Management Conference (PSAM10), Seattle, WA, USA, 7–11 June 2010.
87. Hoyek, N.; Collet, C.; Di Rienzo, F.; De Almeida, M.; Guillot, A. Effectiveness of three-dimensional digital animation in teachinghuman anatomy in an authentic classroom context. Anat. Sci. Educ. 2014, 7, 430–437. [CrossRef]
88. Boeing. Maintenance Error Decision Aid (MEDA)—User’s Guide; The Boeing Company: Seattle, WA, USA, 2013; p. 73.89. Brands, J. Tightening Technology 4.0: Flexible and Transparent Production with Decentralized Intelligence. Factory Automa-
tion 2018. Available online: https://community.boschrexroth.com/t5/Rexroth-Blog/Tightening-technology-4-0-Flexible-and-transparent-production/ba-p/151 (accessed on 5 March 2019).
90. Camillo, J. Error-Proofing with Power Tools. Assembly Magazine 2010. Available online: https://www.assemblymag.com/articles/87830-error-proofing-with-power-tools (accessed on 10 May 2019).
91. Dorris, A.L.; Foote, B.L. Inspection errors and statistical quality control: A survey. AIIE Trans. 1978, 10, 184–192. [CrossRef]92. Rasmussen, J.J. Skills, rules, and knowledge; signals, signs, and symbols, and other distinctions in human performance models.
IEEE Trans. Syst. Man Cybern. 1983, 3, 257–266. [CrossRef]93. Shappell, S.A.; Wiegmann, D.A. The Human Factors Analysis and Classification System (HFACS). 2000. Available online: https:
//www.skybrary.aero/index.php/Human_Factors_Analysis_and_Classification_System_(HFACS) (accessed on 10 January 2019).94. HSE. Understanding Human Failure. 2018. Available online: http://www.hse.gov.uk/construction/lwit/assets/downloads/
human-failure.pdf (accessed on 4 January 2019).95. Kolbeinsson, A.; Lindblom, J.; Thorvald, P. Missing mediated interruptions in manual assembly: Critical aspects of breakpoint
selection. Appl. Ergon. 2017, 61, 90–101. [CrossRef] [PubMed]96. Massaiu, S. NRC: International HRA Empirical Study—Phase 1 Report (NUREG/IA-0216, Volume 1). In Technical Report November
2009; Office of Nuclear Regulatory Research US Nuclear Regulatory Commission: Rockville, MD, USA, 2018.97. Stanton, N.A.; Stevenage, S.V. Learning to predict human error: Issues of acceptability, reliability and validity. Ergonomics 1998,
41, 1737–1756. [CrossRef] [PubMed]

Appl. Sci. 2021, 11, 749 24 of 24
98. Richards, B.D. Error Probabilities and Relationships in Assembly and Maintenance of Aircraft Engines. Proc. Hum. Factors Ergon.Soc. Annu. Meet. 2018, 62, 1599–1603. [CrossRef]
99. Hodkinson, P.; Hodkinson, H. The strengths and limitations of case study research. In Proceedings of the Learning and SkillsDevelopment Agency Conference, Cambridge, UK, 27–28 February 2020.
100. Romero, D. Towards an Operator 4.0 Typology: A Human-Centric Perspective on the Fourth Industrial Revolution Technologies.In Proceedings of the CIE46, Tianjin, China, 29–31 October 2016.
101. Nadeau, S.; Landau, K. Utility, Advantages and Challenges of Digital Technologies in the Manufacturing Sector. Ergon. Int. J.2018, 2, 1–15.