The application of droplet digital PCR technology to measure ...
155
The application of droplet digital PCR technology to measure heteroplasmy levels of the mitochondrial DNA mutation m.3243A>G associated with maternally inherited diabetes and deafness A thesis submitted to the University of Manchester for the degree of Doctor of Clinical Science in the Faculty of Faculty of Biology, Medicine and Health 2021 Kevin J Colclough School of Biological Sciences
-
Upload
khangminh22 -
Category
Documents
-
view
1 -
download
0
Transcript of The application of droplet digital PCR technology to measure ...

The application of droplet digital PCR technology to measure heteroplasmy levels of the mitochondrial DNA mutation m.3243A>G associated with
maternally inherited diabetes and deafness
A thesis submitted to the University of Manchester for the degree of Doctor of Clinical Science in the Faculty of Faculty of Biology, Medicine and Health
2021
Kevin J Colclough
School of Biological Sciences

2
CONTENTS LIST OF FIGURES .................................................................................................................................. 4
LIST OF TABLES .................................................................................................................................... 5
ABBREVIATIONS .................................................................................................................................. 6
ABSTRACT ............................................................................................................................................ 8
DECLARATION ..................................................................................................................................... 9
COPYRIGHT STATEMENT ................................................................................................................... 10
ACKNOWLEDGEMENTS ..................................................................................................................... 11
Chapter 1: Introduction to Mitochondrial Disease ........................................................................... 12
1.1 Mitochondrial function ............................................................................................................. 12
1.2 The mitochondrial genome ....................................................................................................... 12
1.3 Mutations in mtDNA and mitochondrial disease ...................................................................... 14
Chapter 2: Literature Review ............................................................................................................ 19
2.1 Aims of the literature review .................................................................................................... 19
2.2 Literature review methodology ................................................................................................ 20
2.3 Literature review results ........................................................................................................... 20
2.3.1 Prevalence of m.3243A>G variant in patients affected with diabetes .............................21
2.3.2 Techniques for detecting the mtDNA m.3243A>G variant ............................................... 26
2.3.3 Extra-pancreatic features identified in diabetes patients with m.3243A>G .................... 29
2.3.4 Tissues tested & heteroplasmy ......................................................................................... 35
2.3.5 Heteroplasmy & Disease Severity ..................................................................................... 41
2.4 Conclusion ................................................................................................................................. 42
Chapter 3: Project Aims & Objectives ............................................................................................... 45
Chapter 4: Methodology ................................................................................................................... 47
4.1 Samples for ddPCR assay validation .......................................................................................... 47
4.2 Samples from patients referred for mitochondrial diabetes testing analysed as part of the
clinical cohort .................................................................................................................................... 48
4.3 Detection of m.3243A>G by ddPCR – overview of the technology .......................................... 48
4.4 Calculation of m.3243A>G heteroplasmy by ddPCR ................................................................. 52
4.5 QC requirements for ddPCR detection of the m.3243A>G mutation ....................................... 54
4.6 Verification of ddPCR PCR primers and probe design ............................................................... 55
4.7 Optimising DNA concentration and PCR annealing temperature .............................................57
4.8 Determining test precision, uncertainty of measurement, sensitivity, accuracy, specificity and
limits of detection ............................................................................................................................. 57
4.9 Acceptance criteria for the validation study ............................................................................. 60

3
4.10 ddPCR analysis of patients referred for mitochondrial diabetes testing .................................. 61
4.11 Cost comparison of ddPCR and TaqMan assays........................................................................ 61
4.12 Statistical analysis ..................................................................................................................... 62
Chapter 5: Results ............................................................................................................................. 63
5.1 Successful PCR amplification, droplet generation and specific probe binding ......................... 63
5.2 Improved droplet separation and heteroplasmy estimation with lower DNA sample
concentration and annealing temperature ...................................................................................... 64
5.3 Heteroplasmy estimates are accurate at low, intermediate and high heteroplasmy levels for a
single DNA sample concentration ..................................................................................................... 67
5.4 ddPCR estimates m.3243A>G heteroplasmy with a high degree of precision ......................... 68
5.5 ddPCR is a sensitive and specific assay for detecting the m.3243A>G mutation and accurately
determines heteroplasmy ................................................................................................................. 71
5.6 Threshold settings for positive droplet classification accounts for some ddPCR bias .............. 75
5.7 Successful validation of the ddPCR assay for m.3243A>G analysis .......................................... 77
5.8 Clinical and biological characteristics of the patient cohorts ................................................... 77
5.9 TaqMan has a limit of detection of 2% and ddPCR does not increase diagnostic yield ........... 79
5.10 A heteroplasmy level ≥2% is considered a positive result for m.3243A>G ............................... 80
5.11 Heteroplasmy levels decrease with age but can be corrected using the Newcastle formula .. 85
5.12 Heteroplasmy levels do not correlate with diabetes severity or family history ....................... 85
5.13 Heteroplasmy levels do not correlate with number of mitochondrial related conditions ....... 88
5.14 ddPCR is more expensive compared to TaqMan genotyping ................................................... 88
Chapter 6: Discussion, Conclusion & Future Work ........................................................................... 92
6.1 Discussion .................................................................................................................................. 92
6.2 Conclusion ............................................................................................................................... 104
6.3 Future work ............................................................................................................................. 104
References ...................................................................................................................................... 105
Appendix 1: A Units and C1 Credits ................................................................................................ 113
Appendix 2: HSST DClinSci Section C1 Innovation Project, Part 1– Literature Review ................... 114
Appendix 3: HSST DClinSci Section C1 Innovation Project, Part 2 – Innovation Proposal .............. 137
Appendix 4: Confirmation of successful completion of the C1 innovation project ........................ 153
Appendix 5: Completion of The Royal College of Pathologists FRCPath part 1 examination ........ 154
Appendix 6: Completion of The Royal College of Pathologists FRCPath part 2 examination ........ 155
Final word count: 29,648

4
LIST OF FIGURES
Figure 1: Mitochondrial function. ..................................................................................................... 12
Figure 2: A map of the human mitochondrial genome. ................................................................... 13
Figure 3: Clinical presentations of mitochondrial diseases. ............................................................. 15
Figure 4: Heteroplasmy causes mitochondrial bottleneck during oogenesis. .................................. 17
Figure 5. Flow diagram outlining strategy for performing PubMed literature review. .................... 21
Figure 6: Principles of digital PCR...................................................................................................... 49
Figure 7: Features of a rare mutation detection assay. .................................................................... 50
Figure 8: droplet digital PCR technique. ........................................................................................... 50
Figure 9: 1-D amplitude plot of fluorescent amplitude against droplet number. ............................ 51
Figure 10: 2-D plot of droplet fluorescence. ..................................................................................... 52
Figure 11: Relationship between fraction of negative (empty droplets) and concentration of
starting molecules. ............................................................................................................................ 53
Figure 12: 1-D plot for ddPCR primer, probe and hardware testing. ............................................... 64
Fig 13: 1D, 2D and fractional abundance plots for DNA concentration optimisation. ..................... 66
Fig. 14: Comparison of m.3243A>G heteroplasmy test results from ddPCR and tNGS
methodologies (N = 40). .................................................................................................................... 73
Fig. 14: Comparison of m.3243A>G heteroplasmy test results from ddPCR and tNGS
methodologies (N = 40). .................................................................................................................... 74
Figure 15: examples of low, intermediate and high heteroplasmy threshold settings. ................... 76
Figure 16: ddPCR heteroplasmy results of TaqMan positive and negative groups. ......................... 79
Figure 17: Pedigree of a family with a possible de novo m.3243A>G mutation. ............................. 80
Figure 18: Pedigrees of the five patients with heteroplasmy levels between 2 and 5%. ................. 84
Figure 19: Relationship between heteroplasmy level and age at testing. ........................................ 85
Figure 20: Scatter plots of age-adjusted heteroplasmy and clinical features. ................................. 86
Figure 21: Box plots of age-adjusted heteroplasmy levels and clinical features. ............................ 89
Figure 22: Comparison of patient age at time of testing and diabetes or hearing loss status. ....... 89

5
LIST OF TABLES
Table 1: Common mitochondrial DNA disorders .............................................................................. 16
Table 2: Summary of studies testing for the m.3243A>G mutation in patients with diabetes. ...... 23
Table 3: Clinical features in adult patients with m.3243A>G across seven different studies........... 32
Table 4: Clinical findings from ‘The UK MRC Mitochondrial Disease Patient Cohort Study’ ............ 32
Table 5: Summary of 28 studies measuring heteroplasmy in patients with the m.3243A>G. ......... 37
Table 6: Example calculation for determining heteroplasmy using two channel ddPCR. ................ 53
Table 7. Sequences of primers and probes used for the ddPCR assay.. ........................................... 56
Table 8: Temperature gradient settings for optimising annealing temperature. ............................. 57
Table 9: Blood DNA samples with known heteroplasmy used for the validation study. .................. 59
Table 10: Heteroplasmy levels estimated for DNA concentrations 0.003, 0.015 and 0.03ng/ul. .... 68
Table 11: Further assessment of inter-assay CV and measurement uncertainty. ............................ 69
Table 12: Further assessment of intra-assay CV. .............................................................................. 70
Table 13: ddPCR heteroplasmy measurements in the validation cohort. ........................................ 72
Table 14: Successful validation of the ddPCR assay with all acceptance criteria met ...................... 72
Table 15: clinical and biological characteristics of the m.3243A>G positive and negative groups. . 78
Table 16: Clinical characteristics of patients with heteroplasmy levels between 2 and 5%. ........... 83
Table 17: Heteroplasmy levels and number of reported clinical features. ...................................... 88
Table 18: Consumable costs for ddPCR and TaqMan genotyping assays. ........................................ 91

6
ABBREVIATIONS
ACGS Association for Clinical Genomic Science AfC Agenda for Change AID Aminoglycoside-induced deafness AS-PCR Allele-Specific Polymerase Chain Reaction ATP Adenosine triphosphate BMI Body Mass Index CI Confidence Interval CPD Copies Per Droplet CPEO Chronic Progressive External Ophthalmoplegia CSF Cerebrospinal fluid CT Computerised Tomography CV Coefficient of Variation CVA Cerebrovascular accident dCTP Deoxycytidine triphosphate DD Developmental Delay ddPCR Droplet digital Polymerase Chain Reaction DGGE Denaturing Gradient Gel Electrophoresis DM Diabetes Mellitus DNA Deoxyribonucleic acid ESRD End-Stage Renal Disease FAM 6-carboxyfluorescein FH Family History FSGS Focal Segmental Glomerulosclerosis GAD Glutamic Acid Decarboxylase GBP Great British Pounds GDM Gestational Diabetes GFR Glomerular Filtration Rate GI Gastrointestinal GLH Genomic Laboratory Hub HBA1C Glycated Haemoglobin HEX Hexachloro-fluorescein HFE Homeostatic Iron Regulator gene HLA Human Leukocyte Antigen IA2 Islet tyrosine phosphatase 2 ICA Islet Cell Autoantibodies IQR Interquartile Range JAK2 Janus Kinase 2 KSS Kearns-Sayre syndrome LADA Latent Autoimmune Diabetes in Adulthood LD Learning Difficulties LHON Leber Hereditary Optic Neuropathy LMPCR Ligation-Mediated Polymerase Chain Reaction LoA Limits of Agreement LoD Limit of Detection LVH Left Ventricular Hypertrophy MELAS Mitochondrial Encephalopathy, Lactic Acidosis and Stroke-like
episodes

7
MERRF Myoclonic Epilepsy and Ragged-Red Fibres MIDD Maternally-Inherited Diabetes and Deafness MODY Maturity Onset Diabetes of the Young MRI Magnetic Resonance Imaging MT Mutant mtDNA Mitochondrial DNA MTTL1 Mitochondrially encoded tRNA leucine 1 gene NARP Neurogenic weakness, Ataxia and Retinitis Pigmentosa NGS Next Generation Sequencing NHS National Health Service NMDAS Newcastle Mitochondrial Disease Scale for Adults NTC No Template Control OHA Oral Hyperglycaemic Agent OXPHOS Oxidative phosphorylation PCR Polymerase Chain Reaction QC Quality Control RFLP Restriction Fragment Length Polymorphism RNA Ribonucleic acid SD Standard Deviation SNHL Sensorineural hearing loss SNP Single Nucleotide Polymorphism TAT Turnaround Time TCA Tricarboxylic acid tNGS Targeted Next Generation Sequencing tRNA Transfer ribonucleic acid U Uncertainty of measurement UEC Urine Epithelial Cells VAT Value-Added Tax VIC 2′-chloro-7′phenyl-1,4-dichloro-6-carboxy-fluorescein WT Wildtype ZnT8 Zinc Transporter 8

8
ABSTRACT
The pathogenic mitochondrial DNA mutation m.3243A>G causes two syndromes; maternally
inherited diabetes and deafness (MIDD) and Mitochondrial Encephalopathy, Lactic Acidosis,
and Stroke-like episodes (MELAS). There is considerable clinical variation in these syndromes,
and although clinically distinct patients can have overlapping features. m.3243A>G is highly
heteroplasmic and mutation load varies significantly between different tissues and between
individuals. Heteroplasmy levels have been shown to positively correlate with disease burden
in MELAS, and very low levels of heteroplasmy (1%) have been considered diagnostic.
However the effect of low level heteroplasmy on diagnostic test sensitivity is unknown and
the association between heteroplasmy and clinical traits has rarely been studied in patients
with MIDD.
We developed a quantitative droplet digital PCR assay to measure m.3243A>G heteroplasmy
to 0.01% in blood. We then tested 190 patients from suspected MIDD families previously
tested by a TaqMan genotyping assay capable of detecting ≥5% heteroplasmy. The aim was
to determine if cases had been missed by TaqMan due to low heteroplasmy, and to look for
an association between heteroplasmy and clinical features in MIDD patients.
We confirmed all previous positive TaqMan results and did not identify any additional low
heteroplasmy cases in the negative patients. The mean heteroplasmy level was 24.9%
±13.9%. All positive patients had heteroplasmy >2% and all negative patients <1%, thereby
defining cut-offs for reporting a positive result and re-defining the true limit of detection of
the TaqMan assay as 2%. A grey-zone between 1 and 2% heteroplasmy was identified
representing clinical uncertainty that requires confirmatory testing of other tissues. No
significant association was seen between age-adjusted heteroplasmy and age of diabetes
diagnosis, HbA1c, diabetes status, deafness status and family history. Droplet digital PCR was
considerably more expensive to perform compared to TaqMan genotyping (1.82 GBP per
sample for TaqMan versus 39.60 GBP for ddPCR).
The lack of a significant diagnostic and clinical benefit and the high cost of ddPCR suggests a
low benefit to cost ratio in our cohort. It is therefore unlikely that ddPCR will replace the
existing TaqMan genotyping assay as the Exeter laboratory’s NHS funded routine diagnostic
test for m.3243A>G. There may be a role for ddPCR in a research setting, although recent
reconfigurations to NHS genomic testing services will likely result in the replacement of most
single variant genotyping assays with next generation sequencing over time.

9
DECLARATION
Elements of the work to validate the ddPCR assay (specifically the test methodology and
preliminary results of optimising the assay) have been written and submitted as part of
coursework by Adedayo Shonekan, an undergraduate student undertaking a BSc (Hons.)
Medical Sciences degree at the University of Exeter Medical School. Ade was based at the
Exeter Genomics Laboratory at the Royal Devon & Exeter Hospital, Exeter, UK as part of
her Professional Training Year (PTY) and assisted me with the ddPCR laboratory work.
Ade assisted with removing DNA specimens from freezers, performing DNA quantification
using Qubit, performing robotic DNA dilutions and carrying out ddPCR laboratory tasks for
the initial blood DNA validation study.
Neil Goodman, Ben Bunce and Richard Caswell provided technical guidance on optimising
ddPCR conditions and provided information on consumables and staff times for the cost
comparison work.
Assistance with statistical analysis using the STATA software package was provided by Dr
Kash Patel.
Kevin Colclough was solely responsible for all other aspects of the study including the
literature review, design of the validation and the study, undertaking searches to identify
patient samples for inclusion in the study, undertaking ddPCR analysis of the TaqMan
tested cohort, analysis and interpretation of all ddPCR data, undertaking the cost
comparison analysis and preparation of the thesis.

10
COPYRIGHT STATEMENT
i. The author of this thesis (including any appendices and/or schedules to this thesis)
owns certain copyright or related rights in it (the “Copyright”) and s/he has given The
University of Manchester certain rights to use such Copyright, including for administrative
purposes.
ii. Copies of this thesis, either in full or in extracts and whether in hard or electronic copy,
may be made only in accordance with the Copyright, Designs and Patents Act 1988 (as
amended) and regulations issued under it or, where appropriate, in accordance with
licensing agreements which the University has from time to time. This page must form
part of any such copies made.
iii. The ownership of certain Copyright, patents, designs, trademarks and other
intellectual property (the “Intellectual Property”) and any reproductions of copyright
works in the thesis, for example graphs and tables (“Reproductions”), which may be
described in this thesis, may not be owned by the author and may be owned by third
parties. Such Intellectual Property and Reproductions cannot and must not be made
available for use without the prior written permission of the owner(s) of the relevant
Intellectual Property and/or Reproductions.
iv. Further information on the conditions under which disclosure, publication and
commercialisation of this thesis, the Copyright and any Intellectual Property and/or
Reproductions described in it may take place is available in the University IP Policy (see
http://documents.manchester.ac.uk/
DocuInfo.aspx?DocID=24420), in any relevant Thesis restriction declarations deposited in
the University Library, The University Library’s regulations (see
http://www.library.manchester.ac.uk/about/regulations/) and in the University’s policy
on Presentation of Theses

11
ACKNOWLEDGEMENTS
First and foremost I’d like to thank my colleague and dear friend Dr Kashyap Patel for all of his
tireless advice, guidance, mentorship and support during a difficult year with many
competing interests. He is a unique and amazing individual and the best clinician scientist I
have ever had the pleasure to work with.
I would also like to thank my supervisor Bill Newman for his guidance, support, patience and
gentle pushing to complete this thesis. I’d like to thank my external supervisor and manager
Sian Ellard for allowing me to undertake this project within the Exeter genomics laboratory
and for supporting me in balancing highly demanding diagnostic and professional
development activities over the past 5 years.
A big thank you goes to Ade Shonekan who assisted me with the ddPCR laboratory work as
part of her placement training year at the Exeter genomics year. I was concerned that asking
her help to remove from our freezers and serially dilute over 200 DNA samples would result
in a career change so I’m very pleased to hear she has remained in medical science!
A big thanks also to Neil Goodman, Ben Bunce and Dr Richard Caswell for their invaluable
knowledge and expertise on ddPCR technology, and for their assistance with the preliminary
validation work on blood and urine samples.
Undertaking a qualification like this whilst meeting the demands of very busy diagnostic
service would not have been possible without the help and support from my amazing team of
scientists that help run the monogenic diabetes service at the Exeter genomics laboratory.
Jayne, Rachel and Ana have worked very hard to provide an amazing service for patients and
clinicians which has enabled me to complete this thesis alongside performing a full-time
principal clinical scientist role and becoming a father. I owe them all several years’ worth of
novel variant interpretation!
And finally I dedicate this thesis to my wife Catherine and son Noah. Catherine your infinite
love, support, patience and understanding as enabled me to complete something I never
thought in my lifetime I could or would achieve. Thank you for being an amazing mother
during my dodging of parental duties whilst writing this thesis over the last few months – I
promise never to write a thesis during a global pandemic again. I’m guessing after this I’m
back on nappy changing duty?

12
Chapter 1: Introduction to Mitochondrial Disease
1.1 Mitochondrial function
The majority of cellular ATP is produced from a process called oxidative phosphorylation
and occurs within subcellular organelles called Mitochondria (van der Giezen and Tovar,
2005). Other biochemical pathways such as the tricarboxylic acid (TCA) and urea cycles
are also located in mitochondria. Mitochondria also play a central role in apoptotic cell
death (Newmeyer and Ferguson-Miller, 2003), the regulation of cytosolic free calcium
concentration (Pozzan et al., 2000), and redox signalling through mitochondrial reactive
oxygen species (Murphy, 2009) (figure 1).
Figure 1: Mitochondrial function. Some of the many roles of mitochondria in cell function and aspects of mitochondrial biogenesis are illustrated, including oxidative phosphorylation, apoptosis, redox signalling and the regulation of cytosolic calcium concentration. Taken from Smith et al 2012 Trends in Pharmacological Sciences 33: 341 – 352 (Smith et al., 2012).
1.2 The mitochondrial genome
The majority (~1500) of mitochondrial proteins are transcribed from nuclear genes,
translated to the cytoplasm and imported into the mitochondria (figure 1). The genes

13
required for assembly of the oxidative phosphorylation (OXPHOS) machinery are encoded
on the mitochondria’s own DNA (mtDNA). mtDNA is a circular, double stranded DNA
molecule approximately 16.6kb in length. It encodes 37 genes including 13 essential
polypeptides for the oxidative phosphorylation system, two ribosomal RNAs (12S and
16S) and 22 transfer RNAs (tRNAs) (Anderson et al., 1981) (figure 2).
Figure 2: A map of the human mitochondrial genome. Schematic diagram of the 16.6 kb circular, double-stranded human mitochondrial genome. The outer circle represents the heavy (H) strand of the genome and the inner circle the light (L) strand. Genes encoding subunits of respiratory chain complex I are shown in blue, the MT-CYB gene of complex III in green, catalytic subunits of complex IV in red and those of complex V in yellow. The two ribosomal RNAs are shown in purple and the 22 transfer RNAs represented as black bars and denoted by their single-letter abbreviations. The D-loop is the only non-coding region and contains the control elements for mtDNA transcription and replication. Adapted from Greaves et al 2012 J Pathol 226: 274–286 (Greaves et al., 2012).
There are a number of important characteristics that distinguish the mitochondrial
genome from the nuclear genome. mtDNA is strictly maternally inherited, which results

14
in a characteristic inheritance pattern for mitochondrial genetic disease with transmission
through the maternal lineage and all offspring of affected mothers inheriting mutated
mtDNA. Each mitochondrion contains multiple copies of mtDNA (on average 2-10
copies), and the number of mitochondria varies between different cell types depending
on the energy requirements of the tissue (low in blood, high in muscle and nerves) (Taylor
and Turnbull, 2005). So the number of mtDNA copies can vary from a few hundred and
many tens of thousands depending on the different tissue types. There are very few non-
coding nucleotides; genes do not contain introns and have few non-coding nucleotides
between them (Anderson et al., 1981).
The mitochondrial genome is situated in close proximity to the OXPHOS system and is
prone to damage from reactive oxygen species generated during energy production. This,
in conjunction with the low efficiency of mtDNA repair pathways, results in a higher
mutation frequency compared to nuclear DNA (Brown et al., 1979).
1.3 Mutations in mtDNA and mitochondrial disease
At least 673 different disease-causing point mutations have been reported (Lott, 2017).
Half of the disease-causing point mutations published to date are found in tRNA genes
(330 located in tRNA genes and 343 located in coding and control regions) despite these
genes accounting for only 5% of the mitochondrial genome. Mutations in RNA genes are
likely to impair mitochondrial synthesis, whereas mutations in protein coding genes affect
respiratory chain complexes. Point mutations are usually maternally inherited.
Approximately 250 different single or multiple disease-causing deletions of mtDNA have
been reported. Deletions are frequently sporadic rather than inherited (Chinnery et al.,
2004) and are likely to arise due to DNA repair errors in regions flanked by tandem repeat
sequences (Krishnan et al., 2008; Schon et al., 1989).
Mitochondrial diseases are clinically heterogeneous with patients exhibiting a wide range
of clinical features that and can occur at any age (McFarland et al., 2010). Mutations
impair OXPHOS mediated energy production resulting in systemic lactic acidosis and a
failure to meet cellular energy demands. This results in the multi-system disease observed
in virtually all mitochondrial disorders. Tissues with higher energy demands are therefore
more severely affected, and the clinical features associated with mitochondrial disease
frequently involve nerves, skeletal muscles and the heart (figure 3). Additional tissues

15
affected include pancreatic beta cells (causing diabetes), cochlear hair cells (causing
deafness) or the renal tubules (causing kidney disease).
Figure 3: Clinical presentations of mitochondrial diseases. The clinical presentation of mitochondrial diseases is variable between patients and can encompass dysfunction of any organ or tissue. Broadly speaking, the clinical presentations have non-neurological or neurological characteristics and usually involve multiple organ systems. Taken from Gorman et al 2016 Nat Rev Dis Primers 2: 16080 (Gorman et al., 2016)
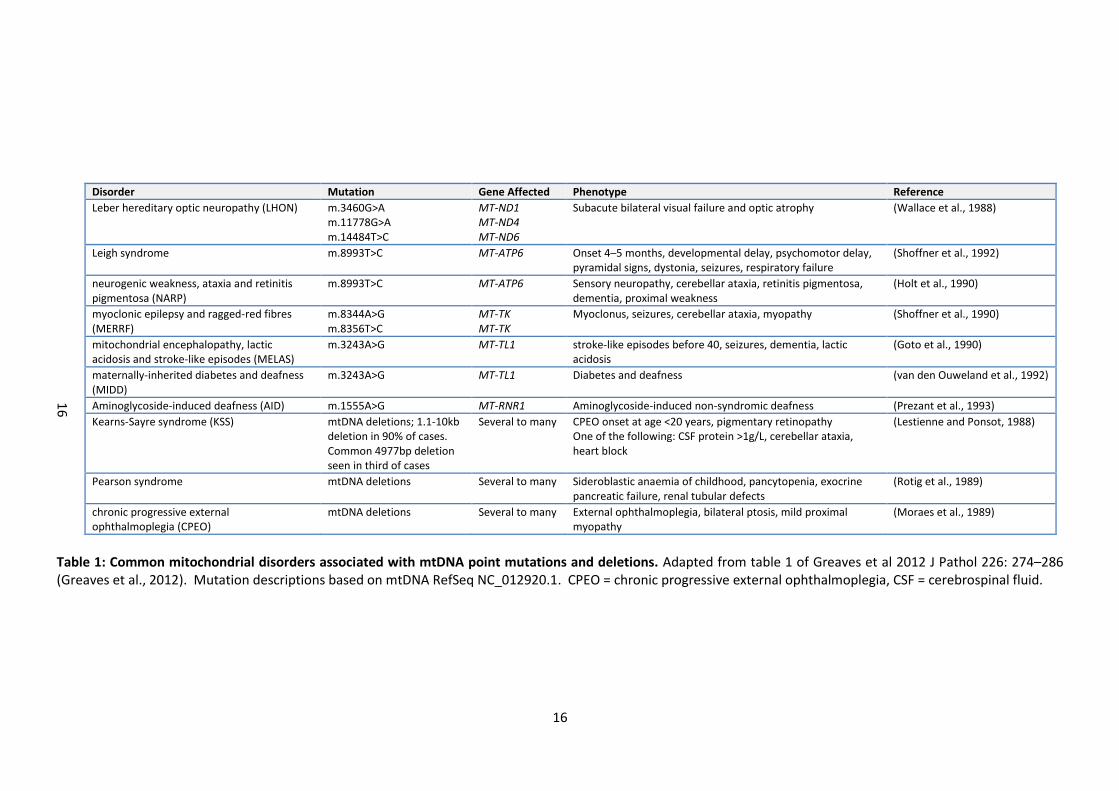
A number of well-defined mtDNA syndromes have been described (table 1) but patients
rarely fit into a particular clinically defined group. Clinical heterogeneity means that
diagnosis, management and counselling for at risk unaffected relatives is very difficult.
Genotype based classification can be helpful.
16
Disorder Mutation Gene Affected Phenotype Reference
Leber hereditary optic neuropathy (LHON) m.3460G>A m.11778G>A m.14484T>C
MT-ND1 MT-ND4 MT-ND6
Subacute bilateral visual failure and optic atrophy (Wallace et al., 1988)
Leigh syndrome m.8993T>C MT-ATP6 Onset 4–5 months, developmental delay, psychomotor delay, pyramidal signs, dystonia, seizures, respiratory failure
(Shoffner et al., 1992)
neurogenic weakness, ataxia and retinitis pigmentosa (NARP)
m.8993T>C MT-ATP6 Sensory neuropathy, cerebellar ataxia, retinitis pigmentosa, dementia, proximal weakness
(Holt et al., 1990)
myoclonic epilepsy and ragged-red fibres (MERRF)
m.8344A>G m.8356T>C
MT-TK MT-TK
Myoclonus, seizures, cerebellar ataxia, myopathy (Shoffner et al., 1990)
mitochondrial encephalopathy, lactic acidosis and stroke-like episodes (MELAS)
m.3243A>G MT-TL1 stroke-like episodes before 40, seizures, dementia, lactic acidosis
(Goto et al., 1990)
maternally-inherited diabetes and deafness (MIDD)
m.3243A>G MT-TL1 Diabetes and deafness (van den Ouweland et al., 1992)
Aminoglycoside-induced deafness (AID) m.1555A>G MT-RNR1 Aminoglycoside-induced non-syndromic deafness (Prezant et al., 1993)
Kearns-Sayre syndrome (KSS) mtDNA deletions; 1.1-10kb deletion in 90% of cases. Common 4977bp deletion seen in third of cases
Several to many CPEO onset at age <20 years, pigmentary retinopathy One of the following: CSF protein >1g/L, cerebellar ataxia, heart block
(Lestienne and Ponsot, 1988)
Pearson syndrome mtDNA deletions Several to many Sideroblastic anaemia of childhood, pancytopenia, exocrine pancreatic failure, renal tubular defects
(Rotig et al., 1989)
chronic progressive external ophthalmoplegia (CPEO)
mtDNA deletions Several to many External ophthalmoplegia, bilateral ptosis, mild proximal myopathy
(Moraes et al., 1989)
Table 1: Common mitochondrial disorders associated with mtDNA point mutations and deletions. Adapted from table 1 of Greaves et al 2012 J Pathol 226: 274–286 (Greaves et al., 2012). Mutation descriptions based on mtDNA RefSeq NC_012920.1. CPEO = chronic progressive external ophthalmoplegia, CSF = cerebrospinal fluid.
16

17
Because mtDNA disease is both clinically and genetically heterogeneous, exact prevalence
figures are difficult to obtain. A study of genetically confirmed mtDNA disease in adults
in the North East of England estimated the prevalence to be 9.6 cases per 100,000 with an
additional 10.8 per 100,000 individuals being at risk first-degree relatives (Gorman et al.,
2015). Disease prevalence in any population is likely to be significantly underestimated
given the high frequency of pathogenic mtDNA mutations in the population (about 1 in
200 individuals) (Elliott et al., 2008; Manwaring et al., 2007; Manwaring et al., 2008) and
many individuals harbouring pathogenic mtDNA mutations will not be clinically affected
(Bitner-Glindzicz et al., 2009; Vandebona et al., 2009).
Since mitochondria are numerous within cells and contain multiple copies of mtDNA,
mutated DNA molecules may co-exist with wild-type molecules within the same cell. This
is known as heteroplasmy (Larsson and Clayton, 1995) (figure 4).
Figure 4: Heteroplasmy causes mitochondrial bottleneck during oogenesis. The transmission of heteroplasmic mitochondrial DNA (mtDNA) mutations from mother to offspring is complicated by the genetic bottleneck during development. This bottleneck occurs owing to a profound dilution of mtDNA during the formation of the primordial germ cell, followed potentially by selective replication of mtDNA genomes. This can lead to profoundly different levels of heteroplasmy in different mature oocytes of women with heteroplasmic mtDNA mutations and is an important consideration when counselling mothers with heteroplasmic mtDNA mutations about the risks of having offspring with mitochondrial diseases. Taken from Gorman et al 2016 Nat Rev Dis Primers 2: 16080 (Gorman et al., 2016).

18
High heteroplasmy refers to cells with high levels of mutant mtDNA and low levels of
wildtype mtDNA, and vice-versa for low heteroplasmy. Heteroplasmy is very important
for determining cellular phenotype; cells become respiratory deficient once the
heteroplasmy level reaches a certain threshold which varies for different types of
mutation and different cell types. A high percentage (>50%) of mutated mtDNA is
typically required, but this can be much higher (>90%) for some tRNA gene mutations
(Boulet et al., 1992; Chomyn et al., 1992). Gene deletions typically manifest cellular
defects when there is 50-60% deleted mtDNA (Hayashi et al., 1991; Mita et al., 1990;
Moraes et al., 1992; Shoubridge, 1994). Heteroplasmy is responsible for the variable
phenotype, clinical severity and expressivity of mtDNA disease; for example, patients with
Leigh’s syndrome can have heteroplasmy levels around 80-90% that correlate with a
more clinically severe form of the disease.

19
Chapter 2: Literature Review
2.1 Aims of the literature review
Given that the level of mutated mtDNA can vary between different cell types, and that
this level is important in determining whether cells will become respiratory deficient,
what are the implications of heteroplasmy for diagnostic genetic testing for mtDNA
mutations? Will the sensitivity of the assay used to detect the mutation have a significant
impact on the test result? Do we need a highly sensitive assay to detect very low levels of
mtDNA mutations, or is there no clinical utility for this if low levels are not associated with
clinical disease? Does knowing the level of heteroplasmy in the cell type being tested
have any usefulness in determining the clinical phenotype or disease burden in the
patient?
This literature review will provide some answers to these questions with respect to one
specific mtDNA variant; the m.3243A>G variant associated with the MIDD and MELAS
syndromes. This variant has been selected since it is routinely tested in patients with
diabetes by the Exeter Molecular Genetics Laboratory as part of the laboratory’s
monogenic diabetes testing service. Analysis is performed using a TaqMan genotyping
assay with an estimated limit of detection of about 5% heteroplasmy. Will there be a sub-
group of patients with m.3243A>G related disease that have tested negative due to a
heteroplasmy level that is clinically significant but below the limit of detection of the
assay? If so, what are a most appropriate levels of heteroplasmy to classify a result as
positive or negative and therefore determine whether a patient receives a diagnosis of
mitochondrial diabetes? Will the clinical features and family history in patients with a
positive m.3243A>G result associate with the level of heteroplasmy in blood?
The review will focus on peer reviewed research undertaken on the m.3243A>G variant
but specifically relating to patients affected with diabetes. The review will consider
articles relating to the prevalence of the m.3243A>G variant in populations affected with
diabetes, the methods used to detect the variant and their sensitivity, the additional
extra-pancreatic clinical features seen in patients with m.3243A>G and diabetes, the
clinical utility of identifying the m.3243A>G variant in patients with diabetes, variation in
heteroplasmy between different cell types and association between heteroplasmy and
clinical phenotype. If the review highlights that low level heteroplasmy (<5%) is present

20
in patients with m.3243A>G related disease then this will provide evidence for the need
to implement a more sensitive assay to test MIDD referrals to the Exeter Laboratory. A
review of the testing methodologies used in the studies will look for suitable assays to
adopt, or whether more sensitive assays exist that have yet to be used for the detection
of the m.3243A>G variant. And importantly the review will also determine if there is a
relationship between the level of heteroplasmy and clinical phenotype that has any
clinical utility.
2.2 Literature review methodology
The PubMed database was searched for peer reviewed articles relating to the m.3243A>G
variant in patients affected with diabetes. Search terms were devised to cover a range of
ways in which the m.3243A>G variant might be written in the literature.
The disease specific terms ‘diabetes’ and ‘MIDD’ were combined using the operator AND
with various descriptions of the m.3243A>G to give the following search terms:
(*3243*[Title/Abstract] AND diabetes[Title/Abstract]) OR (*3243*[Title/Abstract] AND
MIDD[Title/Abstract]) OR (*MTTL1*[Title/Abstract] AND diabetes[Title/Abstract]) OR
(*MTTL1*[Title/Abstract] AND MIDD[Title/Abstract]) OR (*MT-TL1*[Title/Abstract] AND
diabetes[Title/Abstract]) OR (*MT-TL1*[Title/Abstract] AND MIDD[Title/Abstract] OR
(tRNALeu(UUR)[Title/Abstract] AND diabetes[Title/Abstract]) OR
(tRNALeu(UUR)[Title/Abstract] AND MIDD[Title/Abstract]).
All terms were searched within the title or abstract of the article. Articles were excluded
if they were not in English or if a full text version was not available. Publication date
range was up to June 2018. Articles were excluded if they did not relate to the
m.3243A>G variant in patients with diabetes, contained no methodological details or
related to functional studies. Review articles and audits were also excluded.
2.3 Literature review results
A total of 223 citations were obtained from the PubMed database using the search
criteria described in the Methods section 2.2. After reviewing the titles and abstracts,
136 articles did not meet the inclusion criteria and were discarded. After reading the full
text of the remaining articles, 7 were excluded leaving 108 for review (figure 5).

21
Figure 5. Flow diagram outlining strategy for performing PubMed literature review.
2.3.1 Prevalence of the mitochondrial m.3243A>G variant in patients affected with
diabetes
A total of 64 studies were published determining the prevalence of the m.3243A>G
variant in patients affected with diabetes (Table 2). Asian populations were screened in
41/64 studies, with Japan accounting for 45% of all studies in the review. There was a
wide variation in the prevalence of the variant across the studies (0 to 60%). Prevalence
was dependent on the ethnicity of the population studied, the clinical selection criteria of
the cohort tested and the sensitivity of the assay used. The mean prevalence across
studies with isolated diabetes cohorts was higher in Asian populations compared to
European populations (1.5% vs 0.6%). The highest prevalence was seen in the Japanese
population where the variant was detected in 1.5% of diabetes patients.

22
The variant was detected in about 1% of patients initially diagnosed with type 2 diabetes
but very rarely identified in patients with typical features of type 1 diabetes. However
three studies detected the variant in 5% of patients with an atypical diagnosis of insulin
treated type 1 diabetes (negative auto-antibodies, non-ketotic at presentation or not
treated with insulin at diagnosis) suggesting that a high prevalence is seen in patients
with severe insulin deficiency (Lee et al., 2001; Ohkubo et al., 2001; Yanagisawa et al.,
1995).
Prevalence in cohorts of patients with diabetes and deafness was higher compared to
isolated diabetes cohorts regardless of ethnic population studied (5% vs 1%). Detection
of the variant was 60% in Japanese patients with diabetes and deafness (Kadowaki et al.,
1994). In this early study of MIDD the authors described the hearing loss as sensory and
typically occurring after the diagnosis of diabetes. The hearing loss phenotype in MIDD is
now well characterised. It is bilateral, sensorineural and progressive, typically affecting
higher frequencies, and is thought to be due to atrophy of the cochlear striae vascularis
(Chinnery et al., 2000). Hearing loss typically develops in early adulthood, and is more
frequently reported to precede the onset of diabetes (van den Ouweland et al., 1995).
Hearing loss deterioration is bilateral and can be rapid or slowly progressive, with males
more commonly affected and a severe and faster progressing hearing loss (Uimonen et
al., 2001). Deafness appears to be a clinical feature that significantly increases the
likelihood of detecting the variant compared to diabetes alone. Other clinical features
related to the m.3243A>G variant were used to select patients for testing; high
frequencies of the variant were observed in patients with diabetes and end stage renal
disease or neurological features associated with the mitochondrial encephalomyopathy,
lactic acidosis and stroke-like episodes (MELAS) phenotype (Iwasaki et al., 2001; Suzuki et
al., 2003). A higher prevalence was also likely when cohorts were selected with a
maternal family history of diabetes or deafness (Fukui et al., 1997; Mazzaccara et al.,
2012; t'Hart et al., 1994). These could be features that in addition to deafness would help
to identify patients most likely to harbour the m.3243A>G variant.

23
Table 2: Summary of studies testing for the m.3243A>G mutation in patients with diabetes.
Author Year Population Diabetes Phenotype Additional Selection Criteria Number of patients tested
Positive cases
Prevalence Detection Method
(Oka et al., 1993) 1993 Japan LADA None 27 3 11.1 PCR & RFLP & Southern Blotting
Oka et al., 1993) 1993 Japan Type 2 DM None 188 5 2.7 PCR & RFLP & Southern Blotting
(Lehto et al., 1999) 1999 Sweden Type 1 DM & Type 2 DM None 115 3 2.6 PCR & RFLP & radiolabelling
(Otabe et al., 1994) 1994 Japan Type 1 DM & Type 2 DM None 550 6 1.0 PCR & RFLP
(Kadowaki et al., 1994) 1994 Japan Type 1 DM None 85 0 0.0 PCR & RFLP
Kadowaki et al., 1994) 1994 Japan Type 2 DM None 100 2 2.0 PCR & RFLP
Kadowaki et al., 1994) 1994 Japan Type 2 DM Deafness 5 3 60.0 PCR & RFLP
(Katagiri et al., 1994) 1994 Japan Type 1 DM & Type 2 DM None 300 4 1.3 PCR & RFLP
(Vionnet et al., 1993) 1993 France Type 1 DM None 267 5 1.9 PCR & RFLP
Vionnet et al 1993 France Type 2 DM None 90 0 0.0 PCR & RFLP
(Smith et al., 1999) 1999 UK Type 2 DM Deafness or FH of deafness 201 10 5.0 PCR & RFLP
(Holmes-Walker et al., 1998) 1998 Australia Type 2 DM None 205 1 0.5 PCR & RFLP
(Yamagata et al., 2000) 2000 Japan Type 2 DM Deafness & ESRD 158 1 0.6 PCR & RFLP
(Iwasaki et al., 2001) 2001 Japan Type 2 DM ESRD 135 8 5.9 PCR & RFLP
(Ohkubo et al., 2001) 2001 Japan Atypical Type 1 DM None 39 2 5.1 PCR & RFLP
Ohkubo et al 2001 Japan Type 2 DM None 276 2 0.7 PCR & RFLP
Ohkubo et al 2001 Japan GDM None 13 0 0.0 PCR & RFLP
(Tsukuda et al., 1997) 1997 Japan Type 1 DM & Type 2 DM None 440 7 1.6 PCR-RFLP & Southern Blotting
(Suzuki et al., 2003) 2003 Japan Type 2 DM None 180 2 1.1 AS-PCR & RFLP
Suzuki et al 2003 Japan Type 2 DM Leg symptoms
91 9 9.8 AS-PCR & RFLP
(Yanagisawa et al., 1995) 1995 Japan Atypical Type 1 DM None 55 3 5.5 SDS-PAGE
23

24
Table 2: Summary of studies testing for the m.3243A>G mutation in patients with diabetes. Author Year Population Diabetes Phenotype Additional Selection Criteria Number of
patients tested
Positive cases
Prevalence Detection Method
Yanagisawa et al 1995 Japan Type 2 DM None 102 6 6.0 SDS-PAGE
Yanagisawa et al 1995 Japan GDM None 46 3 6.5 SDS-PAGE
(Lee et al., 2001) 2001 Korea Atypical Type 1 DM None 56 3 5.4 PCR & RFLP
(Odawara et al., 1995) 1995 Japan Type 1 DM None 94 0 0.0 PCR & RFLP
Odawara et al 1995 Japan Impaired Glucose Tolerance None 24 1 4.0 PCR & RFLP
(Saker et al., 1997) 1997 UK Type 2 DM None 500 0 0.0 PCR & RFLP
Saker et al 1997 UK GDM None 50 0 0.0 PCR & RFLP
Saker et al 1997 UK Type 2 DM First degree FH of DM 748 2 0.3 PCR & RFLP
(Abad et al., 1997) 1997 USA Paed Type 1 DM None 270 0 0.0 PCR & RFLP
(t'Hart et al., 1994) 1994 Netherlands Type 2 DM None 473 2 0.4 PCR & RFLP
t’Hart et al 1994 Netherlands Type 2 DM Deafness and 2 generation maternal FH 28 3 11.0 PCR & RFLP
(Malecki et al., 2001) 2001 Poland Type 2 DM None 127 0 0.0 PCR & RFLP
Malecki et al 2001 Poland GDM None 12 0 0.0 PCR & RFLP
(Martin-Kleiner et al., 2004) 2004 Croatia Type 2 DM None 22 2 9.0 PCR & RFLP
(Uchigata et al., 1996) 1996 Japan Type 1 DM None 568 0 0.0 PCR & RFLP
(Matsuura et al., 1999) 1999 Japan Type 1 DM None 155 0 0.0 PCR & RFLP
(Kishimoto et al., 1995) 1995 Japan Type 1 DM None 64 0 0.0 PCR & RFLP
Kishimoto et al 1995 Japan Type 2 DM None 214 6 2.8 PCR & RFLP
(Ng et al., 2000) 2000 Hong Kong Type 1 DM & Type 2 DM Diagnosed <40 years and FH 219 4 1.8 PCR & RFLP
(Danawati et al., 2002) 2002 Indonesia Type 1 DM & Type 2 DM None 128 0 0.0 PCR & RFLP
(Sepehrnia et al., 1995) 1995 Pima Indian Type 1 DM & Type 2 DM None 148 0 0.0 PCR-RFLP & Southern Blotting
(Klemm et al., 2001) 2001 Germany Type 2 DM FH of deafness or DM
122 1 0.8 PCR & RFLP
(Newkirk et al., 1997) 1997 Type 2 DM maternal DM or deafness or MELAS features
445 2 0.5 PCR & RFLP
24

25
Table 2: Summary of studies testing for the m.3243A>G mutation in patients with diabetes. FH = Family History, DM = Diabetes Mellitus, MODY = Maturity Onset Diabetes of the Young, ESRD = End Stage Renal Disease
Author Year Population Diabetes Phenotype Additional Selection Criteria Number of patients tested
Positive cases
Prevalence Detection Method
(Bouhaha et al., 2010) 2010 Tunisia Type 1 DM None 80 1 1.3 PCR & RFLP
Bouhaha et al 2010 Tunisia Type 2 DM None 200 2 1.0 PCR & RFLP
(Chuang et al., 1995) 1995 Taiwan Type 2 DM Two or more siblings affected with DM 23 1 4.3 PCR & RFLP
(Fukui et al., 1997) 1997 Type 1 DM & Type 2 DM Deafness and a mother affected with DM 14 3 21.4 PCR & RFLP
(Imagawa et al., 1995) 1995 Type 1 DM None 18 0 0.0 PCR & RFLP
(Ji et al., 2001) 2001 China Type 2 DM None 716 3 0.4 PCR & RFLP
(Lee et al., 1997) 1997 Korea Type 1 DM & Type 2 DM Randomly selected 503 1 0.2 PCR & RFLP
(Martikainen et al., 2013) 2013 Finland Type 1 DM & Type 2 DM Randomly selected 299 3 1.0 PCR & RFLP
(Mazzaccara et al., 2012) 2012 Italy Type 2 DM Deafness & maculopathy and a Maternal FH of deafness or DM or maculopathy
11 1 9.1 Sanger Sequencing & RT-PCR (TaqMan)
(Mkaouar-Rebai et al., 2007) 2007 Tunisia Type 2 DM None 28 0 0.0 PCR & RFLP
Mkaouar-Rebai et al 2007 Tunisia Type 2 DM Deafness 4 0 0.0 PCR & RFLP
(Suzuki et al., 2005) 2005 Japan Type 1 DM None 13 13 100.0 RT-PCR (TaqMan)
(Urata et al., 1998) 1998 Japan Type 1 DM & Type 2 DM Randomly selected 233 2 0.9 LMPCR & RFLP
(Wang et al., 2013) 2013 Chinese Han Type 2 DM None 770 13 2.2 PCR & RFLP
(Yorifuji et al., 2012) 2012 Japan Type 2 DM Autosomal dominant family history of DM
80 1 1.3 PCR & RFLP
(Naveed et al., 2009) 2009 India Type 2 DM None 23 0 0.0 PCR & RFLP
Naveed et al 2009 India Type 2 DM Deafness 27 0 0.0 PCR & RFLP
(Ang et al., 2016) 2016 Asia Type 2 DM (MODY) Dominant FH 84 2 2.4 RT-PCR (TaqMan)
(Katulanda et al., 2008) 2008 Sri Lanka Type 1 DM & Type 2 DM Randomly selected young adult DM 994 9 0.9 RT-PCR (TaqMan)
(Singh et al., 2006) 2006 UK Type 2 DM Negative testing by PCR & RFLP 230 1 0.4 RT-PCR (TaqMan)
Total: 12485 167 1.3
25

26
2.3.2 Techniques for detecting the mtDNA m.3243A>G variant
Table 2 also lists the various detection methods used in the screening studies.
The most commonly used assay was a Polymerase Chain Reaction (PCR) and restriction
fragment length polymorphism (RFLP) technique which was employed by 89% of the
studies. A PCR product is generated that incorporates the m.3243A locus, and the
product is incubated with a DNA endonuclease (usually Apa1) that specifically cuts the
PCR product when the m.3243A>G variant is present (Fukui et al., 1997). This generates
two shorter DNA fragments that can be separated by gel electrophoresis and visualised
using a specific DNA staining technique such as ethidium bromide and UV imaging. The
advantage of this technique is that it is technically very straightforward to perform and
does not require expensive equipment (only a thermal cycler and gel electrophoresis
equipment are needed). The disadvantage is that it has fairly low sensitivity and accurate
determination of heteroplasmy is difficult (Smith et al., 1997). Sensitivity is likely to be 5-
10% although some authors claim to achieve levels down to 2-3% (Lee et al., 1997; Ng et
al., 2000). A more sensitive variation on the PCR-RFLP technique uses radiolabelled dCTP
nucleotides and has been reported to detect heteroplasmy levels down 1% (Smith et al.,
1997), but the associated risks and costs preclude this technique from routine diagnostic
use.
Estimation of heteroplasmy by PCR-RFLP can be influenced by variation in PCR efficiency
(due to template, primer or Taq polymerase quality, cycling conditions, allelic drop-out or
poor primer design), endonuclease enzyme activity and staining efficiency (Singh et al.,
2006; Smith et al., 1997). It can also be very subjective as the value is determined by
visually comparing staining intensity against a control and making an estimate. Early
studies using RFLP rarely considered heteroplasmy and that the limits of
detection/sensitivity of the technique might affect estimates of prevalence. It is
therefore likely that studies using PCR & RFLP techniques will underestimate prevalence
since low level heteroplasmy will not be detected.
Five studies employed techniques with significantly higher sensitivity compared to PCR &
RFLP. (Suzuki et al., 2005) used a real-time PCR assay and TaqMan probes to test for the
m.3243A>G variant in 13 patients with type 1 DM and 192 healthy controls. The variant
was detected in all Type 1 DM patients, but at a very low level of heteroplasmy (average

27
was 0.033 ± 0.014% SD). This was higher compared to healthy controls where average
heteroplasmy levels were 0.004-0.005%. No statistical analysis was performed to
determine if this difference was significant. 12/13 type 1 DM patients had a
heteroplasmy level below 0.05%. The other type 1 DM patient had a heteroplasmy level
of 0.075% and a family history of diabetes affecting mother (type 2 DM) and a sibling
(type 2 DM). The level of heteroplasmy in the mother was 0.06% but the sibling was not
available for testing. The authors speculated that the higher levels in type 1 DM patients
were due to an increased oxidative stress caused by long-term hyperglycaemia, but did
not conclude that the variant was a cause of diabetes in these patients. However they
did consider the variant to be of clinical significance in the patient with a maternal family
history of diabetes despite no evidence provided to exclude type 1 DM in these patients.
Without clear criteria for diagnosis of type 1 DM in these patients (i.e. antibody and C-
peptide status) it is difficult to determine if heteroplasmy levels below 0.1% are clinically
significant in this study. It is very likely that this technique is too sensitive and is merely
detecting the background level of somatic mitochondrial mutation present in all
individuals regardless of disease status (Nomiyama et al., 2002).
(Katulanda et al., 2008) also used an RT-PCR TaqMan assay to screen 994 randomly
selected DM patients of Sri Lankan descent. The sensitivity of the assay was 0.01% and
quantification could be accurately performed down to 0.5%. To determine a cut-off for
mutation positivity all samples were ranked according to heteroplasmy levels. 82% of
patients had levels of ≤1.0% and no patients had levels between 3 and 13%. There was
no difference in the clinical characteristics of patients with heteroplasmy levels of 1-3%
compared to patients with levels of 0-1.0%. Based on the ranking data a cut-off value for
positivity of >5% was chosen, however this seems to be an arbitrary threshold since the
authors provided no clinical information about patients with levels between 1 and 5%
that would be good candidates for further investigation to exclude other causes of
diabetes. The major limitation of this study was that the cut-off value for positivity was
determined using a cohort of randomly selected DM patients rather than a cohort of
healthy control subjects. Therefore it was not possible to determine whether the low
levels detected in DM patients by this technique would also be present in non-diabetic
individuals.

28
Urata et al. (1998) used a modified PCR & RFLP technique called LMPCR that ligated a
primer binding sequence to digested templates to amplify only mtDNA containing the
m.3243A>G variant. The authors stated that this method could detect heteroplasmy as
low as 0.01% and analysed 233 randomly selected DM patients and 136 healthy controls
for the m.3243A>G variant. All healthy controls had heteroplasmy levels ≤0.01%. Two
DM patients had levels ≥0.1% and clinical features consistent with mitochondrial diabetes
(diabetes diagnosed <40 years, non-obese, hearing loss, myopathy, raised serum lactate
and a mother affected with diabetes) (Iwase et al., 2001). Three DM patients had levels
between 0.01–0.1% but features associated with mitochondrial disease (deafness,
myopathy, acidosis and maternal family history) were absent. The authors therefore
considered a level of <0.01% to be diagnostically negative and a level of >0.1% to be a
positive test for m.3243A>G using this technique. Levels between these two values were
considered to be of uncertain clinical significance and would require further investigation
using other tissue types. The major limitation of this technique this that it is only semi
quantitative and does not provide an accurate determination of heteroplasmy levels; the
two patients with levels >0.1% may have significantly higher levels that would easily be
detected by a less sensitive but more simple technique such as conventional PCR-RFLP.
(Singh et al., 2006) used an RT-PCR TaqMan assay to test for the m.3243A>G mutation a
cohort of 230 patients with type 2 DM previously tested using a PCR-RFLP technique with
sensitivity of 5%. The sensitivity of the TaqMan assay was 0.01% and quantification could
be accurately performed down to 0.1%. Only one DM patient tested positive with a
heteroplasmy level of 0.6%. The patient was diagnosed with diabetes aged 63 years, had
a BMI of 30kg/m2 and no parental history of DM. No other features associated with
mitochondrial disease were present and genetic testing was not performed in any family
members. Clinically the patient therefore fitted a diagnosis of late onset type 2 DM
rather than mitochondrial diabetes, and the variant is likely to be somatic and a product
of the oxidative stress associated with diabetes.
Conventional and real-time PCR have therefore historically been the most frequently
employed techniques for detecting m.3243A>G in published studies of diabetes patients.
More recently, pyrosequencing and targeted next generation sequencing have been used.
De Laat et al. used pyrosequencing to detect de novo m.3243A>G mutations in three of 48
families with known m.3243A>G mutation (de Laat et al., 2016). Two different

29
pyrosequencing assays were used – that published by Lowik et al. with a sensitivity of
4.5% (Lowik et al., 2005) and another by Alston et al. with sensitivity of 1% (Alston et al.,
2011). The Wellcome Trust Centre for Mitochondrial Research in Newcastle, UK uses
pyrosequencing assay with test sensitivity and reporting threshold of 3% (Grady et al.,
2018; Pickett et al., 2018). Ellard et al. generated a targeted next generation sequencing
assay that captured and sequenced a 120 nucleotide region of the mitochondrial genome
encompassing the m.3243 position (Ellard et al., 2013). The m.3243A>G variant was
detected in blood DNA of two patients with diabetes and no other clinical features
associated with mitochondrial disease. No information regarding the limits of detection of
the assay, depth of coverage over m.3243, or the estimated heteroplasmy in the two
patients was provided.
2.3.3 Extra-pancreatic clinical features identified in diabetes patients with m.3243A>G
variant
16 papers provided information on non-diabetic clinical features identified in diabetes
patients with the m.3243A>G variant. Seven studies performed retrospective analysis of
the clinical features in large cohorts of adult patients with the m.3243A>G mutation and
the findings are summarised in table 3. Hearing loss, encephalopathy, ophthalmological
disease, skeletal and cardiac muscle dysfunction, short stature and diabetes were the
most commonly reported clinical manifestations.
Early-adult onset, bilateral sensorineural deafness was the most common clinical feature
and was reported in 75% of patients with m.3243A>G related diabetes (Guillausseau et
al., 2001; Suzuki et al., 1994; Uimonen et al., 2001). Ascertainment bias may
overestimate the prevalence since hearing loss or a family history was a criterion for
selection of diabetic patients for genetic testing in 16% of the screening studies from
table 2. Deafness was most frequently diagnosed in early adulthood and before the onset
of diabetes (Guery et al., 2003; Guillausseau et al., 2001; Reardon et al., 1992; van den
Ouweland et al., 1994; Vionnet et al., 1993). The m.3243A>G mutation was also
associated with a syndrome of mitochondrial encephalomyopathy, lactic acidosis and
stroke-like episodes (MELAS) (Goto et al., 1990). The combination of diabetes and MELAS
features was estimated in occur in 10-15% of patients with the m.3243A>G mutation

30
(Gerbitz et al., 1995), and at least 50% of diabetes patients had brain abnormalities
detected using scanning techniques such as computerized tomography (CT) and magnetic
resonance imaging (MRI) (Fromont et al., 2009; Karppa et al., 2004; Lien et al., 2001).
Retinal dystrophy was another common feature of the m.3243A>G mutation and was
seen in ~85% of adult patients with diabetes (Guillausseau et al., 2001). Macular
dystrophy was characterised by pigmented lesions in the retina and atrophy of the retinal
epithelium or choroid (Harrison et al., 1997; Massin et al., 1999; Vialettes et al., 1995).
As expected with a mitochondrial disease, myopathy was a feature of the m.3243A>G
variant and was reported in about 40% of diabetes patients (Guillausseau et al., 2001).
The characteristics were exercise-induced muscle weakness or cramps and typically
affected the proximal limb muscles (Chinnery et al., 2001; Dinour et al., 2004;
Guillausseau et al., 2001; Karppa et al., 2004). The ragged red fibres that are
characteristic of mitochondrial myopathy were observed in muscle biopsies of some
affected patients (Guillausseau et al., 2001). In additional to skeletal muscle, cardiac
muscle was also affected in diabetes patients. Wahbi et al. (2015) investigated 68 patients
with the m.3243A>G variant for cardiac disease and identified a high prevalence of left
ventricular hypertrophy (LVH) (34%) and electrical system disease (27%) (Wahbi et al.,
2015). A major adverse cardiac event was reported in 14% of the patients and was mainly
associated with decompensated heart failure. The high rates of LVH and conduction
disease were replicated in other studies and prevalence of LVH and conduction disease in
mitochondrial diabetes patients was estimated to be four fold higher than in other types
of diabetes (Anan et al., 1995; Majamaa-Voltti et al., 2002; Momiyama et al., 2001;
Momiyama et al., 2002).
Patients with long term poor glycaemic control are at higher risk of diabetic nephropathy
but impaired renal function was four to six-fold more frequent in MIDD compared to type
1 and type 2 diabetes after controlling for severity of hyperglycaemia (Massin et al.,
2008). This suggests the presence of a specific renal pathology independent of diabetic
nephropathy, the most prevalent being focal segmental glomerular sclerosis (FSGS) (Cao
et al., 2013; Godinho et al., 2017; Guillausseau et al., 2001; Hotta et al., 2001). The main
clinical manifestation of renal disease was proteinuria in early adulthood (Doleris et al.,
2000; Hirano et al., 2002; Kurogouchi et al., 1998; Nakamura et al., 1999) and occasionally
in childhood (Cheong et al., 1999; Ueda et al., 2004). Proteinuria was seen in over half of

31
patients with the m.3243A>G variant (Hall et al., 2015). The variant was also identified
with high frequency (6%) in unselected diabetic patients on dialysis (Iwasaki et al., 2001).
Therefore m.3243A>G is the mtDNA variant most likely to be associated with renal
involvement.
Growth impairment was reported in a number of studies and was particularly frequent in
China and Japan where approximately 70-90% of patients were reported to have short
stature and weight loss (Ma et al., 2010; Suzuki, 2004; Xia et al., 2016). Short stature was
related to growth hormone deficiency (Matsuzaki et al., 2002), and low BMI is likely to be
related to insulin deficiency (Guillausseau et al., 2004). Dysphagia and gastrointestinal
problems occur frequently in patients with the m.3243A>G mutation (Narbonne et al.,
2004) and are likely to contribute to the low BMI phenotype. In an observational study of
92 Dutch patients with m.3243A>G, 79 (86%) suffered from at least one GI symptom, and
the frequency and severity of GI symptoms were significantly increased compared to
healthy controls (de Laat et al., 2015). Height, weight and BMI of the patients were
significantly lower than the national average. GI symptoms are therefore a strong risk
factor for malnutrition in patients with m.3243A>G.
The largest audit of clinical features in patients with the m.3243A>G variant was
undertaken by Nesbitt et al. (Nesbitt et al., 2013). The audit included 129 UK patients
from 83 unrelated families (table 4). 57 patients (44%) were affected with diabetes and
this was the most common clinical feature. Deafness was present in 53 of the patients
with diabetes confirming a diagnosis of MIDD. 8/53 patients with MIDD had an
overlapping MELAS syndrome with CVA and encephalopathy, and 6/53 MIDD patients had
CPEO. Proximal myopathy was seen in 13 (23%) of the diabetes patients and at least 13
of the patients with diabetes had cardiomyopathy (most frequently hypertrophic). Four
patients with MIDD had gastrointestinal features and two had short stature. Ataxia,
migraines and seizures were also observed in the patients with MIDD.

32
Table 3: Clinical features reported in 558 adult patients with the m.3243A>G variant across seven different studies. Numbers in the table are the percentage of
patients with the clinical feature from the total number of patients with m.3243A>G in each study.
(Ma et al., 2010) (n= 47)
(de Laat et al., 2012) (n= 71)
(Nesbitt et al., 2013) (n= 129)
(Chin et al., 2014) (n= 35)
(Mancuso et al., 2014) (n= 126)
(Dvorakova et al., 2016) (n=50)
(Xia et al., 2016) (n= 100)
Ataxia - 36 23 9 20 42 -
Cardiomyopathy 34 - 15 6 - 24 -
Cerebellar symptomatology
- 35 - 14 - 15 -
Decreased vision 49 42 - 9 - 15 55
CT/MRI abnormal findings
85 - - 26 - - 72
Dementia - - - 6 - - -
Depression - - - - - 21 -
Diabetes 48 37 44 51 41 42 11
Elevated lactate 100 - - 23 - - 74
Elevated pyruvate - - - 9 - - -
Exercise intolerance - 38 - 23 33 - -
GI symptoms - 42 9 23 18 45 71
Hearing loss 45 48 59 63 58 76 22
Heart block - - - 9 - - -
Intellectual disability - - - 11 - 36 -
Migraines 77 18 29 29 28 30 -
Myopathy 98 34 29 6 23 58 80
Neuropathy - 14 - 11 10 15 -
Ophthalmoplegia 30 5 12 14 - 45 -
Optic atrophy - - - 9 5 6 -
Pigmentary retinal dystrophy
- - 12 17 - 6 -
32

33
Table 3: Clinical features reported in 558 adult patients with the m.3243A>G variant across seven different studies (Ma et al., 2010)
(n= 47) (de Laat et al., 2012) (n= 71)
(Nesbitt et al., 2013) (n= 129)
(Chin et al., 2014) (n= 35)
(Mancuso et al., 2014) (n= 126)
(Dvorakova et al., 2016) (n=50)
(Xia et al., 2016) (n= 100)
Proximal limb weakness
- - - 31 41 - -
Ptosis - 32 - 14 28 36 -
Seizures 89 9 22 20 37 42 -
Short stature 89 - 3 23 17 36 81
Stroke-like episodes 30 4 21 20 41 42 -
Thyroid disease - - - 6 4 18 -
Weight loss 85 - - - - - -
Cognitive decline 70 32 5 - 25 - -
Cardiac disease - 31 - - 32 - 37
Psychiatric problems 36 20 - - 6 - -
Respiratory disease - 26 - 6 5 - -
Encephalopathy - 4 23 - - - 85
33

34
Table 4: Summary of clinical features seen in 129 patient with the m.3243A>G mutation from ‘The UK MRC Mitochondrial Disease Patient Cohort Study’
Taken from: Nesbitt et al 2013 J Neurol Neurosurg Psychiatry 84: 936-938.
34

35
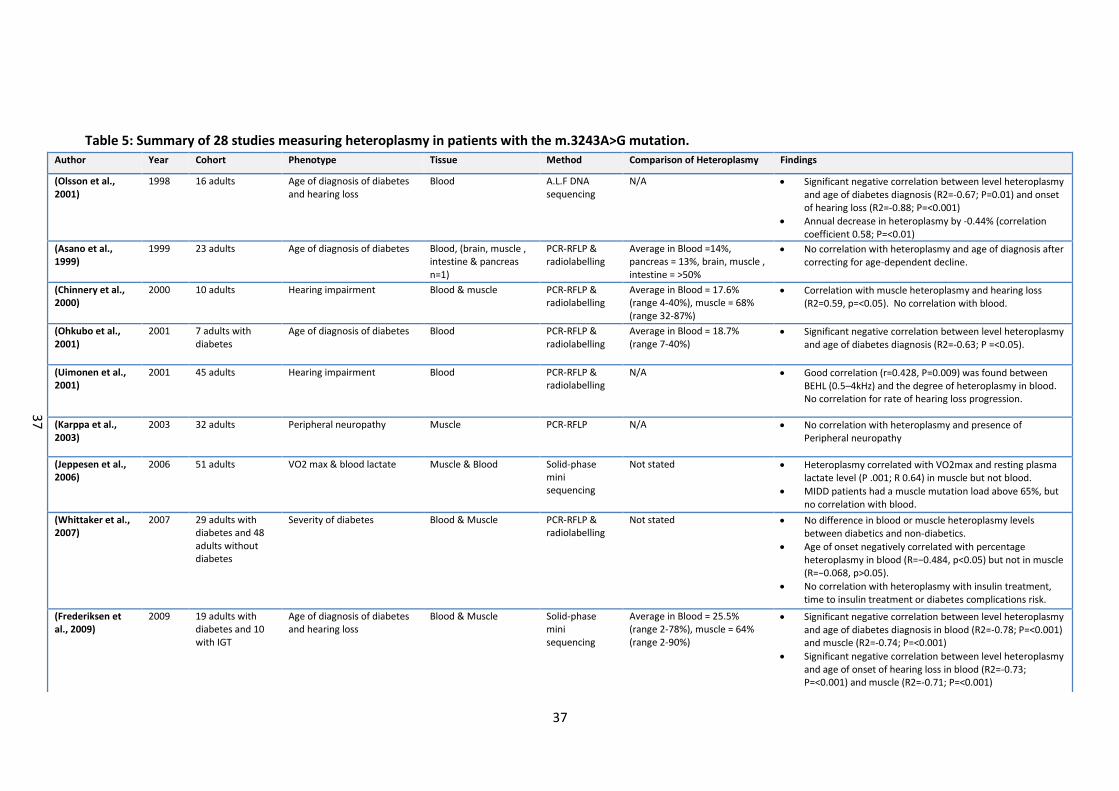
2.3.4 Tissues tested & heteroplasmy
Table 5 summarises the findings from 28 studies where heteroplasmy levels were
determined in various sample types in patients with a range of clinical phenotypes.
Eleven studies compared heteroplasmy levels between blood and urine epithelial cells
(UEC), and seven studies also included buccal mucosa or saliva (table 5). The average
mutation load in blood across the studies was 18% and was lower compared to the
average mutation load in UEC (51%). The average mutation load for buccal mucosa &
saliva was 31%. de Laat et al. (2012) reported that the m.3243A>G variant was
undetectable in 15% of blood samples (i.e. <5%) but could be detected in UEC samples
from the same patient (de Laat et al., 2012). Asano et al (1999) compared mutation loads
in blood, muscle, brain, intestine and pancreas in a patient affected with overlapping
MIDD & MELAS phenotypes (Asano et al., 1999). Mutation load was only 1.4% in blood,
but was 13% in pancreas and exceeded 50% in brain, intestine and muscle. However it
may be that the small sample sizes in these studies are a significant limitation. The
largest and most recent study to date by Grady et al. (2018) used multiple linear
regression and linear mixed modelling to evaluate blood, urine and skeletal muscle
heteroplasmy levels in a total of 210 patients. Heteroplasmy levels were correlated
between all three tissue types (R2 = 0.61-0.73) with the strongest relationship between
blood and urine heteroplasmy levels. This study improves significantly over previous
studies due to large sample size and adjustments to heteroplasmy levels according to
patient age. Heteroplasmy declines significantly in blood with increasing age of the
patient; Langdahl et al. (2017) reported a 0.7% annual decrease in heteroplasmy levels,
and a similar value of 0.5% was reported by Mehrazin et al. (2009) (Langdahl et al., 2017;
Mehrazin et al., 2009). Grady et al. (2018) observed a 2.3%/year reduction in blood
heteroplasmy levels with increasing age of individual, and also a sex difference in UEC
m.3243A>G heteroplasmy with males have on average having a 19% higher urine
heteroplasmy compared to females. Smaller decreases in heteroplasmy have been
reported in UEC and buccal mucosa (de Laat et al., 2012) but not in muscle (Shiraiwa et
al., 1993). Lower blood heteroplasmy also correlated with increasing BMI (de Laat et al.,
2015; Laloi-Michelin et al., 2009). Therefore lower heteroplasmy in blood would be
expected in older patients and would require a more sensitive assay to detect the mtDNA
variant. These observations would also be limitations to studies that perform

36
heteroplasmy-phenotype correlation studies but do not take into account patient age or
gender at time of testing (depending on tissue types tested).
37
Table 5: Summary of 28 studies measuring heteroplasmy in patients with the m.3243A>G mutation. Author Year Cohort Phenotype Tissue Method Comparison of Heteroplasmy Findings
(Olsson et al., 2001)
1998 16 adults Age of diagnosis of diabetes and hearing loss
Blood A.L.F DNA sequencing
N/A Significant negative correlation between level heteroplasmy and age of diabetes diagnosis (R2=-0.67; P=0.01) and onset of hearing loss (R2=-0.88; P=<0.001)
Annual decrease in heteroplasmy by -0.44% (correlation coefficient 0.58; P=<0.01)
(Asano et al., 1999)
1999 23 adults Age of diagnosis of diabetes Blood, (brain, muscle , intestine & pancreas n=1)
PCR-RFLP & radiolabelling
Average in Blood =14%, pancreas = 13%, brain, muscle , intestine = >50%
No correlation with heteroplasmy and age of diagnosis after correcting for age-dependent decline.
(Chinnery et al., 2000)
2000 10 adults Hearing impairment Blood & muscle PCR-RFLP & radiolabelling
Average in Blood = 17.6% (range 4-40%), muscle = 68% (range 32-87%)
Correlation with muscle heteroplasmy and hearing loss (R2=0.59, p=<0.05). No correlation with blood.
(Ohkubo et al., 2001)
2001 7 adults with diabetes
Age of diagnosis of diabetes Blood PCR-RFLP & radiolabelling
Average in Blood = 18.7% (range 7-40%)
Significant negative correlation between level heteroplasmy and age of diabetes diagnosis (R2=-0.63; P =<0.05).
(Uimonen et al., 2001)
2001 45 adults Hearing impairment Blood PCR-RFLP & radiolabelling
N/A Good correlation (r=0.428, P=0.009) was found between BEHL (0.5–4kHz) and the degree of heteroplasmy in blood. No correlation for rate of hearing loss progression.
(Karppa et al., 2003)
2003 32 adults Peripheral neuropathy Muscle PCR-RFLP N/A No correlation with heteroplasmy and presence of Peripheral neuropathy
(Jeppesen et al., 2006)
2006 51 adults VO2 max & blood lactate Muscle & Blood Solid-phase mini sequencing
Not stated Heteroplasmy correlated with VO2max and resting plasma lactate level (P .001; R 0.64) in muscle but not blood.
MIDD patients had a muscle mutation load above 65%, but no correlation with blood.
(Whittaker et al., 2007)
2007 29 adults with diabetes and 48 adults without diabetes
Severity of diabetes Blood & Muscle PCR-RFLP & radiolabelling
Not stated No difference in blood or muscle heteroplasmy levels between diabetics and non-diabetics.
Age of onset negatively correlated with percentage heteroplasmy in blood (R=−0.484, p<0.05) but not in muscle (R=−0.068, p>0.05).
No correlation with heteroplasmy with insulin treatment, time to insulin treatment or diabetes complications risk.
(Frederiksen et al., 2009)
2009 19 adults with diabetes and 10 with IGT
Age of diagnosis of diabetes and hearing loss
Blood & Muscle Solid-phase mini sequencing
Average in Blood = 25.5% (range 2-78%), muscle = 64% (range 2-90%)
Significant negative correlation between level heteroplasmy and age of diabetes diagnosis in blood (R2=-0.78; P=<0.001) and muscle (R2=-0.74; P=<0.001)
Significant negative correlation between level heteroplasmy and age of onset of hearing loss in blood (R2=-0.73; P=<0.001) and muscle (R2=-0.71; P=<0.001)
37

38
Table 5: Summary of 28 studies measuring heteroplasmy in patients with the m.3243A>G mutation.
Author Year Cohort Phenotype Tissue Method Comparison of Heteroplasmy Findings
(Laloi-Michelin et al., 2009)
2009 88 adults with MIDD
Age of diagnosis of DM, HbA1c & BMI
Blood AS-PCR & Sanger sequencing
N/A Significant negative correlation between level heteroplasmy and age of diabetes diagnosis (R2=0.13; P=0.0014), BMI (R2=0.18; P 0.001).
Significant positive correlation between heteroplasmy level and HbA1c (R2=0.06;P=0.02)
(Mehrazin et al., 2009)
2009 17 adults with MELAS & 17 unaffected relatives
Karnofsky Score Blood RT-PCR (TaqMan)
N/A No correlation between heteroplasmy and clinical impairment.
Mutation load decreased by 0.5%/year.
(Whittaker et al., 2009)
2009 24 adults NMDAS Blood, UEC & muscle Mean heteroplasmy in blood = 17% (range 1-71%), UEC = 54% (range 4-96%) buccal mucosa = 55% (range 4-87%)
Weak correlation between blood and muscle heteroplasmy and total NMDAS score (R=0.205, p=0.372 for blood, R=0.191, p=0.372 for muscle).
Higher correlation in UEC (R=0.451, p=0.027).
(de Laat et al., 2012)
2012 71 adults NMDAS Blood, buccal mucosa & UEC
Pyrosequencing Mean heteroplasmy in blood = 22% (range 2-65%), UEC = 48% (range 4-96%) buccal mucosa = 35% (range 2-74%)
Weak correlation between the score on the NMDAS and heteroplasmy (blood r=0.254 (p=0.032), buccal r=0.427 (p=<0.001) & UEC r=0.294 (p=0.016)).
Heteroplasmy declined with increasing age in all three samples: blood R=0.705 (p<0.001), UEC R=0.374(p00.001), buccal mucosa R=0.460(p<0.001).
(Iwanicka-Pronicka et al., 2012)
2012 34 adults Hearing loss Blood & UEC PCR-RFLP Mean heteroplasmy level in UEC = 58% and significantly higher (p=1x10⁻⁶) than in any other tissue. Blood = 14% and significantly lower compared to other tissues (p=0.002).
Weak correlation between total disease score and heteroplasmy level in urine (p= 0.034) or nails (p =0.015).
No useful clinical prediction of disease severity.
(de Laat et al., 2013a)
2013 56 mother-child relations
correlation between mother and child
UEC Pyrosequencing N/A r=0.679 (p= < 0.001).
30% of offspring had no detectable mutation when born from mothers with heteroplasmy <25%.
When >25%, all offspring had detectable mutation levels.
(de Laat et al., 2013a)
2013 82 intersibling relations
correlation between siblings UEC Pyrosequencing N/A r=0.512 (p=< 0.001) but had limited extra predictive value because of outliers.
(de Laat et al., 2013b)
2013 29 adults Retinal dystrophy Blood, buccal mucosa & UEC
Pyrosequencing Mean heteroplasmy level in UEC = 54%, blood = 21%.
No correlation between heteroplasmy levels in all tissues and retinal phenotype.
38

39
Table 5: Summary of 28 studies measuring heteroplasmy in patients with the m.3243A>G mutation.
Author Year Cohort Phenotype Tissue Method Comparison of Heteroplasmy Findings
(Yan et al., 2014) 2014 37 adults Age of diagnosis of MIDD Blood N/A Inverse correlation between level of heteroplasmy and age of onset (R=0.5306, P value not reported).
(de Laat et al., 2015)
2015 79 adults Gastrointestinal symptoms & BMI
UEC Pyrosequencing N/A No correlation between heteroplasmy levels in UEC and gastrointestinal symptoms.
Negative correlation between BMI and heteroplasmy levels in UEC (- 0.319, p = 0.003).
(O'Callaghan et al., 2015)
2015 16 affected and 11 unaffected adults
Symptomatic vs Asymptomatic
Blood, buccal mucosa & UEC
PCR-RFLP & radiolabelling
Mean heteroplasmy level in UEC = 42%, blood = 26%, buccal mucosa = 27%
significantly higher mutation loads in the symptomatic group vs asymptomatic group in blood (40% vs 13%, p=0.027), urine (average 58% vs 23%, p=0.003) and buccal mucosa (average 39% vs 9%, p=0.008)
(Dvorakova et al., 2016)
2016 24 affected adults and 19 unaffected adults
Stroke-like Episodes Blood, Muscle, Buccal mucosa, Hair follicles & UEC
PCR-RFLP Not reported Significant positive relationship between heteroplasmy levels and disease severity in UEC, hair and blood (p = 0.022, resp. p = 0.023, resp. p = 0.003).
Heteroplasmy in UEC predictive for disease severity with R=0.833
(Verhaak et al., 2016)
2016 72 adults Quality of life, fatigue and mental health
Blood, UEC and buccal mucosa
Not Stated Mean level in blood = 19% (SD = 13; range 0–56), UEC = 49% (SD = 27; range 0–97) buccal mucosa = 34% (SD = 18; range 0–73).
Health outcomes poorly correlated with heteroplasmy levels (R=<0.30 for all clinical manifestations)
(Fayssoil et al., 2017)
2017 43 adults major adverse event (MAE) Blood & UEC DGGE Mean level in blood = 20% and UEC = 47%
Patients with MAEs had higher mutation load in UEC (60.1% vs. 40.6% P = 0.01) and in blood (26.9% vs. 16.0% P = 0.03) than patients without MAEs.
Higher heteroplasmy predicted MAEs in blood with r=0.680 (p=0.03) and UEC with r=0.740 (p=0.01).
Optimal cut-off values for the prediction of MAEs were 45% for UEC and 35% for blood
(Langdahl et al., 2017)
2017 32 adults Age Blood NGS N/A Blood heteroplasmy declined by -0.7%/year (p<0.0001) and correlated with level of initial sample (ρ =-0.92, p<0.0001).
Blood levels correlated with levels in buccal cells but not UEC or muscle.
39

40
Table 5: Summary of 28 studies measuring heteroplasmy in patients with the m.3243A>G mutation.
Author Year Cohort Phenotype Tissue Method Comparison of Heteroplasmy Findings
(Grady et al., 2018)
2018 242 adult m.3243A>G carriers (30 asymptomatic)
NMDAS Blood (n=231) UEC (n=235) Muscle (n=77)
Pyrosequencing Heteroplasmy correlated in all three tissues. R2 for blood vs UEC = 0.73, blood vs muscle = 0.64, UEC vs muscle = 0.61
Blood heteroplasmy declined by -2.3%/year
Males have average 19.2% higher UEC heteroplasmy compared to females
Combined muscle heteroplasmy and mtDNA copy number give highest R2 of 0.40.
No association with blood or UEC mtDNA copy number
Age and sex adjusted R2 for blood heteroplasmy = 0.25 and UEC = 0.25. Both higher than muscle heteroplasmy alone (0.20)
(Geng et al., 2019)
2019 15 adults with diabetes
HbA1c Blood, Saliva and UEC Pyrosequencing Mean level in blood = 16.3 ±2.7%, Saliva = 22.7 ±3.4% and UEC = 57.1 ±6.1%
Significant positive correlation between heteroplasmy level and HbA1c (R2=0.55;P=0.02)
(Chae et al., 2020)
2020 15 adults with diabetes and 2 with IGT
Age of diabetes diagnosis, severity of diabetes and progression to diabetes
Blood NGS Mean level in blood = 60.4 ±18.4% (range 22.5 – 100%)
Significant negative correlation between level heteroplasmy and age of diabetes diagnosis in blood (R2=-0.55; P=<0.001)
No correlation with clinical severity or progression to DM
(de Laat et al., 2021)
2021 151 patients with m.3243A>G related disease (including 60 with MIDD) and 27 unaffected carriers
NMDAS Blood, Saliva and UEC Pyrosequencing Mean level in blood = 14% (range 1–43), saliva = 38% (SD = range 2–59) and UEC = 50% (range 2–96)
Highest correlation with NMDAS in saliva (0.30, P=<0.001), followed by blood (R2=0.17, P=0.04) and UEC (R=0.15, P=0.10). Correlation in blood improved when age corrected (R=0.47, P=<0.001).
Heteroplasmy levels decreased in blood by 0.5%/year
UEC = Urine Epithelial Cells. MIDD = Mitochondrial Diabetes & Deafness. NMDAS = The Newcastle Mitochondrial Disease Scale for Adults (NMDAS); a semi-quantitative clinical rating scale designed specifically for all forms of mitochondrial disease.
40

41
2.3.5 Heteroplasmy & Disease Severity
The degree of heteroplasmy in specific tissues did not correlate at all with the severity of
disease in over half of the studies and was only weakly correlated in the others, with R2
values below 0.4 for >90% of statistical analyses (table 5). Heteroplasmy provided a fairly
inaccurate predictive tool for the development of specific clinical symptoms and disease
progression (de Laat et al., 2015; Karppa et al., 2003; Verhaak et al., 2016). Negative
correlations were reported with muscle heteroplasmy and severity of hearing loss
(Chinnery et al., 2000) and blood heteroplasmy and age of diabetes diagnosis (Chae et al.,
2020; Frederiksen et al., 2009; Laloi-Michelin et al., 2009; Ohkubo et al., 2001; Olsson et
al., 2001; Whittaker et al., 2007; Yan et al., 2014), and positive correlation with blood
heteroplasmy and HbA1c (Geng et al., 2019). But these were not replicated in other
studies (Asano et al., 1999; Iwanicka-Pronicka et al., 2012). Weak positive correlations
were reported when studying heteroplasmy in UEC and clinical features other than
diabetes and deafness, such as stroke-like episodes (Dvorakova et al., 2016), and the
overall disease burden as measured by the frequency of major adverse events (Fayssoil et
al., 2017) or the NMDAS (Whittaker et al., 2009). Maternal UEC heteroplasmy was also
positively associated with the UEC heteroplasmy of offspring; 30% of offspring had no
detectable mutation when born from mothers with heteroplasmy <25% but all offspring
had detectable mutation levels when maternal heteroplasmy was >25% (de Laat et al.,
2013a).
The significant limitations of these studies with regard to the MIDD phenotype are the
very small sample sizes and the fact that the authors have not adjusted blood
heteroplasmy to take into account the reduction in levels with increasing patient age.
Several studies published after the literature review had been undertaken have been
included because of their sample size, detailed clinical phenotyping of the cohort and
accurate adjustment for patient age. The most recent and mostly highly powered study
by Grady et al. (2018) showed that 40% of variation in disease severity is due to muscle
heteroplasmy and mtDNA copy number (R2=0.40). There was no association with mtDNA
copy number and disease severity in blood or urine. An age adjusted blood heteroplasmy
level gave an R2 of 0.25 and a sex adjusted urine level gave R2 of 0.20. Therefore muscle
heteroplasmy is not more highly associated with disease severity compared to age-
adjusted blood or urine, and blood was better than urine as a measure of disease severity

42
(this contrasts with studies by Mehrazin et al, 2009; Whittaker et al, 2009; de Laat et al,
2012 and likely due to increased sample numbers in the Grady study). There was
significant inter-individual variation highlighting the difficulty of using heteroplasmy levels
for predicting disease burden, and the authors suggest other contributing factors such as
nuclear genetic variation, environmental influences and epigenetics. The authors
conclude that age-adjusted blood heteroplasmy is the most reliable and convenient
heteroplasmy measure to use routinely within the clinical setting. Similar correlations
between heteroplasmy and NMDAS were also reported very recently in a similarly high-
powered study (de Laat et al., 2021).
2.4 Conclusion
This review highlights five key facts; that the m.3243A>G mutation is a significant cause of
diabetes; it is associated with a significant health burden due to the wide range of
additional non-diabetic co-morbidities; that heteroplasmy levels vary significantly
between diagnostically accessible tissues; that heteroplasmy levels decline significantly in
blood with increasing age and may result in false negative results from insensitive
diagnostic assays; and that heteroplasmy influences clinical phenotype and this
association varies depending on the tissue analysed. Making a genetic diagnosis of
mitochondrial diabetes is therefore very important since it has implications for clinical
management, monitoring, prognosis and disease risk for the patient and family members.
Clinical features of mitochondrial disease do not appear to be present in patients with
levels <1%. Levels below 1% are very unlikely to be causing mitochondrial diabetes and
are somatic mutations associated with diabetes mediated oxidative stress i.e. a
consequence of DM, but not causative. The review did not identify any patients with
heteroplasmy <1% that had a strong m.3243A>G-related clinical phenotype. Levels >1%
are likely to be causative; however examples of patients with atypical DM exist and as
with the diagnosis of any subtype of monogenic diabetes the differential diagnosis of
common subtypes (type 1 and type 2) needs to be considered, as does other causes of
hearing loss.
This review shows that levels of heteroplasmy are important in terms of how they affect
the sensitivity of testing. There can be significant variation in heteroplasmy between the
tissues that are readily accessible for genetic testing. There is also variation between

43
individuals within the same tissues, for example decreasing heteroplasmy in blood due to
age or variation in UEC heteroplasmy between males and females. These variations need
to be considered and adjusted for when assessing heteroplasmy against disease burden.
The correlation between heteroplasmy in diagnostically tested tissues (blood, saliva,
urine) and clinically relevant tissues (muscle or brain) varies between studies. An
association between heteroplasmy and clinical phenotype exists but there is a significant
challenge to using this association in a clinical setting. Caution must be exercised when
using heteroplasmy levels to predict disease severity, progression/prognosis (e.g. a
clinician would still advise monitoring for cardiomyopathy in a patient with diabetes and
deafness if heteroplasmy is low in blood or urine samples) and risk to future offspring.
Heteroplasmy-phenotype correlations are further complicated by the significant decrease
in m.3243A>G heteroplasmy levels with increasing age, although work to correct
heteroplasmy for patient age may help overcome this. It is likely that further research is
needed to understand the factors that influence m.3243A>G heteroplasmy levels and
clinical severity/expression, particularly in patients with MIDD. Opinions on the utility of
heteroplasmy levels differ within the published literature. Asano et al. (1999) makes a
clear statement on the utility of heteroplasmy:
…it is virtually impossible to predict the prognosis or seriousness or both of clinical
manifestations including diabetes, deafness, and encephalomyopathies in a
particular patient. In other words, whether or not the mutated mtDNA is present,
rather than the percentage of mutated mtDNA in leucocytes, is of major
importance.
In the review of their diagnostic laboratory service, Chin et al. (2014) state that they do
not include heteroplasmy levels in their diagnostic reports since this has not clinical utility
in a diagnostic setting (Chin et al., 2014). Reporting heteroplasmy levels is not included as
a recommendation in the best practice guidelines for the testing and reporting of
mitochondrial diseases published by the UK Association for Clinical and Genetic Science
(ACGS) (ACGS, 2017). A new version of the ACGS guidelines went out for consultation in
August 2020 and is very likely to state that measuring and reporting of heteroplasmy is
essential for all mtDNA tests, but is unlikely to provide any specific guidance with regard
to reporting m.3243A>G heteroplasmy. In the current guidelines emphasis is placed on
ensuring that the most appropriate test sensitivity is achieved to avoid the false positive
results seen with very high sensitivity (Suzuki et al., 2005) and false negative results when

44
achieving a low sensitivity (de Laat et al., 2013b). This will depend on the tissue sample
analysed (higher mutation load in UEC compared to blood), the age of the patient (blood
heteroplasmy may be undetectable in older patients) and the techniques used (PCR-RFLP
techniques have low sensitivity (5-10%) compared to real-time PCR/probe based assays
that can detect levels down to 0.1%). High levels of sensitivity and specificity are the key
requirements for any mtDNA mutation test, but there is still a need to accurately
determine heteroplasmy levels so that further information can be gathered to help
understand the relationship between heteroplasmy and clinical phenotype. The lack of
confidence in using heteroplasmy levels for clinical management is most likely due to the
lack of data supporting its use. This uncertainty around the relationship between
heteroplasmy and disease severity comes in part due to the small size of cohorts used
and no adjustment of blood heteroplasmy for age in the vast majority of studies. This has
been highlighted by the most recent study in the literature review using the largest
cohort to date, suggesting that age adjusted blood heteroplasmy can account for about
25% of the variation in disease severity seen in patients with m.3243A>G. This is an
important finding since blood heteroplasmy has historically not shown strong
associations, and this new data now gives confidence to using blood DNA in heteroplasmy
studies. However large scale studies looking specifically at heteroplasmy levels in
patients with diabetes are lacking. If there is a clear clinical distinction between MELAS
and MIDD as suggested by the clinical trait correlation studies by Pickett et al., then it
may be the case that the relationship between heteroplasmy and clinical features differs
too. Clearly then there is a need to determine heteroplasmy levels in diabetes patients
referred for diagnostic testing so that this data can be built upon to strengthen the
evidence base and enable reporting of heteroplasmy and clinical advice specific to the
heteroplasmy result. This might be achieved by determining guidance for specific ranges
of heteroplasmy rather than for a specific heteroplasmy level. Whether the role of ddPCR
in m.3243A>G testing will be strictly within the realms of research or as a routine
diagnostic test in the Exeter laboratory setting may in part be determined by the findings
of this study.
45
Chapter 3: Project Aims & Objectives
The Exeter genomics laboratory currently performs testing for the m.3243A>G mutation
using a TaqMan genotyping assay that has a lower limit of detection of about 5%
heteroplasmy and does not quantify heteroplasmy levels. Based on the findings from the
literature review, there is likely to be clinical utility in finding an alternative assay that
achieves a lower limit of detection (down to at least 1%) and can estimate heteroplasmy
levels with a high degree of accuracy and precision. In addition to being more sensitive
and also quantitative, it should ideally not be significantly more expensive or labour
intensive than the existing assay, provide a result within a reasonable timescale and be
able to fit into existing diagnostic workflows and informatics pipelines.
The literature review identified a range of potential assays but this project will develop a
technique not yet used for the study of the m.3243A>G variant; droplet digital PCR
(ddPCR). This technique is suited to the Exeter genomics laboratory since the hardware
and software for ddPCR are already in situ in the laboratory (a Bio-Rad QX200 droplet
reader, a C1000 Touch thermal cycler and both manual and automated droplet
generators) and have been validated for other diagnostic services offered by our
laboratory such as the detection of copy number variation in autosomal genes (Iacovazzo
et al., 2016) and the detection of maternally inherited mutations in cell free fetal DNA
(Caswell et al., 2020).
The aims of this project are two-fold. Firstly, to determine whether ddPCR is a suitable
assay for the detection of m.3243A>G in a diagnostic laboratory setting. The assay will
need to achieve high levels of precision and accuracy with regard to detecting the variant
and estimating heteroplasmy in order to fulfil requirements for a diagnostic test. A
thorough validation study using defined acceptance criteria will need to be undertaken to
ensure the assay is fit for purpose. Secondly, the project will aim to determine the utility
of ddPCR compared to the existing TaqMan genotyping assay. Analysis of patients with a
negative TaqMan genotyping test result will determine whether ddPCR increases
diagnostic yield by detecting low level heteroplasmy (down to 1%). Estimation of
heteroplasmy will enable statistical analysis to determine if there is a relationship
between heteroplasmy and clinical phenotype that could enable prediction of disease
severity and penetrance.

46
Validation of the assay will be undertaken using DNA samples from patients with
m.3243A>G and heteroplasmy levels determined by targeted NGS. Once the assay has
been optimised and meets the requirements in terms of precision and accuracy, further
analysis of patient DNA samples will be undertaken to determine diagnostic yield and
clinical utility. The assay will be used to test for the presence of low level heteroplasmy
(down to approximately 1%) in blood DNA from patients with a clinical phenotype
suggestive of mitochondrial diabetes and deafness (MIDD) or who have a maternal
relative with m.3243A>G, but have previously tested negative using the TaqMan assay
with ~5% limit of detection. If low level mutations are detected in patients this will
enable the correct diagnosis of mitochondrial diabetes to be made and provide
prognostic information, enable screening for other related health conditions and
potentially lead to improvements in clinical management of their diabetes. A positive
result will enable testing of other affected relatives, and will also have implications for
risk to future offspring if the patient is female. In addition to diagnostic yield, we will
determine the clinical utility of accurately determining heteroplasmy. Patients with
m.3243A>G detected by our TaqMan assay will be re-tested by ddPCR to determine
heteroplasmy levels, and the relationship between heteroplasmy and clinical disease
severity and penetrance will be examined. Heteroplasmy estimation within both a
TaqMan negative and a Taqman negative cohort will also help to determine appropriate
thresholds for reporting a positive or negative result.

47
Chapter 4: Methodology
4.1 Samples for ddPCR assay validation
Assay validation was performed using peripheral blood DNA samples from patients with a
known level of m.3243A>G heteroplasmy. These patients were tested in the Exeter
Genomics Laboratory as part of routine diagnostic testing for monogenic diabetes using
the targeted Next Generation sequencing method previously described (Ellard et al.,
2013). This NGS assay sequences all of the known monogenic diabetes genes and also
genotypes the m.3243A>G variant using MuTect software (Broad Institute,
https://software.broadinstitute.org/cancer/cga/MuTect). MuTect was developed for
detection of low level somatic single base substitution variants in next generation
sequencing data of cancer genomes and is used in our bioinformatics pipeline for the
detection of mosaic germline variants and mitochondrial heteroplasmy. Heteroplasmy
levels in patients with m.3243A>G detected by tNGS were calculated as the proportion of
all sequencing reads aligning to m.3243 position that have the G nucleotide (i.e. mutant)
sequence. The tNGS-estimated heteroplasmy level was taken as the true value for the
purposes of ddPCR assay validation.
Validations of primers and probes, verification of ddPCR hardware and software and
optimisation of assay conditions (PCR annealing temperature and sample DNA
concentration) was first performed using a sample of ~50% heteroplasmy. Further testing
was performed on 7 different samples using a range of DNA concentrations to determine
whether the conditions were suitable for a range of heteroplasmy levels (0.16, 0.53, 1.01,
1.71, 11.6, 25.2 and 61.3%). A sample of ~12% heteroplasmy was used to determine test
reproducibility and a sample of ~9% for test repeatability.
A replication cohort of 40 samples with a known heteroplasmy level determined by tNGS
was used to confirm the accuracy of the ddPCR assay. All validation test runs included a
peripheral blood DNA sample from a patient with m.3243A>G heteroplasmy level of
<0.05% determined by tNGS as the normal/negative control for the assay, and sterile
water was used as the no template control.

48
4.2 Samples from patients referred for mitochondrial diabetes testing analysed as
part of the clinical cohort
Peripheral blood DNA samples were available from 190 patients referred to the Exeter
Genomics Laboratory between the period of January 2006 to July 2018 for m.3243A>G
mutation testing as part of their routine clinical care. All patients had previously been
tested for m.3243A>G using the TaqMan assay described previously (Singh et al., 2006)
with an estimated limit of detection of 5% heteroplasmy. This assay provided a
detected/not detected result and did not estimate heteroplasmy levels. Patients were
probands or a clinically affected or unaffected family member of a proband with
m.3243A>G. Probands were selected by clinicians for testing based on a personal or
family history of diabetes with additional clinical features suggestive of a diagnosis of
m.3243A>G related disease. Clinical information and family history were provided using a
clinical questionnaire (https://www.diabetesgenes.org/download/188/). In addition to
diabetes related data, this form specifically asked whether the patient had a hearing
impairment, and whether there was a family history of hearing loss. The request form
was not used for all referrals and not all fields were completed.
119/190 patients tested by TaqMan were positive for the m.3243A>G mutation and
underwent quantification of heteroplasmy levels by ddPCR. 71 patients with a not
detected result had further testing by ddPCR to determine whether the m.3243A>G
variant was present at a heteroplasmy level below the limit of detection of the TaqMan
assay.
We also included the clinical and family history data of 32 patients from the tNGS-tested
positive control replication cohort. These patients were referred for MODY testing as
part of routine care with no clinical suspicion of a diagnosis of m.3243A>G related
diabetes.
4.3 Detection of the m.3243A>G mutation by droplet digital PCR – overview of the
technology
Digital PCR (dPCR) is a method for absolute quantification of target nucleic acids. dPCR
works by partitioning the DNA sample into a large number (tens of thousands) of
independent PCR micro-reactions (Figure 6). In a typical dPCR experiment the sample is
randomly distributed into discrete partitions that contain only a few or no target

49
sequences, and PCR amplification to end point occurs in each partition. Concentration of
the target nucleic acid is calculated based on the fraction of partitions with positive
amplification using Poisson statistics. Rather than a real time analysis of fluorescence
generated during PCR, dPCR analyses the end-point fluorescent signal for each partition
to make a binary call (i.e. absence or presence) with regard to the target nucleic acid
sequence.
A positive call is given once the fluorescent signal from the partition reaches a defined
amplitude threshold. Because of the binary nature of the digital process and the many
thousands of partitions used, the exact position at which the amplitude threshold is set
does not greatly affect the result. The result is also not biased by a small fraction of
partitions falling below the threshold. This removes the need for calibrators or external
controls.
Figure 6: Principles of digital PCR. The initial PCR mix containing DNA template, primers, probes, enzyme & buffers is divided into thousands of discrete partitions, each containing 0 or 1, 2, 3 etc target sequences. Distribution of targets into partitions is random and follows a Poisson distribution. Each partition acts as a micro-PCR reactor with PCR products detected by presence of a fluorescent signal. Concentration of target nucleic acid is calculated based on the fraction of positive partitions (i.e. partitions with fluorescence). Taken from Quan et al. 2018 Sensors (Basel) 18:1271 (Quan et al., 2018).
There are a number of different technologies available for generating the partitions
required for dPCR. Droplet digital PCR (ddPCR) is a dPCR technique that uses water-oil
emulsion and microfluidics to partition samples into thousands of droplets. Before
droplet generation, ddPCR mixes are set up similar to other real-time PCR applications
(such as TaqMan) that use fluorophore labelled hydrolysis probes (FAM, HEX or VIC).
ddPCR for rare mutation detection is set up as a duplex PCR, with one probe targeted to
the sequence containing the mutation of interest, and a second probe targeted for the
wild type sequence (Figure 7).

50
Figure 7: Features of a rare mutation detection assay. Adapted from Fig. 5.1., page 66 of the BioRad Droplet Digital PCR Applications Guide.
The reaction mix is then partitioned into oil droplets containing the PCR reaction mix. PCR
amplification using a thermal cycler is carried out within each droplet which is
subsequently streamed in single file across a fluorescence detector (Figure 8).
Fluorescence is only detected when the corresponding amplification product is present at
sufficient levels. Positive and negative droplets are counted so that target DNA
concentration can be calculated.
Figure 8: droplet digital PCR technique. A) droplet generation using oil emulsion partitions the sample into thousands of droplets of uniform size and volume. B) Droplets are separated and streamed in single file across a droplet reader to measure fluorescence. C) A two channel reader detects the separate signals from two different dyes to enable a binary call for each droplet, and quantification of a target DNA sequence. Adapted from Fig 1.4. (page 3), Fig 1.7. and Fig 1.8. (page 5) of the BioRad Droplet Digital PCR Applications Guide
Data generated from ddPCR can be viewed by plotting each droplet on a graph of
fluorescent amplitude against droplet number, known as a 1-D plot (Figure 9). A
threshold is set and all droplets with fluorescent intensity above this are scored positive
(value of 1) and all droplets below the line are negative (value of 0).

51
Figure 9: 1-D amplitude plot of fluorescent amplitude against droplet number. The threshold for positive droplet calling is the red line. Blue dots above this line are positive droplets, the black dots below are negative. Taken from page 5 of the BioRad Droplet Digital PCR Applications Guide.
In an experiment where two PCR targets are amplified and detected using two different
fluorescently labelled probes, the data can be viewed in a 2-D plot where the
fluorescence from both dyes (channel 1 and channel 2) are plotted against each other for
each droplet (Figure 10). Random distribution of target DNA molecules allows for four
different groups: double negatives, double positives, channel 1 positive/channel 2
negative, and channel 2 positive/channel 2 negative. The fraction of positive droplets is
then fitted into a Poisson model to determine the concentration of the target DNA
molecule in the starting DNA sample in units of copies/ul.
A B
C D

52
Figure 10: 2-D plot of droplet fluorescence. From two different probes targeting two different DNA sequences, four groups are observed with a combination of positive and negative fluorescence for each channel: A = channel 1 positive (mutant) only, B = double positive (mutant and wildtype), C = double negative (no fluorescence) and D = channel 2 positive (wildtype) only. Taken from page 74 of the BioRad Droplet Digital PCR Applications Guide.
4.4 Calculation of m.3243A>G heteroplasmy by ddPCR
BioRad QX200 ddPCR technology generates roughly 20,000 droplets per sample. Target
molecules are randomly distributed into any one of these droplets independently of each
other and don’t interact with each other.
Droplets are of equal volume (about 1nl). Reading a subset of droplets has no impact on
the concentration measurement as the calculation is based on the number of empty
droplets (i.e. no target DNA). The fraction of empty droplets will be the same regardless
of the total number of droplets analysed. ddPCR concentrations are expressed as copies
of target per microlitre (copies/ul). A typical ddPCR system will be able to determine
concentration over a range of 0.25 to 5,000 copies/ul.
Rare mutation detection (typically the detection of a single nucleotide substitution) uses
two fluorescent probes – one for the mutation nucleotide and another for the wildtype
nucleotide. This generates data from two channels – MT (mutation) & WT (wildtype).
Each channel will have a total number of droplets, with a fraction being positive (i.e.
fluorescent signal detected) and a fraction negative. The total volume of droplets can be
calculated based on droplet volume (1nl) and the total droplet number. The next
important value is copies per droplet (CPD). This is the number of copies of target DNA
per unit volume (i.e. 1nl) and expressed as the average copy number per droplet.
Poisson modelling is needed to determine CPD, using the formula:
-ln(1-(positive droplet number/total droplet number))
Multiplying CPD by the total droplet number for each channel gives the total number of
copies of variant and wildtype DNA. Dividing this by the total volume of droplets gives
the copies per ul. This can be calculated for variant and wild type DNA sequences and the
ratio of mutant copies/ul over mutant + wildtype copies/ul gives the percentage variant
DNA in the sample (Table 6). In the context of testing for m.3243A>G this ratio would be
the heteroplasmy level.

53
Allele positive droplets
negative droplets
total droplets
total volume of droplets (ul) where 1 droplet = 1nl
copies per droplet
total copies
copies per ul
proportion of mutant copies (heteroplasmy)
Mutant 3953 34675 38628 38.628 0.108 4170 108 5.1
Wildtype 33562 5066 38628 38.628 2.031 78470 2031
Table 6: Example calculation for determining m.3243A>G heteroplasmy using two channel ddPCR data. Copies per droplet (CPD) calculated using formula -ln(1-(positive droplet number/total droplet number)). Total copies calculated by multiplying copies per droplet by total droplet number. Copies per ul calculated by dividing total copies by the total volume of droplets. Heteroplasmy expressed as proportion of copies that are mutant.
Poisson modelling requires a certain ratio of negative partitions to positive partitions.
This is determined by the amount of DNA template added to the PCR mix and therefore
accurate quantification DNA concentration in the starting sample is essential. If too much
template is added then there will be insufficient number of negative droplets to enable
Poisson modelling. As the concentration of the inputted target DNA increases, the
Poisson estimated number of negative droplets decreases (Figure 11). Zero negative
droplets occurs when CPD reaches a value of about 8, and quantification is impossible.
Figure 11: Relationship between fraction of negative (empty droplets) and concentration of starting molecules. CPD = copies per droplet. Taken from page 54 of the BioRad Droplet Digital PCR Applications Guide.
A typical ddPCR reaction for a genomic target uses 22ng of genomic DNA, equivalent to
approximately 6,500 genome copies. This gives a good ratio of positive to negative
droplets to enable reliable Poisson modelling. However the average mitochondrial DNA
copy number per cell nucleus in peripheral blood is 144 copies/cell (Grady et al., 2018),
which would be equivalent to about 936,000 mtDNA copies if using 22ng of genomic
DNA. This would result in no negative droplets and so a significantly higher dilution factor
is required to achieve the appropriate ratio of positive to negative droplets. This is likely
to be a dilution factor of around 250-500 but will need to be determined experimentally
for optimum negative droplet generation.

54
The final statistical consideration specific to rare mutation detection is the limit of
detection (LoD) of the assay which is determined by the number of wildtype sequences
tested. As a general rule, the number of sequences to test in order to find one mutant
sequence is equivalent to the three times the background number of wildtype sequences.
A large number of sequences may need to be analysed in order to detect a single positive
droplet at lower LoD (<0.1%). This can be achieved by combining droplets from a number
of wells/replicates into a meta-well. For a LoD of 1/1000 (0.1%) 3,000 wildtype
sequences are needed, and 300 for a 1/100 (1%) LoD.
4.5 QC requirements for ddPCR detection of the m.3243A>G mutation
Appropriate controls are required for each run of ddPCR performed. This will include a no
template control (NTC), a negative (normal) control that has the highest proportion of
wildtype target DNA that would be expected for the assay, and a positive (mutant)
control that contains sufficient number of both mutant and wildtype DNA sequences to
create a double-positive cluster with >100 droplets. A run is rejected if the positive
and/or negative controls have failed. The NTC should have no positive droplets. If 1 or 2
positive droplets are observed then the negative control should be checked for
contaminating positive droplets.
Droplet quality is assessed through visual inspection of plots and droplet numbers. All
samples are run in triplicate and any well with <10,000 accepted droplets (i.e. droplet
with or without fluorescence that is detected by the droplet reader) is rejected. At least 2
wells with >10,000 accepted droplets are required; if only 1 or 0 wells have >10,000
accepted droplets then sample has failed. Within the 1-D plot view, any well with
significantly different amplitude of double-negative droplets (indicative of poor droplet
generation) is rejected. Within the 2-D plot, wells are rejected if they have poorly defined
clusters or a significant spray of droplets running 45 degrees through the plot.
Data from the 2 or 3 accepted wells is then merged and the total number of wildtype
droplet calls is calculated to determine the LoD of the assay for that sample.
If <300 and there are <3 positive droplets then sample has failed since there
will be insufficient numbers of droplets to detect the variant at <1%
heteroplasmy.

55
If >3000, sample has passed and there is a 95% confidence that the LoD will be
0.1% heteroplasmy.
If >300 but <3000, the sample has passed and there is a 95% confidence that
the LoD will be 1% heteroplasmy.
Then determine the number of m.3243A>G positive droplets.
If the result is 0 or ≥3, the sample has passed.
If the result is 1 or 2, compare with the wildtype (100% homoplasmic
m.3243A) to determine if there is any indication of contamination within the
batch. If there is contamination, repeat samples with 1 or 2 droplets.
Therefore the minimum requirement to call a sample as positive is three positive
droplets. This can be in a single well or merged across wells.
4.6 Verification of ddPCR PCR primers and probe design
Verification of PCR primers and probe design was undertaken first using a peripheral
blood DNA sample with known heteroplasmy of ~50%. DNA concentration of the
genomic DNA sample was determined using a Qubit 3.0 fluorometer (Thermo Fisher
Scientific, Massachusetts, United States) according to manufacturer’s instructions and
then diluted with water to four different concentrations for analysis; 0.1ng/ul, 1ng/ul,
2ng/ul and 10ng/ul.
PCR primer sequences for the m.3243A>G ddPCR assay are the same as those used for
the department’s existing m.3243A>G assay using TaqMan methodology as previously
described ((Singh et al., 2006) and Table 7). The PCR primers amplify a 90bp sequence of
mtDNA incorporating the m.3243A locus. Allelic discrimination is achieved using
nucleotide specific probes differing only at mtDNA position m.3243 (as indicated by the
bold and underlined nucleotides in the sequences in Table 7). Probes were designed by
Thermo Fisher Scientific’s custom SNP genotyping assay design tool
(https://www.thermofisher.com/order/custom-genomic-products/tools/cadt/). The
probe with complementary sequence specific to the wild-type (A) allele is labelled 5’ with
the fluorescent dye VIC (2′-chloro-7′phenyl-1,4-dichloro-6-carboxy-fluorescein), and the
probe specific to the variant (G) allele is labelled 5’ with the dye FAM (6-

56
carboxyfluorescein). Both are labelled 3’ with a minor groove binder (MGB). MGB is a
moiety attached to the 3’ end of the probe that increases melting temperature and
stabilizes probe/target hybrids. This enables the use of probes that are significantly
shorter than traditional probes, providing better sequence discrimination and flexibility to
accommodate more targets. Primers and probes were designed according to GenBank
Accession number NC_012920.1 and synthesised by Thermo Fisher Scientific. Primers
and probes were synthesised and reconstituted to a concentration of 100pmol/ul and
diluted to 2pmol/ul prior to use. Primer and probe sequences are provided in table 7.
Primer/probe description Sequence
Forward primer 5’-CCA CAC CCA CCC AAG AAC AG-3’
Reverse primer 5’-AGG AAT TGA ACC TCT GAC TGT AAA GTT T-3’
Wild-type probe VIC-CCG GGC TCT GCC AT-MGB
Mutant probe 6FAM-CCG GGC CCT GCC AT-MGB
Table 7. Sequences of primers and probes used for the ddPCR assay. Sequences based to
GenBank Accession number NC_012920.1.
A 20X primer and probe mix of total volume 380ul was created using 36ul of forward
primer, 36ul of reverse primer, 10ul of wildtype probe, 10ul of mutant probe and 288ul of
Baxter water (Deerfield, Illinois, United States). A PCR mix containing 10ul of 2X ddPCR
Supermix (Bio-Rad, California, United States), 1ul of the 20X primer & probe mix and 5.5ul
of Baxter water was added to 5.5ul of diluted sample DNA for a total PCR volume of 22ul.
PCR reactions were set up in duplicate into a green Twin-tec 96 well plate (Eppendorf Ltd,
Stevenage, UK). The plate was sealed using a PX1 plate sealer (Bio-Rad) and pierceable
foil heat seal (Bio-Rad) and put onto an AutoDG Droplet Generator (Bio-Rad) with DG32
cartridges (Bio-Rad) containing AutoDG droplet oil (Bio-Rad). An AutoDG cold block was
placed on the droplet plate site of the AutODG machine to prevent degradation of newly
formed droplets and a blue Twin-tec 96 well plate (Eppendorf) was inserted into the cold
block. The AutoDG was run according to manufacturer’s instructions. A 40ul volume of
droplets was generated per sample using 20ul of the PCR mix and 70 ul of droplet oil. The
plate containing droplets was re-sealed with a fresh foil seal and placed on a C1000
thermal cycler (Bio-Rad) and run with a standard ddPCR program (50 cycles of 10 minutes
at 95oC, denaturation for 30 seconds at 94oC and annealing/extension for 1 minute at
52oC). The plate was then placed in the QX200 Droplet Reader (Bio-Rad) and analysed
using QuantaSoft version 1.7 software (Bio-Rad). Optimum DNA concentration was

57
chosen based on generation of a suitable proportion of negative droplets and optimum
separation of positive and negative droplets for WT and MT probes. Amplitude
thresholds were manually set accordingly using the 2-D plot option to obtain appropriate
separation of groups according to droplet clustering.
4.7 Optimising DNA concentration and PCR annealing temperature
The initial validation test was repeated using DNA concentrations of 0.1ng/ul and
0.05ng/ul. To minimise pipetting and sampling errors, multiple dilution steps at low ratio
were performed, rather than single step at high ratio. The sample was first diluted to
10ng/ul, then serial 1 in 10 dilutions were performed to 0.1ng/ul and a final 1 in 2 dilution
to 0.05ng/ul. Due to the low DNA concentration used, all dilutions were performed using
low-DNA binding plastics and a liquid handling robot. Samples were thoroughly mixed at
each stage to ensure homogeneity prior to the next dilution step. A temperature gradient
was used for the PCR step to determine the optimum annealing temperature. This used
the same PCR conditions but eight different annealing temperatures ranging from 55oC to
65oC as a gradient across the thermal cycling block (Table 8). Samples A1 to H1 contained
the 0.1ng/ul dilution, and A2 to H2 the 0.05ng/ul dilution.
Well Temperature oC
A1/A2 65.0
B1/B2 64.5
C1/C2 63.3
D1/D2 61.4
E1/E2 59.0
F1/F2 57.0
G1/G2 55.7
H1/H2 55.0
Table 8: Temperature gradient settings used to determine the optimum annealing temperature. Optimisation of annealing temperature was performed using samples of DNA concentration 0.1ng/ul dilution (wells A1 to H1) and 0.05ng/ul (wells A2 to H2).
4.8 Determining test precision, uncertainty of measurement, sensitivity, accuracy,
specificity and limits of detection
The precision (or reproducibility and repeatability) of the ddPCR assay was determined by
measuring the Coefficient of Variability (CV) values of inter-assay and intra-assay
variation. The CV is a dimensionless number defined as the standard deviation (SD) of a
set of measurements divided by the mean of the set and expressed as a percentage.
Inter-assay CV (reproducibility) represents the plate to plate (or run to run) consistency.

58
Intra-assay CV (repeatability) represents the degree of difference between multiple
measures of the same sample tested on the same plate. Inter-assay CVs of less than 15%
are generally acceptable, and intra-assay CVs should be less than 10%.
Inter-assay CV was calculated using a DNA sample with heteroplasmy level of ~12%
(determined by tNGS) tested in triplicate on 12 different plates (36 independent wells).
Each plate was tested using the same assay conditions and the same operator but on
different days. The mean heteroplasmy value was calculated for each plate and then
used to calculate the overall mean, SD and CV of the means. Intra-assay variation was
determined using a control sample with a known heteroplasmy level of ~9% (determined
by tNGS). This sample was tested across 6 separate wells on the same plate under the
same test conditions along with the 50% positive, normal and NTC controls.
Measurement of Uncertainty was also performed using the values from the 36 wells for
the inter-assay CV calculation, and the formula:
Uncertainty (u) = √ (∑ (xi – μ)2) / (n * (n-1))
Where xi is each heteroplasmy value from the dataset, µ is the mean of the 36 values and
n is the number of values (n=36). The value u was multiplied by 2 (the value used to
determine at the 95% confidence interval that 2 different values are statistically
different). This predicts a 95% chance that the true value of the assay lies within a range
covered by the result number ± the uncertainty of measurement.
To determine the accuracy of heteroplasmy measurement, 40 m.3243A>G positive DNA
samples (known heteroplasmy level ≥1% determined by tNGS) were tested (Table 9). The
mean tNGS heteroplasmy level of this control dataset was 26% and range was 1%-58.9%.
Linear regression analysis was performed to estimate the degree of relatedness (R-
squared value) and the correlation coefficient. We also used the Bland-Altman method to
determine the level of agreement (bias) between each tNGS and paired ddPCR
measurement (Altman & Bland, 1983), and whether any bias was constant across or
samples or clustered around high or low heteroplasmy levels. This method generates a
graph of every difference between two paired heteroplasmy values (ddPCR minus tNGS
heteroplasmy) plotted against the average of both values for each assay. The bias is the
mean difference between the results from the two assays. Test sensitivity (false negative
rate) was also calculated from the number of positive and negative ddPCR tests (using 1%
heteroplasmy threshold).
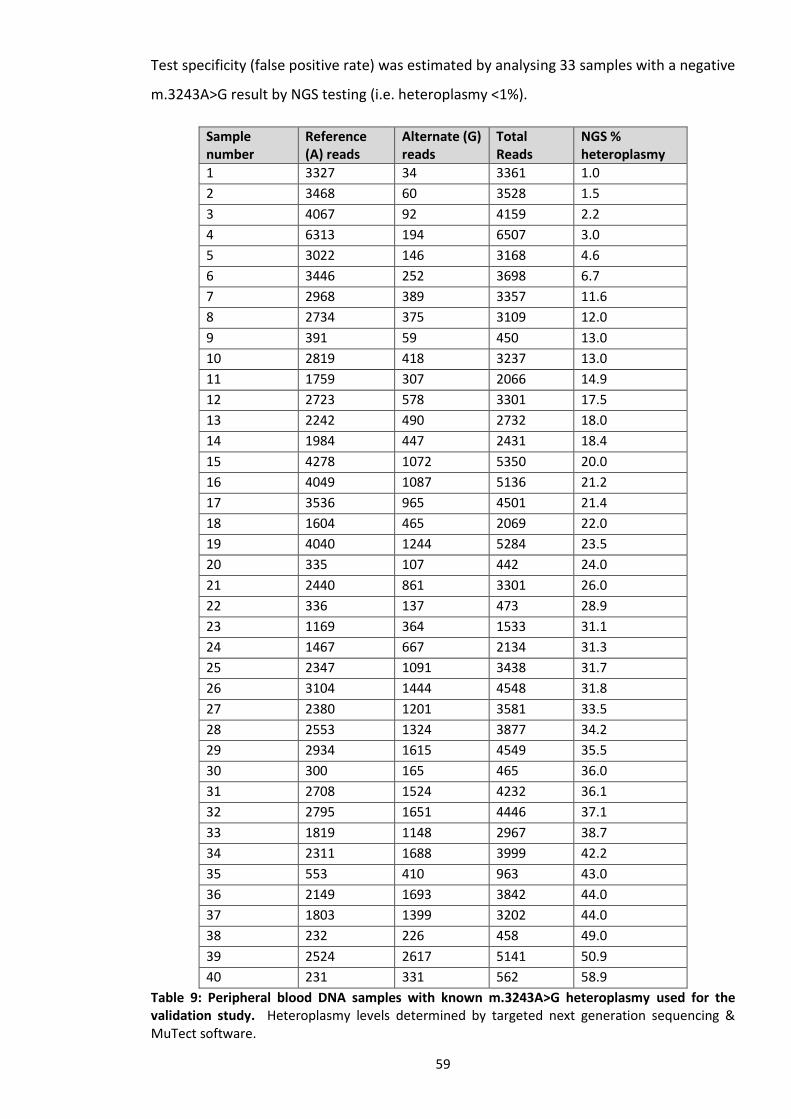
59
Test specificity (false positive rate) was estimated by analysing 33 samples with a negative
m.3243A>G result by NGS testing (i.e. heteroplasmy <1%).
Sample number
Reference (A) reads
Alternate (G) reads
Total Reads
NGS % heteroplasmy
1 3327 34 3361 1.0
2 3468 60 3528 1.5
3 4067 92 4159 2.2
4 6313 194 6507 3.0
5 3022 146 3168 4.6
6 3446 252 3698 6.7
7 2968 389 3357 11.6
8 2734 375 3109 12.0
9 391 59 450 13.0
10 2819 418 3237 13.0
11 1759 307 2066 14.9
12 2723 578 3301 17.5
13 2242 490 2732 18.0
14 1984 447 2431 18.4
15 4278 1072 5350 20.0
16 4049 1087 5136 21.2
17 3536 965 4501 21.4
18 1604 465 2069 22.0
19 4040 1244 5284 23.5
20 335 107 442 24.0
21 2440 861 3301 26.0
22 336 137 473 28.9
23 1169 364 1533 31.1
24 1467 667 2134 31.3
25 2347 1091 3438 31.7
26 3104 1444 4548 31.8
27 2380 1201 3581 33.5
28 2553 1324 3877 34.2
29 2934 1615 4549 35.5
30 300 165 465 36.0
31 2708 1524 4232 36.1
32 2795 1651 4446 37.1
33 1819 1148 2967 38.7
34 2311 1688 3999 42.2
35 553 410 963 43.0
36 2149 1693 3842 44.0
37 1803 1399 3202 44.0
38 232 226 458 49.0
39 2524 2617 5141 50.9
40 231 331 562 58.9
Table 9: Peripheral blood DNA samples with known m.3243A>G heteroplasmy used for the validation study. Heteroplasmy levels determined by targeted next generation sequencing & MuTect software.

60
4.9 Acceptance criteria for the validation study
Before undertaking ddPCR testing of the 190 patients previously tested by TaqMan, the
following validation acceptance criteria had to be met:
1. Probes and primers work as evidenced by generation of mutant and wildtype positive
droplets.
2. Assay is capable of detecting heteroplasmy to a minimum level of 1%
3. All TaqMan positive samples are also positive by ddPCR. This assumes that regardless
of the true limit of detection of the TaqMan assay, the ddPCR assay will have the
same or lower detection limit and would therefore confirm all TaqMan positive results
(assuming the initial Taqman result is not a false positive).
4. All TaqMan negative results are also negative by ddPCR. The caveat here is that some
TaqMan negative tests may be positive by ddPCR if heteroplasmy level is below the
assumed 5% LoD of TaqMan. Therefore a false positive ddPCR result (or false
negative TaqMan result) will only be suspected if the sample has heteroplasmy level
>5%. Since ddPCR will determine that the true LoD of TaqMan will exist between the
lowest heteroplasmy level in the TaqMan positive group and the highest
heteroplasmy level of the negative group, this LoD can be refined for the purposes of
estimating sensitivity and specificity of both assays.
5. The assay meets the CV requirements for precision. This is <10% for intra-assay
variation (repeatability) and <15% for inter-assay variation (reproducibility).
6. The assay’s measurement uncertainty is within 2 standard deviations of the mean
value.
7. Heteroplasmy levels determined by ddPCR are highly and significantly correlated with
those measured by tNGS. This will be determined by linear regression with tNGS
values, with requirements being an r-squared value of >0.90 and a P value <0.05.
8. Heteroplasmy levels determined by ddPCR significantly agree with tNGS heteroplasmy
levels, there is minimal bias in the assay and that any bias that exists is constant
across the range of heteroplasmy levels. This will be determined using a Bland Altman
plot with acceptable bias level of <1% and a visual inspection of the plot for trends in
any bias.

61
4.10 ddPCR analysis of patients referred for mitochondrial diabetes testing
DNA from the 190 TaqMan tested patients was extracted from peripheral blood using
standard procedures. We also included in the heteroplasmy analysis 32 patients with
m.3243A>G detected by tNGS that were tested as part of the assay validation, selected
based on having clinical information and family history provided by the referring clinician.
DNA concentrations were determined using Qubit technology prior to being serially
diluted to 0.015ng/ul. All samples were tested by ddPCR using a 57oC annealing
temperature and 50 cycles for PCR, according the validated methodology described in
section 4.6. All samples were tested in triplicate and droplet data combined into a meta-
well for final analysis of heteroplasmy. Patients were tested alongside a positive control
of known heteroplasmy (~12%), a normal control with heteroplasmy <0.05% and a no
template control. The QC requirements described in section 4.5 were applied to all
samples. Samples failing QC were repeated if sufficient DNA was available to do so, or
excluded from the final analysis. Thresholds for positive fluorescence were manually
assigned for all samples per batch to provide the best separation of the four groups in the
2-D amplitude plot.
All heteroplasmy levels estimated by ddPCR were subsequently adjusted for the patient’s
age at time of blood sampling using the formula described by Grady et al. 2018:
Age-adjusted blood level = (Blood heteroplasmy)/0:977(age+12)
This formula is based on a compound decline of heteroplasmy by ~2.3%/year and includes
an age adjustment to account for the rapid reduction of heteroplasmy seen in early life
(Grady et al., 2018).
4.11 Cost comparison of ddPCR and TaqMan assays
Test costs and time taken for detection of the m.3243A>G mutation were compared for
TaqMan and ddPCR assays. Comparisons were made for the processes from DNA
quantification through to data analysis. DNA extraction and result reporting methods
were identical for both assays and therefore excluded from the comparison analysis.
Reagent costs per sample including VAT at 20% were calculated. Staff costs were
calculated using hourly salary rate based on AFC banding and increment equivalent to the
half way point in the pay scale. Total cost per sample was the sum of reagents and staff
costs.

62
4.12 Statistical analysis
Data were analyzed using STATA 16 (StataCorp, Texas, USA). Linear regression and Bland-
Altman plots were used to determine correlation between tNGS and ddPCR heteroplasmy
estimates, and to assess for assay bias. Linear regression was used to assess correlation
between heteroplasmy levels and continuous clinical traits. The Mann-Whitney U test
and ANOVA were used to compare heteroplasmy levels and discontinuous clinical traits
The Mann-Whitney U test and the Fisher Exact test were used to compare the continuous
and categorical clinical variables of the m.3243A>G positive and negative patients
respectively. The clinical probability of MODY was generated using our validated
published statistical model where data was available for all relevant variables (Shields et
al., 2012). Clopper-Pearson analysis was used to determine 95% confidence intervals
around sensitivity and specificity estimates. A P value of ≤0.05 was considered
statistically significant.
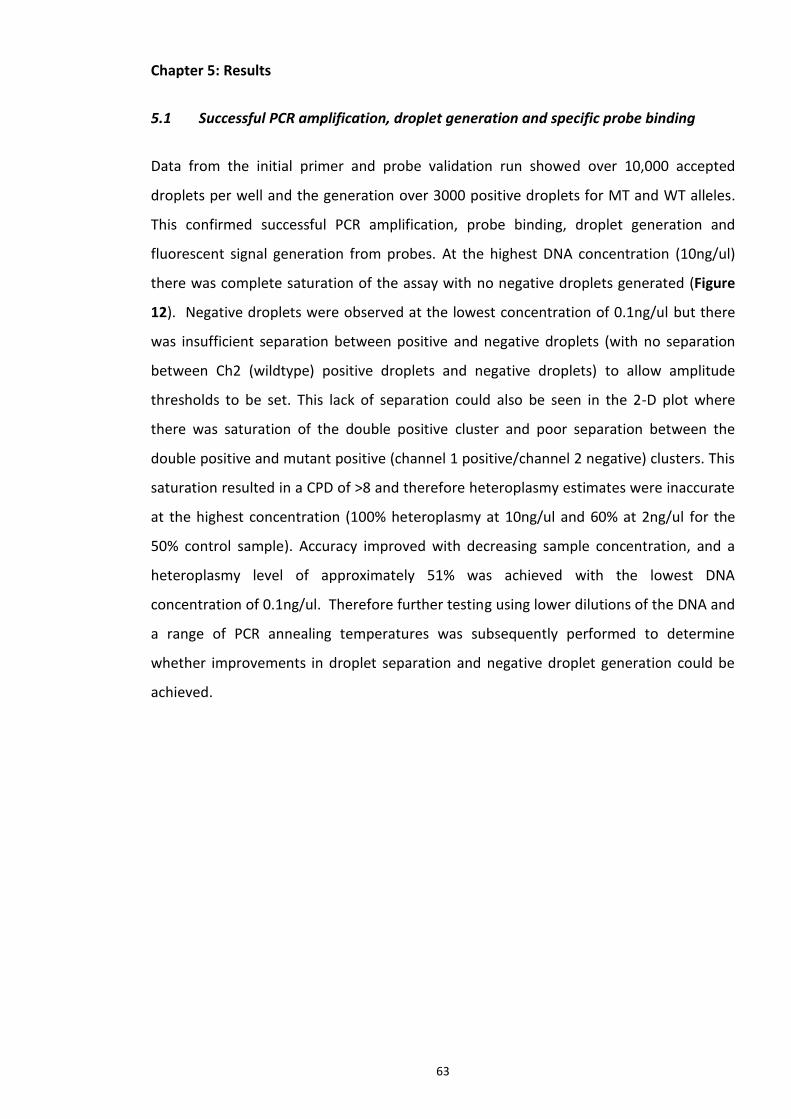
63
Chapter 5: Results
5.1 Successful PCR amplification, droplet generation and specific probe binding
Data from the initial primer and probe validation run showed over 10,000 accepted
droplets per well and the generation over 3000 positive droplets for MT and WT alleles.
This confirmed successful PCR amplification, probe binding, droplet generation and
fluorescent signal generation from probes. At the highest DNA concentration (10ng/ul)
there was complete saturation of the assay with no negative droplets generated (Figure
12). Negative droplets were observed at the lowest concentration of 0.1ng/ul but there
was insufficient separation between positive and negative droplets (with no separation
between Ch2 (wildtype) positive droplets and negative droplets) to allow amplitude
thresholds to be set. This lack of separation could also be seen in the 2-D plot where
there was saturation of the double positive cluster and poor separation between the
double positive and mutant positive (channel 1 positive/channel 2 negative) clusters. This
saturation resulted in a CPD of >8 and therefore heteroplasmy estimates were inaccurate
at the highest concentration (100% heteroplasmy at 10ng/ul and 60% at 2ng/ul for the
50% control sample). Accuracy improved with decreasing sample concentration, and a
heteroplasmy level of approximately 51% was achieved with the lowest DNA
concentration of 0.1ng/ul. Therefore further testing using lower dilutions of the DNA and
a range of PCR annealing temperatures was subsequently performed to determine
whether improvements in droplet separation and negative droplet generation could be
achieved.

64
Figure 12: 1-D plot for ddPCR primer, probe and hardware testing. DNA samples at 0.1, 1, 2 and 10ng/ul using 52oC annealing temperature. Ch1 (blue) is mutant probe, Ch2 (green) is wildtype. Pink line represents amplitude threshold for positive droplet calling. Samples tested in duplicate except 10ng/ul and NTC.
5.2 Improved droplet separation and heteroplasmy estimation with lower DNA
sample concentration and annealing temperature
Further optimisation was performed using DNA concentrations of 0.1ng/ul and 0.05ng/ul,
and a temperature gradient PCR ranging from annealing temperatures of 55 to 65oC. The
degree of separation between positive and negative droplets increased with decreasing
annealing temperature, with an optimum separation seen at 57oC. Better separation was
also observed with the lower DNA concentration of 0.05ng/ul (Figure 13A). All wells
contained >10,000 droplets and WT droplet calls were >3000 enabling a limit of detection
to 0.1%. The normal control contained no mutant positive droplets and the 2-D plot
confirmed successful generation and separation of positive and negative droplets (Figure

65
13B). It was possible to set clear thresholds for determining the different clusters of
droplets. The double positive cluster contained >100 droplets and the amplitude of the
double negative droplets indicated good droplet generation. There was no 45 degree
spray of droplets through the plot. At a DNA concentration of 0.05ng/ul and an annealing
temperature of 57oC the fractional abundance was 51% (Figure 13C). Heteroplasmy
estimates for a sample with 50% heteroplasmy were similar for 0.1ng/ul and 0.05ng/ul
but there was better separation between positive and negative droplets for 0.05ng/ul due
to lower positive droplet density.
Based on this data an annealing temperature of 57oC and cycle number of 50 was chosen
for the PCR cycling conditions. The data showed improving separation with lower DNA
concentration but this had only been performed for a single heteroplasmy value of 50%,
and the effect of DNA concentration on accuracy of heteroplasmy measurement for low,
intermediate and high heteroplasmy was not known. Further testing was therefore
performed using concentrations of 0.03, 0.015 and 0.003ng/ul and seven different
heteroplasmy levels: 0.16, 0.53, 1.01, 1.71, 11.6, 25.2 and 61.3%.

66
Fig 13: 1D, 2D and fractional abundance plots for DNA concentration optimisation. A) 1D plot
showing positive and negative droplets for 0.1ng/ul and 0.05ng/ul DNA concentrations across a
temperature gradient PCR ranging from 65oC (well A) down to 55oC (well H); B) 2D plot showing
droplet clusters generated according to signal from the mutant and wildtype probes. Blue =
channel 1 positive (mutant) only, Orange = double positive (mutant and wildtype), Black = double
negative (no fluorescence) and Green = channel 2 positive (wildtype) only. Pink lines represent
C
B
A

67
threshold settings for detecting a fluorescent signal from each channel; C) Fractional abundance
of the m.3243A>G mutation in DNA samples at 0.1ng/ul and 0.05ng/ul at various annealing
temperatures. Samples A01 to H01 = 0.1ng/ul and A02 to H02 = 0.05ng/ul. Temperature gradient
PCR ranging from 65oC (well A) down to 55oC (well H).
5.3 Heteroplasmy estimates are accurate at low, intermediate and high
heteroplasmy levels for a single DNA sample concentration
Linear regression analysis showed a strong correlation for ddPCR vs tNGS heteroplasmy
for low (0.003ng/ul), intermediate (0.015ng/ul) and high (0.03ng/ul) DNA concentrations
(R2 = 0.99, P = <0.001 for all concentrations). There was no difference in strength of
correlation between the different concentrations. All mean ddPCR heteroplasmy
estimates were within ±3 SD of the tNGS value (Table 10). Inter-assay (reproducibility) CV
values taken from the mean values from all three dilutions per plate were within
acceptable range of <15% for all heteroplasmy values. Intra-assay variation
(repeatability) CV values were higher for lower heteroplasmy samples and were slightly
above the threshold of 10% for 0.16 (CV=12.9%) and 1.0% (CV=13.3%). Two large Inter-
assay CV outliers for the lowest DNA concentration were noted for 0.16 and 1.7%
suggesting that accurate pipetting is critical for lower DNA concentrations. Measurement
uncertainty was less than or equal to the standard deviation for all heteroplasmy
samples. Therefore selection of optimal DNA concentration was made based on the
degree of droplet separation between positive and negative droplets and therefore the
ease at which the channel 1 amplitude threshold could be set. This was chosen to be
0.015ng/ul and this dilution factor was used for all further tests.

68
DNA concentration (ng/ul)
tNGS % heteroplasmy
ddPCR % heteroplasmy Day 1
ddPCR % heteroplasmy Day 2
ddPCR % heteroplasmy Day 3
Mean ± SD Inter-assay CV (%)
U (95% CI)
0.003 0.16 0.20 0.18 0.13 0.17±0.04 21.2 0.04%
0.015 0.16 0.16 0.16 0.15 0.16±0.01 3.7 0.01%
0.03 0.16 0.15 0.13 0.14 0.14±0.01 7.1 0.01%
Mean ± SD 0.17±0.03 0.16±0.03 0.14±0.01 0.16±0.02 9.7 0.02%
Intra-assay CV (%) 15.6 16.1 7.1 12.9
0.003 0.53 0.59 0.58 0.61 0.59±0.02 2.6 0.02%
0.015 0.53 0.61 0.70 0.65 0.65±0.05 6.9 0.05%
0.03 0.53 0.72 0.71 0.63 0.69±0.05 7.2 0.06%
Mean ± SD 0.64±0.07 0.66±0.07 0.63±0.02 0.64±0.05 2.7 0.02%
Intra-assay CV(%) 10.9 10.9 3.2 8.3
0.003 1.0 0.7 0.7 0.9 0.8±0.1 15.1 0.12%
0.015 1.0 1.1 0.8 1.0 1.0±0.2 15.8 0.18%
0.03 1.0 0.9 0.8 1.1 0.9±0.2 16.4 0.18%
Mean ± SD 0.9±0.2 0.8±0.1 1.0±0.1 0.9±0.2 13.2 0.12%
Intra-assay CV (%) 22.2 7.5 10.0 13.3
0.003 1.7 2.3 1.6 2.2 2.0±0.4 18.6 0.44%
0.015 1.7 2.1 2.0 1.9 2.0±0.1 5.0 0.12%
0.03 1.7 2.0 2.0 1.9 2.0±0.1 2.9 0.07%
Mean ± SD 2.1±0.2 1.9±0.2 2.0±0.2 2.0±0.2 6.7 0.12%
Intra-assay CV (%) 7.2 12.4 8.7 9.4
0.003 11.6 12.9 11 12.4 12.1±1.0 8.1 1.14%
0.015 11.6 13.0 12.5 13.4 13.0±0.5 3.5 0.52%
0.03 11.6 12.4 12.7 12.7 12.6±0.2 1.4 0.20%
Mean ± SD 12.8±0.3 12.1±0.9 12.8±0.5 12.6±0.7 3.4 0.47%
Intra-assay CV (%) 2.5 7.7 4.0 4.7
0.003 25.2 28.9 29.6 30.2 29.6±0.7 2.2 0.75%
0.015 25.2 28.6 27.5 28.4 28.2±0.6 2.1 0.68%
0.03 25.2 28.1 29.1 29.2 28.8±0.6 2.1 0.70%
Mean ± SD 28.5±0.4 28.7±1.1 29.3±0.9 28.8±0.8 1.3 0.48%
Intra-assay CV (%) 1.4 3.8 3.1 2.8
0.003 61.3 63.1 63.7 64.0 63.6±0.5 0.7 0.53%
0.015 61.3 63.0 63.4 65.0 63.8±1.1 1.7 1.22%
0.03 61.3 64.2 63.7 64.5 64.1±0.4 0.6 0.47%
Mean ± SD 63.4±0.7 63.6±0.2 64.5±0.5 63.8±0.7 0.9 0.68%
Intra-assay CV (%) 1.0 0.3 0.8 0.7
Table 10: Heteroplasmy levels and precision estimated for DNA concentrations 0.003, 0.015 and 0.03ng/ul. Seven different heteroplasmy levels were each tested in triplicate on three consecutive days. Intra (within run) and inter (between run) assay CV calculated by SD divided by mean. U = measurement uncertainty calculated using the equation described in the methods section.
5.4 ddPCR estimates m.3243A>G heteroplasmy with a high degree of precision
Due to the small numbers of samples used to calculate Inter-assay variation in table 10,
further validation was performed by analysis of a DNA sample with estimated
heteroplasmy level of ~12% tested in triplicate across 12 separate runs. The mean
heteroplasmy level from the mean of 12 runs was 12.5%, SD was ±0.47% and inter-assay
CV was 3.7% (Table 11). This was within the accepted threshold of <15% and the assay
therefore met reproducibility requirements for a diagnostic assay. Uncertainty of
measurement was estimated to be ±0.24% at the 95% CI

69
Plate number Result 1 Result 2 Result 3 Plate Mean heteroplasmy
1 11.8 12.0 11.2 11.7
2 14.0 12.0 12.9 13.0
3 12.2 12.9 11.9 12.3
4 12.9 11.8 12.5 12.4
5 12.3 12.6 12.9 12.6
6 12.4 12.0 12.0 12.1
7 12.5 12.0 12.0 12.2
8 11.8 13.6 12.5 12.6
9 13.4 13.6 12.2 13.1
10 13.5 13.4 12.3 13.1
11 13.1 13.6 11.9 12.9
12 12.4 12.1 11.1 11.9
mean of means 12.5
SD of means ±0.47
Inter-assay CV (%) 3.7
Uncertainty (u) 0.12
Mean with uncertainty
12.5 ±0.24% at the 95% CI
Table 11: Further assessment of inter-assay CV and measurement uncertainty. Inter-assay CV and measurement uncertainty calculated from the same sample with heteroplasmy level estimated at ~12% tested 36 times across 12 days (three tests per day).
The previous intra-assay estimates in table 10 may have been confounded by the
different DNA concentrations used and the small numbers of samples. Further validation
of intra-assay performance was therefore carried out by analysis of a DNA sample of
concentration 0.015ng/ul and estimated heteroplasmy level of ~9% tested across 6
separate wells on the same plate under the same test conditions. The mean
heteroplasmy from the 6 replicates was 9.5%. The SD was ±0.23 and the intra-assay CV
was 2.4%, within the acceptable level of <10% and meeting the repeatability
requirements for a diagnostic assay (Table 12).

70
Sample Allele positive droplets
negative droplets
total droplets
total volume of droplets (ul) where 1 droplet = 1nl
copies per droplet
total copies copies per ul % proportion of mutant copies (heteroplasmy)
1 Mutant 461 12094 12555 12.555 0.037 470 37 9.68
Wildtype 3701 8854 12555 12.555 0.349 4385 349
2 Mutant 510 12967 13477 13.477 0.039 520 39 9.67
Wildtype 4078 9399 13477 13.477 0.360 4857 360
3 Mutant 516 12954 13470 13.47 0.039 526 39 9.43
Wildtype 4212 9258 13470 13.47 0.375 5051 375
4 Mutant 286 14793 15079 15.079 0.019 289 19 9.26
Wildtype 2580 12499 15079 15.079 0.188 2830 188
5 Mutant 250 12934 13184 13.184 0.019 252 19 9.22
Wildtype 2266 10918 13184 13.184 0.189 2486 189
6 Mutant 308 15624 15932 15.932 0.020 311 20 9.67
Wildtype 2655 13277 15932 15.932 0.182 2904 182
Mean 9.5
SD ±0.23
Intra-assay CV (%) 2.4
Positive Control (50%) Mutant 995 10533 11528 11.528 0.090 1041 90 49.74
Wildtype 1005 10523 11528 11.528 0.091 1052 91
Normal control Mutant 0 13655 13655 13.655 0.000 0 0 0.00
Wildtype 1452 13960 15412 15.412 0.099 1525 99
NTC Mutant 0 13575 13575 13.575 0.000 0 0 0.00
Wildtype 0 13575 13575 13.575 0.000 0 0
Table 12: Further assessment of intra-assay CV. Intra-assay CV calculated from the same sample with heteroplasmy level estimated at ~9% tested 6 times within a single plate under the same test conditions.
70

71
5.5 ddPCR is a sensitive and specific assay for detecting the m.3243A>G mutation
and accurately determines heteroplasmy
To determine test sensitivity, 40 DNA samples with a known heteroplasmy level ≥1%
determined by NGS were tested. A positive ddPCR result was obtained for all tNGS
positive control samples (Table 13 and Figure 14A). With no false negative results the
test sensitivity was estimated to be 100% based on a lower limit of detection of 1%
heteroplasmy (Clopper-Pearson 95% CI 92 to 100%). The mean ± SD heteroplasmy level
of this control dataset was 26.2 ± 14.5% for tNGS (SE 2.3, 95% CI 21.5 to 30.8) and 26.9 ±
14.5% for ddPCR (SE 2.3, 95% CI 22.3 to 31.5). There was no significant statistical
difference between the groups (P=0.27) (Figure 14B). Linear regression analysis showed
significant correlation between NGS and ddPCR heteroplasmy levels with R2 = 0.99 (n=40,
P < 0.001, 95% CI 0.989 to 0.997) (Figure 14C). To estimate the mean difference (or bias)
between the ddPCR and tNGS methods and to identify outliers a Bland-Altman plot was
generated (Figure 14D). A small bias was detected with ddPCR heteroplasmy estimates
0.7% higher than tNGS; the mean difference between ddPCR and tNGS heteroplasmy was
+0.72% ± 1.3% for ddPCR (SE=0.20, 95% CI 0.31 to 1.1%). Upper and lower limits of
agreement (LoA) at the 95% confidence interval were calculated by adding (for the upper
limit) and subtracting (for the lower limit) the SD x 1.96 from the mean difference to give
an upper LoA of 3.2% and a lower LoA of 1.6%. This predicts with 95% confidence that a
heteroplasmy level determined by ddPCR could be 1.6% below or 3.2% above the value
estimated by tNGS. There were no outliers above the mean difference, and one outlier
below with a difference of -1.74%.

72
Sample number
Reference (A) reads
Alternate (G) reads
Total Reads
NGS % heteroplasmy
ddPCR % heteroplasmy
1 3327 34 3361 1.0 1.2
2 3468 60 3528 1.5 1.8
3 4067 92 4159 2.2 2.4
4 6313 194 6507 3.0 3.2
5 3022 146 3168 4.6 4.2
6 3446 252 3698 6.7 7.0
7 2968 389 3357 11.6 13.2
8 2734 375 3109 12.0 14.2
9 391 59 450 13.0 13.4
10 2819 418 3237 13.0 12.7
11 1759 307 2066 14.9 16.3
12 2723 578 3301 17.5 18.4
13 2242 490 2732 18.0 18.2
14 1984 447 2431 18.4 20.6
15 4278 1072 5350 20.0 21.8
16 4049 1087 5136 21.2 22.8
17 3536 965 4501 21.4 20.9
18 1604 465 2069 22.0 24.2
19 4040 1244 5284 23.5 21.8
20 1169 364 1533 23.7 29.4
21 335 107 442 24.0 23.4
22 2440 861 3301 26.0 27.6
23 336 137 473 28.9 28.8
24 1467 667 2134 31.3 33.7
25 2347 1091 3438 31.7 32.6
26 3104 1444 4548 31.8 33.3
27 2380 1201 3581 33.5 35.6
28 2553 1324 3877 34.2 32.8
29 2934 1615 4549 35.5 35.3
30 300 165 465 36.0 34.7
31 2708 1524 4232 36.1 37.7
32 2795 1651 4446 37.1 38.0
33 1819 1148 2967 38.7 39.9
34 2311 1688 3999 42.2 43.0
35 553 410 963 43.0 44.4
36 2149 1693 3842 44.0 47.0
37 1803 1399 3202 44.0 44.8
38 232 226 458 49.0 53.1
39 2524 2617 5141 50.9 50.7
40 230 332 562 58.9 57.4
Table 13: ddPCR heteroplasmy measurements in the validation cohort. 40 peripheral blood DNA samples with known m.3243A>G heteroplasmy determined by tNGS & and heteroplasmy levels determined by ddPCR.

73
Fig. 14: Comparison of m.3243A>G heteroplasmy test results from ddPCR and tNGS methodologies (N = 40). A) Heteroplasmy estimated from ddPCR and tNGS for each of the 40 samples used in the replication cohort. Orange squares represent heteroplasmy levels determined by ddPCR and blue diamonds by tNGS. B) Dot plot comparison of heteroplasmy for tNGS and ddPCR methodologies. Red crosses represent the mean heteroplasmy levels (n=40, 26% for tNGS vs 27% for ddPCR, P = 0.27).
A
B

74
Fig. 14: Comparison of m.3243A>G heteroplasmy test results from ddPCR and tNGS methodologies (N = 40). C) Correlation by linear regression between ddPCR and tNGS. The fitted red line is the predicted linear regression with the grey shading representing the 95% CI (R2 = 0.994, n=40, P=<0.001) D) Estimation of bias between ddPCR and tNGS test results using a Bland-Altman graph. The Bland-Altman graph represents every difference between two paired heteroplasmy values (ddPCR minus tNGS heteroplasmy) plotted against the average of both values for each methodology. The purple line represents the mean difference (bias) between the results from the two assays, estimated to be +0.72% for ddPCR vs tNGS. The top green line and the bottom red line are the upper and lower limits of agreement at the 95% CI (1.96 x SD).
-1.96 SD
-1.6
Mean
0.72
+1.96 SD
3.2
D
R2 = 0.994, n=40, P=<0.001, 95% CI 0.989 to 0.997
C

75
Test specificity was estimated by analysing 33 samples with a negative m.3243A>G result
based on a heteroplasmy level of <1% determined by tNGS testing. A negative ddPCR
result with heteroplasmy level <1% (mean 0.11%, SD 0.18) was obtained for all samples.
With no false positive results the test specificity was estimated to be 100% based on a
lower limit of detection of 0.01% heteroplasmy (Clopper-Pearson 95% CI 90-100%).
5.6 Threshold settings for positive droplet classification accounts for a small
proportion of ddPCR bias
To account for the +0.7% variation in heteroplasmy estimates between ddPCR and tNGS,
we investigated the effect of selecting a low, intermediate and high threshold for calling
channel 1 positive droplets. We selected 17 samples from the tNGS validation cohort
with mean heteroplasmy 22% (IQR 13 to 24%, range 4.2 to 53%), and determined
heteroplasmy at three different threshold settings. An example of the different threshold
settings is given in Figure 15. We saw an average increase in heteroplasmy from high to
intermediate threshold setting of 0.21% (SD±0.08%, range 0.1 to 0.4%), 0.21% from
intermediate to low (SD±0.09%,, range 0 to 0.3) and 0.42% from high to low (SD±0.14%,,
range 0.1 to 0.6). An intermediate setting was selected to give the best balance between
accuracy and test sensitivity & specificity. Repeat analysis of the positive tNGS validation
cohort using an intermediate setting returned a similarly high correlation and a reduction
in the bias to +0.50% (R2 = 0.996, n=40, P=<0.001, 95% CI 0.991 to 0.998).

76
Figure 15: examples of low, intermediate and high heteroplasmy threshold settings. Threshold settings used a fixed Channel 2 threshold but a variable channel 1 threshold visually assigned according to proximity to the channel 1 +ve/channel 2-ve (green) and double positive (orange clusters). A) Low threshold with closest proximity to channel 1 +ve/channel 2-ve, B) intermediate threshold set approximately halfway between channel 1 +ve/channel 2-ve and double positive clusters, and C) high threshold with closest proximity to double positive cluster.
C
A B

77
5.7 Successful validation of the ddPCR assay for m.3243A>G analysis
After completing all validation testing, the acceptance criteria in methods section 4.9
were assessed to determine if the assay could be used for diagnostic testing purposes.
The outcomes are provided in table 14 confirming successful validation and acceptance of
the assay for testing of the TaqMan cohort.
Criteria Criteria met?
Evidence
Probes and primers work (positive droplets >3000 across 3 wells)
Yes Primers and probes work based on droplets >3000 and presence of channel 1 and 2 signals
heteroplasmy LoD is 1% Yes Assay accurately detects to 1%
No false negative results (100% Sensitivity) Yes All tNGS positive results confirmed
No false positive results (100% specificity) Yes All tNGS negative results confirmed
CV <10% for intra-assay variation (repeatability) Yes intra-assay CV 2.7%
CV <15% for inter-assay variation (reproducibility)
Yes inter-assay CV 3.7%
uncertainty is within ±2 SD of the mean Yes Uncertainty ±0.24% at the 95% CI, with SD ±0.50%
Heteroplasmy correlated with tNGS (r-squared value of >0.90 and a P value <0.05)
Yes r-squared value of >0.99 and a P value <0.001
Bias <1% Yes Bias 0.7%
Table 14: acceptance criteria for successful validation of the ddPCR, assay, outcome and evidence for meeting criteria.
5.8 Clinical and biological characteristics of the patient cohorts
The validated ddPCR assay and analysis parameters were subsequently used to determine
heteroplasmy levels in patients referred to the Exeter laboratory for diagnostic testing of
monogenic diabetes. We tested 119 patients with a previously positive m.3243A>G result
by TaqMan and 71 patients with a negative TaqMan result. We performed regression
analysis for all positive samples with heteroplasmy >1% to determine relationship
between heteroplasmy and clinical features. Included in this regression analysis were 32
patients with m.3243A>G detected by tNGS that were used in the validation of the assay
to give a total of 151 positive patients.
The clinical and biological characteristics of the 151 patients with a positive m.3243A>G
result and the 71 with a negative result are presented in Table 14. The median age of the
m.3243A>G positive cohort at time of genetic testing was 41 years. Diabetes was

78
diagnosed in 137 patients (91%) with median age of diagnosis 31 years and median
diabetes duration 6 years. Median BMI was 22.5, HbA1c 7.5% (58.5mmol/mol) and
80/114 (70%) were insulin treated at time of genetic testing. 59% of patients had at least
one additional extra-pancreatic clinical feature, with hearing impairment the most
commonly reported (78/151, 52%). Other clinical features were rare but included cardiac
and skeletal muscle myopathy (3 patients) and neurological problems including learning
difficulties, ataxia, seizures and stroke-like episodes (5 patients). 63% of patients had a
mother affected with diabetes and/or deafness, and 44% had a maternal family history of
deafness. Patients with a negative TaqMan result were clinically similar to the positive
group except for a higher BMI (22.5 vs 27.1, P = <0.001) and had a higher proportion with
clinician-reported hearing impairment (52% vs 87%, P = <0.001%).
m.3243A>G positive (n=151) m.3243A>G negative (n=71) P
Age at time of testing 41 (32-50), 151 44 (33-59), 71 0.09
Diabetes 137/151 (91) 68/71 (96) 0.30
Age at DM diagnosis, years 31 (23-39), 117 34 (17-43), 59 0.99
DM Duration, years 6 (1-14), 117 9 (4-22), 59 0.01
Sex (Female) 105/151 (70) 52/71 (73) 0.64
Ethnicity (White) 138/151 (91) 57/71 (80) 0.03
BMI 22.5 (20-25.6), 87 27.1 (24-34.5), 47 <0.001
Height 1.60 (1.54-1.66), 51 1.61 (1.54-1.68), 34 0.46
Any extra-pancreatic features
89/151 (59) 62/71 (87) <0.001
Number of additional features (1,2, 3, 4 or 5)
73, 7, 2, 0, 0 49, 11, 1, 0, 1 -
Deafness 78/151 (52) 62/71 (87) <0.001
Neurological (seizures, epilepsy, DD, autism, LD)
5/151 (4) 3/71 (4) 0.71
Cardiac or skeletal muscle myopathy
3/151 (3) 2/71 (3) 0.66
renal disease 3/151 (3) 4/71 (6) 0.21
Retinal changes 4/151 (3) 5/71 (7) 0.15
maternal family history of deafness
67/151 (44) 47/71 (66) 0.15
mother with diabetes and/or deafness
95/120 (79) 49/61 (80) 0.99
HbA1c (% NGSP) 7.5 (6.8-8.7), 80 7.9 (7.1-9.6), 48 0.21
HbA1c (mmol/mol IFCC) 58.5 (50.8-71.6), 80 62.8 (54.1-81.4), 48 0.21
Insulin treated 80/114 (70) 36/57 (63) 0.39
Table 15: clinical and biological characteristics of the m.3243A>G positive and negative groups. Positive cohort consists of 119 patients with a positive TaqMan result and 32 patients with a positive ddPCR result, and negative cohort are patients with a negative TaqMan result. Data is in the format median, (IQR), n for continuous variables and n (%) for categorical variables. DM = diabetes mellitus, DD = developmental delay, LD = learning difficulties.

79
5.9 TaqMan has a limit of detection of 2% and ddPCR does not increase diagnostic
yield
Droplet digital PCR testing detected the m.3243A>G mutation in all 119 patients with a
previous TaqMan positive result. The mean heteroplasmy level in this group was 24.9%
±13.9% (SE 1.13, 95% CI 22.7 to 27.2). All TaqMan positive patients had a heteroplasmy
level ≥2% (range 2% to 66%) (Figure 16A). The mean heteroplasmy level of the 71
patients with a negative TaqMan result was 0.04% ±0.04% (SE 0.05, 95% CI 0.34 to 0.54).
All patients with a negative TaqMan result had a heteroplasmy level <1% (range 0.01% to
0.23%) and none of the 190 TaqMan tested patients had a heteroplasmy level between
1% and 2%. (Figure 16B). Therefore ddPCR demonstrated that the true limit of detection
of the TaqMan assay was 2%.
Figure 16: ddPCR heteroplasmy results of TaqMan positive and negative groups. A) ddPCR heteroplasmy estimates for TaqMan positive (n=71) and (TaqMan negative (n=119) patients; B) graph with zoomed in scale of 0 to 10% heteroplasmy to show patients with low level heteroplasmy levels. TaqMan limit of detection estimated as 2%, and ddPCR to 0.01%.
Our cohort included 21 mothers with a child positive for m.3243A>G. Twenty were
positive but interestingly one mother tested negative for the mutation in her blood
sample (heteroplasmy 0.07%) but had a child affected with diabetes and deafness and a
m.3243A>G heteroplasmy level of 19%. She had two other daughters with type 2
diabetes and a fourth who was clinically unaffected, all with heteroplasmy levels <0.1%
(Figure 17). There was a strong family history of later onset type 2 diabetes in maternal
and paternal relatives. It is possible that the variant has arisen de novo in the daughter
with diabetes and deafness and the other daughters and mother are type 2 diabetes
phenocopies (supported by their later ages of diagnosis and higher BMIs). No other
A B
A B
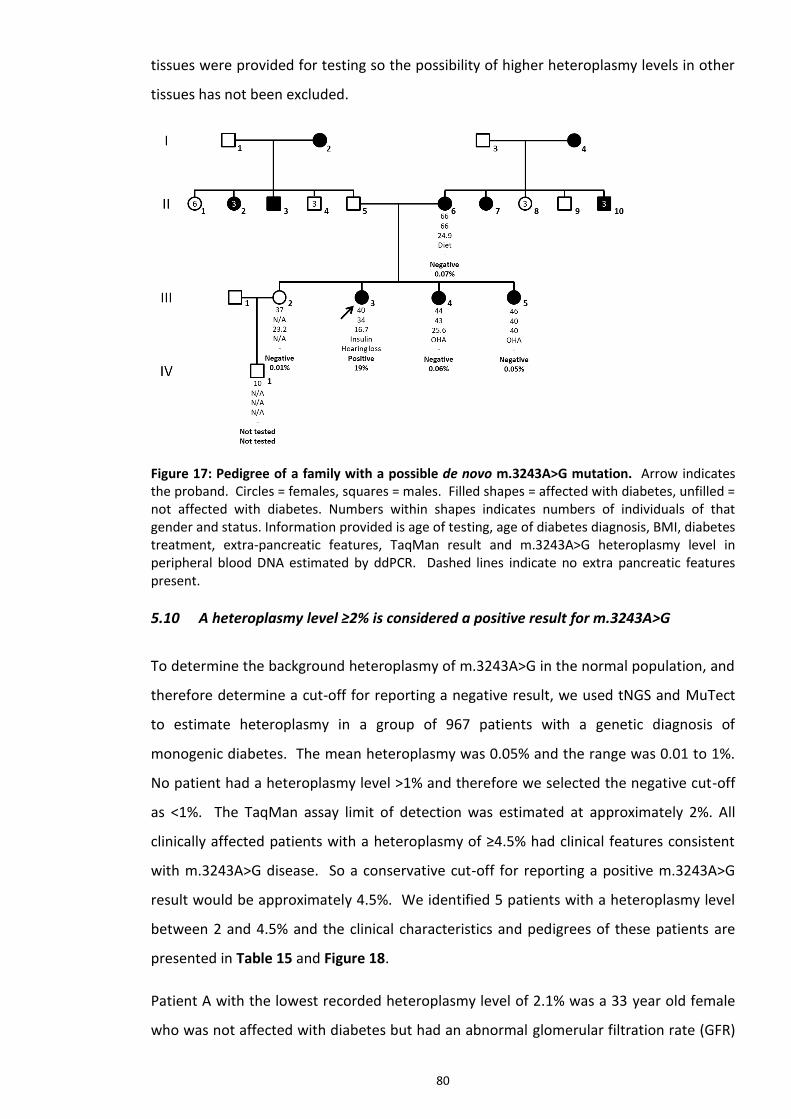
80
tissues were provided for testing so the possibility of higher heteroplasmy levels in other
tissues has not been excluded.
Figure 17: Pedigree of a family with a possible de novo m.3243A>G mutation. Arrow indicates the proband. Circles = females, squares = males. Filled shapes = affected with diabetes, unfilled = not affected with diabetes. Numbers within shapes indicates numbers of individuals of that gender and status. Information provided is age of testing, age of diabetes diagnosis, BMI, diabetes treatment, extra-pancreatic features, TaqMan result and m.3243A>G heteroplasmy level in peripheral blood DNA estimated by ddPCR. Dashed lines indicate no extra pancreatic features present.
5.10 A heteroplasmy level ≥2% is considered a positive result for m.3243A>G
To determine the background heteroplasmy of m.3243A>G in the normal population, and
therefore determine a cut-off for reporting a negative result, we used tNGS and MuTect
to estimate heteroplasmy in a group of 967 patients with a genetic diagnosis of
monogenic diabetes. The mean heteroplasmy was 0.05% and the range was 0.01 to 1%.
No patient had a heteroplasmy level >1% and therefore we selected the negative cut-off
as <1%. The TaqMan assay limit of detection was estimated at approximately 2%. All
clinically affected patients with a heteroplasmy of ≥4.5% had clinical features consistent
with m.3243A>G disease. So a conservative cut-off for reporting a positive m.3243A>G
result would be approximately 4.5%. We identified 5 patients with a heteroplasmy level
between 2 and 4.5% and the clinical characteristics and pedigrees of these patients are
presented in Table 15 and Figure 18.
Patient A with the lowest recorded heteroplasmy level of 2.1% was a 33 year old female
who was not affected with diabetes but had an abnormal glomerular filtration rate (GFR)

81
and a family history of deafness, diabetes and renal disease affecting her mother and
maternal grandmother. It is possible that her abnormal GFR is early m.3243A>G related
renal disease (focal segmental glomerulosclerosis (FSGS) is a known renal phenotype
associated with m.3243A>G (Hotta et al., 2001)) but a renal biopsy is required to confirm
this.
Patient B with a heteroplasmy level of 2.4% was a healthy 44 year old female who was
part of a larger family with a strong family history of diabetes and extra-pancreatic
disease and an inheritance pattern consistent with a mitochondrial disorder (Figure 18B).
Her mother, maternal grandparents, aunt, cousin and all 4 siblings also had diabetes. Her
mother, aunt and two brothers with diabetes also had hearing loss, and her mother and a
brother had additional neurological problems including epilepsy. TaqMan genotyping for
m.3243A>G was performed for the proband and the mutation was detected. ddPCR
confirmed the mutation and estimated heteroplasmy at 31%. The mutation was also
detected by TaqMan in two affected brothers and cousin, but not her unaffected sister
and the brother with diabetes and epilepsy. ddPCR testing of the sister subsequently
identified the mutation at a heteroplasmy level of 2.4% but did not detect a low level
heteroplasmy in the brother. Further TaqMan testing of a urine sample from the brother
also excluded the presence of the mutation to a level of about 5% heteroplasmy. We
therefore could not confirm a diagnosis of mitochondrial diabetes in the brother. His
diabetes and epilepsy could have a different aetiology (type 1 or type 2 diabetes) but
there was insufficient clinical information to determine this. We also could not exclude
the possibility of the mutation being present at a much higher heteroplasmy level in other
clinically relevant issues that could not be sampled.
Patient C with a heteroplasmy level of 3.2% was an 18 year old female with diabetes
diagnosed aged 14 years. She had been insulin treated from diagnosis but stopped insulin
for the 6 months prior to genetic testing with no DKA. She tested negative for GAD, IA2
and ZnT8 pancreatic auto-antibodies and had a blood C-peptide of 434pmol/L four years
post-diagnosis of diabetes. Her BMI was 26 and she had no additional extra-pancreatic
features. Her mother, maternal grandmother and maternal great uncle (grandmother’s
brother) have type 2 diabetes, and her mother and maternal grandmother also have
some hearing loss.
Patient D with heteroplasmy level 3.6% was a 50 year old female with diabetes diagnosed
aged 35 years. She had a family history of diabetes affecting her daughter (diagnosed

82
aged 24 years), sister (diagnosed aged 40 years) and mother. There was no personal or
family history of deafness or any additional extra-pancreatic features suggestive of
m.3243A>G related disease. The m.3243A>G variant was detected at a heteroplasmy
level of 34% by tNGS in her daughter who was referred for MODY genetic testing.
Patient E with heteroplasmy level 4.2% was a 49 year old female who was not reported to
be affected with diabetes or have any other features associated with mitochondrial
disease. She was tested following the detection of the m.3243A>G mutation in her
daughter (the proband) who was diagnosed with diabetes at aged 15 years. A diagnosis
of type 1 diabetes was suspected in the proband and insulin was commenced with a total
daily dose of 0.6units/kg/day. She tested negative for GAD and ICA pancreatic auto-
antibodies. She had short stature (height 1.45 metres, 0.4th centile), BMI of 20.2 and
heavy proteinuria in the range suggestive of nephrotic syndrome. There was no clinician
reported hearing loss or any other extra-pancreatic features in her or her family, nor was
there any reported family history of diabetes. Testing by tNGS for a possible diagnosis of
MODY detected the m.3243A>G variant in peripheral blood DNA at a very high
heteroplasmy level of 65%. The mutation was not detected in her clinically unaffected
brother or mother by TaqMan genotyping. The brother was tested by ddPCR and was
negative (heteroplasmy 0.01%).
Further TaqMan analysis of DNA from a urine epithelial sample was possible for the
patients with heteroplasmy levels of 2.4, 3.2 and 3.6%. TaqMan was able to detect the
variant at a level ≥2% but exact heteroplasmy level was not determined. Therefore a
m.3243A>G positive test report was issued for these patients based on blood and urine
heteroplasmy levels ≥2%. This suggests that patients with a blood heteroplasmy level
>2% should be considered positive for m.3243A>G if they have clinical features or a family
history consistent with m.3243A>G related disease. If there are any doubts regarding the
clinical significance of a heteroplasmy level between 1% and 2% then this could be
reported as uncertain and further testing of a urine sample recommended.
Therefore applying a cut-off ≥2% for reporting an m.3243A>G test as positive resulted in
100% sensitivity and 100% specificity for m.3243A>G detection for TaqMan and ddPCR
assays. There were no additional cases diagnosed in the TaqMan negative group by
ddPCR, and ddPCR did not increase the yield of m.3243A>G diagnosis over and above
TaqMan testing alone.
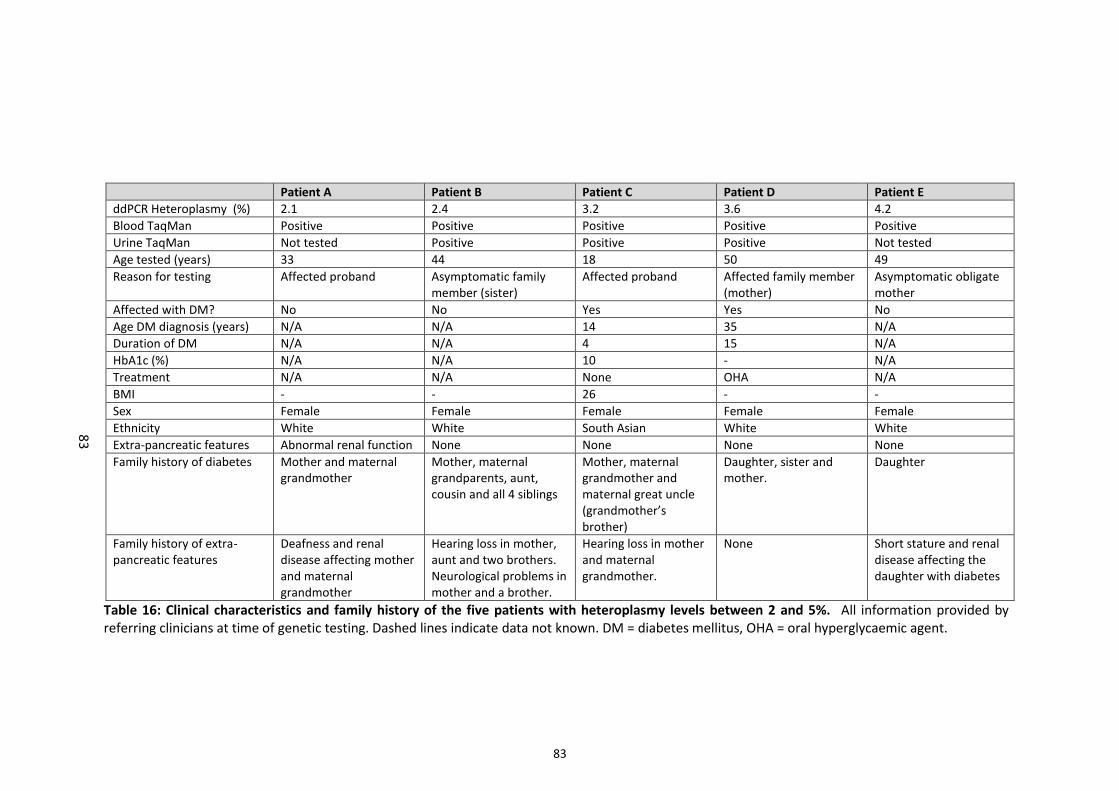
83
Patient A Patient B Patient C Patient D Patient E
ddPCR Heteroplasmy (%) 2.1 2.4 3.2 3.6 4.2
Blood TaqMan Positive Positive Positive Positive Positive
Urine TaqMan Not tested Positive Positive Positive Not tested
Age tested (years) 33 44 18 50 49
Reason for testing Affected proband Asymptomatic family member (sister)
Affected proband Affected family member (mother)
Asymptomatic obligate mother
Affected with DM? No No Yes Yes No
Age DM diagnosis (years) N/A N/A 14 35 N/A
Duration of DM N/A N/A 4 15 N/A
HbA1c (%) N/A N/A 10 - N/A
Treatment N/A N/A None OHA N/A
BMI - - 26 - -
Sex Female Female Female Female Female
Ethnicity White White South Asian White White
Extra-pancreatic features Abnormal renal function None None None None
Family history of diabetes Mother and maternal grandmother
Mother, maternal grandparents, aunt, cousin and all 4 siblings
Mother, maternal grandmother and maternal great uncle (grandmother’s brother)
Daughter, sister and mother.
Daughter
Family history of extra-pancreatic features
Deafness and renal disease affecting mother and maternal grandmother
Hearing loss in mother, aunt and two brothers. Neurological problems in mother and a brother.
Hearing loss in mother and maternal grandmother.
None Short stature and renal disease affecting the daughter with diabetes
Table 16: Clinical characteristics and family history of the five patients with heteroplasmy levels between 2 and 5%. All information provided by referring clinicians at time of genetic testing. Dashed lines indicate data not known. DM = diabetes mellitus, OHA = oral hyperglycaemic agent.
83
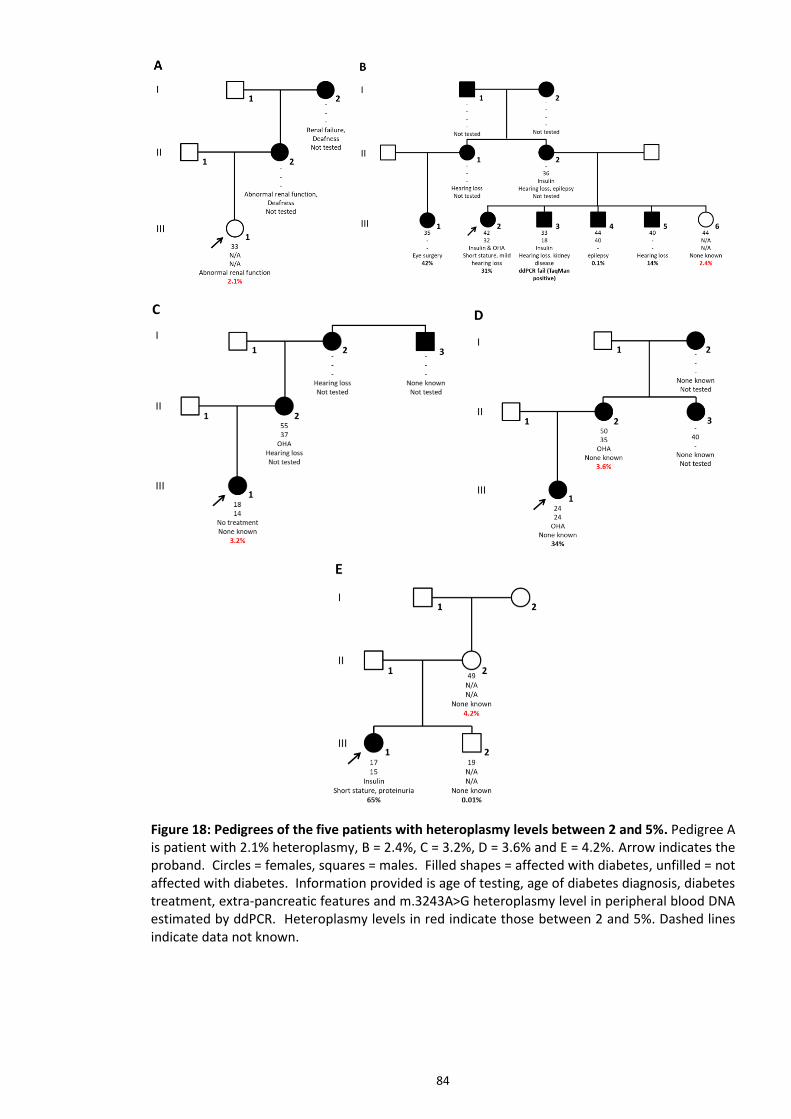
84
Figure 18: Pedigrees of the five patients with heteroplasmy levels between 2 and 5%. Pedigree A is patient with 2.1% heteroplasmy, B = 2.4%, C = 3.2%, D = 3.6% and E = 4.2%. Arrow indicates the proband. Circles = females, squares = males. Filled shapes = affected with diabetes, unfilled = not affected with diabetes. Information provided is age of testing, age of diabetes diagnosis, diabetes treatment, extra-pancreatic features and m.3243A>G heteroplasmy level in peripheral blood DNA estimated by ddPCR. Heteroplasmy levels in red indicate those between 2 and 5%. Dashed lines indicate data not known.

85
5.11 Heteroplasmy levels decrease with age but can be corrected using the Newcastle
formula
We confirmed previous observations of a decrease in m.3243A>G heteroplasmy with age
based on ddPCR results from 151 m.3243A>G positive patients (heteroplasmy >2%) with a
mean heteroplasmy 24.6% and median age at time of testing of 40 years. Heteroplasmy
levels decreased by -0.7% per year (R-squared = 0.46, n=151, 95% CI -0.83 to -0.58, P =
<0.001) (Figure 19A). Using the Newcastle formula to adjust heteroplasmy level for age,
the correlation was no longer seen with no significant reduction in heteroplasmy level (-
0.4% decrease with r-squared = 0.02, n=151, 95% CI -0.8 to -0.01, P = 0.054) (Figure 19B).
Figure 19: Relationship between heteroplasmy level and age at testing. The fitted red line is the predicted linear regression with the grey shading representing the 95% CI. A) Unadjusted heteroplasmy levels decrease by -0.7% per year age increase (R2=0.46, n=151, 95% CI -0.83 to -0.58, P = <0.001); B) Age–adjusted heteroplasmy using the Newcastle formula Blood heteroplasmy/0:977(age+12) (-0.4% decrease with R2=0.02, n=151, 95% CI -0.8 to -0.01, P = 0.054).
5.12 Heteroplasmy levels do not correlate with diabetes severity or family history
We next took the age adjusted heteroplasmy levels of patients with a positive ddPCR
result (>2% heteroplasmy) and performed linear regression analysis for continuous
variables. There was no significant correlation with heteroplasmy and age of diagnosis (R-
squared = 0.60, n=117, 95% CI -0.047 to +0.048, P = 0.98), HbA1c (R-squared = -0.005,
n=80, 95% CI -0.03 to +0.01, P = 0.52), height (R-squared = 0.03, n=50, 95% CI -0.022 to
+0.0001, P = 0.08) or BMI (R-squared = 0.11, n=86, 95% CI -0.097 to -0.028, P = <0.001)
(Figure 20). Mann-Whitney and ANOVA testing for the categorical variables showed no
difference between mean age adjusted heteroplasmy levels and having a mother affected
with diabetes and/or deafness (n=120, 78% affected vs 78.8% not affected, P = 0.90),
A B

86
having a maternal family history of deafness (n=151, 77.6% with family history vs 80.7%
with no family history, P = 0.85 for Mann-Whitney and 0.57 for ANOVA), having clinician
reported hearing impairment (n=151, 74% affected vs 83% not affected, P = 0.28 for
Mann-Whitney and 0.43 for ANOVA) or diabetes (n=151, 79.8% affected vs 74.1% not
affected, P = 0.15 for Mann-Whitney and P = 0.54 for ANOVA) (Figure 21). There was no
association between patient age at time of genetic testing and being affected with
diabetes (n=151, 41 years affected vs 41 years not affected, P = 0.91 for Mann-Whitney
and P = 0.82 for ANOVA), but patients with hearing loss were on average 10 years older
than those without hearing loss at time of testing (n=151, 45 years affected vs 35 years
not affected, P = <0.001 for Mann-Whitney and ANOVA) (Figure 22), reflecting the
progressive nature of hearing loss caused by m.3243A>G (Uimonen et al., 2001).
Figure 20: Scatter plots of age-adjusted heteroplasmy and continuous variables in patients with heteroplasmy >2%. The fitted red line is the predicted linear regression with the grey shading representing the 95% CI. A) vs age of diabetes diagnosis (R2 = 0.60, n=80, P = 0.98), B) vs HbA1c (R2 = -0.005, n=80, P = 0.52), C) vs Height (R2 = 0.03, n=50, P = 0.08), and D) vs BMI (R2 = 0.11, n=86, P = <0.001).

87
Figure 21: Box plots of age-adjusted heteroplasmy levels and family history, diabetes status and hearing loss status. The line within the box represents the median, and the top and bottom edges of the box represent the interquartile range (IQR). The whiskers are the highest and lowest values within 1.5 x IQR from the first and second quartiles. A) vs whether mother affected with diabetes and/or deafness (n=120, P = 0.90), B) vs maternal family history of deafness (n=151, P = 0.85), C) hearing loss status (n=151, P = 0.28), and D) diabetes status (n=151, P = 0.15).
Figure 22: Comparison of patient age at time of testing and diabetes or hearing loss status. The line within the box represents the median, and the top and bottom edges of the box represent the interquartile range (IQR). The whiskers are the highest and lowest values within 1.5 x IQR from the first and second quartiles. A) vs diabetes status (n=151, P = 0.91) and B) vs hearing loss status (n=151, P = <0.001).
B
D C
A P = 0.90

88
5.13 Heteroplasmy levels do not correlate with number of mitochondrial related
conditions
For each of the 151 patients with a heteroplasmy level >2% we determined a disease
severity score based on how many of the following clinical features were reported in the
patient: diabetes, deafness, lactic acidosis, cardiac or skeletal myopathy, retinal or visual
problems, renal disease, learning difficulties, gastrointestinal problems and any other
neurological-related conditions. The minimum possible score was 0 for clinically
unaffected individuals and the maximum score was 9 if all features were present. A
summary of the number of patients with each score and their heteroplasmy levels is
presented in Table 16. The maximum severity score was 4, and most patients had two
clinical features with diabetes and deafness the most common clinical scenario in 74/151
(49%) patients. There was a trend of increasing clinical severity from 0 to 3 with
increasing median and mean heteroplasmy levels but standard deviations were large and
linear regression analysis showed no statistical correlation (R-squared = -0.01, n=151, P =
>0.2).
Severity score
Number of patients
p25 p50 p75 mean SD of mean
0 9 17.2 51.4 75.2 68.7 76.3 1 64 56.2 77.1 95.5 77.4 29.2 2 70 56.6 81.2 99.4 81.0 30.6 3 6 68.9 91.9 113.1 93.8 28.5 4 2 84.9 87.3 89.7 87.3 3.4
Total 151 77.3 56.3 99.4 79.3 33.8
Table 17: Heteroplasmy levels and number of reported clinical features. Severity score based on the number of distinct clinical features affecting each patient with 0 representing clinically unaffected individuals. Heteroplasmy levels given at the median (p50) and IQR (p25 & p75), mean and SD around the mean.
5.14 ddPCR is more expensive compared to TaqMan genotyping
We performed a cost comparison of TaqMan genotyping and ddPCR methodologies with
regard to cost per sample, including consumable and staff time costs. We also compared
the total time taken to complete the assay. Both assays are validated with all equipment
and software owned by the laboratory, so no additional outlay for this was required.
Both assays use DNA samples extracted using the same protocol, and result reporting

89
processes are also identical for both tests. Therefore DNA extraction and reporting
processes have been excluded from the cost and time to test comparisons.
Consumable costs are split between those used per well and those used per plate. Per
well consumables and costs for the TaqMan assay are listed in Table 17A, and Table 17B
for ddPCR. The cost per well excluding plate and plate seal costs was 0.41 GBP for
TaqMan and 5.63 GBP for ddPCR. Since the ddPCR assay requires samples to be tested in
triplicate, these equates to 16.89 GBP per sample. The cost of PCR plates and plate seals
per sample will vary depending on the number of patient samples tested on the plate,
since the cost will be spread across them. The more samples that are tested on a plate,
the lower the per sample cost for plates and plate seals. The plate and plate seal costs
are provided in Table 17C. The TaqMan assay has a cost advantage in that different tests
for different genetic variants can be performed using the same test conditions and
therefore run on the same plate. These include testing for the HFE gene variants
p.Cys282Tyr and p.His63Asp associated with haemochromatosis, the HLA B27 allele
associated with increased risk for ankylosing spondylitis and the JAK2 p.Val617Phe variant
associated with myeloproliferative disorders. A typical TaqMan assay run contains about
20 patient samples and the cost per sample for plates and seals, on average, will be 0.13
GBP. The ddPCR assay for m.3243A>G would not share run conditions with other ddPCR
assays and so an average run would have only 4 samples, with a plate & seal cost of 1.50
GBP. The ddPCR assay requires more expensive low DNA binding PCR plates for the
dilution and PCR steps.
Therefore the total consumables cost for TaqMan is 0.54 GBP vs 7.13 GBP per well for
ddPCR. In addition, each ddPCR sample would be run in triplicate so the per sample cost
would be 21.39. The cost of control samples would also need to be factored into each
sample on a run; three controls (mutation positive, no mutation and a no template
control) would be run on each batch and so the cost of these would be spread across the
number of m.3243A>G patient samples on each batch. TaqMan control consumable costs
would be 3 x 0.41/4 = 0.31 GBP and for ddPCR (3 x 21.39/4 = 16.04 GBP. Final estimated
consumable cost per sample would be 0.85 GBP for TaqMan vs 37.43 GBP for ddPCR.
Staff costs were calculated from the DNA dilution step to data analysis, with additional
costs for performing the Qubit DNA quantification step for ddPCR. Costs based on a
genetic technologist earning 21,582 GBP a year, equivalent to hourly rate of 11.07 GBP
(AfC band 4, middle pay point 4 using pay scale for staff on the NHS terms and conditions

90
of service for 2018/19). Time taken to perform the assays was estimated based on an
average TaqMan batch size of 20 samples that included 4 samples for m.3243A>G testing.
For ddPCR, a batch size of 4 samples and 3 positive controls run in triplicate (equivalent to
21 wells of PCR) was used. Staff time excluded the time that the sample was being
manipulated by hardware that required no input from a technician (e.g. during PCR,
droplet generation, fluorescent signal reading). Staff time and costs were similar for
TaqMan vs ddPCR (1.75 hours and total wage cost was 19.37/20 = 0.97 GBP per sample
for TaqMan vs 2 hours and wage cost of 22.14/4 = 5.54 GBP for ddPCR). The additional
time for non-staff processes was also similar for the two assays (120 minutes for TaqMan
and 140 minutes for ddPCR). There was no meaningful difference between the total time
to complete both assays (3.75 hours for TaqMan and 4.33 hours for ddPCR).
Adding these staff costs to the consumables costs gives a final cost per sample of 0.85 +
0.97 = 1.82 GBP for TaqMan and 37.43 + 5.54 = 42.97 GBP for ddPCR. Per sample costs for
ddPCR were therefore 23.5 times more expensive than TaqMan. This cost difference in
addition to the lack of increased diagnostic yield or value of heteroplasmy estimation is
likely to prohibit the replacement of TaqMan with ddPCR as the routine NHS funded
diagnostic test for m.3243A>G. However the test may still be an option for non-NHS
patients and for research tests where costs will be covered from other funding sources.

91
A TaqMan Universal Master Mix Primers Probes MGB Labelled filter tips 10-200ul Filter tips 0.1-10ul
Ordering unit 10 x 5ml (50,000ul) 250ul at 100uM 60ul at 100uM 10 x 96 (960 tips) 10 x 96 (960 tips)
Cost per order unit 2223.28 8.16 (0.16 per base) 219 64 42.85
Inc VAT 2612.35 9.59 257.33 76.8 51.42
Amount used per sample
1ul 0.25ul 0.05ul 1 tip 1 tip Total per sample cost
Cost per test (GBP) 0.04 0.01 0.17 0.07 0.05 0.34
Inc VAT 0.05 0.01 0.20 0.08 0.06 0.41
B Qubit® dsDNA
HS Assay Kit Qubit® tubes ddPCR supermix Primers Probes MGB
Labelled DG buffer for probes
Auto DG filter tips 200ul
Filter tips 20ul
AutoDG Cartridges
Auto DG oil Reader Oil
Ordering unit 500 Assays 500 bag 5 x 1ml (5,000ul) 250ul at 100uM 60ul at 100uM 2 x 4.5ml (225 wells)
20 x 96 (1920 tips)
10 x 96 (960 tips)
30 (960 wells) 140ml (20 x 96 well plates)
2000ml (10 x 96 well plates)
Cost per order unit
195.00 51.50 412 8.16 (0.16 per base) 219 181 128 37 1121 422 749
Inc VAT 234 61.8 494.4 9.59 257.33 217.2 153.6 44.4 1345.2 506.4 898.8
Amount used per sample
1 assay 1 tube 10ul 0.25ul 0.05ul 40ul 1 tip 1 tip 1 well 72ul 2ml Total per sample cost
Cost per test (GBP)
0.51 0.10 0.82 0.01 0.17 0.80 0.07 0.04 1.17 0.22 0.78 4.69
Inc VAT 0.61 0.12 0.99 0.01 0.20 0.97 0.08 0.05 1.40 0.26 0.94 5.63
C TaqMan 96 Well PCR plates TaqMan PCR seal ddPCR 96 Well plates ddPCR seal
Ordering unit 50 plates 100 seals 25 50
Cost per order unit 90.8 38 95.2 59.84
Inc VAT 106.69 44.65 114.24 71.81
Cost per plate/seal 1.82 0.38 3.81 1.20
Inc VAT 2.13 0.45 4.57 1.44
Amount used per sample Average of 20 samples per plate Average of 20 samples per seal Average of 4 samples per plate Average of 4 samples per seal
Cost per test (GBP) 0.09 0.02 0.95 0.30
Inc VAT 0.11 0.02 1.14 0.36
Table 18: Consumable costs for ddPCR and TaqMan genotyping assays. Table A shows the consumables used for the m.3243A>G TaqMan genotyping assay, and table B the consumables for ddPCR. Table C shows the PCR plates and plate seals used for TaqMan and ddPCR. Each table shows the cost of each consumable per test, and the total cost of all consumables from A or B plus total costs from table C represents the total consumable costs for each assay (0.41 + 0.11 + 0.02 = 0.54 GBP for TaqMan, and 5.63 + 1.14 + 0.36 = 7.13 GBP for ddPCR). VAT value is the cost per test value +20%.
91

92
Chapter 6: Discussion, Conclusion & Future Work
6.1 Discussion
We have successfully designed a droplet digital PCR assay for the detection of the
m.3243A>G mutation. We had access to peripheral blood DNA samples from patients
with m.3243A>G where heteroplasmy levels had been accurately determined by targeted
NGS, and this enabled validation of the method for both detection of the variant and
estimation of heteroplasmy levels. Validation testing demonstrated high assay
performance, achieving 100% sensitivity and specificity compared to both tNGS and
TaqMan genotyping methodologies. The ddPCR assay estimated heteroplasmy with a very
high degree of concordance with tNGS heteroplasmy levels, achieving a significant R2 of
>0.99. We observed a slightly higher estimate of heteroplasmy using ddPCR compared to
tNGS by roughly 1%. This may suggest that a lower threshold setting for the channel 1
(mutant positive) signal is being favoured in order to increase test sensitivity but in turn
would increase droplet numbers in the double cluster and hence overestimate
heteroplasmy. In practice this should not matter since ddPCR is able to compensate for
variation in threshold setting due to the large numbers of individual events (droplets)
measured, but this may become more significant when droplet numbers are lower due to
lower mtDNA copy number. Heteroplasmy estimates varied on average by 0.2% between
intermediate and low or high threshold levels, and by 0.4% between low and high
thresholds. So this is likely to account for some, but not all of the bias. The other
consideration is the accuracy of tNGS heteroplasmy estimation which is influenced by the
number of reads generated over the m.3243A>G region. In theory the high numbers of
mtDNA template in the sample should result in a significant number of reads generated
with which to calculate heteroplasmy (on average over 30,000 reads per sample), but in
practice read numbers used by analysis tools like MuTect may be significantly lower than
the raw read numbers. This is due to a downsampling process whereby MuTect will
discard a proportion of reads based on the degree of contamination estimated to come
from other sources of human DNA. The extent to which this will affect heteroplasmy
estimates will vary depending on the total number of reads, with lower read depth
resulting in a greater underestimate by MuTect compared to a method that counts raw

93
reads. It is possible that this accounts for between 0.1 to 0.5% of the difference between
tNGS and ddPCR heteroplasmy estimates. Re-analysis of the tNGS m.3243A>G positive
patients is planned using an alternate bioinformatics tool that uses a ‘pileup’ method to
analyse all reads mapped to the variant position. If this provides a more accurate
estimate then this will be adopted for diagnostic use within the tNGS bioinformatics
pipeline for calling the m.3243A>G variant. In practical terms, there will be the possibility
of a patient with a very low heteroplasmy level that could fall either side of the threshold
for issuing a positive diagnostic report. Confirmatory testing in other tissues such as EUC
that harbour a higher mutational load is essential for patients with low blood
heteroplasmy.
The assay was very precise, with little variation in heteroplasmy for the same sample
between individual wells on the same plate/run and also between runs. We also
demonstrated that this accuracy and precision could be achieved for low, intermediate
and high levels of heteroplasmy. The limit of detection of ddPCR is theoretical and
dependent on the number of droplets successfully generated and analysed, and this
needs to be considered as part of the analysis QC. The ability to perform a meta-analysis
of multiple wells means that there is no theoretical limit to the number of droplets that
could be generated, only costs and practicalities limit the number of replicates performed
for each sample. We aimed for a limit of detection ≤1% as acceptable for a successful
test, which requires a very achievable total number of 300 positive droplets to see a
minimum of 3 mutant positive droplets equal to 1% heteroplasmy at the 95% confidence
interval. Any lower than 300 would constitute a fail.
It was clear in the early stages of assay validation that the mitochondrial genome being
tens or hundreds times more abundant in cells than the nuclear genome would confound
the Poisson calculations of heteroplasmy. High dilution factors were required to reduce
the numbers of mtDNA templates in order to prevent droplet saturation and significant
overestimation of heteroplasmy. Using a lower DNA concentration in turn reduced total
numbers of positive droplets and therefore required testing in triplicate and a subsequent
meta-analysis of all three wells to provide sufficient droplets to enable Poisson
calculations and detection of low level heteroplasmy. This in effect creates a scenario
where the optimal dilution factor is dependent on mtDNA copy number and variant
heteroplasmy, which are not known at time of testing. Therefore a dilution factor was
selected which achieved an acceptable level of accuracy across a range of heteroplasmy,

94
but not necessarily using optimum DNA concentrations for extremes of heteroplasmy.
This was seen in a trend of slightly reduced accuracy at very high heteroplasmy levels
where threshold setting was difficult due to near saturation of the double positive cluster
caused by too high DNA concentration. Therefore another aspect that determined
dilution factor was the degree of separation between clusters and hence the ease at
which manual thresholds for cluster determination could be set. We also saw higher
inter-assay variation with the lowest DNA concentrations reflecting the variation in
pipetting and template distribution within a sample volume.
The Exeter Genomics Laboratory currently uses a TaqMan genotyping assay for the
qualitative determination of m.3243A>G that can be performed on both peripheral blood
and urine epithelial-derived DNA samples. The limitations of this assay are considered to
be that it does not quantify heteroplasmy levels, and that the limit of detection is
estimated to be around 5%. Both of these limitations can be overcome using ddPCR
technology but that does not automatically assume ddPCR is the preferred assay for an
NHS diagnostic laboratory. The ddPCR assay accurately determined heteroplasmy levels
in patients with a positive TaqMan result and determined that the TaqMan assay was in
fact able to detect the variant when present at a heteroplasmy of ≥2%. ddPCR testing of
patients with a negative TaqMan result did not detect a heteroplasmy level greater than
1%. These patients were tested specifically for the m.3243A>G variant either because
they had clinical features consistent with m.3243A>G disease, or were a relative of an
individual harbouring the m.3243A>G variant. Since the laboratory had been reporting
positive m.3243A>G results from TaqMan under the assumption that heteroplasmy levels
were at least 5%, we reviewed the clinical features and family history of the patients with
a heteroplasmy level between 2% and 5% and concluded that their personal clinical
features and/or family history were consistent with m.3243A>G related disease and
therefore a cut-off of 2% for reporting the m.3243A>G mutation would be acceptable.
This would come with a caveat that the patient has a clinical suspicion or a family history
of m.3243A>G disease or the variant is present in a maternal relative or sibling. The
confirmation of the blood positive result in urine samples by TaqMan for three of these
patients also supports the cut-off of 2%. Urine epithelia consistently have higher
heteroplasmy levels than blood (see Table 5) and there is the potential for false negative
results if only blood samples are analysed, particularly in older patients. False negative
rates of 11.4 and 15% have been reported for blood testing (de Laat et al., 2012; de Laat
et al., 2021), and there have been reports of de novo occurrences of m.3243A>G after

95
exclusion of the variant in mother’s blood, buccal epithelia and urine epithelia DNA
samples (de Laat et al., 2016; Ko et al., 2001; Maassen et al., 2002). We may also have
identified a de novo mutation in a Chinese family. The proband was an adult female
affected with MIDD and a positive m.3243A>G result, but with negative ddPCR tests in
her diabetic mother and three sibling. There is a high background prevalence of younger
onset type 2 diabetes in the Chinese population (Hu and Jia, 2018) and so the affected
individuals in this family may be type 2 diabetes phenocopies with the mutation arising de
novo in the patient with MIDD, but this requires further testing of urine and buccal
epithelia in all blood DNA negative individuals.
The ability to test other accessible samples such as urine epithelia is an essential
requirement for any diagnostic m.3243A>G assay. It is likely that any additional diagnostic
yield from TaqMan negative blood tested patients will come from detecting higher
heteroplasmy levels in urine or buccal epithelia rather than very low level heteroplasmy
in blood. This brings up a current limitation of the ddPCR assay – that we have only
validated testing of DNA from peripheral blood. Additional validation studies are required
to determine whether the assay is suitable for testing DNA from other tissue types. The
high heteroplasmy levels in other tissues compared to blood may be a significant problem
for ddPCR heteroplasmy estimation due to droplet saturation. Even higher dilution
factors are likely to be required in order to generate sufficient negative droplets for
heteroplasmy estimation. We have performed some preliminary ddPCR testing of urine
DNA confirming that the assay works and is possible of estimating heteroplasmy, but
positive droplet numbers are very high with overestimation of heteroplasmy using the
same DNA concentration and PCR conditions optimised for blood. Mean urine
heteroplasmy levels from initial ddPCR tess were on average 20% higher compared to
levels from other methods in published studies list in Table 5. Currently we do not have
an accurate and sensitive method for determining heteroplasmy in urine DNA for the
purposes of validating the ddPCR assay, and external collaboration with a laboratory that
offers pyrosequencing would be required. The expectation is that accuracy of
heteroplasmy estimates in urine will improve with higher dilution factors but the
reduction in positive droplet numbers will reduce the limit of detection of the assay to
around 1-2% unless further replicates are performed.
We selected a negative threshold of ≤1% based on a level no higher than this seen in
almost 1000 individuals with a known monogenic cause for their diabetes. This assumes

96
that a patient does not have or is not predisposed to m.3243A>G disease and another
genetic condition – a scenario that cannot be excluded but will be very rare. Selecting a
1% negative cut-off is also supported by the literature review not finding evidence of
clinical features consistent with m.3243A>G related disease in individuals with
heteroplasmy <1%. This means that although ddPCR is capable of detecting very low
levels of heteroplasmy there is currently no clinical utility for an assay to have the ability
to detect below 1%. This shows that the current TaqMan assay is a suitable diagnostic
assay for detecting the m.3243A>G mutation.
Our study did not detect any patients with a heteroplasmy between 1 and 2%, and this
likely represents a ‘grey-zone’ for determining clinical significance. There will be
uncertainty around if and how to report a 1% to 2% heteroplasmy level to the clinician.
The decision to report may depend on the prior probability of detecting the variant
according to the clinical features of the patient, or whether the patient has a mother,
siblings or offspring (if female) that are either affected with m.3243A>G disease or have a
positive m.3243A>G test result. Our literature review identified only 5 patients with
heteroplasmy levels between 1 and 2% (Asano et al., 1999; Whittaker et al., 2009; Yan et
al., 2014). They were predominantly aged over 65 with diabetes diagnosed over 45 years
and had mild/subclinical disease or no additional m.3243A>G features. No information
regarding their diabetes was provided so the possibility of type 1 or type 2 diabetes in
these individuals cannot be excluded. The phenotype most consistent with mitochondrial
disease was reported in a male with late onset diabetes, mild hearing impairment and
muscle weakness due to an ischaemic stroke at age 65 years (Asano et al., 1999).
Heteroplasmy level in his blood was 1.7% but was significantly higher in other tissues
taken post mortem. The low blood heteroplasmy reflects the older age of the patient,
and a false negative result would likely have been issued if this patient had been tested
with our TaqMan assay (although testing of other tissues would have been recommended
and have yielded a positive result). One of the biggest challenges in diagnosing
monogenic diabetes is identifying patients against a high background prevalence of type 1
and type 2 diabetes. It is essential that the differential diagnosis is investigated using
clinical features, biomarkers such as antibodies and C-peptide, and probability models
prior to either requesting testing for m.3243A>G or issuing a low level heteroplasmy
result (Shields et al., 2017). Hearing impairment is common in the older population and
may also be unrelated to low level heteroplasmy; phenocopies have been reported in
m.3243A>G families (de Laat et al., 2016). Key features of m.3243A>G hearing loss are

97
that it is bilateral, sensorineural, not congenital and progressive (Murphy et al., 2008).
When low level heteroplasmy is identified but phenotype is not highly consistent it may
be advisable to report the result but state that the clinical significance of this level of
heteroplasmy in peripheral blood DNA is uncertain and that further testing of a urine or
buccal epithelial sample is required. If the variant is present at a level >2% in urine or
buccal cells this could then be reported as a positive, clinically actionable result. There is a
potential risk in reporting low level heteroplasmy with a caveat that the clinical
significance of the result is uncertain or that a genetic diagnosis has not yet been made,
since this can be misinterpreted by the clinician and/or patient as a diagnostic result. This
is of particular concern for mitochondrial diabetes which occurs as part of a syndrome
with a very wide range of clinical conditions with variable severity and expressivity.
Patients may perform internet searches and read information detailing severe extra-
pancreatic features leading to significant anxiety. In these scenarios it is important to
verbally communicate with the clinician, and preferably involve local clinical genetics
teams, to explain the result, the requirement to test other tissue types and how best to
feedback to the patient, prior to issuing the report.
Our analysis of a TaqMan tested cohort showed that ddPCR does not increase diagnostic
yield as a result of identifying low level heteroplasmy undetectable by TaqMan. This is
based on a negative cut-off of 1%, a positive cut-off of 2% and a grey-zone between these
values that requires further testing of other tissues and evaluation of clinical features.
The absence of patients with blood heteroplasmy between negative and positive cut-offs
(1 to 2%) indicates that they are rare, will have uncertainty around the significance of the
result and could harbour the variant at a higher level in another tissue. Therefore the
requirement for an assay to detect 1% heteroplasmy is debatable, particularly if urine
epithelia is the primary tissue being tested. If ddPCR does not increase diagnostic yield
and there is uncertainty around heteroplasmy levels below 2%, is there a clinical utility in
being able to accurately determine heteroplasmy levels? We confirmed previous reports
of a decrease in heteroplasmy levels with increasing age by approximately 0.7% decrease
per year (Langdahl et al., 2017), and were able to correct for this using the formula
previously described (Grady et al., 2018). We compared age-adjusted blood
heteroplasmy levels with age of diabetes diagnosis and HbA1c, and did not see a
significantly earlier age of diagnosis or a higher HbA1c with increasing heteroplasmy level.
This differs with previous studies that have reported significant R2 values of over 0.5
((Chae et al., 2020; Frederiksen et al., 2009; Geng et al., 2019; Ohkubo et al., 2001; Olsson

98
et al., 2001; Yan et al., 2014), see Table 5). Our study has the largest cohort of
m.3243A>G patients with diabetes investigated to date, and we used a robust method to
age-adjust heteroplasmy levels. Previous studies in diabetes patients have analysed
comparatively very small cohorts and have not adjusted heteroplasmy levels for patient
age. Our correlations are therefore likely to be significantly more accurate.
Penetrance of diabetes and hearing loss is highly variable in families with MIDD; we
therefore compared heteroplasmy levels in patients with and without clinician reported
diabetes or deafness. We did not see a significantly higher heteroplasmy level in clinically
affected individuals, suggesting that heteroplasmy levels in blood are not a strong
predictor of diabetes and hearing loss penetrance. Age was associated with hearing loss
penetrance and is likely due to the progressive nature of hearing loss in MIDD (Uimonen
et al., 2001). It is also likely that other genetic and environmental factors influence
disease penetrance. We could not exclude the possibility of sub-clinical hearing
impairment in patients with no clinician reported hearing loss, and further clinical follow-
up is required. Significant ascertainment bias exists in our cohort since having diabetes
and deafness, or a strong maternal history, is the primary reason for referral for
m.3243A>G testing. This resulted in our cohort having fewer individuals without diabetes
or extra-pancreatic features, or lacking a maternal family history, to perform statistical
comparisons. We were able to include in our heteroplasmy study patients with
m.3243A>G and no clinician reported extra-pancreatic features diagnosed using a tNGS
assay that tests all diabetes genes regardless of clinical phenotype, in addition to
probands and family members without diabetes and/or deafness that were tested for
m.3243A>G. Undertaking heteroplasmy studies in unselected population-based research
cohorts such as UK biobank would provide a more meaningful estimate of disease
penetrance, and could also provide more information about the clinical significance of
very low level heteroplasmy.
Higher heteroplasmy levels also did not correlate with a higher likelihood of having a
mother affected with diabetes or deafness, or having a family history of deafness in
maternal relatives. This lack of association is predictable given the bottleneck nature of
mitochondrial variant inheritance which randomly assorts mutant mitochondria into
oocytes. An association between EUC heteroplasmy and risk to offspring has been
reported in MELAS (Chinnery et al., 1998) but we did not have sufficient number of

99
patients with offspring to determine with significance that this association exists in blood
DNA in our diabetes cohort.
We attempted to compare heteroplasmy levels with disease burden in our cohort of
patients primarily affected with diabetes and deafness. The best tool to gauge disease
burden is the Newcastle Mitochondrial Disease Scale for Adults (NMDAS), a semi-
quantitative clinical rating scale designed specifically for all forms of mitochondrial
disease devised by the Wellcome Trust Centre for Mitochondrial Research, Newcastle, UK
(Schaefer 2006). This is uses a very detailed clinical questionnaire that is undertaken
during each clinical assessment of the patient. This is typically performed for patients
visiting specialist mitochondrial disease centres and is very rarely used in routine clinical
care. Using NMDAS gives the most robust estimate of heteroplasmy effect on disease
burden (de Laat et al., 2021; Grady et al., 2018). Determining the relationship between
heteroplasmy and disease burden was difficult for our cohort due to the nature of the
referrals for testing. We are a monogenic diabetes specialist service and our clinical
questionnaire is specifically tailored for collecting detailed information on the diabetes
phenotype. It does not ask for specific details on extra-pancreatic features. Since hearing
loss is the most common feature associated with mitochondrial diabetes, our
questionnaire does ask if the patient is affected or has a family history, but this is typically
provided as a yes/no answer by clinicians. Extra-pancreatic and extra-aural clinical
features are therefore very likely to be underreported in our diabetes cohort. Our clinical
data capture is also a one-time snapshot taken at time of testing, and we have no follow
up data to measure disease progression. Therefore use of NMDAS was not possible in our
cohort without undertaking extensive clinical follow-up. Instaed we used the number of
different clinical systems affected (including endocrine) as a proxy for disease burden.
Our comparison of heteroplasmy levels and number of systems affected did not show a
positive correlation. Clinical heterogeneity is widely reported in m.3243A>G disease but
this was not seen in our cohort; only 18% of patients were affected with clinical
phenotypes other than diabetes or deafness consistent with underreporting of clinical
features. Interestingly a recent study suggests that patients with m.3243A>G related
diabetes are less likely to develop multisystem disease. Picket et al. looked at the
correlation between different clinical traits in patients with the m.3243A>G variant
(Pickett et al., 2018). They identified a moderate correlation with deafness (r-squared
0.45) and a weak significant correlation with ataxia, neuropathy and myopathy (r-squared
0.24 to -.32) but no significant association with any other m.3243A>G related traits (r-

100
squared <0.24). In patients where the primary disease phenotype was MELAS, there was a
clear association across multiple clinical traits. The absence of a high number of
additional extra-pancreatic and extra-aural features in our cohort is therefore likely to be
associated with the primary phenotype being diabetes in addition to underreporting by
clinicians. This may have implications for whether heteroplasmy is a suitable determinant
of disease burden in patients with m.3243A>G related diabetes. Studies that have
investigated heteroplasmy and NMDAS have done so using a single cohort of all patient
subtypes, and not for example separate analyses for MELAS and MIDD phenotypes (de
Laat et al., 2021). Further analysis in these distinct disease groups would be of interest.
We have not accounted for the effect of heteroplasmy levels in other tissues since only
blood samples were available. However age-adjusted blood heteroplasmy levels
correlate strongly with levels in other tissues and age-adjusted blood gives the strongest
association with disease burden (Grady et al., 2018). Therefore the results from this study
are meaningful without the need for heteroplasmy estimates in other tissues.
A comparison of TaqMan versus ddPCR methodologies revealed a significantly higher cost
for ddPCR testing. We estimated a 23.5 times higher cost per sample for ddPCR analysis
compared to TaqMan testing. This was in part due to the higher consumables costs, the
need to test in triplicate and the fact that ddPCR testing for m.3243A>G is currently
performed on a plate that contains only patients being tested for this variant. In contrast,
TaqMan reagent costs are lower, a single PCR is required and the cost is further spread
across additional patient samples that can be tested for other variants on a single plate
using the same PCR conditions. We did not consider the cost of the equipment and
software licenses since both methodologies were in place within our laboratory. Start-up
costs for ddPCR are likely to be much higher given the requirement for droplet
generators, plate sealers, PCR machines and droplet readers. ddPCR costs could be
reduced through testing additional assays on the same plate, but this would require
optimisation of all assays to work under the same PCR conditions (and also to allow all
samples to be diluted robotically into the same plate). There was no significant time
difference between ddPCR and TaqMan to complete a run, and both assays would enable
testing to be completed and reported well within the 42 day turnaround time (TAT). In
practice, it is likely that TaqMan will provide a faster TAT since sufficient samples would
be available from other patients being tested for other variants to run a batch. For
ddPCR, there will be a trade-off between waiting for sufficient samples to reduce test

101
costs and increasing the TAT, or test one or two samples with increased cost but quicker
TAT. The ddPCR assay requires more staff time by virtue of having a higher number of
specific sample handling steps, but the processes involved are not any more complex or
have more demanding training requirements. The most critical step in the process is
ensuring the sample is accurately diluted using serial dilutions, which requires good
pipetting technique, low bind plastics and sufficient sample mixing between each
pipetting step. Manual pipetting increases the risk of a sample swap and robotic liquid
handling is preferred – we confirmed through comparison of robotic and manual
pipetting processes that there is no difference in variant detection and heteroplasmy
estimates (data not shown). A current advantage that TaqMan has over ddPCR is the
ability to test DNA from UEC. We have yet to validate ddPCR for heteroplasmy
measurement in UEC DNA but this should technically be possible. A more cost effective
option might be to consider quantitative analysis using the TaqMan assay. Again this
would need to be validated to ensure accurate estimation across a range of heteroplasmy
levels and would require additional control samples for standard curve generation, but
would still be much less expensive.
The question then is whether there is justification in replacing our current assay with one
that is significantly more expensive, does not increase diagnostic yield and generates
heteroplasmy levels that currently have limited clinical utility in patients with a MIDD
phenotype. It could be argued that adopting a ddPCR assay for routine diagnostic use will
future-proof m.3243A>G testing in Exeter and enable long term collection of
heteroplasmy data for further research work that could translate to clinical and diagnostic
use. This would increase the power to tease out relationships between heteroplasmy,
clinical disease and risk to offspring in a MIDD cohort, and may help to determine the
clinical significance of heteroplasmy levels between 1 and 2%. Having a cohort of patients
with accurately determined heteroplasmy levels would also open up the possibility of
collaborative research with other mitochondrial research groups like Newcastle to
investigate factors that determine whether families with m.3243A>G develop exclusively
either a MIDD or MELAS phenotype. There is an interest in investigating whether nuclear
factors influence disease expression (Pickett et al., 2018) and the addition of a large
cohort from Exeter to this study would be extremely valuable. Heteroplasmy estimation
also has other applications besides disease burden, such as predicting offspring
heteroplasmy levels using maternal heteroplasmy levels (Chinnery et al., 1998) or in a

102
prenatal or preimplantation testing scenario (Bouchet et al., 2006; Bredenoord et al.,
2009).
Like the TaqMan assay, ddPCR is capable of only testing for one specific mtDNA variant
due to the limited number of fluorescent channels available for allelic discrimination.
Other rare mtDNA mutations are known to cause diabetes (Whittaker et al., 2007).
Therefore the highest diagnostic sensitivity would be achieved by testing all known
diabetes causing mtDNA mutations. There is one assay that can potentially
simultaneously test for all mtDNA variants associated with diabetes and estimate
heteroplasmy with a high degree of accuracy and precision to levels below 1%, and that is
targeted next generation sequencing. RNA custom capture tNGS assays can easily be
designed to sequence any part of the mitochondrial genome and test for other diabetes
associated variants such as m.3243A>T, m.8344A>G, m.12258C>A and m.14709T>C
(Whittaker et al., 2007). The high degree of accuracy and sensitivity comes from the high
numbers of reads generated over mitochondrial targets. Our tNGS assay detected the
pathogenic m.3243A>T variant in a patient with diabetes, deafness, blindness,
persistently raised lactate and who was severely underweight (BMI 14) who tested
negative for m.3243A>G by TaqMan. Although the mutation alters the A nucleotide at
position m.3243, the change to a T is not detectable by the m.3243A>G TaqMan assay
since the probe can only bind in the presence of G. Therefore the diagnosis would have
been missed if more comprehensive testing was not available in Exeter.
There are two main disadvantages to tNGS; firstly we have yet to validate the method for
testing DNA from urine epithelial cells, and secondly, the assay is more costly and has a
longer turnaround time compared to both TaqMan and ddPCR. However the decision to
use tNGS for m.3243A>G testing in Exeter may largely be out of the laboratory’s hands.
There has been a significant reconfiguration of NHS genomic testing services in England,
with all testing selected from a new test directory and provided by seven new genomic
laboratory hubs. The provision of rare mitochondrial disorders is now split between three
highly specialised mitochondrial disease services that offer histochemical and biochemical
testing in addition to genetic analysis. These are the Yorkshire & North East GLH
(Newcastle Laboratory), the West Midlands, Oxford & Wessex GLH (Oxford Laboratory)
and the North Thames GLH (Great Ormond Street Hospital Laboratory). These three
laboratories offer testing as per the National Genomic Test Directory for rare and
inherited disease (https://www.england.nhs.uk/publication/national-genomic-test-
103
directories/). The directory specifies that testing for m.3243A>G in patients with diabetes
and sensorineural hearing loss will be undertaken by one of these specialist centres, and
therefore referrals to the Exeter laboratory are likely to discontinue. Exeter has
historically performed m.3243A>G testing for patients with possible MIDD since it is has
been the NHSE national specialist provider for monogenic diabetes testing since 2000.
Exeter will continue to be the national provider for monogenic diabetes as part of the
South West Genomics Laboratory hub, although testing for all genetic subtypes of
diabetes will only be undertaken using a targeted NGS assay (with the exception of GCK
which will still be offered as a single gene test due to the high clinical specificity of the
glucose phenotype). This is a move in Exeter towards analysis of all known monogenic
diabetes genes by tNGS rather than gene testing of specific genes or variants based on
extra-pancreatic features. The clear benefit of this approach is the diagnosis of syndromic
forms of diabetes like MIDD and RCAD in patients that have isolated diabetes and have
not developed, or the clinician has not provided details of, clinical features consistent
with a syndromic subtype (Ellard et al., 2013). These patients would not be diagnosed
using the current strategy of only testing for specific subtypes based on the presence of
characteristic clinical features. So it is likely that over time, the diagnosis of m.3243A>G
related diabetes in Exeter will be limited to patients where there is no prior clinical
suspicion and the diagnosis is made ‘unexpectedly’ through comprehensive tNGS testing.
Patients with a clinical suspicion of MIDD would be referred to the specialist
mitochondrial laboratories. The reconfiguration of genomic services will move the Exeter
laboratory towards a service dominated by high-throughput NGS testing. There is
potential then for turnaround times to decrease and test costs to also reduce through
bulk purchasing of NGS consumables on a national level for NHS laboratories. This would
make tNGS testing for mitochondrial diabetes feasible and offer a better diagnostic test
to patients compared to assays testing for a single variant. It is important however that
any patient that receives a diagnosis of a mitochondrial disorder has access to specialist
clinical care provision regardless of the laboratory performing the testing.

104
6.2 Conclusion
Droplet digital PCR is a highly sensitive, accurate and precise assay for detecting
m.3243A>G and estimating heteroplasmy levels in blood. However we found no evidence
in our large cohort of diabetes patients that ddPCR will identify a significant number of
additional cases that would not be identified using our current TaqMan assay. Our study
therefore does not support implementation of ddPCR over TaqMan solely for the
purposes of detecting low level heteroplasmy to increase diagnostic yield. We also did
not see any association between age-adjusted heteroplasmy levels in blood and diabetes
severity or likelihood of being affected with deafness or diabetes. Heteroplasmy levels
were also not associated with maternal family history of diabetes or deafness. This
argues against the clinical utility of quantifying and reporting heteroplasmy levels in
patients with m.3243A>G related diabetes. There were limitations to our study with
regard to collecting extra-pancreatic clinical information and further clinical assessment
using NMDAS is needed if the effect of heteroplasmy on disease burden on our MIDD
cohort is to be meaningfully assessed. The per-sample cost of ddPCR is significantly
higher than TaqMan genotyping and is likely to be prohibitively expensive given the low
benefit to cost ratio. Implementation as a routine diagnostic service may be beneficial in
centres with a strong research interest since this will generate data for future studies and
collaborations. For Exeter, ddPCR is more likely to have a role in m.3243A>G research
rather than as a routine diagnostic assay. Ultimately the increasingly broader application
of disruptive NGS technology in genomic laboratories will likely render many genotyping
assays like those used for m.3243A>G obsolete.
6.3 Future work
COVID-19 restrictions limited our access to patients for further investigations for this
study. There is significant scope for performing detailed clinical assessment of our
m.3243A>G positive MIDD cohort to more accurately assess the severity of their disease
using the NMDAS tool. This would also help to improve estimates of heteroplasmy effect
on disease burden in the MIDD cohort. Our analysis was limited to peripheral blood DNA
since this is the sample type sent by the referring clinician in the vast majority of cases,
and we have yet to validate the method for urine epithelia. Once this validation work has
been completed the next step would be to obtain urine samples from all individuals with

105
a negative blood TaqMan result for further testing. There is an association between
mtDNA copy number, m.3243A>G heteroplasmy and disease burden in muscle (Grady et
al., 2018). We have not validated a ddPCR method for mtDNA copy number estimation
but the technology is perfectly suited to this application. Research on mtDNA copy
number and disease burden in peripheral blood could be extended to our cohort of MIDD
patients.
References
Abad, M. M., et al. (1997). 'Screening for the mitochondrial DNA a3243g mutation in children with insulin-dependent diabetes mellitus', Metabolism, 46(4), pp. 445-9.
Alston, C. L., et al. (2011). 'Maternally inherited mitochondrial DNA disease in consanguineous families', Eur J Hum Genet, 19(12), pp. 1226-9.
Altman, D.G. & Bland, J.M. (1983) 'Measurement in medicine: the analysis of method comparison studies', Statistician, 32, pp. 307–17.
Anan, R., et al. (1995). 'Cardiac involvement in mitochondrial diseases. A study on 17 patients with documented mitochondrial DNA defects', Circulation, 91(4), pp. 955-61.
Anderson, S., et al. (1981). 'Sequence and organization of the human mitochondrial genome', Nature, 290(5806), pp. 457-65.
Ang, S. F., et al. (2016). 'A preliminary study to evaluate the strategy of combining clinical criteria and next generation sequencing (ngs) for the identification of monogenic diabetes among multi-ethnic asians', Diabetes Res Clin Pract, 119, pp. 13-22.
Asano, T., et al. (1999). 'Clinical relevance of heteroplasmic concentration of mitochondrial a3243g mutation in leucocytes', Diabetologia, 42, pp. 1439-1443.
Bio-Rad Droplet Digital PCR Applications Guide Bulletin 6407 version B https://www.bio-rad.com/webroot/web/pdf/lsr/literature/Bulletin_6407.pdf accessed 10/10/2020 Bitner-Glindzicz, M., et al. (2009). 'Prevalence of mitochondrial 1555a-->g mutation in european
children', N Engl J Med, 360(6), pp. 640-2. Bouchet, C., et al. (2006). 'Prenatal diagnosis of myopathy, encephalopathy, lactic acidosis, and
stroke-like syndrome: Contribution to understanding mitochondrial DNA segregation during human embryofetal development', J Med Genet, 43(10), pp. 788-92.
Bouhaha, R., Abid Kamoun, H., Elgaaied, A. & Ennafaa, H. (2010). 'A3243g mitochondrial DNA mutation in tunisian diabetic population', Tunis Med, 88(9), pp. 642-5.
Boulet, L., Karpati, G. & Shoubridge, E. A. (1992). 'Distribution and threshold expression of the trna(lys) mutation in skeletal muscle of patients with myoclonic epilepsy and ragged-red fibers (merrf)', Am J Hum Genet, 51(6), pp. 1187-200.
Bredenoord, A., et al. (2009). 'Preimplantation genetic diagnosis for mitochondrial DNA disorders: Ethical guidance for clinical practice', Eur J Hum Genet, 17(12), pp. 1550-9.
Brown, W. M., George, M., Jr. & Wilson, A. C. (1979). 'Rapid evolution of animal mitochondrial DNA', Proc Natl Acad Sci U S A, 76(4), pp. 1967-71.
Cao, X. Y., et al. (2013). 'Focal segmental glomerulosclerosis associated with maternally inherited diabetes and deafness: Clinical pathological analysis', Indian J Pathol Microbiol, 56(3), pp. 272-5.
Caswell, R. C., et al. (2020). 'Noninvasive fetal genotyping by droplet digital pcr to identify maternally inherited monogenic diabetes variants', Clin Chem, 66(7), pp. 958-965.
Chae, H. W., Na, J. H., Kim, H. S. & Lee, Y. M. (2020). 'Mitochondrial diabetes and mitochondrial DNA mutation load in melas syndrome', Eur J Endocrinol, 183(5), pp. 505-512.
Cheong, H. I., et al. (1999). 'Hereditary glomerulopathy associated with a mitochondrial trna(leu) gene mutation', Pediatr Nephrol, 13(6), pp. 477-80.
106
Chin, J., et al. (2014). 'Detection rates and phenotypic spectrum of m.3243a>g in the mt-tl1 gene: A molecular diagnostic laboratory perspective', Mitochondrion, 17, pp. 34-41.
Chinnery, P. F., et al. (2004). 'Risk of developing a mitochondrial DNA deletion disorder', Lancet, 364(9434), pp. 592-6.
Chinnery, P. F., et al. (2000). 'The spectrum of hearing loss due to mitochondrial DNA defects', Brain, 123 ( Pt 1), pp. 82-92.
Chinnery, P. F., Howell, N., Lightowlers, R. N. & Turnbull, D. M. (1998). 'Melas and merrf: The relationship between maternal mutation load and the frequency of clinically affected offspring', Brain, 121, pp. 1889-1894.
Chinnery, P. F., et al. (2001). 'Mitochondrial enteropathy: The primary pathology may not be within the gastrointestinal tract', Gut, 48(1), pp. 121-4.
Chomyn, A., et al. (1992). 'Melas mutation in mtdna binding site for transcription termination factor causes defects in protein synthesis and in respiration but no change in levels of upstream and downstream mature transcripts', Proc Natl Acad Sci U S A, 89(10), pp. 4221-5.
Chuang, L. M., et al. (1995). 'Mitochondrial gene mutations in familial non-insulin-dependent diabetes mellitus in taiwan', Clin Genet, 48(5), pp. 251-4.
Danawati, W., Sakaue, M. & Taniguchi, H. (2002). 'Low prevalence of the substitution of adenine to guanine at the 3243 nucleotide position of mitochondrial DNA (mtdna) among indonesian diabetic subjects', 2002, 58, pp. 201-202.
de Laat, P., et al. (2016). 'Three families with 'de novo' m.3243a > g mutation', BBA Clin, 6, pp. 19-24.
de Laat, P., et al. (2013a). 'Inheritance of the m.3243a>g mutation', JIMD Rep, 8, pp. 47-50. de Laat, P., et al. (2012). 'Clinical features and heteroplasmy in blood, urine and saliva in 34 dutch
families carrying the m.3243a > g mutation', J Inherit Metab Dis, 35(6), pp. 1059-69. de Laat, P., et al. (2021). 'Six-year prospective follow-up study in 151 carriers of the mitochondrial
DNA 3243 a>g variant', J Med Genet, 58(1), pp. 48-55. de Laat, P., et al. (2013b). 'Mitochondrial retinal dystrophy associated with the m.3243a>g
mutation', Ophthalmology, 120(12), pp. 2684-96. de Laat, P., et al. (2015). 'Dysphagia, malnutrition and gastrointestinal problems in patients with
mitochondrial disease caused by the m3243a>g mutation', Neth J Med, 73(1), pp. 30-6. Dinour, D., et al. (2004). 'Progressive nephropathy associated with mitochondrial trna gene
mutation', Clin Nephrol, 62(2), pp. 149-54. Doleris, L. M., et al. (2000). 'Focal segmental glomerulosclerosis associated with mitochondrial
cytopathy', Kidney Int, 58(5), pp. 1851-8. Dvorakova, V., et al. (2016). 'The phenotypic spectrum of fifty czech m.3243a>g carriers', Mol
Genet Metab, 118(4), pp. 288-95. Ellard, S., et al. (2013). 'Improved genetic testing for monogenic diabetes using targeted next-
generation sequencing', Diabetologia, 56(9), pp. 1958-63. Elliott, H. R., et al. (2008). 'Pathogenic mitochondrial DNA mutations are common in the general
population', Am J Hum Genet, 83(2), pp. 254-60. Fayssoil, A., et al. (2017). 'Prediction of long-term prognosis by heteroplasmy levels of the
m.3243a>g mutation in patients with the mitochondrial encephalomyopathy, lactic acidosis and stroke-like episodes syndrome', Eur J Neurol, 24(2), pp. 255-261.
Frederiksen, A. L., et al. (2009). 'High prevalence of impaired glucose homeostasis and myopathy in asymptomatic and oligosymptomatic 3243a>g mitochondrial DNA mutation-positive subjects', J Clin Endocrinol Metab, 94(8), pp. 2872-9.
Fromont, I., et al. (2009). 'Brain anomalies in maternally inherited diabetes and deafness syndrome', J Neurol, 256(10), pp. 1696-704.
Fukui, M., et al. (1997). 'High prevalence of mitochondrial diabetes mellitus in japanese patients with major risk factors', Metabolism, 46(7), pp. 793-5.
Geng, X., et al. (2019). 'Mitochondrial DNA mutation m.3243a>g is associated with altered mitochondrial function in peripheral blood mononuclear cells, with heteroplasmy levels and with clinical phenotypes', Diabet Med, 36(6), pp. 776-783.

107
Gerbitz, K. D., van den Ouweland, J. M., Maassen, J. A. & Jaksch, M. (1995). 'Mitochondrial diabetes mellitus: A review', Biochim Biophys Acta, 1271(1), pp. 253-60.
Godinho, I., et al. (2017). 'Diabetes, deafness and renal disease', Clin Kidney J, 10(4), pp. 487-489. Gorman, G. S., et al. (2016). 'Mitochondrial diseases', Nat Rev Dis Primers, 2, p. 16080. Gorman, G. S., et al. (2015). 'Prevalence of nuclear and mitochondrial DNA mutations related to
adult mitochondrial disease', Ann Neurol, 77(5), pp. 753-9. Goto, Y.-i., Nonaka, I. & Horai, S. (1990). 'A mutation in the trna leu(uur) gene associated with the
melas subgroup of mitochondrial encephalomyopathies', Nature, 348, pp. 651-653. Grady, J. P., et al. (2018). 'Mtdna heteroplasmy level and copy number indicate disease burden in
m.3243a>g mitochondrial disease', EMBO Mol Med, 10(6), e8262. Greaves, L. C., Reeve, A. K., Taylor, R. W. & Turnbull, D. M. (2012). 'Mitochondrial DNA and
disease', J Pathol, 226(2), pp. 274-86. Guery, B., et al. (2003). 'The spectrum of systemic involvement in adults presenting with renal
lesion and mitochondrial trna(leu) gene mutation', J Am Soc Nephrol, 14, pp. 2099-2108. Guillausseau, P. J., et al. (2004). 'Heterogeneity of diabetes phenotype in patients with 3243 bp
mutation of mitochondrial DNA (maternally inherited diabetes and deafness or midd)', Diabetes and Metabolism, 30(2).
Guillausseau, P. J., et al. (2001). 'Maternally inherited diabetes and deafness: A multicenter study', Ann Intern Med, 134(9 Pt 1), pp. 721-8.
Hall, A. M., et al. (2015). 'The urinary proteome and metabonome differ from normal in adults with mitochondrial disease', Kidney Int, 87(3), pp. 610-22.
Harrison, T. J., et al. (1997). 'Macular pattern retinal dystrophy, adult-onset diabetes, and deafness: A family study of a3243g mitochondrial heteroplasmy', American Journal of Opthalmology, 124(2), pp. 217-221.
Hayashi, J., et al. (1991). 'Introduction of disease-related mitochondrial DNA deletions into hela cells lacking mitochondrial DNA results in mitochondrial dysfunction', Proc Natl Acad Sci U S A, 88(23), pp. 10614-8.
Hirano, M., et al. (2002). 'Renal complications in a patient with a-to-g mutation of mitochondrial DNA at the 3243 position of leucine trna', Intern Med, 41(2), pp. 113-8.
Holmes-Walker, D., Mitchell, P. & Boyages, S. (1998). 'Does mitochondrial genome mutation in subjects with maternally inherited diabetes and deafness decrease severity of diabetic retinopathy', Diabetic Medicine, 15, pp. 946-952.
Holt, I. J., Harding, A. E., Petty, R. K. & Morgan-Hughes, J. A. (1990). 'A new mitochondrial disease associated with mitochondrial DNA heteroplasmy', Am J Hum Genet, 46(3), pp. 428-33.
Hotta, O., Inoue, C., Miyabayashi, S. & al, e. (2001). 'Clinical and pathological features of focal glomerulosclerosis with mitochondrial trna leu (uur) gene mutation', Kidney International, 59(4), pp. 1236-1243.
Hu, C. & Jia, W. (2018). 'Diabetes in china: Epidemiology and genetic risk factors and their clinical utility in personalized medication', Diabetes, 67(1), pp. 3-11.
Iacovazzo, D., et al. (2016). 'Germline or somatic gpr101 duplication leads to x-linked acrogigantism: A clinico-pathological and genetic study', Acta Neuropathol Commun, 4(1), p. 56.
Imagawa, A., et al. (1995). 'Mitochondrial DNA mutations in pancreatic biopsy specimens from iddm patients', Diabetes Res Clin Pract, 30(2), pp. 79-87.
Iwanicka-Pronicka, K., et al. (2012). 'Postlingual hearing loss as a mitochondrial 3243a>g mutation phenotype', PLoS One, 7(10), p. e44054.
Iwasaki, N., et al. (2001). 'Prevalence of a-to-g mutation at nucleotide 3243 of the mitochondrial trna(leu(uur)) gene in japanese patients with diabetes mellitus and end stage renal disease', J Hum Genet, 46(6), pp. 330-4.
Iwase, M., et al. (2001). 'Clinical features of diabetic patients with 0.01-0.1% heteroplasmy a3243g mutation in leukocyte mitochondrial DNA', Diabetes Research and Clinical Practice, 54, pp. 215-217.
Jeppesen, T. D., et al. (2006). 'Muscle phenotype and mutation load in 51 persons with the 3243a>g mitochondrial DNA mutation', Arch Neurol, 63(12), pp. 1701-6.

108
Ji, L., Hou, X. & Han, X. (2001). 'Prevalence and clinical characteristics of mitochondrial trnaleu(uur) nt 3243 a-->g and nt 3316 g-->a mutations in chinese patients with type 2 diabetes', Diabetes Res Clin Pract, 54 Suppl 2, pp. S35-8.
Kadowaki, T., et al. (1994). 'A subtype of diabetes mellitus associated with a mutation of mitochondrial DNA', New England Journal of Medicine, 330(14), pp. 962-968.
Karppa, M., et al. (2004). 'Muscle computed tomography patterns in patients with the mitochondrial DNA mutation 3243a>g', J Neurol, 251(5), pp. 556-63.
Karppa, M., Syrjala, P., Tolonen, U. & Majamaa, K. (2003). 'Peripheral neuropathy in patients with the 3243a>g mutation in mitochondrial DNA', J Neurol, 250(2), pp. 216-21.
Katagiri, H., et al. (1994). 'Mitochondrial diabetes mellitus: Prevalence and clinical characterization of diabetes due to mitochondrial trna(leu(uur)) gene mutation in japanese patients', Diabetologia, 37(5), pp. 504-510.
Katulanda, P., et al. (2008). 'Prevalence and clinical characteristics of maternally inherited diabetes and deafness caused by the mt3243a > g mutation in young adult diabetic subjects in sri lanka', Diabet Med, 25(3), pp. 370-4.
Kishimoto, M., et al. (1995). 'Diabetes mellitus carrying a mutation in the mitochondrial trnaleu(uur) gene', Diabetologia, 38, pp. 193-200.
Klemm, T., et al. (2001). 'Search for mitochondrial DNA mutation at position 3243 in german patients with a positive family history of maternal diabetes mellitus', Exp Clin Endocrinol Diabetes, 109(5), pp. 283-7.
Ko, C., et al. (2001). 'De novo mutation in the mitochondrial trna leu(uur) gene (a3243g) with rapid segregation resulting in melas in the offspring', J Paediatr Child Health, 37, pp. 87-90.
Krishnan, K. J., et al. (2008). 'What causes mitochondrial DNA deletions in human cells?', Nat Genet, 40(3), pp. 275-9.
Kurogouchi, F., et al. (1998). 'A case of mitochondrial cytopathy with a typical point mutation for melas, presenting with severe focal-segmental glomerulosclerosis as main clinical manifestation', Am J Nephrol, 18(6), pp. 551-6.
Laloi-Michelin, M., et al. (2009). 'The clinical variability of maternally inherited diabetes and deafness is associated with the degree of heteroplasmy in blood leukocytes', J Clin Endocrinol Metab, 94(8), pp. 3025-30.
Langdahl, J. H., et al. (2017). 'Leucocytes mutation load declines with age in carriers of the m.3243a>g mutation. A 10-year prospective cohort', Clin Genet.
Larsson, N. G. & Clayton, D. A. (1995). 'Molecular genetic aspects of human mitochondrial disorders', Annu Rev Genet, 29, pp. 151-78.
Lee, H. C., et al. (1997). 'Mitochondrial gene transfer ribonucleic acid (trna)leu(uur) 3243 and trna(lys) 8344 mutations and diabetes mellitus in korea', J Clin Endocrinol Metab, 82(2), pp. 372-4.
Lee, W. J., et al. (2001). 'Islet cell autoimmunity and mitochondrial DNA mutation in korean subjects with typical and atypical type i diabetes', Diabetologia, 44(12), pp. 2187-91.
Lehto, M., et al. (1999). 'High frequency of mutations in mody and mitochondrial genes in scandinavian patients with familial early-onset diabetes', Diabetologia, 42(9), pp. 1131-7.
Lestienne, P. & Ponsot, G. (1988). 'Kearns-sayre syndrome with muscle mitochondrial DNA deletion', Lancet, 1(8590), p. 885.
Lien, L., et al. (2001). 'Involvement of nervous system in maternally inherited diabetes and deafness (midd) with the a3243g mutation of mitochondrial DNA', Acta Neurol Scand, 103(3), pp. 159-65.
Lowik, M. M., et al. (2005). 'Mitochondrial trnaleu(uur) mutation in a patient with steroid-resistant nephrotic syndrome and focal segmental glomerulosclerosis', Nephrol Dial Transplant, 20(2), pp. 336-41.
Ma, Y., et al. (2010). 'Clinical features of mitochondrial DNA m.3243a>g mutation in 47 chinese families', J Neurol Sci, 291(1-2), pp. 17-21.
Maassen, J., et al. (2002). 'A case of a de novo a3243g mutation in a mitochondrial DNA in a patient with diabetes and deafness', Arch Physiol Biochem, 110(3), pp. 186-8.
109
Majamaa-Voltti, K., et al. (2002). 'Cardiac abnormalities in patients with mitochondrial DNA mutation 3243 a>g', BMC Cardiovascular Disorders, 2(12).
Malecki, M. T., et al. (2001). 'Search for mitochondrial a3243g trna (leu) mutation in polish patients with type 2 diabetes mellitus', Med Sci Monit, 7(2), pp. 246-50.
Mancuso, M., et al. (2014). 'The m.3243a>g mitochondrial DNA mutation and related phenotypes. A matter of gender?', J Neurol, 261(3), pp. 504-10.
Manwaring, N., et al. (2007). 'Population prevalence of the melas a3243g mutation', Mitochondrion, 7(3), pp. 230-3.
Manwaring, N., Wang, J. J., Mitchell, P. & Sue, C. M. (2008). 'Mitochondrial DNA disease prevalence: Still underrecognized?', Ann Neurol, 64(4), pp. 471; author reply 471-2.
Martikainen, M. H., Ronnemaa, T. & Majamaa, K. (2013). 'Prevalence of mitochondrial diabetes in southwestern finland: A molecular epidemiological study', Acta Diabetol, 50(5), pp. 737-41.
Martin-Kleiner, I., et al. (2004). 'A pilot study of mitochondrial DNA point mutation a3243g in a sample of croatian patients having type 2 diabetes mellitus associated with maternal inheritance', Acta Diabetol, 41(4), pp. 179-84.
Massin, P., et al. (2008). 'Retinal and renal complications in patients with a mutation of mitochondrial DNA at position 3,243 (maternally inherited diabetes and deafness). A case-control study', Diabetologia, 51(9), pp. 1664-70.
Massin, P., et al. (1999). 'Prevalence of macular pattern dystrophy in maternally inherited diabetes and deafness. Gediam group', Ophthalmology, 106(9), pp. 1821-7.
Matsuura, N., et al. (1999). 'The prevalence of mitochondrial gene mutations in childhood diabetes in japan', J Pediatr Endocrinol Metab, 12(1), pp. 27-30.
Matsuzaki, M., et al. (2002). 'Hypothalamic growth hormone deficiency and supplementary gh therapy in two patients with mitochondrial myopathy, encephalopathy, lactic acidosis and stroke-like episodes', Neuropaediatrics, 33(5), pp. 271-3.
Mazzaccara, C., et al. (2012). 'Mitochondrial diabetes in children: Seek and you will find it', PLoS One, 7(4), p. e34956.
McFarland, R., Taylor, R. W. & Turnbull, D. M. (2010). 'A neurological perspective on mitochondrial disease', Lancet Neurol, 9(8), pp. 829-40.
Mehrazin, M., et al. (2009). 'Longitudinal changes of mtdna a3243g mutation load and level of functioning in melas', Am J Med Genet A, 149A(4), pp. 584-7.
Mita, S., et al. (1990). 'Recombination via flanking direct repeats is a major cause of large-scale deletions of human mitochondrial DNA', Nucleic Acids Res, 18(3), pp. 561-7.
Mkaouar-Rebai, E., et al. (2007). 'Mutational analysis of the mitochondrial trnaleu(uur) gene in tunisian patients with mitochondrial diseases', Biochem Biophys Res Commun, 355(4), pp. 1031-7.
Momiyama, Y., et al. (2001). 'Left ventricular hypertrophy and diastolic dysfunction in mitochondrial diabetes', Diabetes Care, 24(3), pp. 604-5.
Momiyama, Y., et al. (2002). 'Cardiac autonomic nervous dysfunction in diabetic patients with a mitochondrial DNA mutation', Diabetes Care, 25, pp. 2308-2313.
Moraes, C. T., et al. (1989). 'Mitochondrial DNA deletions in progressive external ophthalmoplegia and kearns-sayre syndrome', N Engl J Med, 320(20), pp. 1293-9.
Moraes, C. T., et al. (1992). 'Molecular analysis of the muscle pathology associated with mitochondrial DNA deletions', Nat Genet, 1(5), pp. 359-67.
Murphy, M. P. (2009). 'How mitochondria produce reactive oxygen species', Biochem J, 417(1), pp. 1-13.
Murphy, R., Turnbull, D. M., Walker, M. & Hattersley, A. T. (2008). 'Clinical features, diagnosis and management of maternally inherited diabetes and deafness (midd) associated with the 3243a>g mitochondrial point mutation', Diabet Med, 25(4), pp. 383-99.
Nakamura, S., et al. (1999). 'Renal complications in patients with diabetes mellitus associated with an a to g mutation of mitochondrial DNA at the 3243 position of leucine trna', Diabetes Research and Clinical Practice, 44, pp. 183-189.
Narbonne, H., et al. (2004). 'Gastrointestinal tract symptoms in maternally inherited diabetes and deafness (midd)', Diabetes metab, 30(1), pp. 61-6.

110
Naveed, A. K., Wahid, M. & Naveed, A. (2009). 'Mitochondrial trnaleu(uur) gene mutation and maternally inherited diabetes mellitus in pakistani population', International Journal of Diabetes Mellitus, 1(1), pp. 11-15.
Nesbitt, V., et al. (2013). 'The uk mrc mitochondrial disease patient cohort study: Clinical phenotypes associated with the m.3243a>g mutation--implications for diagnosis and management', J Neurol Neurosurg Psychiatry, 84(8), pp. 936-8.
Newkirk, J., et al. (1997). 'Maternally inherited diabetes and deafness: Prevalence in a hospital diabetic population', Diabetic Medicine, 14, pp. 457-460.
Newmeyer, D. D. & Ferguson-Miller, S. (2003). 'Mitochondria: Releasing power for life and unleashing the machineries of death', Cell, 112(4), pp. 481-90.
Ng, M. C., et al. (2000). 'Mitochondrial DNA a3243g mutation in patients with early- or late-onset type 2 diabetes mellitus in hong kong chinese', Clin Endocrinol (Oxf), 52(5), pp. 557-64.
Nomiyama, T., et al. (2002). 'Accumulation of somatic mutation in mitochondrial DNA extracted from peripheral blood cells in diabetic patients', Diabetologia, 45, pp. 1577-1583.
O'Callaghan, M. M., et al. (2015). 'Mutation loads in different tissues from six pathogenic mtdna point mutations', Mitochondrion, 22, pp. 17-22.
Odawara, M., Sasaki, K. & Yamashita, K. (1995). 'Prevalence and clinical characterisation of japanese diabetes mellitus with an a to g mutation at nucleotide 3243 of the mitochondrial trnaleu(uur) gene.', Journal of clinical Endocrinology and Metabolism, 80, pp. 1290-1294.
Ohkubo, K., et al. (2001). 'Mitochondrial gene mutations in the trna leu(uur) region and diabetes: Prevalence and clinical phenotypes in japan', Clinical Chemistry, 47(9), pp. 1641-1648.
Oka, Y., et al. (1993). 'Mitochondrial gene mutation in islet-cell-antibody-positive patients who were initially non-insulin-dependent diabetics', Lancet, 342, pp. 527-8.
Olsson, C., et al. (2001). 'The level of mitochondrial mutation a3243g decreases upon ageing in epithelial cells from individuals with diabetes and deafness', European Journal of Human Genetics, 9(12), pp. 917-21.
Otabe, S., et al. (1994). 'The high prevalence of diabetic patients with a mutation in the mitochondrial gene in japan', J Clin Endocrinol Metab, 79, pp. 768-771.
Pickett, S. J., et al. (2018). 'Phenotypic heterogeneity in m.3243a>g mitochondrial disease: The role of nuclear factors', Ann Clin Transl Neurol, 5(3), pp. 333-345.
Pozzan, T., Magalhaes, P. & Rizzuto, R. (2000). 'The comeback of mitochondria to calcium signalling', Cell Calcium, 28(5-6), pp. 279-83.
Prezant, T. R., et al. (1993). 'Mitochondrial ribosomal rna mutation associated with both antibiotic-induced and non-syndromic deafness', Nat Genet, 4(3), pp. 289-94.
Quan, P. L., Sauzade, M. & Brouzes, E. (2018). 'Dpcr: A technology review', Sensors (Basel), 18(4). Reardon, W., et al. (1992). 'Diabetes mellitus associated with a pathogenic point mutation in
mitochondrial DNA', Lancet, 340, pp. 1376-79. Rotig, A., et al. (1989). 'Mitochondrial DNA deletion in pearson's marrow/pancreas syndrome',
Lancet, 1(8643), pp. 902-3. Saker, P. J., et al. (1997). 'Ukpds 21: Low prevalence of the mitochondrial transfer rna gene
(trna(leu(uur))) mutation at position 3243bp in uk caucasian type 2 diabetic patients', Diabet Med, 14(1), pp. 42-5.
Schon, E. A., et al. (1989). 'A direct repeat is a hotspot for large-scale deletion of human mitochondrial DNA', Science, 244(4902), pp. 346-9.
Sepehrnia, B., et al. (1995). 'Screening for mtdna diabetes mutations in pima indians with niddm', Am J Med Genetics, 56(2), pp. 198-202.
Shields, B. M., et al. (2012). 'The development and validation of a clinical prediction model to determine the probability of mody in patients with young-onset diabetes', Diabetologia, 55(5), pp. 1265-72.
Shields, B. M., et al. (2017). 'Population-based assessment of a biomarker-based screening pathway to aid diagnosis of monogenic diabetes in young-onset patients', Diabetes Care, 40(8), pp. 1017-1025.

111
Shiraiwa, N., et al. (1993). 'Content of mutant mitochondrial DNA and organ dysfunction in a patient with a melas subgroup of mitochondrial encephalomyopathies', J Neurological Sciences, 120(2), pp. 174-9.
Shoffner, J. M., et al. (1992). 'Subacute necrotizing encephalopathy: Oxidative phosphorylation defects and the atpase 6 point mutation', Neurology, 42(11), pp. 2168-74.
Shoffner, J. M., et al. (1990). 'Myoclonic epilepsy and ragged-red fiber disease (merrf) is associated with a mitochondrial DNA trna(lys) mutation', Cell, 61(6), pp. 931-7.
Shoubridge, E. A. (1994). 'Mitochondrial DNA diseases: Histological and cellular studies', J Bioenerg Biomembr, 26(3), pp. 301-10.
Singh, R., Ellard, S., Hattersley, A. & Harries, L. W. (2006). 'Rapid and sensitive real-time polymerase chain reaction method for detection and quantification of 3243a>g mitochondrial point mutation', J Mol Diagn, 8(2), pp. 225-30.
Smith, M. L., et al. (1997). 'Diabetes and mitochondrial encephalomyopathy with lactic acidosis and stroke-like episodes (melas): Radiolabeled polymerase chain reaction is necessary for accurate detection of low percentages of mutation', J Clin Endocrinol Metab, 82, pp. 2826-2831.
Smith, P., et al. (1999). 'Pigmentary retinal dystrophy and the syndrome of maternally inherited diabetes and deafness caused by the mitochondrial DNA 3243 trna leu a to g mutation', Opthalmology, 106, pp. 1101-1108.
Smith, R. A., Hartley, R. C., Cocheme, H. M. & Murphy, M. P. (2012). 'Mitochondrial pharmacology', Trends Pharmacol Sci, 33(6), pp. 341-52.
Suzuki, S. (2004). 'Diabetes mellitus with mitochondrial gene mutations in japan', Ann N Y Acad Sci, 1011, pp. 185-92.
Suzuki, S., et al. (1994). 'Pancreatic beta-cell secretory defect associated with mitochondrial point mutation of the trna(leu(uur)) gene: A study in seven families with mitochondrial encephalomyopathy, lactic acidosis and stroke-like episodes (melas)', Diabetologia, 37(8), pp. 818-25.
Suzuki, S., et al. (2003). 'Clinical features of diabetes mellitus with the mitochondrial DNA 3243 (a to g) mutation in japanese: Maternal inheritance and mitochondria-related complications', Diabetes Research and Clinical Practice, 59(3), pp. 207-17.
Suzuki, Y., et al. (2005). 'Mitochondrial trna(leu(uur)) mutation at position 3243 detected in patients with type 1 diabetes', Diabetes Res Clin Pract, 67(1), pp. 92-4.
t'Hart, L., Lemkes, H., Heine, R. & et, a. (1994). 'Prevalence of maternally inherited diabetes and deafness in diabetic populations in the netherlands', Diabetologia, 37, pp. 1169-1170.
Taylor, R. W. & Turnbull, D. M. (2005). 'Mitochondrial DNA mutations in human disease', Nat Rev Genet, 6(5), pp. 389-402.
Tsukuda, K., et al. (1997). 'Screening of patients with maternally transmitted diabetes for mitochondrial gene mutations in the trna leu(uur) region', Diabetic Medicine, 14, pp. 1032-7.
Uchigata, Y., et al. (1996). 'Large-scale study of an a-to-g transition at position 3243 of the mitochondrial gene and iddm in japanese patients', Diabetologia, 39(2), pp. 245-6.
Ueda, Y., et al. (2004). 'A boy with mitochondrial disease: Asymptomatic proteinuria without neuromyopathy', Pediatr Nephrol, 19(1), pp. 107-10.
Uimonen, S., et al. (2001). 'Hearing impairment in patients with 3243a-->g mtdna mutation: Phenotype and rate of progression', Hum Genet, 108(4), pp. 284-9.
Urata, M., et al. (1998). 'New sensitive method for the detection of the a3243g mutation of human mitochondrial deoxyribonucleic acid in diabetes mellitus patients by ligation-mediated polymerase chain reaction', Clinical Chemistry, 44, pp. 2088-2093.
van den Ouweland, J., Lemkes, H. & Gerbitz, K. (1995). 'Maternally inherited diabetes and deafness (midd): A distinct subtype of diabetes associated with a mitochondrial trna leu(uur) gene point mutation', Muscle and Nerve, Suppl 3, pp. S124-S130.
van den Ouweland, J., et al. (1992). 'Mutation in mitochondrial trna leu(uur) gene in a large pedigree with maternally transmitted type 2 diabetes and deafness', Nature Genetics, 1, pp. 368-371.

112
van den Ouweland, J., et al. (1994). 'Maternally inherited diabetes and deafness is a distinct subtype of diabetes and associates with a single point mutation in the mitochondrial trna leu(uur) gene', Diabetes, 43(746-751).
van der Giezen, M. & Tovar, J. (2005). 'Degenerate mitochondria', EMBO Rep, 6(6), pp. 525-30. Vandebona, H., et al. (2009). 'Prevalence of mitochondrial 1555a-->g mutation in adults of
european descent', N Engl J Med, 360(6), pp. 642-4. Verhaak, C., et al. (2016). 'Quality of life, fatigue and mental health in patients with the m.3243a >
g mutation and its correlates with genetic characteristics and disease manifestation', Orphanet J Rare Dis, 11, p. 25.
Vialettes, B., et al. (1995). 'Extra-pancreatic manifestations in diabetes secondary to mitochondrial DNA point mutation within the trna leu(uur) gene', Diabetes Care, 18(7), pp. 1023-1028.
Vionnet, N., Passa, P. & Froguel, P. (1993). 'Prevalence of mitochondrial gene mutations in families with diabetes mellitus', Lancet, 342, pp. 1429-30.
Wahbi, K., et al. (2015). 'Long-term cardiac prognosis and risk stratification in 260 adults presenting with mitochondrial diseases', Eur Heart J, 36(42), pp. 2886-93.
Wallace, D. C., et al. (1988). 'Mitochondrial DNA mutation associated with leber's hereditary optic neuropathy', Science, 242(4884), pp. 1427-30.
Wang, S., et al. (2013). 'Mitochondrial DNA mutations in diabetes mellitus patients in chinese han population', Gene, 531(2), pp. 472-5.
Whittaker, R. G., et al. (2009). 'Urine heteroplasmy is the best predictor of clinical outcome in the m.3243a>g mtdna mutation', Neurology, 72(6), pp. 568-9.
Whittaker, R. G., et al. (2007). 'Prevalence and progression of diabetes in mitochondrial disease', Diabetologia, 50(10), pp. 2085-9.
Xia, C. Y., et al. (2016). 'Clinical and molecular characteristics in 100 chinese pediatric patients with m.3243a>g mutation in mitochondrial DNA', Chin Med J (Engl), 129(16), pp. 1945-9.
Yamagata, K., et al. (2000). 'Prevalence of japanese dialysis patients with an a-to-g mutation at nucleotide 3243 of the mitochondrial trna(leu(uur)) gene', Nephrol Dial Transplant, 15(3), pp. 385-8.
Yan, J. B., et al. (2014). 'Pyrosequencing is an accurate and reliable method for the analysis of heteroplasmy of the a3243g mutation in patients with mitochondrial diabetes', J Mol Diagn, 16(4), pp. 431-9.
Yanagisawa, K., et al. (1995). 'Mutation in the mitochondrial trna(leu) at position 3243 and spontaneous abortions in japanese women attending a clinic for diabetic pregnancies', Diabetologia, 38(7), pp. 809-15.
Yorifuji, T., et al. (2012). 'Comprehensive molecular analysis of japanese patients with pediatric-onset mody-type diabetes mellitus', Pediatr Diabetes, 13(1), pp. 26-32.

113
Appendix 1: A Units and C1 Credits
PGDip Leadership & Management in the Healthcare Sciences Unit marks ratified by Board of Examiners, November 2017 Trainee name: Kevin Colclough Student ID: 9845800 Award: PG Credit
Alliance Manchester Business School (AMBS) A Units
Unit Reference Unit Title Mark Credits Assignment Word Count
BMAN73511 A1: Professionalism and Professional Development in the Healthcare Environment
62% Pass
30 Practice Paper – 2000 words A1 – Assignment 1 – 2500 words A1 – Assignment 2 – 3000 words
BMAN73522 A2: Theoretical Foundations of Leadership
71% Pass
20 A2 – Assignment 1 – 3000 words A2 – Assignment 2 – 3000 words
BMAN73531 A3: Personal and Professional Development to Enhance Performance
68% Pass
30 A3 – Assignment 1 – 1500 words A3 – Assignment 2 – 4000 words
BMAN73542 A4: Leadership and Quality Improvement in the Clinical and Scientific Environment
65% Pass
20 A4 – Assignment 1 – 3000 words A4 – Assignment 2 – 3000 words
BMAN73550 A5: Research and Innovation in Health and Social care
73% Pass
20 A5 – Assignment 1 – 3000 words A5 – Assignment 2 – 3000 words
120/120

114
Appendix 2: HSST DClinSci Section C1 Innovation Project, Part 1– Literature Review
HSST DClinSci Section C1 Innovation Project Part 1 – Literature Review Title: Rapid genetic testing for GCK MODY in pregnant
women and subsequent non-invasive prenatal testing
to help guide obstetric care
Kevin Colclough
Department of Molecular Genetics
Royal Devon & Exeter NHS Foundation Trust
University of Manchester student ID: 9845800
Date of Submission: 30 June 2017
Word Count: 4216

115
Introduction
Heterozygous inactivating mutations in the glucokinase (GCK) gene result in GCK MODY (Maturity
Onset Diabetes of the Young), a subtype of monogenic diabetes that is characterised by persistent
fasting hyperglycaemia (Velho et al., 1992). GCK is an enzyme that catalyses the first reaction
step in the glycolysis pathway, namely the conversion of glucose to glucose-6-phosphate. It
therefore acts as the pancreatic beta cell glucose sensor and determines the set point for glucose
stimulated insulin secretion (Garcia-Herrero et al., 2007; Garcia-Herrero et al., 2012). In patients
with GCK MODY the set point for glucose stimulated insulin secretion is raised, and glucose is
regulated at this higher level (Velho et al., 1997). This results in a specific phenotype that is
distinct from other subtypes of MODY (Murphy et al., 2008). Patients have raised fasting
hyperglycaemia from birth that is mild (range 5.5-8mmol/L), typically asymptomatic and is not
progressive (Stride et al., 2002; Velho et al., 1997). Preserved glucose regulation results in a small
incremental rise in post-prandial glucose with 70% of patients having a 2 hour OGTT increment
<3mmol/L (Stride et al., 2002). The prevalence of GCK MODY is estimated to be approximately
1/1000 individuals (Chakera et al., 2014).
Counter-regulation is highly preserved in these patients, and any attempt to reduce blood glucose
result in a counter-regulatory response to increase glucose back to the higher set point (Guenat et
al., 2001). Therefore HbA1c is stable (between 40-60mmol/mol) and is not altered by
hypoglycaemic treatment (Steele et al., 2013; Stride et al., 2013).
Because the degree of hyperglycaemia is mild, the lifetime risk of microvascular complications
such as sight threatening retinopathy and nephropathy, and macrovascular complications such as
stroke, ischaemic heart disease and intermittent claudication are no different to the non-diabetic
population (Steele et al., 2014; Pruhova et al., 2013). The prevalence of obesity is also lower in
GCK MODY compared in young-onset type 2 diabetes and non-diabetic controls (Steele et al.,
2014). These patients therefore do not need any therapeutic intervention, monitoring or follow
up and can be discharged from diabetes clinics (Stride et al., 2013). A diagnosis of GCK MODY is

116
very important since it saves the patient from unnecessary treatment, glucose monitoring and
clinical follow-up for their lifetime.
Patients with GCK MODY are asymptomatic and many will remain undiagnosed throughout their
lifetime if blood glucose testing is not performed. The fasting hyperglycaemia in GCK MODY is
typically detected incidentally via routine medical screening, and therefore GCK MODY can be
diagnosed during pregnancy when testing for gestational diabetes (Chakera et al., 2014).
There are a number of important questions relating to GCK MODY and pregnancy. Given the
counter-regulatory response to hypoglycaemic treatment and the recommendation not to treat
outside of pregnancy, but knowing that maternal hyperglycaemia in pregnancy increases birth
weight and should therefore be controlled, how should we treat GCK MODY during pregnancy?
Does the GCK mutation status of the fetus alter the effect of maternal hyperglycaemia on fetal
growth, and would knowing the fetal genotype guide how maternal hyperglycaemia is managed in
managed? If so, is there a way of determining fetal genotype that does not involve performing
invasive prenatal sampling which carries a 1% risk of miscarriage? And if making a diagnosis of
GCK MODY in pregnancy and determining fetal genotype has important implications for clinical
management, how best to select women with GDM to undergo genetic testing for GCK MODY?
This literature review will focus on the peer reviewed research undertaken on GCK MODY and
pregnancy to try and provide some answers to these questions. The literature review will
consider articles determining the prevalence of GCK mutations in pregnancy and the clinical
features that most likely identify these patients from other forms of GDM, determine the clinical
implications of GCK MODY in pregnancy, the effect of fetal genotype status on birth weight, and
the current recommendations for treatment of GCK MODY in pregnancy. By determining those
clinical characteristics that enable the highly sensitive and specific selection of pregnant women
for rapid GCK mutation analysis, the literature review will form the basis of an evidence based
proposal for selection and rapid GCK MODY testing in women with GDM. If knowledge of the fetal
genotype determines the management of GDM, the review will also appraise the existing
knowledge of non-invasive prenatal genetic testing. If suitable non-invasive methodologies exist

117
for GCK fetal genotyping, this could be offered to all pregnant women with GCK MODY to ensure
the correct treatment pathway is selected.
Prevalence studies of GCK MODY in gestational diabetes
Sixteen studies have been published investigating the prevalence of GCK gene mutations in
patients with gestational diabetes, and these studies are summarised in Table 1. The proportion
of women in these cohorts with GCK mutations varies widely from 0 to 80%, depending on
population and selection criteria used. The most commonly used criteria for selecting patients for
GCK mutation analysis were a family history of diabetes/impaired fasting glycaemia
(IFG)/impaired glucose tolerance (IGT)/GDM, low BMI, treatment history, age of conception and
FBG/OGTT data characteristic of GCK MODY (typically fasting hyperglycaemia >5.5mmol/L in or
outside of pregnancy and a small incremental rise (<4mmol/L) in plasma glucose during an OGTT).
Diagnostic criteria for GDM varied between studies; National Diabetes Data Group (NDDG)
criteria, Carpenter-Coustan (CC) criteria and WHO/IADPSG criteria were used.
Since FBG in GCK MODY ranges from 5.5mmol/L upwards studies using higher FBG (>7mmol/L)
will miss GCK MODY cases (Stride et al., 2002). A family history of DM/IFG/IGT/GDM would not
always be present in GCK MODY if relatives were asymptomatic/undiagnosed and heterozygous
for a GCK mutation. BMI was rarely used as criteria in the study; outside of pregnancy, patients
with GCK MODY are at population risk of being obese, but as a risk factor for GDM obesity would
be enriched in GDM patients and so could be useful in selecting GDM cases for genetic testing.
The highest detection rate (80%) was reported by Ellard et al. (2000) by using more selective
criteria. However the higher specificity achieved by this criteria would result in a lower sensitivity
for identifying GCK MODY in GDM populations and would miss cases.
Most study sizes were too small to provide any meaningful estimate of the number of GDM cases
that can be attributed to GCK MODY. Three studies did estimate prevalence based on
proportion of their GDM cohort diagnosed with GCK MODY Chakera et al. (2014); 0.1% population

118
prevalence (1/1000) and 0.9% prevalence in GDM (9/1000), Rudland et al. (2016); 0.5-1% in
cohort, 1.4–2.7% for Anglo-Celtic women and 1–1.9% for Indian women, Wang et al. (2017); 0.4%
in Chinese women with GIGT and GDM. Therefore a good estimate of GCK MODY prevalence in
GDM is around 1-3%.
The lowest number of GCK MODY cases were diagnosed in Asian, African and Latino women with
GDM. There is a debate as to whether this is due to a higher predisposition to type 2 DM in these
ethnic groups, different mutation screening methods or different selection criteria (Bhargava et
al., 2016; Rudland et al., 2016).
Selection criteria were diverse, and in the majority of studies the cohort sizes were too small with
insufficient numbers of positive cases to determine the sensitivity and specificity of the selection
criteria used. Two recent studies have provided details on the efficiency of their selection
criteria; by using fasting glucose >5.5 mmol/L on antepartum OGTT and a pre-pregnancy BMI
<25kg/m2 Chakera et al. (2014) and Rudland et al. (2016) achieved sensitivity 68%, specificity 96%
and sensitivity 75%, specificity 96.1% respectively.
Selecting the most appropriate criteria for identifying GCK MODY in pregnancy would therefore
be a balancing act. Using criteria such as family history, FBG >5.5mmol/L outside of pregnancy
and a small 2 hour OGTT increment (<3mmol/L) achieves very good specificity at the cost of
missing cases. Using a FBG of >5.1mmol/L would identify 99% of GCK MODY cases but would
result in a large number of negative tests and use a considerable amount of NHS resources
without cost-benefit.
If diagnosing GCK MODY in pregnancy has important implications for glycaemic and obstetric
management, would it be possible to systematically screen for GCK MODY in pregnancy?
Pregnant women with undiagnosed GCK MODY would not be routinely picked up by the current
GDM screening criteria published by NICE (2015) as not all patients will have a family history of
diabetes or a personal history of GDM or macrosomic babies. Although the selection criteria of
BMI <26 for fasting hyperglycaemia >5.5mmol/L for GCK MODY in GDM cases would give a 1/3
positive detection rate, performing FBG testing in all pregnant women with BMI <26 as part of

119
routine first trimester screening blood tests is neither practical nor economical (would equate to
over 6,000 genetic tests for GCK MODY each year).
Steele et al. (2013) showed that HbA1c is tightly controlled in GCK MODY, ranging from 40-
60mmol/mol. Could this be used as a non-fasting test for selecting pregnant women for GCK
MODY analysis if performed in the first trimester? Rudland et al. (2016) showed that antepartum
HbA1c was not significantly different between GDM and GCK MODY cases, however further case
control studies would be needed to compare HbA1c of GCK MODY against healthy and GDM
pregnancies in the first trimester to determine the sensitivity and specificity of this analyte.

120
Table 1: Summary of studies determining the prevalence of GCK MODY in women with Gestational Diabetes
Author Cohort Selection Criteria Prevalence
Stoffel et al (1993) 40 American women with GDMIf third trimester OGTT 1 hour value >7.7 mmol/L, a 2nd OGTT was performed and GDM diagnosed based on O'Sullivan
and Mahan (1964) criteria. GDM patients with a first-degree diabetic relative selected for the study
5% (2/40), 1/18 Hispanic women, 1/9
Caucasian women
Zouali et al (1993) 17 French women with GDM A diagnosis of GDM and a family history of diabetes. No GDM diagnostic criteria provided. 6% (1/17)
Chiu et al (1994) 45 African American women with GDM
GDM diagnosed based on OGTT result according to O'Sullivan and Mahan (1964) criteria. Patients exlcuded if FBG >7.8
mmol/L on two occasions or an abnormal OGTT according to NDDG (1979) criteria on the follow-up visits after
delivery.
0% (0/45)
Saker et al (1996) 50 UK women with GDMGDM was diagnosed on the basis of two abnormal OGTT results druing pregnancy (at 28–34 weeks) and with
hyperglycaemia (> 5.5–10 mmol/L) on follow-up (mean duration 10 years).6% (3/50)
Allan et al (1997) 50 American women with GDMIf third trimester OGTT 1 hour value >7.7 mmol/L, a 2nd OGTT was performed and GDM diagnosed based on NDDG
(1979) criteria0% (0/50)
Ellard et al (2000) 15 UK Caucasians with GDM
FBG 5.5-8 mmol/L in pregnancy and (1) persisting fasting hyperglycaemia outside pregnancy (5.5-8 mmol/L) (2)
Increment between fasting and 2 hour value on OGTT <4.6 mmol/L (during or post pregnancy) (3) insulin treatment
during at least one pregnancy but subsequently controlled on diet (4) a history of Type II diabetes, gestational
diabetes or fasting hyperglycaemia (> 5.5 mmol/L) in a first-degree relative.
80% (12/15)
Kousta et al (2001) 17 multi-ethnic GDM women(1) FBG 5.5-8 mmol/L in pregnancy (2) persisting fasting hyperglycaemia outside pregnancy (5.5-8 mmol/L) (3)
Increment between fasting an 2 hour value on OGTT <3.5 mmol/L post pregnancy.12% (2/17)
Weng et al (2002)66 Swedish women with GDM selected from 110
women attending antenatal care
2 hour OGTT value of ≥9mmol/L at week 27–28 of pregnancy or at week 12 in women at risk (previous GDM or a family
history of diabetes) and at least one first- or second-degree relative with diabetes.2% (1/66)
Zurawek et al (2007) 119 Polish women with GDMage <35 years, BMI before pregnant <25 years, 2 hour OGTT increment <4.6 mmol/L and a history of type 2 DM or GDM
in a first-degree relative2% (2/119)
Lukasova et al (2008) 141 Czech women with GDMDiagnosis of GDM selected from the Institute for Mother and Child Care in Prague. Criteria for diagnosing GDM not
provided.0% (0/141)
Frigeri et al (2012) 100 Brazilian women with GDM Diagnosis of GDM according to American Diabetes Association criteria (2010). 0% (0/100)
Chakera et al (2014) 247 multi-ethnic women from the Atlantic DiP cohort 129 with FBG 5.1-5.5mmol/L and 118 with FBG ≥5.5mmol/L
4/247, extrapolated to 0.1% population
prevalence (1/1000) and 0.9%
prevalence in GDM (9/1000)
Sewell et al (2015) 72 American women with GDM
Mild T2DM diagnosed in pregnancy or within 10 years prior to pregnancy. Two or more abnormal values on a 100g 3
hour OGTT using the Carpenter & Coustan (1982) criteria. Exclusion criteria; poor glycaemic control documented prior
to pregnancy.
0% (0/72)
Extrapolated to 0.5-1% (4/776);
1.4–2.7% for Anglo-Celtic women
and 1–1.9% for Indian women
Doddabelavangala
Mruthyunjaya et al (2017)50 South Indian (Dravidian) women with GDM All pregnant women with any degree of glucose intolerance diagnosed ≤35 years and BMI ≤30kg/m2. 2% (1/50)
Wang et al (2017)29 Chinese women selected for testing from a cohort
of 501 women with GIGT or GDMFBG 5.5–8.0 mmol/L and Increment between fasting and 2 hour value on 100g OGTT <4.6 mmol/L (during pregnancy). Extrapolated to 0.4% (2/501)
Rudland et al (2016)
31 multi-ethnic women with GDM selected from a
cohort of 776 women from Royal Prince Alfred
Hospital, Australia
FBG 5.5–8.0 mmol/L and Increment between fasting and 2 hour value on OGTT <4.6 mmol/L (during pregnancy).
120

121
Studies on effect of GCK mutations on pregnancy
Hattersley et al. (1998) studied the birth weights of 58 children from GCK MODY families, and
demonstrated that fetal birth weight is dependent on the GCK mutation status of mother and
fetus. The lowest birth weight (mean 2889g, 24th centile) was observed when a fetus inherited
the mutation from the father with GCK MODY, and the highest birth weight (mean 3957g, 86th
centile) occurred when the fetus did not inherit the mutation from the mother with GCK MODY. If
the fetus did inherit the mutation from the mother with GCK MODY, a significant difference in
birth weight was not observed (mean 3378g, 53rd centile). Therefore the fetal genotype was
responsible for the birth weight phenotype when mother had GCK MODY. An average increase in
birth weight of 579g was observed when the fetus did not inherit the mutation and was exposed
to untreated maternal hyperglycaemia in utero, and when both mother and fetus were
heterozygous for the GCK mutation the average birth weight was reduced by 540g. The authors
proposed a fetal insulin hypothesis to explain this effect; glucose sensing by the fetal pancreas
mediates insulin secretion which in turn influences birth weight. A fetus without the GCK
mutation has normal glucose sensing and therefore has increased insulin secretion in response to
the persistent maternal hyperglycaemia, resulting in increased fetal growth (Figure 1 and 2). A
fetus that has inherited the mutation will have higher glucose sensing, and the effect of maternal
hyperglycaemia be cancelled out resulting in a normal birth weight.
Figure 1: Modified Pederson hypothesis explaining effect of maternal and fetal GCK mutation status on birth weight. Adapted from Pedersen (1954).
The increase in birth weight observed in unaffected offspring has been replicated in other studies
which are summarised in Table 2. Excluding the single case study by Spyer et al. (2001) the

122
average birth weight increase in unaffected offspring was 556g (range 288-707g) across the 10
studies. A small increase in birth weight of 288g that did not reach statistical significance (p =
0.88) was observed in the study by Velho et al. (2000). This discrepancy could be due to the fact
that birth weight data was obtained by maternal recall and not from medical records, and there
was no evidence that data on gestational age, gender or birth order was taken and the
appropriate adjustments of birth weight performed. A similar criticism could be made for other
studies where no evidence could be found for birth weight adjustment.
Figure 2: Mean birth weight centile in offspring of pregnant women with GCK MODY. =
unaffected offspring, = affected offspring. Figure taken from Chakera et al. (2015) and
adapted from Figure 1 in Spyer et al. (2009).

123
Table 2: Summary of studies of birth weight outcomes in offspring born to mothers heterozygous for a pathogenic GCK gene mutation
Author Cohort MethodBirth weight (g)
Unaffected Offspring
Birth weight (g)
Affected Offspring
Birth weight
difference (g)Additional observations P value
Hatters ley et a l
(1998)
58 chi ldren from 23 fami l ies
in 10 extended GCK MODY
pedigrees .
Absolute birth weight and centi le bi rth weight corrected for
gestational age, gender and birth order.
3957 ± 447 (n=21) 3378 ± 712 (n=19) 579 None <0.05
Velho et a l (2000) 241 offspring born to
mothers with GCK MODY
Birth weight data obtained from a questionnaire sent to mothers 3754 ± 544 (n=98) 3466 ± 429 (n=143) 288 Maternal hyperglycaemia has no influence on
adult BMI or metabol ic parameters
0.88
Spyer et a l (2001) 2 s ibl ings from a s ingle
mother with GCK MODY
Birth weight, length and occipi tofrontal ci rcumference recorded. 2630 (n=1) 1610 (n=1) 1020 Maternal glycaemia s imi lar in both pregnancies .
IUGR in one chi ld l ikely due to the high insul in
dose needed to achieve s trict BG control .
N/A
Barrio et a l (2002) 17 offspring born to mothers
with GCK MODY
mothers were asked for detai l s of their pregnancies and birth
weights of their offspring.
3883 ± 837 (n=3) 3551 ± 837 (n=14) 332 None Not ca lculated
Shehadeh et a l
(2005)
13 related offspring from a
s ingle pedigree
Birth weight col lected from medica l records bl inded to the
genetic analys is . Al l offspring were born ful l term.
3600 ± 570 (n=6) 2970 ± 390 (7) 630 None 0.007
Estal lela et a l (2007) 18 s ibpairs born to 9
mothers with GCK MODY
Birth weight col lected from medica l records 3610 ± 630 (n=9) 2990 ± 630 (n=9) 620 None 0.01
Singh et a l (2007) 46 offspring born to mothers
with GCK MODY
Birth weight was corrected for gestational age. Detai ls of bi rth
weight and gestation were obtained from cl inica l notes or by
maternal reca l l .
3960 (n=15) 3312 (n=31) 648 No evidence of a l tered beta cel l function or
glucose tolerance in unaffected fetuses exposed
to maternal hyperglycaemia.
<0.05
Shields et a l (2008) 43 offspring born to 19
mothers with GCK MODY
Detai ls of bi rth weight, gestational age at bi rth, and placental
weight were obtained retrospectively from hospita l obstetric
records . Adjustments for gestational age and sex were performed
us ing ANOVA and partia l correlations .
3820 ± 500 (n=18) 3360 ± 500 (n=25) 460 Placental weight increased by 110g in unaffected
fetuses .
0.007
Spyer et a l (2009) 82 offspring born to 42
mothers with GCK MODY
Gestational age at del ivery, feta l bi rth weight and detai ls of
maternal antenatal treatment were col lected. Multiple
pregnancies were excluded from the s tudy. Bi rth weights were
corrected for gender, gestational age and birth order. Centi le
growth was estimated us ing s tandard centi le growth charts .
4100 ± 500 (n=38) 3400 ± 500 (n=44) 700 Macrosomia in 39% of unaffected offspring.
Del ivered on average 1.6 weeks earl ier than
affected offspring. 55% of unaffected offspring
>90th centi le for growth. Shoulder dystocia in 4
unaffected babies .
< 0.001
de Las Heras et a l
(2010)
67 offspring born to 31
mothers with GCK MODY
Gestational age at del ivery, bi rth weight, maternal antenatal
treatment data col lected by questionnaire. Bi rth weights were
corrected for gestational age and gender.
3910 ± 837 (n=22) 3203 ± 481 (n=45) 707 Unaffected offspring more l ikely to be
macrosomic (40.9% vs . 8.9%; P = 0.006) than
affected offspring.
< 0.001
Bacon et a l (2015) 23 offspring born to 12
mothers with GCK MODY
Review of maternal charts and maternal reca l l . Birth weight,
gestation at del ivery, mode of del ivery and compl ications
recorded. BW corrected for gestation and gender.
4800 (n=10) 3200 (n=13) 600 50% of unaffected offspring had macrosomia vs
0% affected. 1/3 pregnancies affected by
compl ications or miscarriage.
0.01
123

124
Additional outcomes were recorded by some authors. Shields et al. (2008) reported that in
addition to a higher birth weight, fetuses not inheriting the mutation had a higher placental
weight (720 vs 610g, p = 0.042). Spyer et al. (2009) reported 39% of unaffected offspring were
born macrosomic (birth weight >4000g), compared to 7% of affected offspring. Similar rates of
macrosomia in unaffected offspring were reported by de Las Heras et al. (2010) (41%) and Bacon
et al. (2015) (50%). Spyer et al. (2009) observed that mothers with GCK MODY delivered their
babies on average 1.6 weeks earlier, and were more likely to have their labour induced (21% vs
3%) or undergo assisted delivery/Caesarean section (26% vs 3%). Complications were recorded in
some unaffected offspring, including four patients with shoulder dystocia (Spyer et al., 2009), and
Bacon et al. (2015) reported a miscarriage rate of 33% in mothers with GCK MODY compared to
the background population rate of 15%.
Studies on the clinical management of pregnancy in women with GCK MODY
The relationship between fetal genotype and birth weight has been well characterised by the
existing studies. But it was not clear if all offspring were exposed to a similar degree of maternal
glycaemia, since maternal blood glucose was not routinely recorded during pregnancy. In
pregnancy, insulin is given to reduce maternal glucose to prevent macrosomia; however only five
studies recorded data on insulin treatment and birth weight outcome in both affected and
unaffected offspring, and these are summarised in Table 3.
Only two authors (Bacon et al., 2015; Spyer et al., 2009) provided sufficient data to make
comparisons between birth weight in unaffected and affected offspring from insulin treated and
diet treated mothers. Both authors reported no significant difference in birth weights or rates of
macrosomia from offspring of insulin and diet treated mothers, regardless of the offspring GCK
mutation status. The study by de Las Heras et al. (2010) also reported no difference in birth
weight between the treatment groups, but only an assumption that is applies to both unaffected
and affected offspring can be made since this data was not provided. Both Spyer et al. (2009) and
de Las Heras et al. (2010) reported that mothers treated with insulin delivered earlier and were
more likely to require induction or assistance with delivery compared to diet treated mothers.

125
All studies were retrospective with offspring genotype determined after pregnancy, with the
exception of Chakera et al. (2012) where the authors were able to perform prenatal testing using
fetal CVS DNA obtained for aneuploidy analysis. In two pregnancies from the same mother,
prenatal testing showed that both fetuses had inherited the GCK mutation, and this informed the
decision not to treat mother with insulin. Both offspring were born without induction or
assistance, were healthy and had normal birth weights of 3405g and 3000g (50th and 21st
percentile respectively). This is the only report to date where prenatal testing has been used to
guide management of hyperglycaemia in GCK MODY pregnancy.
Again the limitation of these studies is the small sample numbers not reaching statistical
significance. They were retrospective studies where insulin doses and timings were variable, with
no monitoring of maternal glucose. There is a lack of data to suggest that insulin significantly
reduces birth weight in unaffected offspring compared to diet control. This could be due to
insufficient insulin doses given to overcome the counter-regulatory response, and therefore a
much higher dose of insulin (>1U/kg/day) would be required to achieve euglycaemia (Spyer et al.,
2001). Reduction of blood glucose in GCK MODY patients to normal physiological levels
(3.6mmol/L, 1mmol/L higher than normal controls) generates a symptomatic hypoglycaemic
response with production of hypoglycaemic markers such as adrenaline and glucagon (Spyer et
al., unpublished data), and there are anecdotal reports of symptomatic hypoglycaemia in GCK
MODY pregnancies treated with high doses of insulin (Chakera et al., 2015). It is therefore likely
that clinicians would favour an earlier delivery over high dose insulin treatment, but randomised
control trials are needed comparing the initiation of insulin therapy in third trimester to no
intervention to determine the effect on fetal size.

126
Table 3: Summary of studies comparing the effect of insulin and diet treatment in mothers on birth weight of offspring
Author Offspring GCK status & mother's treatment statusUnaffected Insulin
birth weigh (kg)
Unaffected no Insulin
birth weigh (kg)
Affected Insulin
birth weigh (kg)
Affected no insulin
birth weigh (kg)Delivery & complications
Spyer et al 2001 One affected child (insulin treated) and one unaffected
child (insulin treated) from the same mother.
2.6 N/A 1.6 N/A Labour induced in both pregnancies, no complications
Spyer et al 2009 38 unaffected offspring (19 insulin treated, 19 no insulin)
44 affected offspring (14 insulin treated, 30 no insulin)
4.1 ± 0.5 4.1 ± 0.5 3.3 ± 0.6 3.5 ± 0.5 Insulin treated mothers delivered 1.4 weeks earlier,
32% underwent induction and 44% underwent assisted
delivery/C-section
de Las Heras et al 2010 22 unaffected offspring (8 insulin treated, 14 no insulin)
45 affected offspring (10 insulin treated, 35 no insulin)
Insulin treated mothers delivered 1.8 weeks earlier and
47% underwent C-section. No difference in all
offsrping birth weight between insulin and not insulin
treated GCK mothers, but birth weight data not
separated according to maternal treatment and fetal
genotype status.
Chakera et al 2012 2 affected siblings, mother not treated in both pregnancies
since genotype known through prenatal testing
N/A N/A N/A 3.4 & 3.0 Term births, no complications
Bacon et al 2015 10 unaffected offspring (7 insulin treated, 3 no insulin)
13 affected offspring (10 insulin treated, 3 no insulin)
4 (3.8-4.1) 4.1 (3.3-4.9) 3.2 (3.1-3.7) 3.3 (3.0-3.9) No significant difference in rates of macrosomia
between insulin and no insulin. Insulin treatment did
not result in low birth weight (10th centile) in any
offspring
3.9 3.2
12
6
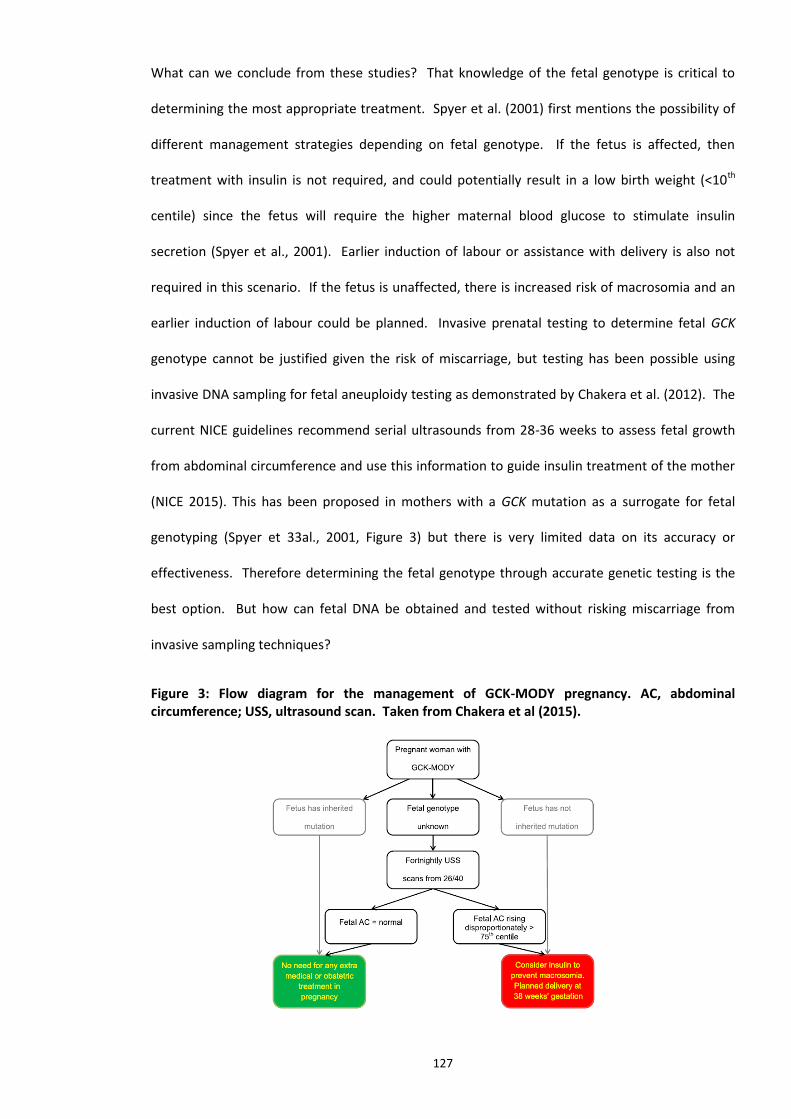
127
What can we conclude from these studies? That knowledge of the fetal genotype is critical to
determining the most appropriate treatment. Spyer et al. (2001) first mentions the possibility of
different management strategies depending on fetal genotype. If the fetus is affected, then
treatment with insulin is not required, and could potentially result in a low birth weight (<10th
centile) since the fetus will require the higher maternal blood glucose to stimulate insulin
secretion (Spyer et al., 2001). Earlier induction of labour or assistance with delivery is also not
required in this scenario. If the fetus is unaffected, there is increased risk of macrosomia and an
earlier induction of labour could be planned. Invasive prenatal testing to determine fetal GCK
genotype cannot be justified given the risk of miscarriage, but testing has been possible using
invasive DNA sampling for fetal aneuploidy testing as demonstrated by Chakera et al. (2012). The
current NICE guidelines recommend serial ultrasounds from 28-36 weeks to assess fetal growth
from abdominal circumference and use this information to guide insulin treatment of the mother
(NICE 2015). This has been proposed in mothers with a GCK mutation as a surrogate for fetal
genotyping (Spyer et 33al., 2001, Figure 3) but there is very limited data on its accuracy or
effectiveness. Therefore determining the fetal genotype through accurate genetic testing is the
best option. But how can fetal DNA be obtained and tested without risking miscarriage from
invasive sampling techniques?
Figure 3: Flow diagram for the management of GCK-MODY pregnancy. AC, abdominal circumference; USS, ultrasound scan. Taken from Chakera et al (2015).

128
Cell free fetal DNA (cffDNA) testing by droplet digital Polymerase Chain Reaction
(ddPCR) technology
Non-invasive prenatal diagnosis (NIPD) for single gene disorders is possible by testing cell free
fetal DNA (cffDNA) in maternal plasma (RAPID, 2014). Studies show cffDNA can be reliably
detected from 11-12 weeks of pregnancy onwards and makes up roughly 10% of all cell-free DNA
in the first trimester (Lo et al., 1998). An NIPD test needs to be very sensitive, inexpensive, quick
to perform and have a simple assay design, and droplet digital PCR (ddPCR) technology could be
suited for this use.
Six articles were selected for review that used ddPCR to determine fetal genotype using cffDNA.
Three studies performed NIPD for single gene disorders, two performed fetal Rhesus genotyping
and one study performed a feasibility study to determine if the relative mutation dosage (RMD)
method by ddPCR could be used to identify maternally inherited informative alleles in cffDNA. All
studies used the Bio-Rad QX100 or QX200 droplet generator and digital reader, and tested
replicates of the cffDNA sample. The key outcomes of the studies are summarised in Table 4.
The ddPCR assay was shown to be highly sensitive and able to detect mutant alleles when present
at less than 0.1% of the cell free DNA fraction (Hindson et al., 2011). The proportion of cell free
DNA in maternal plasma that was fetal varied between studies according to the gestational age of
the fetus at time of sampling (ranging from 1.6-27.7% and 8-36 weeks’ gestation). Fetal fraction
correlated well with increasing gestational age and 12 weeks gestation fetal fraction was 10%
(Svobodova et al., 2015) Higher fetal fractions were obtained when using Streck blood collection
tubes compared to EDTA tubes (Sillence et al., 2015). The correct fetal genotype could be
ascertained at fetal fractions as low as 2%.

129
Table 4: Summary of studies performing cffDNA genotype analysis using droplet digital PCR methodologies.
Author Reason for testing cffDNA Cohort Method Result Fetal Fraction
Debrand et al (2015) Fetal detection of
heterozygous CFTR mutations
inherited from carrier fathers
Three separate pregnancies (11-12 weeks' gestation)
from a couple who were both carriers of CFTR. Six
unaffected and unrelated control fetuses.
Presence of the paternal CFTR mutation p.F508del
determined by ddPCR using Bio-Rad QX100 in
triplicate. Confirmation by Sanger sequencing of
invasive sample.
Correctly detected the paternal
mutation in all three pregnancies, and
obtained a negative reulst in all 6 control
samples.
2.6-4.9% using ZFX and ZFY
Perlado et al (2015) Validation of ddPCR for fetal
genotyping of paternally and
maternally alleles
EDTA blood samples from 15 couples with
pregnancies between 8-20 weeks gestation.
fetal genotyping of selected maternal (31) and
paternal (19) informative autosomal SNPs by ddPCR
using Bio-Rad QX200 in 4-5 replicates. Genotyping
determined by RMD method. Confirmation by
Sanger sequencing of invasive sample.
100% of paternally inherited informative
SNPs identified in cffDNA. For
maternally inherited SNPs accuracy was
96% with one false positive result and 5
inconclusive results requireing repeat
sampling
5-21% using paternal
informative SNPs. 15.8%
using SRY & GAPDH for one
male fetus and 2.5-10.8%
using RASSF1A & GAPDH for
3 female fetuses
Sillence et al (2015) fetal RHD genotyping 46 RHD negative pregnant women (28-30 weeks'
gestation). Maternal plasma collected in Streck BCT &
EDTA tubes for comparison
presence of paternal RHD exons 5 & 7 determined
by ddPCR using Bio-Rad QX100 in duplicate.
Confirmation of ddPCR result by serology.
RHD genotype was correctly identified in
100% (24/24) and 95.5% (21/22) of cases
for samples collected in Streck BCTs and
EDTA tubes, respectively. 100%
sensitivity across all fetal fraction sizes.
9-16% using SRY, TSPY1,
RHD5 & RHD7 and Streck BCT
tubes
Svobodova et al (2015) fetal RHD genotyping EDTA blood samples taken from 10 RHD positive non-
pregnant volunteers and 35 RHD negative pregnant
women (12-36 weeks' gestation).
presence of paternal RHD exons 5, 7 and 10
determined by ddPCR using Bio-Rad QX100 in
triplicate. Confirmation of ddPCR result by
serology.
RHD genotype was correctly identified in
100% of cases.
1.6-27.7% using GAPDH,
RHD5, RHD7 and RHD10
De Franco et al (2016) Fetus at 50% risk of inheriting
heterozygous KCNJ11 mutation
from affected father
A pregnant woman who's partner was heterozygous
for KCNJ11 c.601C>T mutation. EDTA blood samples
taken at 12 and 16 weeks gestation.
Presence of paternal KCNJ11 c.601T allele by ddPCR
using Bio-Rad QX200. Confirmation of ddPCR result
by Sanger sequencing of cord blood.
Fetal genotype (mutation not inherited)
correctly determined by ddPCR.
6.2% (12 week sample) and
10.7% (16 week sample)
using a NEUROG3 gene SNP
Orhant et al (2016) Prenatal testing of the FGFR3
gene to confirm a suspected
diagnosis of Achondroplasia
One pregnant woman (22 weeks gestation) with a
fetus suspected of having achondroplasia and a
partner carrying an FGFR3 mutation. 25 pregnant
women with an echographic suspicion of fetal
chondrodysplasia (12-34 weeks' gestation). Samples
collected in Streck BCT tubes
ddPCR of a FGFR3 paternal mutant A-allele and 25
possible de novo mutant A-alleles using Bio-Rad
QX100 in duplicate. 4% fetal fraction QC cut-off.
Taqman confirmation of genotypes in a CVS or
aminotic fluid sample.
100% correlation of results from ddPCR
compared against Sanger sequencing of
an Amniotic fluid DNA sample. 100%
sensitivity across all fetal fraction sizes.
4-15% using RASSF1A and B-
ACTIN
129

130
5/6 studies tested for paternally inherited alleles. Paternal alleles are easier to determine since
they are only represented the in the fetal DNA and therefore the presence of the paternal allele in
a cell free DNA sample even at low levels is deemed to be positive. 100% accuracy was achieved in
determining paternally inherited alleles in the fetus.
Detecting maternally inherited alleles in cffDNA is more challenging due to the presence of
significant amounts of maternal cfDNA in the sample. One approach is relative mutation dosage
(RMD) that determines if the dosages of the mutant and wild-type alleles of a disease-causing
gene are balanced or unbalanced in maternal plasma (Lun et al., 2008). This involves identifying
informative maternal and paternal inherited single nucleotide variants (SNVs or SNPs) that can be
used to differentiate the maternal and paternal GCK alleles in the fetal DNA sample. By
comparing the abundance of droplets containing the SNPs it is possible to determine whether the
mutant GCK allele is overrepresented in the cell free DNA sample, therefore indicating that the
fetus has inherited the mutation.
Perlado et al. (2016) reported 96.5% accuracy for detecting maternal alleles by ddPCR and RMD.
One false positive result and 5 equivocal results were seen and deemed to be due to insufficient
levels of cffDNA in the maternal plasma sample. Accurately determining the fetal fraction is
therefore important in determining fetal fraction for calculating allelic ratios in the relative
mutation dosage (RMD) technique, and suitable quality and quantity thresholds for the cffDNA
sample need to be applied. In these situations the authors stated that all samples with
insufficient fetal fraction (<4%) would not be tested and a repeat sample would be requested.
Debrand et al. (2015, p. 7) described the ddPCR assay as a ‘technically unchallenging, flexible and
cost-effective addition to the range of tools available for analysing NIPD samples.’ The opinion of
ddPCR from Perlado et al. (2016, p. 10) was ‘this technology has been shown to be precise,
sensitive, rapid, and easy to interpret without a need for complex bioinformatic tools.’
131
Conclusion
Although a rare disorder with a population prevalence of 1/1000, GCK MODY accounts for
approximately 2% of all gestational diabetes cases. This is a significant number given the clinical
impact of GCK MODY in pregnant women; maternal hyperglycaemia increases the birth weight of
unaffected fetuses and the need for induced labour or assisted delivery, whereas affected fetuses
are within normal birth weight centiles and are likely to be delivered spontaneously.
Consequently, fetal GCK mutation status will determine how the pregnancy should be managed;
insulin or early induction of labour if the fetus is unaffected, and no treatment and the usual
planned delivery strategy if fetus is affected. But fetal genotype cannot be determined without
performing a risky invasive procedure. Fetal abdominal scans are an untested and less accurate
surrogate for determining GCK genotype, and so a non-invasive prenatal test is needed to safely
and accurately genotype the fetus.
The diagnosis of GCK MODY in pregnancy is important and diagnostic rates can be improved by
using simple selection criteria such as FBG >5.5mmol/L and BMI <26. It is unlikely that systematic
screening for GCK MODY using these criteria in all pregnancies would be practical, however HbA1c
could potentially be a more practical non-fasting biomarker for GCK MODY in the first trimester of
slim mothers and warrants further study.
The studies on GCK MODY and pregnancy reviewed in this assignment do have their limitations,
the most significant being the small sample numbers and lack of statistical power. This is perhaps
unavoidable given the rarity of the disorder, but does make conclusions regarding the most
appropriate management of unaffected pregnancies difficult to reach. Based on this review there
is insufficient evidence that insulin lowers birth weight in unaffected fetuses, and is more likely to
cause symptomatic hypoglycaemia. Early induction is the more pragmatic approach. A
randomised control trial for insulin treatment in GCK MODY pregnancies could provide the answer
but this may be difficult since the timing of insulin treatment will influence effect on fetal growth.

132
Studies on the detection of maternally inherited alleles in cffDNA by ddPCR are limited. But the
technology is promising with high levels of accuracy and sensitivity achieved in the studies
reviewed. Further studies using ddPCR and the RMD method would provide further evidence of
its utility in detecting maternally inherited alleles. Any NIPD service using ddPCR would obviously
need careful validation to ensure it is fit for purpose.
This review has highlighted a clear clinical utility in diagnosing GCK MODY in women with GDM
and determining fetal GCK genotype using non-invasive cffDNA testing techniques to help guide
pregnancy management. There is scope for an innovation that enables rapid GCK MODY
diagnosis during pregnancy and subsequent non-invasive fetal genotyping in a highly accurate and
timely manner to inform treatment needs. Based on the results of this review the innovation
might consist of three parts; (1) selection of patients with GDM for GCK MODY diagnostic testing
(2) rapid sequencing analysis of the GCK gene to diagnose GCK MODY (3) performing cffDNA
testing using ddPCR to determine fetal genotype and subsequently guide decisions on insulin
treatment during pregnancy. This will form the basis for an innovation proposal to perform rapid
GCK MODY diagnosis of women with GDM and subsequent NIPD by ddPCR to help with clinical
decision making.
(Allan et al., 1997; Zouali et al., 1993; Stoffel et al., 1993; Chiu et al., 1994; Saker et al., 1996;
Ellard et al., 2000; Kousta et al., 2001; Weng et al., 2002; Zurawek et al., 2007; Lukasova et al.,
2008; Doddabelavangala Mruthyunjaya et al., 2017; Frigeri et al., 2012; Sewell et al., 2015; Velho
et al., 2000; Singh et al., 2007; Barrio et al., 2002; Estalella et al., 2007; Shehadeh et al., 2005; De
Franco et al., 2017; Debrand et al., 2015; Orhant et al., 2016)

133
References
Allan, C. J., Argyropoulos, G., Bowker, M., Zhu, J., Lin, P. M., Stiver, K., Golichowski, A. & Garvey,
W. T. (1997) Gestational diabetes mellitus and gene mutations which affect insulin
secretion. Diabetes Res Clin Pract, 36(3), 135-41.
Bacon, S., Schmid, J., McCarthy, A., Edwards, J., Fleming, A., Kinsley, B., Firth, R., Byrne, B., Gavin,
C. & Byrne, M. M. (2015) The clinical management of hyperglycemia in pregnancy
complicated by maturity-onset diabetes of the young. Am J Obstet Gynecol, 213(2), 236
e1-7.
Barrio, R., Bellanne-Chantelot, C., Moreno, J. C., Morel, V., Calle, H., Alonso, M. & Mustieles, C.
(2002) Nine novel mutations in maturity-onset diabetes of the young (MODY) candidate
genes in 22 Spanish families. J Clin Endocrinol Metab, 87(6), 2532-9.
Bhargava, A., Siddiqui, S., Waghdhare, S. & Jha, S. (2016) Comment on Rudland et al. Identifying
Glucokinase Monogenic Diabetes in a Multiethnic Gestational Diabetes Mellitus Cohort:
New Pregnancy Screening Criteria and Utility of HbA1c. Diabetes Care 2016;39:50-52.
Diabetes Care, 39(1), e6.
Chakera, A. J., Carleton, V. L., Ellard, S., Wong, J., Yue, D. K., Pinner, J., Hattersley, A. T. & Ross, G.
P. (2012) Antenatal diagnosis of fetal genotype determines if maternal hyperglycemia due
to a glucokinase mutation requires treatment. Diabetes Care, 35(9), 1832-4.
Chakera, A. J., Spyer, G., Vincent, N., Ellard, S., Hattersley, A. T. & Dunne, F. P. (2014) The 0.1% of
the population with glucokinase monogenic diabetes can be recognized by clinical
characteristics in pregnancy: the Atlantic Diabetes in Pregnancy cohort. Diabetes Care,
37(5), 1230-6.
Chakera, A. J., Steele, A. M., Gloyn, A. L., Shepherd, M. H., Shields, B., Ellard, S. & Hattersley, A. T.
(2015) Recognition and Management of Individuals With Hyperglycemia Because of a
Heterozygous Glucokinase Mutation. Diabetes Care, 38(7), 1383-92.
Chiu, K. C., Go, R. C., Aoki, M., Riggs, A. C., Tanizawa, Y., Acton, R. T., Bell, D. S., Goldenberg, R. L.,
Roseman, J. M. & Permutt, M. A. (1994) Glucokinase gene in gestational diabetes mellitus:
population association study and molecular scanning. Diabetologia, 37(1), 104-10.
De Franco, E., Caswell, R., Houghton, J. A., Iotova, V., Hattersley, A. T. & Ellard, S. (2017) Analysis
of cell-free fetal DNA for non-invasive prenatal diagnosis in a family with neonatal
diabetes. Diabet Med, 34(4), 582-585.
de Las Heras, J., Martinez, R., Rica, I., de Nanclares, G. P., Vela, A. & Castano, L. (2010)
Heterozygous glucokinase mutations and birth weight in Spanish children. Diabet Med,
27(5), 608-10.
Debrand, E., Lykoudi, A., Bradshaw, E. & Allen, S. K. (2015) A Non-Invasive Droplet Digital PCR
(ddPCR) Assay to Detect Paternal CFTR Mutations in the Cell-Free Fetal DNA (cffDNA) of
Three Pregnancies at Risk of Cystic Fibrosis via Compound Heterozygosity. PLoS One,
10(11), e0142729.
Doddabelavangala Mruthyunjaya, M., Chapla, A., Hesarghatta Shyamasunder, A., Varghese, D.,
Varshney, M., Paul, J., Inbakumari, M., Christina, F., Varghese, R. T., Kuruvilla, K. A., T, V.
P., Jose, R., Regi, A., Lionel, J., Jeyaseelan, L., Mathew, J. & Thomas, N. (2017)
Comprehensive Maturity Onset Diabetes of the Young (MODY) Gene Screening in
Pregnant Women with Diabetes in India. PLoS One, 12(1), e0168656.
Ellard, S., Beards, F., Allen, L. I., Shepherd, M., Ballantyne, E., Harvey, R. & Hattersley, A. T. (2000)
A high prevalence of glucokinase mutations in gestational diabetic subjects selected by
clinical criteria. Diabetologia, 43(2), 250-3.

134
Estalella, I., Rica, I., Perez de Nanclares, G., Bilbao, J. R., Vazquez, J. A., San Pedro, J. I., Busturia, M.
A. & Castano, L. (2007) Mutations in GCK and HNF-1alpha explain the majority of cases
with clinical diagnosis of MODY in Spain. Clin Endocrinol (Oxf), 67(4), 538-46.
Frigeri, H. R., Santos, I. C., Rea, R. R., Almeida, A. C., Fadel-Picheth, C. M., Pedrosa, F. O., Souza, E.
M., Rego, F. G. & Picheth, G. (2012) Low prevalence of glucokinase gene mutations in
gestational diabetic patients with good glycemic control. Genet Mol Res, 11(2), 1433-41.
Garcia-Herrero, C. M., Galan, M., Vincent, O., Flandez, B., Gargallo, M., Delgado-Alvarez, E.,
Blazquez, E. & Navas, M. A. (2007) Functional analysis of human glucokinase gene
mutations causing MODY2: exploring the regulatory mechanisms of glucokinase activity.
Diabetologia, 50(2), 325-33.
Garcia-Herrero, C. M., Rubio-Cabezas, O., Azriel, S., Gutierrez-Nogues, A., Aragones, A., Vincent,
O., Campos-Barros, A., Argente, J. & Navas, M. A. (2012) Functional characterization of
MODY2 mutations highlights the importance of the fine-tuning of glucokinase and its role
in glucose sensing. PLoS ONE, 7(1), e30518.
Guenat, E., Seematter, G., Philippe, J., Temler, E., Jequier, E. & Tappy, L. (2001) Counterregulatory
responses to hypoglycemia in patients with maturity-onset diabetes of the young caused
by HNF-1alpha gene mutations (MODY3). Eur J Endocrinol, 144(1), 45-9.
Hattersley, A. T., Beards, F., Ballantyne, E., Appleton, M., Harvey, R. & Ellard, S. (1998) Mutations
in the glucokinase gene of the fetus result in reduced birth weight. Nat Genet, 19(3), 268-
70.
Hindson, B. J., Ness, K. D., Masquelier, D. A., Belgrader, P., Heredia, N. J., Makarewicz, A. J., Bright,
I. J., Lucero, M. Y., Hiddessen, A. L., Legler, T. C., Kitano, T. K., Hodel, M. R., Petersen, J. F.,
Wyatt, P. W., Steenblock, E. R., Shah, P. H., Bousse, L. J., Troup, C. B., Mellen, J. C.,
Wittmann, D. K., Erndt, N. G., Cauley, T. H., Koehler, R. T., So, A. P., Dube, S., Rose, K. A.,
Montesclaros, L., Wang, S., Stumbo, D. P., Hodges, S. P., Romine, S., Milanovich, F. P.,
White, H. E., Regan, J. F., Karlin-Neumann, G. A., Hindson, C. M., Saxonov, S. & Colston, B.
W. (2011) High-throughput droplet digital PCR system for absolute quantitation of DNA
copy number. Anal Chem, 83(22), 8604-10.
Kousta, E., Ellard, S., Allen, L. I., Saker, P. J., Huxtable, S. J., Hattersley, A. T. & McCarthy, M. I.
(2001) Glucokinase mutations in a phenotypically selected multiethnic group of women
with a history of gestational diabetes. Diabet Med, 18(8), 683-4.
Lo, Y. M., Tein, M. S., Lau, T. K., Haines, C. J., Leung, T. N., Poon, P. M., Wainscoat, J. S., Johnson, P.
J., Chang, A. M. & Hjelm, N. M. (1998) Quantitative analysis of fetal DNA in maternal
plasma and serum: implications for noninvasive prenatal diagnosis. Am J Hum Genet,
62(4), 768-75.
Lukasova, P., Vcelak, J., Vankova, M., Vejrazkova, D., Andelova, K. & Bendlova, B. (2008) Screening
of mutations and polymorphisms in the glucokinase gene in Czech diabetic and healthy
control populations. Physiol Res, 57 Suppl 1, S99-108.
Lun, F. M., Tsui, N. B., Chan, K. C., Leung, T. Y., Lau, T. K., Charoenkwan, P., Chow, K. C., Lo, W. Y.,
Wanapirak, C., Sanguansermsri, T., Cantor, C. R., Chiu, R. W. & Lo, Y. M. (2008)
Noninvasive prenatal diagnosis of monogenic diseases by digital size selection and relative
mutation dosage on DNA in maternal plasma. Proc Natl Acad Sci U S A, 105(50), 19920-5.
Murphy, R., Ellard, S. & Hattersley, A. T. (2008) Clinical implications of a molecular genetic
classification of monogenic beta-cell diabetes. Nat Clin Pract Endocrinol Metab, 4(4), 200-
13.
NICE. (2015) Diabetes in pregnancy: management from preconception to the postnatal period.
Available at: https://www.nice.org.uk/guidance/ng3/resources/diabetes-in-pregnancy-

135
management-from-preconception-to-the-postnatal-period-51038446021 (Accessed: 22
June 2017)
Orhant, L., Anselem, O., Fradin, M., Becker, P. H., Beugnet, C., Deburgrave, N., Tafuri, G.,
Letourneur, F., Goffinet, F., Allach El Khattabi, L., Leturcq, F., Bienvenu, T., Tsatsaris, V. &
Nectoux, J. (2016) Droplet digital PCR combined with minisequencing, a new approach to
analyze fetal DNA from maternal blood: application to the non-invasive prenatal diagnosis
of achondroplasia. Prenat Diagn, 36(5), 397-406.
Pedersen, J. (1954) Weight and length at birth of infants of diabetic mothers. Acta Endocrinol
(Copenh), 16(4), 330-42.
Perlado, S., Bustamante-Aragones, A., Donas, M., Lorda-Sanchez, I., Plaza, J. & Rodriguez de Alba,
M. (2016) Fetal Genotyping in Maternal Blood by Digital PCR: Towards NIPD of Monogenic
Disorders Independently of Parental Origin. PLoS One, 11(4), e0153258.
Pruhova, S., Dusatkova, P., Kraml, P. J., Kulich, M., Prochazkova, Z., Broz, J., Zikmund, J., Cinek, O.,
Andel, M., Pedersen, O., Hansen, T. & Lebl, J. (2013) Chronic Mild Hyperglycemia in GCK-
MODY Patients Does Not Increase Carotid Intima-Media Thickness. Int J Endocrinol, 2013,
718254.
RAPID. (2014) NIPD for single gene disorders; A guide for patients and healthcare professionals.
Available at: http://www.rapid.nhs.uk/guides-to-nipd-nipt/nipd-for-single-gene-
disorders/ (Accessed 22 June 2017)
Rudland, V. L., Hinchcliffe, M., Pinner, J., Cole, S., Mercorella, B., Molyneaux, L., Constantino, M.,
Yue, D. K., Ross, G. P. & Wong, J. (2016) Identifying Glucokinase Monogenic Diabetes in a
Multiethnic Gestational Diabetes Mellitus Cohort: New Pregnancy Screening Criteria and
Utility of HbA1c. Diabetes Care, 39(1), 50-2.
Saker, P. J., Hattersley, A. T., Barrow, B., Hammersley, M. S., McLellan, J. A., Lo, Y. M., Olds, R. J.,
Gillmer, M. D., Holman, R. R. & Turner, R. C. (1996) High prevalence of a missense
mutation of the glucokinase gene in gestational diabetic patients due to a founder-effect
in a local population. Diabetologia, 39(11), 1325-8.
Sewell, M. F., Presley, L. H., Holland, S. H. & Catalano, P. M. (2015) Genetic causes of maturity
onset diabetes of the young may be less prevalent in American pregnant women recently
diagnosed with diabetes mellitus than in previously studied European populations. J
Matern Fetal Neonatal Med, 28(10), 1113-5.
Shehadeh, N., Bakri, D., Njolstad, P. R. & Gershoni-Baruch, R. (2005) Clinical characteristics of
mutation carriers in a large family with glucokinase diabetes (MODY2). Diabet Med, 22(8),
994-8.
Shields, B. M., Spyer, G., Slingerland, A. S., Knight, B. A., Ellard, S., Clark, P. M., Hauguel-de
Mouzon, S. & Hattersley, A. T. (2008) Mutations in the glucokinase gene of the fetus result
in reduced placental weight. Diabetes Care, 31(4), 753-7.
Sillence, K. A., Roberts, L. A., Hollands, H. J., Thompson, H. P., Kiernan, M., Madgett, T. E., Welch,
C. R. & Avent, N. D. (2015) Fetal Sex and RHD Genotyping with Digital PCR Demonstrates
Greater Sensitivity than Real-time PCR. Clin Chem, 61(11), 1399-407.
Singh, R., Pearson, E. R., Clark, P. M. & Hattersley, A. T. (2007) The long-term impact on offspring
of exposure to hyperglycaemia in utero due to maternal glucokinase gene mutations.
Diabetologia, 50(3), 620-4.
Spyer, G., Hattersley, A. T., Sykes, J. E., Sturley, R. H. & MacLeod, K. M. (2001) Influence of
maternal and fetal glucokinase mutations in gestational diabetes. Am J Obstet Gynecol,
185(1), 240-1.

136
Spyer, G., Macleod, K. M., Shepherd, M., Ellard, S. & Hattersley, A. T. (2009) Pregnancy outcome in
patients with raised blood glucose due to a heterozygous glucokinase gene mutation.
Diabet Med, 26(1), 14-8.
Steele, A. M., Shields, B. M., Wensley, K. J., Colclough, K., Ellard, S. & Hattersley, A. T. (2014)
Prevalence of vascular complications among patients with glucokinase mutations and
prolonged, mild hyperglycemia. JAMA, 311(3), 279-86.
Steele, A. M., Wensley, K. J., Ellard, S., Murphy, R., Shepherd, M., Colclough, K., Hattersley, A. T. &
Shields, B. M. (2013) Use of HbA1c in the Identification of Patients with Hyperglycaemia
Caused by a Glucokinase Mutation: Observational Case Control Studies. PLoS ONE, 8(6),
e65326.
Stoffel, M., Bell, K. L., Blackburn, C. L., Powell, K. L., Seo, T. S., Takeda, J., Vionnet, N., Xiang, K. S.,
Gidh-Jain, M., Pilkis, S. J. & et al. (1993) Identification of glucokinase mutations in subjects
with gestational diabetes mellitus. Diabetes, 42(6), 937-40.
Stride, A., Shields, B., Gill-Carey, O., Chakera, A. J., Colclough, K., Ellard, S. & Hattersley, A. T.
(2013) Cross-sectional and longitudinal studies suggest pharmacological treatment used
in patients with glucokinase mutations does not alter glycaemia. Diabetologia.
Stride, A., Vaxillaire, M., Tuomi, T., Barbetti, F., Njolstad, P. R., Hansen, T., Costa, A., Conget, I.,
Pedersen, O., Sovik, O., Lorini, R., Groop, L., Froguel, P. & Hattersley, A. T. (2002) The
genetic abnormality in the beta cell determines the response to an oral glucose load.
Diabetologia, 45(3), 427-35.
Svobodova, I., Pazourkova, E., Horinek, A., Novotna, M., Calda, P. & Korabecna, M. (2015)
Performance of Droplet Digital PCR in Non-Invasive Fetal RHD Genotyping - Comparison
with a Routine Real-Time PCR Based Approach. PLoS One, 10(11), e0142572.
Velho, G., Blanche, H., Vaxillaire, M., Bellanne-Chantelot, C., Pardini, V. C., Timsit, J., Passa, P.,
Deschamps, I., Robert, J. J., Weber, I. T., Marotta, D., Pilkis, S. J., Lipkind, G. M., Bell, G. I. &
Froguel, P. (1997) Identification of 14 new glucokinase mutations and description of the
clinical profile of 42 MODY-2 families. Diabetologia, 40(2), 217-24.
Velho, G., Froguel, P., Clement, K., Pueyo, M. E., Rakotoambinina, B., Zouali, H., Passa, P., Cohen,
D. & Robert, J. J. (1992) Primary pancreatic beta-cell secretory defect caused by mutations
in glucokinase gene in kindreds of maturity onset diabetes of the young. Lancet,
340(8817), 444-8.
Velho, G., Hattersley, A. T. & Froguel, P. (2000) Maternal diabetes alters birth weight in
glucokinase-deficient (MODY2) kindred but has no influence on adult weight, height,
insulin secretion or insulin sensitivity. Diabetologia, 43(8), 1060-3.
Wang, Z., Ping, F., Zhang, Q., Zheng, J., Zhang, H., Yu, M., Li, W. & Xiao, X. (2017) Preliminary
screening of mutations in the glucokinase gene of Chinese patients with gestational
diabetes. J Diabetes Investig.
Weng, J., Ekelund, M., Lehto, M., Li, H., Ekberg, G., Frid, A., Aberg, A., Groop, L. C. & Berntorp, K.
(2002) Screening for MODY mutations, GAD antibodies, and type 1 diabetes--associated
HLA genotypes in women with gestational diabetes mellitus. Diabetes Care, 25(1), 68-71.
Zouali, H., Vaxillaire, M., Lesage, S., Sun, F., Velho, G., Vionnet, N., Chiu, K., Passa, P., Permutt, A.,
Demenais, F. & et al. (1993) Linkage analysis and molecular scanning of glucokinase gene
in NIDDM families. Diabetes, 42(9), 1238-45.
Zurawek, M., Wender-Ozegowska, E., Januszkiewicz-Lewandowska, D., Zawiejska, A. & Nowak, J.
(2007) GCK and HNF1alpha mutations and polymorphisms in Polish women with
gestational diabetes. Diabetes Res Clin Pract, 76(1), 157-8.

137
Appendix 3: HSST DClinSci Section C1 Innovation Project, Part 2 – Innovation Proposal
HSST DClinSci Section C1 Innovation Project Part 2 – Innovation Proposal Title: Rapid genetic testing for GCK MODY in pregnant
women and subsequent non-invasive prenatal testing
to help guide obstetric care
Kevin Colclough
Department of Molecular Genetics
Royal Devon & Exeter NHS Foundation Trust
University of Manchester student ID: 9845800
Date of Submission: 30 June 2017

138
Executive summary
An estimated 2% of women with gestational diabetes will have a rare genetic form of diabetes which
doctors call GCK MODY. This is caused by a genetic change or variant in the gene called glucokinase (GCK),
which has an important role in the pancreas by regulating insulin release and controlling blood glucose
levels. GCK MODY not strictly diabetes, but a problem with how the pancreas senses blood glucose levels.
The result is mild but lifelong fasting hyperglycaemia (raised blood glucose) that is present from birth.
A diagnosis of GCK MODY in a woman with gestational diabetes has very important implications for how to
manage the pregnancy. This is because the birth weight of the baby is determined by whether or not the
baby has inherited the GCK MODY gene variant from mother. If the baby has not inherited the GCK variant,
the baby’s pancreas will sense the maternal blood glucose level as being high and produce insulin in
response. Higher insulin levels increase the baby’s growth towards the end of the pregnancy, which will
result in a large baby with a high birth weight. This could cause complications during delivery and the baby
may need assistance to be delivered such as a caesarean section. Often doctors will use insulin to try and
lower mother’s blood glucose, or perform multiple ultrasound scans to determine if the baby is growing too
much.
However in half of all pregnancies the baby will inherit the GCK gene variant from mother and will sense the
raised maternal blood glucose level as normal. Insulin production will not be raised and birth weight will be
normal with a much lower risk to the baby and mother from delivery complications.
Knowing the GCK variant status of the baby can therefore determine how to manage the pregnancy. If baby
has the GCK variant then pregnancy will be low risk, and insulin treatment and intensive ultrasound
monitoring of the baby’s growth are not required. This will reduce stress on the mother and baby, prevent
the birth of babies that are small for gestational age and reduce the burden on NHS resources. If the baby
has not inherited the GCK variant, then plans can be made for an early induction of labour to prevent
complications due to a large baby.
The problem is that it is not possible to test the baby’s GCK gene without performing an invasive procedure
which can cause miscarriage. It is possible to estimate the variant status by ultrasound growth scans, but
this is not very accurate. This innovation proposes a new, non-invasive genetic test to determine the baby’s
variant status and use this to correctly manage the pregnancy. This innovation will analyse cell-free fetal
DNA (cffDNA); small fragments of the baby’s DNA that are released from placenta cells and are present in
small amounts in the mother’s bloodstream. A rapid diagnostic genetic test will diagnose GCK MODY in
pregnant women within 5 days, and a highly accurate cffDNA genetic test for the GCK variant in the baby
will be offered using a fast, accurate and inexpensive technique. If the test is positive, the mother can be

139
discharged from the high-risk antenatal clinic without the need for insulin treatment and scans. If the test is
negative, the mother can be induced at 38 weeks’ gestation and avoid complications from delivering a large
full term baby. Pregnancy outcomes will be improved by reducing the risk of delivery complications and
reducing the degree of stress experienced by mother and baby. Discharge from high-risk antenatal care will
also reduce the burden on NHS services and allow resources to be used elsewhere, improving obstetric
services for all mothers.
Background & Context
GCK MODY is an autosomal dominant disorder of pancreatic glucose sensing caused by heterozygous
inactivating mutations in the GCK gene (Velho et al., 1997). The disorder is characterised by asymptomatic
lifelong fasting hyperglycaemia from birth that does not require treatment and does not increase risk of
developing micro- and macro-vascular complications (Steele et al., 2014; Stride et al., 2013). GCK MODY is
commonly diagnosed after the incidental finding of fasting hyperglycaemia in pregnancy, and is estimated
to account for 2% of all gestational diabetes cases (Chakera et al., 2014).
During pregnancy it is the fetal genotype, rather than the degree of maternal hyperglycaemia, that
determines fetal growth and the risk of delivery complications. Offspring of GCK MODY mothers that do
not inherit the GCK mutation will be born on average 700g heavier than offspring that do, and 55% will have
a birth weight >90th
centile (Spyer et al., 2009). This increased birth weight can result in macrosomia and
birth complications such as shoulder dystocia and a higher likelihood of assisted delivery and caesarean
section (Bacon et al., 2015; Spyer et al., 2009). For a fetus that has inherited the mutation from a mother
with GCK MODY, birth weight is reduced by approximately 400g and there is a 3 fold increased risk of being
born small for gestational age (SGA) (<10th
centile) (Hattersley et al., 1998). The risk of macrosomia and
obstetric complications is only increased when the fetus has not inherited the maternal GCK mutation.
Therefore insulin treatment to lower maternal blood glucose and high-risk intensive antenatal care is not
required if the fetus has inherited the mutation (Chakera et al., 2012). Aggressive glucose lowering when
the fetus has not inherited the mutation can reduce fetal growth resulting in babies that are SGA (Spyer et
al., 2001).
Current situation
Correct management of pregnancy in women with GCK MODY requires knowledge of the fetal GCK
genotype, but this is rarely known during pregnancy. Although invasive prenatal genetic testing is possible,
it carries a 1% risk of miscarriage and therefore cannot be justified. Testing can be undertaken using fetal
DNA samples that have been obtained for other fetal abnormalities such as aneuploidy (Chakera et al.,
2012). However this will be a rare scenario and the suggested pragmatic approach is to manage the
pregnancy based on ultrasound fetal growth scans (Chakera et al. 2015, p. 1388): ‘fortnightly scans from 26
weeks’ gestation. If the fetal abdominal circumference (FAC) is rising disproportionally above the 75th
centile, then, to prevent the risks associated with macrosomia, insulin treatment should be started and
labor should be induced at 38 weeks’. Induction at 38 weeks’ gestation is likely to be favoured over insulin
treatment given the difficulty in lowering maternal blood glucose; ‘The advice isn’t clear as there isn’t the

140
evidence base to be sure, but I would advise not treating with insulin in the third trimester, but monitoring
fetal size and inducing labour when appropriate.’ (Personal communication from Dr Ali Chakera, consultant
diabetologist at the Royal Sussex County Hospital, Brighton). If the fetal abdominal circumference is below
the 75th
centile then there is no need for any extra medical or obstetric treatment in pregnancy (Appendix
1).
Why there needs to be change
There is a high degree of variability in estimating fetal weight using abdominal circumference scans due to
ultra-sonographer experience, the formulae used and high error rates of 5-14% (Hoopmann et al., 2010;
Kurmanavicius et al., 2004). Estimation of fetal weight can therefore be unreliable, requiring multiple fetal
scans to obtain an accurate measure (Hindmarsh et al., 2002). The optimal centile cut-off for estimating
fetal genotype is unclear and the proposed 75th
centile cut-off remains untested in larger GCK MODY
pregnancy cohorts (Tartaglia et al., 2013).
Women with GCK MODY commented that they experienced stress and anxiety during pregnancy caused by
repeated ultrasound examinations and the uncertainty over the size of their babies (Appendix 6):
‘If I would have known at the beginning of both pregnancies if my babies were positive for the gene, the
pregnancies would have been much less stressful regarding appointments, ultrasounds, and education to so
many doctors.’
‘I had 7 ultrasounds in my second pregnancy and was stressing each time, knowing that if the baby was
looking big I may have to consider large amounts of insulin or inducing early.’
It was also clear from the patients’ comments that clinicians struggled with providing the correct clinical
management since the patients were atypical and did not fit the typical phenotype of GDM. Patients would
become unwell and experience hypoglycaemia when treated with insulin.
‘I have had 2 pregnancies now being treated as a diabetic and blindly followed advice from diabetes staff. I
found it quite upsetting that I was having to take insulin and my babies were very big making pregnancy a
struggle physically.’
‘The diabetes team decided to start me on insulin straight away. With this I experienced hypos and was very
unwell. I had a very difficult time trying to convince medical staff I was unwell due to the diabetes treatment
and not just "pregnant".’
‘Not knowing if both of my children had GCK MODY meant I had to have multiple ultrasounds and educate 9
different doctors for 2 pregnancies about GCK MODY, the risks, complications, treatment, and protocols for
checking fetus weight in the 3rd trimester.’
Non-invasive prenatal diagnosis (NIPD) of cell-free fetal DNA (cffDNA) using droplet digital PCR (ddPCR)
could enable highly accurate fetal genotyping in all GCK MODY pregnancies. NIPD is clearly superior to fetal
scanning since it will exactly determine fetal genotype through a single rapid genetic test rather than a
prediction based on numerous ultrasound scans.

141
Aims and Objectives
The proposal put forward here will aim to introduce a service enabling the rapid diagnosis of GCK MODY in
women with GDM, and subsequent non-invasive determination of fetal GCK genotype using ddPCR analysis
of cffDNA. The initial objective would be to diagnose pregnant women with GCK MODY or identify those
with an existing diagnosis. These mothers would be offered a non-invasive diagnostic test to determine
fetal genotype using cffDNA and a rapid ddPCR assay. Fetal genotype would subsequently be used to
determine the most appropriate obstetric management; no insulin, fetal scanning or high-risk management
in 50% of pregnancies where the fetus has inherited the mutation, and early induction of labour at 38
weeks if the fetus is not affected. This innovation would replace fetal abdominal circumference testing
which can only predict the fetal genotype and is often an inaccurate prediction (Hindmarsh et al., 2002).
Change required
Rapid Sanger sequencing of GCK will be made available to all women in pregnancy with FBG ≥5.5mmol/L
and pre-pregnancy BMI of ≤25 (as recommended by Chakera et al. 2014), and also rapid testing for the
familial GCK mutation for pregnant women with a relative with a diagnosis of GCK MODY. The laboratory
will use a request form enabling clinicians to provide this information and select urgent GCK gene testing
(Appendix 2). This will enable the clinical scientist review stage to be by-passed with GCK MODY testing
activated by specimen reception staff on sample receipt. A highly efficient and automated high throughput
DNA sequencing pipeline will be used to sequence the GCK gene for pathogenic variants, with the result to
be issued by email to the clinician and obstetrics team within 5 days of sample receipt. Information sheets
required to obtain consent from mother for cffDNA testing will accompany positive reports. Once the
patient has consented to prenatal testing, a test pack containing Streck blood collection tubes for cffDNA
from maternal blood plasma, a saliva sample kit for paternal saliva DNA and all the necessary paperwork
will be posted to the patient so that sampling can be performed at home or a primary care setting. The
ddPCR assay primers and probes will be designed and ordered for the specific GCK mutation identified in
the mother, if not previously done so already. SNP genotyping of the parental samples to assess fetal
fraction will be performed by a highly accurate Kompetitive Allele Specific PCR (KASP) assay. Fetal
genotyping will be performed in triplicate by ddPCR based on the method published by De Franco et al.
(2017). Results will be issued to clinicians by email along with guidance for management of pregnancy and
contact details for clinical experts based in Exeter. The proposed pathway for testing is explained in
Appendix 3.
Implementation and impact on department
This innovation fits into the current strategy of genetic testing in the NHS with increasing use of cffDNA
NIPD & NIPT for a range of clinical scenarios (RAPID, 2014). The Exeter Laboratory already performs cffDNA
testing for RHD fetal genotype (Royal Devon & Exeter Hospital, 2017) and a business case is currently being
written for aneuploidy screening. Therefore very few additional resources will be required to implement
this innovation. The Exeter Laboratory routinely performs cffDNA extraction and operates a rapid, highly
automated high-throughput Sanger sequencing pipeline for mutation analysis of the GCK gene. The
laboratory owns all of the necessary hardware and software for performing ddPCR, and already has
protocols in place for using ddPCR for other diagnostic applications. The laboratory is well staffed with
highly skilled and experienced technologists and scientists to validate, implement and run the innovation.

142
Laboratory expertise is backed up with clinical expertise from in situ consultants and diabetes nurses
specialising in GCK MODY who will provide the necessary advice and support to patients receiving test
results.
The ddPCR assay will require validation before implementation as a diagnostic test. There will be additional
reagent costs for setting up new assays for new GCK mutations but this will be covered by the test cost.
Reagent costs will be lower if they have already been designed and procured for the mutation for an
unrelated patient (this will be the case for more frequently occurring GCK gene mutations).
Based on GCK MODY referral data from the Exeter Genetics Laboratory for 2014-2016, and estimated 20
GCK MODY pregnancies would be referred for NIPD testing each year and is within the capacity of the
laboratory to test. This number suits the lower throughput manual ddPCR method rather than a next
generation sequencing approach which would require higher numbers of referrals to be cost effective. The
innovation will be advertised through the laboratory website, the monogenic diabetes training course, the
genetic diabetes nurse network and information sent directly to all users of the service alongside test
reports
Benefits
Financial: The overall cost to the NHS for diagnosing GCK MODY and performing NIPD ranges from £139-
£505 (average) depending on the GCK MODY diagnostic strategy and ddPCR reagent requirements
(Appendix 4). The NIPD test will detect the mutation in 50% of pregnancies and in this scenario the mother
will not require insulin treatment, glucose monitoring, serial fetal growth scans, early induction or
assistance with the delivery. A positive NIPD test will enable a planned early induction and therefore
reduce the number of assisted deliveries or caesarean sections, and complications associated with delivery
of a macrosomic baby.
Quote from Dr Ali Chakera, Consultant Diabetologist, Royal Sussex County Hospital, Brighton
‘The utility of a test showing the fetus has inherited the mutation is being able to discharge the women from
the high-risk antenatal clinic. It would mean fewer ultrasound scans, less glucose and antenatal monitoring,
and allow the women to have a normal pregnancy. The potential costs savings in performing the test would
come from the 50% of cases in which the fetus had inherited the mutation in whom the mother could have
routine care. Once this test is available, I would recommend it to women with GCK MODY.’
An estimated £4,600 would be saved for each pregnancy in which the fetus inherited the GCK Mutation,
and roughly £1600 for pregnancies where the fetus is not affected (Appendix 5). The total yearly cost
savings from NIPD testing of GCK MODY pregnancies would be at least £56,000.
Patient Care: knowing the fetal genotype would enable a much better pregnancy experience with better
outcomes for mother and baby. Appendix 6 includes quotes from four mothers with GCK MODY showing
how important this test would be to them in terms of getting the right management of their pregnancies.
The NIPD test will remove uncertainty and alleviate the mother’s stress and anxiety regarding the baby’s
growth and with trying to lower blood glucose. This is important since maternal stress is associated with
poor short and long term outcomes for the fetus (Kinsella and Monk, 2009). Patients felt that getting the
right diabetes diagnosis (GCK MODY) for themselves and their offspring was very important to misdiagnosis
of type 1 or type 2 diabetes and subsequent mis-management. They wanted their daughters with GCK

143
MODY to benefit from the NIPD test once they reach child bearing age and are planning on having their
own families. These patients highlighted a lack of understanding from clinicians regarding GCK MODY and
pregnancy. Clinicians will be much better informed and will be able to provide the correct management
and reassurance to mothers, and comments from two clinicians in Appendix 6 show they are very positive
about the innovation.
Barriers to Implementation
Not all patients with GCK MODY will be diagnosed during pregnancy since they will not meet criteria for
GDM screening. The WHO recommends universal GTT screening in pregnancy (currently performed in
many other countries outside of the UK) and this may be adopted by the NHS in the future (World Health
Organisation, 2013). HbA1c could be used in the first trimester for GCK MODY screening in pregnancy but
reference ranges for pregnant women with GCK MODY are needed.
Using ddPCR to test cffDNA for maternally inherited mutations will be a new innovation to the laboratory
and is therefore highly dependent on successful validation of the assay. Implementing an assay with 100%
accuracy will be essential since postnatal confirmation of the result will not be performed. The literature
review showed that when accuracy of the ddPCR assay fell below 100% this was due to the quantity of
cffDNA in the maternal plasma sample. It is therefore essential that samples with sufficient cffDNA and a
low proportion of maternal cfDNA are obtained for testing. Streck tubes will be used as they help to
stabilise the cffDNA material for up to 5 days. Fetal fraction analysis will be performed to ensure the cffDNA
sample meets the desired quantity thresholds. However repeat sampling may be required in some cases.
Since cffDNA fraction increases with gestational age, samples will preferably be taken from ≥12 weeks
gestation. Timing of the NIPD will not be critical if performed before 28 weeks’ gestation since this is when
management of GDM pregnancy is tailored towards lowering maternal hyperglycaemia. If the diagnosis of
GCK MODY is made much later than this, it may not be possible to benefit from the clinical utility of the
NIPD test. In twin pregnancies with a positive NIPD result it will not be possible ascertain which fetus is
heterozygous. Paternal DNA is required to identify informative SNPs for determination fetal fraction;
therefore if the father is not available to provide a sample, or if there is uncertainty around paternal
identity, it will not be possible to perform NIPD.

144
Appendix 1: Current pathway for managing pregnancy in women with GCK MODY

145
Appendix 2: Request form for rapid GCK MODY testing for women in pregnancy
Genetic testing for MODY (Maturity-onset Diabetes of the Young)
Please send EDTA blood (minimum 10ml adults; 5ml children; 1ml neonates) or DNA (minimum of 5µg)
Please complete form electronically and send a printed copy with the sample
Patient details SURNAME:
CLINICIAN NAME:
FORENAME:
CLINICIAN TELEPHONE:
D.O.B.: (DD/MM/YYYY)
CLINICIAN E-MAIL ADDRESS:
PATIENT POSTCODE:
REPORT ADDRESS (UK only):
INVOICE ADDRESS:
NHS/CHI NUMBER:
GENDER:
ETHNIC ORIGIN:
GENETIC DIABETES NURSE:
Consent 1. I understand that my sample will be used only for diagnostic and research purposes relevant to myself and others in my
family. Please Tick 2. I also consent for my sample to be used for future research into all forms of genetic diabetes and other beta cell
conditions, whether or not it is of direct clinical benefit to me. Please Tick: Yes No 3. I am also happy to be contacted about research into genetic diabetes and you may contact me directly at:
Name Address Telephone E-mail
Signed by patient/ guardian/advocate: ……………………………………. Date: ……………..………
For more information (and patient information sheets) please see www.diabetesgenes.org/content/genetic-beta-cell-research-bank
Clinical information MODY PROBABILTY CALCULATOR SCORE: %
(www.diabetesgenes.org/content/mody-probability-calculator)
AGE AT DIAGNOSIS:
DIAGNOSED DURING PREGNANCY?
HEIGHT:
BMI at Diagnosis:
FATHER’S BMI:
WEIGHT:
Current BMI:
MOTHER’S BMI:
CURRENTLY PREGNANT? CURRENT GESTATIONAL AGE ESTIMATED DELIVERY DATE FETAL ABDOMINAL CIRCUMFERENCE
CENTILE (IF KNOWN)
INITIAL THERAPY, DOSE AND DURATION:
CURRENT THERAPY, DOSE AND DURATION:
FBG OR OGTT 0 HOUR RESULT:
OGTT 2 HOUR RESULT:
OGTT DATE:
HBA1C:
PREVIOUS FBG OR OGTT 0 HOUR RESULT:
PREVIOUS OGTT 2 HOUR RESULT:
PREVIOUS OGTT DATE:
NORMAL RANGE HBA1C:
GAD ANTIBODY RESULT:
IA-2 ANTIBODY RESULT:
C-PEPTIDE (GIVE UNITS):
NORMAL RANGE C-PEPTIDE:
DATE OF C-PEPTIDE:
C-REACTIVE PROTEIN:
NEONATAL HYPOGLYCAEMIA? IF YES, DETAILS AND DURATION OF TREATMENT:
ACANTHOSIS NIGRICANS?:
PARTIAL LIPODYSTROPHY?:
BIRTH WEIGHT:
GESTATION:
DEAF?:
LIVER ADENOMA?:
Family history Please give age at diagnosis and current treatment (Diet/OHA/Ins) DIABETIC GRANDPARENT(S)?:
FATHER’S FATHER:
FATHER’S MOTHER:
MOTHER’S FATHER:
MOTHER’S MOTHER:
DIABETIC PARENT(S)?:
FATHER:
MOTHER:
DIABETIC SIBLING(S)?:
NUMBER AND AGE AT DIAGNOSIS:
DIABETIC CHILDREN?:
NUMBER AND AGE AT DIAGNOSIS:
OTHER DIABETIC RELATIVES (N.B. A FAMILY TREE SHOWING AGE AT DIAGNOSIS AND CURRENT TREATMENT OF AFFECTED FAMILY MEMBERS WOULD BE VERY HELPFUL):
IF SAMPLES FROM OTHER FAMILY MEMBERS HAVE BEEN SENT PREVIOUSLY PLEASE GIVE DETAILS:
Testing required (please tick box)
GCK sequencing (£350) Urgent GCK sequencing (pregnant patients only) (£350) HNF1A AND HNF4A sequencing (£450) m.3243A>G TEST FOR MIDD (£75) Next generation sequencing 16 gene test for monogenic diabetes; includes all MODY genes, MIDD and partial lipodystrophy (£650)
GAD65, IA-2 & ZnT8 Antibodies (EDTA OR SERUM GEL BLOOD SAMPLE REQUIRED) No additional charge: Type 1 diabetes Genetic Risk Score (£50)
KNOWN MUTATION TEST (FOR FAMILIES WHERE A MUTATION HAS ALREADY BEEN IDENTIFIED) £100
Gene Mutation Name and date of birth of relative with mutation: Relationship to this person

146
Appendix 3: Proposed pathway for managing pregnancy based on implementation of the innovation

147
Appendix 4: Costs for diagnosing GCK MODY and performing NIPD by ddPCR of cffDNA in index
cases and family members
See separate Excel file ‘Appendices 4 & 5 - project costings’ for a detailed breakdown of costings for this
innovation. Cost will vary depending on whether GCK MODY was diagnosed in an index case by screening
for mutations in the GCK gene, or whether testing for a known familial mutation has been performed for an
at risk relative. The primers and probes for ddPCR cost £296 for each specific mutation, and so significant
cost savings will be made if NIPD has previously been performed for the GCK mutation. So the most
expensive test cost will be for index cases where new primers and probes are required (£505), and cheapest
for family members where the primers for the familial mutation have been designed previously (£139). The
majority of cases will require new primers and probes, but as the numbers of tests performed increases it
will be more likely that previously designed reagents will be available and average costs per test will be
lower.
NIPD COSTINGS Index case, new
assay design
Index case,
assay exists
Family member,
new assay design
Family member,
assay exists
Diagnosing GCK MODY in an index
case
£50 £50 N/A N/A
Testing for a known mutation in a
relative
N/A N/A £33 £33
cffDNA sample collection and DNA
extraction per family
£67 £67 £67 £67
performing the 12 SNP KASP assay £15 £15 £15 £15
performing ddPCR using new
primers and probes
£365 N/A £365 N/A
performing ddPCR using previously
designed primers and probes
N/A £16 N/A £16
data analysis and reporting fetal
genotype result
£8 £8 £8 £8
Total £505 £156 £488 £139
All prices include VAT

148
Appendix 5: Estimated cost savings to the NHS from performing NIPD by ddPCR of cffDNA in
index cases and family members
Calculating accurate cost savings to the NHS as a result of identifying an affected fetus is more challenging.
Cost savings have been estimated based on:
not administering insulin
not monitoring maternal glycaemic control
not performing regular fetal growth scans
not providing intensive antenatal and post natal care
reduced likelihood of requiring an assisted delivery or having complications during delivery
Estimated cost savings to the NHS when NIPD identifies a fetus that is heterozygous for a maternally
inherited GCK MODY mutation
*based on British National Formulary data September 2016 - March 2017 (British Medical Association,
2016)
†based on NHS National Tariff data for 2018/2019 (NHS Improvement, 2017)
‡based on data from Langer et al. (2000)
#estimated numbers based on information from Trust midwife
Costs savings on insulin treatment and glucose monitoring are estimated to be £260 per pregnancy. An
additional £680 would be saved from not performing multiple fetal growth scans. Discharge from high-risk
antenatal and postnatal care would save £2288, bringing the total to at least £3200. For those pregnancies
that would have required assisted delivery, a further £1400 would be saved, so potentially £4600 could be
saved per pregnancy where the fetus has inherited the GCK mutation, not including any additional staffing
costs. If a fetus has not inherited the mutation, they will be at risk of macrosomia and the patient is likely
to remain under high-risk care and undergo fetal growth scans until induction at 38 weeks. These patients
will still remain off insulin with no glucose monitoring, and induction will save costs by reducing assisted
delivery/complication rates. So there are potential savings of £1660 when the fetus is not affected with GCK
MODY.
Based on and estimated 20 pregnancies undergoing NIPD each year, 50% will have affected fetuses so
£46,000 would be saved for an average total test cost of £322 x 10 = £3220 bringing the total yearly savings
to ~£43,000. 50% will have unaffected fetuses so £16,600 would be saved for an average total test cost of
£322 x 10 = £3220 bringing the total yearly savings to ~£13,380. So the total yearly cost savings from NIPD
testing of GCK MODY pregnancies would be at least £56,000.
Item Cost per unit of treatment Number of units Total Cost
Insulin treatment (Humulin I)* £19.08 for 1500 units = £0.01272 per unit
8830 units (average 85 units/day for 14
weeks‡) 6 x 1500 units = £114.48
glucose test strips (TRUEresult)* £14.99 for 50 strips = £0.2998 per strip
392 strips (average 4 strips per day over
14 weeks#) 8x50 strips = £119.92
Injection pen (Humapen)* £26.82 per pen 1 pen 26.82
Fetal ultrasound growth scans† £170 per scan 4 scans# 680
intensive antenatal care vs standard care† additional £1694 1 1694
intensive postnatal care vs standard care† additional £594 1 594
Delivery with assistance/caesarean
section/complications† additional £1400 1 1400
Total savings 4629.22

149
Appendix 6: Patient and clinician feedback on innovation proposal
Quote from Stacey, diagnosed with GCK MODY prior to her first pregnancy:
'I think the testing is a brilliant idea and would have given me reassurance throughout my pregnancy.’
It allows people like myself to understand how the condition is going to affect myself and possibly my child
during and after pregnancy.
It also helps us ensure there is no misdiagnosis for the child/children later in life (i.e gestational Diabeties)
If the genetic testing is positive I think it gives us the chance to encourage a healthy, well balanced diet and
educate our children to have a good relationship with food and ensure they understand the impact bad
eating could have on them and ensure the grandparents/schools are also looking at the long term affect.’
Quote from Elissa, diagnosed with GCK MODY as a teenager and prior to her two pregnancies:
I want future mothers with GCK MODY to be able to have a non-invasive test to determine the status of their
unborn children, so their care can be determined easier than just going by the baby's abdominal
circumference, which can be inaccurate in ultrasounds later in pregnancy.
Not knowing if both of my children had GCK MODY meant I had to have multiple ultrasounds and educate 9
different doctors for 2 pregnancies about GCK MODY , the risks, complications, treatment, and protocols for
checking fetus weight in the 3rd trimester. If I would have known at the beginning of both pregnancies if my
babies were positive for the gene, the pregnancies would have been much less stressful regarding
appointments, ultrasounds, and education to so many doctors. All of the doctors I had worked with in the
two pregnancies were new to GCK MODY, so it was a steep learning curve.
Overall, I am happy with how things worked out, but having had 7 ultrasounds in my second pregnancy, and
stressing each time, knowing if the baby was looking big, I may have to consider large amounts of insulin or
inducing early, was difficult.
Quote from Jenna, diagnosed with GCK MODY during her third pregnancy:
"I've had 3 children and was only diagnosed with mody during my third pregnancy. I found this a relief as I
was classed as gestational previously though I did not fit the typical candidate for gestational diabetes and
found it quite upsetting that I was having to take insulin and my babies were very big making pregnancy a
struggle physically. Having the test done provided relief as it made me feel like it was not something I had
brought on myself by diet and it having this gene was out of my control.
I think it will help in the future as I have 2 daughters who may have the same problem when they are older
so if they are aware of the gene they may not have to go through lots of tests as I had previously done. I also
think this will benefit myself as I may have been treated unnecessarily for diabetes later on in life.

150
Quote from Sarah, diagnosed with GCK MODY during her second pregnancy:
After being diagnosed at 10 years old (I am now 30) as a diabetic I have always felt something wasn't right
and I wasn't a "textbook case". I have had 2 pregnancies now being treated as a diabetic and blindly
followed advice from diabetes staff. I was treated with insulin and metformin during pregnancy 1 and was
advised to be induced 2 weeks early. After a failed induction I was made to deliver by c section and gave
birth to a boy weighing exactly 8 pounds. My second recent pregnancy I was treated with insulin and opted
for an elected c section after being told I had to deliver again 2 weeks early. My little girl was born weighing
8 pounds 14.5 oz. As I was treated with insulin first pregnancy the diabetes team decided to start me on
insulin straight away on 10 units. With this I experienced hypos and was very unwell. I had a very difficult
time trying to convince medical staff I was unwell due to the diabetes treatment and not just "pregnant". I
persevered although my insulin was reduced eventually when the consultant found out I had MODY and not
textbook diabetes.
Once he knew this he contacted your team and from then on my life changed. I know that sounds dramatic
but I had had 20 years of battling with different diabetes staff trying to get them to understand. I even had a
hba1c test re- done which came back normal but they still insisted that I was diabetic as I "could not have
the label removed".
I was informed there was a chance if either of my children had the same gene as me and my blood sugar
levels were being forced too low it could have a negative impact on them, something never mentioned when
I "just had diabetes". I was advised on future pregnancies and not to be given an insulin scale during delivery
something I had with my first child and was quite unwell with.
Without this testing I would still be in a confusing world of diabetes not fitting in and being advised against
the wrong treatment. The testing has made me finally understand the condition I have and now I can try to
explain to others and feel more confident on using certain treatments. Without these results I would still be
following blindly and causing harm to myself and potentially my children (or future children).
Quote from Dr Ali Chakera, consultant diabetologist, Royal Sussex County Hospital, Brighton:
‘I see cffDNA useful as a very useful test in women with GCK MODY.
In GCK MODY, the utility of a test showing the fetus has inherited the mutation, would result in being to
discharge the women from the high-risk antenatal clinic. It would mean fewer ultrasound scans, less glucose
and antenatal monitoring, and allow the women to have a normal pregnancy. The potential costs savings in
performing the test would come from the 50% of cases in which the fetus had inherited the mutation in
whom the mother could have routine care.
Once this test is available, I would recommend it to women with MODY. I would ensure robust discussion
about the pros and cons of testing.’

151
Quote from Dr Tracey Kay, Obstetrician & Gynaecologist, Royal Devon & Exeter Hospital:
‘The possibility of cell free fetal DNA is an exciting development which will aid the management of
pregnancies in those with monogenic diabetes. Prior to the development of this test management of these
pregnancies has been guided by fetal ultrasound as a surrogate marker of genotype based on estimates of
fetal growth.
I would definitely recommend cffDNA testing in monogenic diabetes pregnancy as this can directly aid
management. Knowing fetal genotype during pregnancy can provide clinicians and patients with the
confidence in treatment decisions and timing of delivery tailored to that specific pregnancy.
I would like to see this test offered in routine clinical practice for those with monogenic diabetes where
genotype can alter birthweight and hence pregnancy management -it removes uncertainty from pregnancy
management and allows individualised, tailored treatment. Patients too have been hugely positive about
the possibility of identifying fetal genotype in order to aid management of pregnancy.’
References
Bacon, S., Schmid, J., McCarthy, A., Edwards, J., Fleming, A., Kinsley, B., Firth, R., Byrne, B., Gavin, C. &
Byrne, M. M. (2015) The clinical management of hyperglycemia in pregnancy complicated by maturity-onset
diabetes of the young. Am J Obstet Gynecol, 213(2), 236 e1-7.
British Medical Association. (2016) British National Formulary September 2016 – March 2017. 72nd
edn.
London: BMJ Group & Pharmaceutical Press.
Chakera, A. J., Carleton, V. L., Ellard, S., Wong, J., Yue, D. K., Pinner, J., Hattersley, A. T. & Ross, G. P. (2012)
Antenatal diagnosis of fetal genotype determines if maternal hyperglycemia due to a glucokinase mutation
requires treatment. Diabetes Care, 35(9), 1832-4.
Chakera, A. J., Spyer, G., Vincent, N., Ellard, S., Hattersley, A. T. & Dunne, F. P. (2014) The 0.1% of the
population with glucokinase monogenic diabetes can be recognized by clinical characteristics in pregnancy:
the Atlantic Diabetes in Pregnancy cohort. Diabetes Care, 37(5), 1230-6.
De Franco, E., Caswell, R., Houghton, J. A., Iotova, V., Hattersley, A. T. & Ellard, S. (2017) Analysis of cell-free
fetal DNA for non-invasive prenatal diagnosis in a family with neonatal diabetes. Diabet Med, 34(4), 582-
585.
Hattersley, A. T., Beards, F., Ballantyne, E., Appleton, M., Harvey, R. & Ellard, S. (1998) Mutations in the
glucokinase gene of the fetus result in reduced birth weight. Nat Genet, 19(3), 268-70.
Hindmarsh, P. C., Geary, M. P., Rodeck, C. H., Kingdom, J. C. & Cole, T. J. (2002) Intrauterine growth and its
relationship to size and shape at birth. Pediatr Res, 52(2), 263-8.
Hoopmann, M., Abele, H., Wagner, N., Wallwiener, D. & Kagan, K. O. (2010) Performance of 36 different
weight estimation formulae in fetuses with macrosomia. Fetal Diagn Ther, 27(4), 204-13.
Kinsella, M. T. & Monk, C. (2009) Impact of maternal stress, depression and anxiety on fetal
neurobehavioral development. Clin Obstet Gynecol, 52(3), 425-40.
152
Kurmanavicius, J., Burkhardt, T., Wisser, J. & Huch, R. (2004) Ultrasonographic fetal weight estimation:
accuracy of formulas and accuracy of examiners by birth weight from 500 to 5000 g. J Perinat Med, 32(2),
155-61.
RAPID. (2014) NIPD for single gene disorders; A guide for patients and healthcare professionals. Available at:
http://www.rapid.nhs.uk/guides-to-nipd-nipt/nipd-for-single-gene-disorders/ (Accessed 22 June 2017)
Royal Devon & Exeter Hospital. (2017) Non-invasive cell free fetal rhesus D (RHD) Genotyping. Available at:
http://www.exeterlaboratory.com/genetics/non-invasive-cell-free-fetal-rhesus-d-rhd-genotyping/
(Accessed 22 June 2017)
Spyer, G., Hattersley, A. T., Sykes, J. E., Sturley, R. H. & MacLeod, K. M. (2001) Influence of maternal and
fetal glucokinase mutations in gestational diabetes. Am J Obstet Gynecol, 185(1), 240-1.
Spyer, G., Macleod, K. M., Shepherd, M., Ellard, S. & Hattersley, A. T. (2009) Pregnancy outcome in patients
with raised blood glucose due to a heterozygous glucokinase gene mutation. Diabet Med, 26(1), 14-8.
Steele, A. M., Shields, B. M., Wensley, K. J., Colclough, K., Ellard, S. & Hattersley, A. T. (2014) Prevalence of
vascular complications among patients with glucokinase mutations and prolonged, mild hyperglycemia.
JAMA, 311(3), 279-86.
Stride, A., Shields, B., Gill-Carey, O., Chakera, A. J., Colclough, K., Ellard, S. & Hattersley, A. T. (2013) Cross-
sectional and longitudinal studies suggest pharmacological treatment used in patients with glucokinase
mutations does not alter glycaemia. Diabetologia.
Tartaglia, E., Iafusco, D., Giuliano, P., Giugliano, B., Sena, T., Perrotta, A. & Mastrantonio, P. (2013)
Comment on: Chakera et al. Antenatal diagnosis of fetal genotype determines if maternal hyperglycemia
due to a glucokinase mutation requires treatment. Diabetes Care 2012;35:1832-1834. Diabetes Care, 36(1),
e14.
Velho, G., Blanche, H., Vaxillaire, M., Bellanne-Chantelot, C., Pardini, V. C., Timsit, J., Passa, P., Deschamps,
I., Robert, J. J., Weber, I. T., Marotta, D., Pilkis, S. J., Lipkind, G. M., Bell, G. I. & Froguel, P. (1997)
Identification of 14 new glucokinase mutations and description of the clinical profile of 42 MODY-2 families.
Diabetologia, 40(2), 217-24.
World Health Organisation. (2013) Diagnostic Criteria and Classification of Hyperglycaemia First Detected in
Pregnancy. Available at:
http://apps.who.int/iris/bitstream/10665/85975/1/WHO_NMH_MND_13.2_eng.pdf (Accessed 22 June
2017)

153
Appendix 4: Confirmation of successful completion of the C1 innovation project

154
Appendix 5: Letter confirming successful completion of The Royal College of Pathologists FRCPath part 1 examination

155
Appendix 6: Letter confirming successful completion of The Royal College of Pathologists FRCPath part 2 examination