Hepatic stellate cell/myofibroblast subpopulations in fibrotic human and rat livers

The Anti-Fibrotic Effect of Mycophenolic Acid–InducedNeutral Endopeptidase
Maria Pia Dell’Oglio,* Gianluigi Zaza,* Michele Rossini,* Chiara Divella,* Paola Pontrelli,†
Raffaella Verrienti,* Monica Rutigliano,‡ Pasquale Ditonno,‡ Patrizia Stifanelli,§
Nicola Ancona,§ Francesco Paolo Schena,* and Giuseppe Grandaliano*
*Renal, Dialysis and Transplantation Unit, Department of Emergency and Organ Transplantation, University of Bari, Bari,Italy; †Nephrology Unit, Department of Biomedical Sciences, University of Foggia, Foggia, Italy; ‡Urology, Andrology andTransplantation Unit, Department of Emergency and Organ Transplantation, University of Bari, Bari, Italy; and §Istitutostudi sui sistemi intelligenti per l’automazione (ISSIA), Consiglio Nazionale delle Ricerche (CNR), Bari, Italy
ABSTRACTMycophenolic acid (MPA) appears to have anti-fibrotic effects, but the molecular mechanisms underlyingthis are unknown. We prospectively studied 35 stable kidney transplant recipients maintained oncyclosporine and azathioprine. We converted 20 patients from azathioprine to enteric-coated mycophe-nolate sodium (EC-MPS) and continued the remaining 15 patients on azathioprine. Exploratory mRNAexpression profiling, performed on five randomly selected EC-MPS patients, revealed significant up-regulation of neutral endopeptidase (NEP), which is an enzyme that degrades angiotensin II. Weconfirmed these microarray data by measuring levels of NEP expression in all subjects; in addition, wefound that NEP gene expression correlated inversely with proteinuria. In an additional 33 patients,glomerular and tubular NEP protein levels from renal graft biopsies were significantly higher among the13 patients receiving cyclosporine � EC-MPS than among the 12 patients receiving cyclosporine �
azathioprine or 8 patients receiving cyclosporine alone. Glomerular NEP expression inversely correlatedwith glomerulosclerosis and proteinuria, and tubular NEP expression inversely correlated with interstitialfibrosis. Incubation of human proximal tubular cells with MPA increased NEP gene expression in a dose-and time-dependent manner. Moreover, MPA reduced angiotensin II–induced expression of the profi-brotic factor plasminogen activator inhibitor-1, and a specific NEP inhibitor completely reversed thiseffect. Taken together, our data suggest that MPA directly induces expression of neutral endopeptidase,which may reduce proteinuria and slow the progression of renal damage in kidney transplant recipients.
J Am Soc Nephrol 21: 2157–2168, 2010. doi: 10.1681/ASN.2010020181
Over the last decade, the continuous progress inthe development of immunosuppressive agentshas enhanced both the efficacy and safety of anti-rejection regimens after renal transplantation,leading to a dramatic reduction in the incidenceof acute rejection.1 This significant improvementin short-term graft outcome was not followed bya similar advance in preventing graft loss causedby chronic graft injury.2,3 The addition of myco-phenolic acid (MPA) into contemporary immu-nosuppressive regimens represented an impor-tant step forward in the development of newtherapeutic protocols in kidney transplantation.
MPA exerts its immunosuppressive effect by in-hibiting the inosine 5� monophosphate dehydro-
Received February 15, 2010. Accepted July 6, 2010.
Published online ahead of print. Publication date available atwww.jasn.org.
M.P.D.’O. and G.Z. contributed equally to this work.
Correspondence: Dr. Gianluigi Zaza, Nephrology, Dialysis andTransplantation Unit, Department of Emergency and OrganTransplantation, University of Bari, Piazza Giulio Cesare 11, 70124Bari, Italy. Phone: 39-080-5478868; Fax: 39-080-5575710; E-mail:[email protected]
Copyright © 2010 by the American Society of Nephrology
CLINICAL RESEARCH www.jasn.org
J Am Soc Nephrol 21: 2157–2168, 2010 ISSN : 1046-6673/2112-2157 2157

genase, a key enzyme involved in the first step of de novosynthetic pathway of guanine nucleotides.4 – 6 Inosine 5�monophosphate dehydrogenase inhibition has a potent cy-tostatic effect on both T and B lymphocytes, because thesecells are critically dependent for their proliferation on denovo purine synthesis, differently from other cell types thatcan use salvage pathways.4 In addition, MPA suppresses gly-cosylation of adhesion molecules, limiting recruitment oflymphocytes and monocytes, and depletes tetrahydrobiop-terin, reducing inducible nitric oxide synthase activity, ni-tric oxide production, and peroxynitrite-induced tissuedamage.7
Two MPA formulations, mycophenolate mofetil and enteric-coated mycophenolate sodium (EC-MPS), have been extensivelyintroduced in association with standard or low-dose calcineurininhibitors (CNIs) and corticosteroids. They have largely replacedthe purine antagonist azathioprine (AZA) in post-transplant im-munosuppressive therapy.4,8,9 The use of MPA, instead of AZA,has significantly reduced the incidence of biopsy-proven acuterejection in the early post-transplant period10 and has signifi-cantly improved long-term patient and graft survival.11,12 Inaddition, the introduction of MPA along with CNI minimiza-tion/withdrawal has been successfully applied to patients withchronic allograft dysfunction and CNI toxicity, resulting in along-term stabilization of their renal function.13–16
Several in vivo studies reported that MPA significantly re-duces mesangial matrix deposition, interstitial fibrosis, myofi-broblast infiltration, and glomerular sclerosis in patients withchronic graft rejection, CNI nephrotoxicity, and glomerulone-phritides.17–20 Even in different models of non–immune-me-
diated renal diseases, including unilateral ureteric obstructionand the 5/6-remnant kidney, MPA was shown to reduce glo-merular sclerosis and interstitial fibrosis.21,22 These results sug-gest that MPA may exert an anti-fibrotic action, although the molec-ular mechanisms underlying this effect are still largely unknown.Thus, theaimofthisstudywastoinvestigatesuchmechanisms,usingan exploratory high-throughput genomic approach.
RESULTS
Genomic Profile of Peripheral Blood MononuclearCells after Conversion from AZA to EC-MPSThe first step of the study was to perform an exploratory/hypothesis-generating analysis, using the microarray tech-nology, in five randomly selected patients included in thetraining group. Statistical analysis showed that 16 geneswere significantly modulated after 3 months of treatmentwith MPA. Among these genes, 6 were up-regulated and 10were down-regulated 3 months after conversion (T1) com-pared with baseline (T0) (Table 1). Principal componentanalysis, using the 16 genes, clearly showed the degree ofgenomic change after conversion from AZA to EC-MPStreatment (Figure 1A).
Neutral endopeptidase (NEP) was among the most sig-nificantly up-regulated genes. This result was confirmedmeasuring NEP expression by real-time PCR in the patientsconverted to EC-MPS (excluding those selected for the mi-croarray study; Figure 1B). No difference between T0 andT1 in NEP expression was found in those patients continu-ing AZA treatment (Figure 1B).
Table 1. Top-ranked genes selected by microarray analysis
Probe Set IDGene
SymbolDescription Pa Pb Fold Change
(Mean)
Up-regulated genes203434_s_at NEP Neutral endopeptidase 0.019828 0.055556 2.093582207635_s_at KCNH1 Potassium voltage-gated channel, subfamily H, member 1 0.000169 0.007937 1.104329214270_s_at MAPRE3 Microtubule-associated protein, RP/EB family, member 3 0.007637 0.007937 1.742978214769_at CLCN4 Chloride channel 4 0.0077 0.015873 0.959988215321_at RUNDC3B RUN domain containing 3B 0.004495 0.007937 1.655881216084_at C9orf144 Chromosome 9 open reading frame 144 0.021957 0.031746 1.365299
Down-regulated genes202834_at AGT Angiotensinogen (serpin peptidase inhibitor, clade
A, member 8)0.066736 0.095238 �0.921237
206742_at FIGF c-fos–induced growth factor (vascular endothelialgrowth factor D)
0.000211 0.007937 �1.581433
207242_s_at GRIK1 Glutamate receptor, ionotropic, kainate 1 0.015235 0.031746 �1.14453207703_at NLGN4Y Neuroligin 4, Y-linked 0.037843 0.055556 �1.286112210882_s_at TRO Trophinin 0.000906 0.007937 �1.79879211508_s_at GH2 Growth hormone 2 0.005822 0.007937 �1.589795214921_at KCNMA1 Potassium large conductance calcium-activated
channel, subfamily M, � member 10.00323 0.007937 �1.183671
215296_at CDC42BPA CDC42 binding protein kinase alpha (DMPK-like) 0.001468 0.007937 �1.377831215882_at CEP152 Centrosomal protein 152 kDa 0.000066 0.007937 �1.368304220337_at NGB Neuroglobin 0.003443 0.007937 �1.04112
P values were calculated by at test and bWilcoxon test.
CLINICAL RESEARCH www.jasn.org
2158 Journal of the American Society of Nephrology J Am Soc Nephrol 21: 2157–2168, 2010

Correlation between NEP Expression, Proteinuria, andSerum Creatinine Levels in the Training GroupInterestingly, NEP gene expression levels, measured in PBMCsfrom all patients (n � 35) in the training group, were signifi-cantly and inversely correlated with daily proteinuria at both
T0 (R2 � 0.21, P � 0.005) and T1 (R2 �0.12, P � 0.042; (Figure 2, A and B, respec-tively). No significant correlations were ob-served between NEP expression and serumcreatinine levels at both time points (Figure2, C and D).
Graft Expression for NEP in theIndependent Test GroupBecause NEP is known to be expressed atthe renal level, we investigated whetherintragraft NEP protein levels were influ-enced by long-term MPA treatment. Glo-merular NEP protein expression, local-ized at the podocyte level, wassignificantly higher in the cyclosporine(CsA) � EC-MPS group compared withCsA � AZA (P � 0.02) and CsA-only pa-tients (P � 0.03). No statistically signifi-cant difference was observed betweenCsA � EC-MPS patients and deceaseddonors (P � 0.4), as well as in the com-parison between CsA � AZA and CsA-
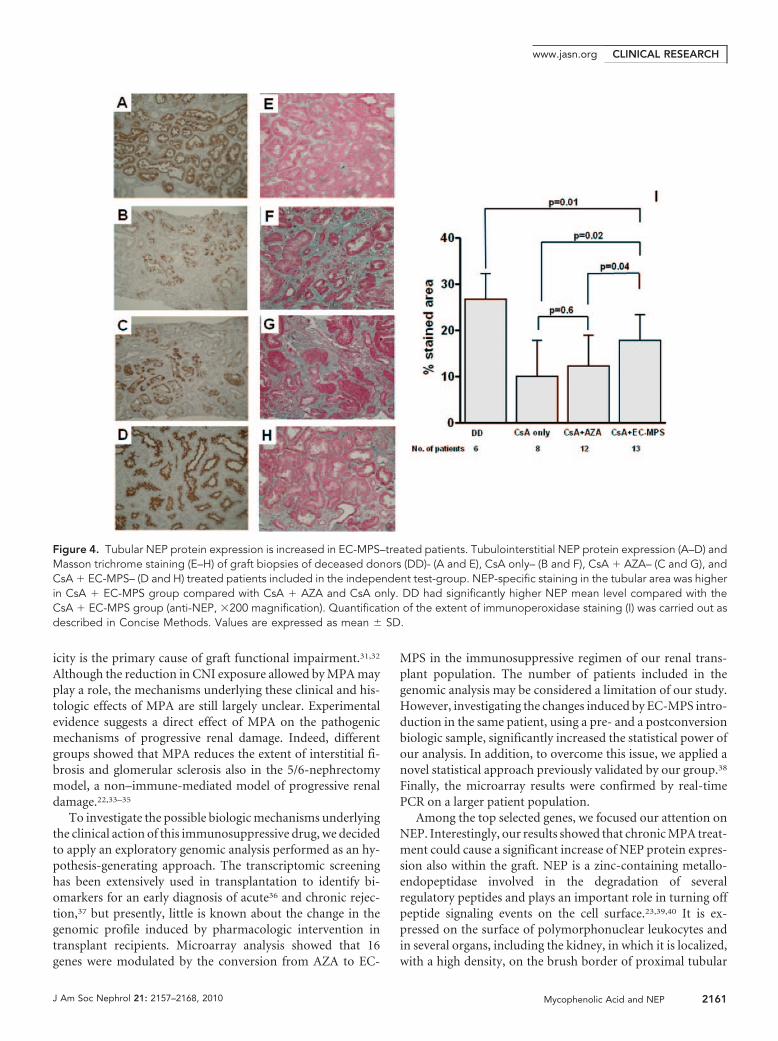
only groups (P � 0.9; Figure 3). Tubular NEP protein ex-pression, mainly localized at the brush border level, wassignificantly higher in the CsA � EC-MPS group comparedwith the other two groups of patients. Deceased donor renal
Figure 1. Conversion from azathioprine to EC-MPS modifies PBMC transcriptomic profileand induces NEP gene expression. Principal components analysis (PCA) (A) and NEP geneexpression by real-time PCR in PBMCs (B). (A) PCA plot using the 16 selected gene probesets discriminates T0 versus T1 samples. (B) The histogram represents the mean � SEM ofNEP expression level, determined by real-time PCR, in PBMCs from 15 patients continuingon AZA treatment and 15 patients converted to EC-MPS treatment at T0 versus T1.
Figure 2. PBMC NEP gene expression correlates with proteinuria but not with graft function. Plots represent the correlations betweenNEP gene expression, proteinuria (A and B), and serum creatinine levels (C and D) in 35 patients included in the training group at thetime of enrollment (T0) and after 3 months of treatment (T1). Gray symbols are for CsA � AZA–treated patients; black symbols representpatients treated with CsA � EC-MPS.
CLINICAL RESEARCHwww.jasn.org
J Am Soc Nephrol 21: 2157–2168, 2010 Mycophenolic Acid and NEP 2159

biopsies presented higher tubular NEP protein levels com-pared with the CsA � EC-MPS group (P � 0.01; Figure 4).
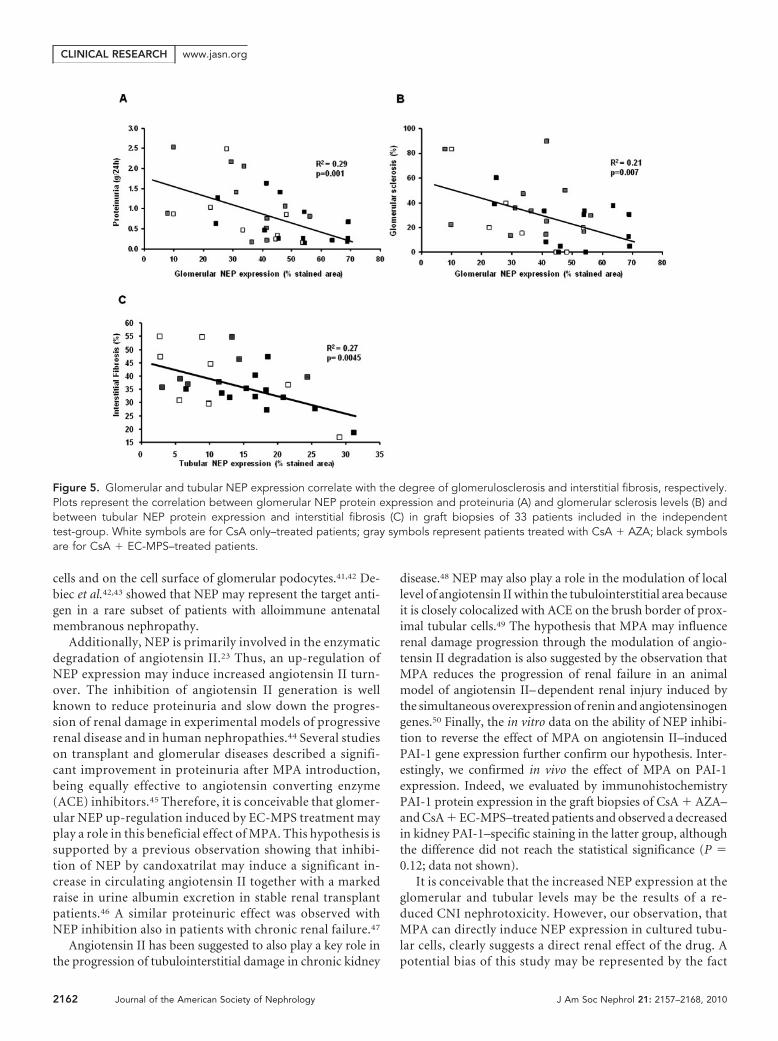
Correlation between NEP Expression and Clinical andHistologic Features in the Independent Test GroupGlomerular NEP protein levels measured in the indepen-dent test group (33 patients) were significantly and in-versely correlated with daily proteinuria evaluated at thetime of graft biopsy (R2 � 0.29, P � 0.001; Figure 5A) andwith the degree of glomerular sclerosis (R2 � 0.21, P �0.007; Figure 5B). The area of specific tubular staining wasinversely correlated with the extent of interstitial fibrosis(R2 � 0.27, P � 0.0045) quantified in graft biopsies of theindependent test group (Figure 5C).
Concordance between PBMCs and Renal NEPExpressionWe next evaluated NEP gene expression in PBMCs harvested atthe time of graft biopsies along with NEP protein expressionwithin the graft in an independent validation group (10 patients).Interestingly, NEP gene expression measured in PBMCs was sig-nificantly correlated with both glomerular (R2 � 0.21, P � 0.004)and tubular (R2 � 0.86, P � 0.001) NEP protein level.
Effect of MPA on NEP mRNA Expression in StimulatedCultured Human Proximal Tubular Cells (HK2)To clarify whether NEP up-regulation observed in PBMCs andglomerular and renal tubular cells in vivo was caused by a directeffect of MPA, we evaluated the influence of this drug on NEPgene expression in HK2, an immortalized line of human prox-imal tubular cells. MPA induced a dose- (Figure 6A) and time-
dependent increase of NEP gene expression (Figure 6B),whereas CsA incubation did not influence its mRNA abun-dance (data not shown).
Effect of MPA and NEP Inhibition on AngiotensinII–Induced Plasminogen Activator Inhibitor-1 GeneExpression in HK2Because NEP is an angiotensin II– degrading enzyme,23 in anattempt to define the molecular link between NEP overexpres-sion and reduced interstitial fibrosis observed in MPA-treatedpatients, we investigated in vitro the effects of MPA on angio-tensin II–induced expression of plasminogen activator inhibi-tor-1 (PAI-1), a powerful profibrotic mediator. As previouslyshown,24 angiotensin II induced a marked increase of PAI-1mRNA abundance (P � 0.003). MPA preincubation signifi-cantly reduced angiotensin II–induced PAI-1 gene expression(P � 0.007). Phosphoramidon, a potent NEP inhibitor, at aconcentration of 5 (P � 0.005) and 10 �M (P � 0.006), com-pletely reversed this MPA effect (Figure 6C).
DISCUSSION
Despite the introduction of several new immunosuppressivedrugs and treatment strategies, chronic allograft damage remainsthe main obstacle to successful long-term graft outcome.25 In vitroand in vivo studies indicate that MPA may have a positive effect inpreventing progressive glomerular and tubulointerstitial changes,leading to chronic graft damage.10,20,26 –30 The introduction ofMPA along with CNI withdrawal or dose reduction improvesrenal transplant dysfunction, especially when CNI nephrotox-
Figure 3. Glomerular NEP protein expression is increased in EC-MPS–treated patients. NEP protein expression at the glomerular levelin renal graft biopsy of deceased donors (DD)- (A), CsA only– (B), CsA � AZA– (C), and CsA � EC-MPS– (D) treated patients includedin the independent test group. NEP-specific staining in the glomerular area was higher in the CsA � EC-MPS group compared with theothers. No statistical difference was found in the comparison between DD- and CsA � EC-MPS– and between CsA � AZA– and CsAonly–treated patients. Quantification of the extent of immunoperoxidase staining was carried out as described in Concise Methods (E).Values are expressed as mean � SD (anti-NEP, �400 magnification).
CLINICAL RESEARCH www.jasn.org
2160 Journal of the American Society of Nephrology J Am Soc Nephrol 21: 2157–2168, 2010
icity is the primary cause of graft functional impairment.31,32
Although the reduction in CNI exposure allowed by MPA mayplay a role, the mechanisms underlying these clinical and his-tologic effects of MPA are still largely unclear. Experimentalevidence suggests a direct effect of MPA on the pathogenicmechanisms of progressive renal damage. Indeed, differentgroups showed that MPA reduces the extent of interstitial fi-brosis and glomerular sclerosis also in the 5/6-nephrectomymodel, a non–immune-mediated model of progressive renaldamage.22,33–35
To investigate the possible biologic mechanisms underlyingthe clinical action of this immunosuppressive drug, we decidedto apply an exploratory genomic analysis performed as an hy-pothesis-generating approach. The transcriptomic screeninghas been extensively used in transplantation to identify bi-omarkers for an early diagnosis of acute36 and chronic rejec-tion,37 but presently, little is known about the change in thegenomic profile induced by pharmacologic intervention intransplant recipients. Microarray analysis showed that 16genes were modulated by the conversion from AZA to EC-
MPS in the immunosuppressive regimen of our renal trans-plant population. The number of patients included in thegenomic analysis may be considered a limitation of our study.However, investigating the changes induced by EC-MPS intro-duction in the same patient, using a pre- and a postconversionbiologic sample, significantly increased the statistical power ofour analysis. In addition, to overcome this issue, we applied anovel statistical approach previously validated by our group.38
Finally, the microarray results were confirmed by real-timePCR on a larger patient population.
Among the top selected genes, we focused our attention onNEP. Interestingly, our results showed that chronic MPA treat-ment could cause a significant increase of NEP protein expres-sion also within the graft. NEP is a zinc-containing metallo-endopeptidase involved in the degradation of severalregulatory peptides and plays an important role in turning offpeptide signaling events on the cell surface.23,39,40 It is ex-pressed on the surface of polymorphonuclear leukocytes andin several organs, including the kidney, in which it is localized,with a high density, on the brush border of proximal tubular
Figure 4. Tubular NEP protein expression is increased in EC-MPS–treated patients. Tubulointerstitial NEP protein expression (A–D) andMasson trichrome staining (E–H) of graft biopsies of deceased donors (DD)- (A and E), CsA only– (B and F), CsA � AZA– (C and G), andCsA � EC-MPS– (D and H) treated patients included in the independent test-group. NEP-specific staining in the tubular area was higherin CsA � EC-MPS group compared with CsA � AZA and CsA only. DD had significantly higher NEP mean level compared with theCsA � EC-MPS group (anti-NEP, �200 magnification). Quantification of the extent of immunoperoxidase staining (I) was carried out asdescribed in Concise Methods. Values are expressed as mean � SD.
CLINICAL RESEARCHwww.jasn.org
J Am Soc Nephrol 21: 2157–2168, 2010 Mycophenolic Acid and NEP 2161
cells and on the cell surface of glomerular podocytes.41,42 De-biec et al.42,43 showed that NEP may represent the target anti-gen in a rare subset of patients with alloimmune antenatalmembranous nephropathy.
Additionally, NEP is primarily involved in the enzymaticdegradation of angiotensin II.23 Thus, an up-regulation ofNEP expression may induce increased angiotensin II turn-over. The inhibition of angiotensin II generation is wellknown to reduce proteinuria and slow down the progres-sion of renal damage in experimental models of progressiverenal disease and in human nephropathies.44 Several studieson transplant and glomerular diseases described a signifi-cant improvement in proteinuria after MPA introduction,being equally effective to angiotensin converting enzyme(ACE) inhibitors.45 Therefore, it is conceivable that glomer-ular NEP up-regulation induced by EC-MPS treatment mayplay a role in this beneficial effect of MPA. This hypothesis issupported by a previous observation showing that inhibi-tion of NEP by candoxatrilat may induce a significant in-crease in circulating angiotensin II together with a markedraise in urine albumin excretion in stable renal transplantpatients.46 A similar proteinuric effect was observed withNEP inhibition also in patients with chronic renal failure.47
Angiotensin II has been suggested to also play a key role inthe progression of tubulointerstitial damage in chronic kidney
disease.48 NEP may also play a role in the modulation of locallevel of angiotensin II within the tubulointerstitial area becauseit is closely colocalized with ACE on the brush border of prox-imal tubular cells.49 The hypothesis that MPA may influencerenal damage progression through the modulation of angio-tensin II degradation is also suggested by the observation thatMPA reduces the progression of renal failure in an animalmodel of angiotensin II– dependent renal injury induced bythe simultaneous overexpression of renin and angiotensinogengenes.50 Finally, the in vitro data on the ability of NEP inhibi-tion to reverse the effect of MPA on angiotensin II–inducedPAI-1 gene expression further confirm our hypothesis. Inter-estingly, we confirmed in vivo the effect of MPA on PAI-1expression. Indeed, we evaluated by immunohistochemistryPAI-1 protein expression in the graft biopsies of CsA � AZA–and CsA � EC-MPS–treated patients and observed a decreasedin kidney PAI-1–specific staining in the latter group, althoughthe difference did not reach the statistical significance (P �0.12; data not shown).
It is conceivable that the increased NEP expression at theglomerular and tubular levels may be the results of a re-duced CNI nephrotoxicity. However, our observation, thatMPA can directly induce NEP expression in cultured tubu-lar cells, clearly suggests a direct renal effect of the drug. Apotential bias of this study may be represented by the fact
Figure 5. Glomerular and tubular NEP expression correlate with the degree of glomerulosclerosis and interstitial fibrosis, respectively.Plots represent the correlation between glomerular NEP protein expression and proteinuria (A) and glomerular sclerosis levels (B) andbetween tubular NEP protein expression and interstitial fibrosis (C) in graft biopsies of 33 patients included in the independenttest-group. White symbols are for CsA only–treated patients; gray symbols represent patients treated with CsA � AZA; black symbolsare for CsA � EC-MPS–treated patients.
CLINICAL RESEARCH www.jasn.org
2162 Journal of the American Society of Nephrology J Am Soc Nephrol 21: 2157–2168, 2010

that analyses were carried out in different sets of patients.Nevertheless, we believe that our study design, confirmingthe observation in independent groups of patients (training,test, and validation group), addresses this potential bias andfurther validates the consistency of our observation. Al-though our data suggest that NEP overexpression mightcorrelate with better clinical outcomes, this effect may notbe always beneficial. In fact, clinical evidence suggests thatsimultaneous NEP and ACE inhibition, increasing natri-uretic and vasodilatory peptides, is extremely effectivein reducing BP. In addition, this double treatment has beenalso shown to slow down the progression of vasculardamage.51
Taken together, our findings contrib-ute to better understand the molecularmechanisms of MPA in solid organ trans-plantation and also underlie the promis-ing use of this drug in the treatment of avariety of proteinuric glomerulonephrit-ides.
CONCISE METHODS
Patients and TreatmentA total of 68 stable renal transplant recipients,
after signing an informed consent form, were
included in this study and divided into a train-
ing-group (n � 35) and an independent test
group (n � 33). A third independent group
(n � 12) was used only for biologic validation.
Patients with biopsy-proven acute rejection
in the last 6 months before the study or active
infections, gastrointestinal disorders, or malig-
nancies at the time of enrollment (T0) were ex-
cluded from the study.
Training Group.This population was used for the microarray and
gene expression studies on PBMCs. Thirty-five pa-
tients included in this group were, at T0, on stan-
dard maintenance immunosuppression with CsA
(mean � SD of daily dose: 160.5 � 36.44 mg, Ne-
oral; Novartis, Basel, Switzerland), prednisone (5
mg daily), and AZA (50 mg daily). Twenty patients
with hyperuricemia were converted, at T0, from
AZA to EC-MPS (720 mg twice daily, Myfortic;
Novartis) because of their need to start allopurinol
therapy to avoid clinical complications (e.g., gout).
This strategy was planed to prevent the develop-
ment of allopurinol adverse events (e.g., leukope-
nia) because of the inhibition of the purine cata-
bolic enzyme xanthine oxidase. However, to avoid
confounding factors, allopurinol treatment did
not start until the end of our study (3 months).
The remaining 15 patients continued AZA treatment. The main baseline
clinical and demographic characteristics of the two groups are summa-
rized in Table 2. Follow-up time was 3 months (T1). We did not observe
any significant difference in the main clinical and laboratory parameters
between T0 and T1 in both AZA and EC-MPS treatments (Table 2). For
the microarray analysis, we randomly selected five patients converted
from AZA to EC-MPS treatment. The main clinical and laboratory find-
ings were not statistically different between these five patients and the
whole group of patients converted to EC-MPS (data not shown).
Independent Test Group.This group was used for the gene expression study on the graft.
Among the patients included in this group, 8 were treated with CsA
Figure 6. MPA induces NEP expression in cultured HK2 cells and NEP activity isnecessary for MPA-induced inhibition of angiotensin II-stimulated PAI-1 gene expres-sion. Dose response (A) and time course (B) of MPA effect on NEP gene expression inHK2 cells. (A) Confluent, quiescent HK2 cells were treated with various concentrationsof MPA (1, 5, 10, and 25 �g/ml) for 3 hours, as indicated, and harvested. (B) Confluent,quiescent HK2 cells were incubated with MPA (10 �g/ml), harvested after 0, 3, 6, 12,and 24 hours and total RNA was extracted as described in Concise Methods. Thehistogram represents the means � SEM of NEP expression level, evaluated by real-time PCR. The figure is representative of three independent experiments. (C) Effect ofMPA and NEP inhibition on angiotensin II–induced PAI-1 gene expression in HK2 cells.Confluent, quiescent HK2 cells were preincubated for 24 hours with MPA (10 �g/ml)and then angiotensin II (20 nM) was added for 6 hours with or without increasingconcentration of phosphoramidon (Ph, 2 to 10 �M) for 6 hours. Total RNA wasextracted as described in Concise Methods, and the histogram represents themeans � SEM of PAI-1 expression level, evaluated by real-time PCR. The figure isrepresentative of three independent experiments.
CLINICAL RESEARCHwww.jasn.org
J Am Soc Nephrol 21: 2157–2168, 2010 Mycophenolic Acid and NEP 2163

Tab
le2
.C
linic
alan
dla
bor
ator
yfin
din
gs
ofth
etr
aini
ngg
roup
atth
etw
od
iffer
ent
tim
ep
oint
sof
the
ind
epen
den
tte
stg
roup
and
the
ind
epen
den
tva
lidat
ion
gro
upTr
aini
ngG
roup
Ind
epen
den
tTe
stG
roup
Ind
epen
den
tV
alid
atio
nG
roup
Pa
AZ
ATr
eatm
ent
EC
-MP
STr
eatm
ent
Enr
ollm
ent
Aft
er3
mo
nths
PE
nro
llmen
tA
fter
3m
ont
hsP
DD
CsA
�E
C-
MP
SC
sA�
AZ
AC
sAo
nly
P
Num
ber
(pat
ient
s)15
//
20/
/6
1312
810
Reci
pie
ntag
e(y
ears
)49
.0�
11.1
//
50.1
�9.
3/
/49
.8�
10.8
51.7
�10
.146
.7�
10.4
48.7
�6.
8N
S50
.9�
9.1
NS
Reci
pie
ntg
end
er(M
/F)
9/6
//
8/12
//
4/2
8/5
7/5
1/7
NS
9/1
NS
Tim
eaf
ter
tran
spla
ntat
ion
(yea
rs)
2.8
�0.
7/
/3.
0�
0.7
//
/3.
5�
1.2
4.0
�1.
43.
4�
1.4
NS
5.9
�4.
00.
01
Seru
mcr
eatin
ine
(mg
/dl)
1.31
�0.
231.
30�
0.20
NS
1.30
�0.
291.
29�
0.30
NS
1.47
�0.
101.
79�
0.43
2.10
�0.
402.
39�
1.02
NS
2.18
�1.
580.
02U
ricac
id(m
g/d
l)5.
9�
1.0
5.8
�1.
1N
S8.
7�
1.2
8.9
�1.
8N
S4.
8�
0.9
6.1
�1.
45.
6�
1.2
5.8
�1.
7N
S6.
4�
1.3
0.03
Prot
einu
ria(g
/24
h)0.
16�
0.08
0.19
�0.
13N
S0.
22�
0.11
0.16
�0.
07N
S/
0.63
�0.
511.
38�
0.81
0.80
�0.
75N
S2.
30�
1.79
0.01
Syst
olic
BP
(mm
Hg
)12
6�
1112
4�
13N
S12
3�
1112
5�
9N
S12
1�
913
5�
1613
0�
1313
6�
10N
S12
3�
8N
SD
iast
olic
BP
(mm
Hg
)79
�8
78�
9N
S80
�7
80�
8N
S72
�7
83�
681
�7
81�
10N
S81
�7
NS
Whi
teb
lood
cells
(n/m
m3)
6850
�15
2972
40�
1247
NS
6589
�15
9467
34�
1347
NS
9358
�13
8876
86�
1673
7441
�13
0164
49�
1663
0.01
8090
�17
30N
SH
emog
lob
in(g
/dl)
12.3
�1.
612
.2�
2.5
NS
12.6
�1.
612
.4�
1.6
NS
10.3
�0.
512
.6�
1.7
13.1
�1.
711
.9�
2.0
NS
11.6
�2.
0N
SPl
atel
etes
(�10
3/m
m3)
245.
2�
74.4
258.
5�
51.9
NS
258.
0�
53.9
252.
4�
62.7
NS
213.
6�
39.3
242.
1�
70.4
245.
6�
67.2
242.
2�
84.2
NS
271.
7�
67.3
NS
Stat
in(y
es/n
o)3/
123/
12N
S5/
156/
14N
S/
3/10
2/10
2/6
NS
4/6
NS
AC
Ein
hib
itor
(yes
/no)
5/10
5/10
NS
7/13
6/14
NS
/7/
67/
54/
4N
S5/
5N
SC
yclo
spor
ine
dos
e(m
g/d
ay)
161
�31
165
�33
NS
159
�41
156
�38
NS
/16
6�
4418
4�
5115
7�
47N
S16
1�
37N
SC
yclo
spor
ine
T2le
vel
561
�17
758
9�
111
NS
573
�99
582
�10
3N
S/
549
�14
653
5�
160
519
�95
NS
489
�13
5N
SEC
-MPS
dos
e(m
g/d
ay)
//
//
720
//
803
�26
1/
//
720
/A
ZAd
ose
(mg
/day
)50
50/
50/
//
/47
�12
//
//
Val
ues
are
exp
ress
edas
mea
n�
SD.
AZA
,az
athi
oprin
e;D
D,
dec
ease
dd
onor
s;A
CE,
ang
iote
nsin
conv
ertin
gen
zym
e.P
valu
esca
lcul
ated
by
AN
OV
A.
aC
omp
arin
gth
etr
aini
ng,
ind
epen
den
tte
st,
and
ind
epen
den
tva
lidat
ion
gro
ups
(AN
OV
A).
CLINICAL RESEARCH www.jasn.org
2164 Journal of the American Society of Nephrology J Am Soc Nephrol 21: 2157–2168, 2010

and prednisone (CsA only), 12 with CsA, prednisone, and AZA
(CsA � AZA), and 13 with CsA, prednisone, and EC-MPS (CsA �
EC-MPS). All patients underwent renal biopsy for chronic allograft
dysfunction. The histologic diagnosis was chronic active humoral re-
jection in 6 patients, chronic active T cell–mediated rejection in 7,
chronic CNI toxicity in 10, and interstitial fibrosis/tubular atrophy
not otherwise specified in 10 cases, according to Banff 2007 criteria.52
Six deceased donor biopsies were used as control for the gene expres-
sion study on the graft. At the time of biopsy, all patients included in
the independent test group did not differ for the main clinical and
demographic features (Table 2). However, patients included in this
group had significantly higher serum creatinine and proteinuria levels
compared with those included in the training group (P � 0.01). Semi-
quantitative scoring for mononuclear cell interstitial inflammation
(ti-score [Ti]) in total parenchyma of renal biopsy from the patients
included in the independent test group was performed according to
Banff 2007 criteria.52 This analysis showed that eight patients had Ti-0
(n � 5 in CsA only, n � 1 in CsA � AZA, n � 2 in CsA � EC-MPS),
nine patients had Ti-1 (n � 2 in CsA only, n � 3 in CsA � AZA, n �
4 in CsA � EC-MPS), seven patients had Ti-2 (n � 1 in CsA only, n �
2 in CsA � AZA, n � 4 in CsA � EC-MPS), and four patients had Ti-3
(n � 2 in CsA � AZA and n � 2 in CsA � EC-MPS).
Independent Validation Group.This group of 10 patients, matching with the two initial study groups
for demographic and clinical features (Table 2), was used to confirm
the relationship between peripheral and tissue gene expression.
The study was carried out according to Declaration of Helsinki
principles and was approved by our institutional ethic review board.
PBMC Isolation and RNA ExtractionFor all patients included in the training group, 20 ml whole blood was
collected at T0 and after 3 months from conversion (T1). In the inde-
pendent validation group, the blood sample was obtained at the time
of renal biopsy. PBMCs were isolated by density separation over a
Ficoll–Hypaque gradient (Flow-Laboratories, Irvine, UK) and
washed three times with PBS pH 7.4/1 mM EDTA (Sigma, Milan,
Italy). Cells were counted, and their viability was determined by
Trypan blue exclusion (�90% PBMCs were viable). Total RNA was
extracted by the RNeasy mini kit (Qiagen, Valencia, CA) from a min-
imum of 5 � 106 cryopreserved PBMCs. Total RNA was quantified by
a NanoDrop ND-1000 Spectrophotometer (NanoDrop Technolo-
gies, Wilmington, DE), and its integrity was assessed by electrophore-
sis, using the Agilent 2100 Bioanalyzer (Agilent, Palo Alto, CA).
Gene Expression ProfilingFor the exploratory microarray analysis, we studied five patients con-
verted from AZA to EC-MPS randomly selected from the training
group. RNA, isolated from PBMCs at T0 and T1, was processed and
hybridized to the GeneChip Human Genome U133A oligonucleotide
microarray (Affymetrix, Santa Clara, CA), which contained 22,283
gene probe sets, representing 12,357 human genes, plus approxi-
mately 3800 expressed sequence tag clones (Affymetrix; see manufac-
turer’s manual for detailed protocol). We used the default settings of
Affymetrix Microarray Suite software version 5 (MAS 5.0) to calculate
scaled gene expression values. Results of the microarray experiments
are available in Gene Expression Omnibus (accession number
GSE14630).
Real-Time Quantitative RT-PCRTwenty microliters of a reaction mixture containing 500 ng of total
RNA, 10� RT-PCR buffer, 25� dNTPs mix, 10� RT random prim-
ers, RNase inhibitor, and 50 U of Multiscribe reverse transcriptase (PE
Applied Biosystems, Foster City, CA) was incubated at 25°C for 10
minutes and heated at 37°C for 120 minutes and then at 85°C for 5
seconds.
Real-time quantitative RT-PCR was performed with two separate
sets of oligonucleotide primers specific for human NEP (upstream:
5�-GAT GAC AAT GGC AGA AAC TT-3�; downstream: 5�-CCT
GAA ATT GCC TGG ACT GT-3�; Invitrogen, Milan, Italy) and glyc-
eraldehyde-3 phosphate dehydrogenase (GAPDH), respectively (up-
stream 5�-GAA GGT GAA GGT CGG AGT CA-3�; downstream: 5�-
CAT GGG TGG AAT CAT ATT GGA A-3�; Invitrogen). NEP and
GAPDH cDNA amplification was performed, in two separate sets of
reactions, using iQ SYBR Green Supermix buffer (6 mM MgCl2,
dNTPs, iTaq DNA polymerase, SYBR Green I, fluorescein, and stabi-
lizers; BIO-RAD Laboratories) and 100 nM of NEP primers or 100
nM of GAPDH primers, in a total volume of 25 �l. Amplification was
carried out with an MiniOpticon real-time PCR detection system
(BIO-RAD Laboratories) programmed with an initial step of 3 min-
utes at 95°C, followed by 40 thermal cycles of 10 seconds at 95°C and
30 seconds at 60°C for GAPDH or at 58°C for NEP. Melting curves
were generated through 60 additional cycles (65°C for 5 seconds, with
an increment of 0.5°C/cycle). Gene expression results were obtained
as average CT (threshold cycle) values of duplicate samples. NEP ex-
pression levels in each sample were normalized with expression of
GAPDH by CFX Manager software version 1.5 (BIO-RAD Laborato-
ries) using the 2Ct method.
Morphometric AnalysisMorphometric analysis was carried out to analyze the extent of glo-
merular sclerosis and interstitial fibrosis. For each biopsy, all glomer-
uli (mean, 10 glomeruli/biopsies; range, 5 to 20), including sclerotic
and nonsclerotic, were analyzed. The percentage of glomerular scle-
rosis was calculated as the ratio between the number of glomeruli with
global sclerosis plus glomeruli with segmental sclerosis and the num-
ber of all glomeruli for each biopsy.
Extent of interstitial fibrosis was assessed on Masson’s trichrome–
stained slides using Adobe Photoshop 6.0 (Adobe System, San Jose,
CA) in a MS Windows 98 environment (Microsoft, Redmond, WA).53
The cortical area of the entire biopsy was analyzed in a stepwise fash-
ion as a series of consecutive fields, with a 20� objective, avoiding the
capsule, the subcapsular areas, and the arterial adventitia. The per-
centage of green-stained area ([fibrous tissue]/total area) was mea-
sured. Values from all consecutive images for each biopsy were aver-
aged.
ImmunohistochemistryImmunohistochemical evaluation of NEP protein expression in the
glomeruli and proximal tubules of renal biopsy from deceased donors
CLINICAL RESEARCHwww.jasn.org
J Am Soc Nephrol 21: 2157–2168, 2010 Mycophenolic Acid and NEP 2165

and transplant patients was carried out on paraffin-embedded renal
biopsy sections according to standard procedures. Briefly, thin (2
�m) sections of paraffin-embedded tissue were hydrated through xy-
lenes and graded alcohol series. After antigen retrieval, the sections
were blocked with protein block serum-free (Dako, Glostrup, Den-
mark) at room temperature for 10 minutes. The slides were incubated
with a mouse monoclonal anti-human NEP antibody (1:50, 1-hour
incubation at room temperature; Abcam, Cambridge, UK). The bind-
ing of the secondary biotinylated antibody was detected by the Dako
Real EnVision, Peroxidase/DAB kit (Dako), according to the manu-
facturer’s instructions. Visualization of peroxidase was performed by
incubation in DAB chromogen solution, giving a brown precipitate.
The sections were counterstained with Mayer hematoxylin (blue) and
mounted with glycerol (Dako Cytomation). Negative controls were
obtained incubating serial sections with the blocking solution and
then omitting the primary antibody. For each biopsy, all glomeruli
were analyzed, and an average of 10 glomeruli/biopsy were present
(range, 5 to 20). Digital images of each glomerulus were captured with
a 40� objective using a Leica (Leitz, Wetzlar, Germany) microscope
fitted with a Coolpix990 digital camera (Nikon, Calenzano, Italy). To
quantify NEP immunostaining at the tubular level, for each biopsy,
the entire cortical region was analyzed in a stepwise fashion as a series
of consecutive fields with a 20� objective, avoiding the capsule, the
subcapsular areas, the arterial adventitia, and the glomeruli. Image
processing and computer operations were performed on Adobe Pho-
toshop 6.0. The percentage of positive stained area/total area was cal-
culated. Values from all consecutive images for each biopsy were av-
eraged. NEP glomerular and tubular expression was evaluated in each
group of treated patients.
Cell Isolation and CultureHK2 cells, an immortalized human proximal tubular epithelial cell
line,54 were obtained from American Type Culture Collection (Rock-
ville, MD). Cells were grown to confluence in DMEM/F12 (Sigma)
medium supplemented with 10% FBS (Sigma), 100 U/ml penicillin,
100 �g/ml streptomycin, and 2 mM L-glutamine (all from Life Tech-
nologies, Milan, Italy). For each passage, confluent cells were washed
with PBS, detached with 0.05% trypsin/0.02% EDTA (Sigma) in PBS,
and plated in DMEM/F12.
RNA Isolation and Real-Time PCRHK2 cells were plated in 6-well dishes at 15 � 104 /well and grown to
confluence in DMEM/F12 (Sigma) supplemented with 10% FBS. The
cells were starved 48 hours in serum-free medium and, for the first set
of experiments, exposed for the indicated time periods to MPA
(Sigma) at concentrations of 1, 5, 10, and 25 �g/ml. At the end of the
treatment, the cell monolayer was rapidly washed twice with PBS and
lysed with 350 �l of RLT buffer (Qiagen), and total RNA was extracted
by QIACUBE (Qiagen; see manufacturer’s manual for detailed pro-
tocol). NEP RNA expression was investigated by real-time PCR and,
to this purpose, 500 ng of RNA was used in a reverse transcription
reaction. In the second set of experiments, confluent cultures of HK2
cells were washed, serum starved for 48 hours, and preincubated for
24 hours with MPA (10 �g/ml), and then angiotensin II (20 nM;
Sigma) was added for 6 hours in the presence or absence of phosphor-
amidon (2, 5, and 10 �M; Sigma) for 6, 12, and 24 hours at 37°C. At
the end of the incubation period, cells were washed with PBS and lysed
with RLT buffer, and total RNA was extracted. Human PAI-1 gene
expression was investigated by real-time PCR using one set of specific
oligonucleotide primers (upstream: 5�-CAG ACC AAG AGC CTC
TCC AC-3�; downstream: 5�-ATG CGG GCT GAG ACT ATG AC-3�;
Invitrogen SRL) with an annealing temperature of 60°C. Real-time
PCR was performed as described above.
Statistical Analysis and BioinformaticsANOVA, t test, and Fisher’s exact test were used to assess differences
in clinical and demographic features among patients included in both
the training and test groups. Results were expressed as mean � SD.
Spearman correlation tests were used for continuous variable assess-
ment. A value of P � 0.05 was considered to be statistically significant.
For microarray analysis, the gene expression profile of each subject
was composed of the log-transformed levels of 22,283 probe sets.
Statistical analysis of the expression profiles of the five subjects en-
rolled in the study was carried out using the standard t test and Wil-
coxon test. Because of the small number of subjects analyzed and,
more importantly, the limited number of genes truly associated to the
phenotype, these classical methods may not reliably identify any sta-
tistically significant differentially expressed gene. To overcome the
problems related to multiple comparisons, we used a different statis-
tical approach. The fold change (FC) of each probe was evaluated as
the difference of the log-transformed values between the two experi-
mental conditions analyzed. The probes having an FC value simulta-
neously greater than (up-regulated) or less than (down-regulated) 0.7
in all of the five analyzed subjects were considered as candidates to be
differentially expressed (DE) probes. We obtained a list of 6 up-reg-
ulated and 10 down-regulated probes (P � 0.001). The statistical sig-
nificance of the obtained lists was assessed with nonparametric per-
mutation tests. The test consists in assigning randomly the FC
values to probes in gene expression profile of each analyzed subject
and counting the number of probes up- or down-regulated simul-
taneously in all of the subjects. We carried out 1000 random per-
mutations of the FC values. The P value associated with the list of
DE genes was evaluated as the number of times in which we obtain
larger lists of DE genes by chance divided by the total number of
permutations.
Principal component analysis was performed using Spotfire
DecisionSite 9.0 (www.spotfire.com).
ACKNOWLEDGMENTS
This work was funded by Ministero della Salute (Ricerca Finalizzata
2006, granted to G.G.) and an unrestricted research grant from No-
vartis. We thank Vincenzo Gesualdo (Renal, Dialysis and Transplan-
tation Unit, Department of Emergency and Organ Transplantation,
University of Bari) for the excellent technical assistance, Giovanni
Pannarale, MD, for the helpful discussion on the histologic findings
and Mariella Mastronardo for her editorial assistance and language
revision of the manuscript.
CLINICAL RESEARCH www.jasn.org
2166 Journal of the American Society of Nephrology J Am Soc Nephrol 21: 2157–2168, 2010

DISCLOSURESNone.
REFERENCES
1. Andrews PA: Renal transplantation. BMJ 324: 530–534, 20022. Wynn JJ, Distant DA, Pirsch JD, Norman D, Gaber AO, Ashby VB,
Leichtman AB: Kidney and pancreas transplantation. Am J Transplant4: 72–80, 2004
3. Lo A, Alloway RR: Strategies to reduce toxicities and improve outcomesin renal transplant recipients. Pharmacotherapy 22: 316–328, 2002
4. Allison AC, Eugui EM: Purine metabolism and immunosuppressiveeffects of mycophenolate mofetil. Clin Transplant 10: 77–84, 1996
5. Sintchak MD, Fleming MA, Futer O, Raybuck SA, Chambers SP, CaronPR, Murcko MA, Wilson KP: Structure and mechanism of inosinemonophosphate dehydrogenase in complex with the immunosup-pressant mycophenolic acid. Cell 85: 921–930, 1996
6. Ji Y, Gu J, Makhov AM, Griffith JD, Mitchell BS: Regulation of theinteraction of inosine monophosphate dehydrogenase with mycophe-nolic acid by GTP. J Biol Chem 281: 206–212, 2006
7. Allison AC, Eugui EM: Mycophenolate mofetil and its mechanisms ofaction. Immunopharmacology 47: 85–118, 2000
8. Nart A, Sipahi S, Aykas A, Uslu A, Hoçscoçskun C, Toz H: Efficacy andsafety of enteric-coated mycophenolate sodium in de novo and main-tenance renal transplant patients. Transplant Proc 40: 189–192, 2008
9. Halloran PF: Immunosuppressive drugs for kidney transplantation.N Engl J Med 351: 2715–2729, 2004
10. Sollinger HW: Mycophenale mofetil for the prevention of acute rejectionin primary cadaveric renal allograft recipients: US Renal Transplant My-cophenolate Mofetil Study Group. Transplantation 60: 225–232, 1995
11. Ojo AO, Meier-Kriesche HU, Hanson JA, Leichtman AB, Cibrik D,Magee JC, Wolfe RA, Agodoa LY, Kaplan B: Mycophenolate mofetilreduces late renal allograft loss independent of acute rejection. Trans-plantation 69: 2405–2409, 2000
12. Meier-Kriesche HU, Steffen BJ, Hochberg AM, Gordon RD, LiebmanMN, Morris JA, Kaplan B: Mycophenolate mofetil versus azathioprinetherapy is associated with a significant protection against long-termrenal allograft function deterioration. Transplantation 75: 1341–1346,2003
13. Bestard O, Cruzado JM, Grinyo JM: Calcineurin-inhibitor-sparing im-munosuppressive protocols. Transplant Proc 37: 3729–3732, 2005
14. Schnuelle P, van der Heide JH, Tegzess A, Paul LC, van der Woude FJ:Open randomized trial comparing early withdrawal of either cyclo-sporine or mycophenolate mofetil in stable renal transplant recipientsinitially treated with a triple drug regimen. J Am Soc Nephrol 13:536–543, 2002
15. Francois H, Durrbach A, Amor M, Djeffal R, Kriaa F, Paradis V, BedossaP, Charpentier B: The long-term effect of switching from cyclospor-ine A to mycophenolate mofetil in chronic renal graft dysfunctioncompared with conventional management. Nephrol Dial Transplant18: 1909 –1916, 2003
16. Ducloux D, Motte G, Billerey C, Bresson-Vautrin C, Vautrin P, RebibouJM, Saint-Hillier Y, Chalopin JM: Cyclosporin withdrawal with con-comitant conversion from azathioprine to mychophenolate mofetilin renal transplant recipients with chronic allograft nephropathy: A2-year follow-up. Transplant Int 15: 387–392, 2002
17. Raisanen-Sokolowski A, Vuoristo P, Myllarniemi M, Yilmaz S, Kallio E,Hayry P: Mycophenolate mofetil (MMF, RS-61443) inhibits inflamma-tion and smooth muscle cell proliferation in rat aortic allografts. Trans-plant Immunol 3: 342–351, 1995
18. Shihab FS, Bennett WM, Yi H, Choi SO, Andoh TF: Mycophenolatemofetil ameliorates arteriolopathy and decreases transforming growthfactor-beta1 in chronic cyclosporine nephrotoxicity. Am J Transplant3: 1550–1559, 2003
19. Yu CC, Yang CW, Wu MS, Ko YC, Huang CT, Hong JJ, Huang CC:Mycophenolate mofetil reduces renal cortical inducible nitric oxidesynthase mRNA expression and diminishes glomerulosclerosis in MRL/lpr mice. J Lab Clin Med 138: 69–77, 2001
20. Nankivell BJ, Wavamunno MD, Borrows RJ, Vitalone M, Fung CL,Allen RD, Chapman JR, O’Connell PJ: Mycophenolate mofetil is as-sociated with altered expression of chronic renal transplant histology.Am J Transplant 7: 366–376, 2007
21. Goncalves RG, Biato MA, Colosimo RD, Martinusso CA, Pecly ID,Farias EK, Cardoso LR, Takiya CM, Ornellas JF, Leite M Jr: Effects ofmycophenolate mofetil and lisinopril on collagen deposition in unilat-eral ureteral obstruction in rats. Am J Nephrol 24: 527–536, 2004
22. Fujihara CK, Malheiros DM, Zatz R, Noronha IL: Mycophenolatemofetil attenuates renal injury in the rat remnant kidney. Kidney Int 54:1510–1519, 1998
23. Erdos EG, Skidgel RA: Neutral endopeptidase 24.11 (enkephalinase)and related regulators of peptide hormones. FASEB J 3: 145–151,1989
24. Gesualdo L, Ranieri E, Monno R, Rossiello MR, Colucci M, Semeraro N,Grandaliano G, Schena FP, Ursi M, Cerullo G: Angiotensin IV stimu-lates plasminogen activator inhibitor-1 expression in proximal tubularepithelial cells. Kidney Int 56: 461–470, 1999
25. Chapman JR, O’Connell PJ, Nankivell BJ: Chronic renal allograft dys-function. J Am Soc Nephrol 16: 3015–3026, 2005
26. Meier-Kriesche HU, Li S, Gruessner RW, Fung JJ, Bustami RT, Barr ML,Leichtman AB: Immunosuppression: Evolution in practice and trends.Am J Transplant 6: 1111–1131, 2006
27. European Mycophenolate Mofetil Cooperative Study Group: Placebo-controlled study of mycophenolate mofetil combined with cyclosporinand corticosteroids for prevention of acute rejection. Lancet 345:1321–1325, 1995
28. Gonwa TA: Mycophenolate mofetil for maintenance therapy in kidneytransplantation. Clin Transplant 10: 128–130, 1996
29. The Tricontinental Mycophenolate Mofetil Renal TransplantationStudy Group: A blinded, randomized clinical trial of mycophenolatemofetil for the prevention of acute rejection in cadaveric renal trans-plantation. Transplantation 61: 1029–1037, 1996
30. Meier-Kriesche HU, Morris JA, Chu AH, Steffen BJ, Gotz VP, GordonRD, Kaplan B: Mycophenolate mofetil vs azathioprine in a large pop-ulation of elderly renal transplant patients. Nephrol Dial Transplant 19:2864–2869, 2004
31. Abramowicz D, Manas D, Lao M, Vanrenterghem Y, Del Castillo D,Wijngaard P, Fung S; Cyclosporine Withdrawal Study Group: Cyclo-sporine withdrawal from a mycophenolate mofetil-containing immu-nosuppressive regimen in stable kidney transplant recipients: A ran-domized, controlled study. Transplantation 74: 1725–1734, 2002
32. Hueso M, Bover J, Seron D, Gil-Vernet S, Sabate I, Fulladosa X, RamosR, Coll O, Alsina J, Grinyo JM: Low-dose cyclosporine and mycophe-nolate mofetil in renal allograft recipients with suboptimal renal func-tion. Transplantation 66: 1727–1731, 1998
33. Romero F, Rodríguez-Iturbe B, Parra G, Gonzalez L, Herrera-AcostaJ, Tapia E: Mycophenolate mofetil prevents the progressive renalfailure induced by 5/6 renal ablation in rats. Kidney Int 55: 945–955,1999
34. Tapia E, Franco M, Sanchez-Lozada LG, Soto V, Avila-Casado C,Santamaría J, Quiroz Y, Rodríguez-Iturbe B, Herrera-Acosta J: Myco-phenolate mofetil prevents arteriolopathy and renal injury in subtotalablation despite persistent hypertension. Kidney Int 63: 994–1002,2003
35. Fujihara CK, Noronha IL, Malheiros D, Antunes GR, de Oliveira IB, ZatzR: Combined mycophenolate mofetil and losartan therapy arrestsestablished injury in the remnant kidney. J Am Soc Nephrol 11:283–290, 2000
36. Stegall M, Park W, Kim D, Kremers W: Gene expression during acuteallograft rejection: Novel statistical analysis of microarray data. Am JTransplant 10: 913–925, 2002
CLINICAL RESEARCHwww.jasn.org
J Am Soc Nephrol 21: 2157–2168, 2010 Mycophenolic Acid and NEP 2167

37. Brouard S, Mansfield E, Braud C, Li L, Giral M, Hsieh SC, Baeten D,Zhang M, Ashton-Chess J, Braudeau C, Hsieh F, Dupont A, Pallier A,Moreau A, Louis S, Ruiz C, Salvatierra O, Soulillou JP, Sarwal M:Identification of a peripheral blood transcriptional biomarker panelassociated with operational renal allograft tolerance. Proc Natl AcadSci USA 104: 15448–15453, 2007
38. Cox SN, Sallustio F, Serino G, Pontrelli P, Verrienti R, Pesce F, TorresDD, Ancona N, Stifanelli P, Zaza G, Schena FP: Altered modulation ofWNT-beta-catenin and PI3K/Akt pathways in IgA nephropathy. KidneyInt 78: 396–407, 2010
39. Stimler-Gerard NP: Neutral endopeptidase-like enzyme controls thecontractile activity of substance P in guinea pig lung. J Clin Invest 79:1819–1825, 1987
40. Roques BP, Noble F, Dauge V, Fournie-Zaluski MC, Beaumont A:Neutral endopeptidase 24.11: Structure, inhibition, and experimentaland clinical pharmacology. Pharmacol Rev 45: 87–146, 1993
41. Westhuyzen J, Endre ZH, Reece G, Reith DM, Saltissi D, Morgan TJ:Measurement of tubular enzymuria facilitates early detection of acuterenal impairment in the intensive care unit. Nephrol Dial Transplant18: 543–551, 2003
42. Debiec H, Guigonis V, Mougenot B, Haymann JP, Bensman A, De-schenes G, Ronco PM: Antenatal membranous glomerulonephritiswith vascular injury induced by anti-neutral endopeptidase antibodies:Toward new concepts in the pathogenesis of glomerular diseases.J Am Soc Nephrol 14: S27–S32, 2003
43. Debiec H, Guigonis V, Mougenot B, Decobert F, Haymann JP, Bens-man A, Deschenes G, Ronco PM: Antenatal membranous glomerulo-nephritis due to anti-neutral endopeptidase antibodies. N Engl J Med346: 2053–2060, 2002
44. Remuzzi G, Benigni A, Remuzzi A: Mechanisms of progression andregression of renal lesions of chronic nephropathies and diabetes.J Clin Invest 116: 288–296, 2006
45. Zatz R, Noronha IL, Fujihara CK: Experimental and clinical rationale foruse of MMF in nontransplant progressive nephropathies. Am J PhysiolRenal Physiol 283: 1167–1175, 2002
46. Lipkin GW, Thuraisingham R, Dawnay AB, Harwood SM, Raine AE:
Acute reversal of cyclosporine nephrotoxicity by neutral endopepti-dase inhibition in stable renal transplant recipients. Transplantation64: 1007–1017, 1997
47. Ishi M, Hirata Y, Sugimoto T, Matsuoka H, Kimura K, Ishimitsu T, FukuiK, Sugimoto T, Kurosawa Y, Kiyose H: Effect of human atrial natriureticpeptide on proteinuria in patients with primary glomerular disease.Clin Sci 77: 643–650, 1989
48. Kobori H, Nangaku M, Navar LG, Nishiyama A: The intrarenal renin-angiotensin system: From physiology to the pathobiology of hyper-tension and kidney disease. Pharmacol Rev 59: 251–287, 2007
49. Schulz WW, Hagler HK, Buja LM, Erdos EG: Ultrastructural localizationof angiotensin I-converting enzyme (EC 3.4.15.1) and neutral met-alloendopeptidase (EC 3.4.24.11) in the proximal tubule of the humankidney. Lab Invest 59: 789–797, 1988
50. Muller DN, Shagdarsuren E, Park JK, Dechend R, Mervaala E, Ham-pich F, Fiebeler A, Ju X, Finckenberg P, Theuer J, Viedt C, Kreuzer J,Heidecke H, Haller H, Zenke M, Luft FC: Immunosuppressive treat-ment protects against angiotensin II-induced renal damage. Am JPathol 161: 1679–1693, 2002
51. Rossi GP: Dual ACE, NEP inhibitors: A review of the pharmacologicalproperties of MDL 100,240, Cardiovasc Drug Rev 21: 51–66, 2003
52. Solez K, Colvin RB, Racusen LC, Haas M, Sis B, Mengel M, HalloranPF, Baldwin W, Banfi G, Collins AB, Cosio F, David DS, Drachen-berg C, Einecke G, Fogo AB, Gibson IW, Glotz D, Iskandar SS,Kraus E, Lerut E, Mannon RB, Mihatsch M, Nankivell BJ, Nickeleit V,Papadimitriou JC, Randhawa P, Regele H, Renaudin K, Roberts I,Seron D, Smith RN, Valente M: Banff 07 classification of renalallograft pathology: Updates and future directions. Am J Transplant8: 753–760, 2008
53. Dahab GM, Kheriza MM, El-Beltagi HM, Fouda AM, El-Din OA: Digitalquantification of fibrosis in liver biopsy sections: Description of a newmethod by Photoshop software. J Gastroenterol Hepatol 19: 78–85,2004
54. Ryan MJ, Johnson G, Kirk J, Fuerstenberg SM, Zager RA, Torok-StorbB: HK-2: An immortalized proximal tubule epithelial cell line fromnormal adult human kidney. Kidney Int 45: 48–57, 1994
CLINICAL RESEARCH www.jasn.org
2168 Journal of the American Society of Nephrology J Am Soc Nephrol 21: 2157–2168, 2010
Copyright © 2022 FDOKUMEN