
Nieuw Amsterdam. Inaugurele rede Universiteit van Amsterdam (2014)
Upload
independentCategory
view
3download
0
This article was downloaded by: [University of Maastricht]On: 28 September 2012, At: 10:26Publisher: Psychology PressInforma Ltd Registered in England and Wales Registered Number: 1072954 Registered office: MortimerHouse, 37-41 Mortimer Street, London W1T 3JH, UK
Journal of Clinical and ExperimentalNeuropsychologyPublication details, including instructions for authors and subscription information:http://www.tandfonline.com/loi/ncen20
The Amsterdam Executive Function Inventory(AEFI): Psychometric properties anddemographically corrected normative data foradolescents aged between 15 and 18 yearsWim Van der Elst a , Carolijn Ouwehand b , Greetje van der Werf c , Hans Kuyper c ,Nikki Lee b & Jelle Jolles ba Faculty of Medicine and Life Sciences, Maastricht University, Maastricht, TheNetherlandsb LEARN! Research Institute and Faculty of Psychology & Education, VU UniversiteitAmsterdam, Amsterdam, The Netherlandsc GION, Institute for Educational Research, University of Groningen, Groningen, TheNetherlands
Version of record first published: 24 Nov 2011.
To cite this article: Wim Van der Elst, Carolijn Ouwehand, Greetje van der Werf, Hans Kuyper, Nikki Lee & JelleJolles (2012): The Amsterdam Executive Function Inventory (AEFI): Psychometric properties and demographicallycorrected normative data for adolescents aged between 15 and 18 years, Journal of Clinical and ExperimentalNeuropsychology, 34:2, 160-171
To link to this article: http://dx.doi.org/10.1080/13803395.2011.625353
PLEASE SCROLL DOWN FOR ARTICLE
Full terms and conditions of use: http://www.tandfonline.com/page/terms-and-conditions
This article may be used for research, teaching, and private study purposes. Any substantial orsystematic reproduction, redistribution, reselling, loan, sub-licensing, systematic supply, or distributionin any form to anyone is expressly forbidden.
The publisher does not give any warranty express or implied or make any representation that thecontents will be complete or accurate or up to date. The accuracy of any instructions, formulae, anddrug doses should be independently verified with primary sources. The publisher shall not be liable forany loss, actions, claims, proceedings, demand, or costs or damages whatsoever or howsoever causedarising directly or indirectly in connection with or arising out of the use of this material.
JOURNAL OF CLINICAL AND EXPERIMENTAL NEUROPSYCHOLOGY2012, 34 (2), 160–171
The Amsterdam Executive Function Inventory (AEFI):Psychometric properties and demographically corrected
normative data for adolescents aged between15 and 18 years
Wim Van der Elst1, Carolijn Ouwehand2, Greetje van der Werf3, Hans Kuyper3,Nikki Lee2, and Jelle Jolles2
1Faculty of Medicine and Life Sciences, Maastricht University, Maastricht, The Netherlands2LEARN! Research Institute and Faculty of Psychology & Education, VU Universiteit Amsterdam,Amsterdam, The Netherlands3GION, Institute for Educational Research, University of Groningen, Groningen, The Netherlands
The Amsterdam Executive Function Inventory (AEFI) is a newly developed brief self-report questionnaire toassess three important components of the executive aspects of daily-life behavior—that is, Attention, Self-Controland Self-Monitoring, and Planning and Initiative. In a population-based study, the AEFI was administered toN = 6,730 Dutch adolescents aged between 15 and 18 years. Psychometric analyses showed that the constructvalidity and the reliability of the AEFI were adequate. Educational level and gender affected the different AEFIscale scores. Regression-based normative data that took these demographic influences into account were estab-lished, so that the AEFI can be used by clinicians and researchers who need to assess executive aspects of daily-lifebehavior.
Keywords: Executive functioning; Adolescents; Norms; Psychometric analyses.
“Executive functions” is an umbrella term thatrefers to the cognitive abilities that are neededfor goal-directed behavior (Lezak, Howieson,& Loring, 2004). Various authors have arguedthat the assessment of executive functions is dif-ficult (Anderson, Anderson, Northam, Jacobs, &Catroppa, 2001; Jurado & Rosselli, 2007; Klenberg,Korkman, & Lahti-Nuuttila, 2001; Lezak et al.,2004; Saboya, Coutinho, Segenreich, Ayrão, &Mattos, 2009; Van der Elst, Van Boxtel, VanBreukelen, & Jolles, 2008). For example, researchhas shown that “traditional” performance-basedexecutive function tests—such as the Stroop ColorWord Test (Stroop, 1935)—are stronger associated
This research was supported by grant 056-35-010 of the National Initiative Brain & Cognition (Nederlandse organisatie voorWetenschappelijk Onderzoek; NWO).
Address correspondence to Wim Van der Elst, Faculty of Medicine and Life Sciences, Department of Psychiatryand Neuropsychology, University Maastricht, Dr. Tanslaan 12, 6200 MD, Maastricht, The Netherlands (E-mail:[email protected]).
with cognitive abilities (e.g., intelligence) thanwith executive aspects of daily-life behavior (e.g.,inattention; Biederman et al., 2008). Moreover,performance on most traditional executive functiontests involves multiple lower level cognitive abilities(such as processing speed and expressive language)in addition to higher level executive components(Anderson et al., 2001). This hampers a straight-forward interpretation of the test results in terms ofexecutive functioning. Most traditional executivefunction tests were also developed in the field ofadult (neuro)psychology, and not all of these testscan be used to assess the executive functions ofchildren and adolescents. For example, assessing
© 2012 Psychology Press, an imprint of the Taylor & Francis Group, an Informa business
http://www.psypress.com/jcen http://dx.doi.org/10.1080/13803395.2011.625353
Dow
nloa
ded
by [
Uni
vers
ity o
f M
aast
rich
t] a
t 10:
26 2
8 Se
ptem
ber
2012
AMSTERDAM EXECUTIVE FUNCTION INVENTORY 161
the inhibition component of executive functioningwith the Stroop Color–Word Test is only possi-ble when reading has become a highly automatizedbehavior in an individual.
More recently, neuropsychological tests havebeen developed that were explicitly intended tomaximize the prediction of real-world behav-ior (the so-called “verisimilitude” tests, such asthe Behavioral Assessment of the DysexecutiveSyndrome for Children, BADS-C; Emslie, Wilson,Burden, Nimmo-Smith, & Wilson, 2003). Theempirical evidence that verisimilitude tests aremore predictive for daily-life functioning thantraditional executive function tests is, how-ever, inconsistent and rather limited (Chaytor &Schmitter-Edgecombe, 2003; Wood & Liossi, 2006).Moreover, some of the problems that arise withtraditional executive function tests also occur withverisimilitude tests. For example, the Water subtestof the BADS-C requires children to remove a corkfrom a tube by using equipment that is provided tointroduce water into the tube to float the cork. Thissubtest requires a complex sequence of behaviorsthat consists of both executive (e.g., planning) andnonexecutive (e.g., visuomotor coordination skills)components. The unequivocal interpretation ofthe test results in terms of executive abilities isthus hampered (Henry & Bettenay, 2010). Anotherproblem with verisimilitude tests such as theBADS-C is that these tests are typically intendedto be administered only once, as they are basedon the philosophy that executive functions shouldbe assessed by novel tasks. Research has indeedshown that the test–retest correlations for variousBADS-C subtests were low (Henry & Bettenay,2010). As a result, instruments such as the BADS-Ccannot be used to address longitudinal researchquestions (e.g., how do the executive functionsof children develop over time?) or questions withrespect to clinical change (e.g., did the executiveabilities of this child improve after initiating atreatment?).
In view of these problems with behavior-basedtests, it has been suggested that questionnairesmay provide a useful complementary approachto assess executive functions (Chaytor, Schmitter-Edgecombe, & Burr, 2006; Isquith, Crawford, Espy,& Gioia, 2005; Jurado & Rosselli, 2007). Researchhas indeed indicated that questionnaire-based mea-sures were more strongly related to the executiveaspects of daily-life behavior than to behavior-based executive function measures (Biedermanet al., 2008). Moreover, questionnaires do not con-found lower and higher level cognitive abilities, andthey can be repeatedly administered in the sameindividual. Questionnaires also have the advantage
that they can be used in both children and adults,by relying on self-report, informant report, or acombination of both.
Existing executive function questionnaires, suchas the Behavior Rating Inventory of ExecutiveFunction (BRIEF; Gioia, Isquith, Guy, &Kenworthy, 2000), have good psychometric prop-erties (e.g., Huizinga & Smidts, 2011), but theseinstruments typically contain a large number ofitems (e.g., 86 items for the BRIEF), which makestheir administration time relatively long. It wouldbe advantageous to have a short psychometricallysound screening instrument available that assessesthe executive functions of children and adolescentsin a straightforward and time-efficient way. Theaim of the present study was to present such aninstrument—that is, the Amsterdam ExecutiveFunction Inventory (AEFI).
In the AEFI, executive functions were con-ceptualized as comprising three separable—butintegrated—factors (see Anderson et al., 2001). Thefirst executive component can be verbally labeled“Attention” and consists of cognitive abilities suchas selective and sustained attention (measured inthe AEFI by items such as “I am not able to focuson the same topic for a long period of time” and“My thoughts easily wander”). The second execu-tive function factor can be verbally labeled “Self-Control and Self-Monitoring” and consists of abili-ties such as working memory and self-monitoring(measured by items such as “I often lose things”and “I often react too fast. I’ve done or said some-thing before it is my turn”). The third factor can beverbally labeled “Planning and Initiative” and con-sists of abilities such as the initiating and planningof behavior (measured in the AEFI by items suchas “I can make fast decisions, e.g., in lessons” and“I am well organized. For example, I am good atplanning what I need to do during a day”).
In the present study, the psychometric proper-ties of the AEFI were evaluated as based on thedata of a large sample (N = 6,730) of adolescents(aged between 15.0 and 18.0 years). Normativedata were also established, because it is difficultto interpret raw test scores in a meaningful waywithout an empirical frame of reference (Capitani,1997; Van der Elst, 2006). Norms are indeed use-ful tools, which allow clinicians and researchersto address questions such as: “Are the Attention,Self-Control and Self-Monitoring, and Planningand Initiative AEFI scale scores of this child“normal” as compared to the scores of his orher demographically matched peers, or are thesescores deviant (i.e., exceptionally low or high)?”Previous studies in children and early adolescents(aged below 15 years) have shown that age (Ardila,
Dow
nloa
ded
by [
Uni
vers
ity o
f M
aast
rich
t] a
t 10:
26 2
8 Se
ptem
ber
2012
162 VAN DER ELST ET AL.
Rosselli, Matute, & Guajardo, 2005; Blakemore& Choudhury, 2006; Klenberg et al., 2001; Levinet al., 1991; Rebok, Smith, Pascualvaca, Mirsky,Anthony, & Kellam, 1997; Welsh, Pennington, &Groisser, 1991), gender (Anderson et al., 2001;Ardila et al., 2005; Berlin & Bohlin, 2002; Brocki& Bohlin, 2004), and educational level (Ardilaet al., 2005; Klenberg et al., 2001; Noble, Norman,& Farah, 2005) affect executive functions. It isconceivable that similar demographic effects occuramong older adolescents who are aged above15 years. Thus we also evaluated the impact ofage, gender, and educational level on the AEFIscale scores, so that that the normative data couldbe appropriately corrected for the relevant demo-graphical variables.
METHODParticipants
Data were derived from the COOL5–18 study(Cohort Onderzoek Onderwijs Loopbanen; inEnglish: Cohort Study of Educational Trajectories),a large-scale study into the determinants of the cog-nitive and social–emotional development of chil-dren and adolescents (Kuyper, Keuning, & Zijsling,2010). A total of N = 7,793 participants (fromN = 75 schools) participated in the COOL5–18 studyand filled in a questionnaire, which included theAEFI. Respondents were excluded from the dataanalyses if they had missing values on one or moreitems of the AEFI (n = 983). The age range ofthe remaining N = 6,810 participants was between14.1 and 20.4 years, but the majority of participantswere aged between 15.0 and 18.0 years (n = 6,730;98.8%). The n = 80 participants who were youngerthan 15.0 years or older than 18.0 years wereexcluded from the analyses to avoid a dispropor-tionate influence of the outlying predictor valueson the fitted regression model (Kutner, Nachtsheim,Neter, & Li, 2005).
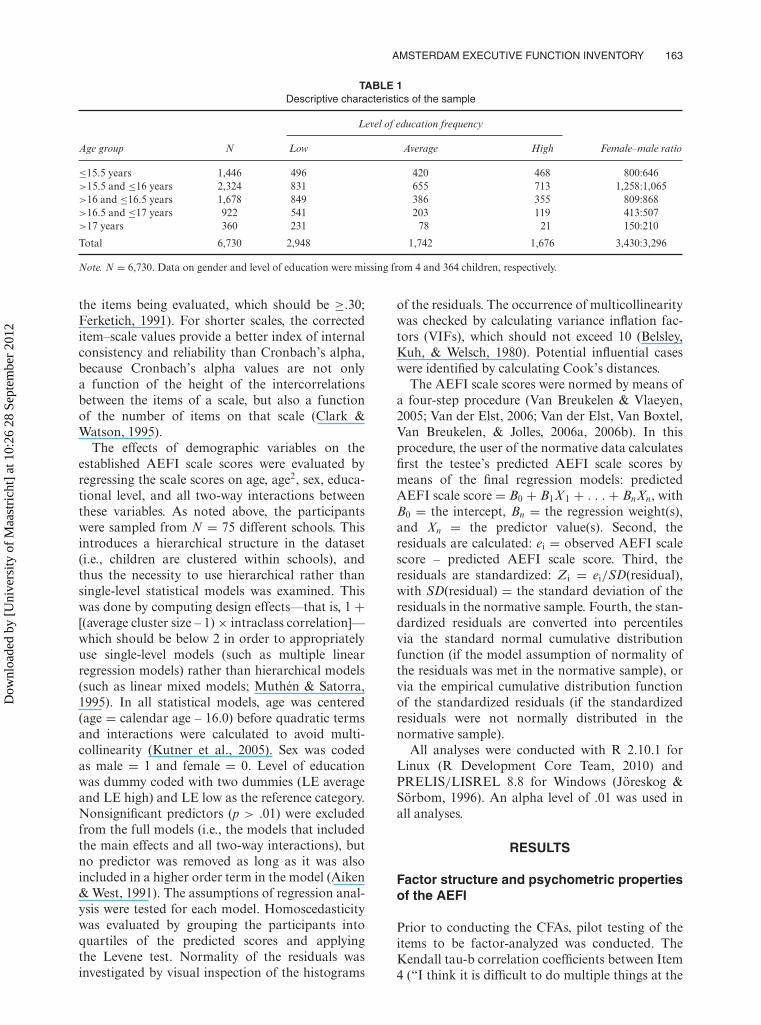
The demographic characteristics of the sampleare shown in Table 1. The mean (standard devi-ation) age of the children who were included inthe analyses was 16.0 (SD = 0.6) years. Levelof education (LE) was measured by classifyingthe formal schooling of the participants into oneof three groups—that is, those with prevocationalsecondary education (LE low; 46.3% of the sam-ple), those with higher general secondary education(LE average; 27.3% of the sample), and those withpreuniversity education (LE high; 26.4% of thesample). There were slightly more female than maleparticipants (51.0% females).
Procedure and instruments
The initial version of the AEFI contained 14 items,which represented three a priori expecteddimensions of executive functioning—that is,Attention, Self-Control and Self-Monitoring, andPlanning and Initiative (see Introduction). Theresponses for the AEFI items were presented ona 3-point Likert scale with the choice options1 = “not true,” 2 = “partly true,” and 3 = “true.”Items 1, 4, 5, 6, 7, 8, 11, 12, and 13 were reversecoded, so that higher scores were indicative ofbetter executive abilities.
Statistical analyses
Confirmatory factor analysis (CFA) was used toevaluate the factor structure of the AEFI. An a pri-ori model was specified, in which three factorsunderlay the item responses and in which eachitem loaded on only one factor. Due to the cate-gorical nature of the item responses and the non-normal score distributions of a number of items,the diagonally weighted least squares method forpolychoric correlation matrices was used (insteadof the standard maximum likelihood estimationmethod). Polychoric coefficients and an asymp-totic covariance matrix were generated in PRELISfor subsequent analysis in LISREL (Jöreskog &Sörbom, 1996). Prior to the CFA, pilot testing ofthe items to be factor-analyzed was conducted toensure that the items that were designed to measurea common construct correlated at least moder-ately with each other (i.e., correlations of at least.20; see Floyd & Widaman, 1995). Kendall tau-b correlation coefficients were calculated (ratherthan Pearson correlation coefficients) in view of theordinal measurement level of the items of the AEFI.
The fit of the three-factor AEFI model was eval-uated with the root mean square error of approxi-mation (RMSEA; <.08 acceptable, <.05 excellent;Browne & Cudeck, 1993), the comparative fit index(CFI; >.90 acceptable, >.95 excellent; Bentler,1990; Bentler & Bonett, 1980), and the normed fitindex (NFI; >.90 acceptable; Bentler & Bonnett,1980). Item descriptives (means, SDs, and itemresponse distributions) were calculated. The inter-nal consistency and reliability of the establishedAEFI scales were estimated with Cronbach’s alphacoefficients (which should be ≥.6–.7; Clark &Watson, 1995; Dekovic, Janssens, & Gerris, 1991;Holden, Fekken, & Cotton, 1991) and with cor-rected item–scale correlations (i.e., the correlationsbetween items and scale scores that did not include
Dow
nloa
ded
by [
Uni
vers
ity o
f M
aast
rich
t] a
t 10:
26 2
8 Se
ptem
ber
2012
AMSTERDAM EXECUTIVE FUNCTION INVENTORY 163
TABLE 1Descriptive characteristics of the sample
Level of education frequency
Age group N Low Average High Female–male ratio
≤15.5 years 1,446 496 420 468 800:646>15.5 and ≤16 years 2,324 831 655 713 1,258:1,065>16 and ≤16.5 years 1,678 849 386 355 809:868>16.5 and ≤17 years 922 541 203 119 413:507>17 years 360 231 78 21 150:210
Total 6,730 2,948 1,742 1,676 3,430:3,296
Note. N = 6,730. Data on gender and level of education were missing from 4 and 364 children, respectively.
the items being evaluated, which should be ≥.30;Ferketich, 1991). For shorter scales, the correcteditem–scale values provide a better index of internalconsistency and reliability than Cronbach’s alpha,because Cronbach’s alpha values are not onlya function of the height of the intercorrelationsbetween the items of a scale, but also a functionof the number of items on that scale (Clark &Watson, 1995).
The effects of demographic variables on theestablished AEFI scale scores were evaluated byregressing the scale scores on age, age2, sex, educa-tional level, and all two-way interactions betweenthese variables. As noted above, the participantswere sampled from N = 75 different schools. Thisintroduces a hierarchical structure in the dataset(i.e., children are clustered within schools), andthus the necessity to use hierarchical rather thansingle-level statistical models was examined. Thiswas done by computing design effects—that is, 1 +[(average cluster size – 1) × intraclass correlation]—which should be below 2 in order to appropriatelyuse single-level models (such as multiple linearregression models) rather than hierarchical models(such as linear mixed models; Muthén & Satorra,1995). In all statistical models, age was centered(age = calendar age – 16.0) before quadratic termsand interactions were calculated to avoid multi-collinearity (Kutner et al., 2005). Sex was codedas male = 1 and female = 0. Level of educationwas dummy coded with two dummies (LE averageand LE high) and LE low as the reference category.Nonsignificant predictors (p > .01) were excludedfrom the full models (i.e., the models that includedthe main effects and all two-way interactions), butno predictor was removed as long as it was alsoincluded in a higher order term in the model (Aiken& West, 1991). The assumptions of regression anal-ysis were tested for each model. Homoscedasticitywas evaluated by grouping the participants intoquartiles of the predicted scores and applyingthe Levene test. Normality of the residuals wasinvestigated by visual inspection of the histograms
of the residuals. The occurrence of multicollinearitywas checked by calculating variance inflation fac-tors (VIFs), which should not exceed 10 (Belsley,Kuh, & Welsch, 1980). Potential influential caseswere identified by calculating Cook’s distances.
The AEFI scale scores were normed by means ofa four-step procedure (Van Breukelen & Vlaeyen,2005; Van der Elst, 2006; Van der Elst, Van Boxtel,Van Breukelen, & Jolles, 2006a, 2006b). In thisprocedure, the user of the normative data calculatesfirst the testee’s predicted AEFI scale scores bymeans of the final regression models: predictedAEFI scale score = B0 + B1X1 + . . . + BnXn, withB0 = the intercept, Bn = the regression weight(s),and Xn = the predictor value(s). Second, theresiduals are calculated: ei = observed AEFI scalescore – predicted AEFI scale score. Third, theresiduals are standardized: Zi = ei/SD(residual),with SD(residual) = the standard deviation of theresiduals in the normative sample. Fourth, the stan-dardized residuals are converted into percentilesvia the standard normal cumulative distributionfunction (if the model assumption of normality ofthe residuals was met in the normative sample), orvia the empirical cumulative distribution functionof the standardized residuals (if the standardizedresiduals were not normally distributed in thenormative sample).
All analyses were conducted with R 2.10.1 forLinux (R Development Core Team, 2010) andPRELIS/LISREL 8.8 for Windows (Jöreskog &Sörbom, 1996). An alpha level of .01 was used inall analyses.
RESULTS
Factor structure and psychometric propertiesof the AEFI
Prior to conducting the CFAs, pilot testing of theitems to be factor-analyzed was conducted. TheKendall tau-b correlation coefficients between Item4 (“I think it is difficult to do multiple things at the
Dow
nloa
ded
by [
Uni
vers
ity o
f M
aast
rich
t] a
t 10:
26 2
8 Se
ptem
ber
2012
164 VAN DER ELST ET AL.
same time, e.g., studying and listening to music”)and the other items that were designed to mea-sure the Attention construct were below .20. Afterexclusion of Item 4, all Kendall tau-b intercorrela-tions of the items that were designed to measureAttention were above .20. The mean Kendall tau-b intercorrelation coefficients between the itemsthat were designed to measure Self-Control andSelf-Monitoring and between the items that weredesigned to measure Planning and Initiative werealso all above .20.
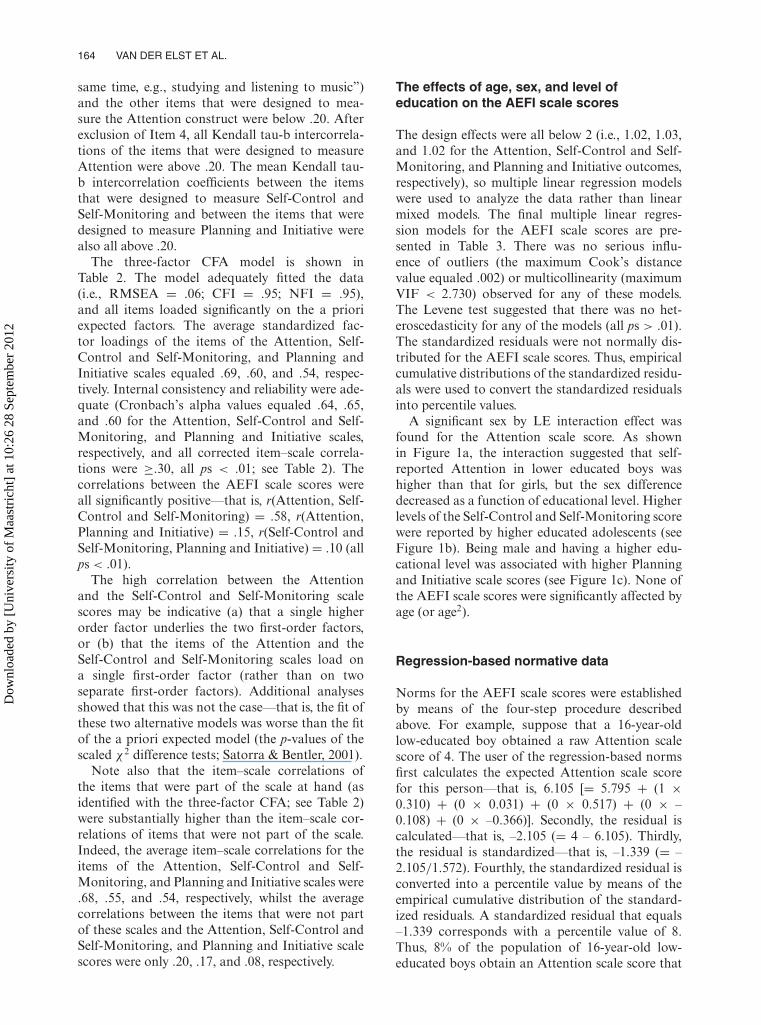
The three-factor CFA model is shown inTable 2. The model adequately fitted the data(i.e., RMSEA = .06; CFI = .95; NFI = .95),and all items loaded significantly on the a prioriexpected factors. The average standardized fac-tor loadings of the items of the Attention, Self-Control and Self-Monitoring, and Planning andInitiative scales equaled .69, .60, and .54, respec-tively. Internal consistency and reliability were ade-quate (Cronbach’s alpha values equaled .64, .65,and .60 for the Attention, Self-Control and Self-Monitoring, and Planning and Initiative scales,respectively, and all corrected item–scale correla-tions were ≥.30, all ps < .01; see Table 2). Thecorrelations between the AEFI scale scores wereall significantly positive—that is, r(Attention, Self-Control and Self-Monitoring) = .58, r(Attention,Planning and Initiative) = .15, r(Self-Control andSelf-Monitoring, Planning and Initiative) = .10 (allps < .01).
The high correlation between the Attentionand the Self-Control and Self-Monitoring scalescores may be indicative (a) that a single higherorder factor underlies the two first-order factors,or (b) that the items of the Attention and theSelf-Control and Self-Monitoring scales load ona single first-order factor (rather than on twoseparate first-order factors). Additional analysesshowed that this was not the case—that is, the fit ofthese two alternative models was worse than the fitof the a priori expected model (the p-values of thescaled χ2 difference tests; Satorra & Bentler, 2001).
Note also that the item–scale correlations ofthe items that were part of the scale at hand (asidentified with the three-factor CFA; see Table 2)were substantially higher than the item–scale cor-relations of items that were not part of the scale.Indeed, the average item–scale correlations for theitems of the Attention, Self-Control and Self-Monitoring, and Planning and Initiative scales were.68, .55, and .54, respectively, whilst the averagecorrelations between the items that were not partof these scales and the Attention, Self-Control andSelf-Monitoring, and Planning and Initiative scalescores were only .20, .17, and .08, respectively.
The effects of age, sex, and level ofeducation on the AEFI scale scores
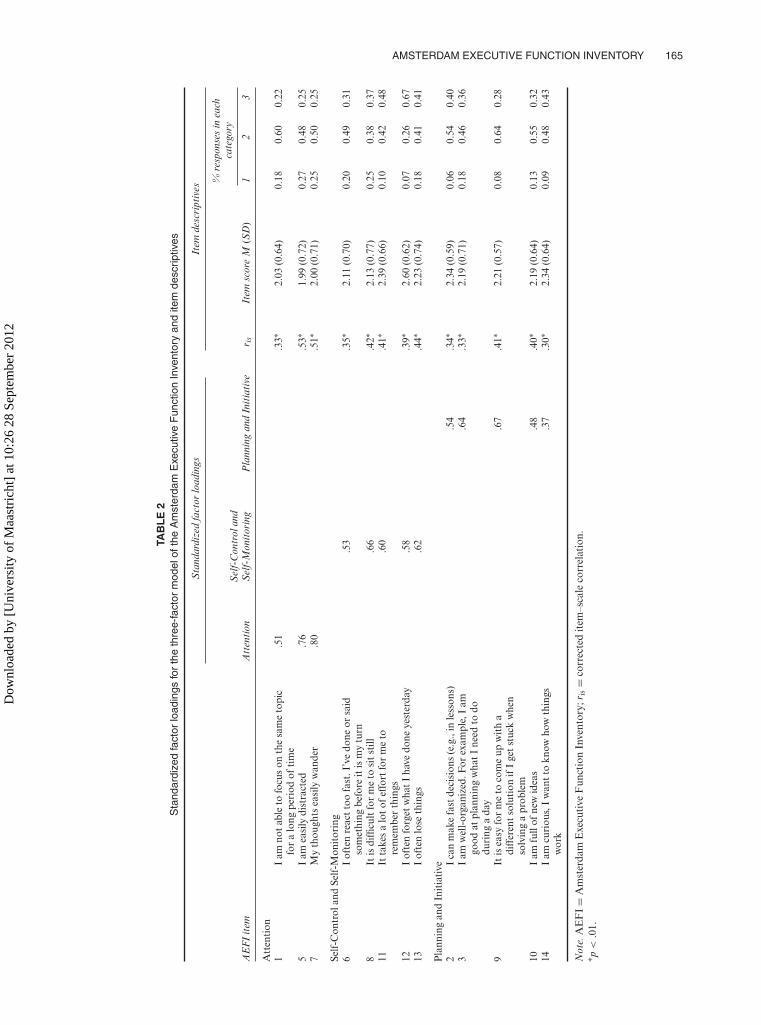
The design effects were all below 2 (i.e., 1.02, 1.03,and 1.02 for the Attention, Self-Control and Self-Monitoring, and Planning and Initiative outcomes,respectively), so multiple linear regression modelswere used to analyze the data rather than linearmixed models. The final multiple linear regres-sion models for the AEFI scale scores are pre-sented in Table 3. There was no serious influ-ence of outliers (the maximum Cook’s distancevalue equaled .002) or multicollinearity (maximumVIF < 2.730) observed for any of these models.The Levene test suggested that there was no het-eroscedasticity for any of the models (all ps > .01).The standardized residuals were not normally dis-tributed for the AEFI scale scores. Thus, empiricalcumulative distributions of the standardized residu-als were used to convert the standardized residualsinto percentile values.
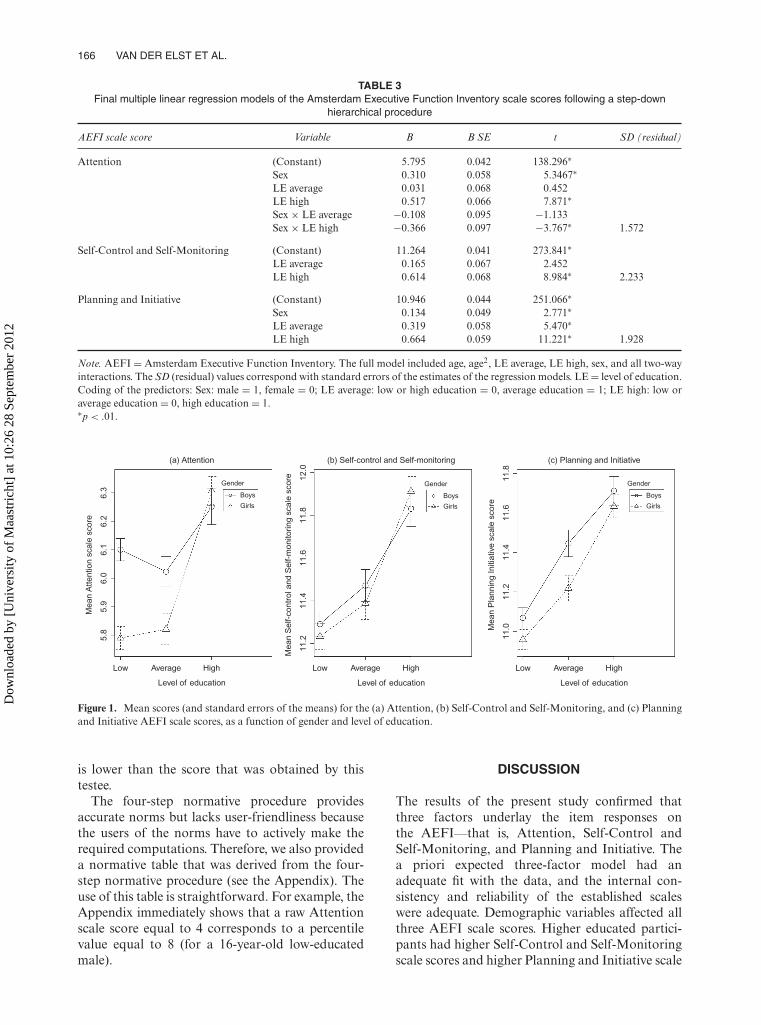
A significant sex by LE interaction effect wasfound for the Attention scale score. As shownin Figure 1a, the interaction suggested that self-reported Attention in lower educated boys washigher than that for girls, but the sex differencedecreased as a function of educational level. Higherlevels of the Self-Control and Self-Monitoring scorewere reported by higher educated adolescents (seeFigure 1b). Being male and having a higher edu-cational level was associated with higher Planningand Initiative scale scores (see Figure 1c). None ofthe AEFI scale scores were significantly affected byage (or age2).
Regression-based normative data
Norms for the AEFI scale scores were establishedby means of the four-step procedure describedabove. For example, suppose that a 16-year-oldlow-educated boy obtained a raw Attention scalescore of 4. The user of the regression-based normsfirst calculates the expected Attention scale scorefor this person—that is, 6.105 [= 5.795 + (1 ×0.310) + (0 × 0.031) + (0 × 0.517) + (0 × –0.108) + (0 × –0.366)]. Secondly, the residual iscalculated—that is, –2.105 (= 4 – 6.105). Thirdly,the residual is standardized—that is, –1.339 (= –2.105/1.572). Fourthly, the standardized residual isconverted into a percentile value by means of theempirical cumulative distribution of the standard-ized residuals. A standardized residual that equals–1.339 corresponds with a percentile value of 8.Thus, 8% of the population of 16-year-old low-educated boys obtain an Attention scale score that
Dow
nloa
ded
by [
Uni
vers
ity o
f M
aast
rich
t] a
t 10:
26 2
8 Se
ptem
ber
2012
AMSTERDAM EXECUTIVE FUNCTION INVENTORY 165
TAB
LE
2S
tand
ardi
zed
fact
orlo
adin
gsfo
rth
eth
ree-
fact
orm
odel
ofth
eA
mst
erda
mE
xecu
tive
Fun
ctio
nIn
vent
ory
and
item
desc
riptiv
es
Sta
ndar
dize
dfa
ctor
load
ings
Item
desc
ript
ives
%re
spon
ses
inea
chca
tego
ry
AE
FI
item
Att
enti
onS
elf-
Con
trol
and
Sel
f-M
onit
orin
gP
lann
ing
and
Init
iati
ver i
sIt
emsc
ore
M(S
D)
12
3
Att
enti
on1
Iam
not
able
tofo
cus
onth
esa
me
topi
cfo
ra
long
peri
odof
tim
e.5
1.3
3∗2.
03(0
.64)
0.18
0.60
0.22
5I
amea
sily
dist
ract
ed.7
6.5
3∗1.
99(0
.72)
0.27
0.48
0.25
7M
yth
ough
tsea
sily
wan
der
.80
.51∗
2.00
(0.7
1)0.
250.
500.
25
Self
-Con
trol
and
Self
-Mon
itor
ing
6I
ofte
nre
act
too
fast
.I’v
edo
neor
said
som
ethi
ngbe
fore
itis
my
turn
.53
.35∗
2.11
(0.7
0)0.
200.
490.
31
8It
isdi
fficu
ltfo
rm
eto
sit
still
.66
.42∗
2.13
(0.7
7)0.
250.
380.
3711
Itta
kes
alo
tof
effo
rtfo
rm
eto
rem
embe
rth
ings
.60
.41∗
2.39
(0.6
6)0.
100.
420.
48
12I
ofte
nfo
rget
wha
tI
have
done
yest
erda
y.5
8.3
9∗2.
60(0
.62)
0.07
0.26
0.67
13I
ofte
nlo
seth
ings
.62
.44∗
2.23
(0.7
4)0.
180.
410.
41
Pla
nnin
gan
dIn
itia
tive
2I
can
mak
efa
stde
cisi
ons
(e.g
.,in
less
ons)
.54
.34∗
2.34
(0.5
9)0.
060.
540.
403
Iam
wel
l-or
gani
zed.
For
exam
ple,
Iam
good
atpl
anni
ngw
hat
Ine
edto
dodu
ring
ada
y
.64
.33∗
2.19
(0.7
1)0.
180.
460.
36
9It
isea
syfo
rm
eto
com
eup
wit
ha
diff
eren
tso
luti
onif
Ige
tst
uck
whe
nso
lvin
ga
prob
lem
.67
.41∗
2.21
(0.5
7)0.
080.
640.
28
10I
amfu
llof
new
idea
s.4
8.4
0∗2.
19(0
.64)
0.13
0.55
0.32
14I
amcu
riou
s,I
wan
tto
know
how
thin
gsw
ork
.37
.30∗
2.34
(0.6
4)0.
090.
480.
43
Not
e.A
EF
I=
Am
ster
dam
Exe
cuti
veF
unct
ion
Inve
ntor
y;r i
s=
corr
ecte
dit
em–s
cale
corr
elat
ion.
∗ p<
.01.
Dow
nloa
ded
by [
Uni
vers
ity o
f M
aast
rich
t] a
t 10:
26 2
8 Se
ptem
ber
2012
166 VAN DER ELST ET AL.
TABLE 3Final multiple linear regression models of the Amsterdam Executive Function Inventory scale scores following a step-down
hierarchical procedure
AEFI scale score Variable B B SE t SD (residual)
Attention (Constant) 5.795 0.042 138.296∗Sex 0.310 0.058 5.3467∗LE average 0.031 0.068 0.452LE high 0.517 0.066 7.871∗Sex × LE average −0.108 0.095 −1.133Sex × LE high −0.366 0.097 −3.767∗ 1.572
Self-Control and Self-Monitoring (Constant) 11.264 0.041 273.841∗LE average 0.165 0.067 2.452LE high 0.614 0.068 8.984∗ 2.233
Planning and Initiative (Constant) 10.946 0.044 251.066∗Sex 0.134 0.049 2.771∗LE average 0.319 0.058 5.470∗LE high 0.664 0.059 11.221∗ 1.928
Note. AEFI = Amsterdam Executive Function Inventory. The full model included age, age2, LE average, LE high, sex, and all two-wayinteractions. The SD (residual) values correspond with standard errors of the estimates of the regression models. LE = level of education.Coding of the predictors: Sex: male = 1, female = 0; LE average: low or high education = 0, average education = 1; LE high: low oraverage education = 0, high education = 1.∗p < .01.
6.3
12.0
11.8
11.6
11.4
11.2
11.0
11.8
11.6
11.4
11.2
6.2
6.1
6.0
5.9
5.8
Mea
n A
ttent
ion
scal
e sc
ore
Mea
n S
elf-
cont
rol a
nd S
elf-
mon
itorin
g sc
ale
scor
e
Mea
n P
lann
ing
Initi
ativ
e sc
ale
scor
e
Low Average High
Level of education
Low Average High
Level of education
Low Average High
Level of education
(a) Attention (b) Self-control and Self-monitoring (c) Planning and Initiative
Gender
Boys
Girls
Gender
Boys
Girls
Gender
Boys
Girls
Figure 1. Mean scores (and standard errors of the means) for the (a) Attention, (b) Self-Control and Self-Monitoring, and (c) Planningand Initiative AEFI scale scores, as a function of gender and level of education.
is lower than the score that was obtained by thistestee.
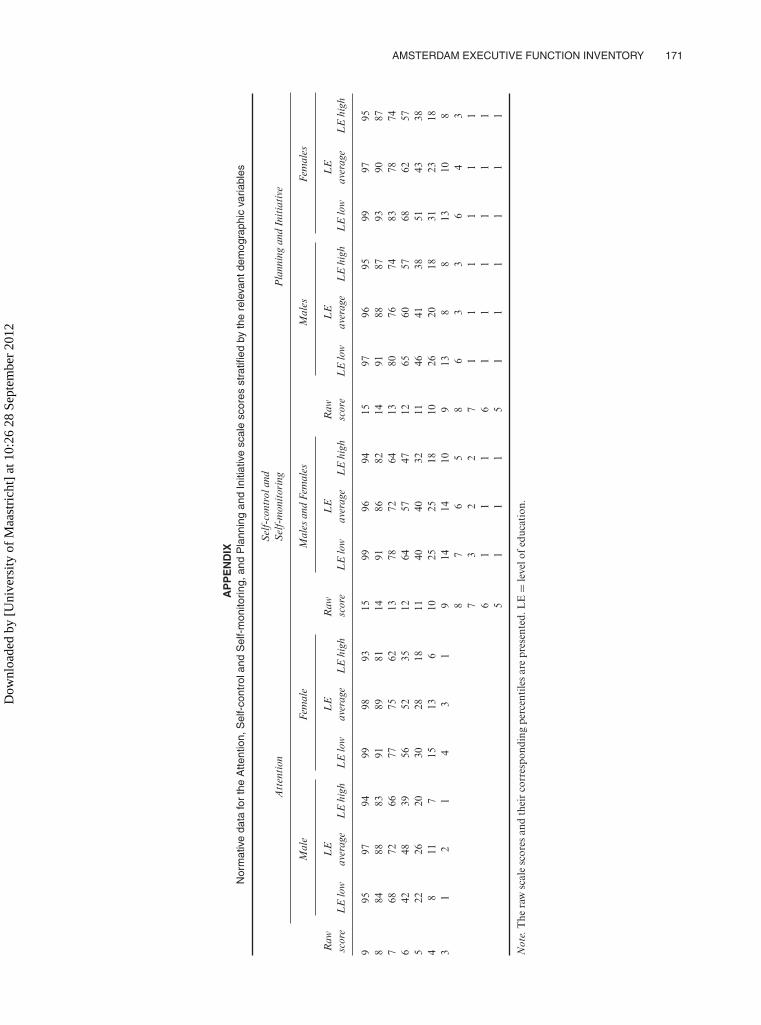
The four-step normative procedure providesaccurate norms but lacks user-friendliness becausethe users of the norms have to actively make therequired computations. Therefore, we also provideda normative table that was derived from the four-step normative procedure (see the Appendix). Theuse of this table is straightforward. For example, theAppendix immediately shows that a raw Attentionscale score equal to 4 corresponds to a percentilevalue equal to 8 (for a 16-year-old low-educatedmale).
DISCUSSION
The results of the present study confirmed thatthree factors underlay the item responses onthe AEFI—that is, Attention, Self-Control andSelf-Monitoring, and Planning and Initiative. Thea priori expected three-factor model had anadequate fit with the data, and the internal con-sistency and reliability of the established scaleswere adequate. Demographic variables affected allthree AEFI scale scores. Higher educated partici-pants had higher Self-Control and Self-Monitoringscale scores and higher Planning and Initiative scale
Dow
nloa
ded
by [
Uni
vers
ity o
f M
aast
rich
t] a
t 10:
26 2
8 Se
ptem
ber
2012
AMSTERDAM EXECUTIVE FUNCTION INVENTORY 167
scores than their lower educated counterparts. Theeffect of educational level on the Attention scalescore was moderated by gender: Boys had higherlevels of self-reported Attention scores than girlsin the group of lower educated participants, butthe gender differences in the Attention scale scoresdecreased as the educational level of the childrenincreased (see Figure 1a). Previous studies in whichthe moderating effects of (parental) level of educa-tion on performance-based measures of executivefunctioning were evaluated in children and earlyadolescents (aged below 14 years) showed simi-lar results (Ardila et al., 2005; Klenberg et al.,2001; Noble et al., 2005). Moreover, males obtainedhigher Planning and Initiative scale scores thanfemales. This finding is in line with previous stud-ies (Ardila et al., 2005; Brocki & Bohlin, 2004),though not all studies have reported better exec-utive functions in males (female advantages havealso been reported, especially when the executivefunction tests used rely strongly on verbal abilities;Anderson et al., 2001; Berlin & Bohlin, 2002).
The specific patterns of association between gen-der, level of education, and the different compo-nents of executive functioning as measured withthe AEFI are unclear, especially because genderand level of education are proxies of multiple fac-tors that may affect executive abilities—includingenvironmental and social variables, personalitytraits (such as cautiousness), and verbal abilities(Klenberg et al., 2001; Noble et al., 2005). One wayto evaluate these patterns of association in moredetail would be through the explicit measurementand modeling of these proxy variables together withthe demographical variables and the AEFI scalescores in a series of structural equation models. Thisis beyond the scope of the present paper (for a dis-cussion on the mechanisms underlying the effects ofgender and educational level on aspects of execu-tive functioning, see, e.g., Klenberg et al., 2001, andNoble et al., 2005), but from a psychometric view-point the finding that level of education and genderaffect the AEFI scale scores implies that demo-graphically corrected normative data for the AEFIscale scores are required to adequately interpret thescale scores (see the Appendix).
The Attention and the Self-Control and Self-Monitoring AEFI scale scores were highly corre-lated, which could be indicative (a) that a singlehigher order factor underlay these two first-orderfactors, or (b) that the items of these two scalesloaded on a single first-order factor (rather thanon two separate factors), but additional analysesshowed that this was not the case. The patternof results is in agreement with previous studies inwhich it was concluded that executive functions
comprise multiple components, which are relatedbut yet separable. Note also that the differentialeffects of gender and educational level on the differ-ent AEFI scale scores (see Table 3) further indicatethat the different components of executive function-ing as measured with the AEFI are indeed separable(i.e., if it were the case that a single unitary executivefunction factor would underlie all item responses,then it would also be expected that all three AEFIscale scores would be influenced in a similar way bygender and/or level of education, which was not thecase).
Some critical remarks and limitations of thepresent study can be given. First, the results of theCFA provided support for the construct validity ofthe AEFI (i.e., the obtained factor structure wasconsistent with the a priori expected model; Floyd& Widaman, 1995), but other types of validity werenot evaluated. Future studies are needed to estab-lish other types of validity of the AEFI, especiallyits discriminant, predictive, and ecological validity.For example, it has been suggested that executivefunction measures may allow for a better predictionof school performance than do more general cogni-tive indices (such as IQ; Best, Miller, & Jones, 2009).Future studies should evaluate this issue.
Second, after exclusion of a poorly fitting item(Item 4), the Attention scale of the AEFI consistedof only three items. There are both advantagesand disadvantages of shorter and longer scales.For example, longer scales usually have betterpsychometric properties (e.g., higher Cronbach’salpha values), whilst shorter scales take up lessprecious space on a survey and increase compli-ance of test-takers. Three items per scale is usuallyconsidered to be the minimum number of itemsin a multidimensional instrument (Raubenheimer,2004), at least when the scale has an adequate levelof reliability—which was the case for all scales ofthe AEFI.
Third, age and age2 did not affect any of theAEFI scale scores. The age range that was con-sidered in the present study was, however, quitenarrow (i.e., 15–18 years), which raises the pos-sibility that the insignificant results may (partly)be attributable to the restricted age variability inthe sample. This was, however, probably not thecase, because our results are in line with earlierstudies that showed that improvements in executivefunctioning mainly occur in younger children andin early adolescents (aged below 14 years), with lit-tle or no improvement afterwards (Anderson et al.,2001; Ardila et al., 2005; Blakemore & Choudhury,2006; Brocki & Bohlin, 2004; Levin et al., 1991;Welsh et al., 1991). Nevertheless, future studiesshould administer the AEFI in a sample that has
Dow
nloa
ded
by [
Uni
vers
ity o
f M
aast
rich
t] a
t 10:
26 2
8 Se
ptem
ber
2012
168 VAN DER ELST ET AL.
a broader age range (e.g., 10–25 years) to fur-ther examine this issue. Note that such a studywould also allow for an evaluation of the AEFI’svalidity to detect the developmental improvementsin executive functions during childhood and earlyadolescence.
Fourth, the valid use of self-report questionnairesrequires that the respondents have sufficient read-ing skills, have insight into their own problems, haveperspective-taking skills, and have sufficient cog-nitive abilities to understand and reflect upon thequestions (Finlay & Lyons, 2001; Theunissen et al.,1998). These conditions may not be fulfilled in,for example, younger children or in children withcognitive impairments. It would thus be advanta-geous to have an informant-based AEFI versionin addition to the self-report version. At present,a parental-report version of the AEFI is beingdeveloped.
Fifth, the distribution of educational level in oursample deviated from the population distribution(i.e., 46.3%, 27.3%, and 26.4% of the children inthe sample had low, average, and high levels of edu-cation, respectively, as compared to 54.9%, 22.1%,and 23.0% in the general population of 15–18-year-old children; Kuyper et al., 2010). This differenceis, however, not a problem, because all analyses andthe derived normative data were corrected for LE.On a related note, the imbalance in the numberof participants in the educational categories (i.e.,n = 2,948, n = 1,742, and n = 1,676 for low-,average-, and high-educated participants, respec-tively) is not a problem when a regression-basednormative procedure is used, because any imbal-ance in the sample does not bias the estimationof the regression weights as long as the model isproperly specified (i.e., as long as educational levelis included in the model, if it is truly associatedwith the outcomes; Kleinbaum, Kupper, Muller, &Nizam, 1998). The use of imbalanced data may leadto a loss of statistical power (because the standarderror of the regression weight is proportional tothe
√VIF of the predictor at hand), but this was
not a problem in the present study because LE wassignificant in all models.
In conclusion, the AEFI is a newly developedbrief self-report questionnaire to assess differentexecutive aspects of daily-life behavior. Based on alarge sample of adolescents (aged between 15 and18 years), we found that gender and educationallevel affected the different AEFI scale scores.Normative data that took these demographicalvariables into account were established, so that theAEFI can be used by clinicians and researchers who
need to assess executive aspects of daily-life behav-ior. Additional psychometric analyses supportedthe reliability and the construct validity of theAEFI.
Original manuscript received 15 April 2011Revised manuscript accepted 6 July 2011
First published online 24 November 2011
REFERENCES
Aiken, L. S., & West, S. G. (1991). Multiple regression:Testing and interpreting interactions. Newbury Park,CA: Sage.
Anderson, V. A., Anderson, P., Northam, E., Jacobs,R., & Catroppa, C. (2001). Development of executivefunctions through late childhood and adoles-cence in an Australian sample. DevelopmentalNeuropsychology, 20, 385–406.
Ardila, A., Rosselli, M., Matute, E., & Guajardo, S.(2005). The influence of the parents’ educationallevel on the development of executive functions.Developmental Neuropsychology, 28, 539–560.
Belsley, D. A., Kuh, E., & Welsch, R. E. (1980).Regression diagnostics: Identifying influential data andsources of collinearity. New York, NY: Wiley.
Bentler, P. M. (1990). Comparative fit indexes in struc-tural models. Psychological Bulletin, 107, 238–246.
Bentler, P. M., & Bonett, D. G. (1980). Significancetests and goodness of fit in the analysis of covariancestructures. Psychological Bulletin, 88, 588–606.
Berlin, L., & Bohlin, G. (2002). Response inhibition,hyperactivity, and conduct problems among preschoolchildren. Journal of Clinical Child and AdolescentPsychology, 31, 242–251.
Best, J. R., Miller, P. H., & Jones, L. L. (2009).Executive functions after age 5: Changes and corre-lates. Developmental Review, 29, 180–200.
Biederman, J., Petty, C. R., Fried, R., Black, S., Faneuil,A., Doyle, A. E., et al. (2008). Discordance betweenpsychometric testing and questionnaire-based def-initions of executive function deficits in individu-als with ADHD. Journal of Attention Disorders, 12,92–102.
Blakemore, S., & Choudhury, S. (2006). Development ofthe adolescent brain: Implications for executive func-tion and social cognition. Journal of Child Psychologyand Psychiatry, 47, 296–312.
Brocki, K. C., & Bohlin, G. (2004). Executive functionsin children aged 6 to 13: A dimensional and devel-opmental study. Developmental Neuropsychology, 26,571–593.
Browne, M. W., & Cudeck, R. (1993). Alternative ways ofassessing model fit. Sociological Methods & Research,21, 230–258.
Capitani, E. (1997). Normative data and neuropsy-chological assessment. Common problems in clin-ical practice and research. NeuropsychologicalRehabilitation, 7, 295–309.
Chaytor, N., & Schmitter-Edgecombe, M. (2003). Theecological validity of neuropsychological tests: A
Dow
nloa
ded
by [
Uni
vers
ity o
f M
aast
rich
t] a
t 10:
26 2
8 Se
ptem
ber
2012
AMSTERDAM EXECUTIVE FUNCTION INVENTORY 169
review of the literature on everyday cognitive skills.Neuropsychology Review, 13, 181–197.
Chaytor, N., Schmitter-Edgecombe, M., & Burr, R.(2006). Improving the ecological validity of exec-utive functioning assessment. Archives of ClinicalNeuropsychology, 21, 217–227.
Clark, L. A., & Watson, D. (1995). Constructing valid-ity: Basic issues in objective scale development.Psychological Assessment, 7, 309–319.
Dekovic, M., Janssens, J. M. A. M., & Gerris, J. R.M. (1991). Factor structure and construct validity ofthe Block Child Rearing Practices Report (CRPR).Psychological Assessment, 3, 182–187.
Emslie, H., Wilson, F., Burden, V., Nimmo-Smith, I.,& Wilson, B. A. (2003). Behavioural Assessmentof the Dysexecutive Syndrome for Children(BADS-C). London, UK: Harcourt Assessment/ThePsychological Corporation.
Ferketich, S. (1991). Focus on psychometrics. Aspectsof item analysis. Research in Nursing and Health, 14,165–168.
Finlay, W. M. L., & Lyons, E. (2001). Methodologicalissues in interviewing and using self-report ques-tionnaires with people with mental retardation.Psychological Assessment, 13, 319–335.
Floyd, F. J., & Widaman, K. F. (1995). Factor anal-ysis in the development and refinement of clinicalassessment instruments. Psychological Assessment, 7,286–299.
Gioia, G. A., Isquith, P. K., Guy, S. C., & Kenworthy,L. (2000). Behavior Rating Inventory of ExecutiveFunction (BRIEF): Professional manual. Lutz, FL:Psychological Assessment Resources.
Henry, L. A., & Bettenay, C. (2010). The assess-ment of executive functioning in children. Child andAdolescent Mental Health, 15, 110–119.
Holden, R. R., Fekken, G. C., & Cotton, D. H. G.(1991). Assessing psychopathology using structuredtest-item response latencies. Psychological Assessment,3, 111–118.
Huizinga, M., & Smidts, D. P. (2011). Age-relatedchanges in executive function: A normative study withthe Dutch version of the Behavior Rating Inventory ofExecutive Function (BRIEF). Child Neuropsychology,17, 51–66.
Isquith, P. K., Crawford, J. S., Espy, K. A., &Gioia, G. A. (2005). Assessment of executive func-tions in preschool-aged children. Mental Retardationand Developmental Disabilities Research Reviews, 11,209–215.
Jöreskog, K. G., & Sörbom, D. (1996). LISREL 8:Structural equation modeling with the SIMPLIS com-mand language. Chicago, IL: Scientific SoftwareInternational.
Jurado, M. B., & Rosselli, M. (2007). The elusive natureof executive functions: A review of our current under-standing. Neuropsychology Review, 17, 213–233.
Kleinbaum, D. G., Kupper, L. L., Muller, K. E., &Nizam, A. (1998). Applied regression analysis andother multivariate methods (3rd ed.). New York, NY:Duxberry Press.
Klenberg, L., Korkman, K., & Lahti-Nuuttila, P. (2001).Differential development of attention and execu-tive functions in 3- to 12-year-old Finnish children.Developmental Neuropsychology, 20, 407–428.
Kutner, M. H., Nachtsheim, C. J., Neter, J., & Li, W.(2005). Applied linear statistical models (5th ed.). NewYork, NY: McGraw Hill.
Kuyper, H., Keuning, J., & Zijsling, D. (2010).Basisrapport eerste meting van COOL5–18 in het derdeleerjaar van het voortgezet onderwijs [A report onthe first wave of the COOL5–18]. Groningen, TheNetherlands: GION/Cito.
Levin, H. S., Culhane, K., Hartmann, J., Evankovich,K., Mattson, A. J., Harward, H., et al. (1991).Developmental changes in performance on tests ofpurported frontal lobe functioning. DevelopmentalNeuropsychology, 7, 377–395.
Lezak, M. D., Howieson, D. B., & Loring, D. W. (2004).Neuropsychological assessment (4th ed.). New York,NY: Oxford University Press.
Muthén, B., & Satorra, A. (1995). Complex sample datain structural equation modeling. In P. V. Marsden(Ed.), Sociological methodology (pp. 267–316).Oxford, UK: Blackwell.
Noble, K. G., Norman, M. F., & Farah, M. J. (2005).Neurocognitive correlates of socioeconomic statusin kindergarten children. Developmental Science, 8,74–87.
R Development Core Team. (2010). R: A language andenvironment for statistical computing. Vienna, Austria:R Foundation for Statistical Computing. Retrievedfrom http://www.R-project.org/.
Raubenheimer, J. (2004). An item selection procedure tomaximise scale reliability and validity. South AfricanJournal of Industrial Psychology, 30, 59–64.
Rebok, G. W., Smith, C. B., Pascualvaca, D. M., Mirsky,A. F., Anthony, B. J., & Kellam, S. G. (1997).Developmental changes in attentional performancein urban children from eight to thirteen years. ChildNeuropsychology, 3, 28–46.
Saboya, E., Coutinho, G., Segenreich, D, Ayrão, V., &Mattos, P. (2009). Lack of executive function deficitsamong adult ADHD individuals from a Brazilian clin-ical sample. Dementia & Neuropsychologia, 3, 34–37.
Satorra, A., & Bentler, P. M. (2001). A scaled differencechi-square test statistic for moment structure analysis.Psychometrika, 66, 507–514.
Stroop, J. R. (1935). Studies of interference in serial ver-bal reactions. Journal of Experimental Psychology, 18,643–662.
Theunissen, N. C. M., Vogels, T. G. C., Koopman, H. M.,Verrips, G. H. W., Zwinderman, K. A. H., & Verloove-Vanhorick, S. P. (1998). The proxy problem: Childreport versus parent report in health-related qualityof life research. Quality of Life Research, 7, 387–397.
Van Breukelen, G. J. P., & Vlaeyen, J. W. S. (2005).Norming clinical questionnaires with multipleregression: The Pain Cognition List. PsychologicalAssessment, 17, 336–344.
Van der Elst, W. (2006). The neuropsychometrics of aging.Normative studies in the Maastricht Aging Study.Maastricht, The Netherlands: Neuropsy Publishers.
Van der Elst, W., Van Boxtel, M. P. J., Van Breukelen,G. J. P., & Jolles, J. (2006a). Normative data forthe Animal, Profession and Letter M Naming ver-bal fluency tests for Dutch speaking participantsand the effects of age, education, and sex. Journalof the International Neuropsychological Society, 12,80–89.
Dow
nloa
ded
by [
Uni
vers
ity o
f M
aast
rich
t] a
t 10:
26 2
8 Se
ptem
ber
2012
170 VAN DER ELST ET AL.
Van der Elst, W., Van Boxtel, M. P. J., Van Breukelen,G. J. P., & Jolles, J. (2006b). The Stroop Color–WordTest: Influence of age, sex, and education; and norma-tive data for a large sample across the adult age range.Assessment, 13, 62–79.
Van der Elst, W., Van Boxtel, M. P. J., Van Breukelen,G. J. P., & Jolles, J. (2008). A large scale cross-sectionaland longitudinal study into the ecological validityof neuropsychological test measures in neurologically
intact people. Archives of Clinical Neuropsychology,23, 787–800.
Welsh, M. C., Pennington, B. F., & Groisser, D. B. (1991).A normative-developmental study of executive func-tions: A window on prefrontal functions in children.Developmental Neuropsychology, 7, 131–149.
Wood, R., L., & Liossi, C. (2006). The ecological validityof executive tests in a severely brain injured sample.Archives of Clinical Neuropsychology, 21, 429–437.
Dow
nloa
ded
by [
Uni
vers
ity o
f M
aast
rich
t] a
t 10:
26 2
8 Se
ptem
ber
2012
AMSTERDAM EXECUTIVE FUNCTION INVENTORY 171
AP
PE
ND
IXN
orm
ativ
eda
tafo
rth
eA
ttent
ion,
Sel
f-co
ntro
land
Sel
f-m
onito
ring,
and
Pla
nnin
gan
dIn
itiat
ive
scal
esc
ores
stra
tified
byth
ere
leva
ntde
mog
raph
icva
riabl
es
Att
enti
onS
elf-
cont
rola
ndS
elf-
mon
itor
ing
Pla
nnin
gan
dIn
itia
tive
Mal
eFe
mal
eM
ales
and
Fem
ales
Mal
esFe
mal
es
Raw
scor
eL
Elo
wL
Eav
erag
eL
Ehi
ghL
Elo
wL
Eav
erag
eL
Ehi
ghR
awsc
ore
LE
low
LE
aver
age
LE
high
Raw
scor
eL
Elo
wL
Eav
erag
eL
Ehi
ghL
Elo
wL
Eav
erag
eL
Ehi
gh
995
9794
9998
9315
9996
9415
9796
9599
9795
884
8883
9189
8114
9186
8214
9188
8793
9087
768
7266
7775
6213
7872
6413
8076
7483
7874
642
4839
5652
3512
6457
4712
6560
5768
6257
522
2620
3028
1811
4040
3211
4641
3851
4338
48
117
1513
610
2525
1810
2620
1831
2318
31
21
43
19
1414
109
138
813
108
87
65
86
33
64
37
32
27
11
11
11
61
11
61
11
11
15
11
15
11
11
11
Not
e.T
hera
wsc
ale
scor
esan
dth
eir
corr
espo
ndin
gpe
rcen
tile
sar
epr
esen
ted.
LE
=le
velo
fed
ucat
ion.
Dow
nloa
ded
by [
Uni
vers
ity o
f M
aast
rich
t] a
t 10:
26 2
8 Se
ptem
ber
2012
Copyright © 2022 FDOKUMEN