The activity of flavonoids extracted from Tanacetum microphyllum DC. (Compositae) on soybean...
10
Loss of acetylation at Lys16 and trimethylation at Lys20 of histone H4 is a common hallmark of human cancer Mario F Fraga 1 , Esteban Ballestar 1 , Ana Villar-Garea 1 , Manuel Boix-Chornet 1 , Jesus Espada 1 , Gunnar Schotta 2 , Tiziana Bonaldi 3 , Claire Haydon 4 , Santiago Ropero 1 , Kevin Petrie 1 , N Gopalakrishna Iyer 5 , Alberto Pe ´rez-Rosado 6 , Enrique Calvo 7 , Juan A Lopez 7 , Amparo Cano 8 , Maria J Calasanz 9 , Dolors Colomer 10 , Miguel A ´ ngel Piris 6 , Natalie Ahn 4,11 , Axel Imhof 3 , Carlos Caldas 5 , Thomas Jenuwein 2 & Manel Esteller 1 CpG island hypermethylation and global genomic hypomethylation are common epigenetic features of cancer cells. Less attention has been focused on histone modifications in cancer cells. We characterized post-translational modifications to histone H4 in a comprehensive panel of normal tissues, cancer cell lines and primary tumors. Using immunodetection, high-performance capillary electrophoresis and mass spectrometry, we found that cancer cells had a loss of monoacetylated and trimethylated forms of histone H4. These changes appeared early and accumulated during the tumorigenic process, as we showed in a mouse model of multistage skin carcinogenesis. The losses occurred predominantly at the acetylated Lys16 and trimethylated Lys20 residues of histone H4 and were associated with the hypomethylation of DNA repetitive sequences, a well-known characteristic of cancer cells. Our data suggest that the global loss of monoacetylation and trimethylation of histone H4 is a common hallmark of human tumor cells. Epigenetics has become an increasingly important aspect of cancer biology. From the first observation of global genomic hypomethylation in tumors 1,2 to the identification of genes that are transcriptionally silenced in cancer cells by CpG island promoter hypermethylation 3–6 and the translational use of DNA demethylating agents 7 , cancer epigenetics has focused mainly on aberrant DNA methylation. But changes in DNA methylation observed in transformed cells are not isolated events: they occur in the context of more complex epigenetic deregulation. DNA methylation is associated with the formation of nuclease-resistant chromatin 8 , and DNA methyltransferases and methyl-CpG binding proteins are associated with histone deacetylases (HDACs) and histone methyltransferases 9,10 . This intimate relationship between DNA methylation and other components of the epigenetic layer, such as histones, is also expected to be disrupted in cancer cells. Acetylation and methylation of lysine residues in the tails of nucleosomal core histones has a crucial role in chromatin packaging and gene expression 10,11 . Overall, histone hypoacetylation and hyper- methylation is characteristic of DNA sequences that are methylated and repressed in normal cells 12,13 . Each lysine residue can be a marker for a different signal. In this regard, Lys16 of histone H4 (H4-Lys16) behaves differently from the other acetylated residues: its distribution is similar in the X chromosome and in autosomes 14 ; it provides a barrier to the spreading of histone hypoacetylation and silencing 15 ; and it is associated with differential binding of transcription factors 16 . The only lysine that is methylated in the tail of histone H4 is Lys20 (H4-Lys20). Trimethylation of H4-Lys20 is a marker of constitutive heterochromatin 17,18 , gene silencing 17,18 and aging 19 . We are largely ignorant of how these histone modifications are disrupted in cancer cells. Hypermethylated promoter CpG islands of transcriptionally repressed tumor-suppressor genes are associated with hypoacetylated and hypermethylated histones 20–22 . Certain genes with tumor suppressor–like properties, such as CDKN1A (also called p21 WAF1 ), are transcriptionally silent, without CpG island hyper- methylation, in association with hypoacetylated and hypermethylated histones 23,24 . But no profile of overall histone modifications and their genomic locations in the transformed cell has been identified. It is important to determine this histone modification pattern, because HDAC inhibitors are being developed as anticancer drugs 25 . Here, we comprehensively examined the modification patterns of histone H4 in human normal tissues and cancer cells. Published online 13 March 2005; doi:10.1038/ng1531 1 Cancer Epigenetics Laboratory, Molecular Pathology Program, Spanish National Cancer Center, Melchor Ferna ´ndez Almagro 3, 28029 Madrid, Spain. 2 Research Institute of Molecular Pathology, The Vienna Biocenter, A-1030 Vienna, Austria. 3 Histone Modifications Group, Ludwig-Maximillians Universita ¨t Mu ¨nchen, Munich, Germany. 4 Department of Chemistry and Biochemistry, University of Colorado, Boulder, Colorado, USA. 5 Cancer Genomics Program, Department of Oncology, University of Cambridge, Hutchison/MRC Research Centre, Hills Road, Cambridge CB2 2XZ, UK. 6 Lymphoma Laboratory, Molecular Pathology Program, Spanish National Cancer Center, Madrid, Spain. 7 Proteomics Unit, Fundacio ´n Centro Nacional de Investigaciones Cardiovasculares, Madrid, Spain. 8 Biochemistry Department, School of Medicine, Universidad Auto ´noma de Madrid, Instituto de Investigaciones Biome ´dicas, Madrid, Spain. 9 Department of Genetics, School of Science, University of Navarra, Pamplona, Spain. 10 Hematopathology Unit, Hospital Clinic, University of Barcelona, Catalonia, Spain. 11 The Howard Hughes Medical Institute, Department of Chemistry and Biochemistry, University of Colorado, Boulder, Colorado, USA. Correspondence should be addressed to M.E. ([email protected]). NATURE GENETICS VOLUME 37 [ NUMBER 4 [ APRIL 2005 391 ARTICLES © 2005 Nature Publishing Group http://www.nature.com/naturegenetics
-
Upload
independent -
Category
Documents
-
view
0 -
download
0
Transcript of The activity of flavonoids extracted from Tanacetum microphyllum DC. (Compositae) on soybean...
Loss of acetylation at Lys16 and trimethylation at Lys20of histone H4 is a common hallmark of human cancerMario F Fraga1, Esteban Ballestar1, Ana Villar-Garea1, Manuel Boix-Chornet1, Jesus Espada1,Gunnar Schotta2, Tiziana Bonaldi3, Claire Haydon4, Santiago Ropero1, Kevin Petrie1, N Gopalakrishna Iyer5,Alberto Perez-Rosado6, Enrique Calvo7, Juan A Lopez7, Amparo Cano8, Maria J Calasanz9, Dolors Colomer10,Miguel Angel Piris6, Natalie Ahn4,11, Axel Imhof3, Carlos Caldas5, Thomas Jenuwein2 & Manel Esteller1
CpG island hypermethylation and global genomic hypomethylation are common epigenetic features of cancer cells. Less attentionhas been focused on histone modifications in cancer cells. We characterized post-translational modifications to histone H4 in acomprehensive panel of normal tissues, cancer cell lines and primary tumors. Using immunodetection, high-performance capillaryelectrophoresis and mass spectrometry, we found that cancer cells had a loss of monoacetylated and trimethylated forms ofhistone H4. These changes appeared early and accumulated during the tumorigenic process, as we showed in a mouse modelof multistage skin carcinogenesis. The losses occurred predominantly at the acetylated Lys16 and trimethylated Lys20 residuesof histone H4 and were associated with the hypomethylation of DNA repetitive sequences, a well-known characteristic ofcancer cells. Our data suggest that the global loss of monoacetylation and trimethylation of histone H4 is a common hallmarkof human tumor cells.
Epigenetics has become an increasingly important aspect of cancerbiology. From the first observation of global genomic hypomethylationin tumors1,2 to the identification of genes that are transcriptionallysilenced in cancer cells by CpG island promoter hypermethylation3–6
and the translational use of DNA demethylating agents7, cancerepigenetics has focused mainly on aberrant DNA methylation. Butchanges in DNA methylation observed in transformed cells are notisolated events: they occur in the context of more complex epigeneticderegulation. DNA methylation is associated with the formation ofnuclease-resistant chromatin8, and DNA methyltransferases andmethyl-CpG binding proteins are associated with histone deacetylases(HDACs) and histone methyltransferases9,10. This intimate relationshipbetween DNA methylation and other components of the epigeneticlayer, such as histones, is also expected to be disrupted in cancer cells.
Acetylation and methylation of lysine residues in the tails ofnucleosomal core histones has a crucial role in chromatin packagingand gene expression10,11. Overall, histone hypoacetylation and hyper-methylation is characteristic of DNA sequences that are methylatedand repressed in normal cells12,13. Each lysine residue can be a markerfor a different signal. In this regard, Lys16 of histone H4 (H4-Lys16)
behaves differently from the other acetylated residues: its distributionis similar in the X chromosome and in autosomes14; it provides abarrier to the spreading of histone hypoacetylation and silencing15;and it is associated with differential binding of transcription factors16.The only lysine that is methylated in the tail of histone H4 is Lys20(H4-Lys20). Trimethylation of H4-Lys20 is a marker of constitutiveheterochromatin17,18, gene silencing17,18 and aging19.
We are largely ignorant of how these histone modifications aredisrupted in cancer cells. Hypermethylated promoter CpG islands oftranscriptionally repressed tumor-suppressor genes are associated withhypoacetylated and hypermethylated histones20–22. Certain genes withtumor suppressor–like properties, such as CDKN1A (also calledp21WAF1), are transcriptionally silent, without CpG island hyper-methylation, in association with hypoacetylated and hypermethylatedhistones23,24. But no profile of overall histone modifications and theirgenomic locations in the transformed cell has been identified. It isimportant to determine this histone modification pattern, becauseHDAC inhibitors are being developed as anticancer drugs25. Here, wecomprehensively examined the modification patterns of histone H4in human normal tissues and cancer cells.
Published online 13 March 2005; doi:10.1038/ng1531
1Cancer Epigenetics Laboratory, Molecular Pathology Program, Spanish National Cancer Center, Melchor Fernandez Almagro 3, 28029 Madrid, Spain.2Research Institute of Molecular Pathology, The Vienna Biocenter, A-1030 Vienna, Austria. 3Histone Modifications Group, Ludwig-Maximillians UniversitatMunchen, Munich, Germany. 4Department of Chemistry and Biochemistry, University of Colorado, Boulder, Colorado, USA. 5Cancer Genomics Program,Department of Oncology, University of Cambridge, Hutchison/MRC Research Centre, Hills Road, Cambridge CB2 2XZ, UK. 6Lymphoma Laboratory, MolecularPathology Program, Spanish National Cancer Center, Madrid, Spain. 7Proteomics Unit, Fundacion Centro Nacional de Investigaciones Cardiovasculares, Madrid,Spain. 8Biochemistry Department, School of Medicine, Universidad Autonoma de Madrid, Instituto de Investigaciones Biomedicas, Madrid, Spain. 9Departmentof Genetics, School of Science, University of Navarra, Pamplona, Spain. 10Hematopathology Unit, Hospital Clinic, University of Barcelona, Catalonia, Spain.11The Howard Hughes Medical Institute, Department of Chemistry and Biochemistry, University of Colorado, Boulder, Colorado, USA. Correspondence should beaddressed to M.E. ([email protected]).
NATURE GENETICS VOLUME 37 [ NUMBER 4 [ APRIL 2005 39 1
A R T I C L E S©
2005
Nat
ure
Pub
lishi
ng G
roup
ht
tp://
ww
w.n
atur
e.co
m/n
atur
egen
etic
s
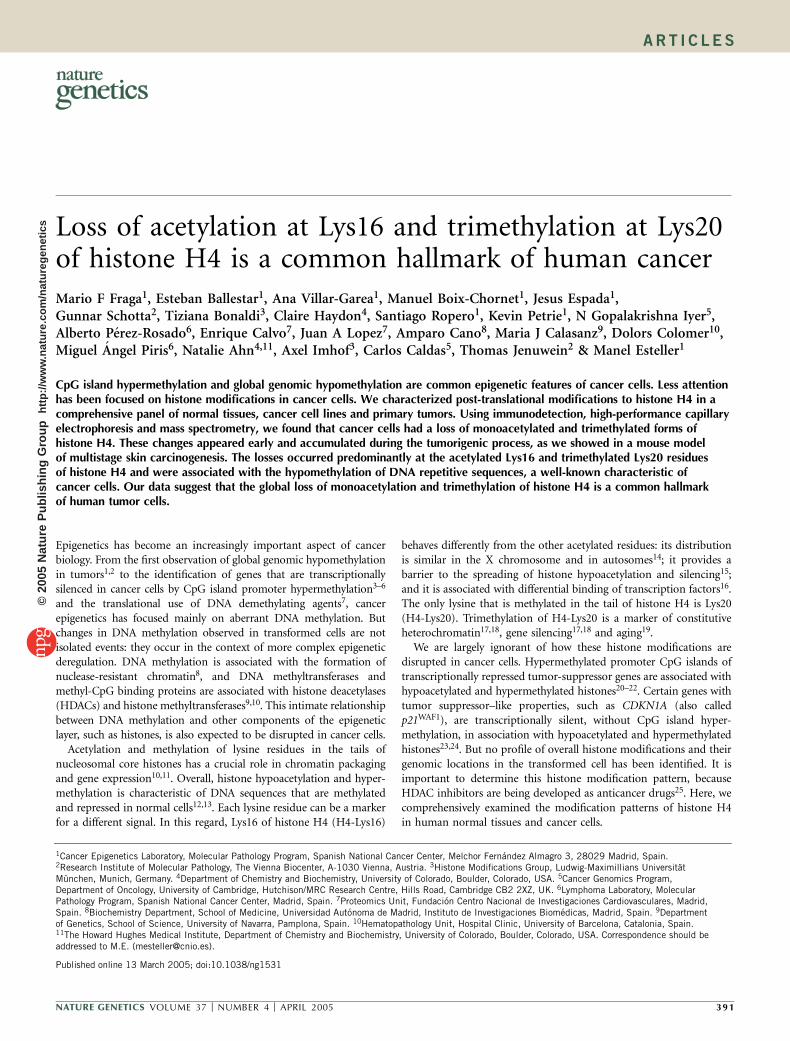
RESULTSLoss of monoacetylation and trimethylation of H4 in cancerWe first compared histone modification patterns in the tail of histoneH4 in normal lymphocytes (n ¼ 80) versus transformed cells fromleukemia cell lines, such as HL60 and Jurkat. We purified histone H4using high-performance liquid chromatography (HPLC) and exam-ined the eluted fraction by high-performance capillary electrophoresis(HPCE)26 and liquid chromatography–electrospray mass spectrome-try (LC-ES/MS)27 (Fig. 1). In the HPCE analysis, each of the non-,mono-, di-, tri- and tetra-acetylated histone derivatives appeared as adoublet of peaks (Fig. 1). The first and second peaks of the doubletwere identified as di- and trimethylated histone H4, respectively, byLC-ES/MS analysis of the same samples (Fig. 1).
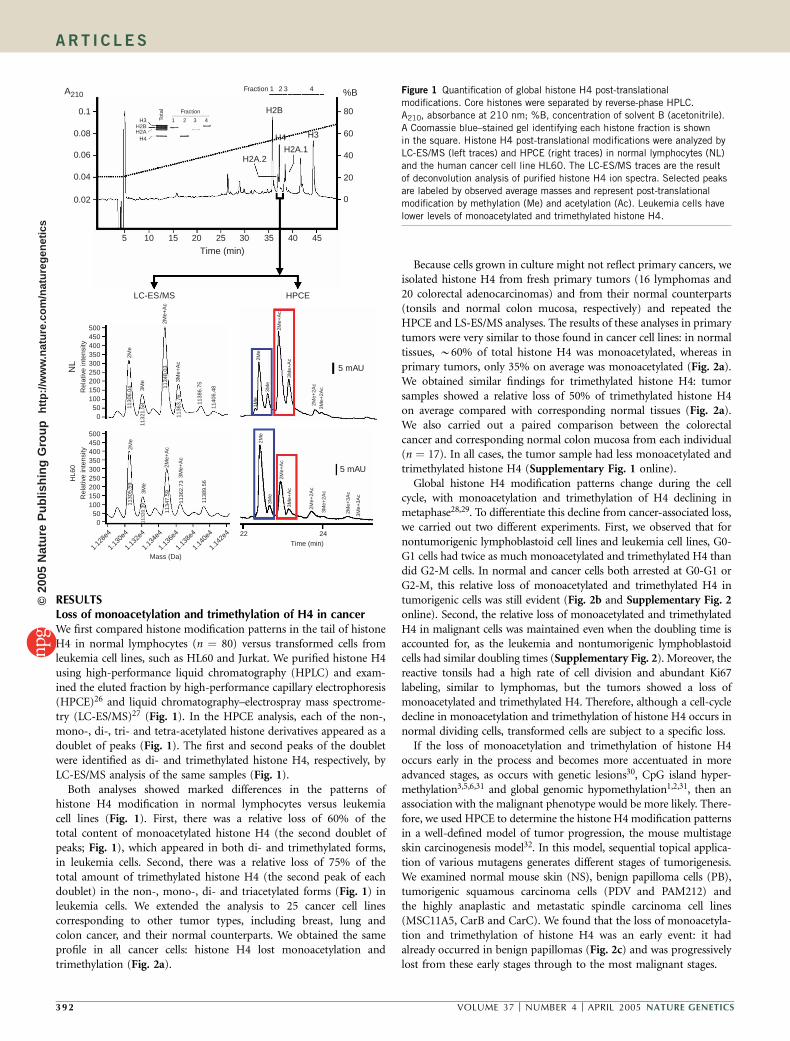
Both analyses showed marked differences in the patterns ofhistone H4 modification in normal lymphocytes versus leukemiacell lines (Fig. 1). First, there was a relative loss of 60% of thetotal content of monoacetylated histone H4 (the second doublet ofpeaks; Fig. 1), which appeared in both di- and trimethylated forms,in leukemia cells. Second, there was a relative loss of 75% of thetotal amount of trimethylated histone H4 (the second peak of eachdoublet) in the non-, mono-, di- and triacetylated forms (Fig. 1) inleukemia cells. We extended the analysis to 25 cancer cell linescorresponding to other tumor types, including breast, lung andcolon cancer, and their normal counterparts. We obtained the sameprofile in all cancer cells: histone H4 lost monoacetylation andtrimethylation (Fig. 2a).
Because cells grown in culture might not reflect primary cancers, weisolated histone H4 from fresh primary tumors (16 lymphomas and20 colorectal adenocarcinomas) and from their normal counterparts(tonsils and normal colon mucosa, respectively) and repeated theHPCE and LS-ES/MS analyses. The results of these analyses in primarytumors were very similar to those found in cancer cell lines: in normaltissues, B60% of total histone H4 was monoacetylated, whereas inprimary tumors, only 35% on average was monoacetylated (Fig. 2a).We obtained similar findings for trimethylated histone H4: tumorsamples showed a relative loss of 50% of trimethylated histone H4on average compared with corresponding normal tissues (Fig. 2a).We also carried out a paired comparison between the colorectalcancer and corresponding normal colon mucosa from each individual(n ¼ 17). In all cases, the tumor sample had less monoacetylated andtrimethylated histone H4 (Supplementary Fig. 1 online).
Global histone H4 modification patterns change during the cellcycle, with monoacetylation and trimethylation of H4 declining inmetaphase28,29. To differentiate this decline from cancer-associated loss,we carried out two different experiments. First, we observed that fornontumorigenic lymphoblastoid cell lines and leukemia cell lines, G0-G1 cells had twice as much monoacetylated and trimethylated H4 thandid G2-M cells. In normal and cancer cells both arrested at G0-G1 orG2-M, this relative loss of monoacetylated and trimethylated H4 intumorigenic cells was still evident (Fig. 2b and Supplementary Fig. 2online). Second, the relative loss of monoacetylated and trimethylatedH4 in malignant cells was maintained even when the doubling time isaccounted for, as the leukemia and nontumorigenic lymphoblastoidcells had similar doubling times (Supplementary Fig. 2). Moreover, thereactive tonsils had a high rate of cell division and abundant Ki67labeling, similar to lymphomas, but the tumors showed a loss ofmonoacetylated and trimethylated H4. Therefore, although a cell-cycledecline in monoacetylation and trimethylation of histone H4 occurs innormal dividing cells, transformed cells are subject to a specific loss.
If the loss of monoacetylation and trimethylation of histone H4occurs early in the process and becomes more accentuated in moreadvanced stages, as occurs with genetic lesions30, CpG island hyper-methylation3,5,6,31 and global genomic hypomethylation1,2,31, then anassociation with the malignant phenotype would be more likely. There-fore, we used HPCE to determine the histone H4 modification patternsin a well-defined model of tumor progression, the mouse multistageskin carcinogenesis model32. In this model, sequential topical applica-tion of various mutagens generates different stages of tumorigenesis.We examined normal mouse skin (NS), benign papilloma cells (PB),tumorigenic squamous carcinoma cells (PDV and PAM212) andthe highly anaplastic and metastatic spindle carcinoma cell lines(MSC11A5, CarB and CarC). We found that the loss of monoacetyla-tion and trimethylation of histone H4 was an early event: it hadalready occurred in benign papillomas (Fig. 2c) and was progressivelylost from these early stages through to the most malignant stages.
A210Fraction 1 2 3 4 %B
0.1
0.08
0.06
0.04
0.02
5 10 15 20
LC-ES/MS
NL
HL6
0
HPCE
5 mAU
5 mAU
H2B
H2A.1
H2AH2B
H3
H4
H2A.2
H4 H3
Time (min)25 30 35 40 45
80
60
40
20
0
Tota
l
1 2
Fraction
3 4
500450400350300250200150
500
100
500450400350300250200150
500
100
Rel
ativ
e in
tens
ityR
elat
ive
inte
nsity
Mass (Da)
2Me
2Me
2Me
1Me
3Me
3Me
2Me+
Ac
2Me+
Ac
2Me+
2Ac
2Me+
2Ac
3Me+
2Ac
2Me+
3Ac
3Me+
3Ac
3Me+
2Ac
3Me+
Ac
3Me+
Ac
2Me
1130
6.04
1130
5.59
1134
7.59
1136
2.73
1138
9.56
1132
0.39
1132
1.58
1134
8.03
1136
3.76
1138
6.75
1140
6.483M
e3M
e
3Me+
Ac
3Me+
Ac
2Me+
Ac
2Me+
Ac
1.12
8e4
1.13
0e4
1.13
2e4
1.13
4e4
1.13
6e4
1.13
8e4
1.14
0e4
1.14
2e4 22 24
Time (min)
Figure 1 Quantification of global histone H4 post-translational
modifications. Core histones were separated by reverse-phase HPLC.
A210, absorbance at 210 nm; %B, concentration of solvent B (acetonitrile).
A Coomassie blue–stained gel identifying each histone fraction is shown
in the square. Histone H4 post-translational modifications were analyzed by
LC-ES/MS (left traces) and HPCE (right traces) in normal lymphocytes (NL)
and the human cancer cell line HL60. The LC-ES/MS traces are the result
of deconvolution analysis of purified histone H4 ion spectra. Selected peaks
are labeled by observed average masses and represent post-translational
modification by methylation (Me) and acetylation (Ac). Leukemia cells have
lower levels of monoacetylated and trimethylated histone H4.
3 92 VOLUME 37 [ NUMBER 4 [ APRIL 2005 NATURE GENETICS
A R T I C L E S©
2005
Nat
ure
Pub
lishi
ng G
roup
ht
tp://
ww
w.n
atur
e.co
m/n
atur
egen
etic
s
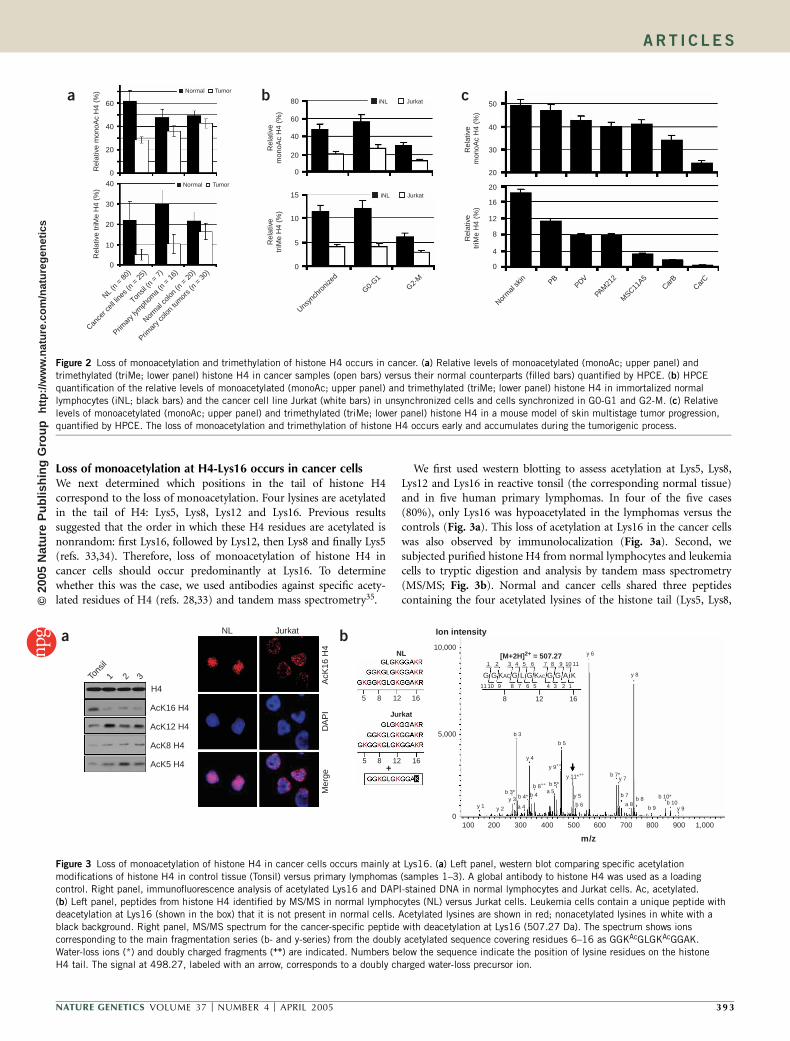
Loss of monoacetylation at H4-Lys16 occurs in cancer cellsWe next determined which positions in the tail of histone H4correspond to the loss of monoacetylation. Four lysines are acetylatedin the tail of H4: Lys5, Lys8, Lys12 and Lys16. Previous resultssuggested that the order in which these H4 residues are acetylated isnonrandom: first Lys16, followed by Lys12, then Lys8 and finally Lys5(refs. 33,34). Therefore, loss of monoacetylation of histone H4 incancer cells should occur predominantly at Lys16. To determinewhether this was the case, we used antibodies against specific acety-lated residues of H4 (refs. 28,33) and tandem mass spectrometry35.
We first used western blotting to assess acetylation at Lys5, Lys8,Lys12 and Lys16 in reactive tonsil (the corresponding normal tissue)and in five human primary lymphomas. In four of the five cases(80%), only Lys16 was hypoacetylated in the lymphomas versus thecontrols (Fig. 3a). This loss of acetylation at Lys16 in the cancer cellswas also observed by immunolocalization (Fig. 3a). Second, wesubjected purified histone H4 from normal lymphocytes and leukemiacells to tryptic digestion and analysis by tandem mass spectrometry(MS/MS; Fig. 3b). Normal and cancer cells shared three peptidescontaining the four acetylated lysines of the histone tail (Lys5, Lys8,
80
60
40
20
15
10
5
0
0
60
40
20
40
30
20
10
0
Unsyn
chro
nized
G0-G1
G2-M
0
Normal Tumor
Normal Tumor
Rel
ativ
e m
onoA
c H
4 (%
)R
elat
ive
triM
e H
4 (%
)iNL Jurkat
iNL Jurkat
Rel
ativ
etr
iMe
H4
(%)
Rel
ativ
em
onoA
c H
4 (%
)
Rel
ativ
etr
iMe
H4
(%)
Rel
ativ
e m
onoA
c H
4 (%
)
50
40
30
20
20
16
12
8
4
0
Norm
al sk
in PBPDV
PAM
212
MSC11
A5Car
BCar
C
a b c
Primar
y colo
n tu
mor
s (n
= 30
)
Norm
al co
lon (n
= 2
0)
Tonsil
(n =
7)
NL (n
= 8
0)
Cance
r cell
lines
(n =
25)
Primar
y lym
phom
a (n
= 1
6)
Figure 2 Loss of monoacetylation and trimethylation of histone H4 occurs in cancer. (a) Relative levels of monoacetylated (monoAc; upper panel) and
trimethylated (triMe; lower panel) histone H4 in cancer samples (open bars) versus their normal counterparts (filled bars) quantified by HPCE. (b) HPCE
quantification of the relative levels of monoacetylated (monoAc; upper panel) and trimethylated (triMe; lower panel) histone H4 in immortalized normal
lymphocytes (iNL; black bars) and the cancer cell line Jurkat (white bars) in unsynchronized cells and cells synchronized in G0-G1 and G2-M. (c) Relative
levels of monoacetylated (monoAc; upper panel) and trimethylated (triMe; lower panel) histone H4 in a mouse model of skin multistage tumor progression,quantified by HPCE. The loss of monoacetylation and trimethylation of histone H4 occurs early and accumulates during the tumorigenic process.
Tons
il
1 2 3H4
AcK16 H4
AcK12 H4
AcK8 H4
AcK5 H4
NL Jurkat
Mer
geD
AP
IA
cK16
H4
NL
Jurkat
5
5 8 12 16+
8 12 16
Ion intensity
m/z
10,000
5,000
0100 200 300 400 500 600 700 800 900 1,000
G G G GL G G A KKACKAC
11 10 9 8
8
[M+2H]2+ = 507.27
12 16
7 6 5 4 3 2 1
1 2 3 4 5 6 7 8 9 10 11
y 1 y 2
y 4
y 5
y 6
y 8
y 7
y 9
y 3b 3*
b 3
b 5
b 6
b 7b 8
b 9b 10
b 10*
b 7*
b 4*
b 5*
b 4
b 8++
y 9++
y 11*++
a 4
a 5
a 8
a b
Figure 3 Loss of monoacetylation of histone H4 in cancer cells occurs mainly at Lys16. (a) Left panel, western blot comparing specific acetylation
modifications of histone H4 in control tissue (Tonsil) versus primary lymphomas (samples 1–3). A global antibody to histone H4 was used as a loading
control. Right panel, immunofluorescence analysis of acetylated Lys16 and DAPI-stained DNA in normal lymphocytes and Jurkat cells. Ac, acetylated.
(b) Left panel, peptides from histone H4 identified by MS/MS in normal lymphocytes (NL) versus Jurkat cells. Leukemia cells contain a unique peptide withdeacetylation at Lys16 (shown in the box) that it is not present in normal cells. Acetylated lysines are shown in red; nonacetylated lysines in white with a
black background. Right panel, MS/MS spectrum for the cancer-specific peptide with deacetylation at Lys16 (507.27 Da). The spectrum shows ions
corresponding to the main fragmentation series (b- and y-series) from the doubly acetylated sequence covering residues 6–16 as GGKAcGLGKAcGGAK.
Water-loss ions (*) and doubly charged fragments (++) are indicated. Numbers below the sequence indicate the position of lysine residues on the histone
H4 tail. The signal at 498.27, labeled with an arrow, corresponds to a doubly charged water-loss precursor ion.
NATURE GENETICS VOLUME 37 [ NUMBER 4 [ APRIL 2005 39 3
A R T I C L E S©
2005
Nat
ure
Pub
lishi
ng G
roup
ht
tp://
ww
w.n
atur
e.co
m/n
atur
egen
etic
s
Lys12 and Lys16), but there was an additional peptide specific toleukemia cells: GGK8GLGK12GGAK16. This ‘cancer-specific’ peptidewas acetylated at Lys8 and Lys12 but not at Lys16 (Fig. 3b). Therefore,loss of acetylation at H4-Lys16 seems to be particular to transformedcells. Finally, we used a third strategy to establish that loss ofmonoacetylated H4 corresponds to loss of acetylation at H4-Lys16.The colorectal carcinoma cell line HCT-116 had less monoacetylationof H4 than did normal colorectal mucosa (Supplementary Fig. 3online). We obtained similar results with other cancer cell lines. Weobtained a cell line derived from HCT-116 that has a disruption of thehistone acetyltransferase p300 (ref. 36). p300 acetylates histone H4 atLys5, Lys8 and Lys12 but cannot acetylate Lys16 (ref. 37). In an HPCEassay, similar to the one in which we determined that the loss ofacetylation at Lys16 is responsible for the decline in total monoace-tylated H4, we found no change in the global monoacetylation statusof H4 in p300-knockout HCT-116 cells compared with parental HCT-116 cells (Supplementary Fig. 3). These results also imply that the lossof monoacetylation at H4 in malignant cells occurs at Lys16.
Loss of trimethylation at H4-Lys20 occurs in cancer cellsThe only lysine in the tail of histone H4 that undergoes methylation isLys20, which can exist in mono-, di- or trimethylated states19,27. Todetermine whether trimethylation at Lys20 was involved in the declinein trimethylated forms of H4, we used specific antibodies against thismodification, HPCE and mass spectrometry.
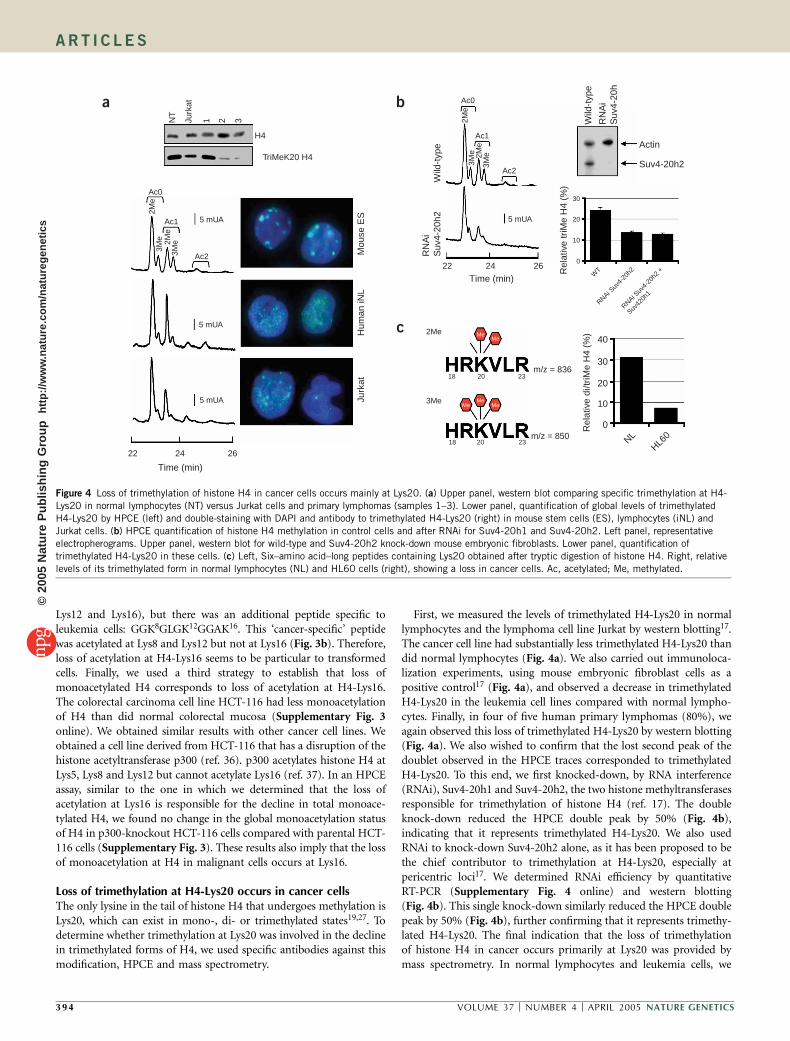
First, we measured the levels of trimethylated H4-Lys20 in normallymphocytes and the lymphoma cell line Jurkat by western blotting17.The cancer cell line had substantially less trimethylated H4-Lys20 thandid normal lymphocytes (Fig. 4a). We also carried out immunoloca-lization experiments, using mouse embryonic fibroblast cells as apositive control17 (Fig. 4a), and observed a decrease in trimethylatedH4-Lys20 in the leukemia cell lines compared with normal lympho-cytes. Finally, in four of five human primary lymphomas (80%), weagain observed this loss of trimethylated H4-Lys20 by western blotting(Fig. 4a). We also wished to confirm that the lost second peak of thedoublet observed in the HPCE traces corresponded to trimethylatedH4-Lys20. To this end, we first knocked-down, by RNA interference(RNAi), Suv4-20h1 and Suv4-20h2, the two histone methyltransferasesresponsible for trimethylation of histone H4 (ref. 17). The doubleknock-down reduced the HPCE double peak by 50% (Fig. 4b),indicating that it represents trimethylated H4-Lys20. We also usedRNAi to knock-down Suv4-20h2 alone, as it has been proposed to bethe chief contributor to trimethylation at H4-Lys20, especially atpericentric loci17. We determined RNAi efficiency by quantitativeRT-PCR (Supplementary Fig. 4 online) and western blotting(Fig. 4b). This single knock-down similarly reduced the HPCE doublepeak by 50% (Fig. 4b), further confirming that it represents trimethy-lated H4-Lys20. The final indication that the loss of trimethylationof histone H4 in cancer occurs primarily at Lys20 was provided bymass spectrometry. In normal lymphocytes and leukemia cells, we
NT
Jurk
at
1 2 3
H4
TriMeK20 H4
Ac0
Ac0
Ac1
Ac1
Ac2
Ac2
5 mUA 5 mUA
Actin
Suv4-20h2
5 mUA
5 mUA
22 24 26
Time (min)
22 24 26
40
30
20
10
0
NLHL6
0
Time (min)
2Me
2Me
3Me
2Me
2Me
3Me
3Me
3Me
Mou
se E
SH
uman
iNL
Jurk
at
Wild
-typ
e
Wild
-typ
e
RN
Ai
Suv
4-20
h2
RN
Ai
Suv
4-20
h
Rel
ativ
e tr
iMe
H4
(%)
30
20
10
0
WT
RNAi Suv
4-20
h2
RNAi Suv
4-20
h2 +
Suv42
0h1
2Me
3Me
18 20 23m/z = 836
18 20 23m/z = 850
MeMe
MeMe
Me
Rel
ativ
e di
/triM
e H
4 (%
)
a b
c
Figure 4 Loss of trimethylation of histone H4 in cancer cells occurs mainly at Lys20. (a) Upper panel, western blot comparing specific trimethylation at H4-
Lys20 in normal lymphocytes (NT) versus Jurkat cells and primary lymphomas (samples 1–3). Lower panel, quantification of global levels of trimethylated
H4-Lys20 by HPCE (left) and double-staining with DAPI and antibody to trimethylated H4-Lys20 (right) in mouse stem cells (ES), lymphocytes (iNL) and
Jurkat cells. (b) HPCE quantification of histone H4 methylation in control cells and after RNAi for Suv4-20h1 and Suv4-20h2. Left panel, representative
electropherograms. Upper panel, western blot for wild-type and Suv4-20h2 knock-down mouse embryonic fibroblasts. Lower panel, quantification of
trimethylated H4-Lys20 in these cells. (c) Left, Six–amino acid–long peptides containing Lys20 obtained after tryptic digestion of histone H4. Right, relative
levels of its trimethylated form in normal lymphocytes (NL) and HL60 cells (right), showing a loss in cancer cells. Ac, acetylated; Me, methylated.
3 94 VOLUME 37 [ NUMBER 4 [ APRIL 2005 NATURE GENETICS
A R T I C L E S©
2005
Nat
ure
Pub
lishi
ng G
roup
ht
tp://
ww
w.n
atur
e.co
m/n
atur
egen
etic
s
characterized a six–amino acid–long peptide with Lys20 in the centralposition: H18RK20VLR23 (Fig. 4c). We quantified the differentiallymodified peptides27 and found that leukemia cells lost 77% of thetrimethylated H4-Lys20 found in normal lymphocytes (Fig. 4c),providing further evidence that this site is the target for the loss oftrimethylation of histone H4.
We also wished to determine whether all the histone H4 mono-acetylated at Lys16 or only histone H4 methylated at Lys20 wasdepleted in the cancer cells. The mass spectrometry spectra showedthat loss of monoacetylated H4 in cancer occurred for both dimethy-lated and trimethylated histones (Fig. 1) and that most histone H4 is
di- or trimethylated at Lys20 in both normal and cancer cells. There-fore, although monoacetylated histone H4 may exist in the unmethy-lated H4-Lys20 isoform, the amount is so small that it is at the limit ofdetection (always o1%). The relative amounts of the eight possiblecombinations of modifications for Lys16 and Lys20 in normal versuscancer cells is shown in Supplementary Fig. 5 online.
No association with histone-silenced genesWe wanted to determine at which genomic loci the loss of acetylatedH4-Lys16 and trimethylated H4-Lys20 took place in the cancer cells.At least three aberrant epigenetic events occur in transformed cells: theglobal loss of 5-methylcytosine DNA content, originating mainly fromrepetitive sequences1,2,31 and some hypomethylated CpG islands38; thehypermethylation of promoter-associated CpG islands of tumor-suppressor genes3–6; and a shift in the promoter histone modificationpattern without DNA methylation changes, such as occurs withCDKN1A (refs. 23,24). We investigated these three possible targets.
HL60
H 2O
NL
– – – 0.3 µM TSA+
CDKN1A
CD
KN
1A
CDKN1A
GADPH
NL HL60
NL HL60
NA
B
NA
B
AcK
5
AcK
5
AcK
8
AcK
8
AcK
12
AcK
12
AcK
16
AcK
16
DiM
eK20
H4
DiM
eK20
H4
TriM
eK20
H4
TriM
eK20
H4
H4
H4
H2O
a
b
c
PRDM2
PRDM2
GSTP1
GSTP1
GSTP1
MGMT
MGMT
PRDM2
GSTP1
MGMT
IVD
HL6
0N
L
NL HL60 IVD H2O
U M U M U M U M
HL60
NL H 2O
– – – 5 µM ADC+
NL HL60
NA
B
NA
B
AcK
5
AcK
5
AcK
8
AcK
8
AcK
12
AcK
12
AcK
16
NA
BA
cK16
AcK
16
H4
H4
H2O
H2O
DiM
eK20
H4
DiM
eK20
H4
TriM
eK20
H4
DiM
eK20
TriM
eK20
NA
BA
cK16
DiM
eK20
TriM
eK20
TriM
eK20
H4
NL
Jurk
at
NL
NL
Jurk
at
Jurkat
0 0100 100200 200300 300 400bp bp
CTAG2 PSCA
a
d e
b
c
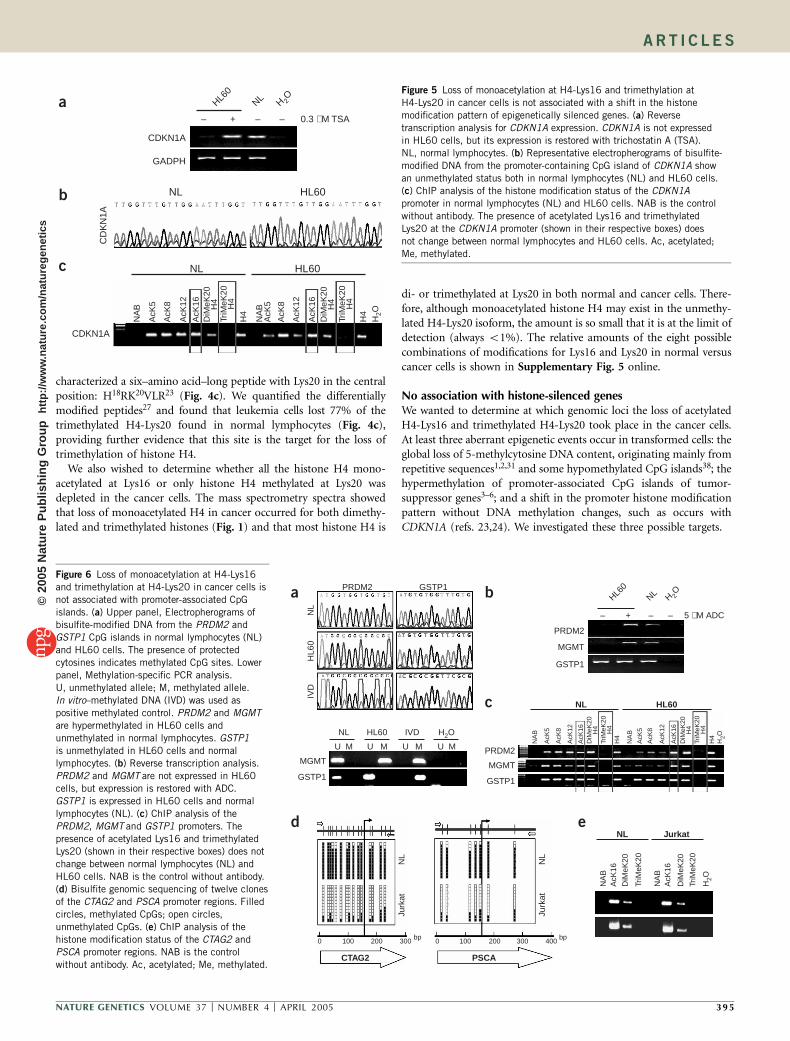
Figure 6 Loss of monoacetylation at H4-Lys16
and trimethylation at H4-Lys20 in cancer cells is
not associated with promoter-associated CpG
islands. (a) Upper panel, Electropherograms ofbisulfite-modified DNA from the PRDM2 and
GSTP1 CpG islands in normal lymphocytes (NL)
and HL60 cells. The presence of protected
cytosines indicates methylated CpG sites. Lower
panel, Methylation-specific PCR analysis.
U, unmethylated allele; M, methylated allele.
In vitro–methylated DNA (IVD) was used as
positive methylated control. PRDM2 and MGMT
are hypermethylated in HL60 cells and
unmethylated in normal lymphocytes. GSTP1
is unmethylated in HL60 cells and normal
lymphocytes. (b) Reverse transcription analysis.
PRDM2 and MGMT are not expressed in HL60
cells, but expression is restored with ADC.
GSTP1 is expressed in HL60 cells and normal
lymphocytes (NL). (c) ChIP analysis of the
PRDM2, MGMT and GSTP1 promoters. The
presence of acetylated Lys16 and trimethylatedLys20 (shown in their respective boxes) does not
change between normal lymphocytes (NL) and
HL60 cells. NAB is the control without antibody.
(d) Bisulfite genomic sequencing of twelve clones
of the CTAG2 and PSCA promoter regions. Filled
circles, methylated CpGs; open circles,
unmethylated CpGs. (e) ChIP analysis of the
histone modification status of the CTAG2 and
PSCA promoter regions. NAB is the control
without antibody. Ac, acetylated; Me, methylated.
Figure 5 Loss of monoacetylation at H4-Lys16 and trimethylation at
H4-Lys20 in cancer cells is not associated with a shift in the histone
modification pattern of epigenetically silenced genes. (a) Reverse
transcription analysis for CDKN1A expression. CDKN1A is not expressed
in HL60 cells, but its expression is restored with trichostatin A (TSA).
NL, normal lymphocytes. (b) Representative electropherograms of bisulfite-
modified DNA from the promoter-containing CpG island of CDKN1A show
an unmethylated status both in normal lymphocytes (NL) and HL60 cells.
(c) ChIP analysis of the histone modification status of the CDKN1A
promoter in normal lymphocytes (NL) and HL60 cells. NAB is the control
without antibody. The presence of acetylated Lys16 and trimethylated
Lys20 at the CDKN1A promoter (shown in their respective boxes) does
not change between normal lymphocytes and HL60 cells. Ac, acetylated;
Me, methylated.
NATURE GENETICS VOLUME 37 [ NUMBER 4 [ APRIL 2005 39 5
A R T I C L E S©
2005
Nat
ure
Pub
lishi
ng G
roup
ht
tp://
ww
w.n
atur
e.co
m/n
atur
egen
etic
s

CDKN1A undergoes epigenetic silencing in cancer cells through achange in the histone modification pattern23,24. The presence ofglobal hypoacetylation in the CDKN1A promoter, detected using anantibody that recognizes a peptide that is tetra-acetylated at Lys5,Lys8, Lys12 and Lys16, is associated with transcriptional silencing24.CDKN1A was expressed in normal lymphocytes and lost inleukemia cells but restored by treatment with HDAC inhibitors(Fig. 5a). The CDKN1A promoter–associated CpG island wasalways unmethylated (Fig. 5b). To assess which acetylation changesoccurred at the CDKN1A promoter, we used specific antibodiesagainst the four lysine residues in a chromatin immunoprecipitation(ChIP) assay. Lys5 and Lys12 of H4 were hypoacetylated in leukemiacells compared with normal lymphocytes, whereas the acetylationstatus of Lys8 and Lys16 did not change (Fig. 5c). ChIP fortrimethylated H4-Lys20 also showed no differences between normaland leukemia cells. These data suggest that the loss of acetylationat H4-Lys16 and trimethylation at H4-Lys20 in cancer cells wasnot due to CDKN1A-like sequences, as an archetype of genes under-going shifts in the histone modification pattern without DNA methy-lation changes.
This conclusion was confirmed when we analyzed histone H4 fromHL60 cells before and after treatment with HDAC inhibitors. HPCEanalysis and western blotting using an antibody raised against a tetra-acetylated peptide showed that sodium butyrate induced globalhyperacetylation of histone H4 (Supplementary Fig. 6 online).HPCE electropherograms also showed that the effect was morepronounced for N-terminal, more exposed lysines, manifested as anincrease in tetra-acetylated histones relative to monoacetylated. Usingantibodies against specifically acetylated residues, we found thatacetylated Lys5 increased by a factor of 50 and acetylated Lys16
increased by a factor of only 1.5 (Supplementary Fig. 6). Theseobservation reinforce the idea that of lysine residues on histone H4undergo ordered acetylation28. Because acetylated H4-Lys5 is veryrare, its presence is greatly enhanced by the use of HDAC inhibitors;the maximum possible increase in acetylated H4-Lys16 is much less.
No association with CpG island methylationThe second candidate locus at which changes in acetylation atH4-Lys16 and trimethylation at H4-Lys20 could occur in cancercells is promoter-associated CpG islands: CpG island hypermethy-lation in tumor-suppressor genes3–6 or hypomethylation of certainCpG islands38.
Because we used leukemia cell lines, we selected two genes whoseCpG islands are hypermethylated in HL60 cells: the DNA repair geneMGMT and the retinoblastoma-interacting protein PRDM2 (alsocalled RIZ1; refs. 4,39). We used glutathione S-transferase P1(GSTP1) as an unmethylated CpG island4,39. DNA methylationanalysis showed that MGMT and PRDM2 CpG islands were unmethy-lated in normal lymphocytes and hypermethylated in HL60 cells,whereas GSTP1 was unmethylated in both (Fig. 6a). Expression ofGSTP1 was present in HL60 cells, whereas expression of MGMT andPRDM2 was not detected but was restored with DNA demethylatingagents (Fig. 6b). ChIP showed that both methylation-silenced geneswere hypoacetylated at Lys5, Lys8 and Lys12 of H4 in leukemia cellscompared with normal lymphocytes, whereas acetylation at H4-Lys16did not differ (Fig. 6c). Trimethylation at H4-Lys20 also showed nodifference between normal lymphocytes and leukemia cells (Fig. 6c).Acetylation at Lys5, Lys8, Lys12 and Lys16 and trimethylation at Lys20for the unmethylated GSTP1 CpG island was the same in normallymphocytes and HL60 cells. These results suggest that the loss of
4
3,5
3
2,5
2
1,5Rel
ativ
e gl
obal
5m
C (
%)
Sat2
D4Z4
NBL2
Sat2
D4Z4
NBL2
NL HL60NL HL60
NA
B
NA
B
AcK
5
AcK
5
AcK
8
AcK
8
AcK
12
AcK
12
AcK
16
AcK
16
DiM
eK20
H4
DiM
eK20
H4
TriM
eK20
H4
TriM
eK20
H4
H4
H4
H2O NA
B
MO
F
MO
Z
MO
RF
TIP
60
NA
B
MO
F
MO
Z
MO
RF
TIP
60
H2O
+338 +385 +319
0 0100 100200 200300 300 400bp 0 100 200 300 bpbp
HL6
0N
L
HL6
0N
L
HL6
0N
L
Sat2 D4Z4 NBL2
a
b
c d
NL HL60
Figure 7 Loss of monoacetylation at H4-Lys16 and trimethylation at H4-Lys20 in cancer cells is associated with DNA hypomethylation of repetitive
sequences. (a) 5-methylcytosine (5mC) genomic content by HPCE in normal lymphocytes (NL) and HL60 cells as a percentage of the total cytosine pool.
(b) Bisulfite genomic sequencing of twelve clones of the repetitive DNA sequences Sat2, D4Z4 and NBL2 in normal lymphocytes (NL) and HL60 cells.
Filled circles, methylated CpGs; open circles, unmethylated CpGs. All repetitive sequences are hypomethylated in HL60 cells versus normal lymphocytes.
(c) ChIP analysis of the repetitive DNA sequences in normal lymphocytes (NL) and HL60 cells. Loss of acetylation at H4-Lys16 and trimethylation atH4-Lys20 for Sat2, D4Z4 and NBL2 repetitive sequences (shown in their respective boxes) is observed in leukemia versus normal cells. NAB is the control
without antibody. Ac, acetylated; Me, methylated. (d) ChIP analysis of the Lys16-specific histone acetyltransferases MOF, MOZ, MORF and TIP60 at the
repetitive DNA sequences in normal lymphocytes (NL) and HL60 cells. NAB is the control without antibody.
3 96 VOLUME 37 [ NUMBER 4 [ APRIL 2005 NATURE GENETICS
A R T I C L E S©
2005
Nat
ure
Pub
lishi
ng G
roup
ht
tp://
ww
w.n
atur
e.co
m/n
atur
egen
etic
s
acetylation at H4-Lys16 and trimethylation at H4-Lys20 in trans-formed cells was not related to CpG island hypermethylation.
A second aspect of aberrant CpG island methylation in cancer ismanifested in the hypomethylation of certain CpG islands that arenormally methylated in somatic tissues38. These include CpG islandsin testis-specific genes, melanoma antigens and certain proliferation-linked genes38. To determine whether these loci were involved in thealtered acetylation at H4-Lys16 and trimethylation at H4-Lys20, westudied eight genes belonging to this category: MAGEA1, CAGE1,CTAG2, GAGE1, PSCA, S100A4 and MSLN38. All their CpG islandswere methylated in normal lymphocytes, but only the CTAG2 andPSCA CpG islands were hypomethylated in leukemia cells (Fig. 6d).ChIP assay showed no changes in acetylation at H4-Lys16 ortrimethylation at H4-Lys20 for these two hypomethylated sequencesbetween normal lymphocytes and leukemia cells, despite the change inDNA methylation (Fig. 6e). Therefore, this type of sequence did notcontribute to the loss of acetylation at H4-Lys16 and trimethylation atH4-Lys20 in tumor cells.
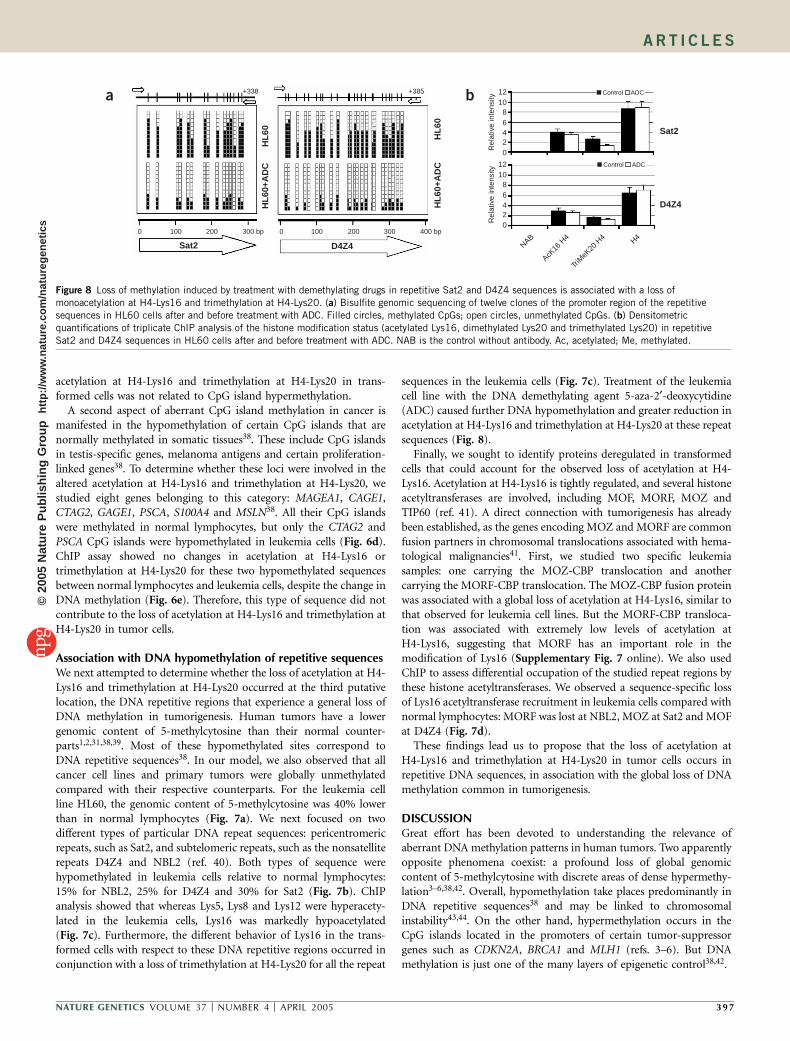
Association with DNA hypomethylation of repetitive sequencesWe next attempted to determine whether the loss of acetylation at H4-Lys16 and trimethylation at H4-Lys20 occurred at the third putativelocation, the DNA repetitive regions that experience a general loss ofDNA methylation in tumorigenesis. Human tumors have a lowergenomic content of 5-methylcytosine than their normal counter-parts1,2,31,38,39. Most of these hypomethylated sites correspond toDNA repetitive sequences38. In our model, we also observed that allcancer cell lines and primary tumors were globally unmethylatedcompared with their respective counterparts. For the leukemia cellline HL60, the genomic content of 5-methylcytosine was 40% lowerthan in normal lymphocytes (Fig. 7a). We next focused on twodifferent types of particular DNA repeat sequences: pericentromericrepeats, such as Sat2, and subtelomeric repeats, such as the nonsatelliterepeats D4Z4 and NBL2 (ref. 40). Both types of sequence werehypomethylated in leukemia cells relative to normal lymphocytes:15% for NBL2, 25% for D4Z4 and 30% for Sat2 (Fig. 7b). ChIPanalysis showed that whereas Lys5, Lys8 and Lys12 were hyperacety-lated in the leukemia cells, Lys16 was markedly hypoacetylated(Fig. 7c). Furthermore, the different behavior of Lys16 in the trans-formed cells with respect to these DNA repetitive regions occurred inconjunction with a loss of trimethylation at H4-Lys20 for all the repeat
sequences in the leukemia cells (Fig. 7c). Treatment of the leukemiacell line with the DNA demethylating agent 5-aza-2¢-deoxycytidine(ADC) caused further DNA hypomethylation and greater reduction inacetylation at H4-Lys16 and trimethylation at H4-Lys20 at these repeatsequences (Fig. 8).
Finally, we sought to identify proteins deregulated in transformedcells that could account for the observed loss of acetylation at H4-Lys16. Acetylation at H4-Lys16 is tightly regulated, and several histoneacetyltransferases are involved, including MOF, MORF, MOZ andTIP60 (ref. 41). A direct connection with tumorigenesis has alreadybeen established, as the genes encoding MOZ and MORF are commonfusion partners in chromosomal translocations associated with hema-tological malignancies41. First, we studied two specific leukemiasamples: one carrying the MOZ-CBP translocation and anothercarrying the MORF-CBP translocation. The MOZ-CBP fusion proteinwas associated with a global loss of acetylation at H4-Lys16, similar tothat observed for leukemia cell lines. But the MORF-CBP transloca-tion was associated with extremely low levels of acetylation atH4-Lys16, suggesting that MORF has an important role in themodification of Lys16 (Supplementary Fig. 7 online). We also usedChIP to assess differential occupation of the studied repeat regions bythese histone acetyltransferases. We observed a sequence-specific lossof Lys16 acetyltransferase recruitment in leukemia cells compared withnormal lymphocytes: MORF was lost at NBL2, MOZ at Sat2 and MOFat D4Z4 (Fig. 7d).
These findings lead us to propose that the loss of acetylation atH4-Lys16 and trimethylation at H4-Lys20 in tumor cells occurs inrepetitive DNA sequences, in association with the global loss of DNAmethylation common in tumorigenesis.
DISCUSSIONGreat effort has been devoted to understanding the relevance ofaberrant DNA methylation patterns in human tumors. Two apparentlyopposite phenomena coexist: a profound loss of global genomiccontent of 5-methylcytosine with discrete areas of dense hypermethy-lation3–6,38,42. Overall, hypomethylation take places predominantly inDNA repetitive sequences38 and may be linked to chromosomalinstability43,44. On the other hand, hypermethylation occurs in theCpG islands located in the promoters of certain tumor-suppressorgenes such as CDKN2A, BRCA1 and MLH1 (refs. 3–6). But DNAmethylation is just one of the many layers of epigenetic control38,42.
+338 +385
0 0100 100200 200300 bp 300 400 bp
Sat2 D4Z4
Sat2
D4Z4HL
60+A
DC
HL
60
HL
60+A
DC
HL
60
1210
86420
1210
86420
Rel
ativ
e in
tens
ityR
elat
ive
inte
nsity
NAB
AcK16
H4
TriM
eK20
H4 H4
Control ADC
Control ADC
a b
Figure 8 Loss of methylation induced by treatment with demethylating drugs in repetitive Sat2 and D4Z4 sequences is associated with a loss of
monoacetylation at H4-Lys16 and trimethylation at H4-Lys20. (a) Bisulfite genomic sequencing of twelve clones of the promoter region of the repetitive
sequences in HL60 cells after and before treatment with ADC. Filled circles, methylated CpGs; open circles, unmethylated CpGs. (b) Densitometric
quantifications of triplicate ChIP analysis of the histone modification status (acetylated Lys16, dimethylated Lys20 and trimethylated Lys20) in repetitive
Sat2 and D4Z4 sequences in HL60 cells after and before treatment with ADC. NAB is the control without antibody. Ac, acetylated; Me, methylated.
NATURE GENETICS VOLUME 37 [ NUMBER 4 [ APRIL 2005 39 7
A R T I C L E S©
2005
Nat
ure
Pub
lishi
ng G
roup
ht
tp://
ww
w.n
atur
e.co
m/n
atur
egen
etic
s

Histones are another key player. They have a primordial role in thecontrol of gene expression and chromatin structure10,11, togetherwith DNA methylation9,10. But our knowledge of the behavior ofhistones in cancer is poor. Apart from the role of certain histonemodifications in gene silencing, with20–22 or without23,24 CpG islandhypermethylation, there has previously been no portrait available ofgeneral aberrant histone modification patterns in cancer cells. Here,we show that human tumors undergo an overall loss of monoacetyla-tion at H4-Lys16 and trimethylation at H4-Lys20. These two lossescan be considered almost universal epigenetic markers of malig-nant transformation, like global DNA hypomethylation and CpGisland hypermethylation.
Changes in histone modifications affect DNA methylation45, butchanges in DNA methylation also affect histone modifications40,46.We found that the loss of acetylation at H4-Lys16 and trimethylationat H4-Lys20 could be assigned to DNA repetitive regions thatundergo DNA hypomethylation in cancer cells. Therefore, thesehypomethylated loci could drive the observed chromatin changes.We do not know which occurs first, but these genomic regions haveprofoundly disturbed epigenetic regulation with regard to both DNAmethylation and histone modification. These findings should inspireus to study how the chromatin domains of the cancer cell genomebecome misplaced. Defects in the establishment of DNA methylationpatterns may be related to the generation of genomic aberrations43,44,but perhaps an imbalanced pattern of histone modifications could alsobe invoked.
The identities of the molecules responsible for the aberrant profileof histone H4 modifications are of note. We found a loss of recruit-ment of the H4-Lys16 acetyltransferases MOZ, MOF and MORF torepeat sequences in cancer cells and an association of the fusionproteins MOZ-CBP and MORF-CBP with substantial global losses ofacetylation at H4-Lys16. The other partner of the fusion protein isusually CBP or p300, both histone acetyltransferases with numeroussubstrates that do not act on H4-Lys16 (refs. 37,41). Similarly, thedeacetylation of H4-Lys16 seems to be closely regulated: in yeast, SIR2deacetylates this residue; its human homolog, Sirtuin 1 (SIRT1), alsodeacetylates the tumor-suppressor protein p53 (ref. 47), therebyestablishing another link with cancer. A similar scenario could beconceived for trimethylation at H4-Lys20. Two human histonemethyltransferases, Suv4-20h1 and Suv4-20h2, are responsible formethylation at Lys20 (ref. 17), in addition to PR/SET7 and SET8(refs. 48,49). They could also constitute targets for disruption incancer cells, as occurs with another histone methyltransferase, MLL,which is translocated in hematological malignancies50. These resultsreinforce the idea that aberrant histone modification patterns have arole in the tumorigenic process.
Our results suggest a global aberrant pattern of histone H4modification associated with the transformed phenotype. This histoneH4 ‘cancer signature’ is characterized by a loss of monoacetylation atLys16 and trimethylation at Lys20, predominantly located at DNArepetitive sequences. These findings may have implications for theidentification of histone-modifying enzymes as putative targets forcellular transformation, for the development of histone-related bio-markers of cancer and for a better understanding of the inhibitors ofHDACs as antitumor agents.
METHODSCell lines and primary tumor samples. We obtained 25 human cancer cell
lines corresponding to leukemia (HL60, Jurkat, K562 and REH), lymphoma
(Raji, U937, Molt16, HT and HuT78), breast (MDA-MB-231 and MCF-7),
colon (HCT-116, LoVo, RKO and Colo-205), bone (A637 and MG63), cervix
(SiHa, CaSki and SK-N-SH), lung (H1299), testis (NTERA), neuroblastoma
(SKN-SH), osteosarcoma (MG63) and prostate (LnCAP) cell types from the
American Type Culture Collection and the German Collection of Microorgan-
isms and Cell Cultures. The origin of the mouse multistage skin cancer model
cells was previously described31,32. The p300 knock-out cells used were
previously described. We obtained them by homologous recombination target-
ing exon 2 of the gene EP300 (ref. 36). To reactivate CDKN1A, we carried
out HDAC inhibition treatment by adding 0.3 mM trichostatin A to the
culture medium for 24 h or by treating the cells for 6 h in medium
supplemented with 10 mM sodium butyrate (Sigma)33. We carried out
demethylating treatments using ADC (1 mM) for 48 h, replacing the drug
and medium 24 h after the beginning of the treatment. For the cell cycle
experiments, we synchronized cells at G0-G1 and G2-M by serum starvation
and nocodazole treatment, respectively. For serum starvation, we incubated
actively growing Jurkat and lymphoblastoid cell lines for 24 h in RPMI medium
supplemented with 0.5% fetal bovine serum. To arrest cell cultures in G2-M, we
incubated subconfluent Jurkat and lymphoblastoid cells for 18 h in RPMI
medium plus 10% fetal bovine serum containing 500 ng ml�1 nocodazole.
After treatment, we washed cells and incubated them in the absence of
nocodazole for 2 h. We confirmed cell-cycle profiles of synchronized cell lines
by flow cytometry. We obtained tissue samples of 36 human primary malig-
nancies corresponding to lymphoma (n ¼ 16) and colon carcinomas (n ¼ 20),
as well as normal tonsils (n ¼ 3) and normal colon mucosa (n ¼ 5), at the time
of clinically indicated surgical procedures from the Tumor Bank of the Spanish
National Cancer Center. From 17 individuals with colorectal cancer we
obtained a normal sample and a tumor sample. We obtained 80 normal
lymphocytes from healthy volunteers.
Histone extraction. We prepared histone in accordance with established
protocols28. We obtained histones from cell lines and tumor samples in parallel
with their matching controls under identical conditions. For cell lines, we
isolated nuclei with RSB buffer (10 mM Tris 10 (pH 7.5), 10 mM NaCl and
3 mM MgCl2) containing 1% Nonidet-P40 and protease inhibitors. We
extracted nuclei with 0.25 M HCl and precipitated them with eight volumes
of acetone. For tumors and their normal tissue counterparts, we homogenized
samples with a Polytron homogenizer (Brinkman Instruments) in 0.25 M HCl
and incubated them with gentle agitation for 4 h. We precipitated the resulting
supernatant with eight volumes of acetone. We then fractionated individual
histones by reverse-phase HPLC on a Jupiter C18 column. We made compar-
isons only between samples extracted with identical methodology.
Western blotting and immunolocalization. For western blotting, we collected
cells by centrifugation and washed cell pellets twice with phosphate-buffered
saline buffer. We then extracted the histones directly from the cell pellets with
0.250 M HCl. We fractionated 10 mg of the acid-extracted proteins on a 10%
SDS-PAGE gel, transferred the fractions to a polyvinylidene difluoride mem-
brane with 22-mm pore size (Immobilon PSQ, Millipore), blocked the mem-
brane in 5% milk PBS-T (phosphate-buffered saline with 0.1% Tween-20)
and immunoprobed it with antibodies to acetylated H4-Lys12 (1:2,000),
dimethylated H4-Lys20 (1:2,000) or trimethylated H4-Lys20 (1:1,000; all from
Upstate) and with antibodies to acetylated H4-Lys5 (1:1,000), acetylated H4-
Lys8 (1:1,000) and acetylated H4-Lys16 (1:4,000; all from Abcam). We used
horseradish peroxidase–conjugated antibody to rabbit IgG (Amersham) at
1:3,000 dilution in PBS-T as the secondary antibody and antibody to H4
(1:3,000; Upstate) as a loading control. We raised Suv4-20h2 antibodies in
rabbits using a linear peptide corresponding to amino acid residues 10–24
(ELCENDDLATSLVLD) of human Suv4-20h2 (Abcam ab18186). We detected
signals with a Luminol reagent detection kit (Santa Cruz Biotechnology, Inc.).
For immunolocalization experiments, we grew cells on coverslips and stained
them with a mouse antibody against acetylated H4-Lys16 (Abcam) as pre-
viously described40. We obtained images with a Leica DMRD photomicroscope
coupled to a Leica DC200 camera, processed them using Adobe Photoshop
software and analyzed them using public National Institutes of Health Image
software. We measured indirect immunofluorescence of total trimethylated
H4-Lys20 in interphase cells as previously described17, using antibody against
trimethylated H4-Lys20 (Upstate). All samples were analyzed in triplicate.
We carried out densitometric quantification using Quantity One Software
(BIO-RAD; data available on request).
3 98 VOLUME 37 [ NUMBER 4 [ APRIL 2005 NATURE GENETICS
A R T I C L E S©
2005
Nat
ure
Pub
lishi
ng G
roup
ht
tp://
ww
w.n
atur
e.co
m/n
atur
egen
etic
s

ChIP. We carried out ChIP assays as previously described22 with the same
antibodies as used for the western blotting (5 mg per 106 cells). We sheared
chromatin sheared to an average length of 0.2–0.5 kb for this analysis. We
carried out PCR amplification in 25-ml reactions with primers specific for each
of the analyzed promoters. For each promoter, we evaluated the sensitivity of
PCR amplification by serial dilution of total DNA collected after sonication
(input fraction). Primers and conditions for each DNA sequence are available
on request. All samples were analyzed in triplicate. We carried out densito-
metric quantification using Quantity One Software (BIO-RAD; data available
on request).
HPCE quantification of global histone acetylation and methylation. We
quantified global histone H4 acetylation and methylation as previously
described40. We prepared individual histone fractions from cell nuclei and
purified them by reverse-phase HPLC on a Jupiter C18 column (Phenomenex,
Inc.) with an acetonitrile gradient (20–60%) in 0.3% trifluoroacetic acid using
an HPLC gradient system (Beckman-Coulter). We resolved non-, mono, di-,
tri- and tetra-acetylated, as well as di- and trimethylated, histone H4 derivatives
by HPCE. We used an uncoated fused-silica capillary (Beckman-Coulter;
60.2 cm � 75 mm, effective length ¼ 50 cm) in a capillary electrophoresis
system (P/ACE MDQ, Beckman-Coulter) with 100 mM phosphate buffer
(pH 2.0) 0.02% (w/v) HPM-cellulose as running buffer and operating voltages
of 12 kV.
Analysis of modified histone H4 by LC-ES/MS. We acidified purified histone
H4 samples (B1 mg) by adding formic acid to 1% (w/v) and loaded them onto
a fused silica column (10 cm � 500 mm internal diameter) packed with
POROS 20 R1 perfusion chromatography resin (LC Packings, Inc.). We eluted
bound proteins with a gradient of 0–48% (v/v) acetonitrile for 1 h and then
48–80% (v/v) acetonitrile for 20 min in 0.1% (w/v) formic acid and analyzed
them by ES/MS. We collected spectra using an ABI QSTAR Pulsar mass
spectrometer (Applied Biosystems) and derived deconvolution plots from the
ion spectra using Bayesian Protein Reconstruction (ABI Analyst QS software,
Applied Biosystems).
MS/MS analysis of amino acid–specific acetylation in histone H4 tail.
We incubated purified histone H4 in 50 mM NH4HCO3 with 45 mg/ml of
trypsin (Promega) at 37 1C for 1 h. We cleaned tryptic peptides on C18 reverse-
phase self-packing cartridges (Discovery BIO Wide pore, Supelco) in accor-
dance with the manufacturer’s instructions. We then injected samples on-line
onto a C18 reverse-phase nanocolumn in an automated nanogradient gen-
erator (Ultimate nano-HPLC, LC Packings) controlled by Hystar 2.3 software
and analyzed in a continuous acetonitrile gradient consisting of 0–50% A
solution (0–50% acetonitrile and 0.5% acetic acid in water) for 45 min and
then 50–90% A solution for 1 min. We used a flow rate of B300 nl min–1 to
elute peptides from the reverse-phase nanocolumn to a PicoTip emitter
nanospray needle (New Objective) for real-time ionization and peptide
fragmentation on an Esquire HCT ion-trap (Bruker Daltonics, Inc.) mass
spectrometer. We acquired one MS/MS spectrum every second with a 3-Da
window (precursor m/z 1.5), 0.90-V fragmentation amplitude and 0.3-min
dynamic exclusion time. We batch-processed MS/MS spectra using DataAna-
lysis 5.1 SR1 and BioTools 2.0 software packages (Bruker Daltonics, Inc.) and
searched for them in the MSDB protein database using MASCOT software
(Matrix Science).
Mass spectrometry of propionyl-modified histone H4 tail. We sepa-
rated B200 pmol of acid-extracted histones by SDS-PAGE, excised the
Coomassie-stained bands corresponding to histone H4 and subjected them
to chemical modification to derive free amino groups of lysine residues. We
digested them overnight with 100 ng of sequencing-grade trypsin (Promega)
in a total volume of 40 ml in accordance with the manufacturer’s protocol.
We acquired MALDI spectra as described27. To identify specific post-transla-
tional modifications, we analyzed the resulting spectra with the support of
MASCOT software. To quantify the differentially modified peptides, we
monoisotoped and integrated the corresponding peaks. We took the total
cluster area of the different isoforms of one peptide as 100% and determined
the contribution of each isoform to the total from the integrated area under
each peak.
Semi-quantitative RT-PCR expression analyses. We reverse-transcribed total
RNA (2 mg) treated with DNase I (Ambion) using oligo(dT)12–18 primer with
Superscript II reverse transcriptase (Gibco/BRL). We carried out PCR reactions
in a 20-ml volume containing 1� PCR buffer (Gibco/BRL), 1.5 mM of MgCl2,
0.3 mM of dNTP, 0.25 mM of each primer and 2 U of Taq polymerase (Gibco/
BRL). We used 100 ng of cDNA for PCR amplification and amplified all of the
sequences with multiple cycle numbers (20–35 cycles) to determine the
appropriate conditions for identifying semi-quantitative differences in their
expression levels. We designed RT-PCR primers for gene sequences between
different exons to avoid any amplification of DNA. We also carried out PCR
with GAPDH (25 and 28 cycles) to ensure cDNA quality and loading accuracy.
Primer sequences are shown in Supplementary Table 1 online.
Analysis of gene promoter methylation. We established the CpG island
DNA methylation status by PCR analysis after bisulfite modification22,39
and then carried out bisulfite genomic sequencing and methylation-specific
PCR as described22,39. We designed all bisulfite genomic sequencing and
methylation-specific PCR primers to encompass the transcription start
sites of the genes investigated. Primer sequences are shown in Supplementary
Table 1.
Quantification of global DNA methylation degree. We determined
5-methylcytosine genomic content by HPCE as previously described39. We
boiled genomic DNA samples and treated them with nuclease P1 (Sigma) for
16 h at 37 1C and then with alkaline phosphatase (Sigma) for an additional 2 h
at 37 1C. After hydrolysis, we measured total cytosine and 5-methylcytosine
content by capillary electrophoresis using a P/ACE MDQ system (Beckman-
Coulter). Relative 5-methylcytosine content is expressed as a percentage of total
cytosine content (methylated and nonmethylated).
Suv4-20h1 and Suv420h2 RNAi knock-down. We generated Suv4-20h knock-
downs as described17. We cloned DNA oligos containing the 19-mer targeting
sequence, a loop region and HindIII-BglII restriction sites into pSUPER. For
each target gene we used two different 19-mer sequences. We plated mouse
embryonic fibroblasts onto 15-cm dishes before transfection and transfected
cells with a mixture of 20 mg pSUPER plasmids containing the 19-mer targeting
sequences and 2 mg pEGFP-N1 using Lipofectamine (Invitrogen). One day after
transfection, we applied selection medium containing 600 mg ml�1 G418 to the
cells. Five days after transfection, we washed and centrifuged cells and then
stored pellets at �80 1C until histone extraction.
Note: Supplementary information is available on the Nature Genetics website.
ACKNOWLEDGMENTSWe thank H. Lindner for advice regarding the optimization of the capillaryelectrophoresis method for quantification of histone H4 modifications and theTumor Bank of the Spanish National Cancer Center for providing humanprimary tumor samples. This work was supported by the Health and ScienceDepartments of the Spanish Government. M.F.F. is funded by the SpanishAssociation Against Cancer.
COMPETING INTERESTS STATEMENTThe authors declare that they have no competing financial interests.
Received 13 December 2004; accepted 31 January 2005
Published online at http://www.nature.com/naturegenetics/
1. Feinberg, A.P. & Vogelstein, B. Hypomethylation distinguishes genes of some humancancers from their normal counterparts. Nature 301, 89–92 (1983).
2. Goelz, S.E., Vogelstein, B., Hamilton, S.R. & Feinberg, A.P. Hypomethylation ofDNA from benign and malignant human colon neoplasms. Science 228, 187–190(1985).
3. Jones, P.A. & Laird, P.W. Cancer epigenetics comes of age. Nat. Genet. 21, 163–167(1999).
4. Esteller, M., Corn, P.G., Baylin, S.B. & Herman, J.G. A gene hypermethylation profile ofhuman cancer. Cancer Res. 61, 3225–3229 (2001).
5. Esteller, M. CpG island hypermethylation and tumor suppressor genes: a boomingpresent, a brighter future. Oncogene 21, 5427–5440 (2002).
6. Herman, J.G. & Baylin, S.B. Gene silencing in cancer in association with promoterhypermethylation. N. Engl. J. Med. 349, 2042–2054 (2003).
7. Esteller, M. DNA methylation and cancer therapy: new developments and expectations.Curr. Opin. Oncol. 17, 55–60 (2005).
NATURE GENETICS VOLUME 37 [ NUMBER 4 [ APRIL 2005 39 9
A R T I C L E S©
2005
Nat
ure
Pub
lishi
ng G
roup
ht
tp://
ww
w.n
atur
e.co
m/n
atur
egen
etic
s
8. Cedar, H. DNA methylation and gene activity. Cell 53, 3–4 (1988).9. Dobosy, J.R. & Selker, E.U. Emerging connections between DNA methylation and
histone acetylation. Cell. Mol. Life Sci. 58, 721–727 (2001).10. Bannister, A.J. & Kouzarides, T. Histone methylation: recognizing the methyl mark.
Methods Enzymol. 376, 269–288 (2004).11. Jenuwein, T. & Allis, C.D. Translating the histone code. Science 293, 1074–1080
(2001).12. Keohane, A.M., O’Neill, L.P., Belyaev, N.D., Lavender, J.S. & Turner, B.M. X-Inactiva-
tion and histone H4 acetylation in embryonic stem cells. Dev. Biol. 180, 618–630(1996).
13. Lunyak, V.V. et al. Corepressor-dependent silencing of chromosomal regions encodingneuronal genes. Science 298, 1747–1752 (2002).
14. Belyaev, N., Keohane, A.M. & Turner, B.M. Differential underacetylation of histonesH2A, H3 and H4 on the inactive X chromosome in human female cells. Hum. Genet.97, 573–578 (1996).
15. Suka, N., Suka, Y., Carmen, A.A., Wu, J. & Grunstein, M. Highly specific antibodiesdetermine histone acetylation site usage in yeast heterochromatin and euchromatin.Mol. Cell 8, 473–479 (2001).
16. Kurdistani, S.K., Tavazoiem, S. & Grunstein,, M. Mapping global histone acetylationpatterns to gene expression. Cell 117, 721–733 (2004).
17. Schotta, G. et al. A silencing pathway to induce H3-K9 and H4-K20 trimethylation atconstitutive heterochromatin. Genes Dev. 18, 1251–1262 (2004).
18. Kourmouli, N. et al. Heterochromatin and tri-methylated lysine 20 of histone H4 inanimals. J Cell. Sci. 117, 2491–2501 (2004).
19. Sarg, B., Koutzamani, E., Helliger, W., Rundquist, I. & Lindner, H.H. Postsynthetictrimethylation of histone H4 at lysine 20 in mammalian tissues is associated withaging. J Biol. Chem. 277, 39195–39201 (2002).
20. Fahrner, J.A., Eguchi, S., Herman, J.G. & Baylin, S.B. Dependence of histonemodifications and gene expression on DNA hypermethylation in cancer. Cancer Res.62, 7213–7218 (2002).
21. Nguyen, C.T. et al. Histone H3-lysine 9 methylation is associated with aberrant genesilencing in cancer cells and is rapidly reversed by 5-aza-2¢-deoxycytidine. Cancer Res.62, 6456–6461 (2002).
22. Ballestar, E. et al. Methyl-CpG binding proteins identify novel sites of epigeneticinactivation in human cancer. EMBO J. 22, 6335–6345 (2003).
23. Archer, S.Y., Meng, S., Shei, A. & Hodin, R.A. p21(WAF1) is required for butyrate-mediated growth inhibition of human colon cancer cells. Proc. Natl. Acad. Sci. USA95, 6791–6796 (1998).
24. Richon, V.M., Sandhoff, T.W., Rifkind, R.A. & Marks, P.A. Histone deacetylase inhibitorselectively induces p21WAF1 expression and gene-associated histone acetylation.Proc. Natl. Acad. Sci. USA 97, 10014–10019 (2000).
25. Richon, V.M. et al. Histone deacetylase inhibitors: assays to assess effectiveness invitro and in vivo. Methods Enzymol. 376, 199–205 (2004).
26. Lindner, H., Helliger, W., Dirschlmayer, A., Jaquemar, M. & Puschendorf, B. High-performance capillary electrophoresis of core histones and their acetylated modifiedderivatives. Biochem. J. 283, 467–471 (1992).
27. Galasinski, S.C., Resing, K.A. & Ahn, N.G. Protein mass analysis of histones. Methods31, 3–11 (2003).
28. Turner, B.M. & Fellows, G. Specific antibodies reveal ordered and cell-cycle-related useof histone-H4 acetylation sites in mammalian cells. Eur. J. Biochem. 179, 131–139(1989).
29. Baxter, J. et al. Histone hypomethylation is an indicator of epigenetic plasticity inquiescent lymphocytes. EMBO J. 23, 4462–4472 (2004).
30. Fearon, E.R. & Vogelstein, B. A genetic model for colorectal tumorigenesis. Cell 61,759–767 (1990).
31. Fraga, M.F. et al. A mouse skin multistage carcinogenesis model reflects the aberrantDNA methylation patterns of human tumors. Cancer Res. 64, 5527–5534 (2004).
32. Balmain, A. & Harris, C.C. Carcinogenesis in mouse and human cells: parallels andparadoxes. Carcinogenesis 21, 371–377 (2000).
33. Turner, B.M., O’Neill, L.P. & Allan, I.M. Histone H4 acetylation in human cells.Frequency of acetylation at different sites defined by immunolabeling with site-specificantibodies. FEBS Lett. 253, 141–145 (1989).
34. Thorne, A.W., Kmiciek, D., Mitchelson, K., Sautiere, P. & Crane-Robinson, C. Patternsof histone acetylation. Eur. J. Biochem. 193, 701–713 (1990).
35. Zhang, K. et al. Histone acetylation and deacetylation: identification of acetylation andmethylation sites of HeLa histone H4 by mass spectrometry. Mol. Cell Proteomics 1,500–508 (2002).
36. Iyer, N.G. et al. p300 regulates p53-dependent apoptosis after DNA damage incolorectal cancer cells by modulation of PUMA/p21 levels. Proc. Natl. Acad. Sci.USA 101, 7386–7391 (2004).
37. Schiltz, R.L. et al. Overlapping but distinct patterns of histone acetylation by thehuman coactivators p300 and PCAF within nucleosomal substrates. J. Biol. Chem.274, 1189–1192 (1999).
38. Feinberg, A.P. & Tycko, B. The history of cancer epigenetics. Nat. Rev. Cancer 4,143–153 (2004).
39. Paz, M.F. et al. A systematic profile of DNA methylation in human cancer cell lines.Cancer Res. 63, 1114–1121 (2003).
40. Espada, J. et al. Human DNA methyltransferase 1 is required for maintenance of thehistone H3 modification pattern. J. Biol. Chem. 279, 37175–37184 (2004).
41. Yang, X.J. The diverse superfamily of lysine acetyltransferases and their roles inleukemia and other diseases. Nucleic Acids Res. 32, 959–976 (2004).
42. Cho, K.S., Elizondo, L.I. & Boerkoel, C.F. Advances in chromatin remodelling andhuman disease. Curr. Opin. Genet. Dev. 14, 308–315 (2004).
43. Eden, A., Gaudet, F., Waghmare, A. & Jaenisch, R. Chromosomal instability and tumorspromoted by DNA hypomethylation. Science 300, 455 (2003).
44. Ehrlich, M. DNA hypomethylation, cancer, the immunodeficiency, centromeric regioninstability, facial anomalies syndrome and chromosomal rearrangements. J. Nutr. 132,2424S–2429S (2002).
45. Tamaru, H. & Selker, E.U. A histone H3 methyltransferase controls DNA methylation inNeurospora crassa. Nature 414, 277–283 (2001).
46. Bachman, K.E. et al. Histone modifications and silencing prior to DNA methylation of atumor suppressor gene. Cancer Cell 3, 89–95 (2003).
47. Vaziri, H. et al. hSIR2(SIRT1) functions as an NAD-dependent p53 deacetylase.Cell 107, 149–159 (2001).
48. Nishioka, K. et al. PR-Set7 is a nucleosome-specific methyltransferase that modifieslysine 20 of histone H4 and is associated with silent chromatin. Mol. Cell 9, 1201–1213 (2002).
49. Fang, J. et al. Purification and functional characterization of SET8, a nucleosomalhistone H4-lysine 20-specific methyltransferase. Curr. Biol. 9, 1086–1099 (2002).
50. Nakamura, T. et al. ALL-1 is a histone methyltransferase that assembles a super-complex of proteins involved in transcriptional regulation. Mol. Cell 10, 1119–1128(2002).
4 00 VOLUME 37 [ NUMBER 4 [ APRIL 2005 NATURE GENETICS
A R T I C L E S©
2005
Nat
ure
Pub
lishi
ng G
roup
ht
tp://
ww
w.n
atur
e.co
m/n
atur
egen
etic
s